energy performance assessment - jnujprdistance.comjnujprdistance.com/assets/lms/lms jnu/dual degree...
TRANSCRIPT

Energy Performance Assessment

This book is a part of the course by Jaipur National University, Jaipur.This book contains the course content for Energy Performance Assessment.
JNU, JaipurFirst Edition 2013
The content in the book is copyright of JNU. All rights reserved.No part of the content may in any form or by any electronic, mechanical, photocopying, recording, or any other means be reproduced, stored in a retrieval system or be broadcast or transmitted without the prior permission of the publisher.
JNU makes reasonable endeavours to ensure content is current and accurate. JNU reserves the right to alter the content whenever the need arises, and to vary it at any time without prior notice.
III//JNU OLE
Index
ContentI. .....................................................................IV
List of FiguresII. ..........................................................IX
List of TablesIII. ............................................................ X
AbbreviationsIV. .........................................................XI
Case Study V. ............................................................. 143
BibliographyVI. ......................................................... 146
Self Assessment AVII. nswers ................................... 148
Book at a Glance
IV//JNU OLE
Contents
Chapter I ....................................................................................................................................................... 1Performance Assessment of Boilers ............................................................................................................ 1Aim ................................................................................................................................................................ 1Objectives ...................................................................................................................................................... 1Learning outcome .......................................................................................................................................... 11.1 Introduction .............................................................................................................................................. 21.2 Why Conduct a Performance Test............................................................................................................ 21.3 Performance Terms and Definitions ........................................................................................................ 2 1.3.1 Scope ........................................................................................................................................ 21.4 Reference Standards ................................................................................................................................. 21.5 The Direct Method of Testing .................................................................................................................. 3 1.5.1 Description ............................................................................................................................... 3 1.5.2 Measurements required for direct method testing ................................................................... 3 1.5.2.1 Heat Input .................................................................................................................. 3 1.5.2.2 Heat Output ............................................................................................................... 4 1.5.3 Boiler Efficiency by Direct Method - Calculation and Example ............................................. 4 1.5.4 Merits and Demerits of Direct Method .................................................................................... 51.6 The Indirect Method of Testing................................................................................................................ 5 1.6.1 Description ............................................................................................................................... 5 1.6.2 Measurements Required for Performance Assessment Testing ............................................... 6 1.6.3 Test Conditions and Precautions for Indirect Method of Testing ............................................ 7 1.6.4 Boiler Efficiency by Indirect Method - Calculation Procedure and Formula .......................... 81.7 Heat Balance .......................................................................................................................................... 12 1.7.1 Summary of Heat Balance for Coal Fired Boiler .................................................................. 191.8 Factors Affecting Boiler Performance ................................................................................................... 19 1.8.1 Data Collection Format for Boiler Performance Assessment ................................................ 20Summary ..................................................................................................................................................... 25Recommended Reading ............................................................................................................................. 25Self Assessment ........................................................................................................................................... 26
Chapter II ................................................................................................................................................... 28Performance Assessment of Furnaces ...................................................................................................... 28Aim .............................................................................................................................................................. 28Objectives .................................................................................................................................................... 28Learning outcome ........................................................................................................................................ 282.1 Industrial Heating Furnaces ................................................................................................................... 292.2 Purpose of the Performance Test ........................................................................................................... 292.3 Furnace Efficiency Testing Method ....................................................................................................... 30 2.3.1 Furnace Efficiency ................................................................................................................. 30 2.3.2 Direct Method of Testing ....................................................................................................... 31 2.3.3 Indirect Method of Testing ..................................................................................................... 312.4 Measurement Parameters ....................................................................................................................... 31 2.4.1 Heat Loss due to Openings .................................................................................................... 33 2.4.2 Heat Loss Through Skin ........................................................................................................ 34 2.4.3 Unaccounted Loss .................................................................................................................. 362.5 Furnace Efficiency (Direct Method) ...................................................................................................... 362.6 Furnace Efficiency (Indirect Method).................................................................................................... 362.7 Factors Affecting Furnace Performance ................................................................................................ 362.8 Data Collection Format for Furnace Performance Assessment ............................................................. 372.9 Useful Data ............................................................................................................................................ 38Summary ..................................................................................................................................................... 41Recommended Reading ............................................................................................................................. 41Self Assessment ........................................................................................................................................... 42
V//JNU OLE
Chapter III .................................................................................................................................................. 44Energy Performance Assessment of Cogeneration Systems with Steam and GasTurbines ................ 44Aim .............................................................................................................................................................. 44Objectives .................................................................................................................................................... 44Learning outcome ........................................................................................................................................ 443.1 Introduction ............................................................................................................................................ 453.2 Purpose of the Performance Test ........................................................................................................... 453.3 Performance Terms and Definitions ...................................................................................................... 453.4 Reference Standards ............................................................................................................................... 463.5 Field Testing Procedure ......................................................................................................................... 463.6 Example ................................................................................................................................................. 48Summary ..................................................................................................................................................... 51Recommended Reading ............................................................................................................................. 51Self Assessment ........................................................................................................................................... 52
Chapter IV .................................................................................................................................................. 54Energy Performance Assessment of Heat Exchangers ........................................................................... 54Aim .............................................................................................................................................................. 54Objectives .................................................................................................................................................... 54Learning outcome ........................................................................................................................................ 544.1 Introduction ............................................................................................................................................ 554.2 Purpose of the Performance Test ........................................................................................................... 554.3 Performance Terms and Definitions ...................................................................................................... 554.4 Methodology of Heat Exchanger Performance Assessment .................................................................. 56 4.4.1 Procedure for determination of Overall heat transfer Coefficient, U at field ........................ 56 4.4.2 Examples ................................................................................................................................ 57Summary ..................................................................................................................................................... 61Recommended Reading ............................................................................................................................. 61Self Assessment ........................................................................................................................................... 62
Chapter V .................................................................................................................................................... 64Energy Performance Assessment of Motors and Variable Speed Drives .............................................. 64Aim .............................................................................................................................................................. 64Objectives .................................................................................................................................................... 64Learning outcome ........................................................................................................................................ 645.1 Introduction ............................................................................................................................................ 655.2 Performance Terms and Definitions ...................................................................................................... 655.3 Efficiency Testing .................................................................................................................................. 655.4 Determining Motor Loading .................................................................................................................. 685.5 Performance Evaluation of Rewound Motors ........................................................................................ 695.6 Format for Data Collection .................................................................................................................... 705.7 Application of Variable Speed Drives (VSD) ........................................................................................ 70 5.7.1 Concept of Variable Frequency Drive ................................................................................... 70 5.7.2 Factors for Successful Implementation of Variable Speed Drives ......................................... 71 5.7.3 Information needed to Evaluate Energy Savings for Variable Speed Application ............... 73Summary ..................................................................................................................................................... 74Recommended Reading ............................................................................................................................. 74Self Assessment ........................................................................................................................................... 75
Chapter VI .................................................................................................................................................. 77Energy Performance Assessment of Fans and Blowers .......................................................................... 77Aim .............................................................................................................................................................. 77Objectives .................................................................................................................................................... 77Learning outcome ........................................................................................................................................ 776.1 Introduction ............................................................................................................................................ 78
VI//JNU OLE
6.2 Purpose of the Performance Test ........................................................................................................... 786.3 Performance Terms and Definitions ...................................................................................................... 786.4 Scope ...................................................................................................................................................... 786.5 Reference Standards ............................................................................................................................... 786.6 Field Testing ........................................................................................................................................... 78 6.6.1 Instruction for Site Testing ..................................................................................................... 78 6.6.2 Location of Measurement Planes ........................................................................................... 78 6.6.3 Measurement of Air Velocity on Site ..................................................................................... 79 6.6.4 Determination of Flow ........................................................................................................... 81 6.6.5 Determination of Fan Pressure .............................................................................................. 81 6.6.6 Determination of Power Input ............................................................................................... 81Summary ..................................................................................................................................................... 82Recommended Reading ............................................................................................................................. 82Self Assessment ........................................................................................................................................... 83
Chapter VII ................................................................................................................................................ 85Energy Performance Assessment of Water Pumps ................................................................................. 85Aim .............................................................................................................................................................. 85Objectives .................................................................................................................................................... 85Learning outcome ........................................................................................................................................ 857.1 Introduction ............................................................................................................................................ 867.2 Purpose of the Performance Test ........................................................................................................... 867.3 Performance Terms and Definitions ...................................................................................................... 867.4 Field Testing for Determination of Pump Efficiency ............................................................................. 86 7.4.1 Flow Measurement, Q ............................................................................................................ 87 7.4.2 Determination of Total Head, H ............................................................................................. 87 7.4.3 Determination of Hydraulic Power (Liquid Horse Power), ................................................... 87 7.4.4 Measurement of Motor Input Power ...................................................................................... 88 7.4.5 Pump Shaft Power ................................................................................................................. 88 7.4.6 Pump Efficiency..................................................................................................................... 887.5 Determining the System Resistance and Duty Point ............................................................................ 887.6 Determining the System Resistance and Duty Point ............................................................................. 89Summary ..................................................................................................................................................... 91Recommended Reading ............................................................................................................................. 91Self Assessment ........................................................................................................................................... 92
Chapter VIII ............................................................................................................................................... 94Energy Performance Assessment of Compressors .................................................................................. 94Aim .............................................................................................................................................................. 94Objectives .................................................................................................................................................... 94Learning outcome ........................................................................................................................................ 948.1 Introduction ............................................................................................................................................ 958.2 Purpose of the Performance Test ........................................................................................................... 958.3 Performance Terms and Definitions ...................................................................................................... 958.4 Field Testing ........................................................................................................................................... 95 8.4.1 Measurement of Free Air Delivery (FAD) by Nozzle method .............................................. 95 8.4.2 Arrangement of Test Equipment ............................................................................................ 95 8.4.3 Nozzle Sizes .......................................................................................................................... 95 8.4.4 Measurements and Duration of the Test ................................................................................ 968.5 Calculation Procedure for Nozzle Method ........................................................................................... 978.6 Example ................................................................................................................................................ 978.7 Assessment of Specific Power requirement .......................................................................................... 988.8 Measurement of FAD by Pump Up Method ......................................................................................... 98Summary ................................................................................................................................................... 100Recommended Reading ........................................................................................................................... 100Self Assessment ......................................................................................................................................... 101
VII/JNU OLE
Chapter IX ................................................................................................................................................ 103Energy Performance Assessment of HVAC Systems ............................................................................ 103Aim ............................................................................................................................................................ 103Objectives .................................................................................................................................................. 103Learning outcome ...................................................................................................................................... 1039.1 Introduction .......................................................................................................................................... 1049.2 Purpose of the Performance Test ........................................................................................................ 1049.3 Performance Terms and Definitions ................................................................................................... 1049.4 Preparatory for Measurements ............................................................................................................ 1049.5 Procedure ............................................................................................................................................ 104 9.5.1 To determine the net refrigeration capacity ......................................................................... 104 9.5.2 Measurement of Compressor Power ................................................................................... 105 9.5.3 Performance Calculations .................................................................................................... 105 9.5.4 Performance Evaluation of Air Conditioning Systems ........................................................ 1059.6 Measurements to be Recorded During the Test ................................................................................... 1069.7 Example ............................................................................................................................................... 106Summary ................................................................................................................................................... 107Recommended Reading ........................................................................................................................... 107Self Assessment ......................................................................................................................................... 108
Chapter X ..................................................................................................................................................110Energy Performance Assessment of Lighting Systems ..........................................................................110Aim .............................................................................................................................................................110Objectives ...................................................................................................................................................110Learning outcome .......................................................................................................................................11010.1 Introduction ........................................................................................................................................11110.2 Purpose of the Performance Test .......................................................................................................11110.3 Performance Terms and Definitions ..................................................................................................11110.4 Preparation .........................................................................................................................................11210.5 Procedure for Assessment of Lighting Systems .................................................................................112 10.5.1 To Determine the Minimum Number and Positions of Measurement Points ....................11210.6 ILER Assessment ...............................................................................................................................11310.7 Example of ILER Calculation ............................................................................................................11310.8 Areas for Improvement ......................................................................................................................11310.9 Other Useful Information ...................................................................................................................113 10.9.1 IES - Recommendations ....................................................................................................113 10.9.2 Example Using IES Recommendations .............................................................................11310.10 Characteristics of Different Types of Lamps ...................................................................................114Summary ....................................................................................................................................................116
Chapter- XI ................................................................................................................................................119Financial Analysis, Application of Non-conventional, Renewal Energy Sources and Waste Minimisation ..................................................................................................................................119Aim .............................................................................................................................................................119Objectives ...................................................................................................................................................119Learning outcome .......................................................................................................................................11911.1 Introduction ........................................................................................................................................ 12011.2 Fixed and Variable Costs .................................................................................................................... 12011.3 Interest Charges .................................................................................................................................. 12111.4 Simple Payback Period ...................................................................................................................... 12211.5 Discounted Cash Flow Methods ........................................................................................................ 12211.6 Net Present Value Method .................................................................................................................. 12211.7 Internal Rate of Return Method ......................................................................................................... 12311.8 Factors Affecting Analysis ................................................................................................................. 12311.9 Real Value .......................................................................................................................................... 123

Energy Performance Assessment
VIII/JNU OLE
11.10 Application of Non-conventional and Renewable Energy Sources ................................................. 12411.11 Solar Energy ..................................................................................................................................... 12411.12 Solar Thermal Energy Application ................................................................................................... 12511.13 Wind Energy ..................................................................................................................................... 12911.14 Bio Energy ....................................................................................................................................... 13011.15 Tidal and Ocean Energy ................................................................................................................... 13511.16 Waste Minimisation and Resource Conservation ............................................................................. 13611.17 Waste Minimisation.......................................................................................................................... 13611.18 Classification of Waste Minimisation (WM) Techniques ................................................................ 13611.19 Typical Causes of Waste ................................................................................................................... 138Summary ................................................................................................................................................... 140Recommended Reading ........................................................................................................................... 140Self Assessment ......................................................................................................................................... 141
IX/JNU OLE
List of Figures
Fig. 1.1 Input-output method ......................................................................................................................... 3Fig. 1.2 Heat losses in a boiler ....................................................................................................................... 6Fig. 2.1 Pusher-type 3-zone reheating furnace ............................................................................................ 29Fig. 2.2 Walking beam-type reheating furnace ............................................................................................ 29Fig. 2.3 Fuel Fired Furnace .......................................................................................................................... 31Fig. 2.4 Factor for determining the equivalent of heat release from ............................................................ 33Fig. 2.5 Graph determining black body radiation at a particular temperature ............................................. 34Fig. 2.6 Quantity of heat release at various temperatures ............................................................................ 35Fig. 3.1 Process Flow Diagrams for Cogeneration Plant ............................................................................. 47Fig. 3.2 Process flow diagram for small cogeneration ................................................................................ 48Fig. 4.1 Typical shell and tube heat exchanger ............................................................................................ 55Fig. 5.1 Efficiency vs. loading ..................................................................................................................... 65Fig. 5.2 Components of a variable speed drive ............................................................................................ 71Fig. 5.3 Example of an excellent variable speed drive candidate ................................................................ 72Fig. 5.4 Example of a poor variable speed drive candidate ......................................................................... 72Fig. 6.1 Traverse point determination for round duct .................................................................................. 80Fig. 7.1 System resistance and duty point .................................................................................................... 89Fig. 7.2 System resistance curve .................................................................................................................. 90Fig. 8.1 Test Arrangement for measurement of compressed air flow .......................................................... 96Fig. 11.1 Solar water heater ....................................................................................................................... 125Fig. 11.2 Solar cooker ................................................................................................................................ 126Fig. 11.3 Parabolic concentrating solar cooker .......................................................................................... 127Fig. 11.4 Solar photovoltaic (PV) .............................................................................................................. 127Fig. 11.5 Solar street light .......................................................................................................................... 128Fig. 11.6 Wind Tturbine configuration ...................................................................................................... 129Fig. 11.7 Biomass briquetting .................................................................................................................... 131Fig. 11.8 Biomass gasifier .......................................................................................................................... 132Fig. 11.9 Hydro energy .............................................................................................................................. 134Fig. 11. 10 Classification of waste minimisation ....................................................................................... 137
Energy Performance Assessment
X/JNU OLE
List of Tables
Table 1.1 Typical instruments used for boiler performance assessment ........................................................ 7Table 1.2 Theoretical (Stoichiometric) air fuel ratio ...................................................................................... 9Table 1.3 Heat loss due to moisture ............................................................................................................. 10Table 1.4 Boiler heat balance ....................................................................................................................... 12Table 1.5 Boiler efficiency calculation ........................................................................................................ 19Table 2.1 Stock ............................................................................................................................................. 37Table 2.2 Fuel analysis ................................................................................................................................. 37Table 2.3 Flue Gas Analysis ......................................................................................................................... 37Table 2.4 Cooling Water .............................................................................................................................. 37Table 2.5 Heat Balance Table....................................................................................................................... 38Table 2.6 Radiation Loss and Absolute Temperature................................................................................... 38Table 2.7 Pusher type billet reheating furnace (for rolling mills) ................................................................ 39Table 2.8 Pusher type forging furnace ......................................................................................................... 40Table 3.1 Thermal energy checklist ............................................................................................................. 46Table 4.1 Calculated data vs design data ..................................................................................................... 58Table 4.2 Monitored parameters .................................................................................................................. 59Table 7.1 Resistance in the different circuits ............................................................................................... 89Table 7.2 System resistance at different flow rates ...................................................................................... 90Table 8.1 Flow nozzle: Flow nozzle with profile as desired in IS 10431:1994 and dimensions ................. 96Table 10.1 Characteristics of different types of lamps ................................................................................115Table 11.1 Fixed and variable costs ........................................................................................................... 121

XI/JNU OLE
Abbreviations
GCV GrossCalorificValueNCV NetCalorificValueVSD Variable Speed Drives

1/JNU OLE
Chapter I
Performance Assessment of Boilers
Aim
The aim of this chapter is to:
evaluateefficiencyofcoalfiredandoilfiredboilers•
understandboilerperformance-termsanddefinitions•
identifymethodsofboilerefficiencyevaluation-directandindirect•
understandplanningforefficiencyevaluation•
Objectives
The objectives of this chapter are to:
understand boiler performance and factors affecting it•
observe the British Standard BS845: 1987, which states methods and conditions under which a boiler should •
be tested
explaintheconceptsofGrossCalorificValue(GCV)andNetCalorificValue(NCV)•
Learning outcome
At the end of this chapter, students will be able to:
detectefficiencyofcoalandoilfiredboilers•
explain boiler performance•
analyse the British Standard BS845: 1• 987
Energy Performance Assessment
2/JNU OLE
1.1 IntroductionPerformanceoftheboilerlike,efficiencyandevaporationratioreducesovertimeduetopoorcombustion,heat•transfer fouling and poor operation and maintenance.Deteriorationoffuelqualityandwaterqualityalsoleadstopoorperformanceofboiler.Efficiencytestinghelps•ustofindouthowfartheboilerefficiencydriftsawayfromthebestefficiency.Anyobservedabnormaldeviationscould therefore be investigated to pinpoint the problem area for necessary corrective action.Hence,itisnecessarytofindoutthecurrentlevelofefficiencyforperformanceevaluation,whichisapre-•requisite for energy conservation action in industry.
1.2 Why Conduct a Performance TestItisanindicatorfortrackingday-to-dayandseason-to-seasonvariationsinboilerefficiencyandfindingoutthescopeforenergyefficiencyimprovements.A performance test is conducted to:
findouttheefficiencyoftheboiler•findouttheevaporationratio•
The purpose of the performance test is to:determine the actual performance of the boiler•calculatetheefficiencyoftheboiler•compare it with design values or standard norms•
1.3 Performance Terms and DefinitionsBoilerEfficiency,η = (Heat Output)/(Heat Input) = Heat in Steam output (KCals) = Heat in Fuel Input (KCals)Evaporation Ratio = Quantity of Steam Generation /Quantity of Fuel Generation
BoilerEfficiency = (1)
=
1.3.1 ScopeTheaboveproceduredescribesroutinetestforbothoilfiredandsolidfuelfiredboilersusingcoal,agroresiduesetc. Only those observations and measurements need to be made which can be readily applied and is necessary to attain the purpose of the test.
1.4 Reference StandardsBritish standards, BS845: 1987
Itdescribesthemethodsandconditionsunderwhichaboilermustbetestedtodetermineitsefficiency.•For the testing to be done, the boiler should be operated under steady load conditions (generally full load) for a •period of one hour after which readings would be taken during the next hour of steady operation to enable the successfulcalculationoftheefficiency.Theefficiencyofaboilerisquotedasthe%ofusefulheatavailable,expressedasapercentageofthetotal•energy potentially available by burning the fuel.ThisisexpressedonthebasisofGrossCalorificValue(GCV).•This deals with the complete heat balance and it has two parts. These are;•Part one • dealswithstandardboilers,wheretheindirectmethodisspecified
3/JNU OLE
Part two • dealswithcomplexplantwheretherearemanychannelsofheatflow.Inthiscase,boththedirectandindirect methods are applicable, in whole or in partASME Standard:• PTC-4-1 Power Test Code for Steam Generating UnitsThis consists of the following parts:•
Part one � : Direct method (also called as input -output method)Part two � : Indirect method (also called as heat loss method)
IS 8753:IndianStandardforBoilerEfficiencyTestingMoststandardsforcomputationofboilerefficiency,includingIS8753andBS845aredesignedforspotmeasurementofboilerefficiency.Invariably,allthesestandardsdonotincludeblowdownasalossintheefficiencydeterminationprocess.
Boilerefficiencycanbetestedbythefollowingmethods:The direct method:Heretheenergygainoftheworkingfluid(waterandsteam)iscomparedwiththeenergycontent of the boiler fuel.
The indirect method:Heretheefficiencyisthedifferencebetweenthelossesandtheenergyinput.
1.5 The Direct Method of TestingThe direct method of testing is furthere described below:
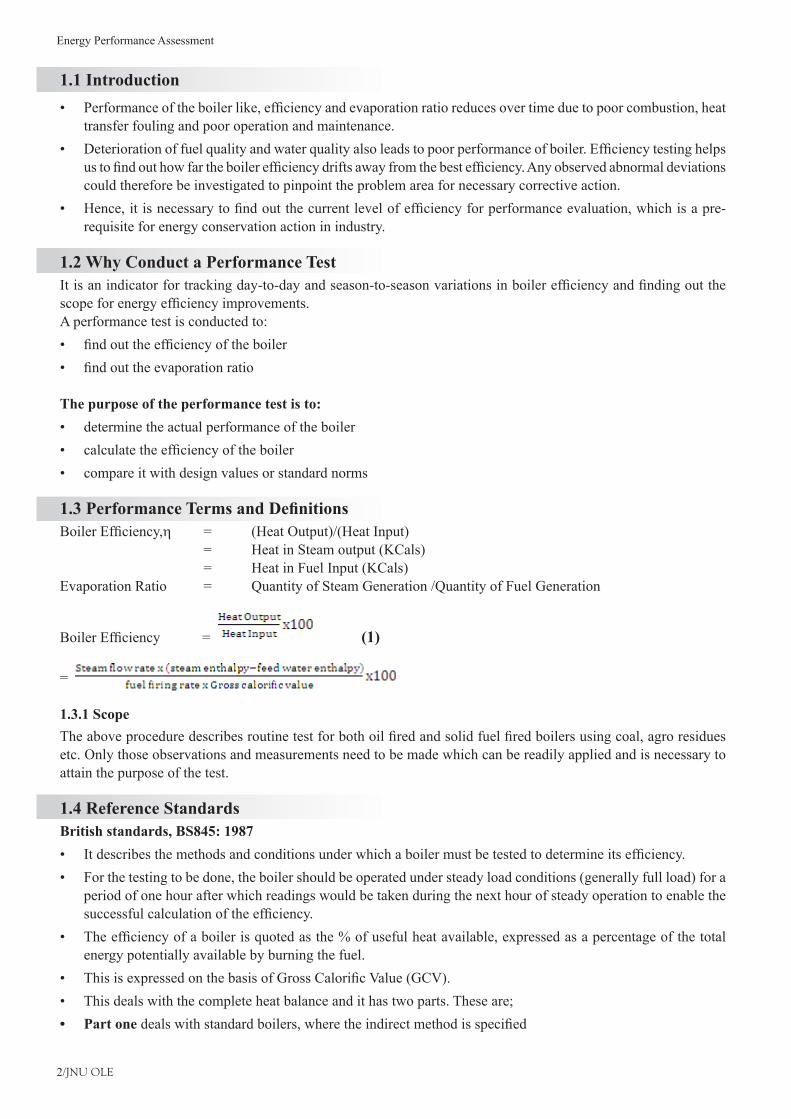
1.5.1 DescriptionThis is also known as ‘input-output method’ due to the fact that it needs only the useful output (steam) and the heat input(i.e.,fuel)forevaluatingtheefficiency.Thisefficiencycanbeevaluatedusingtheaboveformula:(1)
Fig. 1.1 Input-output method
1.5.2 Measurements required for direct method testing
1.5.2.1 Heat InputBoth,heatinputandheatoutputmustbemeasured.Themeasurementofheatinputrequiresknowledgeofthecalorificvalueofthefuelanditsflowrateintermsofmassorvolume,accordingtothenatureofthefuel.
For gaseous fuelA gas meter of the approved type can be used and the measured volume should be corrected for temperature and pressure.Asampleofgascanbecollectedforcalorificvaluedetermination,butitisusuallyacceptabletousethecalorificvaluedeclaredbythegassuppliers.
Fuel Input 100%+Air Boiler
Wat
er
Flue Gas
Stea
mO
utpu
t
Energy Performance Assessment
4/JNU OLE
For liquid fuelHeavy fuel oil is very viscous, and this property varies sharply with temperature. The meter, which is usually installed on the combustion appliance, should be regarded as a rough indicator only and, for test purposes, a meter calibrated for the particular oil is to be used and over a realistic range of temperature should be installed. Even better is the use of an accurately calibrated day tank.
For solid fuelTheaccuratemeasurementoftheflowofcoalorothersolidfuelisverydifficult.Themeasurementmustbebasedonmass,whichmeansthatbulkyapparatusmustbesetupontheboiler-housefloor.Samplesmustbetakenandbagged throughout the test.Thebagsmust be sealed and sent to a laboratory for analysis and calorific valuedetermination.
In some more recent boiler houses, the problem has been alleviated by mounting the hoppers over the boilers on calibrated load cells, but these are yet uncommon.
1.5.2.2 Heat OutputThere are several methods, which can be used for measuring heat output. With steam boilers, an installed steam metercanbeusedtomeasureflowrate,butthismustbecorrectedfortemperatureandpressure.
Earlier,thisapproachwasnotfavouredduetothechangeinaccuracyoforificeorventuremeterswithflowrate.Itisnowmoreviablewithmodernflowmetersofthevariable-orificeorvortex-sheddingtypes.
The alternative with small boilers is to measure feed water and this can be done by previously calibrating the feed tank and noting down the levels of water during the beginning and end of the trial. Care should be taken not to pump water during this period. Heat addition for conversion of feed water at inlet temperature to steam, is considered for heat output.
In case of boilers with intermittent blow down, blow down should be avoided during the trial period.
In case of boilers with continuous blow down, the heat loss due to blow down should be calculated and added to the heat in steam.
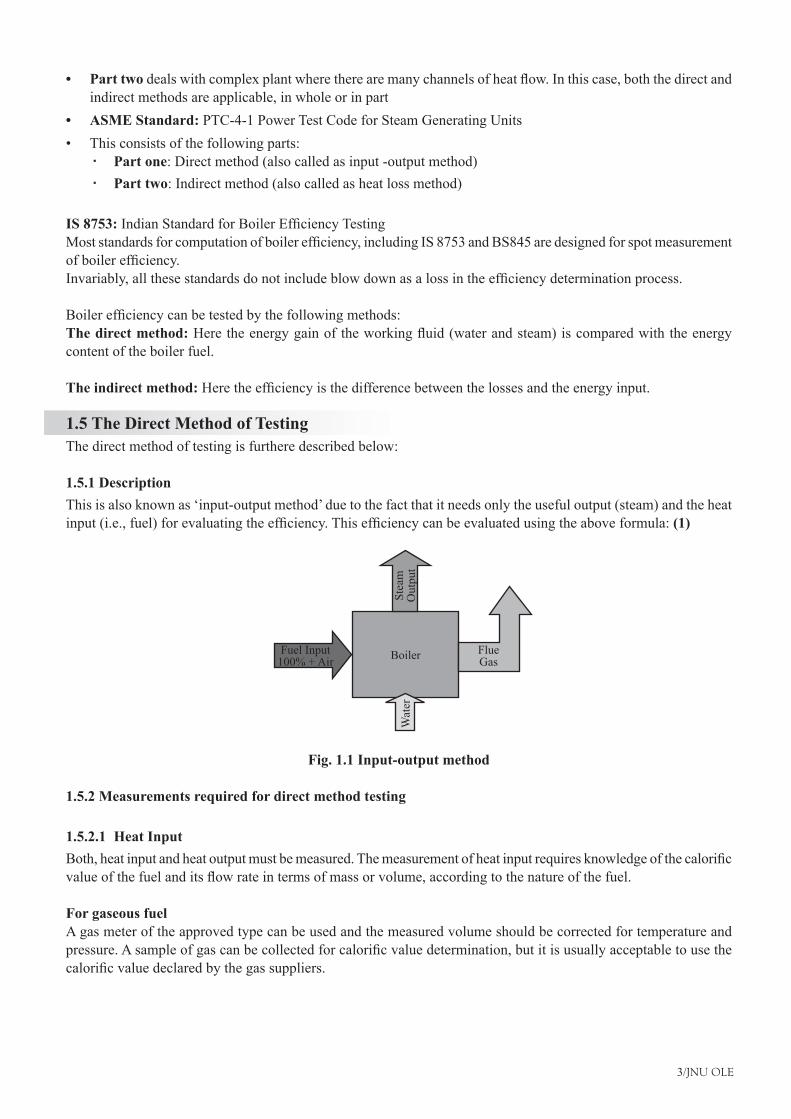
1.5.3 Boiler Efficiency by Direct Method - Calculation and ExampleTest Data and CalculationWater consumption and coal consumptionweremeasured in a coal-fired boiler at hourly intervals.Weighedquantities of coal were fed into the boiler during the trial period. Simultaneously, water level difference was noted to calculate steam generation during the trial period. Blow down was avoided during the test. The measured data is given below.
Type of boiler: Coal Fired BoilerHeat output dataQuantity of steam generated (output) 8 TPHSteam pressure / temperature 10 kg/cm2(g)/ 180 0CEnthalpy of steam (dry and Saturated) at 10 kg/cm2(g) pressure 665 Kcal/kgFeed water temperature 850 CEnthalpy of feed water 85 Kcal/kg Heat input dataQuantity of coal consumed (Input) 1.6 TPHGCV of coal 4000 KCal/kgCalculation
BoilerEfficiency(η) =
5/JNU OLE
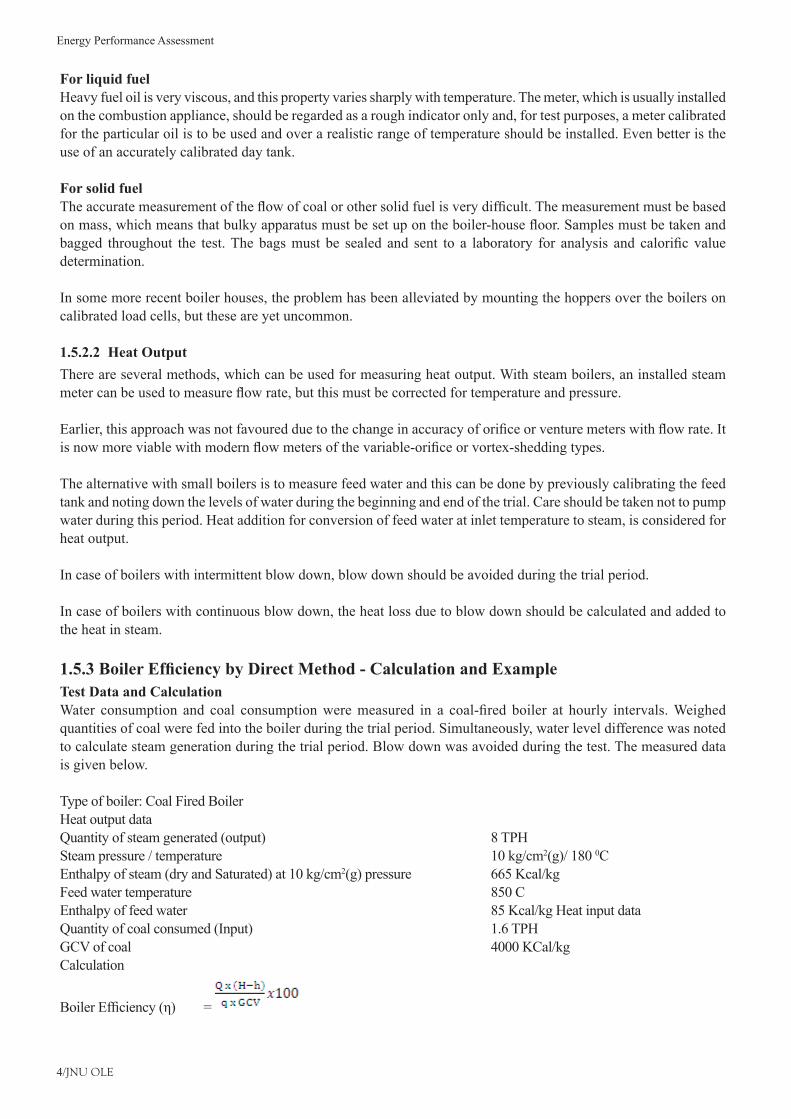
Where,Q = Quantity of steam generated per hour (kg/hr)q = Quantity of fuel used per hour (kg/hr)GCV =Grosscalorificvalueofthefuel(kCal/kg)H = Enthalpy of steam (kCal/kg)H = Enthalpy of feed water (kCal/kg)
=72.5%Evaporation Ratio = 8 Tonne of steam / 1.6 Tonne of coal =5
1.5.4 Merits and Demerits of Direct MethodThe merits of direct method include:
plantpeoplecanevaluatequicklytheefficiencyofboilers•requires few parameters for computation•needs few instruments for monitoring•
The demerits of direct method include:doesnotgivecluestotheoperatorastowhyefficiencyofsystemislower•doesnotcalculatevariouslossesaccountableforvariousefficiencylevels•evaporationratioandefficiencymaymislead,ifthesteamishighlywetduetowatercarryover•
1.6 The Indirect Method of TestingThe Indirect method of testing is described in detail below:
1.6.1 Description
Theefficiencycanbemeasuredeasilybymeasuringallthelossesoccurringintheboilersusingtheprinciples•to be described.The disadvantages of the direct method can be overcome by this method, which calculates the various heat •losses associated with boiler.Theefficiencycanbearrivedat,bysubtractingtheheatlossfractionsfrom100.•Animportantadvantageofthismethodisthattheerrorsinmeasurementdonotmakesignificantchangein•efficiency.
Thus,ifboilerefficiencyis90%,anerrorof1%indirectmethodwillresultinsignificantchangeinefficiency.i.e.,Efficiency=90+0.9=89.1to90.9
Inindirectmethod,1%errorinmeasurementoflosseswillresultin;Efficiency=100–(10+0.1)=90+0.1=89.9to90.1
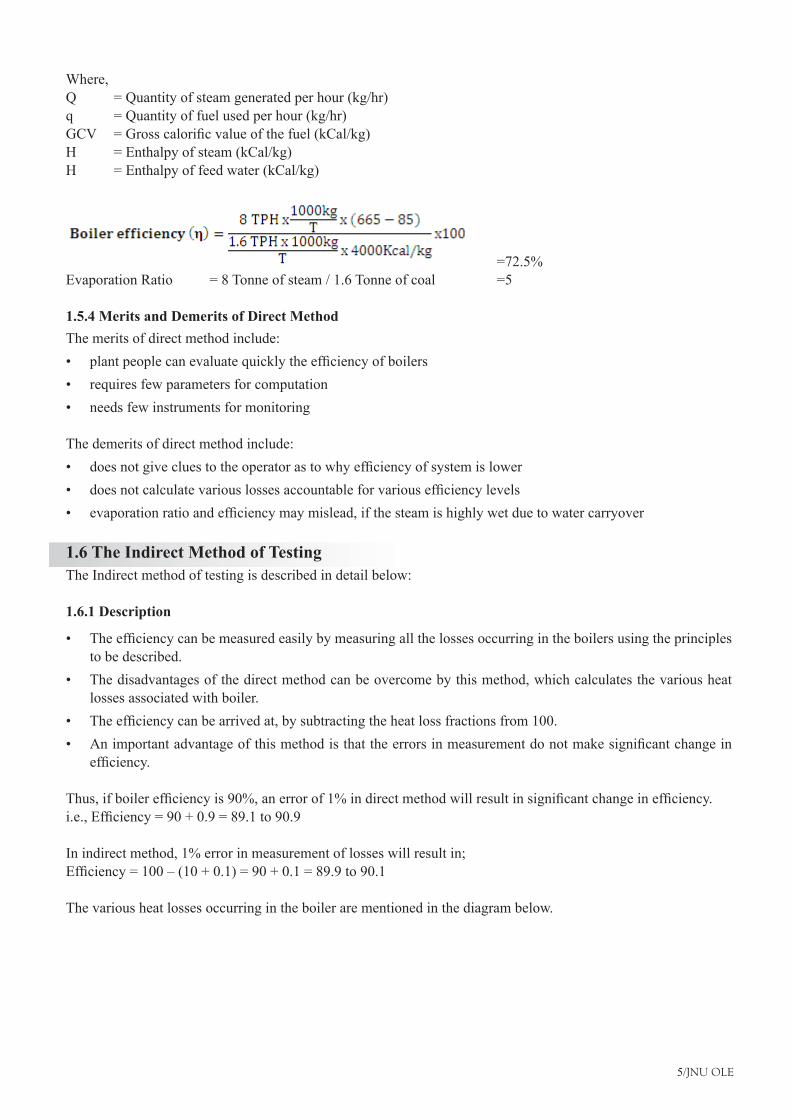
The various heat losses occurring in the boiler are mentioned in the diagram below.
Energy Performance Assessment
6/JNU OLE
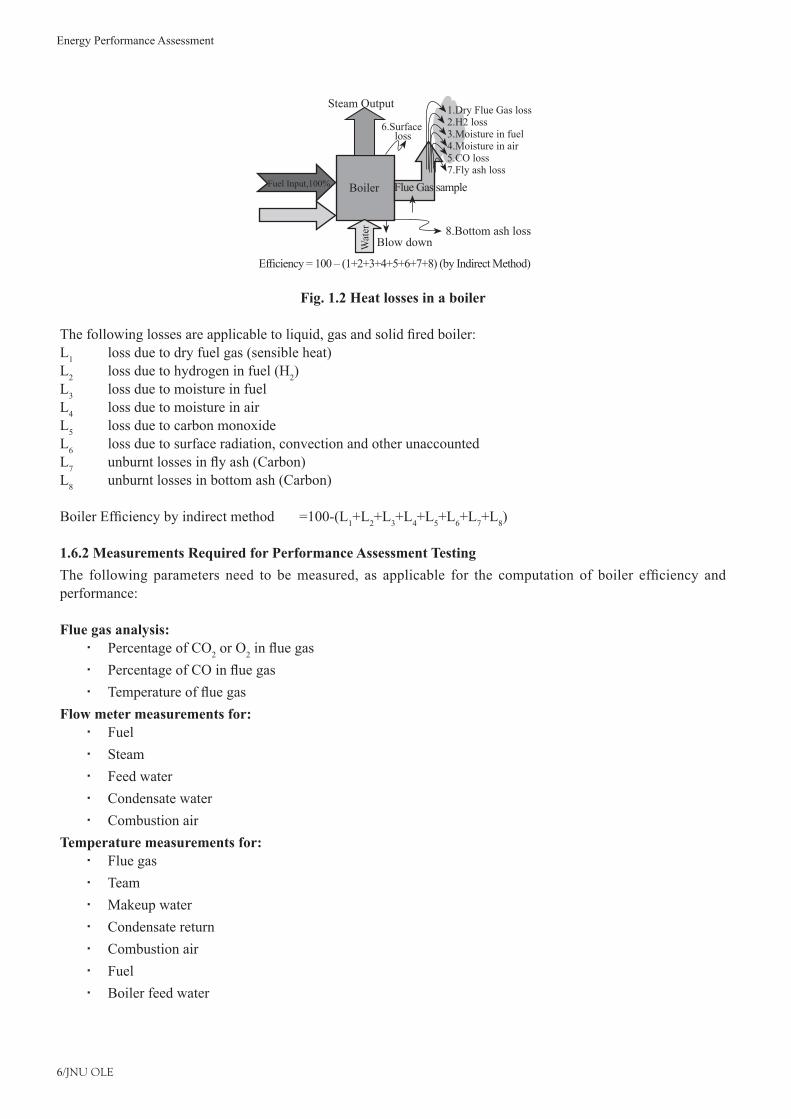
Fig. 1.2 Heat losses in a boiler
Thefollowinglossesareapplicabletoliquid,gasandsolidfiredboiler:L1 loss due to dry fuel gas (sensible heat)L2 loss due to hydrogen in fuel (H2) L3 loss due to moisture in fuelL4 loss due to moisture in airL5 loss due to carbon monoxideL6 loss due to surface radiation, convection and other unaccountedL7 unburntlossesinflyash(Carbon)L8 unburnt losses in bottom ash (Carbon)
BoilerEfficiencybyindirectmethod =100-(L1+L2+L3+L4+L5+L6+L7+L8)
1.6.2 Measurements Required for Performance Assessment TestingThe following parameters need to bemeasured, as applicable for the computation of boiler efficiency andperformance:
Flue gas analysis:Percentage of CO � 2 or O2influegasPercentageofCOinfluegas �Temperatureoffluegas �
Flow meter measurements for:Fuel �Steam �Feed water �Condensate water �Combustion air �
Temperature measurements for:Flue gas �Team �Makeup water �Condensate return �Combustion air �Fuel �Boiler feed water �
Boiler
Steam Output
8.Bottom ash loss
6.Surface loss
Blow down
Efficiency=100–(1+2+3+4+5+6+7+8)(byIndirectMethod)
Wat
er
Flue Gas sampleFuelInput,100%
Air
1.Dry Flue Gas loss2.H2 loss3.Moisture in fuel4.Moisture in air5.CO loss7.Fly ash loss
7/JNU OLE
Pressure measurements for:Steam �Fuel �Combustion air, both primary and secondary �Draft �Water condition �Total dissolved solids (TDS) �pH �Blow down rate and quantity �
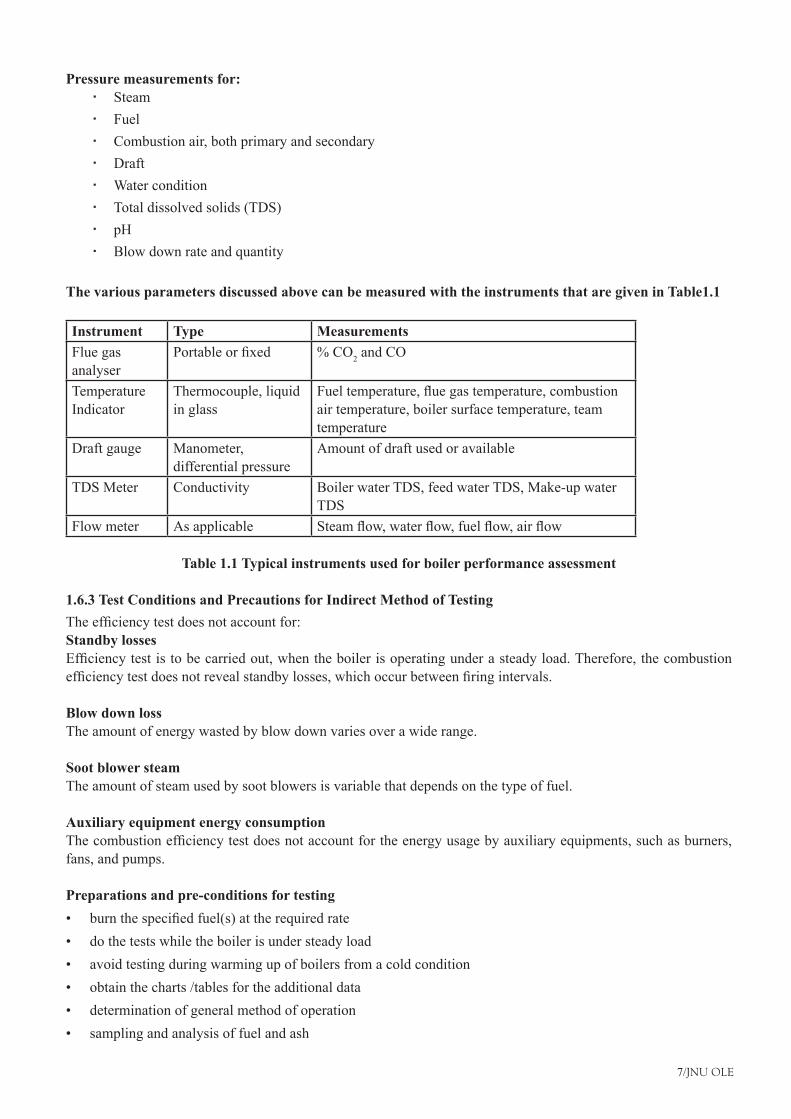
The various parameters discussed above can be measured with the instruments that are given in Table1.1
Instrument Type Measurements Flue gas analyser
Portableorfixed %CO2 and CO
Temperature Indicator
Thermocouple, liquid in glass
Fueltemperature,fluegastemperature,combustionair temperature, boiler surface temperature, team temperature
Draft gauge Manometer, differential pressure
Amount of draft used or available
TDS Meter Conductivity Boiler water TDS, feed water TDS, Make-up water TDS
Flow meter As applicable Steamflow,waterflow,fuelflow,airflow
Table 1.1 Typical instruments used for boiler performance assessment
1.6.3 Test Conditions and Precautions for Indirect Method of TestingTheefficiencytestdoesnotaccountfor:Standby lossesEfficiencytestistobecarriedout,whentheboilerisoperatingunderasteadyload.Therefore,thecombustionefficiencytestdoesnotrevealstandbylosses,whichoccurbetweenfiringintervals.
Blow down lossThe amount of energy wasted by blow down varies over a wide range.
Soot blower steamThe amount of steam used by soot blowers is variable that depends on the type of fuel.
Auxiliary equipment energy consumptionThecombustionefficiencytestdoesnotaccountfortheenergyusagebyauxiliaryequipments,suchasburners,fans, and pumps.
Preparations and pre-conditions for testingburnthespecifiedfuel(s)attherequiredrate•do the tests while the boiler is under steady load•avoid testing during warming up of boilers from a cold condition•obtain the charts /tables for the additional data•determination of general method of operation•sampling and analysis of fuel and ash•
Energy Performance Assessment
8/JNU OLE
ensure the accuracy of fuel and ash analysis in the laboratory•check the type of blow down and method of measurement•ensure proper operation of all instruments•checkforanyairinfiltrationinthecombustionzone•fluegassamplinglocation•itissuggestedthattheexitductoftheboilerbeprobedandtraversedtofindthelocationofthezoneofmaximum•temperature.Thisislikelytocoincidewiththezoneofmaximumgasflowandisthereforeagoodsamplingpoint for both temperature and gas analysis.optionsoffluegasanalysis•check the oxygen test with the carbon dioxide test•
Oxygen Test and Carbon Dioxide Test:If continuous-reading oxygen test equipment is installed in boiler plant, use oxygen reading.•Occasionally, use portable test equipment that checks for both oxygen and carbon dioxide.•If the carbon dioxide test does not give the same results as the oxygen test, something is wrong.•One (or both) of the tests could be erroneous, perhaps because of stale chemicals or drifting instrument •calibration.Anotherpossibilityisthatoutsideairisbeingpickedupalongwiththefluegas.•This occurs if the combustion gas area operates under negative pressure and there are leaks in the boiler •casing.
Carbon Monoxide TestThecarbonmonoxidecontentoffluegasisagoodindicatorofincompletecombustionwithalltypesoffuels,•as long as they contain carbon.Carbonmonoxideinthefluegasisminimalwithordinaryamountsofexcessair,butitrisesabruptlyassoon•as fuel combustion starts to be incomplete.
Planning for the testingThe testing is to be conducted for a duration of 4 to 8 hours in a normal production day.•Advanced planning is essential for the resource arrangement of manpower, fuel, water and instrument check •etc and the same to be communicated to the boiler supervisor and production department.Sufficientquantityoffuelstockandwaterstoragerequiredforthetestdurationshouldbearrangedsothata•test is not disrupted due to non-availability of fuel and water.Necessary sampling point and instruments are to be made available with working condition.•Labanalysisshouldbecarriedoutforfuel,fluegasandwaterincoordinationwithlabpersonnel.•Thesteamtable,psychometricchart,calculatoraretobearrangedforcomputationofboilerefficiency.•
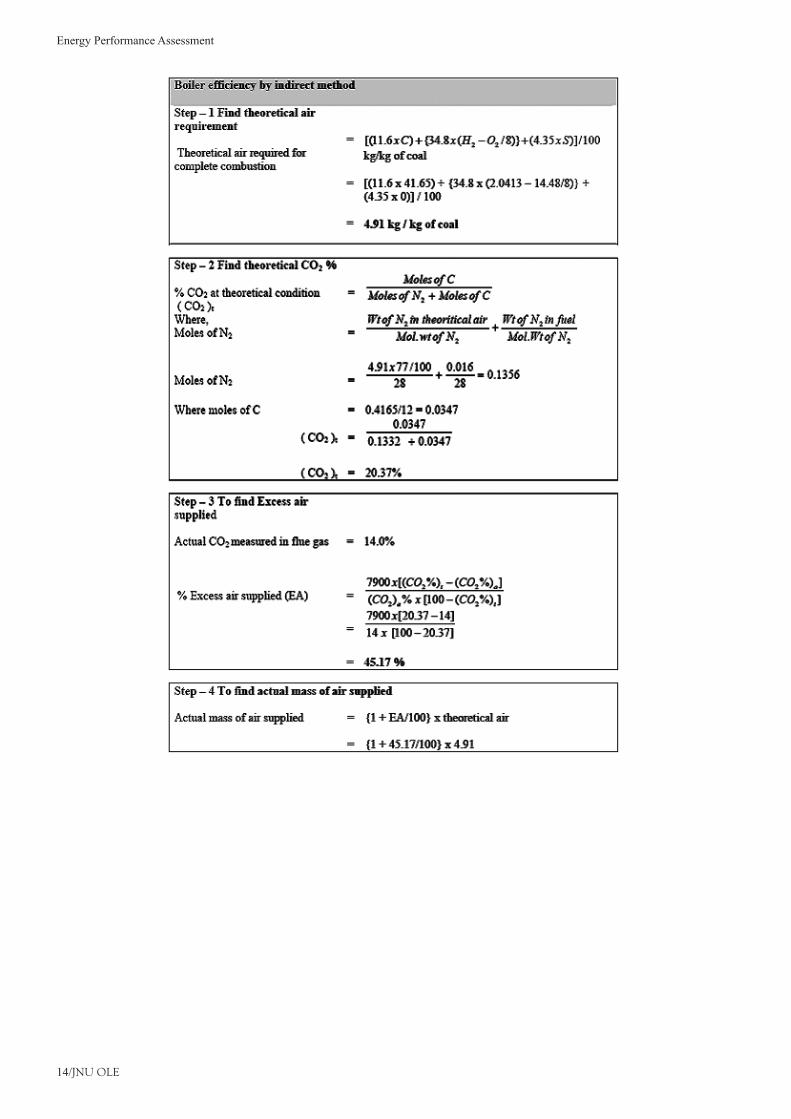
1.6.4 Boiler Efficiency by Indirect Method - Calculation Procedure and FormulaIn order to calculate the boiler efficiency by indirectmethod, all the losses that occur in the boilermust beestablished.
Conversion formula for proximate analysis to ultimate analysis%C=0.97+0.7(VM+0.1A)–M(0.6-0.01M)%H2=0.036C+0.086(VM–0.1xA)–0.00355M2 (1-0.02M)%N2=2.10–0.020VMWhereC=%offixedcarbon A=%ofash
9/JNU OLE
VM=%ofVolatilematter M=%ofmoisture
These losses are conveniently related to the amount of fuel burnt. In this way, it is easy to compare the performance of various boilers with different ratings.
However,itissuggestedtogetanultimateanalysisofthefuelfiredperiodicallyfromareputedlaboratory.Theoretical(stoichiometric)airfuelratioandexcessairsuppliedaretobedeterminedfirstforcomputingtheboilerlosses. The formula is given below for the same.
a) Theoretical air required for combustion = [(11.6xC)+{34.8x(H2-O2/8)}+(4.35xS)]/100kg/kgoffuel.[fromfuelanalysis]
Where C, H2, O2 and S are the percentage of Carbon, Hydrogen, Oxygen and Sulphur present in the fuel.b)%Excessairsupplied(EA) = O2%/21-O2%x100[Fromfluegasanalysis]Normally O2 measurement is recommended. If O2 mesurement is not available, use CO2 measurement.7900x[(CO2%)t-(CO2%)a]/(CO2)a%x[100-(CO2%)T][Fromfluegasanalysis]Where, (CO2 %)t = Theoretical CO2
(CO2 %)a = Actual CO2%measuredinfluegas(CO2 %)t = Moles of C/Moles of N2+MolesofCMoles of N2 = Wt of N2 in theorotical air/Mol. wt of N2+WtofN2 in
fuel/Mol. Wt of N2 Moles of C = Wt of C in fuel/Molecular Wt of Cc) Actual mass of fuel supplied/kg of fuel (AAS)
= {1+EA/100}xtheoroticalair
Table 1.2 Theoretical (Stoichiometric) air fuel ratio
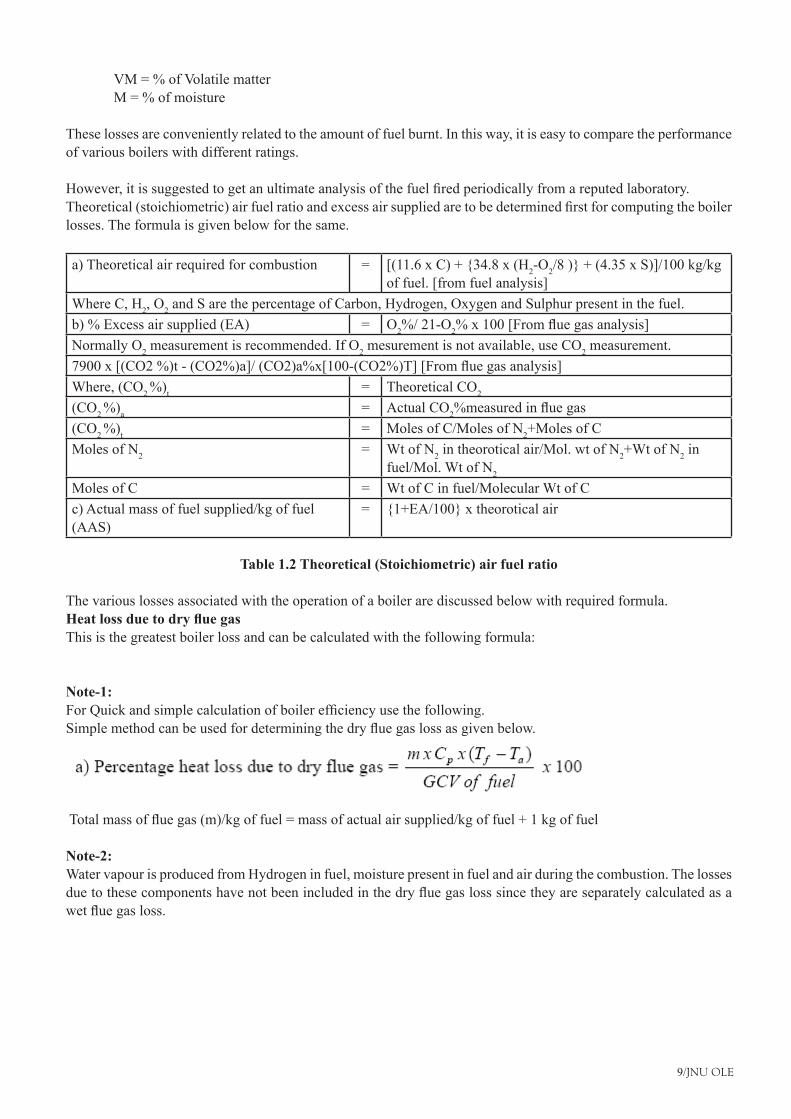
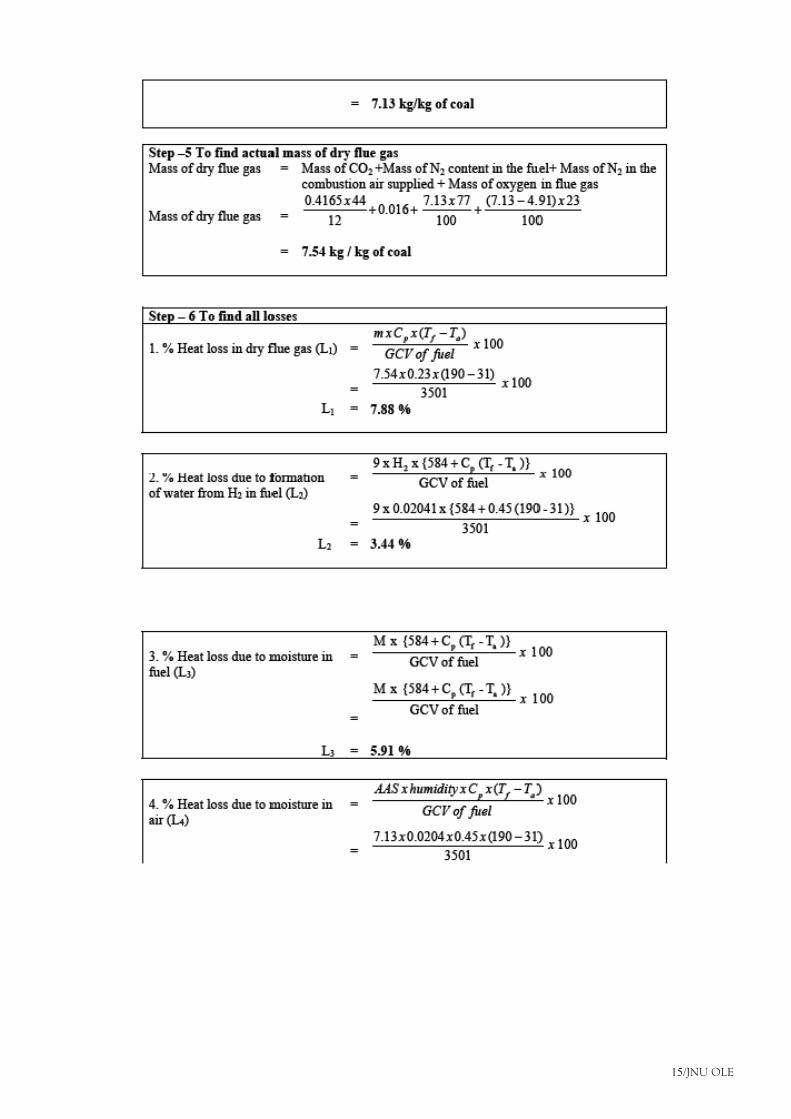
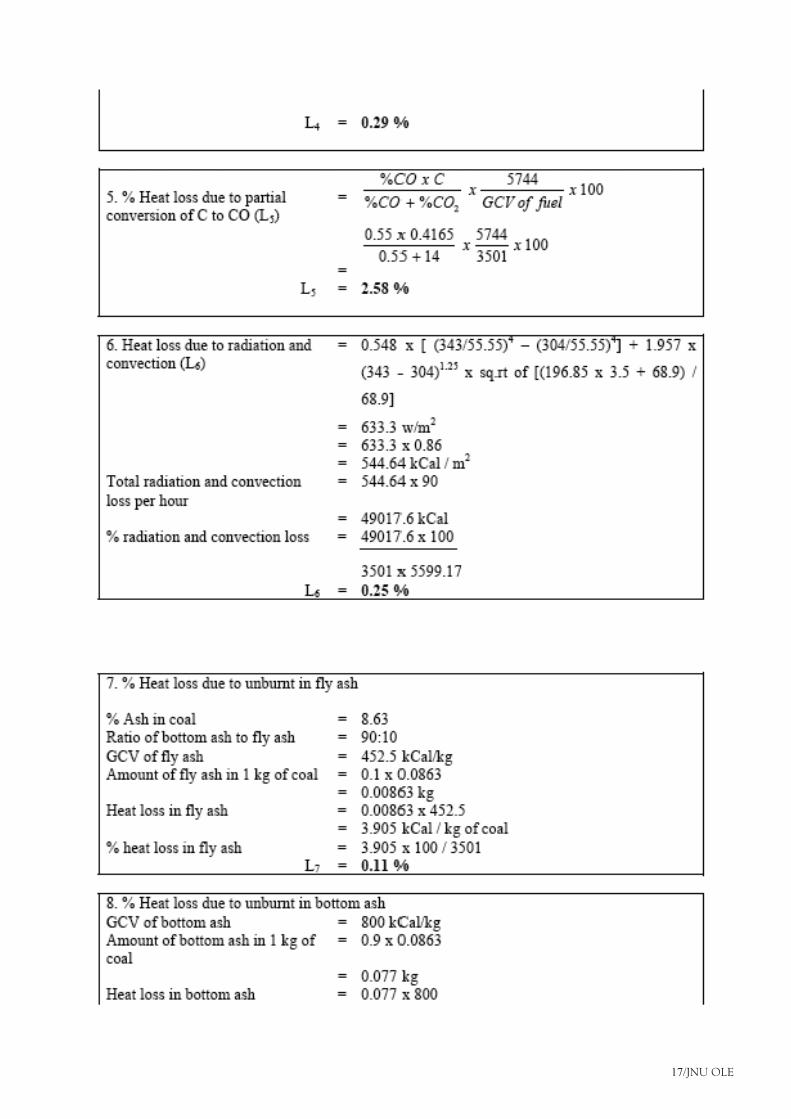
The various losses associated with the operation of a boiler are discussed below with required formula.Heat loss due to dry flue gasThis is the greatest boiler loss and can be calculated with the following formula:
Note-1:ForQuickandsimplecalculationofboilerefficiencyusethefollowing.Simplemethodcanbeusedfordeterminingthedryfluegaslossasgivenbelow.
Totalmassoffluegas(m)/kgoffuel=massofactualairsupplied/kgoffuel+1kgoffuel
Note-2:Water vapour is produced from Hydrogen in fuel, moisture present in fuel and air during the combustion. The losses duetothesecomponentshavenotbeenincludedinthedryfluegaslosssincetheyareseparatelycalculatedasawetfluegasloss.
Energy Performance Assessment
10/JNU OLE
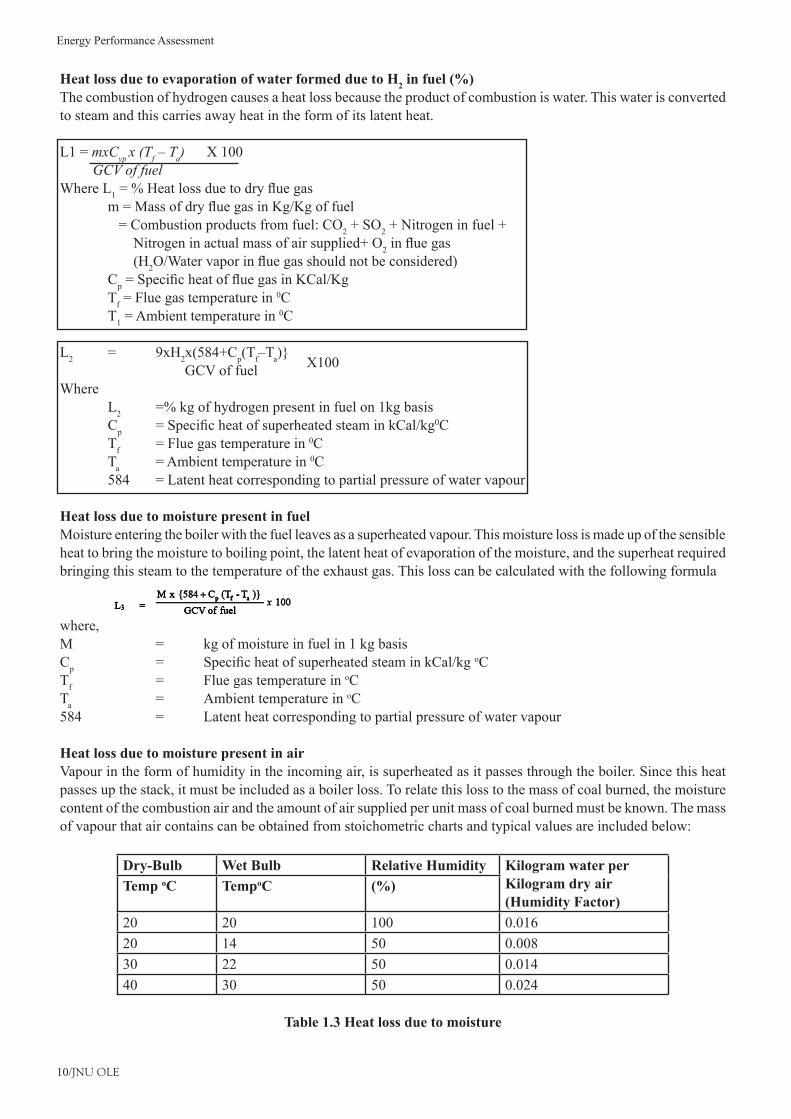
Heat loss due to evaporation of water formed due to H2 in fuel (%)The combustion of hydrogen causes a heat loss because the product of combustion is water. This water is converted to steam and this carries away heat in the form of its latent heat.
L1 = mxCyp x (Tf – Ta) X 100 GCV of fuelWhere L1=%Heatlossduetodryfluegas m=MassofdryfluegasinKg/Kgoffuel = Combustion products from fuel: CO2+SO2+Nitrogeninfuel+ Nitrogeninactualmassofairsupplied+O2influegas (H2O/Watervaporinfluegasshouldnotbeconsidered) Cp=SpecificheatoffluegasinKCal/Kg Tf = Flue gas temperature in 0C T1 = Ambient temperature in 0C
L2 = 9xH2x(584+Cp(Tf–Ta)} GCV of fuel X100
Where L2 =%kgofhydrogenpresentinfuelon1kgbasis Cp =SpecificheatofsuperheatedsteaminkCal/kg0C Tf = Flue gas temperature in 0C Ta = Ambient temperature in 0C 584 = Latent heat corresponding to partial pressure of water vapour
Heat loss due to moisture present in fuelMoisture entering the boiler with the fuel leaves as a superheated vapour. This moisture loss is made up of the sensible heat to bring the moisture to boiling point, the latent heat of evaporation of the moisture, and the superheat required bringing this steam to the temperature of the exhaust gas. This loss can be calculated with the following formula
where,M = kg of moisture in fuel in 1 kg basisCp = SpecificheatofsuperheatedsteaminkCal/kgoCTf = Flue gas temperature in oCTa = Ambient temperature in oC584 = Latent heat corresponding to partial pressure of water vapour
Heat loss due to moisture present in airVapour in the form of humidity in the incoming air, is superheated as it passes through the boiler. Since this heat passes up the stack, it must be included as a boiler loss. To relate this loss to the mass of coal burned, the moisture content of the combustion air and the amount of air supplied per unit mass of coal burned must be known. The mass of vapour that air contains can be obtained from stoichometric charts and typical values are included below:
Dry-Bulb Wet Bulb Relative Humidity Kilogram water per Kilogram dry air (Humidity Factor)
Temp oC TempoC (%)
20 20 100 0.016 20 14 50 0.008 30 22 50 0.014 40 30 50 0.024
Table 1.3 Heat loss due to moisture
11/JNU OLE
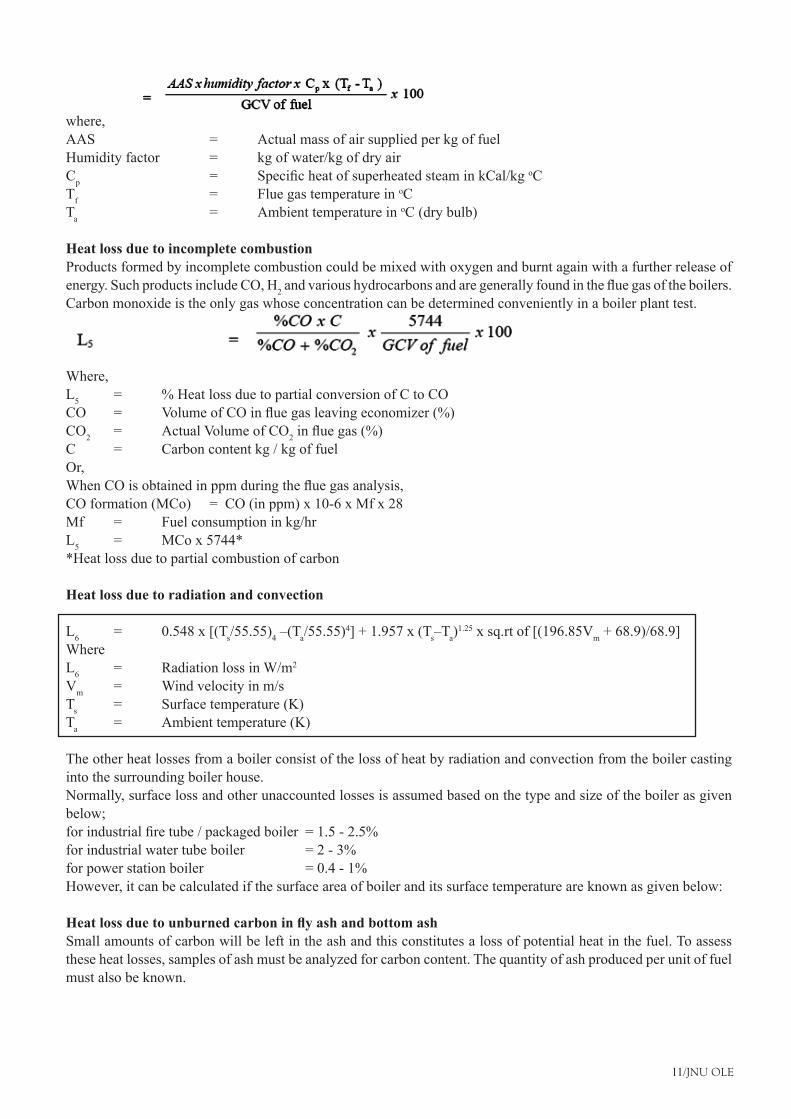
where,AAS = Actual mass of air supplied per kg of fuelHumidity factor = kg of water/kg of dry airCp = SpecificheatofsuperheatedsteaminkCal/kgoCTf = Flue gas temperature in oCTa = Ambient temperature in oC (dry bulb)
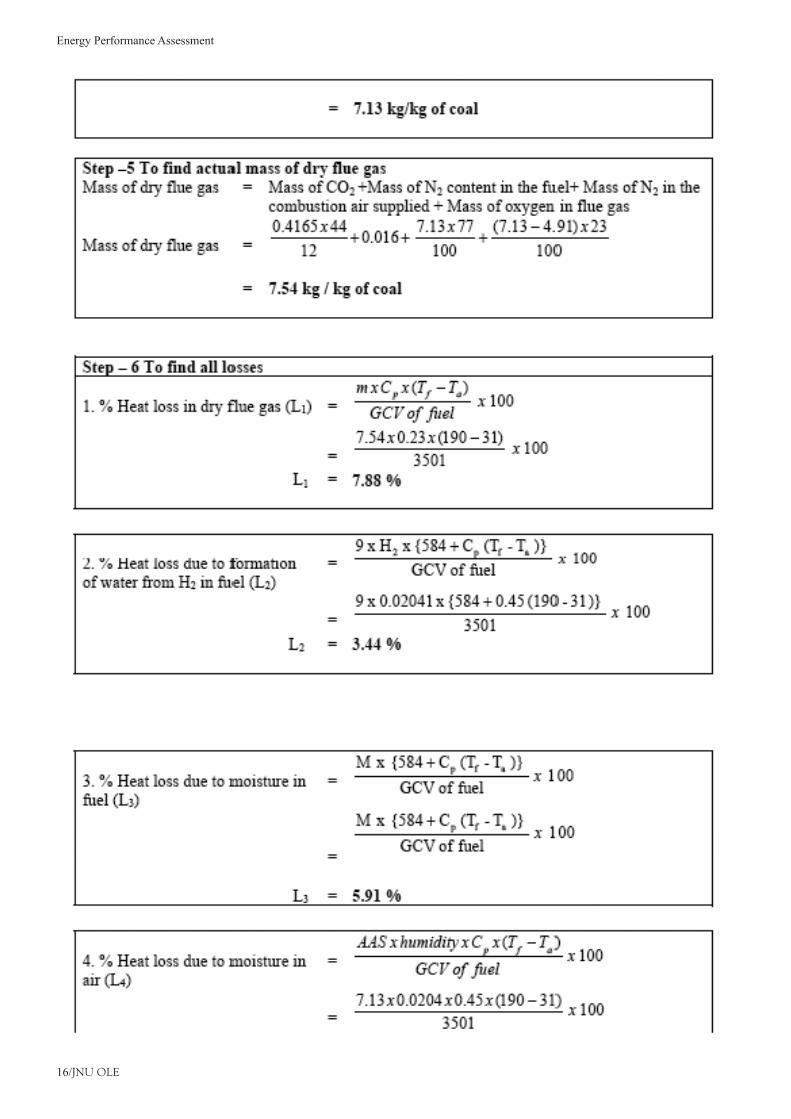
Heat loss due to incomplete combustionProducts formed by incomplete combustion could be mixed with oxygen and burnt again with a further release of energy. Such products include CO, H2andvarioushydrocarbonsandaregenerallyfoundinthefluegasoftheboilers.Carbon monoxide is the only gas whose concentration can be determined conveniently in a boiler plant test.
Where,L5 = %HeatlossduetopartialconversionofCtoCOCO = VolumeofCOinfluegasleavingeconomizer(%)CO2 = Actual Volume of CO2influegas(%)C = Carbon content kg / kg of fuelOr,WhenCOisobtainedinppmduringthefluegasanalysis,CO formation (MCo) = CO (in ppm) x 10-6 x Mf x 28Mf = Fuel consumption in kg/hrL5 = MCo x 5744**Heat loss due to partial combustion of carbon
Heat loss due to radiation and convection
L6 = 0.548 x [(Ts/55.55)4–(Ta/55.55)4]+1.957x(Ts–Ta)1.25 x sq.rt of [(196.85Vm+68.9)/68.9]
WhereL6 = Radiation loss in W/m2
Vm = Wind velocity in m/sTs = Surface temperature (K)Ta = Ambient temperature (K)
The other heat losses from a boiler consist of the loss of heat by radiation and convection from the boiler casting into the surrounding boiler house.Normally, surface loss and other unaccounted losses is assumed based on the type and size of the boiler as given below;forindustrialfiretube/packagedboiler =1.5-2.5%forindustrialwatertubeboiler =2-3%forpowerstationboiler =0.4-1%However, it can be calculated if the surface area of boiler and its surface temperature are known as given below:
Heat loss due to unburned carbon in fly ash and bottom ashSmall amounts of carbon will be left in the ash and this constitutes a loss of potential heat in the fuel. To assess these heat losses, samples of ash must be analyzed for carbon content. The quantity of ash produced per unit of fuel must also be known.
Energy Performance Assessment
12/JNU OLE
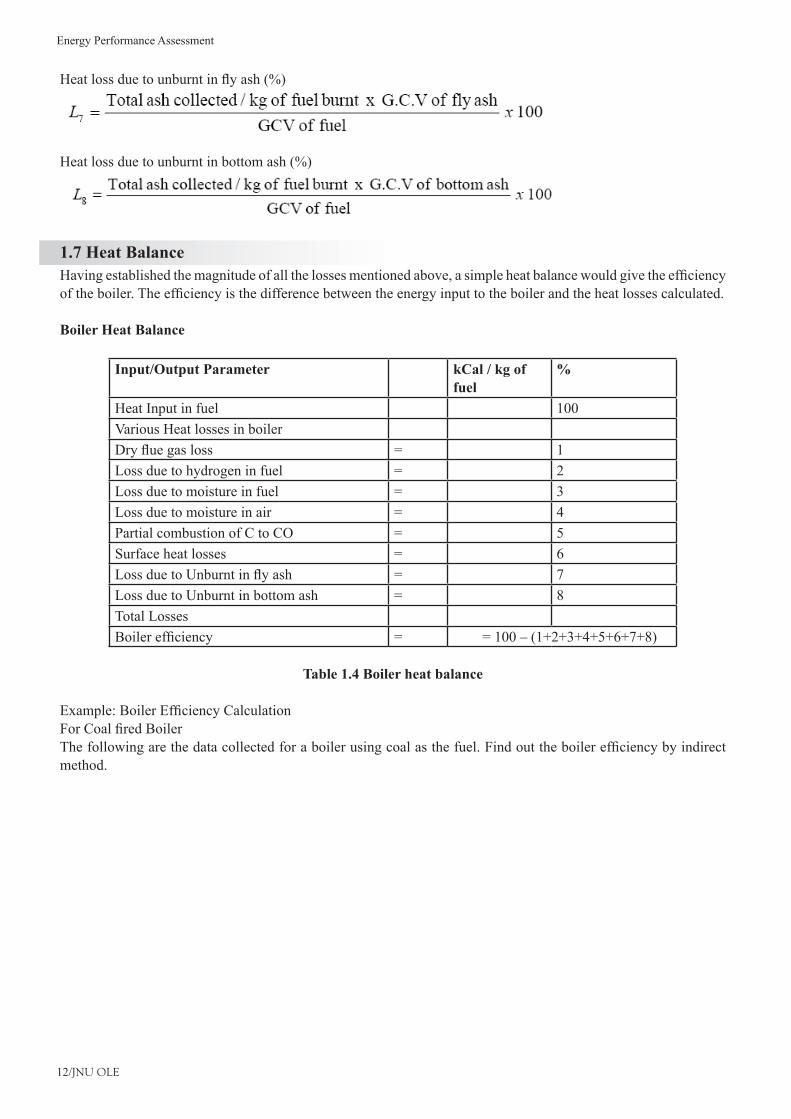
Heatlossduetounburntinflyash(%)
Heatlossduetounburntinbottomash(%)
1.7 Heat BalanceHavingestablishedthemagnitudeofallthelossesmentionedabove,asimpleheatbalancewouldgivetheefficiencyoftheboiler.Theefficiencyisthedifferencebetweentheenergyinputtotheboilerandtheheatlossescalculated.
Boiler Heat Balance
Input/Output Parameter kCal / kg of fuel
%
Heat Input in fuel 100 Various Heat losses in boilerDryfluegasloss = 1Loss due to hydrogen in fuel = 2Loss due to moisture in fuel = 3Loss due to moisture in air = 4Partial combustion of C to CO = 5Surface heat losses = 6LossduetoUnburntinflyash = 7Loss due to Unburnt in bottom ash = 8Total LossesBoilerefficiency = =100–(1+2+3+4+5+6+7+8)
Table 1.4 Boiler heat balance
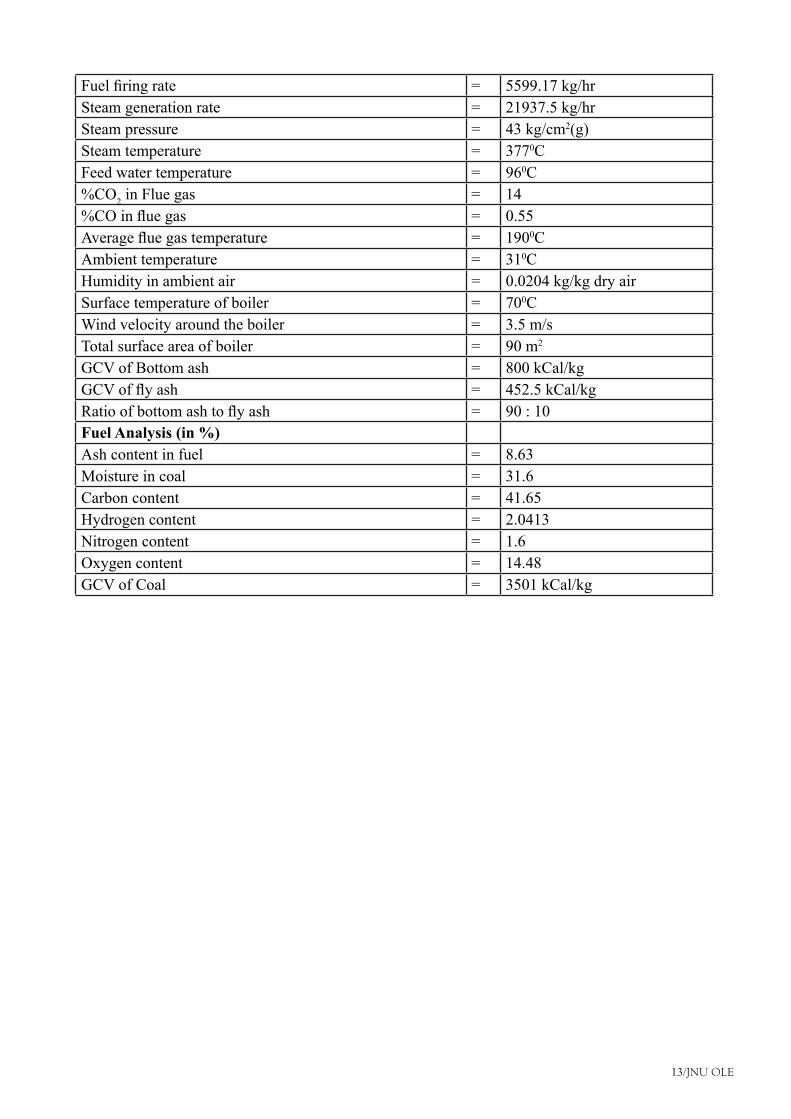
Example:BoilerEfficiencyCalculationForCoalfiredBoilerThefollowingarethedatacollectedforaboilerusingcoalasthefuel.Findouttheboilerefficiencybyindirectmethod.
13/JNU OLE
Fuelfiringrate = 5599.17 kg/hrSteam generation rate = 21937.5 kg/hrSteam pressure = 43 kg/cm2(g)Steam temperature = 3770CFeed water temperature = 960C%CO2 in Flue gas = 14%COinfluegas = 0.55Averagefluegastemperature = 1900CAmbient temperature = 310CHumidity in ambient air = 0.0204 kg/kg dry airSurface temperature of boiler = 700CWind velocity around the boiler = 3.5 m/sTotal surface area of boiler = 90 m2
GCV of Bottom ash = 800 kCal/kgGCVofflyash = 452.5 kCal/kgRatioofbottomashtoflyash = 90 : 10Fuel Analysis (in %)Ash content in fuel = 8.63Moisture in coal = 31.6Carbon content = 41.65Hydrogen content = 2.0413Nitrogen content = 1.6Oxygen content = 14.48GCV of Coal = 3501 kCal/kg
Energy Performance Assessment
14/JNU OLE
15/JNU OLE
Energy Performance Assessment
16/JNU OLE
17/JNU OLE
Energy Performance Assessment
18/JNU OLE
19/JNU OLE
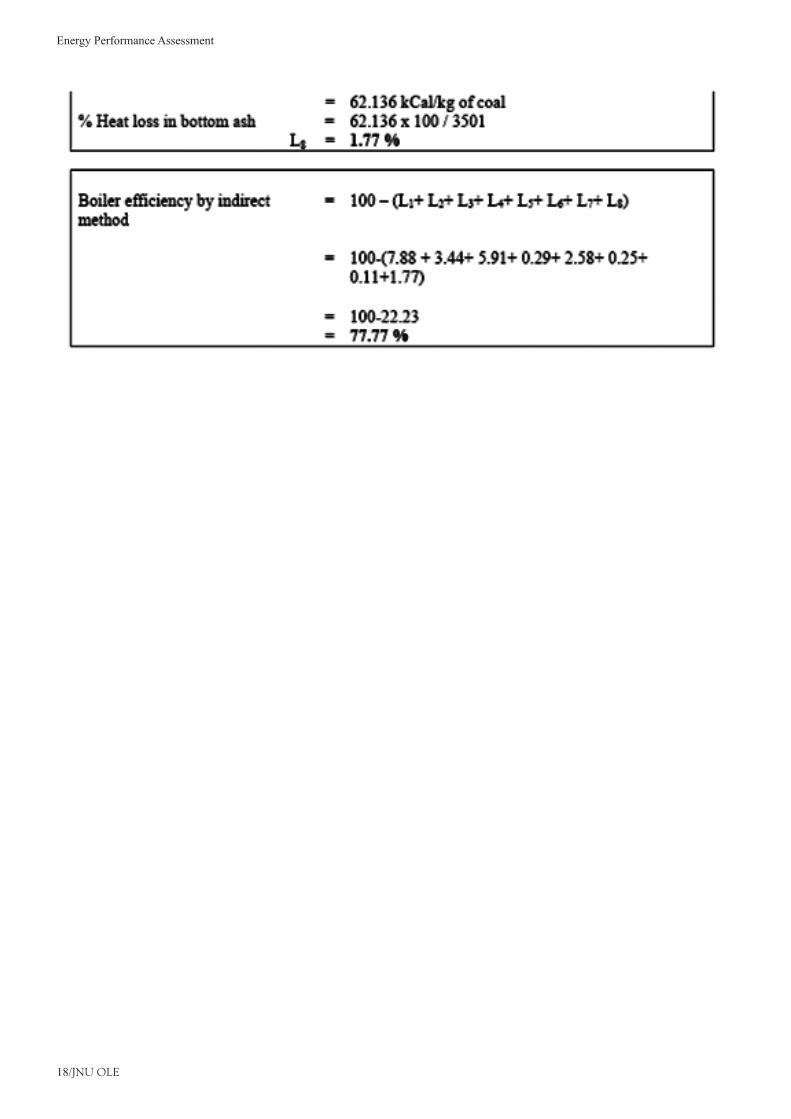
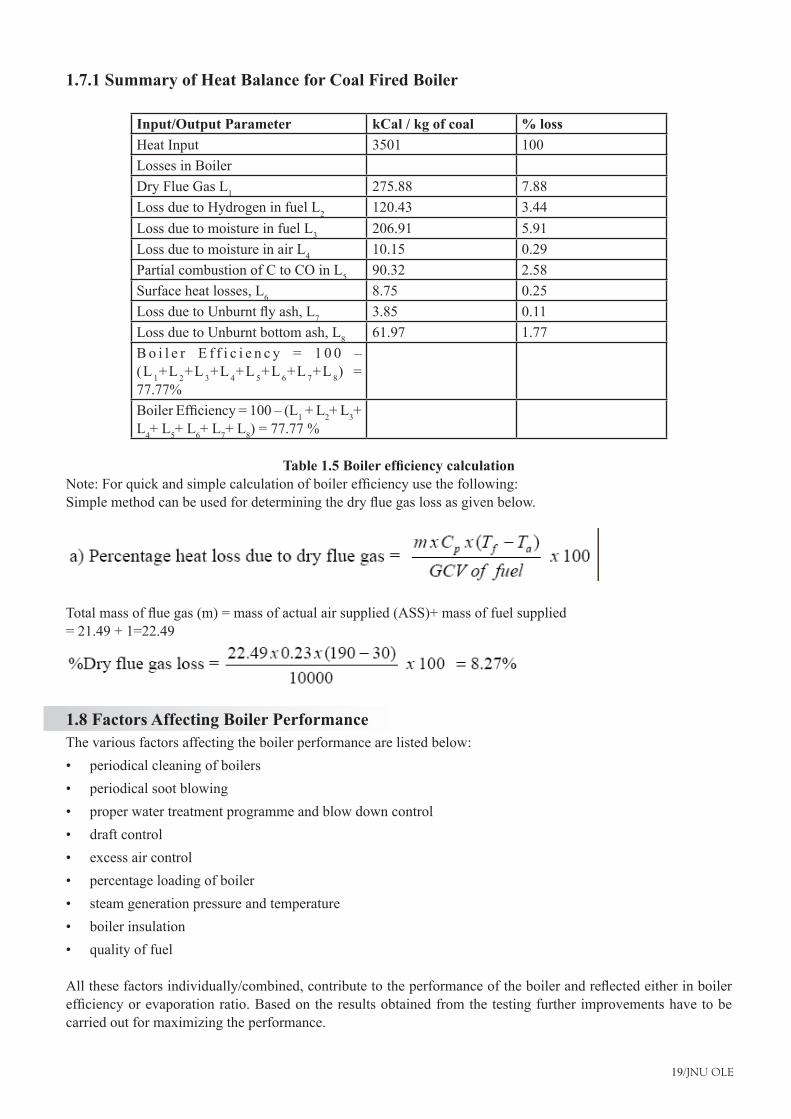
1.7.1 Summary of Heat Balance for Coal Fired Boiler
Input/Output Parameter kCal / kg of coal % lossHeat Input 3501 100Losses in BoilerDry Flue Gas L1 275.88 7.88Loss due to Hydrogen in fuel L2 120.43 3.44Loss due to moisture in fuel L3 206.91 5.91Loss due to moisture in air L4 10.15 0.29Partial combustion of C to CO in L5 90.32 2.58Surface heat losses, L6 8.75 0.25LossduetoUnburntflyash,L7 3.85 0.11Loss due to Unburnt bottom ash, L8 61.97 1.77Bo i l e r E f f i c i e n c y = 1 0 0 –(L 1+L 2+L 3+L 4+L 5+L 6+L 7+L 8) = 77.77%BoilerEfficiency=100–(L1+L2+L3+L4+L5+L6+L7+L8)=77.77%
Table 1.5 Boiler efficiency calculationNote:Forquickandsimplecalculationofboilerefficiencyusethefollowing:Simplemethodcanbeusedfordeterminingthedryfluegaslossasgivenbelow.
Totalmassoffluegas(m)=massofactualairsupplied(ASS)+massoffuelsupplied=21.49+1=22.49
1.8 Factors Affecting Boiler PerformanceThe various factors affecting the boiler performance are listed below:
periodical cleaning of boilers•periodical soot blowing•proper water treatment programme and blow down control•draft control•excess air control•percentage loading of boiler•steam generation pressure and temperature•boiler insulation•quality of fuel•
Allthesefactorsindividually/combined,contributetotheperformanceoftheboilerandreflectedeitherinboilerefficiencyorevaporationratio.Basedontheresultsobtainedfromthetestingfurtherimprovementshavetobecarried out for maximizing the performance.
Energy Performance Assessment
20/JNU OLE
Thetestcanberepeatedaftermodificationorrectificationoftheproblemsandcomparedwithstandardnorms.Energy auditor should carry out this test as a routine manner once in six months and report to the management for necessary action.
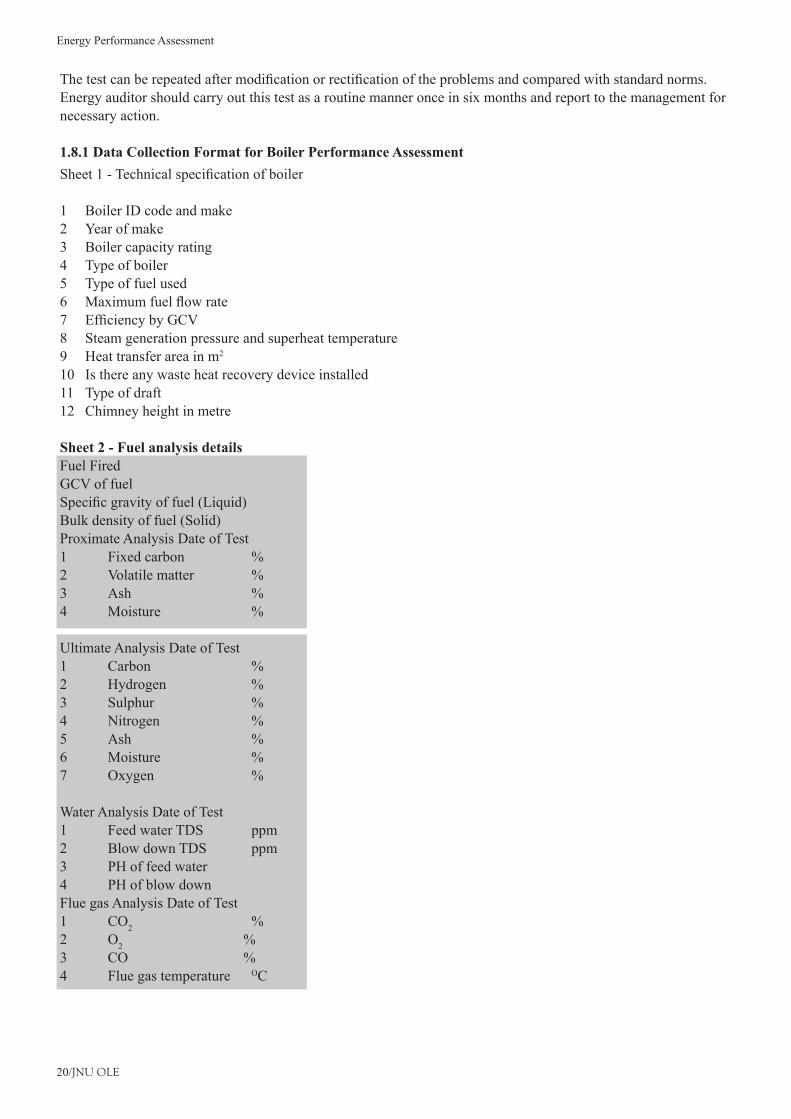
1.8.1 Data Collection Format for Boiler Performance AssessmentSheet1-Technicalspecificationofboiler
1 Boiler ID code and make2 Year of make3 Boiler capacity rating4 Type of boiler5 Type of fuel used6 Maximumfuelflowrate7 EfficiencybyGCV8 Steam generation pressure and superheat temperature9 Heat transfer area in m2
10 Is there any waste heat recovery device installed11 Type of draft12 Chimney height in metre
Sheet 2 - Fuel analysis detailsFuel FiredGCV of fuelSpecificgravityoffuel(Liquid)Bulk density of fuel (Solid)Proximate Analysis Date of Test1 Fixedcarbon %2 Volatilematter %3 Ash %4 Moisture %
Ultimate Analysis Date of Test1 Carbon %2 Hydrogen %3 Sulphur %4 Nitrogen %5 Ash %6 Moisture %7 Oxygen %
Water Analysis Date of Test1 Feed water TDS ppm2 Blow down TDS ppm3 PH of feed water 4 PH of blow down Flue gas Analysis Date of Test1 CO2 %2 O2 %3 CO %4 Flue gas temperature OC

21/JNU OLE
Sheet 3 – Format sheet for boiler efficiency testing
Date: ______________
Boiler Code No.:_________________
Sl.
No.
Time Ambient Air Fuel Stream Flue Gas Analysis Surface Temp. of
Boiler in oC
Dry
Bulb
Temp.
(oC)
Wet
Bulb
Temp.
(oC
Flow Rate
(kg/hr)
Temp.
(oC
Flow
Rate
(m3/
hr)
Pressure
(kg/cm2g)
Temp.
(oC)
O2% CO2
%
CO% Temp
(oC)
Boiler Supervisor________________ Energy Manager________________ Energy Auditor________________
Boiler TerminologyMCRSteamboilersratedoutputisalsousuallydefinedasMCR(MaximumContinuousRating).Thisisthemaximumevaporation rate that can be sustained for 24 hours and may be less than a shorter duration maximum rating
Boiler ratingConventionally,boilersarespecifiedbytheircapacitytoholdwaterandthesteamgenerationrate.Often,thecapacitytogeneratesteamisspecifiedintermsofequivalentevaporation(kgofsteam/hourat100oC).
Equivalent evaporation (“from and at” 100oC)The equivalent of the evaporation of 1 kg of water at 100oC to steam at 100oC.
EfficiencyIntheboilerindustrytherearefourcommondefinitionsofefficiency.
Combustion efficiency Combustionefficiencyistheeffectivenessoftheburneronlyandrelatestoitsabilitytocompletelyburnthefuel.Theboilerhaslittlebearingoncombustionefficiency.Awell-designedburnerwilloperatewithaslittleas15to20%excessair,whileconvertingallcombustiblesinthefueltousefulenergy.
Thermal efficiencyThermalefficiencyistheeffectivenessoftheheattransferinaboiler.Itdoesnottakeintoaccountboilerradiationandconvectionlosses–forexamplefromtheboilershellwatercolumnpipingetc.
Boiler efficiencyThetermboilerefficiencyisoftensubstitutedforcombustionorthermalefficiency.Trueboilerefficiencyisthemeasureoffueltosteamefficiency.
Fuel to steam efficiency FueltosteamefficiencyiscalculatedusingeitherofthetwomethodsasprescribedbytheASME(AmericanSocietyforMechanicalEngineers)powertestcode,PTC4.1.Thefirstmethodisinputoutputmethod.Thesecondmethodis heat loss method.
Energy Performance Assessment
22/JNU OLE
Boiler turndownBoilerturndownistheratiobetweenfullboileroutputandtheboileroutputwhenoperatingatlowfire.Typicalboiler turndown is 4:1. The ability of the boiler to turndown reduces frequent on and off cycling. Fully modulating burnersaretypicallydesignedtooperatedownto25%ofratedcapacity.Ataloadthatis20%oftheloadcapacity,the boiler will turn off and cycle frequently.
A boiler operating at low load conditions can cycle as frequently as 12 times per hour or 288 times per day. Witheachcycle,preandpostpurgeairflowremovesheatfromtheboilerandsendsitoutthestack.Keepingtheboileronatlowfiringratescaneliminatetheenergyloss.Everytimetheboilercyclesoff,itmustgothroughaspecificstart-upsequenceforsafetyassurance.Itrequiresaboutaminuteortwotoplacetheboilerbackonline.
And if there is a sudden load demand the start up sequence cannot be accelerated. Keeping the boiler on line assures the quickest response to load changes. Frequent cycling also accelerates wear of boiler components. Maintenance increases and more importantly, the chance of component failure increases.
Boiler(s) capacity requirement is determined by much different type of load variations in the system. Boiler over -sizing occurs when future expansion and safety factors are added to assure that the boiler is large enough for the application. If the boiler is oversized the ability of the boiler to handle minimum loads without cycling is reduced. Therefore capacity and turndown should be considered together for proper boiler selection to meet overall system load requirements.
Primary airThatpartoftheairsupplytoacombustionsystemwhichthefuelfirstencounters.
Secondary airThe second stage of admission of air to a combustion system, generally to complete combustion initiated by the primaryair.Itcanbeinjectedintothefurnaceofaboilerunderrelativelyhighpressurewhenfiringsolidfuelsinorder to create turbulence above the burning fuel to ensure good mixing with the gases produced in the combustion process and thereby complete combustion
Tertiary airThe third stage of admission of air to a combustion system, the reactions of which have largely been completed by secondary air. Tertiary air is rarely needed.
StoichiometricIn combustion technology, stoichiometric air is that quantity of air, and no more, which is theoretically needed to burncompletelyaunitquantityoffuel.‘Sub-stoichiometric’referstothepartialcombustionoffuelinadeficiencyof air
Balanced draughtThe condition achieved when the pressure of the gas in a furnace is the same as or slightly below that of the atmosphere in the enclosure or building housing it.
Gross Calorific Value (GCV)Theamountofheatliberatedbythecompletecombustion,underspecifiedconditions,byaunitvolumeofagasorof a unit mass of a solid or liquid fuel, in the determination of which the water produced by combustion of the fuel is assumed to be completely condensed and its latent and sensible heat made available.
Net Calorific Value (NCV)Theamountofheatgeneratedbythecompletecombustion,underspecifiedconditions,byaunitvolumeofagasor of a unit mass of a solid or liquid fuel, in the determination of which the water produced by the combustion of the fuel is assumed to remain as vapour.
23/JNU OLE
Absolute pressure The sum of the gauge and the atmospheric pressure. For instance, if the steam gauge on the boiler shows 9 kg/cm2g the absolute pressure of the steam is 10 kg/cm2(a).
Atmospheric pressureThe pressure due to the weight of the atmosphere. It is expressed in pounds per square inches in. or inches of mercury column or kg/cm2. Atmospheric pressure at sea level is 14.7 lbs. / sq. inch. or 30 inch mercury column or 760mm of mercury (mm Hg) or 101.325 kilo Pascal (kPa).
Carbon monoxide (CO)Produced from any source that burns fuel with incomplete combustion, causes chest pain in heart patients, headaches and reduced mental alertness.
Blow down The removal of some quantity of water from the boiler in order to achieve an acceptable concentration of dissolved and suspended solids in the boiler water.
Complete combustion The complete oxidation of the fuel, regardless of whether it is accomplished with an excess amount of oxygen or air, or just the theoretical amount required for perfect combustion.
Perfect combustionThe complete oxidation of the fuel, with the exact theoretical (stoichiometric) amount of oxygen (air) required.
Saturated steam: It is the steam, whose temperature is equal to the boiling point corresponding to that pressure.
Wet steam the saturated steam which contains moisture, is called wet steam.
Dry steamEither saturated or superheated steam containing no moisture.
Superheated steam Steam heated to a temperature above the boiling point or saturation temperature corresponding to its pressure.
Oxygentrimssensormeasuresfluegasoxygenandaclosedloopcontrollercomparestheactualoxygenleveltothedesiredoxygenlevel.Theair(orfuel)flowistrimmedbythecontrolleruntiltheoxygenleveliscorrected.Thedesiredoxygenlevelforeachfiringratemustbeenteredintoacharacterizedsetpointcurvegenerator.OxygenTrimmaintainsthelowestpossibleburnerexcessairlevelfromlowtohighfire.Burnersthatdon’thaveOxygenTrimmust run with Extra Excess Air to allow safe operation during variations in weather, fuel, and linkage.
Heat transfer mediumsThere are different types of heat transfer medium e.g. steam, hot water and thermal oil. Steam and Hot water are most commonand itwill bevaluable tobrieflyexamine these commonheat transfermediumsandassociatedproperties.
Thermic fluidThermic Fluid is used as a heat transfer mechanism in some industrial process and heating applications. Thermic Fluid may be vegetable or mineral based oil and the oil may be raised to a high temperature without the need for any pressurization.Therelativelyhighflowandreturntemperaturesmaylimitthepotentialforfluegasheatrecoveryunless some other system can absorb this heat usefully. Careful design and selection is required to achieve best energyefficiency.

Energy Performance Assessment
24/JNU OLE
Hot waterWaterisafluidwithmediumdensity,highspecificheatcapacity,lowviscosityandrelativelylowthermalconductivity.At relatively low temperature e.g. 70oC -90oC, hot water is useful for smaller heating installations.
SteamWhen water is heated its temperature will rise. The heat added is called sensible heat and the heat content of the water is termed its enthalpy. The usual datum point used to calculate enthalpy is 0oC.
When the water reaches its boiling point, any further heat input will result in some proportion of the water changing from the liquid to the vapour state, i.e., changing to steam. The heat required for this change of state is termed the 'latentheatofevaporation'andisexpressedintermsofafixedmassofwater.Wherenochangeintemperatureoccurs during the change of state, the steam will exist in equilibrium with the water. This equilibrium state is termed 'saturation conditions'. Saturation conditions can occur at any pressure, although at each pressure there is only one discrete temperature at which saturation can occur.
If further heat is applied to the saturated steam the temperature will rise and the steam will become 'superheated'. Any increase in temperature above saturated conditions will be accompanied by a further rise in enthalpy. Steam is useful heat transfer medium because, as a gas, it is compressible. At high pressure and consequently density, steam can carry large quantities of heat with relatively small volume.

25/JNU OLE
SummaryThischapterexplainsperformanceoftheboiler,likeefficiencyandevaporationratioreduceswithtime,dueto•poor combustion, heat transfer fouling and poor operation and maintenance.It states the British Standard BS845: 1987 that describes the methods and conditions under which a boiler should •betestedtodetermineitsefficiency.ItexplainsIS8753Indianstandardforboilerefficiencytestingmethodsthataredirectandindirectmethods.•Italsodescribesboilerefficiencycalculations,examplesandmeasurementsrequiredforperformanceassessment•testing.It gives a brief description of boiler performance and factors affecting boiler performance.•Itmentionsthattheboilerindustryhasfourcommondefinitionsofefficiencythatarecombustion,thermal,•boilerandfueltosteamefficiency.Boilerturndownistheratiobetweenfullboileroutputandtheboileroutputwhenoperatingatlowfire.•AtlastitexplainstheconceptGrossCalorificValue(GCV)andNetCalorificValue(NCV).•
Recommended ReadingFredrick M. Steingress, Harold J. Frost, 2009, • High Pressure Boilers, Amer Technical Publications, p 344.Sam G.Duleglow, • The Control of Boilers, Instrument Society of America, p 412Mohammed Malek, • Heating Boiler Operators Manual: Maintenance, Operation and Repair, McGraw-Hill Professional, 1 edition, p 352.
Energy Performance Assessment
26/JNU OLE
Self Assessment
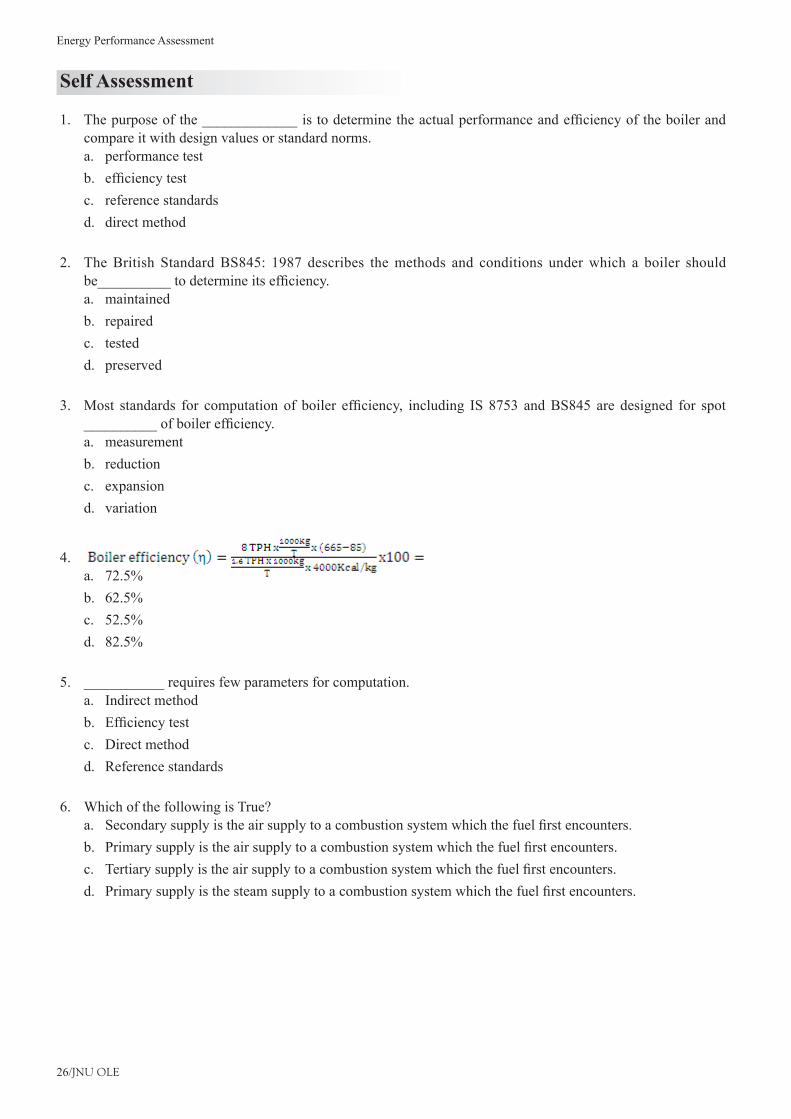
Thepurposeofthe_____________istodeterminetheactualperformanceandefficiencyoftheboilerand1. compare it with design values or standard norms.
performance testa. efficiencytestb. reference standardsc. direct methodd.
The British Standard BS845: 1987 describes the methods and conditions under which a boiler should 2. be__________todetermineitsefficiency.
maintaineda. repairedb. testedc. preservedd.
Most standards for computation of boiler efficiency, including IS 8753 andBS845 are designed for spot3. __________ofboilerefficiency.
measurementa. reductionb. expansionc. variationd.
4. 72.5%a. 62.5%b. 52.5%c. 82.5%d.
___________ requires few parameters for computation.5. Indirect methoda. Efficiencytestb. Direct methodc. Reference standardsd.
Which of the following is True?6. Secondarysupplyistheairsupplytoacombustionsystemwhichthefuelfirstencounters.a. Primarysupplyistheairsupplytoacombustionsystemwhichthefuelfirstencounters.b. Tertiarysupplyistheairsupplytoacombustionsystemwhichthefuelfirstencounters.c. Primarysupplyisthesteamsupplytoacombustionsystemwhichthefuelfirstencounters.d.

27/JNU OLE
Which of the following is True?7. SteamboilersratedoutputisalsousuallydefinedasMCR.a. ElectricboilersratedoutputisalsousuallydefinedasMCR.b. SteamboilersratedoutputisneverdefinedasMCR.c. SteamboilersratedoutputisalsousuallydefinedasMVR.d.
Which of the following is True?8. Indirect method needs few instruments for monitoring.a. Direct method needs few instruments for monitoring.b. Direct method needs many instruments for monitoring.c. Direct method does not need any instruments for monitoring.d.
Which of the following is True?9. Fueltosteamefficiencyistheeffectivenessoftheheattransferinaboiler.a. Combustionefficiencyistheeffectivenessoftheheattransferinaboiler.b. Thermalefficiencyistheeffectivenessoftheheattransferinaboiler.c. Boilerefficiencyistheeffectivenessoftheheattransferinaboiler.d.
Which of the following is True?10. Boilerefficiencyis theeffectivenessof theburneronlyandrelates to itsability tocompletelyburnthea. fuel.Thermalefficiencyistheeffectivenessoftheburneronlyandrelatestoitsabilitytocompletelyburntheb. fuel.Fuelefficiencyistheeffectivenessoftheburneronlyandrelatestoitsabilitytocompletelyburnthefuel.c. Combustionefficiencyistheeffectivenessoftheburneronlyandrelatestoitsabilitytocompletelyburnd. the fuel.

Energy Performance Assessment
28/JNU OLE
Chapter II
Performance Assessment of Furnaces
AimThe aim of this chapter is to:
understandtermsanddefinitionsrelatedtofurnaceperformance•observedirectandindirectmethodsofefficiencyevaluation•identify factors affecting furnace performance•
ObjectivesThe objectives of this chapter are to:
recognize objectives of conducting a performance test•identifyparametersformeasuringenergybalanceinanoilfiredfurnace•understandfieldtestingformatfordatacollection•
Learning outcomeAt the end of this chapter students will be able to:
determinedirectandindirectmethodsofefficiencyevaluation•identify factors affecting furnace performance•classifyparametersformeasuringenergybalanceinanoilfiredfurnace•
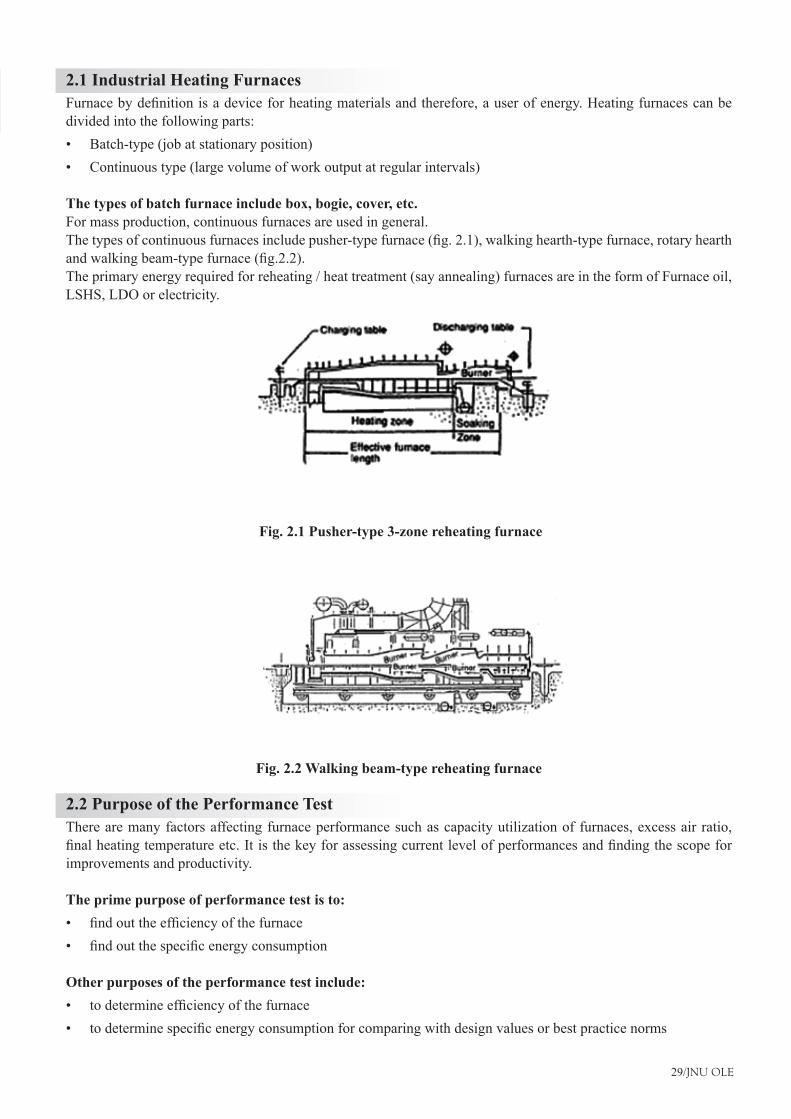
29/JNU OLE
2.1 Industrial Heating FurnacesFurnacebydefinitionisadeviceforheatingmaterialsandtherefore,auserofenergy.Heatingfurnacescanbedivided into the following parts:
Batch-type (job at stationary position)•Continuous type (large volume of work output at regular intervals)•
The types of batch furnace include box, bogie, cover, etc.For mass production, continuous furnaces are used in general.Thetypesofcontinuousfurnacesincludepusher-typefurnace(fig.2.1),walkinghearth-typefurnace,rotaryhearthandwalkingbeam-typefurnace(fig.2.2).The primary energy required for reheating / heat treatment (say annealing) furnaces are in the form of Furnace oil, LSHS, LDO or electricity.
Fig. 2.1 Pusher-type 3-zone reheating furnace
Fig. 2.2 Walking beam-type reheating furnace
2.2 Purpose of the Performance TestThere are many factors affecting furnace performance such as capacity utilization of furnaces, excess air ratio, finalheatingtemperatureetc.Itisthekeyforassessingcurrentlevelofperformancesandfindingthescopeforimprovements and productivity.
The prime purpose of performance test is to:findouttheefficiencyofthefurnace•findoutthespecificenergyconsumption•
Other purposes of the performance test include:todetermineefficiencyofthefurnace•todeterminespecificenergyconsumptionforcomparingwithdesignvaluesorbestpracticenorms•
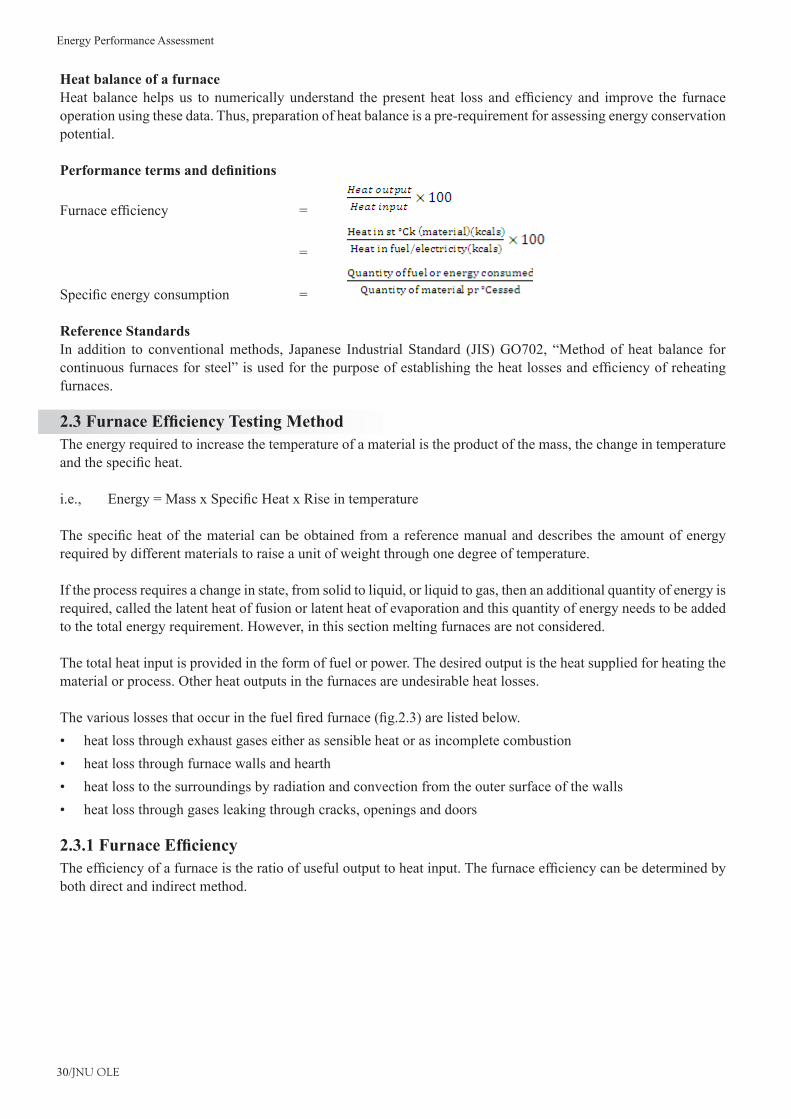
Energy Performance Assessment
30/JNU OLE
Heat balance of a furnaceHeatbalancehelpsus tonumericallyunderstand thepresentheat loss andefficiencyand improve the furnaceoperation using these data. Thus, preparation of heat balance is a pre-requirement for assessing energy conservation potential.
Performance terms and definitions
Furnaceefficiency =
=
Specificenergyconsumption =
Reference StandardsIn addition to conventional methods, Japanese Industrial Standard (JIS) GO702, “Method of heat balance for continuousfurnacesforsteel”isusedforthepurposeofestablishingtheheatlossesandefficiencyofreheatingfurnaces.
2.3 Furnace Efficiency Testing MethodThe energy required to increase the temperature of a material is the product of the mass, the change in temperature andthespecificheat.
i.e., Energy=MassxSpecificHeatxRiseintemperature
Thespecificheatof thematerialcanbeobtainedfromareferencemanualanddescribes theamountofenergyrequired by different materials to raise a unit of weight through one degree of temperature.
If the process requires a change in state, from solid to liquid, or liquid to gas, then an additional quantity of energy is required, called the latent heat of fusion or latent heat of evaporation and this quantity of energy needs to be added to the total energy requirement. However, in this section melting furnaces are not considered.
The total heat input is provided in the form of fuel or power. The desired output is the heat supplied for heating the material or process. Other heat outputs in the furnaces are undesirable heat losses.
Thevariouslossesthatoccurinthefuelfiredfurnace(fig.2.3)arelistedbelow.heat loss through exhaust gases either as sensible heat or as incomplete combustion•heat loss through furnace walls and hearth•heat loss to the surroundings by radiation and convection from the outer surface of the walls•heat loss through gases leaking through cracks, openings and doors•
2.3.1 Furnace EfficiencyTheefficiencyofafurnaceistheratioofusefuloutputtoheatinput.Thefurnaceefficiencycanbedeterminedbyboth direct and indirect method.
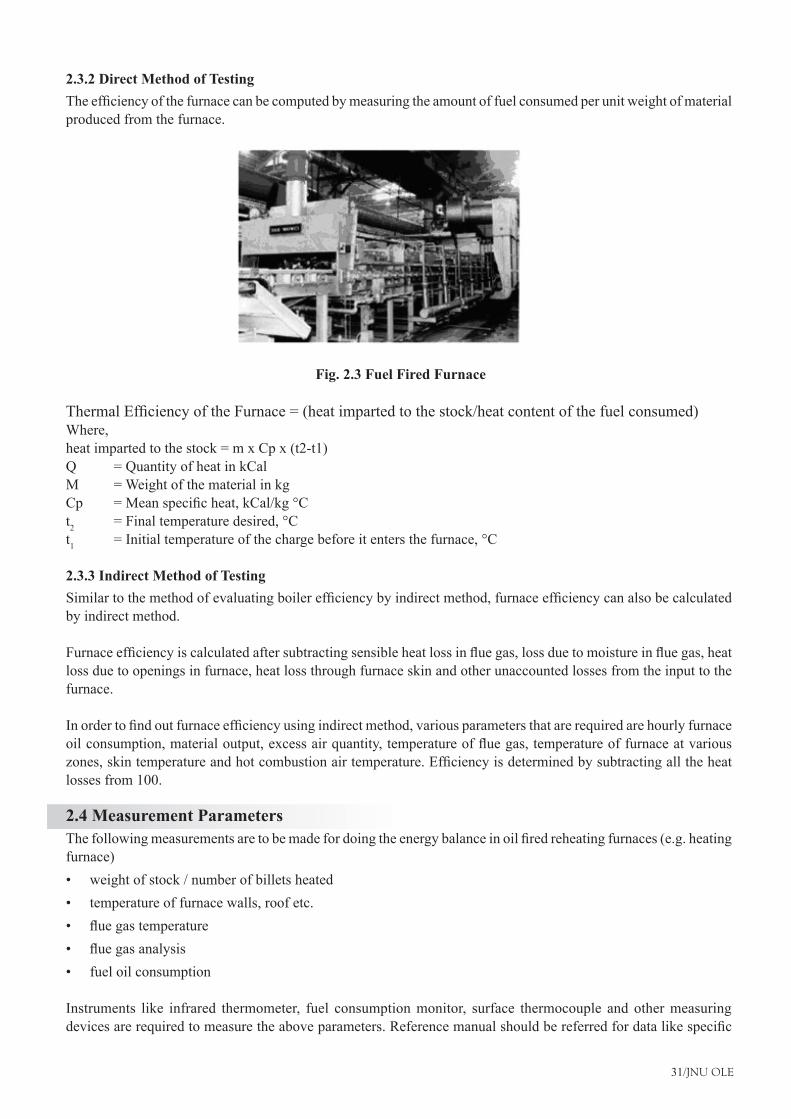
31/JNU OLE
2.3.2 Direct Method of TestingTheefficiencyofthefurnacecanbecomputedbymeasuringtheamountoffuelconsumedperunitweightofmaterialproduced from the furnace.
Fig. 2.3 Fuel Fired Furnace
ThermalEfficiencyoftheFurnace=(heatimpartedtothestock/heatcontentofthefuelconsumed)Where,heat imparted to the stock = m x Cp x (t2-t1)Q = Quantity of heat in kCalM = Weight of the material in kgCp =Meanspecificheat,kCal/kg°Ct2 =Finaltemperaturedesired,°Ct1 =Initialtemperatureofthechargebeforeitentersthefurnace,°C
2.3.3 Indirect Method of TestingSimilartothemethodofevaluatingboilerefficiencybyindirectmethod,furnaceefficiencycanalsobecalculatedby indirect method.
Furnaceefficiencyiscalculatedaftersubtractingsensibleheatlossinfluegas,lossduetomoistureinfluegas,heatloss due to openings in furnace, heat loss through furnace skin and other unaccounted losses from the input to the furnace.
Inordertofindoutfurnaceefficiencyusingindirectmethod,variousparametersthatarerequiredarehourlyfurnaceoilconsumption,materialoutput,excessairquantity,temperatureoffluegas,temperatureoffurnaceatvariouszones,skintemperatureandhotcombustionairtemperature.Efficiencyisdeterminedbysubtractingalltheheatlosses from 100.
2.4 Measurement ParametersThefollowingmeasurementsaretobemadefordoingtheenergybalanceinoilfiredreheatingfurnaces(e.g.heatingfurnace)
weight of stock / number of billets heated•temperature of furnace walls, roof etc.•fluegastemperature•fluegasanalysis•fuel oil consumption•
Instruments like infrared thermometer, fuel consumption monitor, surface thermocouple and other measuring devicesarerequiredtomeasuretheaboveparameters.Referencemanualshouldbereferredfordatalikespecific
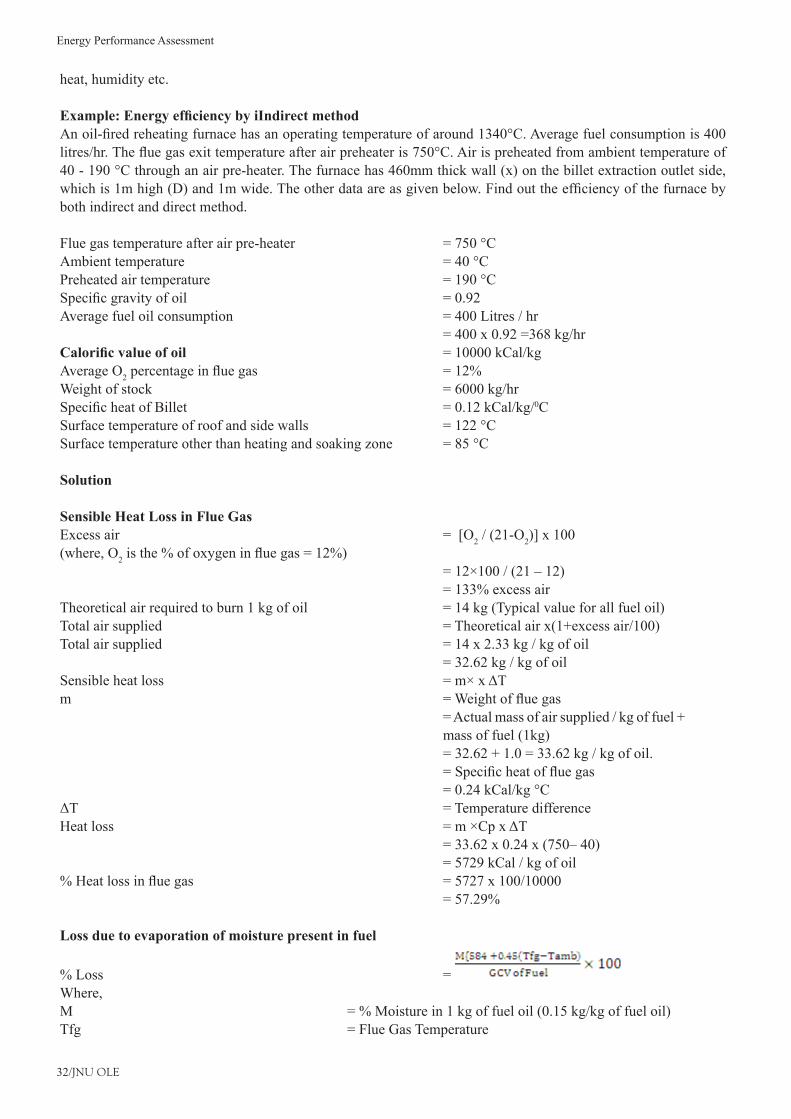
Energy Performance Assessment
32/JNU OLE
heat, humidity etc.
Example: Energy efficiency by iIndirect methodAnoil-firedreheatingfurnacehasanoperatingtemperatureofaround1340°C.Averagefuelconsumptionis400litres/hr.Thefluegasexittemperatureafterairpreheateris750°C.Airispreheatedfromambienttemperatureof40-190°Cthroughanairpre-heater.Thefurnacehas460mmthickwall(x)onthebilletextractionoutletside,whichis1mhigh(D)and1mwide.Theotherdataareasgivenbelow.Findouttheefficiencyofthefurnacebyboth indirect and direct method.
Fluegastemperatureafterairpre-heater =750°CAmbienttemperature =40°CPreheatedairtemperature =190°CSpecificgravityofoil =0.92Average fuel oil consumption = 400 Litres / hr = 400 x 0.92 =368 kg/hrCalorific value of oil = 10000 kCal/kgAverage O2percentageinfluegas =12%Weight of stock = 6000 kg/hrSpecificheatofBillet =0.12kCal/kg/0CSurfacetemperatureofroofandsidewalls =122°CSurfacetemperatureotherthanheatingandsoakingzone =85°C
Solution
Sensible Heat Loss in Flue GasExcess air = [O2 / (21-O2)]x100(where, O2isthe%ofoxygeninfluegas=12%) =12×100/(21–12) =133%excessairTheoretical air required to burn 1 kg of oil = 14 kg (Typical value for all fuel oil)Totalairsupplied =Theoreticalairx(1+excessair/100)Total air supplied = 14 x 2.33 kg / kg of oil = 32.62 kg / kg of oilSensibleheatloss =m×xΔTm =Weightoffluegas =Actualmassofairsupplied/kgoffuel+ mass of fuel (1kg) =32.62+1.0=33.62kg/kgofoil. =Specificheatoffluegas =0.24kCal/kg°CΔT =TemperaturedifferenceHeatloss =m×CpxΔT =33.62x0.24x(750–40) = 5729 kCal / kg of oil%Heatlossinfluegas =5727x100/10000 =57.29%
Loss due to evaporation of moisture present in fuel
%Loss =Where,M =%Moisturein1kgoffueloil(0.15kg/kgoffueloil)Tfg = Flue Gas Temperature
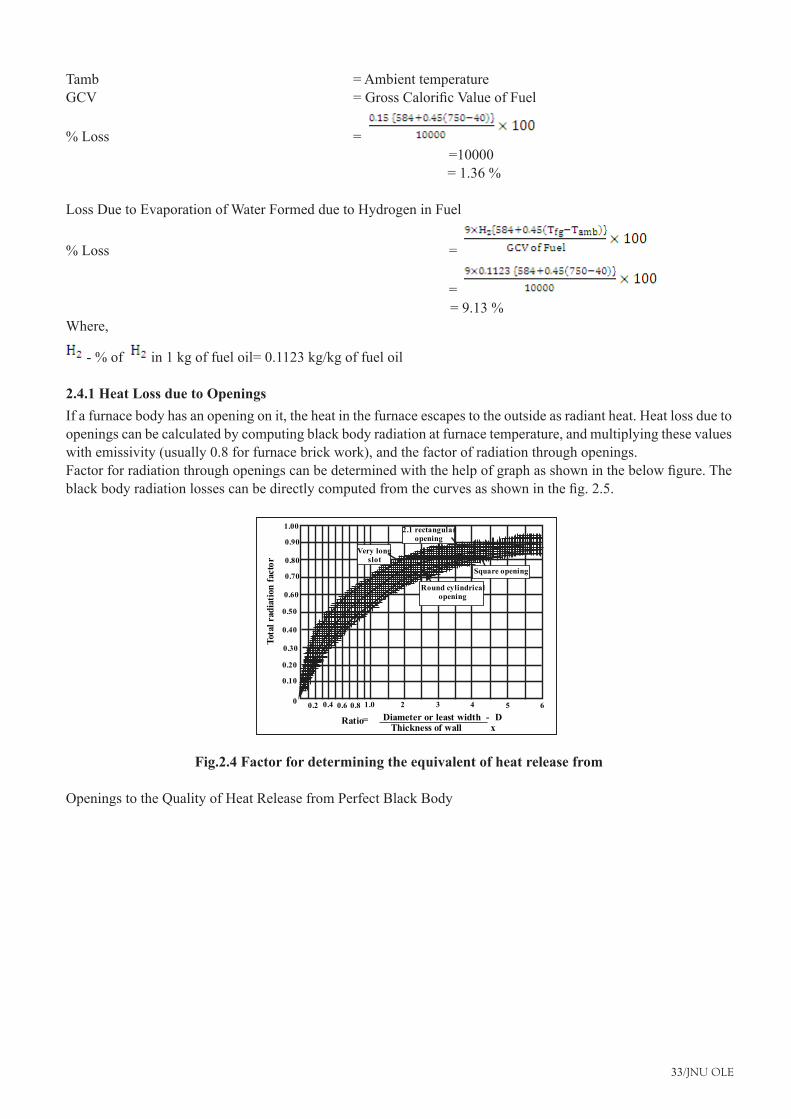
33/JNU OLE
Tamb = Ambient temperatureGCV =GrossCalorificValueofFuel
%Loss = =10000 =1.36%
Loss Due to Evaporation of Water Formed due to Hydrogen in Fuel
%Loss =
= =9.13%Where,
-%of in 1 kg of fuel oil= 0.1123 kg/kg of fuel oil
2.4.1 Heat Loss due to OpeningsIf a furnace body has an opening on it, the heat in the furnace escapes to the outside as radiant heat. Heat loss due to openings can be calculated by computing black body radiation at furnace temperature, and multiplying these values with emissivity (usually 0.8 for furnace brick work), and the factor of radiation through openings.Factorforradiationthroughopeningscanbedeterminedwiththehelpofgraphasshowninthebelowfigure.Theblackbodyradiationlossescanbedirectlycomputedfromthecurvesasshowninthefig.2.5.
Fig.2.4 Factor for determining the equivalent of heat release from
Openings to the Quality of Heat Release from Perfect Black Body
0.2 0.4 0.6 0.8 1.0 2 3 4 50
0.10
0.20
0.30
0.40
0.60
6
Thickness of wall xDiameter or least width - D=Ratio
0.50
0.70
0.80
0.90
1.00
Tota
l rad
iatio
n fa
ctor
Very long slot
2.1 rectangular opening
Round cylindrical opening
Square opening
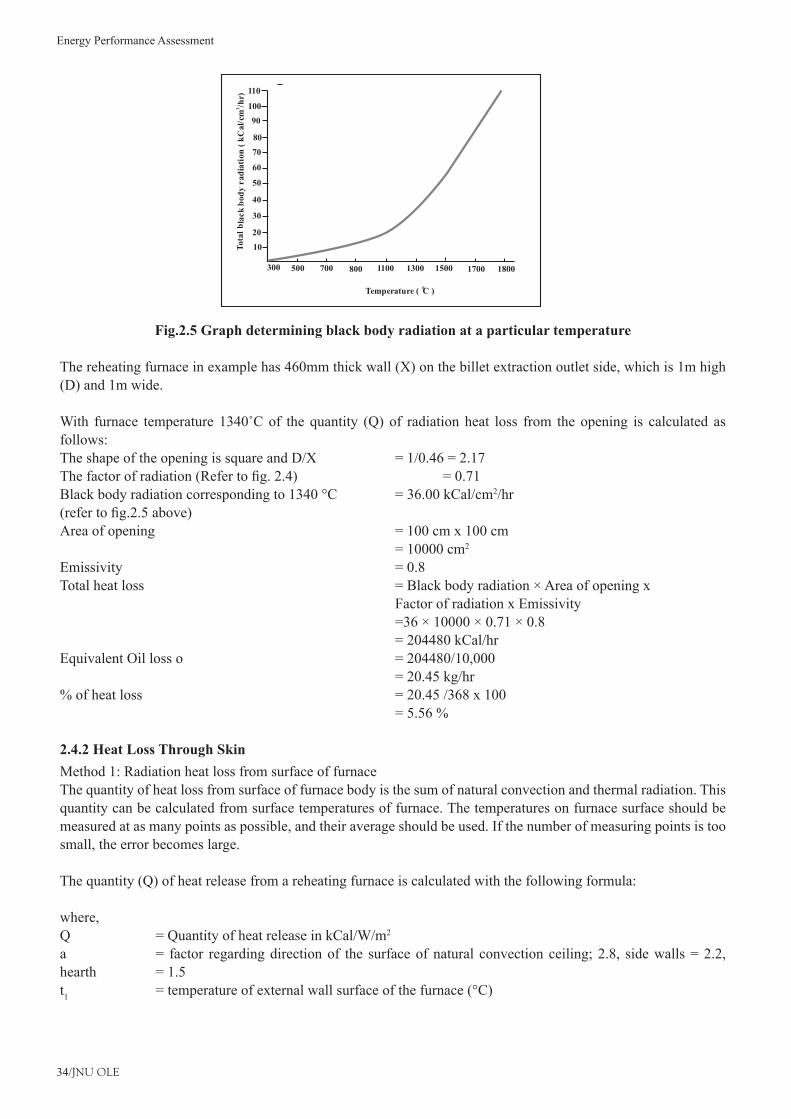
Energy Performance Assessment
34/JNU OLE
Fig.2.5 Graph determining black body radiation at a particular temperature
The reheating furnace in example has 460mm thick wall (X) on the billet extraction outlet side, which is 1m high (D) and 1m wide.
With furnace temperature 1340˚Cof the quantity (Q) of radiationheat loss from theopening is calculated asfollows:The shape of the opening is square and D/X = 1/0.46 = 2.17Thefactorofradiation(Refertofig.2.4) =0.71Blackbodyradiationcorrespondingto1340°C =36.00kCal/cm2/hr(refertofig.2.5above)Area of opening = 100 cm x 100 cm = 10000 cm2
Emissivity = 0.8Total heat loss = Black body radiation × Area of opening x Factor of radiation x Emissivity =36 × 10000 × 0.71 × 0.8 = 204480 kCal/hrEquivalent Oil loss o = 204480/10,000 = 20.45 kg/hr%ofheatloss =20.45/368x100 =5.56%
2.4.2 Heat Loss Through SkinMethod 1: Radiation heat loss from surface of furnaceThe quantity of heat loss from surface of furnace body is the sum of natural convection and thermal radiation. This quantity can be calculated from surface temperatures of furnace. The temperatures on furnace surface should be measured at as many points as possible, and their average should be used. If the number of measuring points is too small, the error becomes large.
The quantity (Q) of heat release from a reheating furnace is calculated with the following formula:
where,Q = Quantity of heat release in kCal/W/m2
a = factor regarding direction of the surface of natural convection ceiling; 2.8, side walls = 2.2, hearth = 1.5t1 =temperatureofexternalwallsurfaceofthefurnace(°C)
300 500 700 800 1100 1300 1500 1700
10
20
30
40
50
60
70
80
90
100
110
Temperature ( C ) 0
Tota
l bla
ck b
ody
radi
atio
n ( k
Cal
/cm
/hr)
2
1800
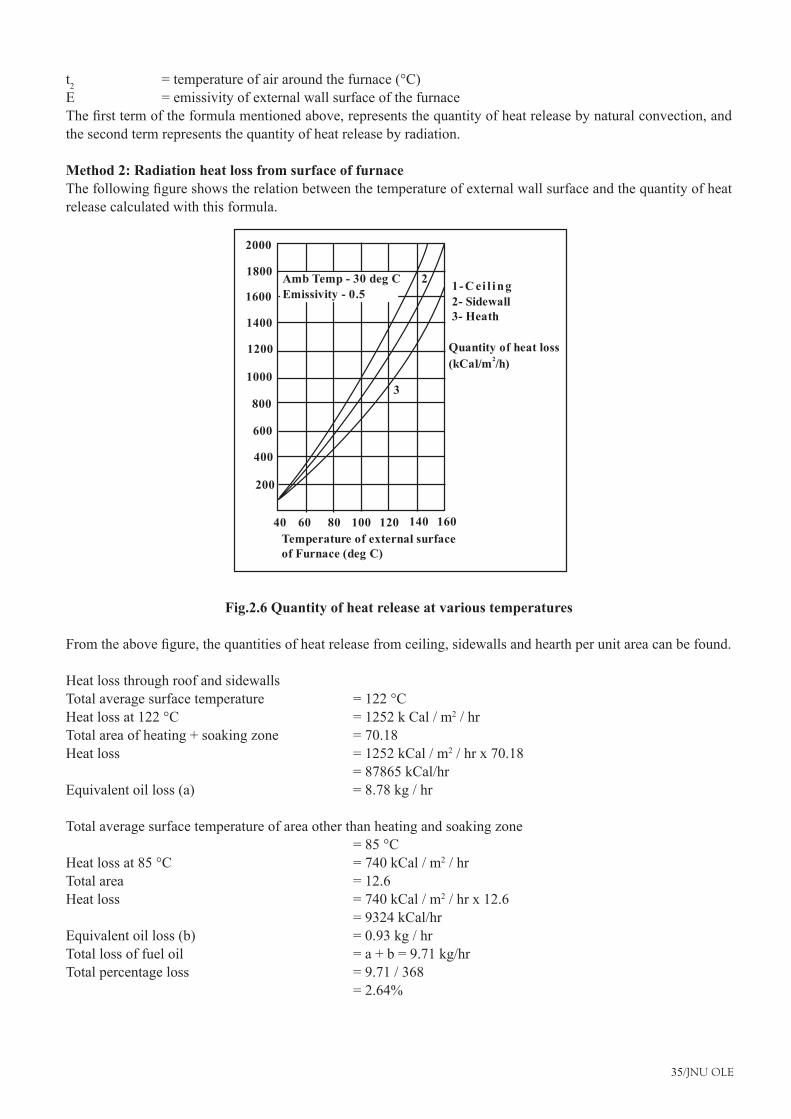
35/JNU OLE
t2 =temperatureofairaroundthefurnace(°C)E = emissivity of external wall surface of the furnaceThefirsttermoftheformulamentionedabove,representsthequantityofheatreleasebynaturalconvection,andthe second term represents the quantity of heat release by radiation.
Method 2: Radiation heat loss from surface of furnaceThefollowingfigureshowstherelationbetweenthetemperatureofexternalwallsurfaceandthequantityofheatrelease calculated with this formula.
Fig.2.6 Quantity of heat release at various temperatures
Fromtheabovefigure,thequantitiesofheatreleasefromceiling,sidewallsandhearthperunitareacanbefound.
Heat loss through roof and sidewallsTotalaveragesurfacetemperature =122°CHeatlossat122°C =1252kCal/m2 / hrTotalareaofheating+soakingzone =70.18Heat loss = 1252 kCal / m2 / hr x 70.18 = 87865 kCal/hrEquivalent oil loss (a) = 8.78 kg / hr
Total average surface temperature of area other than heating and soaking zone =85°CHeatlossat85°C =740kCal/m2 / hrTotal area = 12.6 Heat loss = 740 kCal / m2 / hr x 12.6 = 9324 kCal/hrEquivalent oil loss (b) = 0.93 kg / hrTotallossoffueloil =a+b=9.71kg/hrTotal percentage loss = 9.71 / 368 =2.64%
1- C ei l ing2- Sidewall3- Heath
2
Quantity of heat loss(kCal/m /h)2
40Temperature of external surfaceof Furnace (deg C)
60 80 100 120 140 160
3
1800
2000
1600
1400
1200
1000
800
600
400
200
Amb Temp - 30 deg CEmissivity - 0.5
Energy Performance Assessment
36/JNU OLE
2.4.3 Unaccounted LossThese losses comprise of heat storage loss, loss of furnace gases around charging door and opening, heat loss by incomplete combustion, loss of heat by conduction through hearth, loss due to formation of scales.
2.5 Furnace Efficiency (Direct Method)Fuel input = 400 litres / hr = 368 kg / hrHeat Input = 368 x 10,000 =36,80,000 kCalHeatoutput =mxCpxΔT =6000kgx0.12x(1340–40) = 936000 kCalEfficiency =936000x100/(368x10000) =25.43% =25%(app)TotalLosses =75%(app)
2.6 Furnace Efficiency (Indirect Method)Sensibleheatlossinfluegas =57.29%Lossduetoevaporationofmoistureinfuel =1.36%Loss due to evaporation of water formed from H2infuel =9.13%Heatlossduetoopenings =5.56%Heatlossthroughskin =2.64%Totallosses =75.98%FurnaceEfficiency =100–75.98 =24.02%SpecificEnergyConsumption =400litre/hour(fuelconsumption) =6Tonnes/hour(Wtofst°Ck) =66.6Litreoffuel/tonneofmaterial(st°Ck)
2.7 Factors Affecting Furnace PerformanceTheimportantfactors,whichaffecttheefficiency,arelistedbelowforcriticalanalysis.Underloadingduetopoorhearth loading and improper production scheduling the following factors affect the performance of the furnace:
improper design•useofinefficientburner•insufficientdraft/chimney•absence of waste heat recovery•absence of instruments/controls•improper operation/maintenance•high stack loss•improper insulation /refractories•
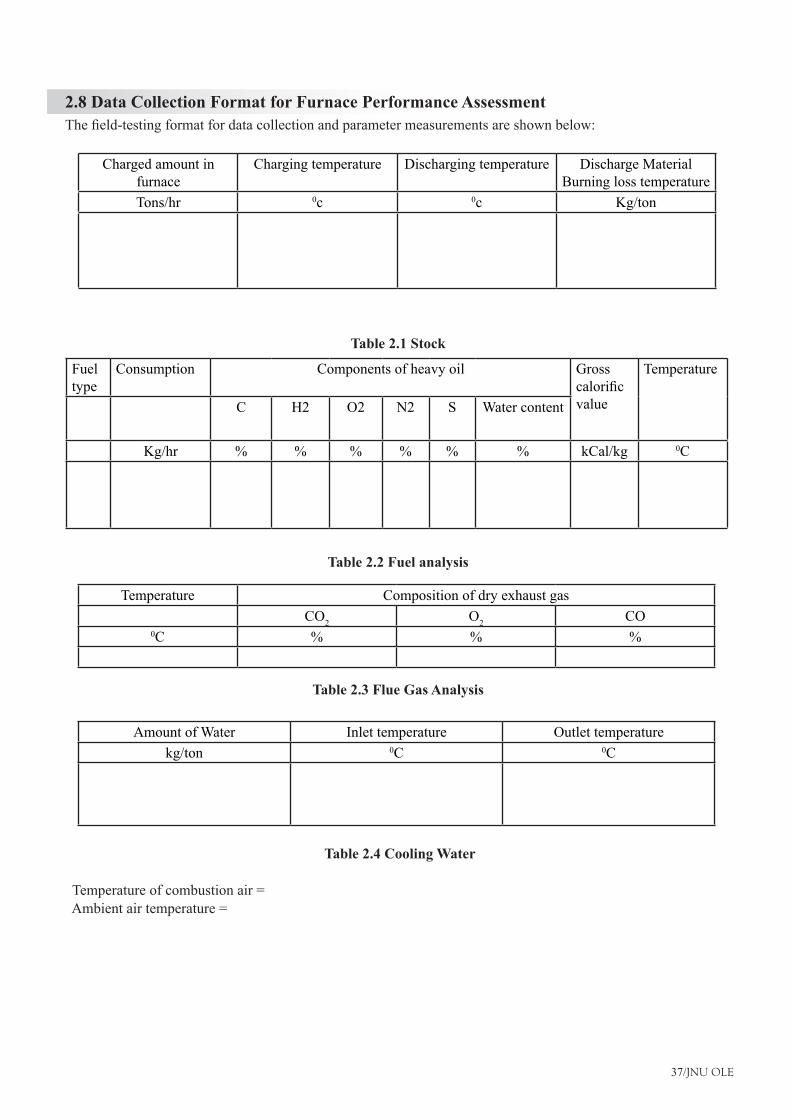
37/JNU OLE
2.8 Data Collection Format for Furnace Performance AssessmentThefield-testingformatfordatacollectionandparametermeasurementsareshownbelow:
Table 2.1 Stock
Table 2.2 Fuel analysis
Table 2.3 Flue Gas Analysis
Table 2.4 Cooling Water
Temperature of combustion air = Ambient air temperature =
Charged amount in furnace
Charging temperature Discharging temperature Discharge Material Burning loss temperature
Tons/hr 0c 0c Kg/ton
Fuel type
Consumption Components of heavy oil Gross calorificvalue
Temperature
C H2 O2 N2 S Water content
Kg/hr % % % % % % kCal/kg 0C
Temperature Composition of dry exhaust gasCO2 O2 CO
0C % % %
Amount of Water Inlet temperature Outlet temperaturekg/ton 0C 0C
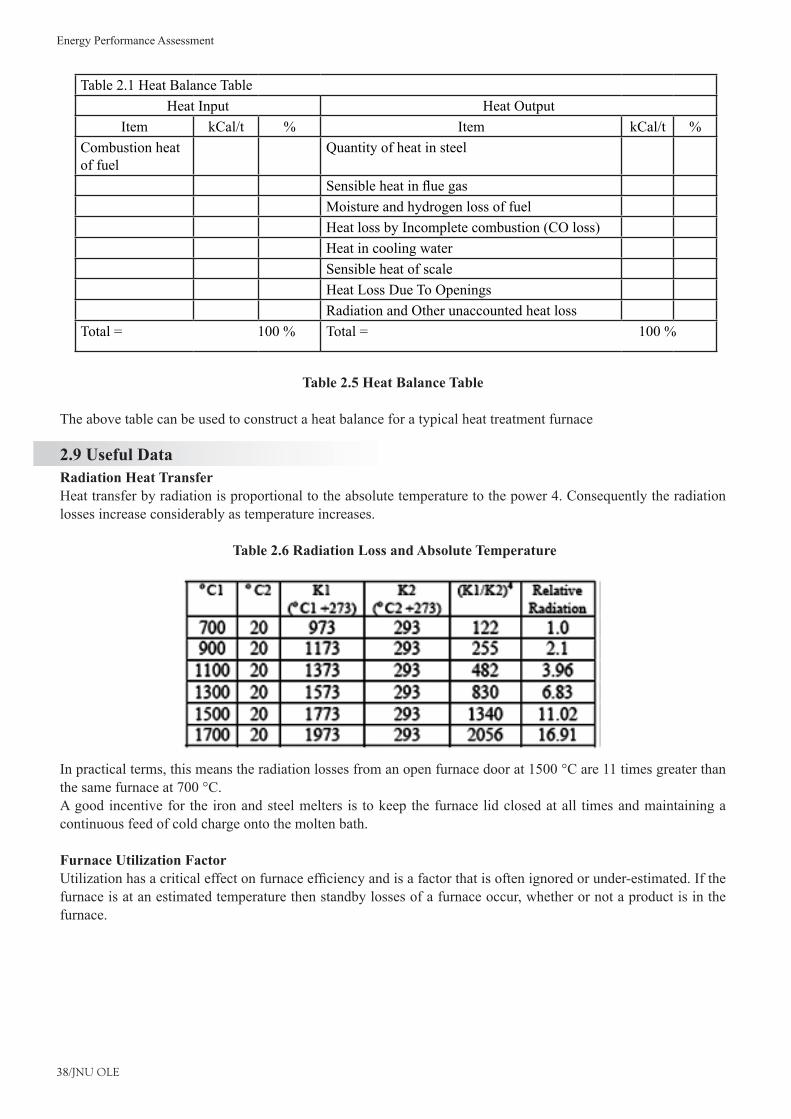
Energy Performance Assessment
38/JNU OLE
Table 2.5 Heat Balance Table
The above table can be used to construct a heat balance for a typical heat treatment furnace
2.9 Useful DataRadiation Heat TransferHeat transfer by radiation is proportional to the absolute temperature to the power 4. Consequently the radiation losses increase considerably as temperature increases.
Table 2.6 Radiation Loss and Absolute Temperature
Inpracticalterms,thismeanstheradiationlossesfromanopenfurnacedoorat1500°Care11timesgreaterthanthesamefurnaceat700°C.A good incentive for the iron and steel melters is to keep the furnace lid closed at all times and maintaining a continuous feed of cold charge onto the molten bath.
Furnace Utilization FactorUtilizationhasacriticaleffectonfurnaceefficiencyandisafactorthatisoftenignoredorunder-estimated.Ifthefurnace is at an estimated temperature then standby losses of a furnace occur, whether or not a product is in the furnace.
Table 2.1 Heat Balance TableHeat Input Heat Output
Item kCal/t % Item kCal/t %Combustion heat of fuel
Quantity of heat in steel
SensibleheatinfluegasMoisture and hydrogen loss of fuelHeat loss by Incomplete combustion (CO loss)Heat in cooling waterSensible heat of scale Heat Loss Due To OpeningsRadiation and Other unaccounted heat loss
Total=100% Total=100%
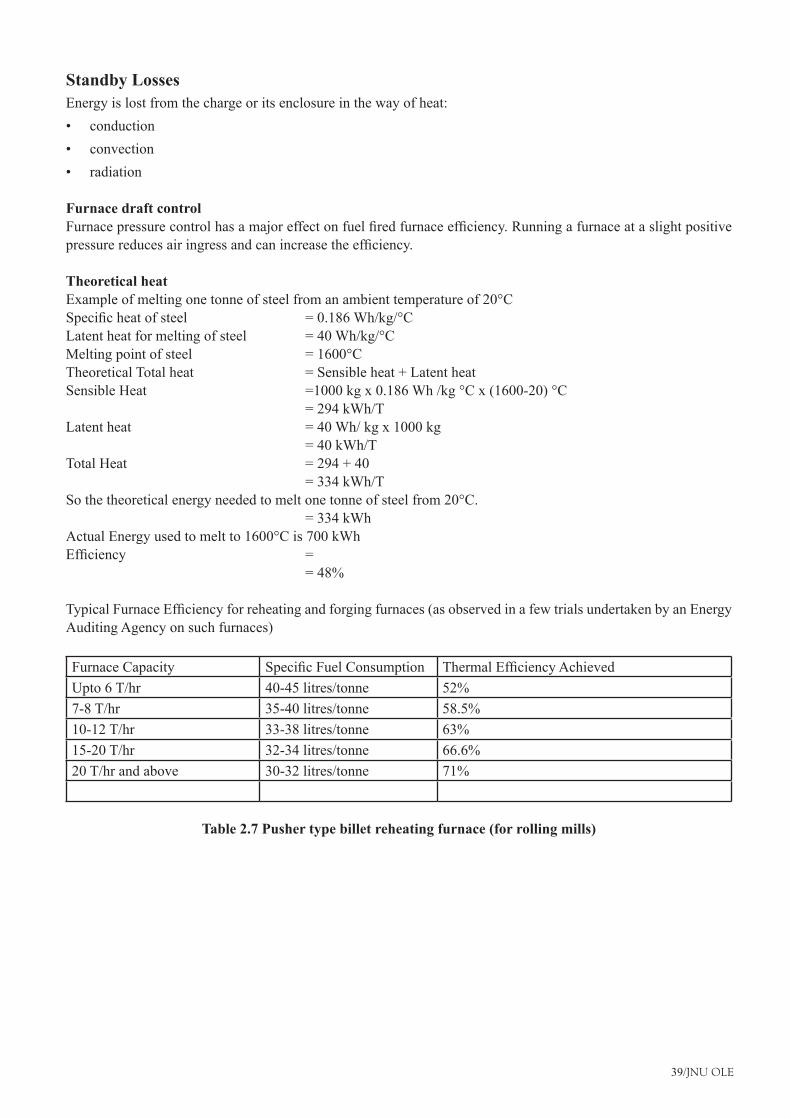
39/JNU OLE
Standby LossesEnergy is lost from the charge or its enclosure in the way of heat:
conduction•convection•radiation•
Furnace draft controlFurnacepressurecontrolhasamajoreffectonfuelfiredfurnaceefficiency.Runningafurnaceataslightpositivepressurereducesairingressandcanincreasetheefficiency.
Theoretical heatExampleofmeltingonetonneofsteelfromanambienttemperatureof20°CSpecificheatofsteel =0.186Wh/kg/°CLatentheatformeltingofsteel =40Wh/kg/°CMeltingpointofsteel =1600°CTheoreticalTotalheat =Sensibleheat+LatentheatSensibleHeat =1000kgx0.186Wh/kg°Cx(1600-20)°C = 294 kWh/TLatent heat = 40 Wh/ kg x 1000 kg = 40 kWh/TTotalHeat =294+40 = 334 kWh/TSothetheoreticalenergyneededtomeltonetonneofsteelfrom20°C. = 334 kWhActualEnergyusedtomeltto1600°Cis700kWhEfficiency = =48%
TypicalFurnaceEfficiencyforreheatingandforgingfurnaces(asobservedinafewtrialsundertakenbyanEnergyAuditing Agency on such furnaces)
Furnace Capacity SpecificFuelConsumption ThermalEfficiencyAchievedUpto 6 T/hr 40-45 litres/tonne 52%7-8 T/hr 35-40 litres/tonne 58.5%10-12 T/hr 33-38 litres/tonne 63%15-20 T/hr 32-34 litres/tonne 66.6%20 T/hr and above 30-32 litres/tonne 71%
Table 2.7 Pusher type billet reheating furnace (for rolling mills)

Energy Performance Assessment
40/JNU OLE
Furnace Capacity Specific Fuel Consumption Thermal Efficiency Achieved500-600 kg/hr 80-90 litres/tonne 26%1.0 T/hr 70-75 litres/tonne 30%1.5-2.0 T/hr 65-70 litres/tonne 32.5%2.5-3.0 T/hr 55-60 litres/tonne 38%
Table 2.8 Pusher type forging furnaceThefiguresshowingfuelconsumptionwerevalidonlywhenthefurnacesareexpectedtooperateattheirratedcapacities.
Note: Thesearethetrailfiguresandcannotbepresumedasthestandardsforthefurnacesinquestion.

41/JNU OLE
SummaryEfficiencyoffurnacesvariesoverawiderange,dependinguponthetypeoffurnace,thetemperaturetowhich•the material is heated in the furnace, type of energy source, etc.Fuelfiredfurnacesfollowingheatlossesassociatedwiththem.•FurnaceefficiencycanbeevaluatedbytheDirectandIndirectmethodsasinthecaseofboilers.•Heat losses due to various causes including those from openings in the indirect method while the total heat input •andtheheatoutput(heatinthestock)areevaluatedfortheindirectmethodofefficiencyevaluation.Several measurements are involved in the indirect method while very few measurements are involved in the •directmethodoffurnaceefficiencytesting.Typicalparametersrequiredtobemeasuredforenergybalanceinoilfiredfurnace.•The formats for data collection are also given in this chapter.•
Recommended ReadingRoger Vizi (1999), • Forced Hot Air Furnaces: Troubleshooting and Repair, McGraw-Hill Professional. P344.James E. Brumbaugh(2004), • Audel HVAC Fundamentals, Heating Systems, Furnaces and Boilers, 4 edition, Audel, p720.

Energy Performance Assessment
42/JNU OLE
Self Assessment
Furnaceefficiencyiscalculatedafter____________sensibleheatlossinfluegas,lossduetomoistureinflue1. gas, heat loss due to openings in furnace, heat loss through furnace skin and other unaccounted losses from the input to the furnace.
subtractinga. addingb. multiplyingc. dividingd.
Furnace______________ can be evaluated by the direct and indirect methods as in the case of boilers.2. efficiencya. workingb. conditionc. temperatured.
Furnaceisbydefinitionadevicefor_____________materialsandthereforeauserofenergy.3. meltinga. coolingb. heatingc. boilingd.
If a furnace body has an opening on it, the __________in the furnace escapes to the outside as radiant heat.4. pressurea. fluidb. gasc. heatd.
Heat transfer by radiation is proportional to the absolute temperature to the power _____5. 2a. 4b. 5c. 7d.
Which of the following is true?6. Furnacepressurecontrolhasamajoreffectonfuelfiredfurnacefluid.a. Furnacepressurecontrolhasamajoreffectonfuelfiredfurnaceheat.b. Furnacepressurecontrolhasamajoreffectonfuelfiredfurnaceefficiency.c. Furnacepressurecontrolhasamajoreffectonfuelfiredfurnacegas.d.

43/JNU OLE
Which of the following is true?7. A good incentive for the iron and steel melters is to keep the furnace lid closed at all times and maintaining a. a continuous feed of cold charge onto the molten bath.A good incentive for the iron and steel heaters is to keep the furnace lid closed at all times and maintaining b. a continuous feed of cold charge onto the molten bath.A good incentive for the iron and steel coolers is to keep the furnace lid closed at all times and maintaining c. a continuous feed of cold charge onto the molten bath.A good incentive for the iron and steel boilers is to keep the furnace lid closed at all times and maintaining d. a continuous feed of cold charge onto the molten bath.
Which of the following is true?8. The quantity of heat loss from surface of furnace body is the product of natural convection and thermal a. radiation.The quantity of heat loss from surface of furnace body is the difference of natural convection and thermal b. radiation.The quantity of heat loss from surface of furnace body is the sum of natural convection and thermal c. radiation.The quantity of heat loss from surface of furnace body is the ratio of natural convection and thermal d. radiation.
Which of the following is true?9. Heatbalancehelpsustonumericallyunderstandthepresenttemperaturegainandefficiencyandimprovea. the furnace operation using these data.Heatbalancehelpsustonumericallyunderstandthepresenttemperaturegainandefficiencyandimproveb. the furnace operation using these data.Heatbalancehelpsustonumericallyunderstandthepresentheatgainandefficiencyandimprovethefurnacec. operation using these data.Heatbalancehelpsustonumericallyunderstandthepresentheatlossandefficiencyandimprovethefurnaced. operation using these data.
Which of the following is true?10. Furnaceefficiencycanbeevaluatedbythedirectandindirectmethodsasinthecaseofsolarheaters.a. Furnaceefficiencycanbeevaluatedbythedirectandindirectmethodsasinthecaseofheaters.b. Furnaceefficiencycanbeevaluatedbythedirectandindirectmethodsasinthecaseofcoolers.c. Furnaceefficiencycanbeevaluatedbythedirectandindirectmethodsasinthecaseofboilers.d.
Energy Performance Assessment
44/JNU OLE
Chapter III
Energy Performance Assessment of Cogeneration Systems with Steam and GasTurbines
AimThe aim of this chapter is to:
understandcogenerationperformancetermsanddefinitions•identifywaystofindturbinecylinderefficiency•recognize the purpose of the Performance Test•observefieldtestingprocedure•estimate the overall plant heat rate•
ObjectivesThe objective of this chapter is to:
analyzewaystofindturbinecylinderefficiency•identify the purpose of the Performance Test•studyfieldtestingprocedure•
Learning outcomeAt the end of this chapter students will be able to:
describewaystofindturbinecylinderefficiency•distinguish the purpose of the Performance Test•interpretfieldtestingprocedure•detect the overall plant heat rate•
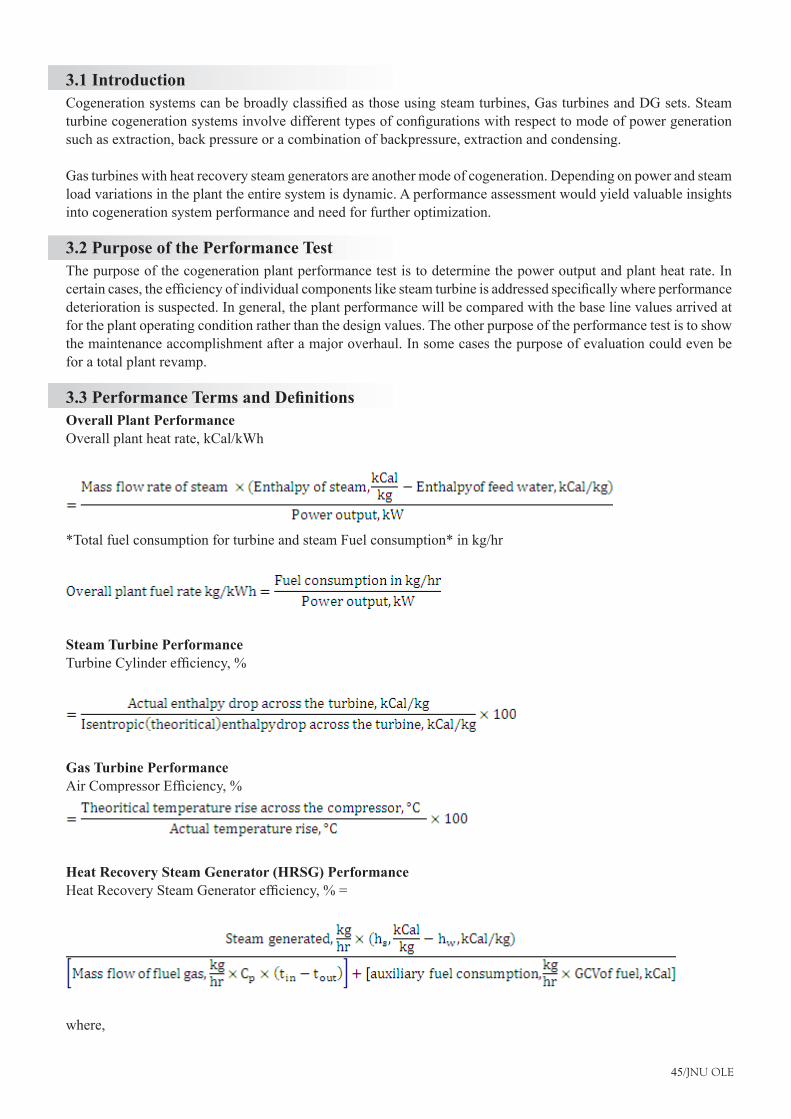
45/JNU OLE
3.1 IntroductionCogenerationsystemscanbebroadlyclassifiedasthoseusingsteamturbines,GasturbinesandDGsets.Steamturbinecogenerationsystemsinvolvedifferenttypesofconfigurationswithrespecttomodeofpowergenerationsuch as extraction, back pressure or a combination of backpressure, extraction and condensing.
Gas turbines with heat recovery steam generators are another mode of cogeneration. Depending on power and steam load variations in the plant the entire system is dynamic. A performance assessment would yield valuable insights into cogeneration system performance and need for further optimization.
3.2 Purpose of the Performance TestThe purpose of the cogeneration plant performance test is to determine the power output and plant heat rate. In certaincases,theefficiencyofindividualcomponentslikesteamturbineisaddressedspecificallywhereperformancedeterioration is suspected. In general, the plant performance will be compared with the base line values arrived at for the plant operating condition rather than the design values. The other purpose of the performance test is to show the maintenance accomplishment after a major overhaul. In some cases the purpose of evaluation could even be for a total plant revamp.
3.3 Performance Terms and DefinitionsOverall Plant PerformanceOverall plant heat rate, kCal/kWh
*Total fuel consumption for turbine and steam Fuel consumption* in kg/hr
Steam Turbine PerformanceTurbineCylinderefficiency,%
Gas Turbine PerformanceAirCompressorEfficiency,%
Heat Recovery Steam Generator (HRSG) PerformanceHeatRecoverySteamGeneratorefficiency,%=
where,
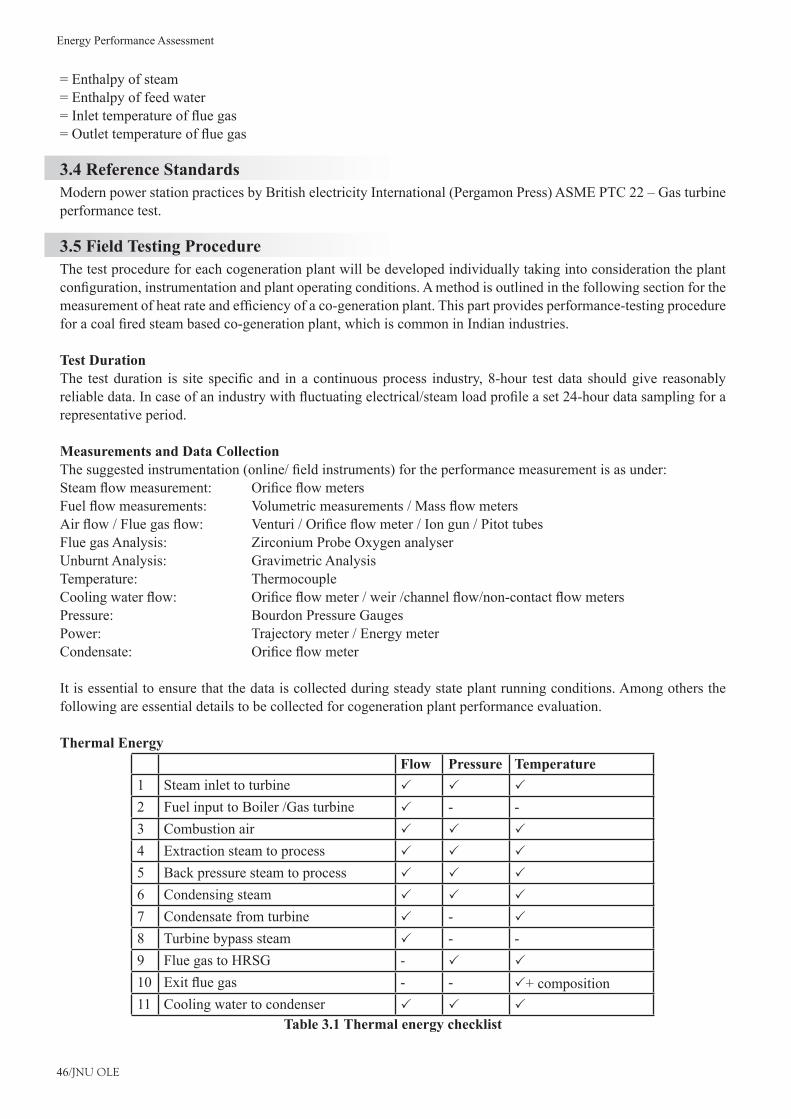
Energy Performance Assessment
46/JNU OLE
= Enthalpy of steam= Enthalpy of feed water=Inlettemperatureoffluegas=Outlettemperatureoffluegas
3.4 Reference StandardsModernpowerstationpracticesbyBritishelectricityInternational(PergamonPress)ASMEPTC22–Gasturbineperformance test.
3.5 Field Testing ProcedureThe test procedure for each cogeneration plant will be developed individually taking into consideration the plant configuration,instrumentationandplantoperatingconditions.Amethodisoutlinedinthefollowingsectionforthemeasurementofheatrateandefficiencyofaco-generationplant.Thispartprovidesperformance-testingprocedureforacoalfiredsteambasedco-generationplant,whichiscommoninIndianindustries.
Test DurationThe testduration is site specificand inacontinuousprocess industry,8-hour testdata shouldgive reasonablyreliabledata.Incaseofanindustrywithfluctuatingelectrical/steamloadprofileaset24-hourdatasamplingforarepresentative period.
Measurements and Data CollectionThesuggestedinstrumentation(online/fieldinstruments)fortheperformancemeasurementisasunder:Steamflowmeasurement: OrificeflowmetersFuelflowmeasurements: Volumetricmeasurements/MassflowmetersAirflow/Fluegasflow: Venturi/Orificeflowmeter/Iongun/PitottubesFlue gas Analysis: Zirconium Probe Oxygen analyserUnburnt Analysis: Gravimetric AnalysisTemperature: ThermocoupleCoolingwaterflow: Orificeflowmeter/weir/channelflow/non-contactflowmetersPressure: Bourdon Pressure GaugesPower: Trajectory meter / Energy meterCondensate: Orificeflowmeter
It is essential to ensure that the data is collected during steady state plant running conditions. Among others the following are essential details to be collected for cogeneration plant performance evaluation.
Thermal EnergyFlow Pressure Temperature
1 Steam inlet to turbine
2 Fuel input to Boiler /Gas turbine - -3 Combustion air
4 Extraction steam to process
5 Back pressure steam to process
6 Condensing steam
7 Condensate from turbine -
8 Turbine bypass steam - -9 Flue gas to HRSG -
10 Exitfluegas - - +composition11 Cooling water to condenser
Table 3.1 Thermal energy checklist
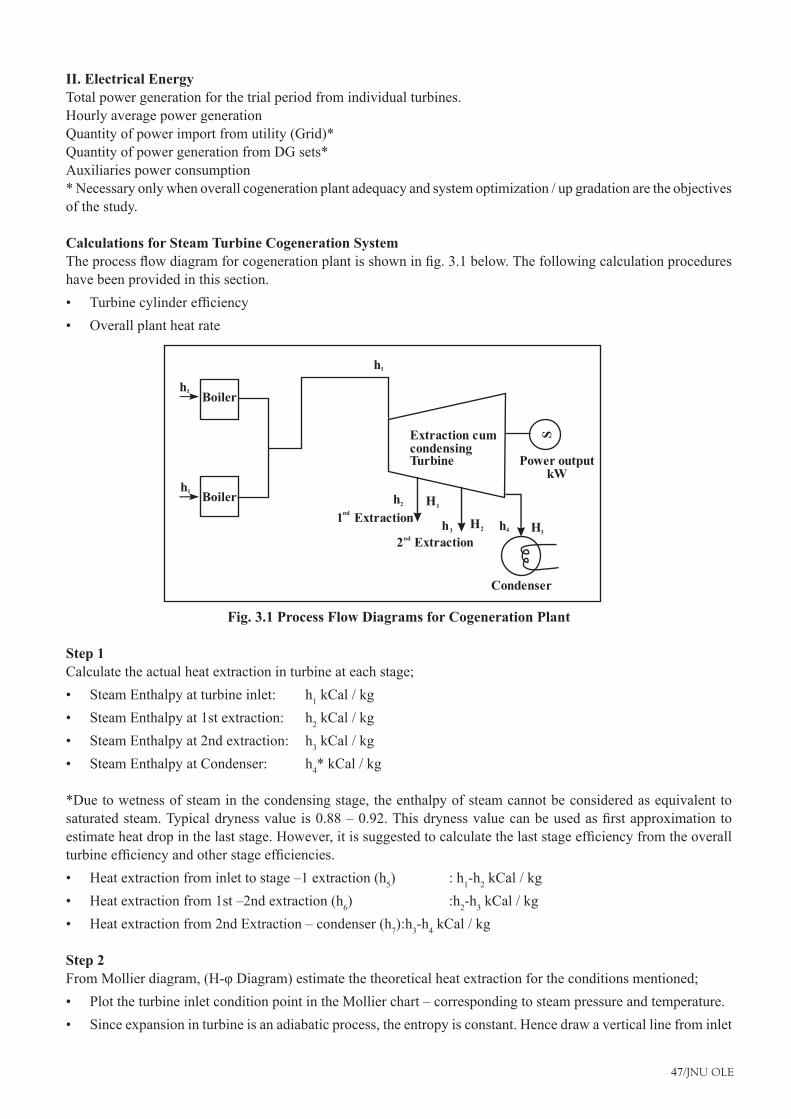
47/JNU OLE
II. Electrical EnergyTotal power generation for the trial period from individual turbines.Hourly average power generationQuantity of power import from utility (Grid)*Quantity of power generation from DG sets*Auxiliaries power consumption* Necessary only when overall cogeneration plant adequacy and system optimization / up gradation are the objectives of the study.
Calculations for Steam Turbine Cogeneration SystemTheprocessflowdiagramforcogenerationplantisshowninfig.3.1below.Thefollowingcalculationprocedureshave been provided in this section.
Turbinecylinderefficiency•Overall plant heat rate•
Fig. 3.1 Process Flow Diagrams for Cogeneration Plant
Step 1Calculate the actual heat extraction in turbine at each stage;
Steam Enthalpy at turbine inlet: h• 1 kCal / kgSteam Enthalpy at 1st extraction: h• 2 kCal / kgSteam Enthalpy at 2nd extraction: h• 3 kCal / kgSteam Enthalpy at Condenser: h• 4* kCal / kg
*Due to wetness of steam in the condensing stage, the enthalpy of steam cannot be considered as equivalent to saturatedsteam.Typicaldrynessvalueis0.88–0.92.Thisdrynessvaluecanbeusedasfirstapproximationtoestimateheatdropinthelaststage.However,itissuggestedtocalculatethelaststageefficiencyfromtheoverallturbineefficiencyandotherstageefficiencies.
Heatextractionfrominlettostage–1extraction(h• 5) : h1-h2 kCal / kg Heatextractionfrom1st–2ndextraction(h• 6) :h2-h3 kCal / kgHeatextractionfrom2ndExtraction–condenser(h• 7) :h3-h4 kCal / kg
Step 2FromMollierdiagram,(H-φDiagram)estimatethetheoreticalheatextractionfortheconditionsmentioned;
PlottheturbineinletconditionpointintheMollierchart–correspondingtosteampressureandtemperature.•Since expansion in turbine is an adiabatic process, the entropy is constant. Hence draw a vertical line from inlet •
Extraction cumcondensingTurbine Power output
kW
2 Extractionnd
1 Extractionnd
h4 H3H2
H1
h3
h2
S
h1
h1 Boiler
Boilerh1
Condenser
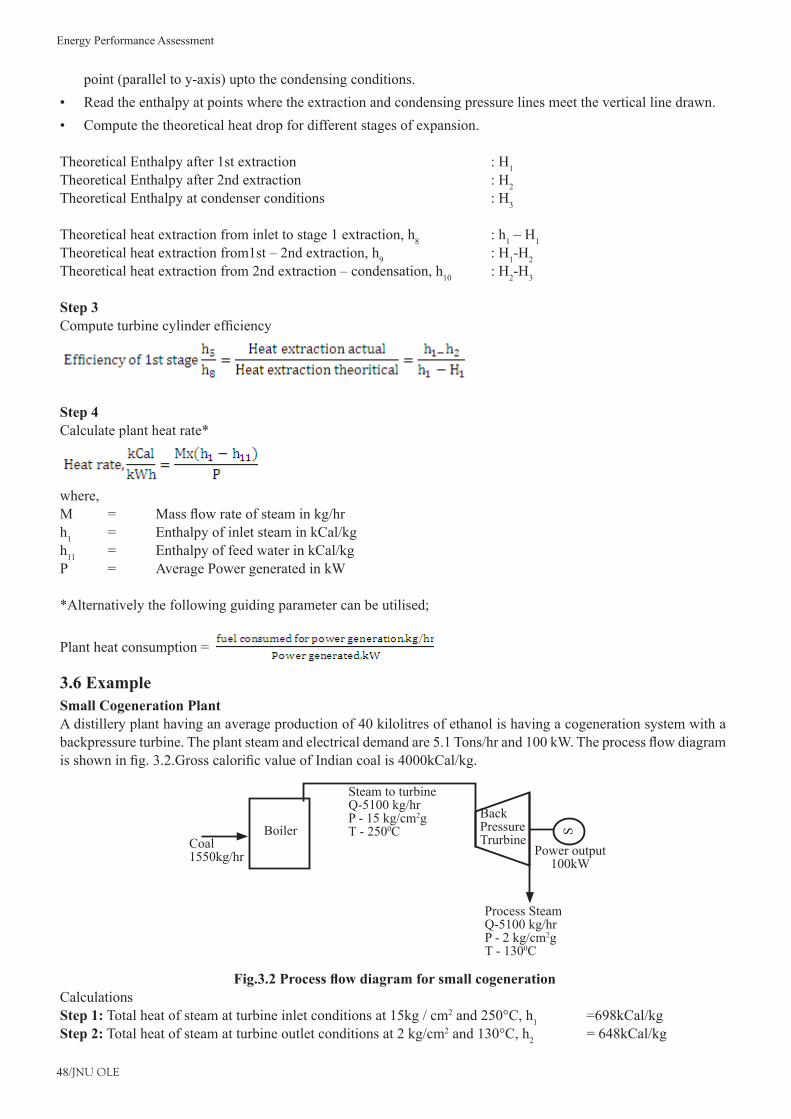
Energy Performance Assessment
48/JNU OLE
point (parallel to y-axis) upto the condensing conditions.Read the enthalpy at points where the extraction and condensing pressure lines meet the vertical line drawn.•Compute the theoretical heat drop for different stages of expansion.•
Theoretical Enthalpy after 1st extraction : H1Theoretical Enthalpy after 2nd extraction : H2Theoretical Enthalpy at condenser conditions : H3
Theoretical heat extraction from inlet to stage 1 extraction, h8 : h1–H1Theoreticalheatextractionfrom1st–2ndextraction,h9 : H1-H2Theoreticalheatextractionfrom2ndextraction–condensation,h10 : H2-H3
Step 3Computeturbinecylinderefficiency
Step 4Calculate plant heat rate*
where,M = Massflowrateofsteaminkg/hrh1 = Enthalpy of inlet steam in kCal/kgh11 = Enthalpy of feed water in kCal/kgP = Average Power generated in kW
*Alternatively the following guiding parameter can be utilised;
Plant heat consumption =
3.6 ExampleSmall Cogeneration PlantA distillery plant having an average production of 40 kilolitres of ethanol is having a cogeneration system with a backpressureturbine.Theplantsteamandelectricaldemandare5.1Tons/hrand100kW.Theprocessflowdiagramisshowninfig.3.2.GrosscalorificvalueofIndiancoalis4000kCal/kg.
Fig.3.2 Process flow diagram for small cogeneration CalculationsStep 1: Total heat of steam at turbine inlet conditions at 15kg / cm2and250°C,h1 =698kCal/kgStep 2: Total heat of steam at turbine outlet conditions at 2 kg/cm2and130°C,h2 = 648kCal/kg
Coal1550kg/hr
Steam to turbineQ-5100 kg/hrP - 15 kg/cm2gT - 2500C
Process SteamQ-5100 kg/hrP - 2 kg/cm2gT - 1300C
BackPressureTrurbine
Power output100kW
SBoiler
49/JNU OLE
Step 3: Heat energy input to turbine per kg of inlet steam, (h1- h2) = (698-648) = 50kCal/kg
Step 4:Totalsteamflowrate,Q1 =5100kg/hrPower generation = 100 kWEquivalent thermal energy = 100 x 860 = 86,000 kCal /hrStep 5: Energy input to the turbine = 5100 x 50 = 2, 55,000 kCal/hr.Step 6:
=34%
Step 7:Efficiencyoftheturboalternator =34%EfficiencyofAlternator =92%Efficiencyofgeartransmission =98%
=0.38Step 8:Quantity of steam bypassing the turbine = Nil
Step 9:Coal consumption of the boiler = 1550 kg/hr.
Step 10:Overall plant heat rate, kCal/kWh, is calculated;
=34068 kCal/kWh**Note: The plant heat rate is in the order of 34000 kCal/kWh because of the use of backpressure turbine. This value will be around 3000 kcal/kWh while operating on fully condensing mode. However with backpressure turbine, the energy in the steam is not wasted, as it is utilised in the process.
Overall plant fuel rate including boiler = 1550/100 = 15.5 kg coal / kW

Energy Performance Assessment
50/JNU OLE
Analysis of resultsTheefficiencyoftheturbinegeneratorsetisaspermanufacturerdesignspecification.Thereisnosteambypassindicating that the power generation potential of process steam is fully utilized. At present the power generation from the process steam completely meets the process electrical demand or in other words, the system is balanced.Remarks: Similar steps can be followed for the evaluation of performance of gas turbine based cogeneration system.

51/JNU OLE
SummarySteam turbines, gas turbines and DG sets provide good opportunities for incorporating the cogeneration •system.Performanceassessmentofthecogenerationsystemrevealstheheatrateoftheplant,andalsoefficiencyofthe•individual components with the base line data. Various parameters to be measured and the instruments required for the same are given.•The cogeneration plant performance test is to determine the power output and plant heat rate.•The performance test is to show the maintenance accomplishment after a major overhaul.•The test procedure for each cogeneration plant will be developed individually taking into consideration the plant •configuration,instrumentationandplantoperatingconditions.Theefficiencyoftheturbinegeneratorsetisaspermanufacturerdesignspecification.Thereisnosteambypass•indicating that the power generation potential of process steam is fully utilized.
Recommended ReadingRolf Kehlohofer, Frank Hannemann, Franz Stirnimann(2009), • Energy performance assessment of cogeneration systems with steam and gas turbines, PennWell Corp, p 430.Philip Kiameh, • Power Generation Handbook : Selection, Applications, Operation, Maintenance, McGraw-Hill Professional, 1edition, p 560.Meherwan P Boyce(2006), • Power Generation Handbook : Selection, Applications, Operation, Maintenance, Gulf Professional Publishing; 3 edition, p 962.

Energy Performance Assessment
52/JNU OLE
Self Assessment
The cogeneration plant performance test is to determine the power output and plant ___________ rate.1. heata. energyb. temperaturec. steamd.
The __________________ is to show the maintenance accomplishment after a major overhaul.2. performance testa. presentation testb. routine testc. periodical testd.
The ______________ for each cogeneration plant will be developed individually taking into consideration the 3. plantconfiguration,instrumentationandplantoperatingconditions.
test procedurea. test methodologyb. test requisitesc. test provisionsd.
Theefficiencyoftheturbinegeneratorsetisaspermanufacturerdesign______________.4. specificationa. requisitesb. conditionc. plansd.
There is no steam bypass indicating that the power generation potential of process ___________is fully 5. utilized.
aira. heatb. temperaturec. steamd.
Total heat of steam at turbine inlet conditions at 15kg / cm6. 2and250°C,h1 =________688kCal/kga. 698kCal/kgb. 678kCal/kgc. 638kCal/kg\d.
B]TrueorFalseWhich of the following is True?7.
Cogenerationimprovesviabilityandprofitabilityofmanufacturingindustries.a. Cogeneration degrades losses of sugar industries. b. Cogenerationdegradesviabilityandprofitabilityofsugarindustries.c. Cogenerationimprovesviabilityandprofitabilityofsugarindustries.d.

53/JNU OLE
Which of the following is True?8. There is no steam bypass indicating that the power generation potential of process heat is fully utilized.a. There is no steam bypass indicating that the power generation potential of process air is fully utilized.b. There is no steam bypass indicating that the power generation potential of process temperature is fully c. utilized.There is no steam bypass indicating that the power generation potential of process steam is fully utilized.d.
Which of the following is True?9. The cogeneration plant performance test is to determine the power output and plant heat rate.a. The cogeneration plant performance test is to determine the power output and plant temperature rate.b. The cogeneration plant performance test is to determine the power output and plant energy rate.c. The cogeneration plant performance test is to determine the power output and plant steam rate.d.
Which of the following is True?10. Theefficiencyoftheturbinegeneratorsetisaspermanufacturerdesignspecifications.a. Theefficiencyoftheturbinegeneratorsetisaspermanufacturerdesignrequisites.b. Theefficiencyoftheturbinegeneratorsetisaspermanufacturerdesignconditions.c. Theefficiencyoftheturbinegeneratorsetisaspermanufacturerdesignplans.d.

Energy Performance Assessment
54/JNU OLE
Chapter IV
Energy Performance Assessment of Heat Exchangers
AimThe aim of this chapter is to:
understand terminology of heat exchangers and their performance•analyzeperformancetermsanddefinitionsofheatexchangers•identify methodology of Heat Exchanger Performance Assessment•determinationofheattransfercoefficientforLiquid-LiquidHeatexchangers,Surfacecondensersvaporisers•and Air Heaters
ObjectivesThe objectives of this chapter are to:
acquireperformancetermsanddefinitionsofheatexchangers•understand methodology of Heat Exchanger Performance Assessment•observe determination of heat transfer coefficient forLiquid-LiquidHeat exchangersSurface condensers•vaporisers and Air Heaters
Learning outcomeAt the end of this chapter students will be able to:
identify terminology of heat exchangers and their performance•classifyperformancetermsanddefinitionsofheatexchangers•specify methodology of Heat Exchanger Performance Assessment•
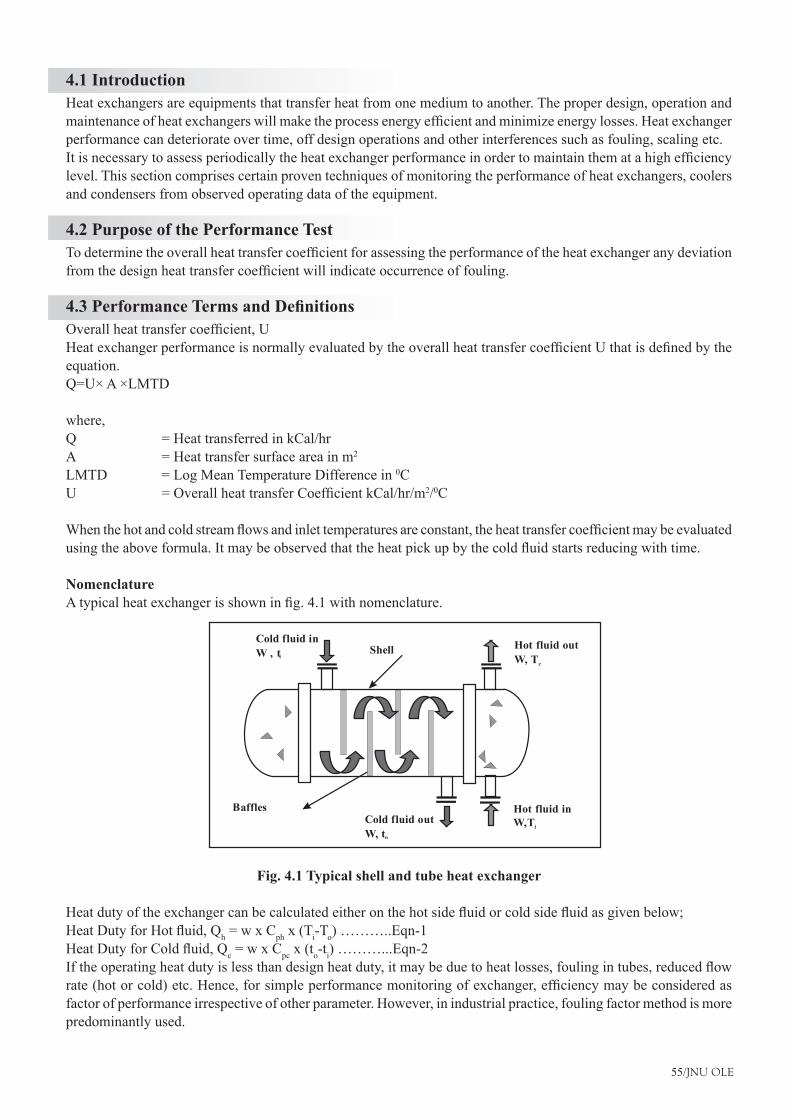
55/JNU OLE
4.1 IntroductionHeat exchangers are equipments that transfer heat from one medium to another. The proper design, operation and maintenanceofheatexchangerswillmaketheprocessenergyefficientandminimizeenergylosses.Heatexchangerperformance can deteriorate over time, off design operations and other interferences such as fouling, scaling etc.Itisnecessarytoassessperiodicallytheheatexchangerperformanceinordertomaintainthematahighefficiencylevel. This section comprises certain proven techniques of monitoring the performance of heat exchangers, coolers and condensers from observed operating data of the equipment.
4.2 Purpose of the Performance TestTodeterminetheoverallheattransfercoefficientforassessingtheperformanceoftheheatexchangeranydeviationfromthedesignheattransfercoefficientwillindicateoccurrenceoffouling.
4.3 Performance Terms and DefinitionsOverallheattransfercoefficient,UHeatexchangerperformanceisnormallyevaluatedbytheoverallheattransfercoefficientUthatisdefinedbytheequation.Q=U× A ×LMTD
where,Q = Heat transferred in kCal/hrA = Heat transfer surface area in m2
LMTD = Log Mean Temperature Difference in 0CU =OverallheattransferCoefficientkCal/hr/m2/0C
Whenthehotandcoldstreamflowsandinlettemperaturesareconstant,theheattransfercoefficientmaybeevaluatedusingtheaboveformula.Itmaybeobservedthattheheatpickupbythecoldfluidstartsreducingwithtime.
NomenclatureAtypicalheatexchangerisshowninfig.4.1withnomenclature.
Fig. 4.1 Typical shell and tube heat exchanger
Heatdutyoftheexchangercanbecalculatedeitheronthehotsidefluidorcoldsidefluidasgivenbelow;HeatDutyforHotfluid,Qh = w x Cph x (Ti-To) ………..Eqn-1HeatDutyforColdfluid,Qc = w x Cpc x (to-ti) ………...Eqn-2Iftheoperatingheatdutyislessthandesignheatduty,itmaybeduetoheatlosses,foulingintubes,reducedflowrate(hotorcold)etc.Hence,forsimpleperformancemonitoringofexchanger,efficiencymaybeconsideredasfactor of performance irrespective of other parameter. However, in industrial practice, fouling factor method is more predominantly used.
Cold fluid outW, to
Baffles Hot fluid in W,Ti
Hot fluid outW, Tc
ShellCold fluid in W , ti
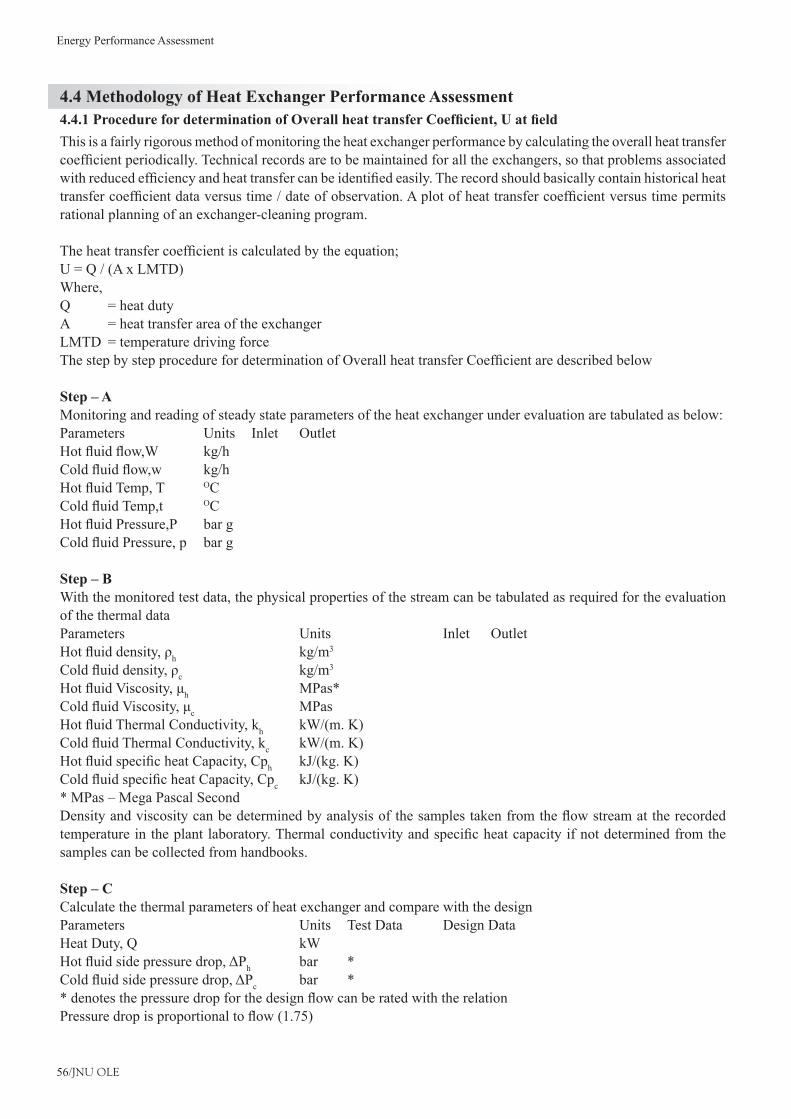
Energy Performance Assessment
56/JNU OLE
4.4 Methodology of Heat Exchanger Performance Assessment4.4.1 Procedure for determination of Overall heat transfer Coefficient, U at fieldThis is a fairly rigorous method of monitoring the heat exchanger performance by calculating the overall heat transfer coefficientperiodically.Technicalrecordsaretobemaintainedforalltheexchangers,sothatproblemsassociatedwithreducedefficiencyandheattransfercanbeidentifiedeasily.Therecordshouldbasicallycontainhistoricalheattransfercoefficientdataversustime/dateofobservation.Aplotofheattransfercoefficientversustimepermitsrational planning of an exchanger-cleaning program.
Theheattransfercoefficientiscalculatedbytheequation;U = Q / (A x LMTD)Where,Q = heat dutyA = heat transfer area of the exchangerLMTD = temperature driving forceThestepbystepprocedurefordeterminationofOverallheattransferCoefficientaredescribedbelow
Step – AMonitoring and reading of steady state parameters of the heat exchanger under evaluation are tabulated as below:Parameters Units Inlet OutletHotfluidflow,W kg/h Coldfluidflow,w kg/h HotfluidTemp,T OC ColdfluidTemp,t OC HotfluidPressure,P barg ColdfluidPressure,p barg
Step – BWith the monitored test data, the physical properties of the stream can be tabulated as required for the evaluation of the thermal data Parameters Units Inlet OutletHotfluiddensity,ρh kg/m3 Coldfluiddensity,ρc kg/m3 HotfluidViscosity,μh MPas* ColdfluidViscosity,μc MPas HotfluidThermalConductivity,kh kW/(m. K) ColdfluidThermalConductivity,kc kW/(m. K) HotfluidspecificheatCapacity,Cph kJ/(kg. K) ColdfluidspecificheatCapacity,Cpc kJ/(kg. K) *MPas–MegaPascalSecondDensityandviscositycanbedeterminedbyanalysisofthesamplestakenfromtheflowstreamattherecordedtemperatureintheplantlaboratory.Thermalconductivityandspecificheatcapacityifnotdeterminedfromthesamples can be collected from handbooks.
Step – CCalculate the thermal parameters of heat exchanger and compare with the designParameters Units Test Data Design Data Heat Duty, Q kWHotfluidsidepressuredrop,ΔPh bar *Coldfluidsidepressuredrop,ΔPc bar **denotesthepressuredropforthedesignflowcanberatedwiththerelationPressuredropisproportionaltoflow(1.75)
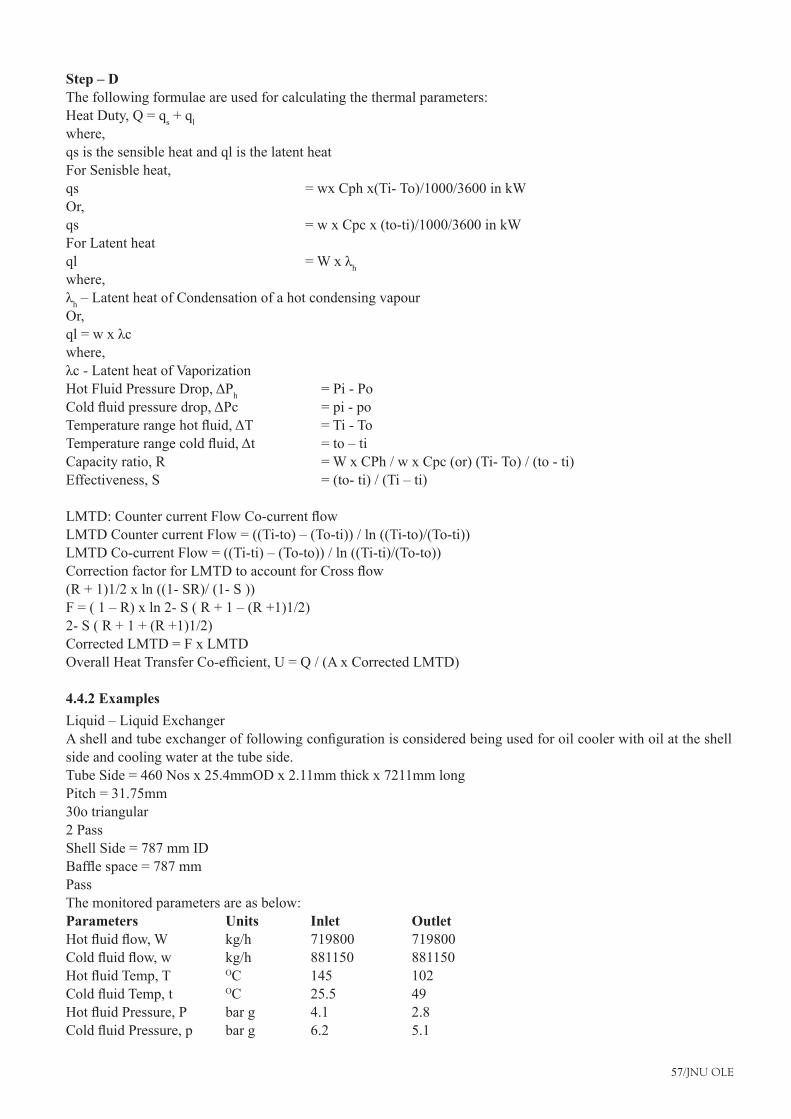
57/JNU OLE
Step – DThe following formulae are used for calculating the thermal parameters:Heat Duty, Q = qs+qlwhere,qs is the sensible heat and ql is the latent heatFor Senisble heat,qs = wx Cph x(Ti- To)/1000/3600 in kWOr,qs = w x Cpc x (to-ti)/1000/3600 in kWFor Latent heatql =Wxλhwhere,λh–LatentheatofCondensationofahotcondensingvapourOr,ql=wxλcwhere,λc-LatentheatofVaporizationHotFluidPressureDrop,ΔPh = Pi - PoColdfluidpressuredrop,ΔPc =pi-poTemperaturerangehotfluid,ΔT =Ti-ToTemperaturerangecoldfluid,Δt =to–tiCapacity ratio, R = W x CPh / w x Cpc (or) (Ti- To) / (to - ti)Effectiveness,S =(to-ti)/(Ti–ti)
LMTD:CountercurrentFlowCo-currentflowLMTDCountercurrentFlow=((Ti-to)–(To-ti))/ln((Ti-to)/(To-ti))LMTDCo-currentFlow=((Ti-ti)–(To-to))/ln((Ti-ti)/(To-to))CorrectionfactorforLMTDtoaccountforCrossflow(R+1)1/2xln((1-SR)/(1-S))F=(1–R)xln2-S(R+1–(R+1)1/2)2-S(R+1+(R+1)1/2)Corrected LMTD = F x LMTDOverallHeatTransferCo-efficient,U=Q/(AxCorrectedLMTD)
4.4.2 ExamplesLiquid–LiquidExchangerAshellandtubeexchangeroffollowingconfigurationisconsideredbeingusedforoilcoolerwithoilattheshellside and cooling water at the tube side.Tube Side = 460 Nos x 25.4mmOD x 2.11mm thick x 7211mm longPitch = 31.75mm30o triangular2 PassShell Side = 787 mm IDBafflespace=787mmPassThe monitored parameters are as below:Parameters Units Inlet OutletHotfluidflow,W kg/h 719800 719800Coldfluidflow,w kg/h 881150 881150HotfluidTemp,T OC 145 102ColdfluidTemp,t OC 25.5 49HotfluidPressure,P barg 4.1 2.8ColdfluidPressure,p barg 6.2 5.1
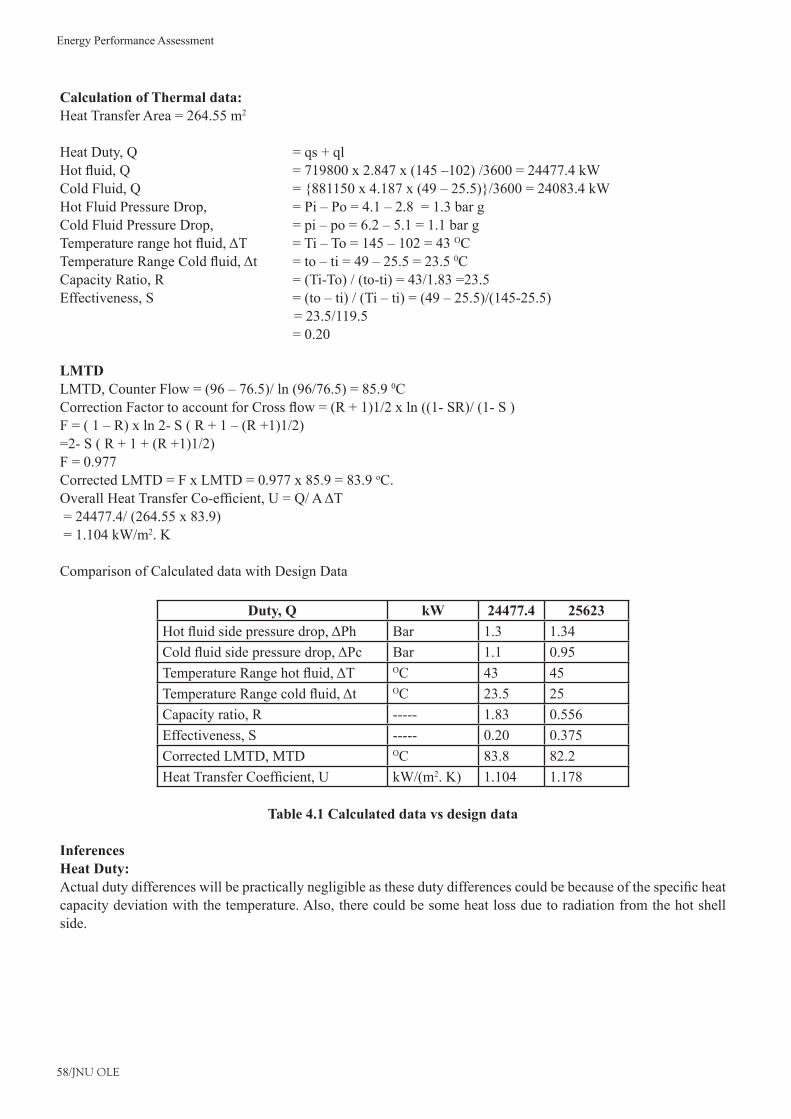
Energy Performance Assessment
58/JNU OLE
Calculation of Thermal data:Heat Transfer Area = 264.55 m2
HeatDuty,Q =qs+qlHotfluid,Q =719800x2.847x(145–102)/3600=24477.4kWColdFluid,Q ={881150x4.187x(49–25.5)}/3600=24083.4kWHotFluidPressureDrop, =Pi–Po=4.1–2.8=1.3bargColdFluidPressureDrop, =pi–po=6.2–5.1=1.1bargTemperaturerangehotfluid,ΔT =Ti–To=145–102=43OCTemperatureRangeColdfluid,Δt =to–ti=49–25.5=23.50CCapacity Ratio, R = (Ti-To) / (to-ti) = 43/1.83 =23.5Effectiveness,S =(to–ti)/(Ti–ti)=(49–25.5)/(145-25.5) = 23.5/119.5 = 0.20
LMTDLMTD,CounterFlow=(96–76.5)/ln(96/76.5)=85.90CCorrectionFactortoaccountforCrossflow=(R+1)1/2xln((1-SR)/(1-S)F=(1–R)xln2-S(R+1–(R+1)1/2)=2-S(R+1+(R+1)1/2)F = 0.977Corrected LMTD = F x LMTD = 0.977 x 85.9 = 83.9 oC.OverallHeatTransferCo-efficient,U=Q/AΔT = 24477.4/ (264.55 x 83.9) = 1.104 kW/m2. K
Comparison of Calculated data with Design Data
Duty, Q kW 24477.4 25623 Hotfluidsidepressuredrop,ΔPh Bar 1.3 1.34 Coldfluidsidepressuredrop,ΔPc Bar 1.1 0.95 TemperatureRangehotfluid,ΔT OC 43 45 TemperatureRangecoldfluid,Δt OC 23.5 25 Capacity ratio, R ----- 1.83 0.556 Effectiveness, S ----- 0.20 0.375 Corrected LMTD, MTD OC 83.8 82.2 HeatTransferCoefficient,U kW/(m2. K) 1.104 1.178
Table 4.1 Calculated data vs design data
InferencesHeat Duty: Actualdutydifferenceswillbepracticallynegligibleasthesedutydifferencescouldbebecauseofthespecificheatcapacity deviation with the temperature. Also, there could be some heat loss due to radiation from the hot shell side.
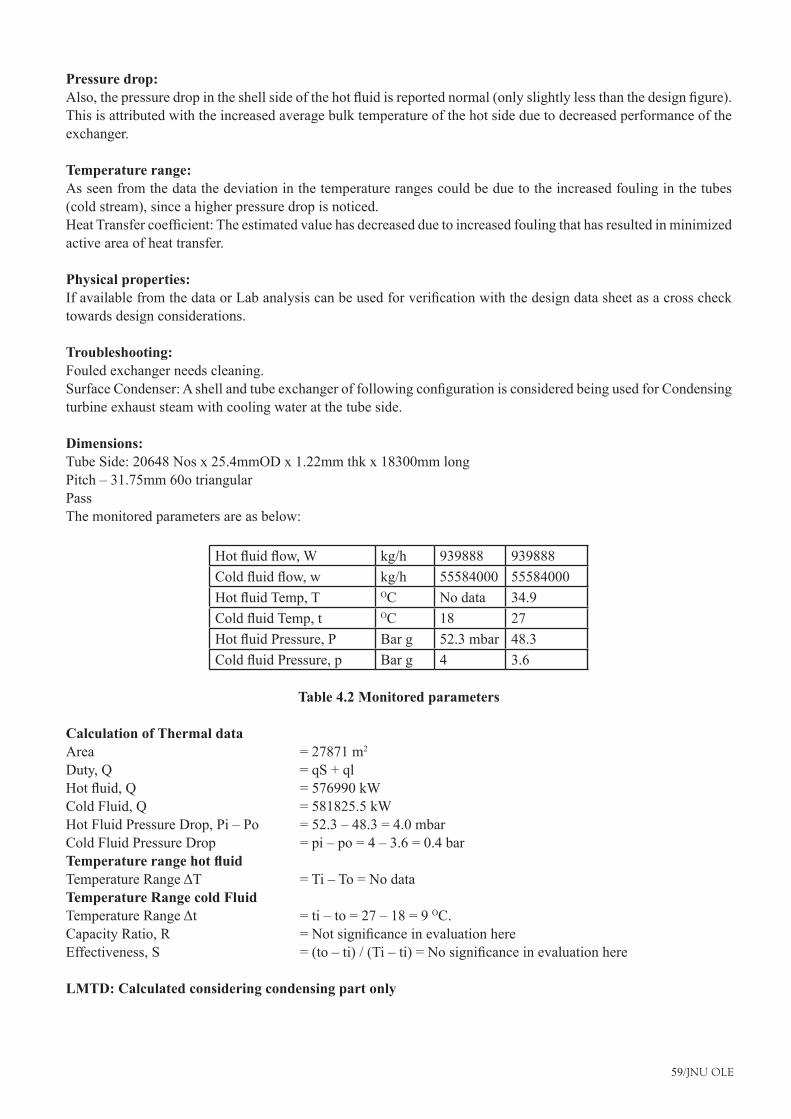
59/JNU OLE
Pressure drop:Also,thepressuredropintheshellsideofthehotfluidisreportednormal(onlyslightlylessthanthedesignfigure).This is attributed with the increased average bulk temperature of the hot side due to decreased performance of the exchanger.
Temperature range: As seen from the data the deviation in the temperature ranges could be due to the increased fouling in the tubes (cold stream), since a higher pressure drop is noticed.HeatTransfercoefficient:Theestimatedvaluehasdecreasedduetoincreasedfoulingthathasresultedinminimizedactive area of heat transfer.
Physical properties: IfavailablefromthedataorLabanalysiscanbeusedforverificationwiththedesigndatasheetasacrosschecktowards design considerations.
Troubleshooting: Fouled exchanger needs cleaning.SurfaceCondenser:AshellandtubeexchangeroffollowingconfigurationisconsideredbeingusedforCondensingturbine exhaust steam with cooling water at the tube side.
Dimensions:Tube Side: 20648 Nos x 25.4mmOD x 1.22mm thk x 18300mm longPitch–31.75mm60otriangularPassThe monitored parameters are as below:
Hotfluidflow,W kg/h 939888 939888 Coldfluidflow,w kg/h 55584000 55584000 HotfluidTemp,T OC No data 34.9 ColdfluidTemp,t OC 18 27 HotfluidPressure,P Bar g 52.3 mbar 48.3 ColdfluidPressure,p Bar g 4 3.6
Table 4.2 Monitored parameters
Calculation of Thermal dataArea = 27871 m2
Duty,Q =qS+qlHotfluid,Q =576990kWCold Fluid, Q = 581825.5 kWHotFluidPressureDrop,Pi–Po =52.3–48.3=4.0mbarColdFluidPressureDrop =pi–po=4–3.6=0.4barTemperature range hot fluidTemperatureRangeΔT =Ti–To=NodataTemperature Range cold FluidTemperatureRangeΔt =ti–to=27–18=9OC. CapacityRatio,R =NotsignificanceinevaluationhereEffectiveness,S =(to–ti)/(Ti–ti)=Nosignificanceinevaluationhere
LMTD: Calculated considering condensing part only
Energy Performance Assessment
60/JNU OLE
LMTD,CounterFlow =((34.9–18)-(34.9-27))/ln((34.9-18)/(34.9-27))=11.8oCCorrectionFactortoaccountforCrossflow,F =1.0Corrected LMTD, MTD = F x LMTD = 1.0 x 11.8 = 11.8 o CHeatTransferCo-efficientOverallHTC,U =Q/AΔT=576990/(27871x11.8)=1.75kW/m2. K
Comparison of Calculated data with Design DataCalculation of Thermal data:Area = 27871 m2
Duty,Q=qS+qLHotfluid,Q=576990kWCold Fluid, Q = 581825.5 kWHotFluidPressureDrop,Pi–Po=52.3–48.3=4.0mbarColdFluidPressureDrop,pi–po=4–3.6=0.4barTemperaturerangehotfluid,ΔT=Ti–To=NodataTemperatureRangeColdFluid,Δt=ti–to=27–18=9OCCapacityRatio,R=NosignificanceinevaluationhereEffectiveness,S=(to–ti)/(Ti–ti)=Notsignificantinevaluationhere
LMTD: Calculated considering condensing part only;LMTD,CounterFlow=((34.9–18)-(34.9-27))/ln((34.9-18)/(34.9-27))=11.8oCCorrectionFactortoaccountforCrossflow,F=1.0Corrected LMTD, MTD = F x LMTD = 1.0 x 11.8 = 11.8 OCHeatTransferCo-efficientOverallHTC,U=Q/AΔT=576990/(27871x11.8)=1.75kW/m2. KComparison of Calculated data with Design DataParameters Units Test data Design dataDuty, Q kW 576990 588430Hotfluidsidepressuredrop,ΔPh mBar 4 3.7Coldfluidsidepressuredrop,ΔPc Bar 0.4TemperatureRangehotfluid,ΔT OCTemperatureRangecoldfluid,Δt OC (27-18) = 9 (28-19)=9Capacity ratio, R ----- Effectiveness, S ----- Corrected LMTD, MTD OC 11.8 8.9HeatTransferCoefficient,U kW/(m2. K) 1.75 2.37

61/JNU OLE
SummaryEfficiencyofheattransferinaheatexchangerismonitoredbyevaluatingOverallHeatTransfercoefficient‘U'•of the exchanger.This factor deteriorates due to the fouling of the heat transfer surface in service.•A periodic evaluation of ‘U' will enable the O and M personnel to plan their programme for defouling or cleaning •the heat exchanger.The operating parameters are measured and the data is used to compute the ‘U' factor.•The evaluated ‘U' factor with the design value or the baseline value to assess the degree of fouling and plan for •taking corrective action.Portable or on-line instruments are used to measure the operating parameters while the physical properties and •chemical composition of the media are evaluated with the laboratory instruments.
Recommended ReadingW. M. Kays(1998), • Compact Heat Exchangers, Krieger Publishing Company; 3 Sub edition,p 335Sadik Kakac(2002),• Heat Exchangers: Selection, Rating, and Thermal Design, 2 Edition, CRC Press, p 520H.S.Lee(2010), Thermal Design: • Heat Sinks, Thermoelectrics, Heat Pipes, Compact Heat Exchangers, and Solar Cells, Wiley; 1 edition, p 648

Energy Performance Assessment
62/JNU OLE
Self Assessment
Q=_____________1. U ×LMTDa. A ×LMTDb. U× A c. U× A ×LMTDd.
If the operating duty is less than design ________ duty, it may be due to heat losses, fouling in tubes, reduced 2. flowrate(hotorcold)etc.
aira. steamb. pressurec. heatd.
Technicalrecordsaretobemaintainedforalltheexchangers,sothatproblemsassociatedwithreducedefficiency3. andheattransfercanbeidentifiedeasily.
aira. steamb. pressurec. heatd.
HotFluidPressureDrop,ΔPh=__________.4. Pi–Poa. P2–Pob. P8–Poc. P7–Pod.
Coldfluidpressuredrop,ΔPc=____________.5. p4- po a. pi- po b. p8- po c. p10- po d.
Actualdutydifferenceswillbepracticallynegligibleasthesedutydifferencescouldbebecauseofthespecific6. heat capacity deviation with the __________.
temperaturea. steamb. pressurec. heatd.

63/JNU OLE
B]TrueorFalseWhich of the following is true?7.
If the operating duty is less than design heat duty, it may be due to heat losses, fouling in tubes, reduced a. flowrate(hotorcold)etc.Iftheoperatingdutyislessthandesignairduty,itmaybeduetoheatlosses,foulingintubes,reducedflowb. rate (hot or cold) etc.If the operating duty is less than design steam duty, it may be due to heat losses, fouling in tubes, reduced c. flowrate(hotorcold)etc.If the operating duty is less than design pressure duty, it may be due to heat losses, fouling in tubes, reduced d. flowrate(hotorcold)etc.
Which of the following is true?8. HotFluidPressureDrop,ΔPh=P7–Poa. HotFluidPressureDrop,ΔPh=P7–P2b. HotFluidPressureDrop,ΔPh=P7–P3c. HotFluidPressureDrop,ΔPh=P7–P6d.
Which of the following is true?9. Coldfluidpressuredrop,ΔPc=p3-po.a. Coldfluidpressuredrop,ΔPc=pi-po.b. Coldfluidpressuredrop,ΔPc=pn-po.c. Coldfluidpressuredrop,ΔPc=p4-po.d.
Which of the following is true?10. Technical records are to be maintained for all the exchangers, so that problems associated with reduced a. efficiencyandairtransfercanbeidentifiedeasily.Technical records are to be maintained for all the exchangers, so that problems associated with reduced b. efficiencyandsteamtransfercanbeidentifiedeasily.Technical records are to be maintained for all the exchangers, so that problems associated with reduced c. efficiencyandheattransfercanbeidentifiedeasily.Technical records are to be maintained for all the exchangers, so that problems associated with reduced d. efficiencyandpressuretransfercanbeidentifiedeasily.

Energy Performance Assessment
64/JNU OLE
Chapter V
Energy Performance Assessment of Motors and Variable Speed Drives
AimThe aim of this chapter is to:
understandwhatisanenergyefficientmotorandhowthelossesinthistypeofmotorarereduced•recognizepartiallyloadedmotorsconsumemorepowerandarelessefficient•identify effect of rewinding on motors•
ObjectivesThe objectives of this chapter are to:
observe application of variable speed drives•analyze performance evaluation of rewound motors•identify format for data collection•analyze various losses in a motor and how to estimate them•
Learning outcomeAt the end of this chapter students will be able to:
identify effect of rewinding on motors•recognize format for data collection•discriminate application of variable speed drives•analyze various losses in a motor and how to estimate them•
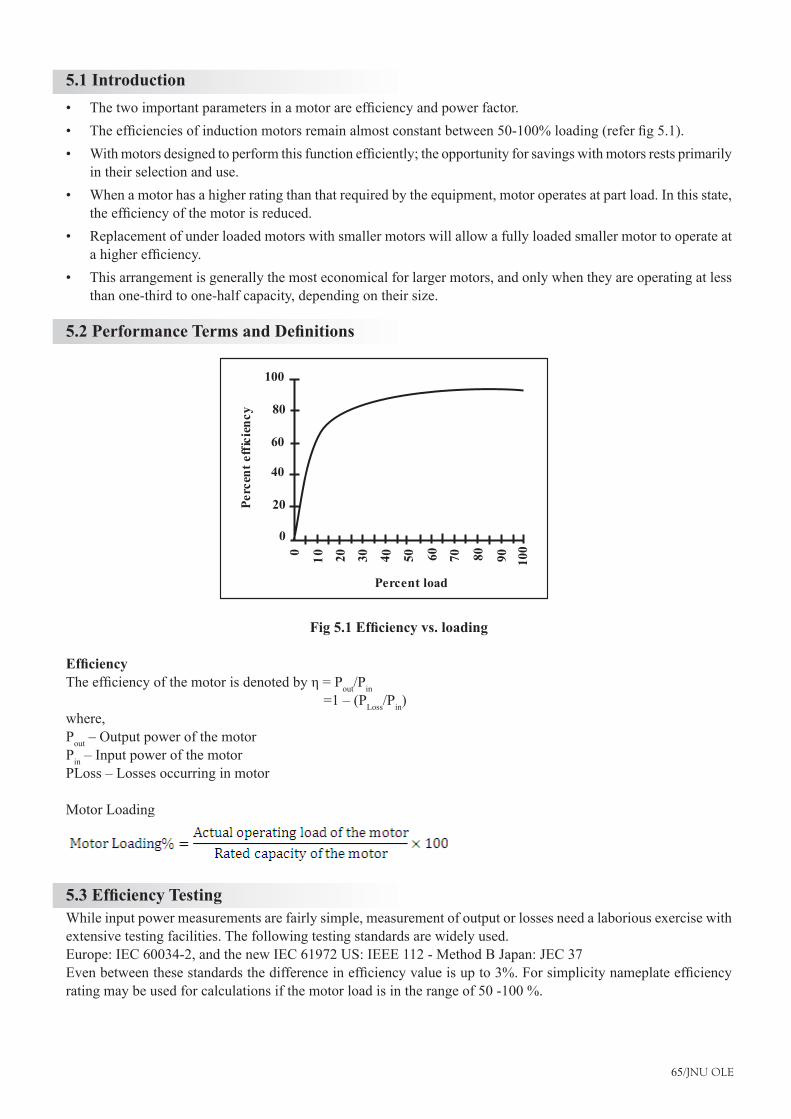
65/JNU OLE
5.1 IntroductionThetwoimportantparametersinamotorareefficiencyandpowerfactor.•Theefficienciesofinductionmotorsremainalmostconstantbetween50-100%loading(referfig5.1).•Withmotorsdesignedtoperformthisfunctionefficiently;theopportunityforsavingswithmotorsrestsprimarily•in their selection and use.When a motor has a higher rating than that required by the equipment, motor operates at part load. In this state, •theefficiencyofthemotorisreduced.Replacement of under loaded motors with smaller motors will allow a fully loaded smaller motor to operate at •ahigherefficiency.This arrangement is generally the most economical for larger motors, and only when they are operating at less •than one-third to one-half capacity, depending on their size.
5.2 Performance Terms and Definitions
Fig 5.1 Efficiency vs. loading
EfficiencyTheefficiencyofthemotorisdenotedbyη=Pout/Pin =1–(PLoss/Pin)where,Pout–OutputpowerofthemotorPin–InputpowerofthemotorPLoss–Lossesoccurringinmotor
Motor Loading
5.3 Efficiency TestingWhile input power measurements are fairly simple, measurement of output or losses need a laborious exercise with extensive testing facilities. The following testing standards are widely used.Europe: IEC 60034-2, and the new IEC 61972 US: IEEE 112 - Method B Japan: JEC 37 Evenbetweenthesestandardsthedifferenceinefficiencyvalueisupto3%.Forsimplicitynameplateefficiencyratingmaybeusedforcalculationsifthemotorloadisintherangeof50-100%.
0
0
20
60
80
100
40
Perc
ent e
ffic
ienc
y
20 30 4 0 50 60 70 80 90 100
10
Percent load
Energy Performance Assessment
66/JNU OLE
FieldTestsforDeterminingEfficiency(Note: The following section is a repeat of material provided in the chapter-2 on Electrical Motors)
No Load Test: The motor is run at rated voltage and frequency without any shaft load. Input power, current, frequency and voltage are noted. The no load P.F. is quite low and hence low PF watt meters are required. From the input power, stator I2R losses under no load are subtracted to give the sum of Friction and Windage (F&W) and core losses. To separate core and F & W losses, test is repeated at variable voltages. It is worthwhile plotting no-load input kW versus Voltage; the intercept is F&W kW loss component.F&Wandcorelosses=Noloadpower(watts)–(Noloadcurrent)2 x Stator resistance
Stator and Rotor I2R Losses:The stator winding resistance is directly measured by a bridge or volt amp method. The resistance must be corrected totheoperatingtemperature.Formodernmotors,theoperatingtemperatureislikelytobeintherangeof100°Cto120°Candnecessarycorrectionshouldbemade.Correctionto75°Cmaybeinaccurate.Thecorrectionfactorisgiven as follows:R2235+t2—–=———–,where,t1=ambienttemperature,°Candt2=operatingtemperature,°C.R1235+t1 The rotor resistance can be determined from locked rotor test at reduced frequency, but rotor I2R losses are measured from measurement of rotor slip.Rotor I2R losses = Slip x (Stator Input - Stator I2R Losses - Core Loss)Accurate measurement of slip is possible by stroboscope or non-contact type tachometer. Slip also must be corrected to operating temperature.
Stray Load LossesTheselossesaredifficulttomeasurewithanyaccuracy.IEEEStandard112givesacomplicatedmethod,whichisrarelyusedonshopfloor.ISandIECstandardstakeafixedvalueas0.5%ofoutput.Itmustberemarkedthatactualvalueofstraylossesislikelytobemore.IEEE-112spec¬ifiesvaluesfrom0.9%to1.8%.
Points for User:Itmustbeclearthataccuratedeterminationofefficiencyisverydifficult.Thesamemotortestedbydifferentmethodsandbysamemethodsbydifferentmanufacturerscangiveadifferenceof2%.Estimationofefficiencyinthefieldcanbesummarizedasfollows:
a) Measure stator resistance and correct to operating temperature. From rated current value, I2R losses are calculated. b) From rated speed and output, rotor I2R losses are calculated
c) From no load test, core and F & W losses are determined for stray loss.
The method is illustrated by the following example;Example:MotorSpecificationsRated power = 34 kW/45 HPVoltage = 415 VoltCurrent = 57 AmpsSpeed = 1475 rpmInsulation class = FFrame = LD 200 LConnection = Delta
No load test Data
67/JNU OLE
Voltage, V = 415 VoltsCurrent, I = 16.1 AmpsFrequency, F = 50 HzStatorphaseresistanceat30°C =0.264OhmsNo load power, Pnl = 1063.74 Watts
Calculate iron plus friction and windage lossesCalculatestatorresistanceat120°C,R2 = R1X[(235+t2)/(235+t1)]Calculatestatorcopperlossesatoperatingtemperatureofresistanceat120°CCalculate full load slip(s) and rotor input assuming rotor losses are slip times rotor inputDeterminethemotorinputassumingthatstraylossesare0.5%ofthemotorratedpowerCalculatemotorfullloadefficiencyandfullloadpowerfactor
SolutionLet Iron plus friction and windage loss,Pi +fwNo load power, Pnl = 1063.74 WattsStator Copper loss, P st-30°C(Pst.cu)’ =3x(16.1/√3)2x0.264 = 68.43 WattsPi+fw=Pnl - Pst.cu =1063.74–68.43 = 995.3 WStatorResistanceat120°C = 0.354 ohms per phase Stator copper losses at full load, Pst.cu120°C =3x(57/√3)2x0.354 = 1150.1 Watts
Full load slipS =(1500–1475)/1500 = 0.0167Rotor input, Pr = Poutput/ (1-S) = 34000 / (1-0.0167) = 34577.4 Watts Motor full load input power, P input = Pr+Pst.cu120°C+(Pi+fw)+Pstray =34577.4+1150.1+995.3+(0.005*x34000) = 36892.8 Watts*where,straylosses=0.5%ofratedoutput(assumed)Motorefficiencyatfullload
Efficiency =
=
= 92.2%
Full Load PF = = = 0.90
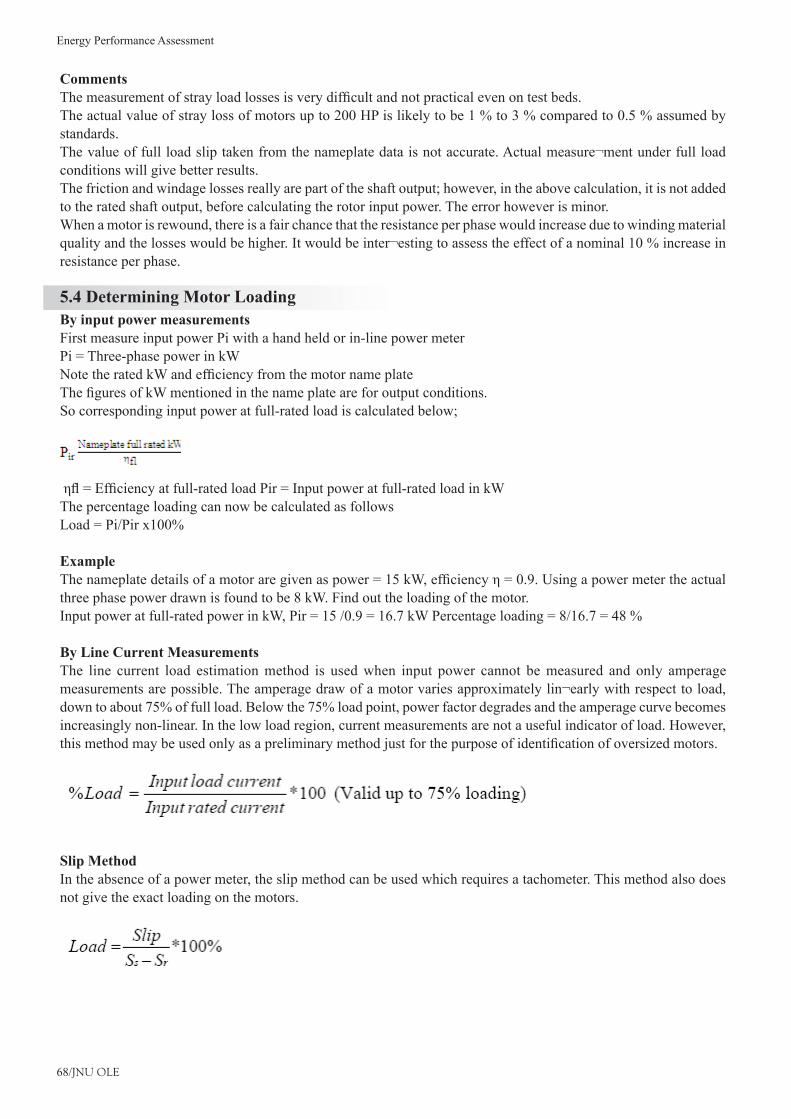
Energy Performance Assessment
68/JNU OLE
CommentsThemeasurementofstrayloadlossesisverydifficultandnotpracticalevenontestbeds.Theactualvalueofstraylossofmotorsupto200HPislikelytobe1%to3%comparedto0.5%assumedbystandards.The value of full load slip taken from the nameplate data is not accurate. Actual measure¬ment under full load conditions will give better results.The friction and windage losses really are part of the shaft output; however, in the above calculation, it is not added to the rated shaft output, before calculating the rotor input power. The error however is minor. When a motor is rewound, there is a fair chance that the resistance per phase would increase due to winding material qualityandthelosseswouldbehigher.Itwouldbeinter¬estingtoassesstheeffectofanominal10%increaseinresistance per phase.
5.4 Determining Motor LoadingBy input power measurementsFirst measure input power Pi with a hand held or in-line power meter Pi = Three-phase power in kW NotetheratedkWandefficiencyfromthemotornameplateThefiguresofkWmentionedinthenameplateareforoutputconditions.So corresponding input power at full-rated load is calculated below;
ηfl=Efficiencyatfull-ratedloadPir=Inputpoweratfull-ratedloadinkWThe percentage loading can now be calculated as follows Load=Pi/Pirx100%
ExampleThenameplatedetailsofamotoraregivenaspower=15kW,efficiencyη=0.9.Usingapowermetertheactualthree phase power drawn is found to be 8 kW. Find out the loading of the motor. Inputpoweratfull-ratedpowerinkW,Pir=15/0.9=16.7kWPercentageloading=8/16.7=48%
By Line Current MeasurementsThe line current load estimation method is used when input power cannot be measured and only amperage measurements are possible. The amperage draw of a motor varies approximately lin¬early with respect to load, downtoabout75%offullload.Belowthe75%loadpoint,powerfactordegradesandtheamperagecurvebecomesincreasingly non-linear. In the low load region, current measurements are not a useful indicator of load. However, thismethodmaybeusedonlyasapreliminarymethodjustforthepurposeofidentificationofoversizedmotors.
Slip MethodIn the absence of a power meter, the slip method can be used which requires a tachometer. This method also does not give the exact loading on the motors.
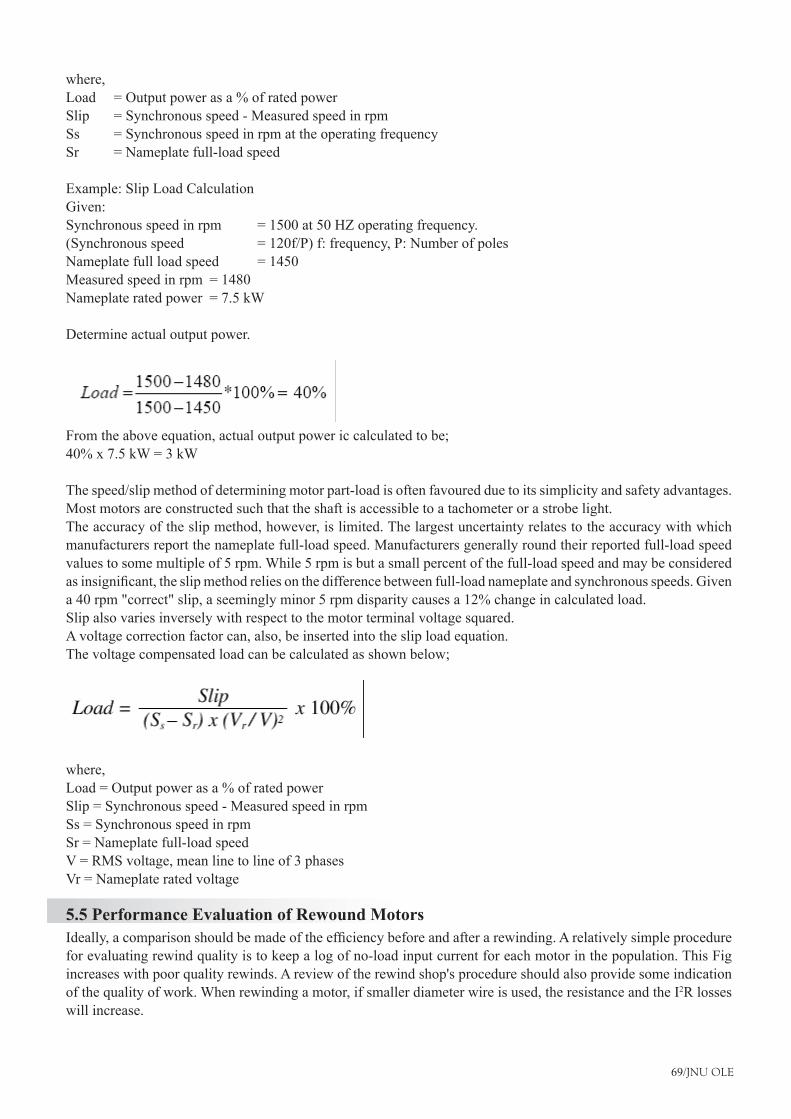
69/JNU OLE
where,Load =Outputpowerasa%ofratedpowerSlip = Synchronous speed - Measured speed in rpm Ss = Synchronous speed in rpm at the operating frequency Sr = Nameplate full-load speed
Example: Slip Load CalculationGiven:Synchronous speed in rpm = 1500 at 50 HZ operating frequency. (Synchronous speed = 120f/P) f: frequency, P: Number of poles Nameplate full load speed = 1450Measured speed in rpm = 1480Nameplate rated power = 7.5 kW
Determine actual output power.
From the above equation, actual output power ic calculated to be;40%x7.5kW=3kW
The speed/slip method of determining motor part-load is often favoured due to its simplicity and safety advantages. Most motors are constructed such that the shaft is accessible to a tachometer or a strobe light.The accuracy of the slip method, however, is limited. The largest uncertainty relates to the accuracy with which manufacturers report the nameplate full-load speed. Manufacturers generally round their reported full-load speed values to some multiple of 5 rpm. While 5 rpm is but a small percent of the full-load speed and may be considered asinsignificant,theslipmethodreliesonthedifferencebetweenfull-loadnameplateandsynchronousspeeds.Givena40rpm"correct"slip,aseeminglyminor5rpmdisparitycausesa12%changeincalculatedload.Slip also varies inversely with respect to the motor terminal voltage squared.A voltage correction factor can, also, be inserted into the slip load equation.The voltage compensated load can be calculated as shown below;
where,Load=Outputpowerasa%ofratedpowerSlip = Synchronous speed - Measured speed in rpmSs = Synchronous speed in rpmSr = Nameplate full-load speedV = RMS voltage, mean line to line of 3 phasesVr = Nameplate rated voltage
5.5 Performance Evaluation of Rewound MotorsIdeally,acomparisonshouldbemadeoftheefficiencybeforeandafterarewinding.Arelativelysimpleprocedurefor evaluating rewind quality is to keep a log of no-load input current for each motor in the population. This Fig increases with poor quality rewinds. A review of the rewind shop's procedure should also provide some indication of the quality of work. When rewinding a motor, if smaller diameter wire is used, the resistance and the I2R losses will increase.

Energy Performance Assessment
70/JNU OLE
5.6 Format for Data CollectionThe motor loading survey can be performed using the format given below: The monitoring format for rewound motor is given below:
5.7 Application of Variable Speed Drives (VSD)Although there are many methods of varying the speeds of the driven equipment such as hydraulic coupling, gear box, variable pulley etc., the most possible method is one of varying the motor speed itself by varying the frequency and voltage by a variable frequency drive.
5.7.1 Concept of Variable Frequency Drive The speed of an induction motor is proportional to the frequency of the AC voltage applied to it, as well as the number of poles in the motor stator. This is expressed by the equation:
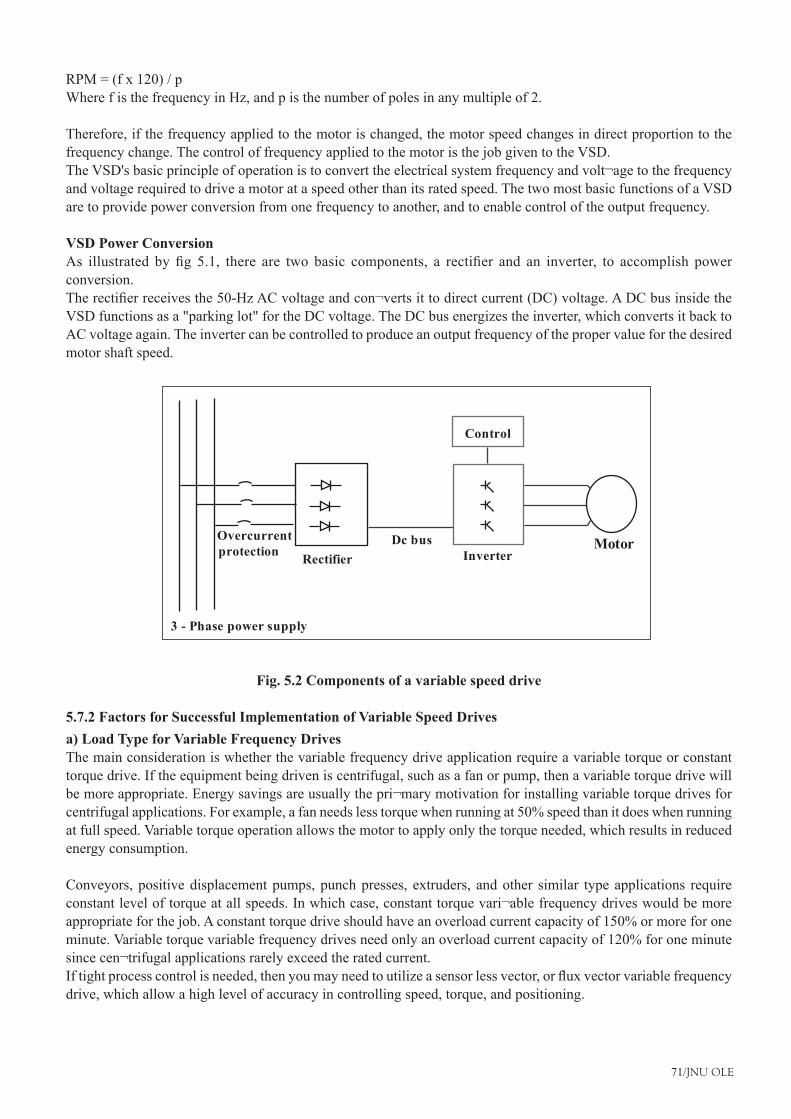
71/JNU OLE
RPM = (f x 120) / pWhere f is the frequency in Hz, and p is the number of poles in any multiple of 2.
Therefore, if the frequency applied to the motor is changed, the motor speed changes in direct proportion to the frequency change. The control of frequency applied to the motor is the job given to the VSD. The VSD's basic principle of operation is to convert the electrical system frequency and volt¬age to the frequency and voltage required to drive a motor at a speed other than its rated speed. The two most basic functions of a VSD are to provide power conversion from one frequency to another, and to enable control of the output frequency.
VSD Power ConversionAs illustrated by fig 5.1, there are two basic components, a rectifier and an inverter, to accomplish powerconversion.Therectifierreceivesthe50-HzACvoltageandcon¬vertsittodirectcurrent(DC)voltage.ADCbusinsidetheVSD functions as a "parking lot" for the DC voltage. The DC bus energizes the inverter, which converts it back to AC voltage again. The inverter can be controlled to produce an output frequency of the proper value for the desired motor shaft speed.
Fig. 5.2 Components of a variable speed drive
5.7.2 Factors for Successful Implementation of Variable Speed Drivesa) Load Type for Variable Frequency DrivesThe main consideration is whether the variable frequency drive application require a variable torque or constant torque drive. If the equipment being driven is centrifugal, such as a fan or pump, then a variable torque drive will be more appropriate. Energy savings are usually the pri¬mary motivation for installing variable torque drives for centrifugalapplications.Forexample,afanneedslesstorquewhenrunningat50%speedthanitdoeswhenrunningat full speed. Variable torque operation allows the motor to apply only the torque needed, which results in reduced energy consumption.
Conveyors, positive displacement pumps, punch presses, extruders, and other similar type applications require constant level of torque at all speeds. In which case, constant torque vari¬able frequency drives would be more appropriateforthejob.Aconstanttorquedriveshouldhaveanoverloadcurrentcapacityof150%ormoreforoneminute.Variabletorquevariablefrequencydrivesneedonlyanoverloadcurrentcapacityof120%foroneminutesince cen¬trifugal applications rarely exceed the rated current.Iftightprocesscontrolisneeded,thenyoumayneedtoutilizeasensorlessvector,orfluxvectorvariablefrequencydrive, which allow a high level of accuracy in controlling speed, torque, and positioning.
MotorDc busRectifier
Overcurrentprotection
Control
Inverter
3 - Phase power supply
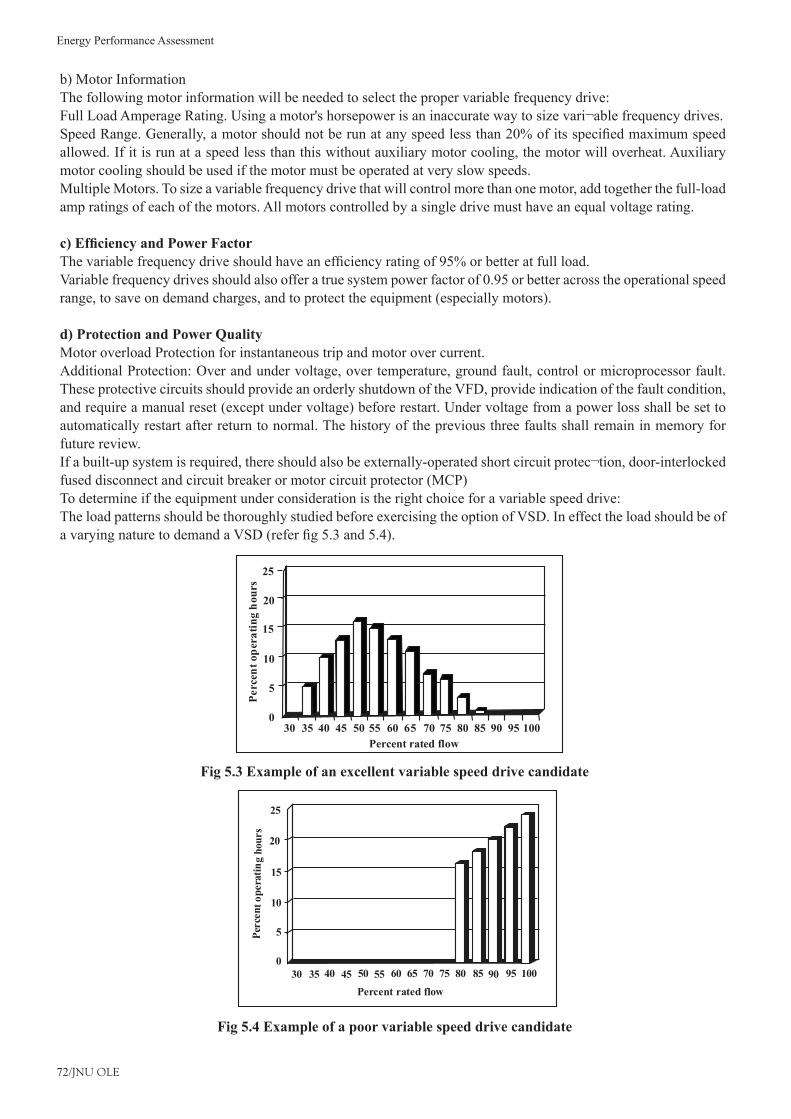
Energy Performance Assessment
72/JNU OLE
b) Motor InformationThe following motor information will be needed to select the proper variable frequency drive: Full Load Amperage Rating. Using a motor's horsepower is an inaccurate way to size vari¬able frequency drives.SpeedRange.Generally,amotorshouldnotberunatanyspeedlessthan20%ofitsspecifiedmaximumspeedallowed. If it is run at a speed less than this without auxiliary motor cooling, the motor will overheat. Auxiliary motor cooling should be used if the motor must be operated at very slow speeds.Multiple Motors. To size a variable frequency drive that will control more than one motor, add together the full-load amp ratings of each of the motors. All motors controlled by a single drive must have an equal voltage rating.
c) Efficiency and Power Factor Thevariablefrequencydriveshouldhaveanefficiencyratingof95%orbetteratfullload.Variable frequency drives should also offer a true system power factor of 0.95 or better across the operational speed range, to save on demand charges, and to protect the equipment (especially motors).
d) Protection and Power QualityMotor overload Protection for instantaneous trip and motor over current.Additional Protection: Over and under voltage, over temperature, ground fault, control or microprocessor fault. These protective circuits should provide an orderly shutdown of the VFD, provide indication of the fault condition, and require a manual reset (except under voltage) before restart. Under voltage from a power loss shall be set to automatically restart after return to normal. The history of the previous three faults shall remain in memory for future review. If a built-up system is required, there should also be externally-operated short circuit protec¬tion, door-interlocked fused disconnect and circuit breaker or motor circuit protector (MCP) To determine if the equipment under consideration is the right choice for a variable speed drive: The load patterns should be thoroughly studied before exercising the option of VSD. In effect the load should be of avaryingnaturetodemandaVSD(referfig5.3and5.4).
Fig 5.3 Example of an excellent variable speed drive candidate
Fig 5.4 Example of a poor variable speed drive candidate
Perc
ent o
pera
ting
hour
s
35 40 4530 50 55 60 65 70 75 80 85 90 95 1000
5
10
15
20
25
Percent rated flow
25
20
15
10
5
030 4035 45 50 55 60 65 70 75 80 85 90 95 100
Percent rated flow
Perc
ent o
pera
ting
hour
s

73/JNU OLE
Thefirststepistoidentifythenumberofoperatinghoursoftheequipmentatvariousloadconditions.Thiscanbedone by using a Power analyzer with continuous data storage or by a simple energy meter with periodic reading being taken.
5.7.3 Information needed to Evaluate Energy Savings for Variable Speed Application
Methodofflowcontroltowhichadjustablespeediscomparedtoare:•output throttling (pump) or dampers (fan)•recirculation(pump)orunrestrainedflow(fan)•adjustable-speed coupling (eddy current coupling)•inlet guide vanes or inlet dampers (fan only)•two-speed motor•
Pump or fan dataHeadv'sflowcurveforeverydifferenttypeofliquid(pump)orgas(fan)thatishandledPumpefficiencycurves.
Process informationspecificgravity(forpumps)orspecificdensityofproducts(forfans)•systemresistancehead/flowcurve•equipmentdutycycle,i.e.flowlevelsandtimeduration•
Efficiencyinformationonallrelevantelectricalsystemapparatus:motors•constant and variable speed•variable speed drives•gears•transformers•
If we do not have precise information for all of the above, we can make reasonable assump¬tions for points 2 and 4.

Energy Performance Assessment
74/JNU OLE
SummaryThe losses in the motor include iron loss and copper loss. Both these can be estimated on the basis of no load •and blocked rotor test.However there are other losses, which need to be estimated on the basis of accepted standards and practices.•These include Stray Load Losses, Friction and Windage losses, etc.•Rewindingchangesthestatorresistanceandhencealltheassociatedlossesareaffected.Normallytheefficiency•goes down after rewinding.Out of the losses, two major losses are Iron Loss called no load loss and Copper Loss depending on the load.•When themotor is partially loaded the iron loss remains fixed and hence its share in the overall losses•increases.Thus, for a partial loaded motor the percentage of input power meeting these losses goes up and hence the •partiallyloadedmotorhaslessefficiencycomparedtothefullyloadedmotor.EnergyEfficientMotorsarethosewhoseefficiencydoesnotvarymorethan4%whentheloadisreducedfrom•100%to75%.Thus,theefficiencyofthemotorremainspracticallyconstantbetween75%and100%ofload.Thisisachieved•by better design, better quality of material, etc.
Recommended ReadingMichael Brumbach(2005),• Electronic Variable Speed Drives, Delmar Cengage Learning; 3 edition, p 312Malcolm Barnes CPEng(2003), • Practical Variable Speed Drives and Power Electronics, Newnes; 1 edition, p 304Bimal K Bose, • Power Electronics and Variable Frequency Drives: Technology and Applications, Wiley-IEEE Press, p 660.

75/JNU OLE
Self Assessment
A] Fill in the blanks
Theefficienciesofinductionmotorsremainalmostconstantbetween_____________loading.1. 50%to100%a. 60%to100%b. 40%to100%c. 30%to100%d.
When a motor has a _________________rating than that required by the equipment, motor operates at part 2. load.
highera. lowerb. constantc. fluctuatingd.
While input power measurements are fairly simple, measurement of output or losses need a laborious exercise 3. with extensive _____________facilities.
measuringa. testingb. calculatingc. observingd.
The measurement of stray load losses is very ______________and not practical even on test beds.4. easya. difficultb. simplec. complexd.
Most motors are _____________such that the shaft is accessible to a tachometer or a strobe light.5. constructeda. designedb. plannedc. calculatedd.
B] True or False
Which of the following is true?6. The line current load estimation method is used when output power can be measured and only amperage a. measurements are possible.The line current load estimation method is used when output power cannot be measured and only amperage b. measurements are possible.The line current load estimation method is used when input power can be measured and only amperage c. measurements are possible.The line current load estimation method is used when input power cannot be measured and only amperage d. measurements are possible.

Energy Performance Assessment
76/JNU OLE
Which of the following is true?7. The speed/slip method of determining motor part-load is often not favoured due to its simplicity and safety a. advantages.The speed/slip method of determining motor part-load is often favoured due to its complexity.b. The speed/slip method of determining motor part-load is often favoured due to its simplicity and safety c. advantages.The speed/slip method of determining motor part-load is often neglected due to its simplicity and safety d. advantages.
Which of the following is true?8. Themeasurementofstrayloadlossesisverydifficultandnotpracticalevenontestbeds.a. Themeasurementofstrayloadgainsisverydifficultandnotpracticalevenontestbeds.b. Themeasurementofstrayloadlossesisverydifficultandpracticalevenontestbeds.c. The measurement of stray load losses is very easy and practical even on test beds.d.
Which of the following is true?9. Theefficienciesofinductionmotorsremainalmostconstantbetween50%to100%loading.a. Theefficienciesofinductionmotorsremainalmostirregularbetween50%to100%loading.b. Theefficienciesofinductionmotorsremainalmostirregularbetween30%to100%loading.c. Theefficienciesofinductionmotorsremainalmostconstantbetween70%to100%loading.d.
Which of the following is true?10. Most motors are constructed such that the shaft is accessible to a tachometer or a strobe light.a. Most motors are designed such that the shaft is accessible to a tachometer or a strobe light.b. Most motors are planned such that the shaft is accessible to a tachometer or a strobe light.c. Most motors are calculated such that the shaft is accessible to a tachometer or a strobe light.d.

77/JNU OLE
Chapter VI
Energy Performance Assessment of Fans and Blowers
AimThe aim of the chapter is to:
recognize fans behaviour at different loading conditions•understandmeasurestoachievehighestfanefficiencies•interprethowdampercontrolisinefficientcomparedtotheSpeedControlofMotorvariablespeeddrive•learnhowtomeasureairflowinafan•statepitottubeandhowitisusedtomeasureflow•
ObjectivesThe objective of the chapter is to:
understandhowdampercontrolisinefficientcomparedtotheSpeedControlofMotorvariablespeeddrive•studyhowtomeasureairflowinafan•recognizepitottubeandhowitisusedtomeasureflow•
Learning outcomeAt the end of this chapter students will be able to:
distinguish fans behaviour at different loading conditions•interpretmeasurestoachievehighestfanefficiencies•recognizehowdampercontrolisinefficientcomparedtotheSpeedControlofMotorvariablespeeddrive•
Energy Performance Assessment
78/JNU OLE
6.1 IntroductionThis section describes the method of testing a fan installed on site in order to determine the performance of the fan in conjunction with the system to which it is connected.
6.2 Purpose of the Performance TestThepurposesofsuchatestaretodetermine,underactualoperatingconditions,thevolumeflowrate,thepower•input and the total pressure rise across the fan.Thesetestresultswillprovideactualvaluefortheflowresistanceoftheairductsystem,whichcanbecompared•withthevaluespecifiedbysupplier.
6.3 Performance Terms and DefinitionsStatic Pressure: The absolute pressure at a point minus the reference atmospheric pressureDynamic Pressure:Theriseinstaticpressurewhichoccurswhenairmovingwithspecifiedvelocityatapointisbought to rest without loss of mechanical energy. It is also known as veloc¬ity pressureTotal Pressure: The sum of static pressures and dynamic pressures at a pointFan Shaft Power: The mechanical power supplied to the fan shaftMotor Input Power: The electrical power supplied to the terminals of an electric motor drive
6.4 ScopeTheproceduredescribesfieldtestingofcentrifugalfansandblowersforassessingperformanceandefficiency.
6.5 Reference StandardsBritish Standard, BS 848 - Fans for general purposes Part 1, Methods of testing performance.
6.6 Field Testing6.6.1 Instruction for Site TestingBefore site tests are carried out, it should be ensured that:
fan and its associated equipment are functioning properly, and at the rated speed•operations are at stable conditions, e.g. steady temperatures, densities, system resistance etc.•
6.6.2 Location of Measurement PlanesGeneral: Theflowmeasurementplaneshallbelocatedinanysuitablestraightlength,(preferablyontheinletsideofthefan)wheretheairflowconditionsaresubstantiallyaxial,symmetricalandfreefromturbulence.Leakageofairfromorintotheairductshallbenegligiblebetweentheflowmeasuringplaneandthefan.Bendsandobstructionsinanairductcandisturbtheairflowforaconsiderabledistancedownstream,andshouldbeavoidedforthepurposesofthe test.
Test length: Thatpartoftheductinwhichtheflowmeasurementplaneislocated,istermedthe'testlength'andshallbestraight,ofuniformcrosssectionandfreefromanyobstructionswhichmaymodifytheairflow.Itshallhavealengthequalto not less than twice the equivalent diameter of the air duct (i.e. 2De). For rectangular duct, equivalent diameter, Deisgivenby2LW/(L+W)whereL,Wisthelengthandwidthoftheduct.ForcircularductsDeisthesameasdiameter of the duct.
79/JNU OLE
Inlet side of the fan: Where the 'test length' is on the inlet side of the fan, its downstream end shall be at a distance from the fan inlet equal to at least 0.75De. See Fig 6.1. In the case of a fan having an inlet box, the downstream end of the test length shall be at a distance from the nearest part of the inlet cone of the fan equal to at least 0.75De.
Outlet side of the fan: Where the 'test length' is on the outlet side of the fan, the upstream end of the 'test length' shall be at a distance from the fan outlet of at least 3De. See Fig 6.2. For this purpose, the fan outlet shall be considered as being the outlet of any expander on the outlet side of the fan. LocationoftheFlowMeasurementPlanewithinthe'TestLength':Theflowmeasurementplaneshallbelocatedwithin the 'test length' at a distance from the downstream end of the 'test length' equal to at least 1.25De.
Location of Pressure Measurement Plane: For the purpose of determining the pressure rise produced by the fan, the static pressure shall be measured at planesontheinletand/ortheoutletsideofthefansufficientlyclosetoittoensurethatthepressurelossesbetweenthe measuring planes and the fan are calculable in accordance with available friction factor data without adding excessively to the uncertainty of fan pressure determination.
Ifconvenientlyclosetothefan,the'testlength'selectedforairflowmeasurementshouldalsobeusedtopressuremeasurement. Other planes used for pressure measurement should be no closer than 0.25De from the fan inlet and no closer than 4De from the fan outlet. The plane of pressure measurement should be selected at least 4De downstream ofanybend,expanderorobstructionwhicharelikelytocauseseparatedfloworotherwiseinterferewithuniformityof pressure distribution.
6.6.3 Measurement of Air Velocity on SiteVelocity shall be measured by either pitot tube or a rotating vane anemometer. When in use, the pitot tube shall be connected by means of airtight tubes to a pressure measuring instrument. The anemometer shall be calibrated before the test.
Pitot Tube: Note that separate static connections (A) and total pressure con¬nections (B) can be connected simultaneously across a manometer (C). Since the static pressure is applied to both sides of the manometer, its effect is cancelled out and the manometer indicates only the velocity pressure.
In practice this type of measurement is usually made with a Pitot tube which incorporates both static and total pressure sensors in a single unit. Essentially, a Pitot tube consists of an impact tube (which receives total pressure input) fastened concentrically inside a second tube of slightly larger diameter which receives static pressure input from radial sensing holes around the tip. The air space between inner and outer tubes permits transfer of pressure from the sensing holes to the static pres¬sure connection at the opposite end of the Pitot and then, through connecting tubing, to the low or negative pressure side of a manometer. When the total pressure tube is connected to the high pres¬sure side of the manometer, velocity pressure is indicated directly.
To ensure accurate velocity pressure readings, the Pitot tube tip must be pointed directly into (parallel with) the air stream. As the Pitot tube tip is parallel with the static pressure outlet tube, the latter can be used as a pointer to align the tip properly. When the Pitot tube is correctly aligned, the pressure indication will be maximum.
Traverse readings: In practical situations, the velocity of the air stream is not uniform across the cross section of a duct. Friction slows the air moving close to the walls, so the velocity is greater in the center of the duct.To obtain the average total velocity in ducts of 100 mm diameter or larger, a series of velocity pressure readings must be taken at points of equal area. A formal pattern of sensing points across the duct cross section is recommended. These are known as traverse readings. Fig 6.6 shows recommended Pitot tube locations for traversing round and rectangular ducts.
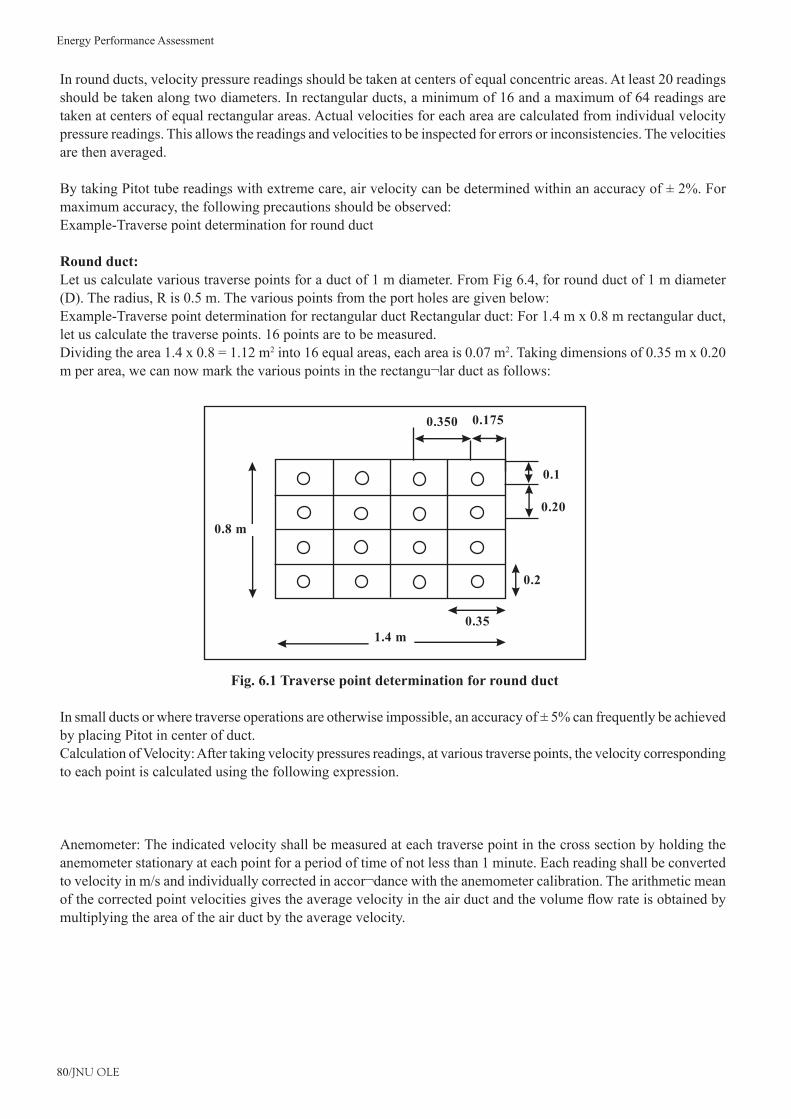
Energy Performance Assessment
80/JNU OLE
In round ducts, velocity pressure readings should be taken at centers of equal concentric areas. At least 20 readings should be taken along two diameters. In rectangular ducts, a minimum of 16 and a maximum of 64 readings are taken at centers of equal rectangular areas. Actual velocities for each area are calculated from individual velocity pressure readings. This allows the readings and velocities to be inspected for errors or inconsistencies. The velocities are then averaged.
BytakingPitottubereadingswithextremecare,airvelocitycanbedeterminedwithinanaccuracyof±2%.Formaximum accuracy, the following precautions should be observed:Example-Traverse point determination for round duct
Round duct: Let us calculate various traverse points for a duct of 1 m diameter. From Fig 6.4, for round duct of 1 m diameter (D). The radius, R is 0.5 m. The various points from the port holes are given below:Example-Traverse point determination for rectangular duct Rectangular duct: For 1.4 m x 0.8 m rectangular duct, let us calculate the traverse points. 16 points are to be measured.Dividing the area 1.4 x 0.8 = 1.12 m2 into 16 equal areas, each area is 0.07 m2. Taking dimensions of 0.35 m x 0.20 m per area, we can now mark the various points in the rectangu¬lar duct as follows:
Fig. 6.1 Traverse point determination for round duct
Insmallductsorwheretraverseoperationsareotherwiseimpossible,anaccuracyof±5%canfrequentlybeachievedby placing Pitot in center of duct.Calculation of Velocity: After taking velocity pressures readings, at various traverse points, the velocity corresponding to each point is calculated using the following expression.
Anemometer: The indicated velocity shall be measured at each traverse point in the cross section by holding the anemometer stationary at each point for a period of time of not less than 1 minute. Each reading shall be converted to velocity in m/s and individually corrected in accor¬dance with the anemometer calibration. The arithmetic mean ofthecorrectedpointvelocitiesgivestheaveragevelocityintheairductandthevolumeflowrateisobtainedbymultiplying the area of the air duct by the average velocity.
0.350 0.175
0.1
0.20
0.2
0.351.4 m
0.8 m
81/JNU OLE
6.6.4 Determination of FlowOncethecross-sectionalareaoftheductismeasured,theflowcanbecalculatedasfollows:Flow, (m3/s) = Area (m2) x Velocity (m/s)
6.6.5 Determination of Fan PressureGeneral: Precautions shall be taken so that the measurements of the static pressure on the inlet and outlet sides of the fan are taken relative to the atmosphere pressure.
Measurement of Static Pressure: This shall be done by using a manometer in conjunction with the static pressure connection of a pitot tube or a U tube manometer.
When using a pitot tube it is necessary to carry out a traverse in the pressure measurement plane taking individual pointpressurereadingsinamannersimilartothatfordeterminingflowrate.Ingeneral,asmallernumberofreadingswillbefoundadequatewhereindividualreadingsdonotvarybymorethan2%fromeachother.Theaverageofall the individual readings shall be taken as the static pressure of that section.
6.6.6 Determination of Power InputPower Measurement: The power measurements can be done using a suitable clamp- on power meter. Alternatively by measuring the amps, voltage and assuming a power factor of 0.9 the power can be calculated as below:
P=√3XVXIXCosΦ
Transmission Systems: The interposition of a transmission system may be unavoidable introducing additional uncertainties. The following valuesshallbeusedasabasisfortransmis¬sionefficiencyinthecaseofdrivesratedat20kWandaboveunlessother reliable information is available:
Other Prime Movers: When the fan forms one unit with a non-electric prime mover it is rec¬ommended that the fuel consumption (oil, steam,compressedairetc.)shouldbespecifiedanddeterminedinplaceoftheoverallpower.

Energy Performance Assessment
82/JNU OLE
SummaryFans have an operating curve given by the manufacturer. These are based on the design. •The fans form part of a system and the system also has its own curve called the system curve. •These two curves are plotted on a common graph and the best operating point for the fan is worked out. •But in practice, process conditions do not remain the same and depending on the situations the fan has to be •operated under different loading conditions. Oncetheoperatingpointgetsshifted,theperformanceofthefanchangesaspertheaffinitylaws.•One of the most important features is attending to leakages in the system. Other measures include proper •maintenance,flowcontrolbythemostappropriatemethod.Fromthesystemcurvesitisclearthatreducingthedamperopeningthefanflowgetsreducedbutthepower•does not reduce in that proportion. Where as if the sameflowcontrol if achieved through speed reduction, the power input also goes down•considerably. HowtomeasureairflowinafanApitottubeisusedtoconvertthevelocityheadintoadifferentialpressure•across the manometer.Thisisconvertedintoaflowbyusingformulae.•
Recommended ReadingFrank Bleier(1997), • Fan Handbook: Selection, Application, and Design, McGraw-Hill Professional; 1 edition, p 640William Cory, • Fans and Ventilation: A practical guide, Elsevier Science; 1 edition, p 424

83/JNU OLE
Self Assessment
A] Fill in the blanks___________pressure is the absolute pressure at a point minus the reference atmospheric pressure.1.
Statica. Dynamicb. Totalc. Fan shaftd.
____________ pressure is the sum of static pressures and dynamic pressures at a point. 2. Statica. Dynamicb. Totalc. Fan shaftd.
_______________pressureistheriseinstaticpressurewhichoccurswhenairmovingwithspecifiedvelocity3. at a point is bought to rest without loss of mechanical energy. It is also known as velocity pressure.
Statica. Dynamicb. Totalc. Fan shaftd.
Theflowmeasurementplaneshallbelocatedwithinthe'testlength'atadistancefromthedownstreamendof4. the 'test length' equal to at least_________.
1.25Dea. 1.35Deb. 1.45Dec. 1.15Ded.
Dynamic pressure is also known as ____________ pressure.5. statica. velocityb. totalc. fan shaftd.
B] True or False
Which of the following is true?6. In practical situations, the velocity of the air stream is uniform across the cross section of a duct.a. In practical situations, the velocity of the air stream is not uniform across the cross section of a duct.b. In practical situations, the velocity of the water stream is not uniform across the cross section of a duct.c. In practical situations, the velocity of the heat stream is not uniform across the cross section of a duct.d.

Energy Performance Assessment
84/JNU OLE
Which of the following is true?7. Friction slows the air moving close to the walls, so the velocity is less at the sides of the duct. a. Friction slows the air moving close to the walls, so the velocity is greater in the centre of the duct. b. Friction slows the air moving close to the walls, so the velocity is less in the centre of the duct. c. Friction slows the air moving close to the walls, so the velocity is greater at the sides of the duct.d.
Which of the following is true?8. Fan shaft power is the mechanical power supplied to the fan shaft a. Motor input power is the mechanical power supplied to the fan shaft b. Dynamic pressure is the mechanical power supplied to the fan shaft c. Total pressure is the mechanical power supplied to the fan shaft d.
Which of the following is true?9. Fan shaft power is the electrical power supplied to the terminals of an electric motor drive.a. Motor input power is the electrical power supplied to the terminals of an electric motor drive.b. Dynamic pressure is the electrical power supplied to the terminals of an electric motor drive.c. Static pressure is the electrical power supplied to the terminals of an electric motor drive.d.
Which of the following is true?10. Static pressure is the absolute pressure at a point minus the reference atmospheric pressure.a. Dynamic pressure is the absolute pressure at a point minus the reference atmospheric pressure.b. Total pressure is the absolute pressure at a point minus the reference atmospheric pressure.c. Fan shaft pressure is the absolute pressure at a point minus the reference atmospheric pressure.d.

85/JNU OLE
Chapter VII
Energy Performance Assessment of Water Pumps
AimThe aim of this chapter is to:
learn various losses in motor and understand how to estimate them •understandperformancetermsanddefinitionsofwaterpumps•analyze effect of rewinding on motors•determinehowpartiallyloadedmotorsconsumemorepowerandarelessefficient•analyzeenergyefficientmotorandlearnhowthelossesinthistypeofmotorarereduced•
ObjectivesThe objective of this chapter is to:
recognizeperformancetermsanddefinitionsofwaterpumps•examine effect of rewinding on motors•learnhowpartiallyloadedmotorsconsumemorepowerandarelessefficient•studyenergyefficientmotorandlearnhowthelossesinthistypeofmotorarereduced•
Learning outcomeAt the end of this chapter students will be able to:
describe various losses in motor and understand how to estimate them •interpretperformancetermsanddefinitionsofwaterpumps•determine effect of rewinding on motors•verifyhowpartiallyloadedmotorsconsumemorepowerandarelessefficient•
Energy Performance Assessment
86/JNU OLE
7.1 IntroductionPumping is the process of addition of kinetic and potential energy to a liquid for the purpose of moving it from onepointtoanother.Thisenergywillcausetheliquidtodoworksuchasflowthroughapipeorrisetoahigherlevel. A centrifugal pump transforms mechanical energy from a rotating impeller into a kinetic and potential energy required by the system.
Themostcriticalaspectofenergyefficiencyinapumpingsystemismatchingofpumpstoloads.Henceevenifanefficientpumpisselected,butifitisamismatchtothesystemthenthepumpwilloperateatverypoorefficiencies.Inadditionefficiencydropcanalsobeexpectedovertimeduetodepositsintheimpellers.Performanceassessmentofpumpswouldrevealtheexistingoperatingefficienciesinordertotakecorrectiveaction.
7.2 Purpose of the Performance TestDeterminationofthepumpefficiencyduringtheoperatingconditionDetermination of system resistance and the operating duty point of the pump and compare the same with design.
7.3 Performance Terms and DefinitionsPump Capacity, Q = Volume of liquid delivered by pump per unit time, m3/hr or m3/sec Q is proportional to N, where N- rotational speed of the pumpTotal developed head, H = the difference of discharge and suction pressureThe pump head represents the net work done on unit weights of a liquid in passing from inlet of the pump to the discharge of the pump.
There are three heads in common use in pumps namely;Static head•Velocity head•Friction head•
Thefrictionalhead inasystemofpipes,valvesandfittingsvariesasa function(roughlyas thesquare)of thecapacityflowthroughthesystem.
System resistance: The sum of frictional head in resistance and total static head.
Pumpefficiency=HydraulicpowerPh X 100 Power input to the pump shaftWhere,Hydraulic power Ph (kW) = Q x (hd - hs) x p x g / 1000
Q=Volumeflowrate(m3/s),p=densityoffluid(kg/m3),g=accelerationduetogravity(m/s2),(hd-hs) = Total head in meters
Pump Efficiency: Fluid power and useful work done by the pump divided by the power input in the pump shaft.
7.4 Field Testing for Determination of Pump EfficiencyTodetermine the pump efficiency, three key parameters are required: Flow,Head andPower.Of these, flowmeasurementisthemostcrucialparameterasnormallyonlineflowmetersarehardlyavailable,inamajorityofpumpingsystem.Thefollowingmethodsoutlinedbelowcanbeadoptedtomeasuretheflowdependingontheavailability and site conditions.
87/JNU OLE
7.4.1 Flow Measurement, QThefollowingarethemethodsforflowmeasurements:
Tracer method BS5857•Ultrasonicflowmeasurement•Tankfillingmethod•Installationofanon-lineflowmeter•
Tracer methodTheTracermethodisparticularlysuitableforcoolingwaterflowmeasurementbecauseof theirsensitivityandaccuracy.This method is based on injecting a tracer into the cooling water for a few minutes at an accurately measured constant rate. A series of samples is extracted from the system at a point where the tracer has become completely mixed with thecoolingwater.Themassflowrateiscalculatedfrom:qcw = q1 x C1/C2 whereqcw=coolingwatermassflowrate,kg/sq1=massflowrateofinjectedtracer,kg/sC1 = concentration of injected tracer, kg/kgC2 = concentration of tracer at downstream position during the 'plateau' period of constant concentration, kg/kgThe tracer normally used is sodium chloride.
Ultrasonic flow meterOperating under Doppler effect principle these meters are non-invasive, meaning measurements can be taken without disturbing the system. Scales and rust in the pipes are likely to impact the accuracy. Ensuremeasurementsaretakeninasufficientlylonglengthofpipefreefromflowdisturbanceduetobends,teesandotherfittings.The pipe section where measurement is to be taken should be hammered gently to enable scales and rusts to fall out.Forbetteraccuracy,asectionofthepipecanbereplacedwithnewpipeforflowmeasurements.
Tank filing methodInopenflowsystemssuchaswatergettingpumpedtoanoverheadtankorasump,theflowcanbemeasuredbynotingthedifferenceintanklevelsforaspecifiedperiodduringwhichtheoutletflowfromthetankisstopped.The internal tank dimensions should be preferable taken from the design drawings, in the absence of which direct measurements may be resorted to.
Installation of an on-line flow meterIf the application to be measured is going to be critical and periodic then the best option would be to install an on-lineflowmeterwhichcangetridofthemajorproblemsencounteredwithothertypes.
7.4.2 Determination of Total Head, HSuction head (hs)This is taken from the pump inlet pressure gauge readings and the value to be converted in to meters (1kg/cm2 = 10. m). If not the level difference between sump water level to the center-line of the pump is to be measured. This gives the suction head in meters.
Discharge head (hd)This is taken from the pump discharge side pressure gauge. Installation of the pressure gauge in the discharge side is a must, if not already available.
7.4.3 Determination of Hydraulic Power (Liquid Horse Power),HydraulicpowerPh(kW)=Qx(hd–hs)xρxg/1000
Energy Performance Assessment
88/JNU OLE
Q=Volumeflowrate(m3/s)ρ=densityofthefluid(kg/m3)g = acceleration due to gravity (m/s2)(hd - hs) = Total head in metres
7.4.4 Measurement of Motor Input PowerThe motor input power Pm can be measured by using a portable power analyser.
7.4.5 Pump Shaft PowerThepumpshaftpowerPsiscalculatedbymultiplyingthemotorinputpowerbymotorefficiencyattheexistingloading.Ps = PmxηMotor
7.4.6 Pump EfficiencyThis is arrived at by dividing the hydraulic power by pump shaft power ηPump=
ExampleofpumpefficiencycalculationIllustration of calculation method outlined.A chemical plant operates a cooling water pump for process cooling and refrigeration applications. During the performance testing the following operating parameters were measured;
Measured data Pumpflow,Q0.40m• 3/ s Power absorbed, P 325 kW •Suction head (Tower basin level), h• 1+1MDelivery head, h• 2 55 M Height of cooling tower 5 M •Motorefficiency88%•Type of drive Direct coupled •Density of water 996 kg/ m• 3
Pump efficiencyFlow delivered by the pump 0.40 m• 3/sTotal head, h• 2–(+h1) 54 MHydraulic power 0.40 x 54 x 996 x 9.81/1000 = 211 kW•Actual power consumption 325 kW•Overallsystemefficiency(211x100)/325=65%•Pumpefficiency65/0.88=74%•
7.5 Determining the System Resistance and Duty Point Determination of the system resistance curve and imposing the pump curve over it will give an idea of the operating efficiencyofthepumpandalsothedropinefficiencieswhenthesystemcurvechangesfromnormal/design.Theexample following from the earlier example outlines the method of constructing a system curve.Example:Location of equipments TheRefrigerationplantislocatedat+0.00levelandtheProcessplantcondensersarelocatedat+15Mlevel.Onecooler having a design pressure drop of 1.9 kg/cm2 is located at the 0.00 level (ground level). Other relevant data can be inferred from the earlier section. See schematic in Fig.7.1.
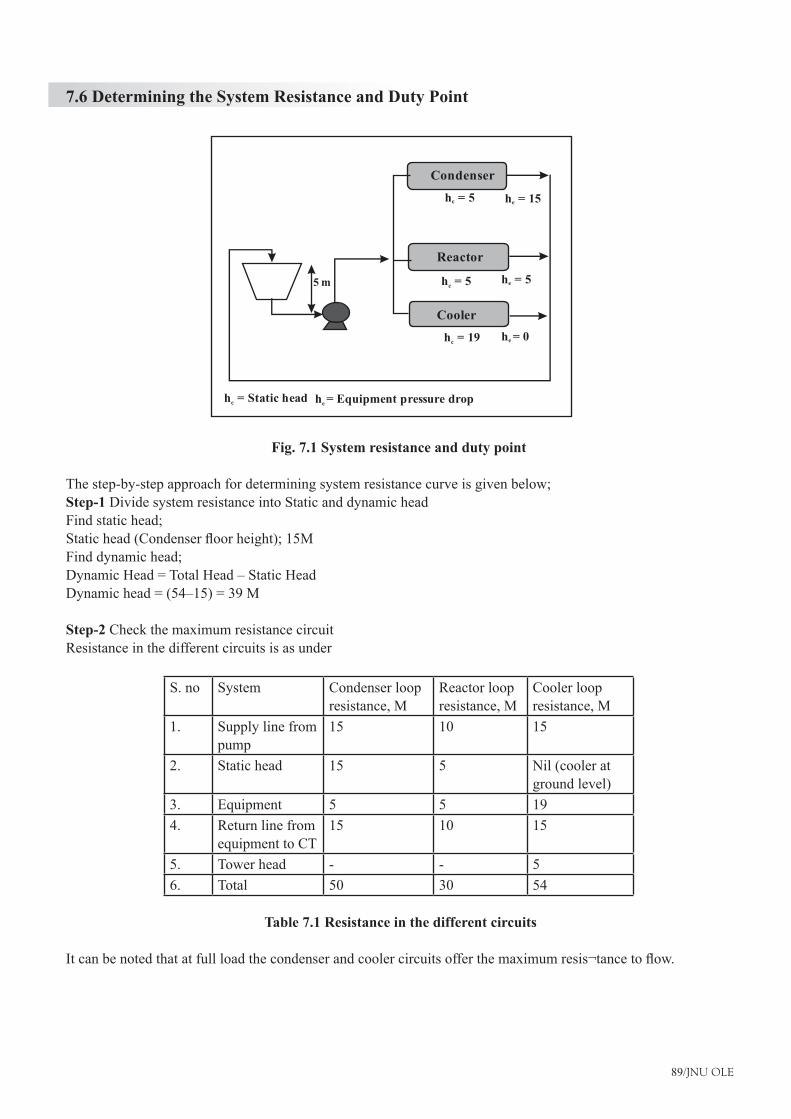
89/JNU OLE
7.6 Determining the System Resistance and Duty Point
Fig. 7.1 System resistance and duty point
The step-by-step approach for determining system resistance curve is given below;Step-1 Divide system resistance into Static and dynamic head Find static head; Statichead(Condenserfloorheight);15MFind dynamic head;DynamicHead=TotalHead–StaticHeadDynamichead=(54–15)=39M
Step-2 Check the maximum resistance circuit Resistance in the different circuits is as under
S. no System Condenser loop resistance, M
Reactor loop resistance, M
Cooler loop resistance, M
1. Supply line from pump
15 10 15
2. Static head 15 5 Nil (cooler at ground level)
3. Equipment 5 5 194. Return line from
equipment to CT15 10 15
5. Tower head - - 56. Total 50 30 54
Table 7.1 Resistance in the different circuits
Itcanbenotedthatatfullloadthecondenserandcoolercircuitsofferthemaximumresis¬tancetoflow.
Cooler
Reactor
Condenser
h = 5c h = 15e
h = 5c
h = 19c
h = 5e
h = 0e
5 m
h = Static headc h = Equipment pressure drope
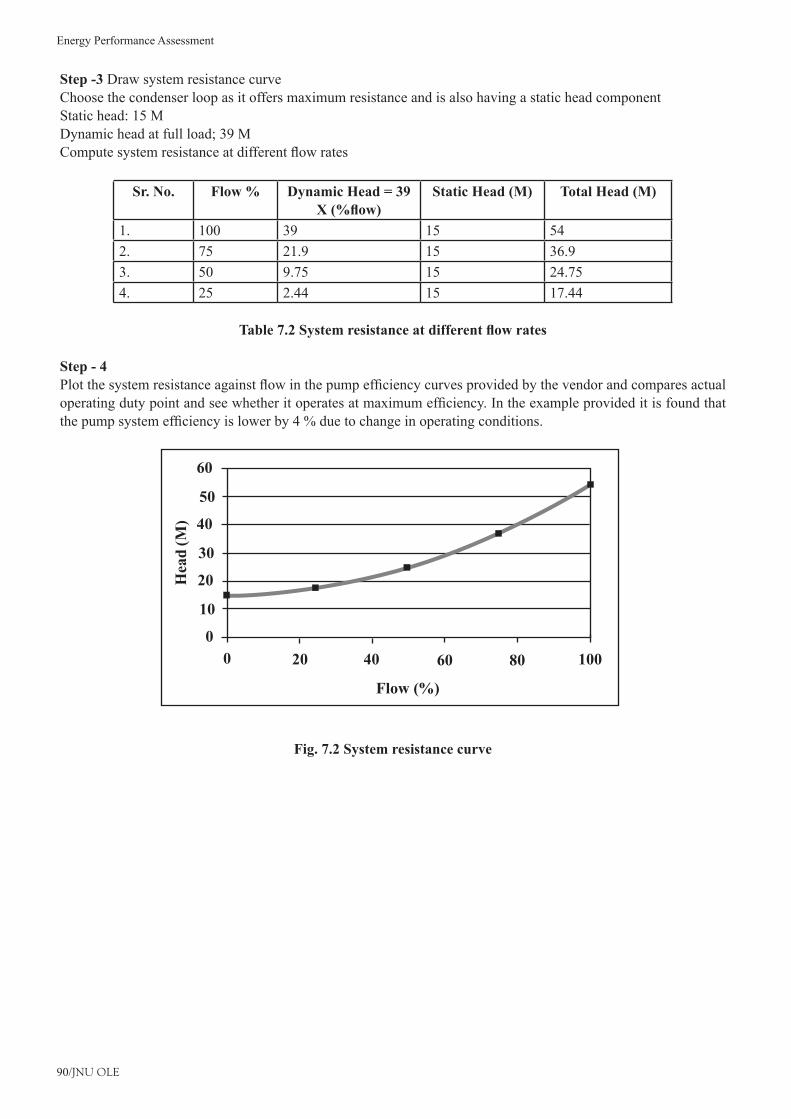
Energy Performance Assessment
90/JNU OLE
Step -3 Draw system resistance curveChoose the condenser loop as it offers maximum resistance and is also having a static head component Static head: 15 M Dynamic head at full load; 39 M Computesystemresistanceatdifferentflowrates
Sr. No. Flow % Dynamic Head = 39 X (%flow)
Static Head (M) Total Head (M)
1. 100 39 15 542. 75 21.9 15 36.93. 50 9.75 15 24.754. 25 2.44 15 17.44
Table 7.2 System resistance at different flow rates
Step - 4 Plotthesystemresistanceagainstflowinthepumpefficiencycurvesprovidedbythevendorandcomparesactualoperatingdutypointandseewhetheritoperatesatmaximumefficiency.Intheexampleprovideditisfoundthatthepumpsystemefficiencyislowerby4%duetochangeinoperatingconditions.
Fig. 7.2 System resistance curve
Flow (%)
0 20 40 600
10
30
40
20
50
60
Hea
d (M
)
80 100

91/JNU OLE
SummaryPumpscanbeclassifiedintotwocategoriesvizcentrifugalandreciprocating.Centrifugalpumpsarenormally•preferredforlowpressureandhighflowrequirementswhereas,reciprocatingpumpsprovidehigherpressureandlowflow.TheaffinitylawsarerelationsbetweenPower,Pressure,FlowandSpeed.•Systemresistanceisanobstructiontoflow.Thisismainlycausedbyvariouscomponentslikepipes,valves,•flanges,bends,etc.Each of them presents resistance in the form of a pressure drop across it and consumes energy. Hence it is •essential to reduce the system resistance to a bare minimum possible.Theflowcanbecontrolledbyvariousmethods.Thebestmethoddependsonthetypeoftheapplicationand•the operating point.Thestrategyshouldbewellplannedsothatmaximumefficiencycanbeachieved.•Many opportunities exist for energy savings in pumping systems.•These include reduction in system resistance, preventing leakages, checking foot valve, impeller trimming, and •speed control.Again speed control can be by pulley change, dual speed motor, variable speed drive, etc.•The best operating point for a pump is the intersection of Pump Performance Curves and the operating •characteristics of the Pump as given by the manufacturer.
Recommended ReadingJames Rishel, • Water Pumps and Pumping Systems , McGraw-Hill Professional; 1 edition, p 912Arthur Williams(2004), • Pumps as Turbines: A User's Guide, Practical Action; 2nd edition, p 80

Energy Performance Assessment
92/JNU OLE
Self Assessment
Fill in the blanks.
Pumping is the process of _________________ of kinetic and potential energy to a liquid for the purpose of 1. moving it from one point to another.
additiona. subtractionb. divisionc. multiplicationd.
Pumpefficiencyisfluidpowerandusefulworkdonebythepumpdividedbythepower__________inthe2. pump shaft.
inputa. outputb. enteredc. producedd.
The_______________isparticularlysuitableforcoolingwaterflowmeasurementbecauseoftheirsensitivity3. and accuracy.
tankfillingmethoda. tracer methodb. pump capacityc. system resistanced.
The tracer normally used is _________________.4. hydrogen chloridea. sodium chlorideb. calcium chloridec. potassium chlorided.
A chemical plant operates a _______________ water pump for process cooling and refrigeration 5. applications.
coolinga. heatingb. boilingc. temperatured.
B] True or FalseWhich of the following is true?6.
A centrifugal pump transforms mechanical energy from a rotating impeller into a thermal and solar energy a. required by the system.A centrifugal pump transforms mechanical energy from a rotating impeller into a kinetic and potential energy b. required by the system.A centrifugal pump adds mechanical energy from a rotating impeller into a kinetic and potential energy c. required by the system.A centrifugal pump transforms thermal energy from a rotating impeller into a kinetic and potential energy d. required by the system.

93/JNU OLE
Which of the following is true?7. The motor output power Pm can be measured by using a portable power analyser.a. The motor input power Pm can be measured by using a portable power analyser.b. The motor input power Pm cannot be measured by using a portable power analyser.c. The motor output power Pm cannot be measured by using a portable power analyser.d.
Which of the following is true?8. The pump head represents the net work done on unit weights of a steam in passing from inlet of the pump a. to the discharge of the pump.The pump head represents the net work done on unit weights of a liquid in passing from outlet of the pump b. to the discharge of the pump.The pump head represents the net work done on unit weights of a steam in passing from inlet of the pump c. to the discharge of the pump.The pump head represents the net work done on unit weights of a liquid in passing from inlet of the pump d. to the discharge of the pump.
Which of the following is true?9. Total developed head, H = the subtraction of discharge and suction pressure.a. Total developed head, H = the multiplication of discharge and suction pressure.b. Total developed head, H = the addition of discharge and suction pressure.c. Total developed head, H = the difference of discharge and suction pressure.d.
Which of the following is true?10. Pumpefficiency=fluidpowerandusefulworkdonebythepumpsubtractedbythepowerinputinthepumpa. shaft.Pumpefficiency=fluidpowerandusefulworkdonebythepumpaddedbythepowerinputinthepumpb. shaft.Pumpefficiency=fluidpowerandusefulworkdonebythepumpdividedbythepowerinputinthepumpc. shaft.Pumpefficiency=fluidpowerandusefulworkdonebythepumpmultipliedbythepowerinputinthepumpd. shaft.

Energy Performance Assessment
94/JNU OLE
Chapter VIII
Energy Performance Assessment of Compressors
AimThe aim of this chapter is to:
understand purpose of the performance test of compressor•analyzeperformancetermsanddefinitionsofcompressor•recognizeconceptoffieldtesting•identify calculation procedure for nozzle method•
ObjectivesThe objective of this chapter is to:
recognize purpose of the performance test of compressor•examineperformancetermsanddefinitionsofcompressor•identifyconceptoffieldtesting•
Learning outcomeAt the end of this chapter students will be able to:
describeperformancetermsanddefinitionsofcompressor•recognizeconceptoffieldtesting•identify calculation procedure for nozzle method •
95/JNU OLE
8.1 IntroductionThecompressedairsystemisnotonlyanenergyintensiveutilitybutalsooneoftheleastenergyefficient.Overa period of time, both performance of compressors and compressed air system reduces drastically. The causes are many such as poor maintenance, wear and tear etc. All these lead to additional compressors installations leading to moreinefficiency.Aperiodicperformanceassessmentisessentialtominimizethecostofcompressedair.
8.2 Purpose of the Performance TestPurpose of the Performance Test is tofindoutthefollowing:
Actual Free Air Delivery (FAD) of the compressor•Isothermal power required•Volumetricefficiency•Specificpowerrequirement•
The actual performance of the plant is to be compared with design / standard values for assessing the plant energy efficiency.
8.3 Performance Terms and DefinitionsCompression ratio: Absolute discharge pressure of last stageIsothermal power:
It is the least power required to compress the air assuming isothermal conditions. •Isothermal efficiency:
The ratio of Isothermal power to shaft power •Volumetric efficiency:
The ratio of free air delivered to compressor swept volume •Specific power requirement:
The ratio of power consumption (in kW) to the volume delivered at ambient conditions.•
8.4 Field Testing8.4.1 Measurement of Free Air Delivery (FAD) by Nozzle methodPrinciple: If specially shaped nozzle discharge air to the atmosphere from a receiver getting its supply from a compressor, sonic flowconditionssetsinatthenozzlethroatforaparticularratioofupstreampressure(receiver)tothedownstreampressure (atmospheric) i.e. Mach number equals one. Whenthepressureinthereceiveriskeptconstantforreasonableintervalsoftime,theairflowoutputofthecompressoris equal to that of the nozzle and can be calculated from the known characteristic of the nozzle.
8.4.2 Arrangement of Test EquipmentThearrangementoftestequipmentandmeasuringdeviceshallconfirmtoFig.8.1.
8.4.3 Nozzle Sizes The following sizes of nozzles are recommended for the range of capacities indicated below:
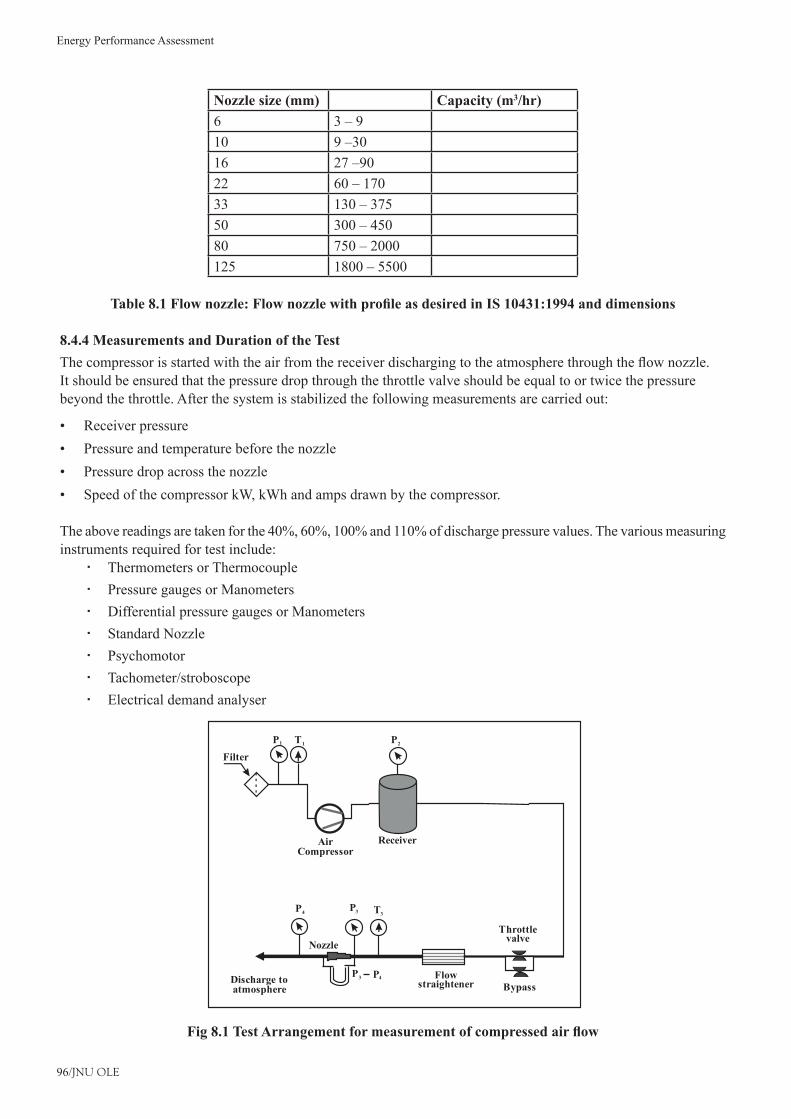
Energy Performance Assessment
96/JNU OLE
Nozzle size (mm) Capacity (m3/hr)6 3–910 9–3016 27–9022 60–17033 130–37550 300–45080 750–2000125 1800–5500
Table 8.1 Flow nozzle: Flow nozzle with profile as desired in IS 10431:1994 and dimensions
8.4.4 Measurements and Duration of the TestThecompressorisstartedwiththeairfromthereceiverdischargingtotheatmospherethroughtheflownozzle.It should be ensured that the pressure drop through the throttle valve should be equal to or twice the pressure beyond the throttle. After the system is stabilized the following measurements are carried out:
Receiver pressure •Pressure and temperature before the nozzle •Pressure drop across the nozzle •Speed of the compressor kW, kWh and amps drawn by the compressor. •
Theabovereadingsaretakenforthe40%,60%,100%and110%ofdischargepressurevalues.Thevariousmeasuringinstruments required for test include:
Thermometers or Thermocouple �Pressure gauges or Manometers �Differential pressure gauges or Manometers �Standard Nozzle �Psychomotor �Tachometer/stroboscope �Electrical demand analyser �
Fig 8.1 Test Arrangement for measurement of compressed air flow
Flow straightenerDischarge to
atmosphere
Nozzle
P4
P3
T3P3
P4
Throttlevalve
ReceiverAir Compressor
Bypass
FilterP1 T1 P 2
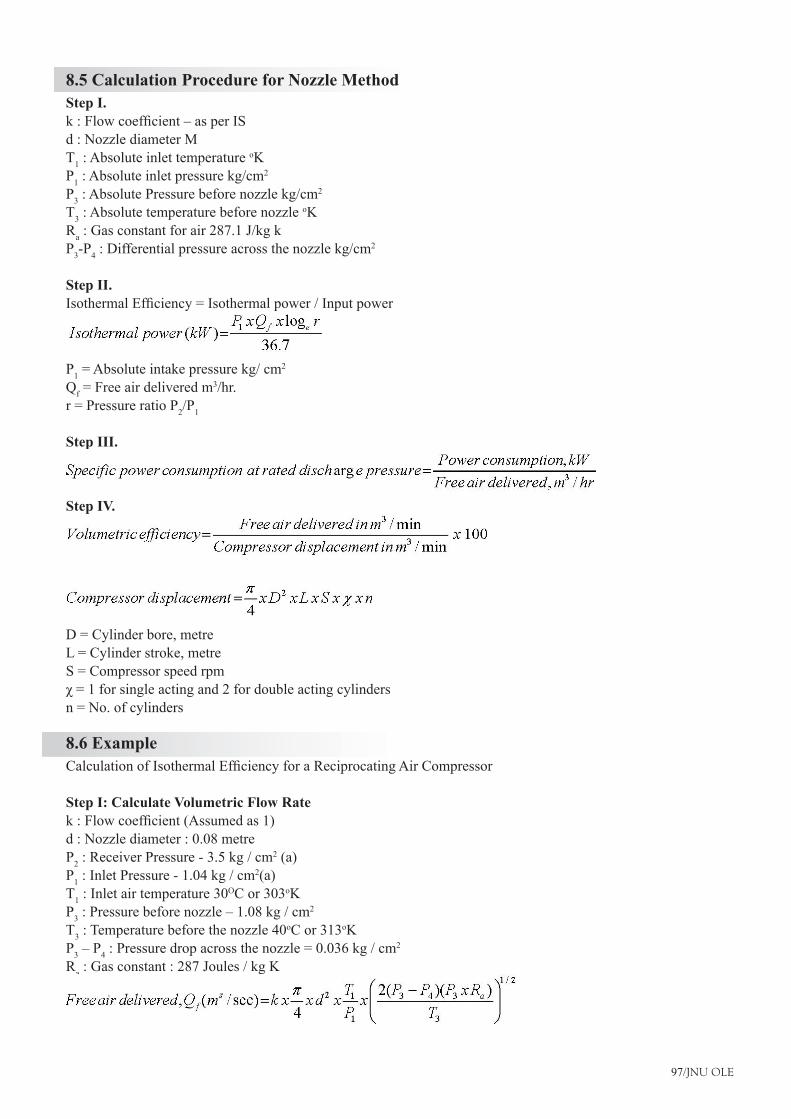
97/JNU OLE
8.5 Calculation Procedure for Nozzle Method Step I.k:Flowcoefficient–asperISd : Nozzle diameter M T1 : Absolute inlet temperature oK P1 : Absolute inlet pressure kg/cm2
P3 : Absolute Pressure before nozzle kg/cm2
T3 : Absolute temperature before nozzle oK Ra : Gas constant for air 287.1 J/kg k P3-P4 : Differential pressure across the nozzle kg/cm2
Step II.IsothermalEfficiency=Isothermalpower/Inputpower
P1 = Absolute intake pressure kg/ cm2
Qf = Free air delivered m3/hr. r = Pressure ratio P2/P1
Step III.
Step IV.
D = Cylinder bore, metre L = Cylinder stroke, metre S = Compressor speed rpm χ=1forsingleactingand2fordoubleactingcylindersn = No. of cylinders
8.6 Example CalculationofIsothermalEfficiencyforaReciprocatingAirCompressor
Step I: Calculate Volumetric Flow Rate k:Flowcoefficient(Assumedas1)d : Nozzle diameter : 0.08 metre P2 : Receiver Pressure - 3.5 kg / cm2 (a) P1 : Inlet Pressure - 1.04 kg / cm2(a)T1 : Inlet air temperature 30OC or 303oK P3:Pressurebeforenozzle–1.08kg/cm
2 T3 : Temperature before the nozzle 40oC or 313oK P3–P4 : Pressure drop across the nozzle = 0.036 kg / cm2 Ra : Gas constant : 287 Joules / kg K
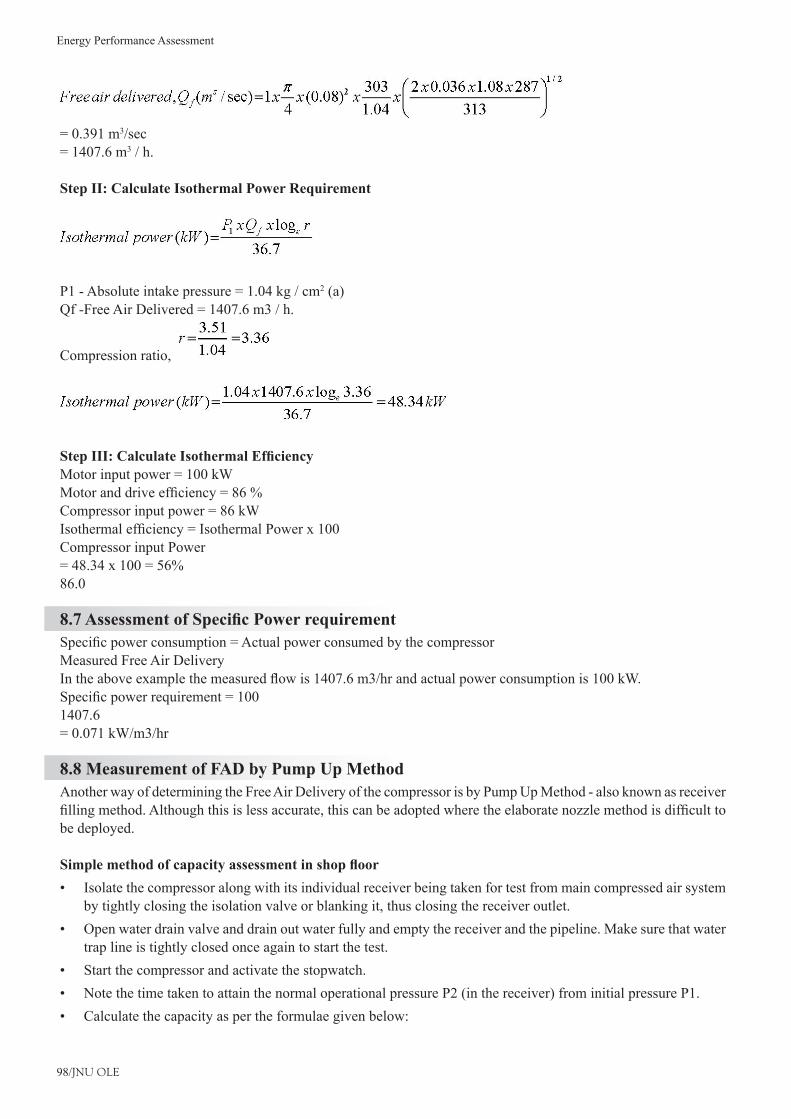
Energy Performance Assessment
98/JNU OLE
= 0.391 m3/sec = 1407.6 m3 / h.
Step II: Calculate Isothermal Power Requirement
P1 - Absolute intake pressure = 1.04 kg / cm2 (a) Qf -Free Air Delivered = 1407.6 m3 / h.
Compression ratio,
Step III: Calculate Isothermal Efficiency Motor input power = 100 kWMotoranddriveefficiency=86%Compressor input power = 86 kWIsothermalefficiency=IsothermalPowerx100Compressor input Power=48.34x100=56%86.0
8.7 Assessment of Specific Power requirement Specificpowerconsumption=ActualpowerconsumedbythecompressorMeasured Free Air Delivery Intheaboveexamplethemeasuredflowis1407.6m3/hrandactualpowerconsumptionis100kW.Specificpowerrequirement=1001407.6 = 0.071 kW/m3/hr
8.8 Measurement of FAD by Pump Up Method Another way of determining the Free Air Delivery of the compressor is by Pump Up Method - also known as receiver fillingmethod.Althoughthisislessaccurate,thiscanbeadoptedwheretheelaboratenozzlemethodisdifficulttobe deployed.
Simple method of capacity assessment in shop floor Isolate the compressor along with its individual receiver being taken for test from main compressed air system •by tightly closing the isolation valve or blanking it, thus closing the receiver outlet. Open water drain valve and drain out water fully and empty the receiver and the pipeline. Make sure that water •trap line is tightly closed once again to start the test. Start the compressor and activate the stopwatch. •Note the time taken to attain the normal operational pressure P2 (in the receiver) from initial pressure P1. •Calculate the capacity as per the formulae given below: •
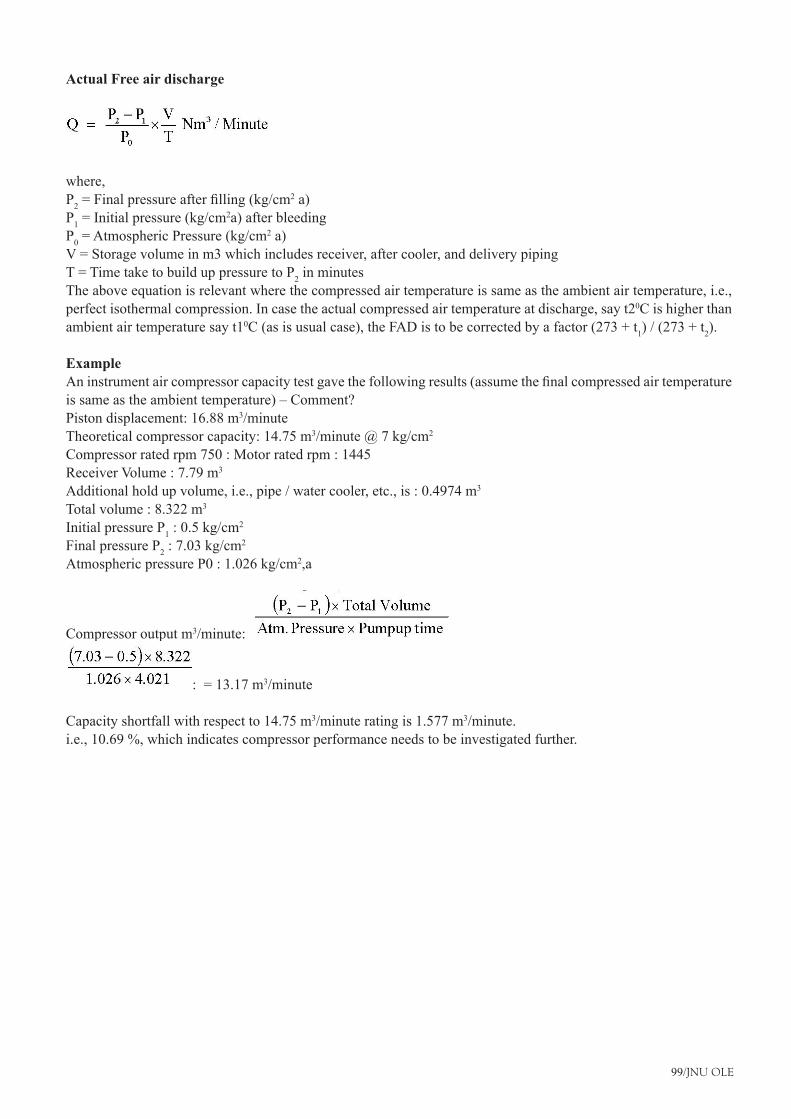
99/JNU OLE
Actual Free air discharge
where,P2=Finalpressureafterfilling(kg/cm
2 a) P1 = Initial pressure (kg/cm2a) after bleeding P0 = Atmospheric Pressure (kg/cm2 a) V = Storage volume in m3 which includes receiver, after cooler, and delivery piping T = Time take to build up pressure to P2 in minutes The above equation is relevant where the compressed air temperature is same as the ambient air temperature, i.e., perfect isothermal compression. In case the actual compressed air temperature at discharge, say t20C is higher than ambient air temperature say t10C(asisusualcase),theFADistobecorrectedbyafactor(273+t1)/(273+t2).
ExampleAninstrumentaircompressorcapacitytestgavethefollowingresults(assumethefinalcompressedairtemperatureissameastheambienttemperature)–Comment?Piston displacement: 16.88 m3/minute Theoretical compressor capacity: 14.75 m3/minute @ 7 kg/cm2
Compressor rated rpm 750 : Motor rated rpm : 1445 Receiver Volume : 7.79 m3
Additional hold up volume, i.e., pipe / water cooler, etc., is : 0.4974 m3
Total volume : 8.322 m3
Initial pressure P1 : 0.5 kg/cm2 Final pressure P2 : 7.03 kg/cm2 Atmospheric pressure P0 : 1.026 kg/cm2,a
Compressor output m3/minute:
: = 13.17 m3/minute
Capacity shortfall with respect to 14.75 m3/minute rating is 1.577 m3/minute.i.e.,10.69%,whichindicatescompressorperformanceneedstobeinvestigatedfurther.

Energy Performance Assessment
100/JNU OLE
SummaryCompressed air is the costliest utility and hence wastage of this air is very expensive. Not only this, it should •be used only when necessary and for proper application. Its cost also depends on the investment done in the compressor.Hence the cost of compressed air depends on the compressor that produces the compressed utility and hence •the utilization should be very judicious. Butplantutilitycompressedairiscostlierthanthatproducedfromagaragecompressor.Henceforfillingair•into vehicles which is a lower end application compressed air only from a garage compressor should be used. Thevariouscomponentssuchasfilters,regulator,lubricator,pressuregauge,moisturetrapandpipingform•various components of the compressed air system. The performance of each of them does affect the overall performance of the system. •The leakage test gives an idea about the load and no load timings and performance of the compressor. •The utilization points of the compressed air are completely shut off and the compressor is started. •Slowly the receiver tank starts building up the pressure. As soon as a preset value of pressure is reached, the •compressor goes into unload operation. This running time is noted. After meeting all the requirements of leakages, slowly the receiver pressure drops •and again at lower pressure the compressor comes into load operation. Thistimeisnotedasunloadperiod.Fromthesevalues,thespecificenergyconsumptioncanbeworkedoutby•noting electrical consumption in both cases. In load and unload operation, the motor continues to run whereas the compressor does not deliver the output. •In on/off operation, the motor itself is switched off. In olden days when soft starters were not available, the starting and stopping of a motor used to be more expensive •from the motor life point of view. But with the advent of the soft starter and the cost of no load consumption also becoming appreciable, most of •the installations prefer on/off operation.However,where the capacity is too small and retrofitting cost is high, still load and unload operation is•continued. The soft starter is a device which starts the motor smoothly and controls the starting current of a motor.•It can be programmed to suit the requirements of the end user. There are two types of soft starters. •One is without energy saving feature which is useful only in starting. The other with the energy saving feature •which is useful in starting as well as in running.
Recommended ReadingBloch, • Calculation Procedure for Nozzle Method, Wiley-Interscience; 2 edition, p 590Royce Brown, • Compressors, Third Edition: Selection and Sizing , Gulf Professional Publishing; 3 edition, p640Anthony Giampaolo, • Compressor Handbook: Principles and Practice, CRC Press; 1 edition, p300
101/JNU OLE
Self Assessment
A] Fill in the blanksA periodic performance assessment is essential to _________________the cost of compressed air. 1.
minimizea. maximizeb. reducec. exploitd.
Another way of determining the Free Air Delivery of the compressor is by Pump Up Method - also known as 2. ____________________.
senderfillingmethoda. receiverfillingmethodb. receiverrefillingmethodc. senderrefillingmethodd.
The compressed air system is not only an ____________intensive utility but also one of the least energy 3. efficient.
energya. heat b. temperaturec. powerd.
Thecompressoris___________withtheairfromthereceiverdischargingtotheatmospherethroughtheflow4. nozzle.
starteda. stoppedb. pausedc. closedd.
It should be ensured that the pressure drop through the throttle valve should be ________________the pressure 5. beyond the throttle.
equal to or thricea. equal to or twiceb. equalc. twiced.
B] True or False
Which of the following is true?6. Thecompressorisstartedwiththesteamfromthereceiverdischargingtotheatmospherethroughtheflowa. nozzle.Thecompressorisstartedwiththeairfromthereceiverdischargingtotheatmospherethroughtheflowb. nozzle.Thecompressorisstartedwiththeheatfromthereceiverdischargingtotheatmospherethroughtheflowc. nozzle.Thecompressorisstartedwiththeenergyfromthereceiverdischargingtotheatmospherethroughtheflowd. nozzle.

Energy Performance Assessment
102/JNU OLE
Which of the following is true?7. Whenthepressureinthereceiveriskeptirregularforreasonableintervalsoftime,theairflowoutputofa. the compressor is equal to that of the nozzle and can be calculated from the known characteristic of the nozzle. Whenthepressureinthereceiveriskeptconstantforreasonableintervalsoftime,theairflowoutputofb. the compressor is equal to that of the nozzle and can be calculated from the known characteristic of the nozzle. Whenthepressureinthereceiveriskeptconstantforreasonableintervalsoftime,thesteamflowoutputc. of the compressor is equal to that of the nozzle and can be calculated from the known characteristic of the nozzle. Whenthepressureinthereceiveriskeptconstantforreasonableintervalsoftime,thesteamflowoutputd. of the compressor is not equal to that of the nozzle and can be calculated from the known characteristic of the nozzle.
Which of the following is true?8. Thecompressorisstartedwiththeairfromthereceiverdischargingtotheatmospherethroughtheflowa. nozzle.Thecompressorisstoppedwiththeairfromthereceiverdischargingtotheatmospherethroughtheflowb. nozzle.Thecompressorisstartedwiththesteamfromthereceiverdischargingtotheatmospherethroughtheflowc. nozzle.Thecompressorisstartedwiththeheatfromthereceiverdischargingtotheatmospherethroughtheflowd. nozzle.
Which of the following is true?9. A periodic performance assessment is essential to exploit the cost of compressed air. a. A periodic performance assessment is essential to reduce the cost of compressed air. b. A periodic performance assessment is essential to maximize the cost of compressed air. c. A periodic performance assessment is essential to minimize the cost of compressed air. d.
Which of the following is true?10. It should be ensured that the pressure drop through the throttle valve should be equal to or twice the pressure a. beyond the throttle.It should be ensured that the pressure drop through the throttle valve should be equal to or thrice the pressure b. beyond the throttle.It should be ensured that the pressure drop through the throttle valve should be equal the pressure beyond c. the throttle.It should be ensured that the pressure drop through the throttle valve should be twice the pressure beyond d. the throttle.

103/JNU OLE
Chapter IX
Energy Performance Assessment of HVAC Systems
AimThe aim of this chapter is to:
recognize purpose of the performance test•understandperformancetermsanddefinitionsofHvacSystems•understand various parameters, particularly COP in the HVAC system •identify various tests to be conducted while assessing the performance of the HVAC system •classify energy saving opportunities in HVAC system•
ObjectivesThe objective of this chapter is to:
distinguish purpose of the performance test•recognizeperformancetermsanddefinitionsofHvacSystems•identify various parameters, particularly COP in the HVAC system •classify various tests to be conducted while assessing the performance of the HVAC system •
Learning outcomeAt the end of this chapter students will be able to:
interpretperformancetermsanddefinitionsofHvacSystems•describe various parameters, particularly COP in the HVAC system •describe various tests to be conducted while assessing the performance of the HVAC system •classify energy saving opportunities in HVAC system•
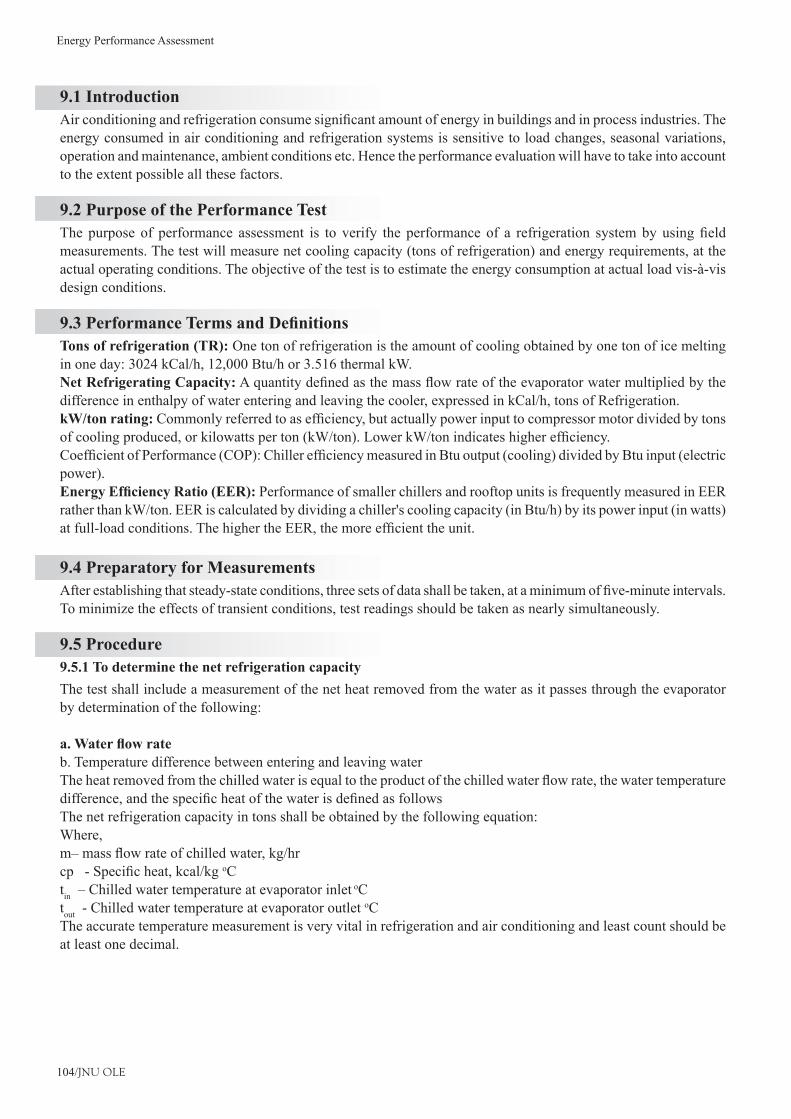
Energy Performance Assessment
104/JNU OLE
9.1 IntroductionAirconditioningandrefrigerationconsumesignificantamountofenergyinbuildingsandinprocessindustries.Theenergy consumed in air conditioning and refrigeration systems is sensitive to load changes, seasonal variations, operation and maintenance, ambient conditions etc. Hence the performance evaluation will have to take into account to the extent possible all these factors.
9.2 Purpose of the Performance Test Thepurpose of performance assessment is to verify the performance of a refrigeration systembyusingfieldmeasurements. The test will measure net cooling capacity (tons of refrigeration) and energy requirements, at the actual operating conditions. The objective of the test is to estimate the energy consumption at actual load vis-à-vis design conditions.
9.3 Performance Terms and Definitions Tons of refrigeration (TR): One ton of refrigeration is the amount of cooling obtained by one ton of ice melting in one day: 3024 kCal/h, 12,000 Btu/h or 3.516 thermal kW.Net Refrigerating Capacity:Aquantitydefinedasthemassflowrateoftheevaporatorwatermultipliedbythedifference in enthalpy of water entering and leaving the cooler, expressed in kCal/h, tons of Refrigeration. kW/ton rating:Commonlyreferredtoasefficiency,butactuallypowerinputtocompressormotordividedbytonsofcoolingproduced,orkilowattsperton(kW/ton).LowerkW/tonindicateshigherefficiency.CoefficientofPerformance(COP):ChillerefficiencymeasuredinBtuoutput(cooling)dividedbyBtuinput(electricpower). Energy Efficiency Ratio (EER): Performance of smaller chillers and rooftop units is frequently measured in EER rather than kW/ton. EER is calculated by dividing a chiller's cooling capacity (in Btu/h) by its power input (in watts) atfull-loadconditions.ThehighertheEER,themoreefficienttheunit.
9.4 Preparatory for Measurements Afterestablishingthatsteady-stateconditions,threesetsofdatashallbetaken,ataminimumoffive-minuteintervals.To minimize the effects of transient conditions, test readings should be taken as nearly simultaneously.
9.5 Procedure 9.5.1 To determine the net refrigeration capacityThe test shall include a measurement of the net heat removed from the water as it passes through the evaporator by determination of the following:
a. Water flow rate b. Temperature difference between entering and leaving water Theheatremovedfromthechilledwaterisequaltotheproductofthechilledwaterflowrate,thewatertemperaturedifference,andthespecificheatofthewaterisdefinedasfollowsThe net refrigeration capacity in tons shall be obtained by the following equation: Where,m–massflowrateofchilledwater,kg/hrcp-Specificheat,kcal/kgoC tin–Chilledwatertemperatureatevaporatorinlet
oC tout - Chilled water temperature at evaporator outlet oC The accurate temperature measurement is very vital in refrigeration and air conditioning and least count should be at least one decimal.
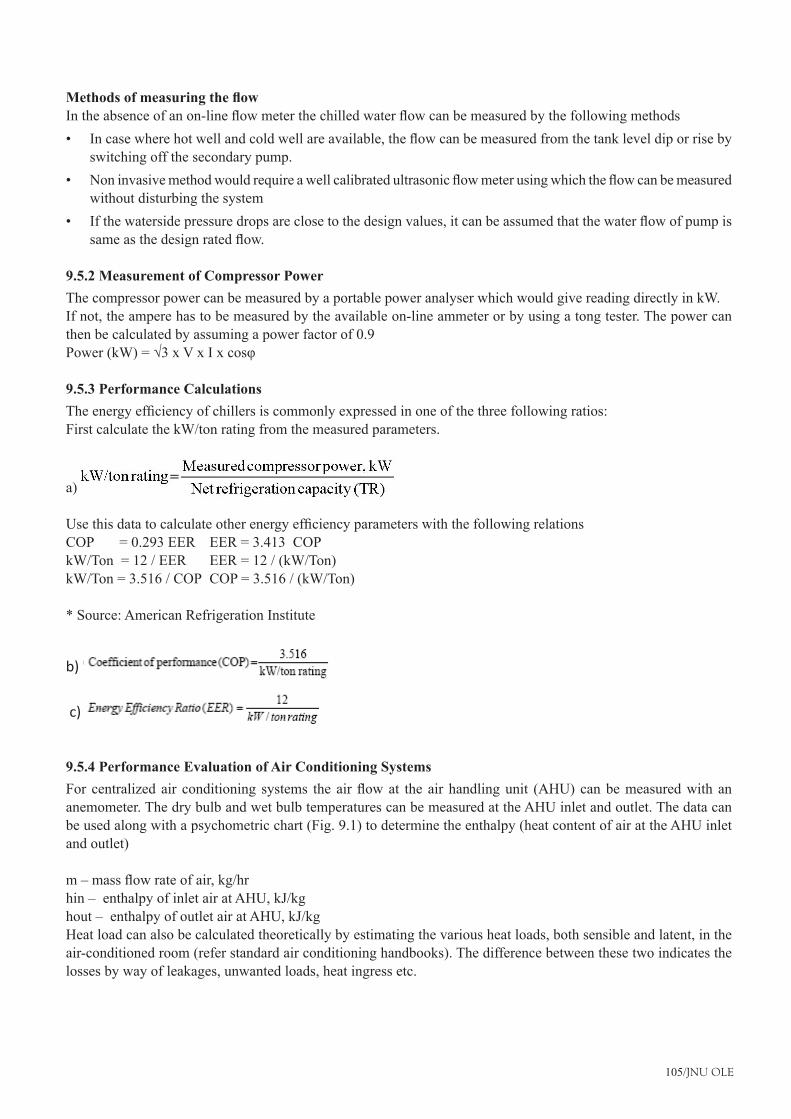
105/JNU OLE
Methods of measuring the flow Intheabsenceofanon-lineflowmeterthechilledwaterflowcanbemeasuredbythefollowingmethods
Incasewherehotwellandcoldwellareavailable,theflowcanbemeasuredfromthetankleveldiporriseby•switching off the secondary pump. Noninvasivemethodwouldrequireawellcalibratedultrasonicflowmeterusingwhichtheflowcanbemeasured•without disturbing the system Ifthewatersidepressuredropsareclosetothedesignvalues,itcanbeassumedthatthewaterflowofpumpis•sameasthedesignratedflow.
9.5.2 Measurement of Compressor Power The compressor power can be measured by a portable power analyser which would give reading directly in kW. If not, the ampere has to be measured by the available on-line ammeter or by using a tong tester. The power can then be calculated by assuming a power factor of 0.9 Power(kW)=√3xVxIxcosφ
9.5.3 Performance CalculationsTheenergyefficiencyofchillersiscommonlyexpressedinoneofthethreefollowingratios:First calculate the kW/ton rating from the measured parameters.
a) UsethisdatatocalculateotherenergyefficiencyparameterswiththefollowingrelationsCOP = 0.293 EER EER = 3.413 COP kW/Ton = 12 / EER EER = 12 / (kW/Ton) kW/Ton = 3.516 / COP COP = 3.516 / (kW/Ton)
* Source: American Refrigeration Institute
b)
c)
9.5.4 Performance Evaluation of Air Conditioning SystemsFor centralizedair conditioning systems the airflowat the air handlingunit (AHU)canbemeasuredwith ananemometer. The dry bulb and wet bulb temperatures can be measured at the AHU inlet and outlet. The data can be used along with a psychometric chart (Fig. 9.1) to determine the enthalpy (heat content of air at the AHU inlet and outlet)
m–massflowrateofair,kg/hrhin–enthalpyofinletairatAHU,kJ/kghout–enthalpyofoutletairatAHU,kJ/kgHeat load can also be calculated theoretically by estimating the various heat loads, both sensible and latent, in the air-conditioned room (refer standard air conditioning handbooks). The difference between these two indicates the losses by way of leakages, unwanted loads, heat ingress etc.
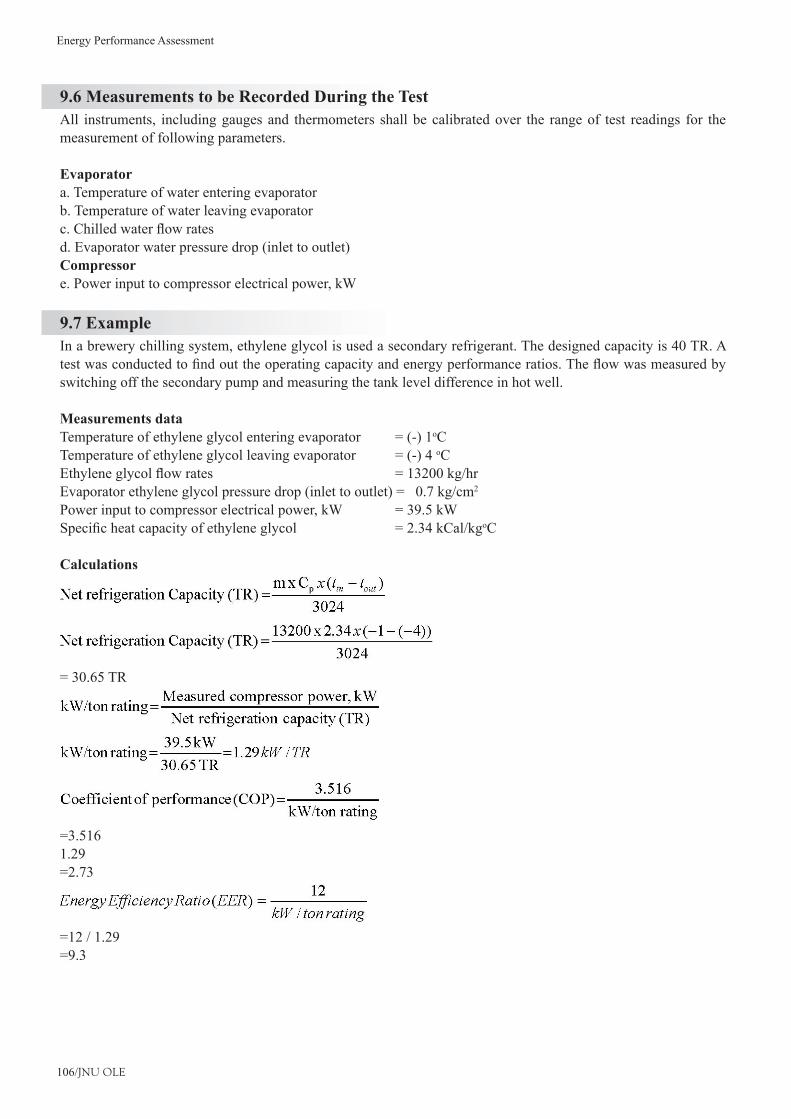
Energy Performance Assessment
106/JNU OLE
9.6 Measurements to be Recorded During the TestAll instruments, including gauges and thermometers shall be calibrated over the range of test readings for the measurement of following parameters.
Evaporatora. Temperature of water entering evaporatorb. Temperature of water leaving evaporator c.Chilledwaterflowratesd. Evaporator water pressure drop (inlet to outlet) Compressore. Power input to compressor electrical power, kW
9.7 ExampleIn a brewery chilling system, ethylene glycol is used a secondary refrigerant. The designed capacity is 40 TR. A testwasconductedtofindouttheoperatingcapacityandenergyperformanceratios.Theflowwasmeasuredbyswitching off the secondary pump and measuring the tank level difference in hot well.
Measurements dataTemperature of ethylene glycol entering evaporator = (-) 1oC Temperature of ethylene glycol leaving evaporator = (-) 4 oC Ethyleneglycolflowrates =13200kg/hrEvaporator ethylene glycol pressure drop (inlet to outlet) = 0.7 kg/cm2 Power input to compressor electrical power, kW = 39.5 kW Specificheatcapacityofethyleneglycol =2.34kCal/kgoC
Calculations
= 30.65 TR
=3.5161.29 =2.73
=12 / 1.29 =9.3

107/JNU OLE
SummaryTR is a measure of refrigeration capacity.•One TR means heat rate that will melt one ton of ice in 24 Hours. Remember this ton is the short ton and not •the metric tonne. Thus 1 TR means 3024 kCal/Hr.Various types of refrigeration systems and refrigerant used. These are vapour Compression Refrigeration, •Absorption Refrigeration.EnergyEfficiencyopportunitiesinthesetypesofsystems.Theenergyefficiencyofsuchsystemsdependsalot•on the refrigerant used, leakages in the system, type and quality of insulation, etc. Each of them presents a number of ways and opportunities in energy savings.•COP is coefficient of Performance. It is the ratio of the cooling effect inKW to thePower Input to the•Compressor.
Recommended ReadingWilliam Bobenhausen, • Simplified Design of HVAC Systems, Wiley-Interscience; 1 edition, p 448David W. Bearg, • Indoor Air Quality and HVAC Systems, CRC Press; 1 edition, p 240Robert McDowall, • Fundamentals of HVAC Systems: SI Edition Hardbound Book, Elsevier Science; SI Ed edition, p 240

Energy Performance Assessment
108/JNU OLE
Self Assessment
A] Fill in the blanksAirconditioningandrefrigerationconsumesignificantamountof_____________inbuildingsandinprocess1. industries.
energya. heatb. temperaturec. fueld.
One ton of refrigeration is the amount of cooling obtained by one ton of ice melting in one day:_____________, 2. 12,000 Btu/h or 3.516 thermal kW.
3034 kCal/ha. 3024 kCal/hb. 3084 kCal/hc. 3054 kCal/hd.
A_____________definedasthemassflowrateoftheevaporatorwatermultipliedbythedifferenceinenthalpy3. of water entering and leaving the cooler, expressed in kCal/h, tons of Refrigeration.
qualitya. quantityb. amountc. valued.
CoefficientofPerformance(COP)=ChillerefficiencymeasuredinBtuoutput(cooling)_______________4. Btu input (electric power).
multiplied bya. divided byb. subtracted byc. added tod.
The compressor ___________can be measured by a portable power analyser which would give reading directly 5. in kW.
energya. heatb. powerc. pressured.
Power(kW)=√3xVxIxcosφ6. √2a. √3b. √4c. √5d.

109/JNU OLE
Performance of smaller chillers and rooftop units is frequently measured in ________ ..7. EERa. kCalb. kW/tonc. COPd.
_________commonlyreferredtoasefficiency,butactuallypowerinputtocompressormotordividedbytons8. of cooling produced, or kilowatts per ton (kW/ton)
EERa. kCalb. kW/ton ratingc. COPd.
Chillerefficiencymeasuredin__________output(cooling)dividedbyBtuinput(electricpower).9. Btua. kCalb. kW/ton ratingc. COPd.
Incasewherehotwellandcoldwellareavailable,theflowcanbemeasuredfromthetankleveldiporriseby10. switching off the __________ pump.
geara. secondryb. tertiaryc. compresord.

Energy Performance Assessment
110/JNU OLE
Chapter X
Energy Performance Assessment of Lighting Systems
AimThe aim of this chapter is to:
recognize purpose of the performance test•understandperformancetermsanddefinitionsofHvacSystems•identify the various types of illumination systems •know how to assess the performance of an Illumination System •recognize the various opportunities for energy savings in illumination systems•
ObjectivesThe objective of this chapter is to:
knowperformancetermsanddefinitionsofHvacSystems•recognize the various types of illumination systems •discriminate how to assess the performance of an Illumination System •be familiar with the various opportunities for energy savings in illumination systems•
Learning outcomeAt the end of this chapter students will be able to:
recognize purpose of the performance test•interpretperformancetermsanddefinitionsofHvacSystems•classify the various types of illumination systems •
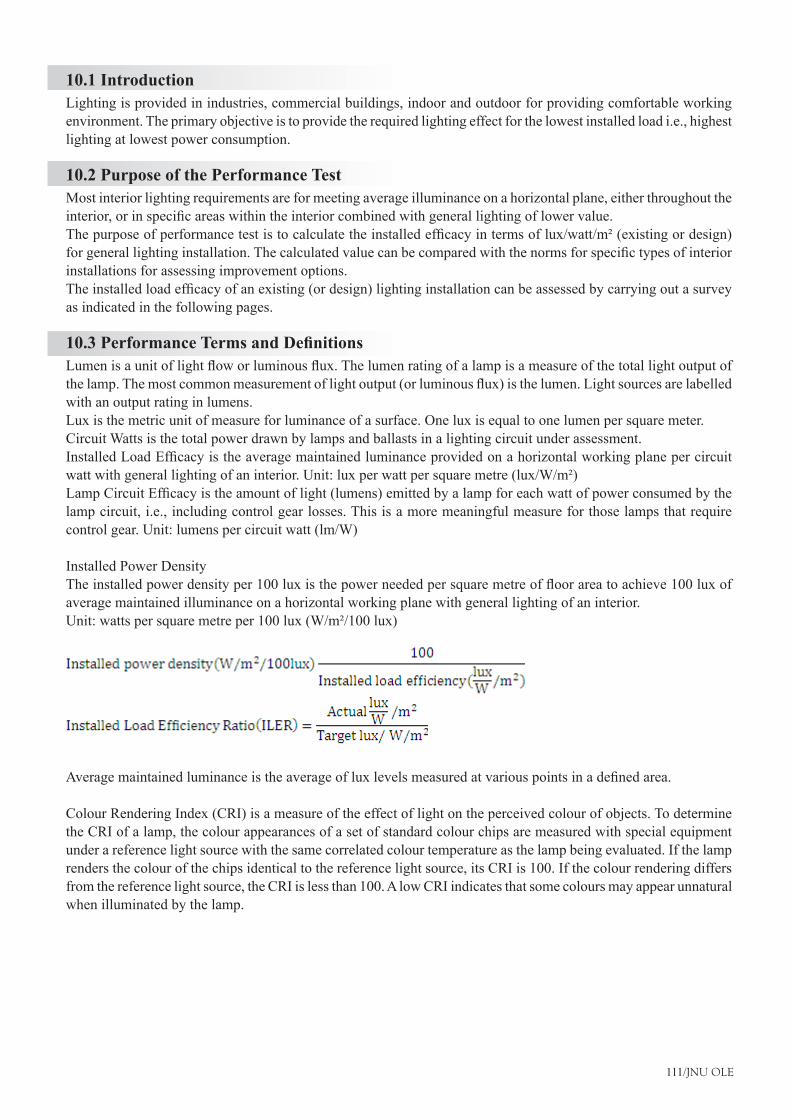
111/JNU OLE
10.1 Introduction Lighting is provided in industries, commercial buildings, indoor and outdoor for providing comfortable working environment. The primary objective is to provide the required lighting effect for the lowest installed load i.e., highest lighting at lowest power consumption.
10.2 Purpose of the Performance Test Most interior lighting requirements are for meeting average illuminance on a horizontal plane, either throughout the interior,orinspecificareaswithintheinteriorcombinedwithgenerallightingoflowervalue.Thepurposeofperformancetestistocalculatetheinstalledefficacyintermsoflux/watt/m²(existingordesign)forgenerallightinginstallation.Thecalculatedvaluecanbecomparedwiththenormsforspecifictypesofinteriorinstallations for assessing improvement options. Theinstalledloadefficacyofanexisting(ordesign)lightinginstallationcanbeassessedbycarryingoutasurveyas indicated in the following pages.
10.3 Performance Terms and Definitions Lumenisaunitoflightfloworluminousflux.Thelumenratingofalampisameasureofthetotallightoutputofthelamp.Themostcommonmeasurementoflightoutput(orluminousflux)isthelumen.Lightsourcesarelabelledwith an output rating in lumens. Lux is the metric unit of measure for luminance of a surface. One lux is equal to one lumen per square meter.Circuit Watts is the total power drawn by lamps and ballasts in a lighting circuit under assessment. InstalledLoadEfficacyistheaveragemaintainedluminanceprovidedonahorizontalworkingplanepercircuitwattwithgenerallightingofaninterior.Unit:luxperwattpersquaremetre(lux/W/m²)LampCircuitEfficacyistheamountoflight(lumens)emittedbyalampforeachwattofpowerconsumedbythelamp circuit, i.e., including control gear losses. This is a more meaningful measure for those lamps that require control gear. Unit: lumens per circuit watt (lm/W)
Installed Power DensityTheinstalledpowerdensityper100luxisthepowerneededpersquaremetreoffloorareatoachieve100luxofaverage maintained illuminance on a horizontal working plane with general lighting of an interior. Unit:wattspersquaremetreper100lux(W/m²/100lux)
Averagemaintainedluminanceistheaverageofluxlevelsmeasuredatvariouspointsinadefinedarea.
Colour Rendering Index (CRI) is a measure of the effect of light on the perceived colour of objects. To determine the CRI of a lamp, the colour appearances of a set of standard colour chips are measured with special equipment under a reference light source with the same correlated colour temperature as the lamp being evaluated. If the lamp renders the colour of the chips identical to the reference light source, its CRI is 100. If the colour rendering differs from the reference light source, the CRI is less than 100. A low CRI indicates that some colours may appear unnatural when illuminated by the lamp.
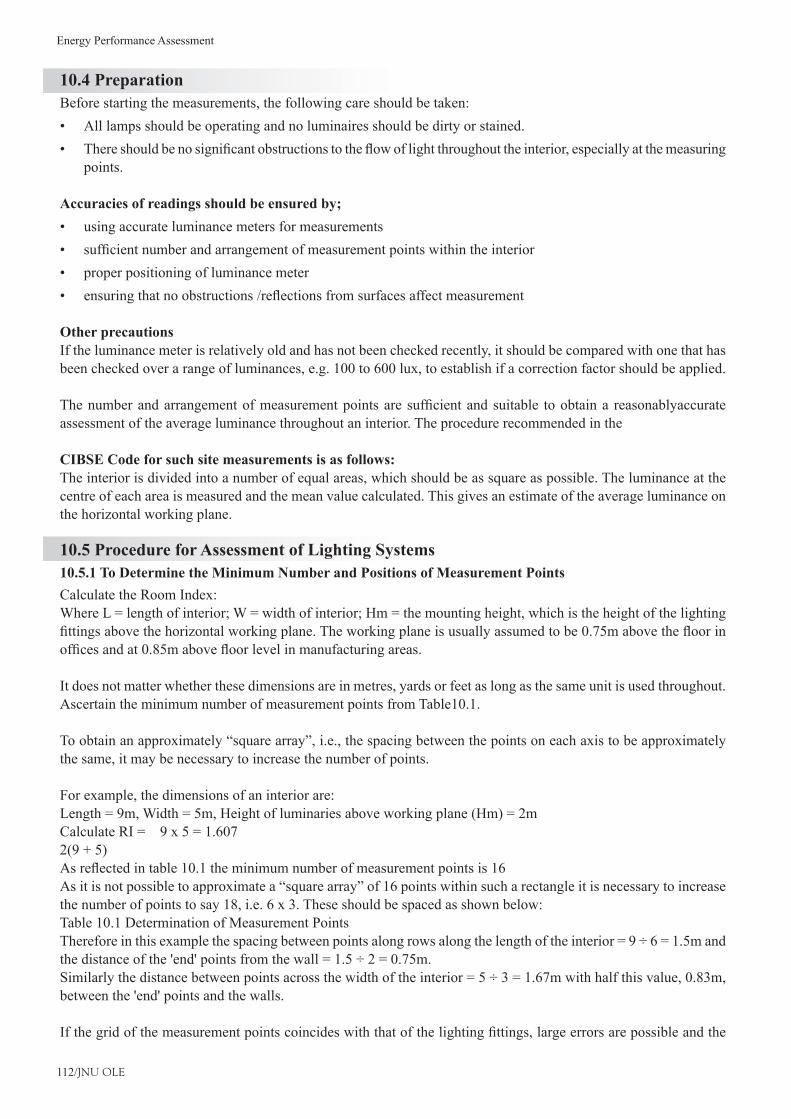
Energy Performance Assessment
112/JNU OLE
10.4 Preparation Before starting the measurements, the following care should be taken:
All lamps should be operating and no luminaires should be dirty or stained. •Thereshouldbenosignificantobstructionstotheflowoflightthroughouttheinterior,especiallyatthemeasuring•points.
Accuracies of readings should be ensured by;using accurate luminance meters for measurements•sufficientnumberandarrangementofmeasurementpointswithintheinterior•proper positioning of luminance meter•ensuringthatnoobstructions/reflectionsfromsurfacesaffectmeasurement•
Other precautionsIf the luminance meter is relatively old and has not been checked recently, it should be compared with one that has been checked over a range of luminances, e.g. 100 to 600 lux, to establish if a correction factor should be applied.
Thenumberandarrangementofmeasurementpointsaresufficientandsuitable toobtaina reasonablyaccurateassessment of the average luminance throughout an interior. The procedure recommended in the
CIBSE Code for such site measurements is as follows: The interior is divided into a number of equal areas, which should be as square as possible. The luminance at the centre of each area is measured and the mean value calculated. This gives an estimate of the average luminance on the horizontal working plane.
10.5 Procedure for Assessment of Lighting Systems 10.5.1 To Determine the Minimum Number and Positions of Measurement Points Calculate the Room Index:Where L = length of interior; W = width of interior; Hm = the mounting height, which is the height of the lighting fittingsabovethehorizontalworkingplane.Theworkingplaneisusuallyassumedtobe0.75mabovethefloorinofficesandat0.85mabovefloorlevelinmanufacturingareas.
It does not matter whether these dimensions are in metres, yards or feet as long as the same unit is used throughout. Ascertain the minimum number of measurement points from Table10.1.
To obtain an approximately “square array”, i.e., the spacing between the points on each axis to be approximately the same, it may be necessary to increase the number of points.
For example, the dimensions of an interior are: Length = 9m, Width = 5m, Height of luminaries above working plane (Hm) = 2m Calculate RI = 9 x 5 = 1.607 2(9+5)Asreflectedintable10.1theminimumnumberofmeasurementpointsis16As it is not possible to approximate a “square array” of 16 points within such a rectangle it is necessary to increase the number of points to say 18, i.e. 6 x 3. These should be spaced as shown below: Table 10.1 Determination of Measurement PointsTherefore in this example the spacing between points along rows along the length of the interior = 9 ÷ 6 = 1.5m and the distance of the 'end' points from the wall = 1.5 ÷ 2 = 0.75m. Similarly the distance between points across the width of the interior = 5 ÷ 3 = 1.67m with half this value, 0.83m, between the 'end' points and the walls.
Ifthegridofthemeasurementpointscoincideswiththatofthelightingfittings,largeerrorsarepossibleandthe
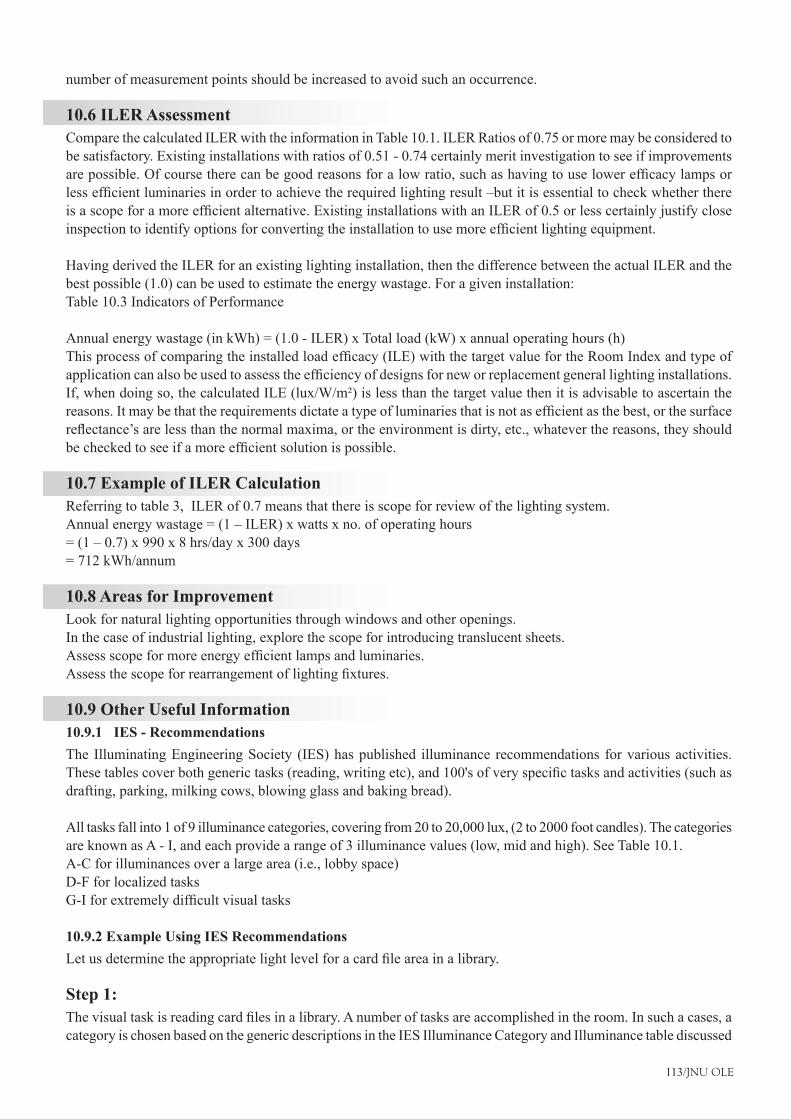
113/JNU OLE
number of measurement points should be increased to avoid such an occurrence.
10.6 ILER Assessment Compare the calculated ILER with the information in Table 10.1. ILER Ratios of 0.75 or more may be considered to be satisfactory. Existing installations with ratios of 0.51 - 0.74 certainly merit investigation to see if improvements arepossible.Ofcoursetherecanbegoodreasonsforalowratio,suchashavingtouselowerefficacylampsorlessefficientluminariesinordertoachievetherequiredlightingresult–butitisessentialtocheckwhetherthereisascopeforamoreefficientalternative.ExistinginstallationswithanILERof0.5orlesscertainlyjustifycloseinspectiontoidentifyoptionsforconvertingtheinstallationtousemoreefficientlightingequipment.
Having derived the ILER for an existing lighting installation, then the difference between the actual ILER and the best possible (1.0) can be used to estimate the energy wastage. For a given installation: Table 10.3 Indicators of Performance
Annual energy wastage (in kWh) = (1.0 - ILER) x Total load (kW) x annual operating hours (h) Thisprocessofcomparingtheinstalledloadefficacy(ILE)withthetargetvaluefortheRoomIndexandtypeofapplicationcanalsobeusedtoassesstheefficiencyofdesignsforneworreplacementgenerallightinginstallations.If,whendoingso,thecalculatedILE(lux/W/m²)islessthanthetargetvaluethenitisadvisabletoascertainthereasons.Itmaybethattherequirementsdictateatypeofluminariesthatisnotasefficientasthebest,orthesurfacereflectance’sarelessthanthenormalmaxima,ortheenvironmentisdirty,etc.,whateverthereasons,theyshouldbecheckedtoseeifamoreefficientsolutionispossible.
10.7 Example of ILER Calculation Referring to table 3, ILER of 0.7 means that there is scope for review of the lighting system. Annualenergywastage=(1–ILER)xwattsxno.ofoperatinghours=(1–0.7)x990x8hrs/dayx300days= 712 kWh/annum
10.8 Areas for Improvement Look for natural lighting opportunities through windows and other openings.In the case of industrial lighting, explore the scope for introducing translucent sheets.Assessscopeformoreenergyefficientlampsandluminaries.Assessthescopeforrearrangementoflightingfixtures.
10.9 Other Useful Information 10.9.1 IES - Recommendations The Illuminating Engineering Society (IES) has published illuminance recommendations for various activities. Thesetablescoverbothgenerictasks(reading,writingetc),and100'sofveryspecifictasksandactivities(suchasdrafting, parking, milking cows, blowing glass and baking bread).
All tasks fall into 1 of 9 illuminance categories, covering from 20 to 20,000 lux, (2 to 2000 foot candles). The categories are known as A - I, and each provide a range of 3 illuminance values (low, mid and high). See Table 10.1.A-C for illuminances over a large area (i.e., lobby space) D-F for localized tasks G-Iforextremelydifficultvisualtasks
10.9.2 Example Using IES Recommendations Letusdeterminetheappropriatelightlevelforacardfileareainalibrary.
Step 1: Thevisualtaskisreadingcardfilesinalibrary.Anumberoftasksareaccomplishedintheroom.Insuchacases,acategory is chosen based on the generic descriptions in the IES Illuminance Category and Illuminance table discussed
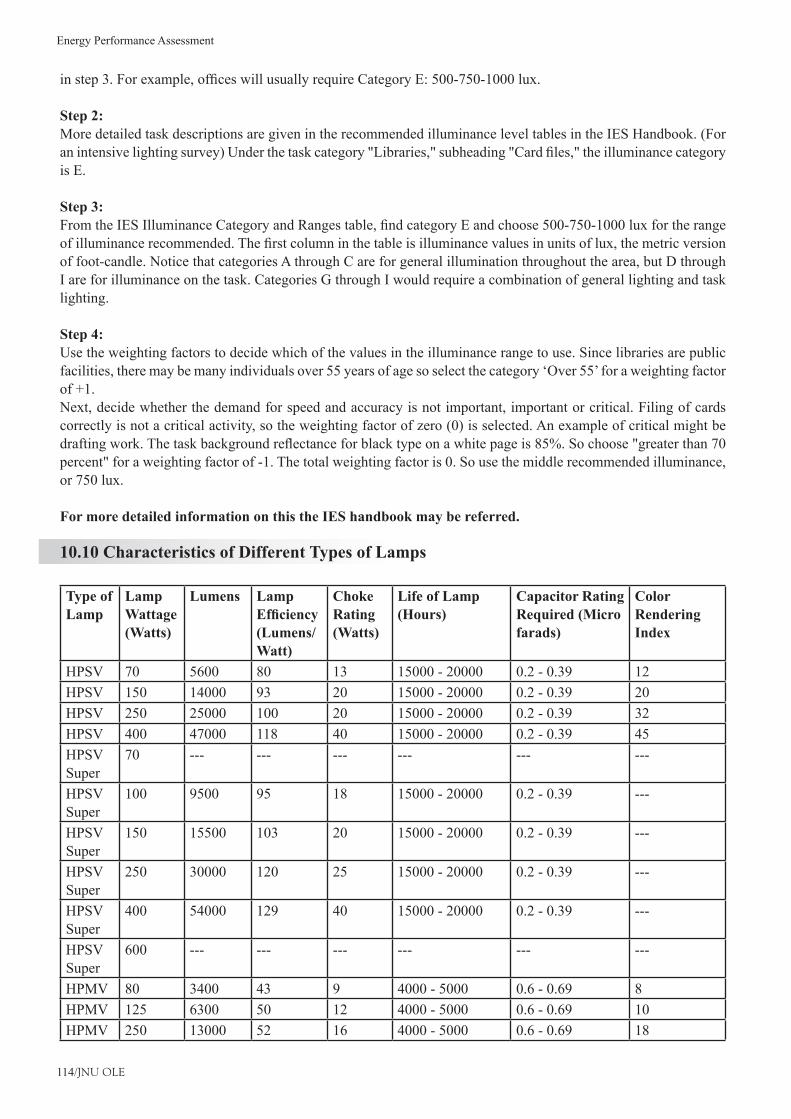
Energy Performance Assessment
114/JNU OLE
instep3.Forexample,officeswillusuallyrequireCategoryE:500-750-1000lux.
Step 2: More detailed task descriptions are given in the recommended illuminance level tables in the IES Handbook. (For anintensivelightingsurvey)Underthetaskcategory"Libraries,"subheading"Cardfiles,"theilluminancecategoryis E.
Step 3:FromtheIESIlluminanceCategoryandRangestable,findcategoryEandchoose500-750-1000luxfortherangeofilluminancerecommended.Thefirstcolumninthetableisilluminancevaluesinunitsoflux,themetricversionof foot-candle. Notice that categories A through C are for general illumination throughout the area, but D through I are for illuminance on the task. Categories G through I would require a combination of general lighting and task lighting.
Step 4:Use the weighting factors to decide which of the values in the illuminance range to use. Since libraries are public facilities, there may be many individuals over 55 years of age so select the category ‘Over 55’ for a weighting factor of+1.Next, decide whether the demand for speed and accuracy is not important, important or critical. Filing of cards correctly is not a critical activity, so the weighting factor of zero (0) is selected. An example of critical might be draftingwork.Thetaskbackgroundreflectanceforblacktypeonawhitepageis85%.Sochoose"greaterthan70percent" for a weighting factor of -1. The total weighting factor is 0. So use the middle recommended illuminance, or 750 lux.
For more detailed information on this the IES handbook may be referred.
10.10 Characteristics of Different Types of Lamps
Type of Lamp
Lamp Wattage (Watts)
Lumens Lamp Efficiency (Lumens/Watt)
Choke Rating (Watts)
Life of Lamp (Hours)
Capacitor Rating Required (Micro farads)
Color Rendering Index
HPSV 70 5600 80 13 15000 - 20000 0.2 - 0.39 12 HPSV 150 14000 93 20 15000 - 20000 0.2 - 0.39 20 HPSV 250 25000 100 20 15000 - 20000 0.2 - 0.39 32 HPSV 400 47000 118 40 15000 - 20000 0.2 - 0.39 45 HPSV Super
70 --- --- --- --- --- ---
HPSV Super
100 9500 95 18 15000 - 20000 0.2 - 0.39 ---
HPSV Super
150 15500 103 20 15000 - 20000 0.2 - 0.39 ---
HPSV Super
250 30000 120 25 15000 - 20000 0.2 - 0.39 ---
HPSV Super
400 54000 129 40 15000 - 20000 0.2 - 0.39 ---
HPSV Super
600 --- --- --- --- --- ---
HPMV 80 3400 43 9 4000 - 5000 0.6 - 0.69 8 HPMV 125 6300 50 12 4000 - 5000 0.6 - 0.69 10 HPMV 250 13000 52 16 4000 - 5000 0.6 - 0.69 18

115/JNU OLE
HPMV 400 22000 55 25 4000 - 5000 0.6 - 0.69 18 Metal Halide
70 4200 84 26 10000 0.9 - 0.93 ---
Metal Halide
150 10500 70 20 10000 0.9 - 0.93 ---
Metal Halide
250 19000 76 25 10000 0.9 - 0.93 ---
Metal Halide
400 31000 76 60 10000 0.9 - 0.93 ---
Metal Halide
1000 80000 80 65 10000 0.9 - 0.93 ---
FTL 40 2400 60 15 4400 0.8 - 0.89 3.2 - 3.8 FTL Super
36 3250 90 5 14000 0.8 - 0.89 3.2 - 3.8
Table 10.1 Characteristics of different types of lamps

Energy Performance Assessment
116/JNU OLE
SummaryThevarioustermsusedinIlluminationEngineeringincludeIncandescentlamps,ReflectorLamps,GasDischarge•Lamps,Luminaire,ControlGear,Ballast,Ignitors,Illuminance,Lux,LuminousEfficacy,ColourRenderingIndex.Incandescent Lamps, Flourescent Lamps, Compact Flourescent Lamps, High Pressure Mercury Vapour Lamps, •Halogen Lamps, High Pressure Sodium Vapor Lamps, Low Pressure Sodium Vapour Lamps.A step by step approach can be obtained to assess the performance of the Illumination System. •The methodology includes measurement of lux levels and comparing with the standards. Apart from this there •are so many steps involved.The biggest opportunity is the replacement of conventional copper wound chokes with electronic ballasts. •The other opportunities include designing buildings to give maximum sunlight during the day time. There are •many such opportunities.

117/JNU OLE
Self Assessment
A] Fill in the blanksLighting is provided in industries, commercial buildings, indoor and outdoor for providing _________________1. working environment.
on edgea. comfortableb. luxuriousc. unpleasantd.
____________isaunitoflightfloworluminousflux.Thelumenratingofalampisameasureofthetotallight2. output of the lamp.
Lumen a. Luxb. Wattsc. Ampere d.
_____________________ is the average maintained illuminance provided on a horizontal working plane per 3. circuit watt with general lighting of an interior.
InstalledLoadEfficacya. Luxb. Circuit Wattsc. LampCircuitEfficacyd.
_____________ is the metric unit of measure for illuminance of a surface. One lux is equal to one lumen per 4. square meter.
Lumen a. Luxb. Wattsc. Ampere d.
_________________ is the total power drawn by lamps and ballasts in a lighting circuit under assessment.5. Lumen a. Luxb. Circuit Wattsc. Ampere d.
___________________ is the amount of light (lumens) emitted by a lamp for each watt of power consumed by 6. the lamp circuit, i.e. including control gear losses.
Lumen a. Luxb. Circuit Wattsc. LampCircuitEfficacyd.

Energy Performance Assessment
118/JNU OLE
True or FalseWhich of the following is true?7.
Colour Rendering Index (CRI) is a measure of the effect of light on the perceived color of objects.a. InstalledLoadEfficacyisameasureoftheeffectoflightontheperceivedcolorofobjects.b. Colour Rendering Index (CRI) is a measure of the effect of heat on the perceived color of objects.c. Colour Rendering Index (CRI) is a measure of the effect of steam on the perceived color of objects.d.
Which of the following is true?8. Averagemaintained luminance is the averageof lumen levelsmeasured at various points in a defineda. area. Averagemaintainedluminanceistheaverageofluxlevelsmeasuredatvariouspointsinadefinedarea.b. Averagemaintainedluminanceistheaverageofcircuitwattslevelsmeasuredatvariouspointsinadefinedc. area. Averagemaintainedluminanceistheaverageoflampcircuitefficacylevelsmeasuredatvariouspointsind. adefinedarea.
Which of the following is true?9. Theinstalledpowerdensityper1000luxisthepowerneededpersquaremetreoffloorareatoachieve100a. lux of average maintained luminance on a horizontal working plane with general lighting of an interior. Theinstalledpowerdensityper100luxisthepowerneededpersquaremetreoffloorareatoachieve100b. lux of average maintained luminance on a horizontal working plane with general lighting of an interior. Theinstalledpowerdensityper100luxisthepowerneededpersquaremetreoffloorareatoachieve1000c. lux of average maintained luminance on a horizontal working plane with general lighting of an interior. Theinstalledpowerdensityper100luxisthepowerneededpersquaremetreoffloorareatoachieve100d. lux of average maintained luminance on a vertical working plane with general lighting of an interior.
Which of the following is true?10. Colour Rendering Index is the average maintained luminance provided on a horizontal working plane per a. circuit watt with general lighting of an interior.Average maintained luminance is the average maintained luminance provided on a horizontal working plane b. per circuit watt with general lighting of an interior.InstalledLoadEfficacyistheaveragemaintainedluminanceprovidedonahorizontalworkingplaneperc. circuit watt with general lighting of an interior.InstalledLoadEfficacyistheaveragemaintainedluminanceprovidedonahorizontalworkingplaneperd. circuit ampere with general lighting of an interior.

119/JNU OLE
Chapter- XI
Financial Analysis, Application of Non-conventional, Renewal Energy Sources and Waste Minimisation
AimThe aim of the chapter is to:
understandfixedandvariablecosts•recognize ways of interest charges•identify factors affecting analysis•observefinancialissuesassociatedwithcapitalinvestmentinenergysavingprojects•examinecashflowtechniquesofnetpresentvalueandinternalrateofreturn•study the concept of renewable energy•explain the causes of waste•enrich students with the concepts of waste minimisation and resource conservation•
ObjectivesThe objectives of the chapter are to:
recognizefixedandvariablecosts•know ways of interest charges•observecashflowtechniquesofnetpresentvalueandinternalrateofreturn•study the features of renewable energy •understand the forms of renewable energy•enrich students with wind energy and bio energy technologies•understand the causes of waste •
Learning outcomeAt the end of this chapter students will be able to:
understandfixedandvariablecosts•recognize ways of interest charges•examinecashflowtechniquesofnetpresentvalueandinternalrateofreturn•understand the application of non-conventional and renewable energy sources•understand the importance and methods of waste minimisation and resource conservation•
Energy Performance Assessment
120/JNU OLE
11.1 IntroductionWhenplanning an energy efficiencyor energymanagement project, the costs involved should always be•considered. Therefore, as with any other type of investment, energy management proposals should show the likely return on any capital that is invested.Consider the case of an energy auditor who advises the senior management of an organisation that capital should •be invested in new boiler plant.Inevitably, the management of the organisation would ask: How much will the proposal cost? How much money •will be saved by the proposal?These are, of course, not unreasonable questions, since within any organisation there are many worthy causes, •each of which requires funding and it is the job of senior management to invest in capital where it is going to obtain the greatest return. In order to make a decision about any course of action, management needs to be able to appraise all the costs •involvedinaprojectanddeterminethepotentialreturns.Thishowever,isnotquiteassimpleasitmightfirstappear. The capital value of plant or equipment usually decreases with time and it often requires more maintenance as •it gets older. Ifmoneyisborrowedfromabanktofinanceaproject,theninterestwillhavetobepaidontheloan.•Inflationtoowillinfluencethevalueofanyfutureenergysavingsthatmightbeachieved.Itisthereforeimportant•that the cost appraisal process allows for all these factors, with the aim of determining which investments should beundertaken,andofoptimisingthebenefitsachieved.Tothisendanumberofaccountingandfinancialappraisaltechniqueshavebeendevelopedwhichhelpenergy•managers and auditors make correct and objective decisions.Thefinancial issues associatedwith capital investment in energy saving projects are investigated in this•chapter. Inparticular,thediscountedcashflowtechniquesofnetpresentvalueandinternalrateofreturnarediscussed•in detail.
11.2 Fixed and Variable CostsWhen appraising the potential costs involved in a project it is important to understand the difference between •fixedandvariablecosts.Variable costs are those which vary directly with the output of a particular plant or production process, such •as fuel costs.Fixed costs are those costs, which are not dependent on plant or process output, such as site-rent and •insurance. Thetotalcostofanyprojectisthereforethesumofthefixedandvariablecosts.•
Example:Thebelowmentionedexampleillustrateshowbothfixedandvariablecostscombinetomakethetotaloperatingcost. The capital cost of the DG set is Rs.9,00,000, the annual output is 219 MWh, and the maintenance cost is Rs.30,000 per annum. The cost of producing each unit of electricity is 3.50 Rs./kWh. The total cost of a diesel generatoroperatingovera5-yearperiod,takingintoconsiderationbothfixedandvariablecostis:
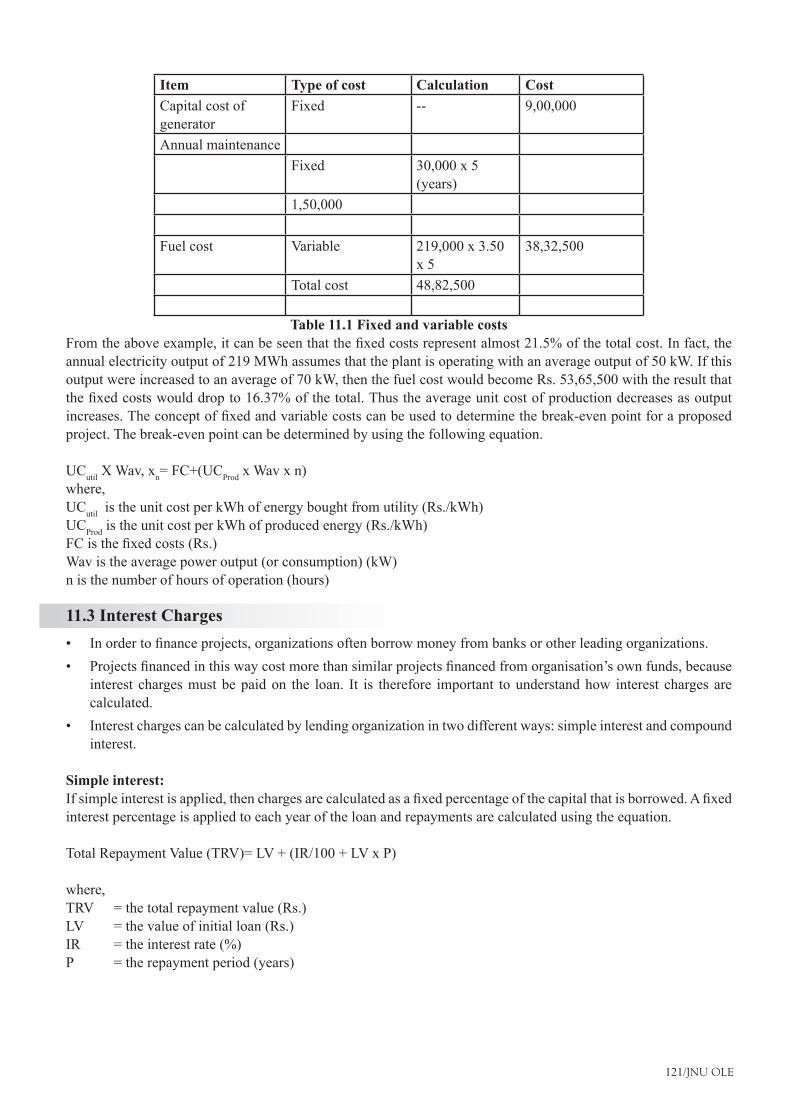
121/JNU OLE
Item Type of cost Calculation CostCapital cost of generator
Fixed -- 9,00,000
Annual maintenanceFixed 30,000 x 5
(years)1,50,000
Fuel cost Variable 219,000 x 3.50 x 5
38,32,500
Total cost 48,82,500
Table 11.1 Fixed and variable costsFromtheaboveexample,itcanbeseenthatthefixedcostsrepresentalmost21.5%ofthetotalcost.Infact,theannual electricity output of 219 MWh assumes that the plant is operating with an average output of 50 kW. If this output were increased to an average of 70 kW, then the fuel cost would become Rs. 53,65,500 with the result that thefixedcostswoulddropto16.37%ofthetotal.Thustheaverageunitcostofproductiondecreasesasoutputincreases.Theconceptoffixedandvariablecostscanbeusedtodeterminethebreak-evenpointforaproposedproject. The break-even point can be determined by using the following equation.
UCutil X Wav, xn=FC+(UCProd x Wav x n)where,UCutil is the unit cost per kWh of energy bought from utility (Rs./kWh)UCProd is the unit cost per kWh of produced energy (Rs./kWh)FCisthefixedcosts(Rs.)Wav is the average power output (or consumption) (kW)n is the number of hours of operation (hours)
11.3 Interest ChargesInordertofinanceprojects,organizationsoftenborrowmoneyfrombanksorotherleadingorganizations.•Projectsfinancedinthiswaycostmorethansimilarprojectsfinancedfromorganisation’sownfunds,because•interest charges must be paid on the loan. It is therefore important to understand how interest charges are calculated.Interest charges can be calculated by lending organization in two different ways: simple interest and compound •interest.
Simple interest:Ifsimpleinterestisapplied,thenchargesarecalculatedasafixedpercentageofthecapitalthatisborrowed.Afixedinterest percentage is applied to each year of the loan and repayments are calculated using the equation.
TotalRepaymentValue(TRV)=LV+(IR/100+LVxP)
where,TRV = the total repayment value (Rs.)LV = the value of initial loan (Rs.)IR =theinterestrate(%)P = the repayment period (years)
Energy Performance Assessment
122/JNU OLE
Compound interest:Compound interest is usually calculated annually (although this is not necessarily the case). The interest charged is calculated as a percentage of the outstanding loan at the end of each time period. It is termed 'compound' because the outstanding loan is the sum of the unpaid capital and the interest charges up to that point. The value of the total repayment can be calculated using the equation.
TRV=LV+(1+IR/100)P
11.4 Simple Payback PeriodThisisthesimplesttechniquethatcanbeusedtoappraiseaproposal.Thesimplepaybackperiodcanbedefined•as 'the length of time required for the running total of net savings before depreciation to equal the capital cost of the project'.In theory, once the payback period has ended, all the project capital costs will have been recoupled and any •additionalcostsavingsachievedcanbeseenasclear'profit'.Obviously, the shorter the payback period, the more attractive the project becomes.•The length of the maximum permissible payback period generally varies with the business culture concerned.•In some companies, payback periods in excess of 3 years are considered acceptable.•The payback period can be calculated using the equation.•
Simple payback period (Years) = Capital cost of the Project (Rs.)/Net Annual Savings (Rs.)= PB= CC/AS
where,PB = the payback period (years)CC = the capital cost of the project (Rs.)AS = the annual net cost saving achieved (Rs.)The annual net cost saving (AS) is the least savings achieved after all the operational costs have been met.
11.5 Discounted Cash Flow MethodsThe payback method is a simple technique, which can easily be used to provide a quick evaluation of a proposal. •However, it has a number of major weaknesses:
Thepaybackmethoddoesnotconsidersavingsthatareaccruedafterthepaybackperiodhasfinished. �The payback method does not consider the fact that money, which is invested, should accrue interest as �timepasses.Insimpletermsthereisa'timevalue'componenttocashflows.ThusRs.1000todayismorevaluable than Rs.1000 in 10 years' time.
Inordertoovercometheseweaknessesanumberofdiscountedcashflowtechniqueshavebeendeveloped,•which are based on the fact that money invested in a bank will accrue annual interest.The two most commonly used techniques are the 'net present value' and the 'internal rate of return' methods.•
11.6 Net Present Value MethodThenetpresentvaluemethodconsidersthefactthatacashsaving(oftenreferredtoasa'cashflow')ofRs.1000•inyear10ofaprojectwillbeworthlessthanacashflowofRs.1000inyear2.The net present value method achieves this by quantifying the impact of time on any particular future cash •flow.Thisisdonebyequatingeachfuturecashflowtoitscurrentvaluetoday,inotherwordsdeterminingthepresentvalueofanyfuturecashflow.The present value (PV) is determined by using an assumed interest rate, usually referred to as a discount rate. •Discounting is the opposite process to compounding.
123/JNU OLE
Compoundingdeterminesthefuturevalueofpresentcashflows,where"discountingdeterminesthepresent•valueoffuturecashflows.
11.7 Internal Rate of Return MethodIt can be seen from Example 5 that both projects returned a positive net present value over 10 years, at a discount •rateof8%.However,ifthediscountratewerereducedtherewouldcomeapointwhenthenetpresentvaluewould become zero. It is clear that the discount rate which must be applied, in order to achieve a net present value of zero, will be •higher for Project 2 than for Project 1. This means that the average rate of return for Project 2 is higher than for Project 1, with the result that Project 2 is the better proposition.The discount rate which achieves a net present value of zero is known as the internal rate of return (IRR). The •higher the internal rate of return, the more attractive the project.
Profitability indexAnothertechnique,whichcanbeusedtoevaluatethefinancialviabilityofprojects,istheprofitabilityindex.Theprofitabilityindexcanbedenotedas:
Profitabilityindex=(Sumofthediscountednetsavings)/(CapitalCosts)
Thehighertheprofitabilityindex,themoreattractivetheproject.
11.8 Factors Affecting AnalysisIn the financial analysis of projects, they do not allow for the following important considerations:
The capital value of plant and equipment generally depreciates over time•Generalinflationreducesthevalueofsavingsastimeprogresses.Forexample,Rs.1000savedin1year’stime•will be worth more than Rs.1000 saved in 10 years time.The capital depreciation of an item of equipment can be considered in terms of its salvage value at the end of •the analysis period. The Example 8 illustrates the point.
11.9 Real ValueInflationcanbedefinedastherateofincreaseintheaveragepriceofgoodsandservices.•Insomecountries,inflationisexpressedintermsoftheretailpriceindex(RPI),whichisdeterminedcentrally•andreflectsaverageinflationoverarangeofcommodities.Becauseofinflation,therealvalueofcashflowdecreases with time.The real value of sum of money (S) realised in n years time can be determined using the equation.•
RV =S x
where,RV = the real value of S realized in n years timeS =thevalueofcashflowinnyear’stimeR =theinflationrate(%)Aswiththediscountfactoritiscommonpracticetouseaninflationfactorwhenassessingtheimpactofinflationonaproject.Theinflationfactorcanbedeterminedusingtheequation;
IF = Theproductofaparticularcashflowandinflationfactoristherealvalueofthecashflow.RV=S x IF
Energy Performance Assessment
124/JNU OLE
11.10 Application of Non-conventional and Renewable Energy SourcesConcept of Renewable Energy•
Renewable energy sources also called non-conventional energy, are sources that are continuously replenished �by natural processes. For example, solar energy, wind energy, bio-energy - bio-fuels grown sustain ably), hydropower etc., are some of the examples of renewable energy sources.
Features of Renewable Energy• A renewable energy system converts the energy found in sunlight, wind, falling-water, sea-waves, geothermal �heat, or biomass into a form, we can use such as heat or electricity. Most of the renewable energy comes either directly or indirectly from sun and wind and can never be �exhausted, and therefore they are called renewable.However, most of the world's energy sources are derived from conventional sources-fossil fuels such as �coal, oil, and natural gases. These fuels are often termed non-renewable energy sources.Although,theavailablequantityofthesefuelsareextremelylarge,theyareneverthelessfiniteandsowill �in principle ‘run out’ at some time in the futureRenewable energy sources are essentiallyflowsof energy,whereas the fossil andnuclear fuels are, in �essence, stocks of energy
Various forms of renewable energy• Solar energy �Wind energy �Bio energy �Hydro energy �Geothermal energy Wave �Tidal energy �
In this focus is on application potential of commercially viable renewable energy sources such as solar, wind, •bio and hydro energy in India.
11.11 Solar EnergySolar energy is the most readily available and free source of energy since prehistoric times. •It is estimated that solar energy equivalent to over 15,000 times the world's annual commercial energy •consumption reaches the earth every year. India receives solar energy in the region of 5 to 7 kWh/m• 2for300to330daysinayear.Thisenergyissufficientto set up 20 MW solar power plant per square kilometre land area. Solar energy can be utilised through two different routes, as solar thermal route and solar electric (solar •photovoltaic) routes. Solar thermal route uses the sun's heat to produce hot water or air, cook food, drying materials etc. Solar •photovoltaic uses sun’s heat to produce electricity for lighting home and building, running motors, pumps, electric appliances, and lighting.
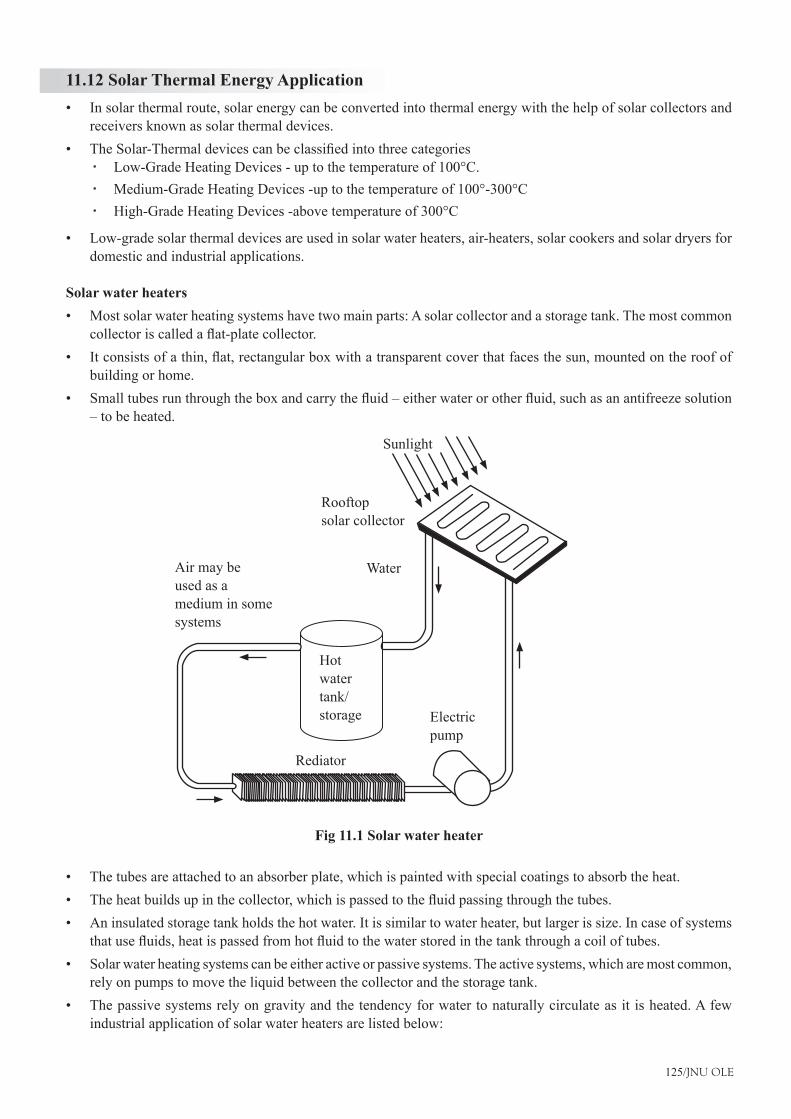
125/JNU OLE
11.12 Solar Thermal Energy ApplicationIn solar thermal route, solar energy can be converted into thermal energy with the help of solar collectors and •receivers known as solar thermal devices. TheSolar-Thermaldevicescanbeclassifiedintothreecategories•
Low-GradeHeatingDevices-uptothetemperatureof100°C. �Medium-GradeHeatingDevices-uptothetemperatureof100°-300°C �High-GradeHeatingDevices-abovetemperatureof300°C �
Low-grade solar thermal devices are used in solar water heaters, air-heaters, solar cookers and solar dryers for •domestic and industrial applications.
Solar water heatersMost solar water heating systems have two main parts: A solar collector and a storage tank. The most common •collectoriscalledaflat-platecollector.Itconsistsofathin,flat,rectangularboxwithatransparentcoverthatfacesthesun,mountedontheroofof•building or home. Smalltubesrunthroughtheboxandcarrythefluid–eitherwaterorotherfluid,suchasanantifreezesolution•–tobeheated.
Fig 11.1 Solar water heater
The tubes are attached to an absorber plate, which is painted with special coatings to absorb the heat. •Theheatbuildsupinthecollector,whichispassedtothefluidpassingthroughthetubes.•An insulated storage tank holds the hot water. It is similar to water heater, but larger is size. In case of systems •thatusefluids,heatispassedfromhotfluidtothewaterstoredinthetankthroughacoiloftubes.Solar water heating systems can be either active or passive systems. The active systems, which are most common, •rely on pumps to move the liquid between the collector and the storage tank. The passive systems rely on gravity and the tendency for water to naturally circulate as it is heated. A few •industrial application of solar water heaters are listed below:
Sunlight
Rooftopsolar collector
Air may beused as a medium in somesystems
Electricpump
Rediator
Water
Hotwatertank/storage

Energy Performance Assessment
126/JNU OLE
Hotels: Bathing, kitchen, washing, laundry applications �Dairies:Ghee(clarifiedbutter)production,cleaningandsterilizing,pasteurization �Textiles:Bleaching,boiling,printing,dyeing,curing,ageingandfinishing �Breweries and Distilleries: Bottle washing, wort preparation, boiler feed heating �Chemical /Bulk drugs units: Fermentation of mixes, boiler feed applications �Electroplating/galvanizing units: Heating of plating baths, cleaning, degreasing applications �Pulp and paper industries: Boiler feed applications, soaking of pulp �
Solar cookerSolar cooker is a device, which uses solar energy for cooking, and thus saving fossil fuels, fuel wood and electrical •energy to a large extent. However, it can only supplement the cooking fuel, and not replace it totally. It is a simple cooking unit, ideal for domestic cooking during most of the year except during the monsoon •season, cloudy days and winter months
Box type solar cookersTheboxtypesolarcookerswithasinglereflectingmirrorarethemostpopularinIndia.•These cookers have proved immensely popular in rural areas where women spend considerable time for collecting •firewood.Afamilysizesolarcooker issufficientfor4 to5membersandsavesabout3 to4cylindersofLPGevery•year. The life of this cooker is up to 15 years. This cooker costs around Rs.1000 after allowing for subsidy. •Solar cookers are widely available in the market.•
Fig. 11.2 Solar cooker
Reflecting Mirror
Double glasslid
Thermal insulator
Guide for Adjustment of Reflecting Mirror
Handle
Cooking Pots 60 cm
20 cm
60 cm
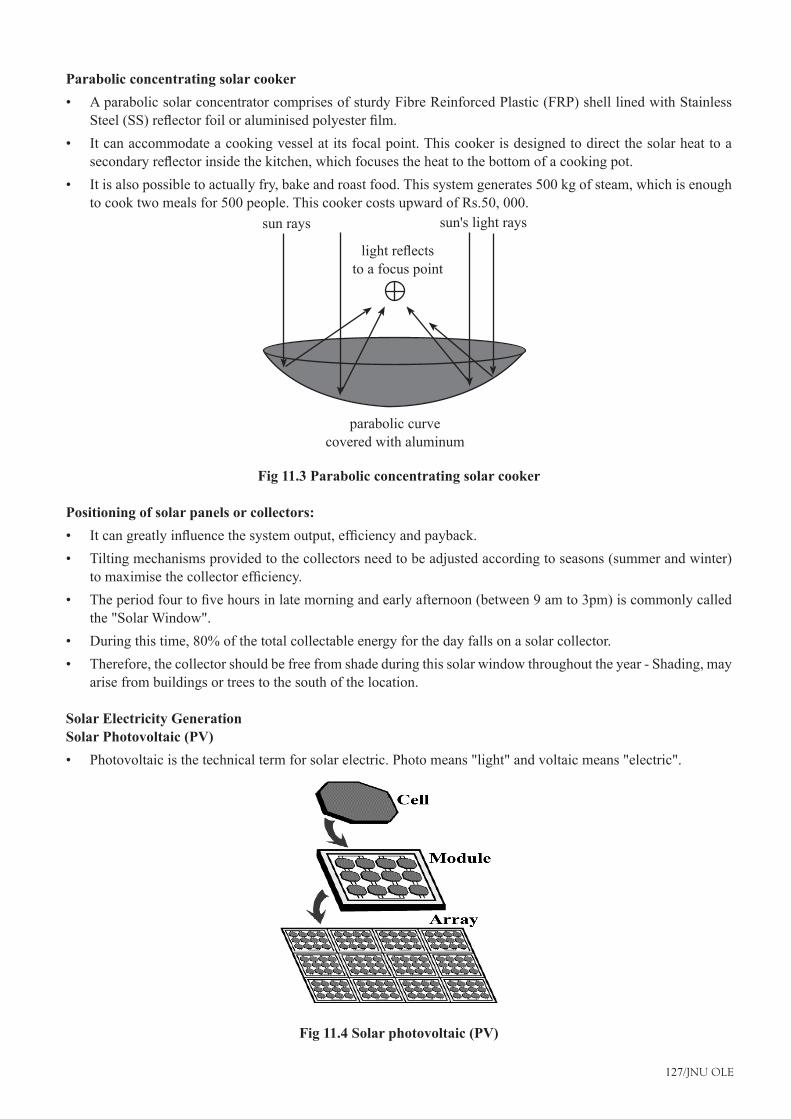
127/JNU OLE
Parabolic concentrating solar cookerA parabolic solar concentrator comprises of sturdy Fibre Reinforced Plastic (FRP) shell lined with Stainless •Steel(SS)reflectorfoiloraluminisedpolyesterfilm.It can accommodate a cooking vessel at its focal point. This cooker is designed to direct the solar heat to a •secondaryreflectorinsidethekitchen,whichfocusestheheattothebottomofacookingpot.It is also possible to actually fry, bake and roast food. This system generates 500 kg of steam, which is enough •to cook two meals for 500 people. This cooker costs upward of Rs.50, 000.
Fig 11.3 Parabolic concentrating solar cooker
Positioning of solar panels or collectors:Itcangreatlyinfluencethesystemoutput,efficiencyandpayback.•Tilting mechanisms provided to the collectors need to be adjusted according to seasons (summer and winter) •tomaximisethecollectorefficiency.Theperiodfourtofivehoursinlatemorningandearlyafternoon(between9amto3pm)iscommonlycalled•the "Solar Window". Duringthistime,80%ofthetotalcollectableenergyforthedayfallsonasolarcollector.•Therefore, the collector should be free from shade during this solar window throughout the year - Shading, may •arise from buildings or trees to the south of the location.
Solar Electricity GenerationSolar Photovoltaic (PV)
Photovoltaic is the technical term for solar electric. Photo means "light" and voltaic means "electric". •
Fig 11.4 Solar photovoltaic (PV)
sun's light rays
lightreflectsto a focus point
parabolic curvecovered with aluminum
sun rays
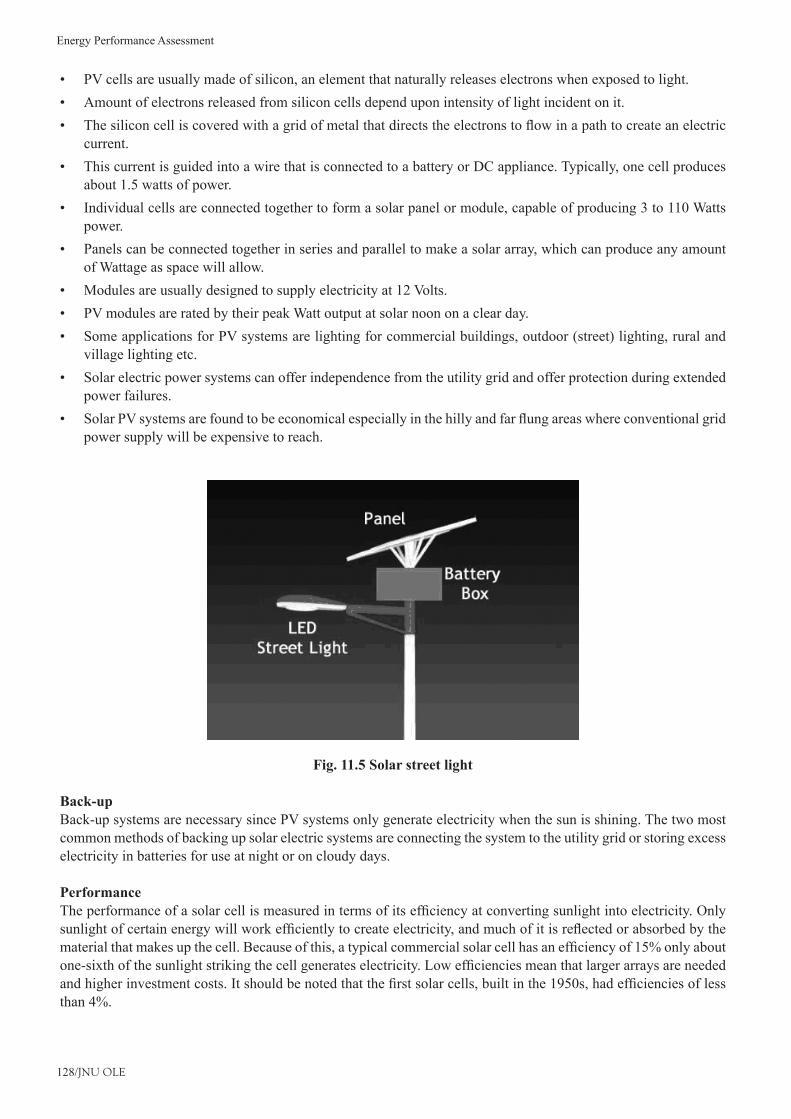
Energy Performance Assessment
128/JNU OLE
PV cells are usually made of silicon, an element that naturally releases electrons when exposed to light.•Amount of electrons released from silicon cells depend upon intensity of light incident on it. •Thesiliconcelliscoveredwithagridofmetalthatdirectstheelectronstoflowinapathtocreateanelectric•current. This current is guided into a wire that is connected to a battery or DC appliance. Typically, one cell produces •about 1.5 watts of power. Individual cells are connected together to form a solar panel or module, capable of producing 3 to 110 Watts •power. Panels can be connected together in series and parallel to make a solar array, which can produce any amount •of Wattage as space will allow. Modules are usually designed to supply electricity at 12 Volts. •PV modules are rated by their peak Watt output at solar noon on a clear day.•Some applications for PV systems are lighting for commercial buildings, outdoor (street) lighting, rural and •village lighting etc. Solar electric power systems can offer independence from the utility grid and offer protection during extended •power failures. SolarPVsystemsarefoundtobeeconomicalespeciallyinthehillyandfarflungareaswhereconventionalgrid•power supply will be expensive to reach.
Fig. 11.5 Solar street light
Back-upBack-up systems are necessary since PV systems only generate electricity when the sun is shining. The two most common methods of backing up solar electric systems are connecting the system to the utility grid or storing excess electricity in batteries for use at night or on cloudy days.
PerformanceTheperformanceofasolarcellismeasuredintermsofitsefficiencyatconvertingsunlightintoelectricity.Onlysunlightofcertainenergywillworkefficientlytocreateelectricity,andmuchofitisreflectedorabsorbedbythematerialthatmakesupthecell.Becauseofthis,atypicalcommercialsolarcellhasanefficiencyof15%onlyaboutone-sixthofthesunlightstrikingthecellgenerateselectricity.Lowefficienciesmeanthatlargerarraysareneededandhigherinvestmentcosts.Itshouldbenotedthatthefirstsolarcells,builtinthe1950s,hadefficienciesoflessthan4%.
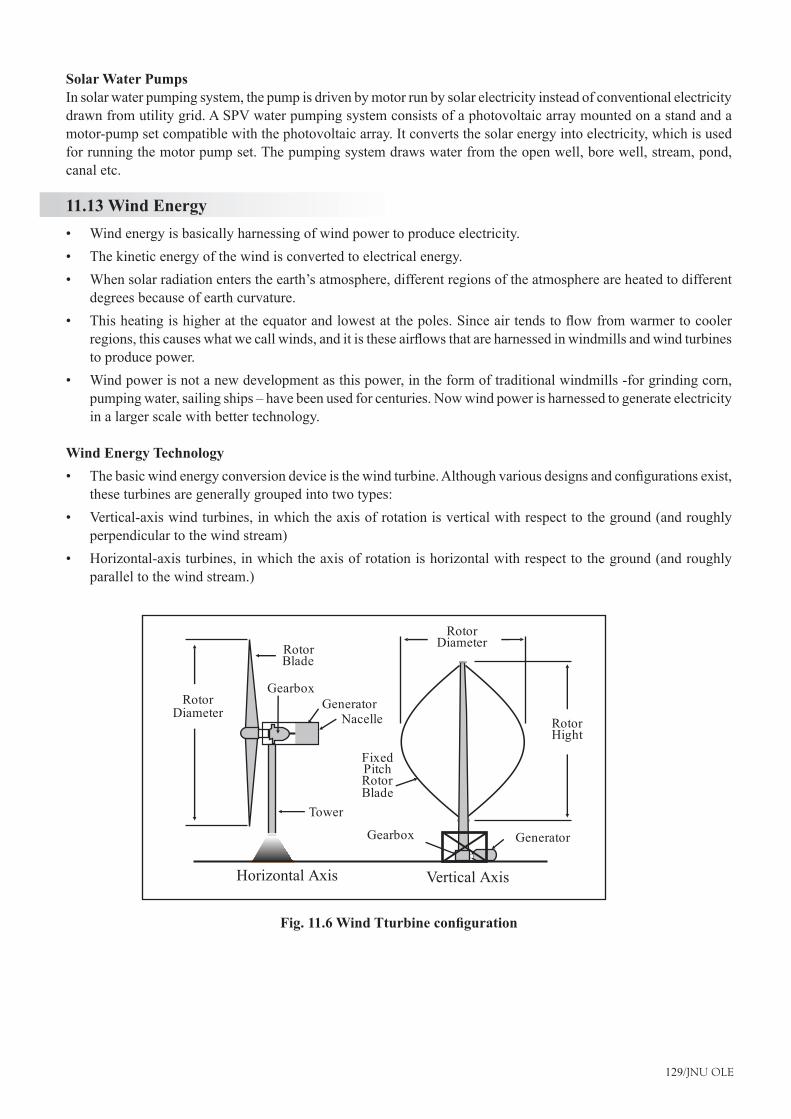
129/JNU OLE
Solar Water PumpsIn solar water pumping system, the pump is driven by motor run by solar electricity instead of conventional electricity drawn from utility grid. A SPV water pumping system consists of a photovoltaic array mounted on a stand and a motor-pump set compatible with the photovoltaic array. It converts the solar energy into electricity, which is used for running the motor pump set. The pumping system draws water from the open well, bore well, stream, pond, canal etc.
11.13 Wind EnergyWind energy is basically harnessing of wind power to produce electricity.•The kinetic energy of the wind is converted to electrical energy.•When solar radiation enters the earth’s atmosphere, different regions of the atmosphere are heated to different •degrees because of earth curvature.Thisheatingishigherattheequatorandlowestatthepoles.Sinceairtendstoflowfromwarmertocooler•regions,thiscauseswhatwecallwinds,anditistheseairflowsthatareharnessedinwindmillsandwindturbinesto produce power.Wind power is not a new development as this power, in the form of traditional windmills -for grinding corn, •pumpingwater,sailingships–havebeenusedforcenturies.Nowwindpowerisharnessedtogenerateelectricityin a larger scale with better technology.
Wind Energy TechnologyThebasicwindenergyconversiondeviceisthewindturbine.Althoughvariousdesignsandconfigurationsexist,•these turbines are generally grouped into two types:Vertical-axis wind turbines, in which the axis of rotation is vertical with respect to the ground (and roughly •perpendicular to the wind stream)Horizontal-axis turbines, in which the axis of rotation is horizontal with respect to the ground (and roughly •parallel to the wind stream.)
Fig. 11.6 Wind Tturbine configuration
Rotor Blade
GearboxGenerator
Nacelle
Tower
FixedPitchRotorBlade
RotorDiameter
RotorHight
Gearbox Generator
Horizontal Axis Vertical Axis
Rotor Diameter
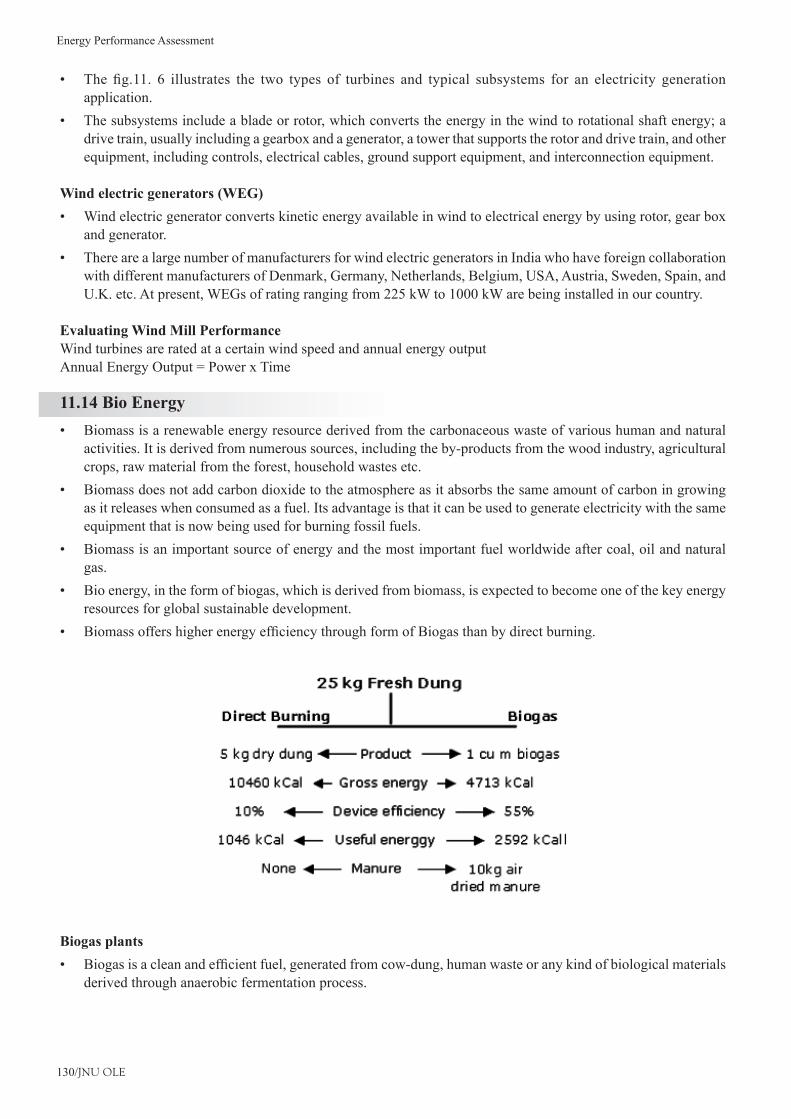
Energy Performance Assessment
130/JNU OLE
The fig.11. 6 illustrates the two types of turbines and typical subsystems for an electricity generation•application.The subsystems include a blade or rotor, which converts the energy in the wind to rotational shaft energy; a •drive train, usually including a gearbox and a generator, a tower that supports the rotor and drive train, and other equipment, including controls, electrical cables, ground support equipment, and interconnection equipment.
Wind electric generators (WEG)Wind electric generator converts kinetic energy available in wind to electrical energy by using rotor, gear box •and generator.There are a large number of manufacturers for wind electric generators in India who have foreign collaboration •with different manufacturers of Denmark, Germany, Netherlands, Belgium, USA, Austria, Sweden, Spain, and U.K. etc. At present, WEGs of rating ranging from 225 kW to 1000 kW are being installed in our country.
Evaluating Wind Mill PerformanceWind turbines are rated at a certain wind speed and annual energy outputAnnual Energy Output = Power x Time
11.14 Bio EnergyBiomass is a renewable energy resource derived from the carbonaceous waste of various human and natural •activities. It is derived from numerous sources, including the by-products from the wood industry, agricultural crops, raw material from the forest, household wastes etc.Biomass does not add carbon dioxide to the atmosphere as it absorbs the same amount of carbon in growing •as it releases when consumed as a fuel. Its advantage is that it can be used to generate electricity with the same equipment that is now being used for burning fossil fuels.Biomass is an important source of energy and the most important fuel worldwide after coal, oil and natural •gas.Bio energy, in the form of biogas, which is derived from biomass, is expected to become one of the key energy •resources for global sustainable development.BiomassoffershigherenergyefficiencythroughformofBiogasthanbydirectburning.•
Biogas plantsBiogasisacleanandefficientfuel,generatedfromcow-dung,humanwasteoranykindofbiologicalmaterials•derived through anaerobic fermentation process.
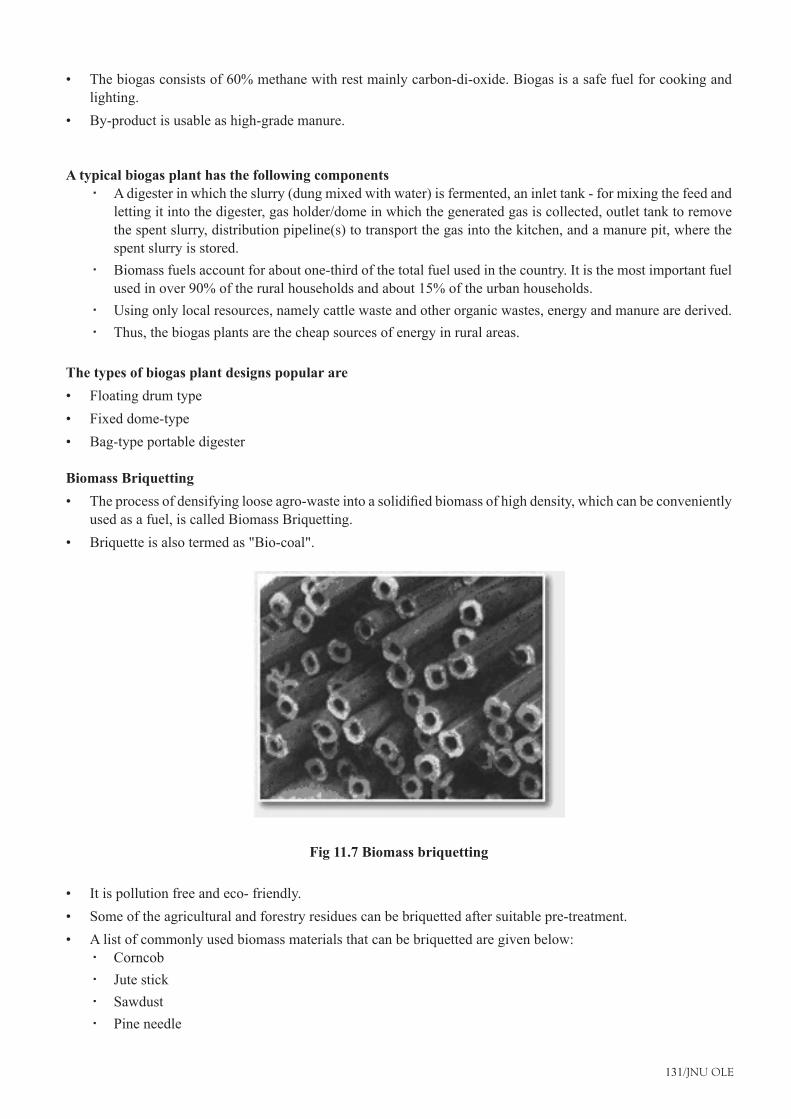
131/JNU OLE
Thebiogasconsistsof60%methanewithrestmainlycarbon-di-oxide.Biogasisasafefuelforcookingand•lighting. By-product is usable as high-grade manure. •
A typical biogas plant has the following componentsA digester in which the slurry (dung mixed with water) is fermented, an inlet tank - for mixing the feed and �letting it into the digester, gas holder/dome in which the generated gas is collected, outlet tank to remove the spent slurry, distribution pipeline(s) to transport the gas into the kitchen, and a manure pit, where the spent slurry is stored.Biomass fuels account for about one-third of the total fuel used in the country. It is the most important fuel �usedinover90%oftheruralhouseholdsandabout15%oftheurbanhouseholds.Using only local resources, namely cattle waste and other organic wastes, energy and manure are derived. �Thus, the biogas plants are the cheap sources of energy in rural areas. �
The types of biogas plant designs popular areFloating drum type•Fixed dome-type•Bag-type portable digester•
Biomass BriquettingTheprocessofdensifyinglooseagro-wasteintoasolidifiedbiomassofhighdensity,whichcanbeconveniently•used as a fuel, is called Biomass Briquetting.Briquette is also termed as "Bio-coal".•
Fig 11.7 Biomass briquetting
It is pollution free and eco- friendly. •Some of the agricultural and forestry residues can be briquetted after suitable pre-treatment. •A list of commonly used biomass materials that can be briquetted are given below:•
Corncob �Jute stick �Sawdust �Pine needle �
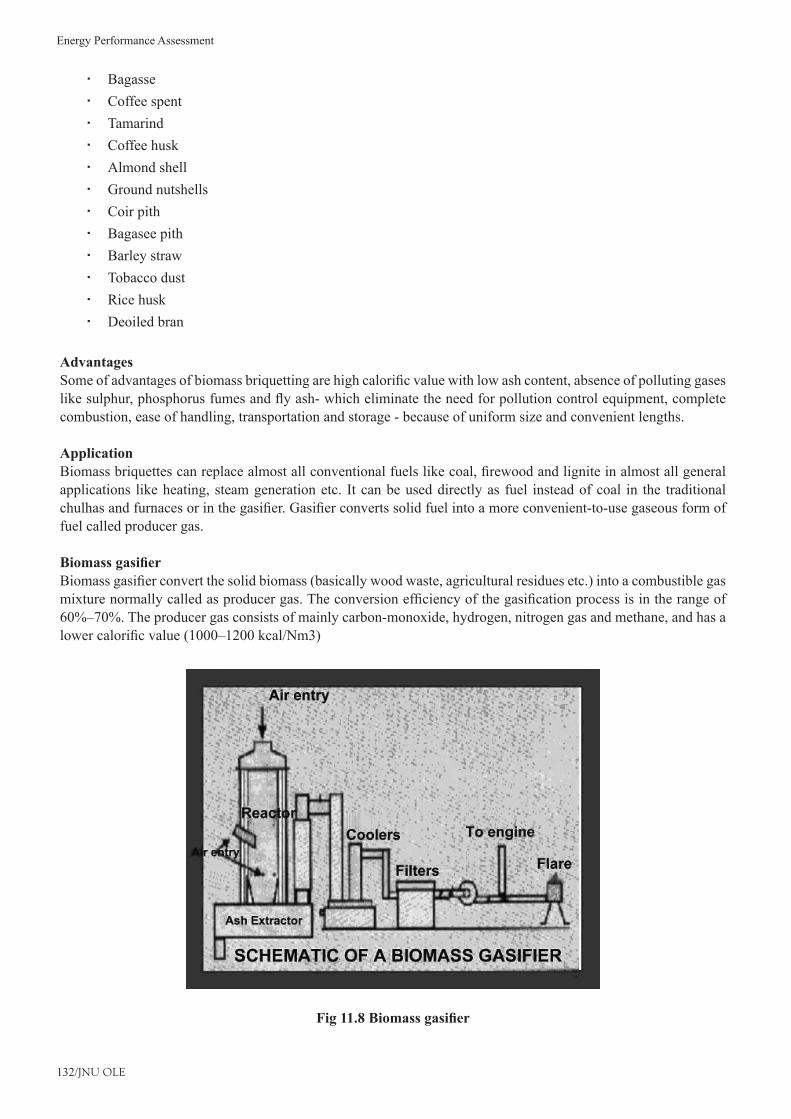
Energy Performance Assessment
132/JNU OLE
Bagasse �Coffee spent �Tamarind �Coffee husk �Almond shell �Ground nutshells �Coir pith �Bagasee pith �Barley straw �Tobacco dust �Rice husk �Deoiled bran �
AdvantagesSomeofadvantagesofbiomassbriquettingarehighcalorificvaluewithlowashcontent,absenceofpollutinggaseslikesulphur,phosphorusfumesandflyash-whicheliminatetheneedforpollutioncontrolequipment,completecombustion, ease of handling, transportation and storage - because of uniform size and convenient lengths.
ApplicationBiomassbriquettescanreplacealmostallconventionalfuelslikecoal,firewoodandligniteinalmostallgeneralapplications like heating, steam generation etc. It can be used directly as fuel instead of coal in the traditional chulhasandfurnacesorinthegasifier.Gasifierconvertssolidfuelintoamoreconvenient-to-usegaseousformoffuel called producer gas.
Biomass gasifierBiomassgasifierconvertthesolidbiomass(basicallywoodwaste,agriculturalresiduesetc.)intoacombustiblegasmixturenormallycalledasproducergas.Theconversionefficiencyofthegasificationprocessisintherangeof60%–70%.Theproducergasconsistsofmainlycarbon-monoxide,hydrogen,nitrogengasandmethane,andhasalowercalorificvalue(1000–1200kcal/Nm3)
Fig 11.8 Biomass gasifier
133/JNU OLE
HighEfficiencyWoodBurningStovesThesestovessavemorethan50%fuelwoodconsumption.Theyreducedrudgeryofwomensavingtimeincookingandfuelcollectionandconsequenthealthhazards.Theyalsohelpinsavingfirewoodleadingtoconservationofforests. They also create employment opportunities for people in the rural areas.
Bio fuelsUnlike other renewable energy sources, biomass can be converted directly into liquid fuels— bio fuels— for •our transportation needs (cars, trucks, buses, airplanes, and trains). The two most common types of bio fuels are ethanol and biodiesel.•Ethanol is an alcohol, similar to that used in beer and wine. •It is made by fermenting any biomass high in carbohydrates (starches, sugars, or celluloses) through a process •similar to brewing beer. Ethanol is mostly used as a fuel additive to cut down a vehicle's carbon monoxide andothersmog-causingemissions.Flexible-fuelvehicles,whichrunonmixturesofgasolineandupto85%ethanol, are now available. Biodiesel,producedbyplantssuchasrapeseed(canola),sunflowersandsoybeans,canbeextractedandrefined•into fuel, which can be burned in diesel engines and buses. Biodiesel can also make by combining alcohol with vegetable oil, or recycled cooking greases. •Itcanbeusedasanadditivetoreducevehicleemissions(typically20%)orinitspureformasarenewable•alternative fuel for diesel engines.
Bio powerBio power, or biomass power, is the use of biomass to generate electricity. There are six major types of biopower •systems:direct-fired,cofiring,gasification,anaerobicdigestion,pyrolysis,andsmall-modular.Mostofthebiopowerplantsintheworldusedirect-firedsystems.Theyburnbio-energyfeedstocksdirectly•in boiler to produce steam. This steam drives the turbo-generator. In some industries, the steam is also used in manufacturing processes or to heat buildings. These are known as combined heat and power facilities. For example, wood waste is often used to produce both electricity and steam at paper mills. Manycoal-firedpowerplantsusecofiringsystemstosignificantlyreduceemissions,especiallysulfurdioxide•emissions. Cofiringinvolvesusingbioenergyfeedstockasasupplementaryfuelsourceinhighefficiencyboilers.•Gasificationsystemsusehightemperaturesandanoxygen-starvedenvironmenttoconvertbiomassintoagas•(a mixture of hydrogen, carbon monoxide, and methane). The gas fuels a gas turbine, which runs an electric generator for producing power. •The decay of biomass produces methane gas, which can be used as an energy source.•Methane can be produced from biomass through a process called anaerobic digestion.•Anaerobic digestion involves using bacteria to decompose organic matter in the absence of oxygen. •Inlandfills–scientificwastedisposalsite-wellscanbedrilledtoreleasethemethanefromthedecayingorganic•matter.Thepipesfromeachwellcarrythegastoacentralpointwhereitisfilteredandcleanedbeforeburning.•Methane can be used as an energy source in many ways. •Most facilities burn it in a boiler to produce steam for electricity generation or for industrial processes.•Two new ways include the use of micro turbines and fuel cells.•Micro turbines have outputs of 25 to 500 kilowatts. About the size of a refrigerator, they can be used where •there are space limitations for power production. Methane can also be used as the "fuel" in a fuel cell. Fuel cells work much like batteries, but never need •recharging, producing electricity as long as there is fuel. In addition to gas, liquid fuels can be produced from biomass through a process called pyrolysis. •
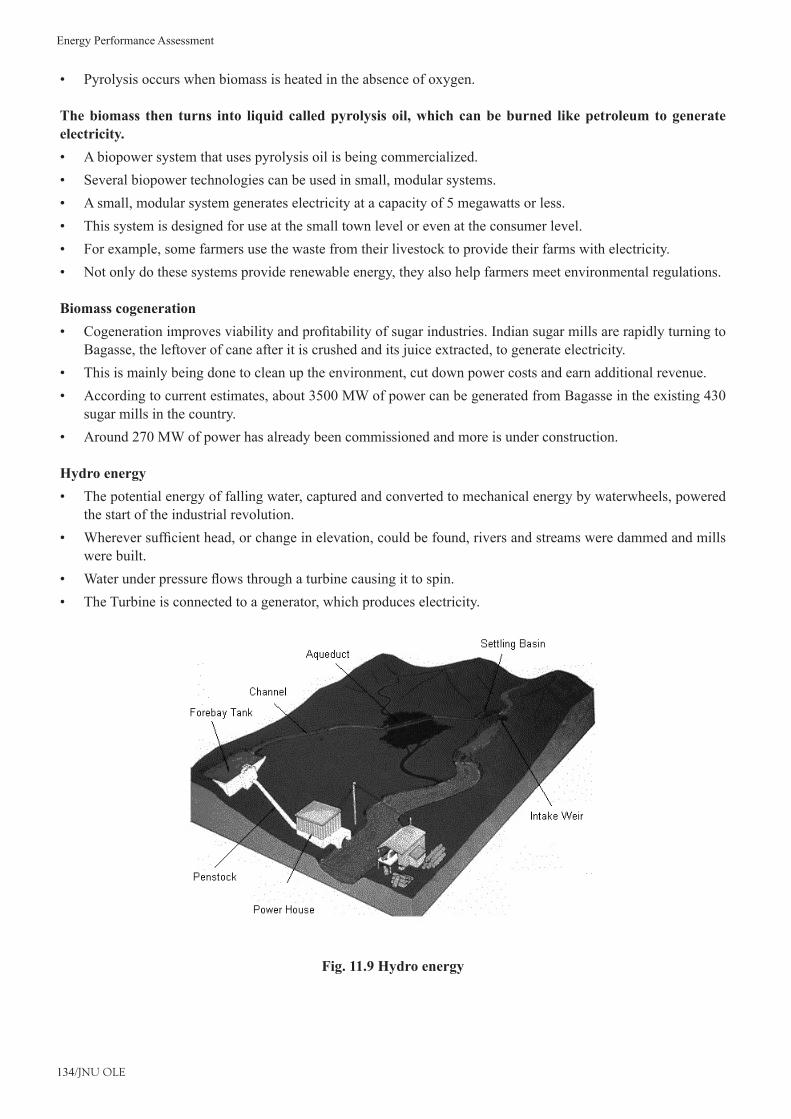
Energy Performance Assessment
134/JNU OLE
Pyrolysis occurs when biomass is heated in the absence of oxygen. •
The biomass then turns into liquid called pyrolysis oil, which can be burned like petroleum to generate electricity.
A biopower system that uses pyrolysis oil is being commercialized. •Several biopower technologies can be used in small, modular systems.•A small, modular system generates electricity at a capacity of 5 megawatts or less.•This system is designed for use at the small town level or even at the consumer level. •For example, some farmers use the waste from their livestock to provide their farms with electricity. •Not only do these systems provide renewable energy, they also help farmers meet environmental regulations.•
Biomass cogenerationCogenerationimprovesviabilityandprofitabilityofsugarindustries.Indiansugarmillsarerapidlyturningto•Bagasse, the leftover of cane after it is crushed and its juice extracted, to generate electricity. This is mainly being done to clean up the environment, cut down power costs and earn additional revenue. •According to current estimates, about 3500 MW of power can be generated from Bagasse in the existing 430 •sugar mills in the country. Around 270 MW of power has already been commissioned and more is under construction.•
Hydro energyThe potential energy of falling water, captured and converted to mechanical energy by waterwheels, powered •the start of the industrial revolution. Whereversufficienthead,orchangeinelevation,couldbefound,riversandstreamsweredammedandmills•were built. Waterunderpressureflowsthroughaturbinecausingittospin.•The Turbine is connected to a generator, which produces electricity.•
Fig. 11.9 Hydro energy

135/JNU OLE
In order to produce enough electricity, a hydroelectric system requires a location with the following features•
Change in elevation or head20 Feet @ 100 gal/min = 200 Watts. 100 feet head @ 20 gal/min gives the same output.•In India the potential of small hydro power is estimated about 10,000 MW.•A total of 183.45 MW small Hydro projects have been installed in India by the end of March 1999. •Small Hydro Power projects of 3 MW capacities have been also installed individually and 148 MW project is •under construction.
11.15 Tidal and Ocean EnergyTidal Energy
Tidal electricity generation involves the construction of a barrage across an estuary to block the incoming and •outgoing tide.The head of water is then used to drive turbines to generate electricity from the elevated water in the basin as •in hydroelectric dams.Barragescanbedesignedtogenerateelectricityontheebbside,orfloodside,orboth.•Tidal range may vary over a wide range (4.5-12.4 m) from site to site. •A tidal rangeof at least7m is required for economicaloperationand for sufficientheadofwater for the•turbines.
Ocean EnergyOceanscovermorethan70%ofEarth’ssurface,makingthemtheworld’slargestsolarcollectors.•Ocean energy draws on the energy of ocean waves, tides, or on the thermal energy (heat) stored in the ocean. •The sun warms the surface water a lot more than the deep ocean water, and this temperature difference stores •thermal energy.The ocean contains two types of energy: thermal energy from the sun’s heat, and mechanical energy from the •tides and waves.
Ocean thermal energyOcean thermal energy is used for many applications, including electricity generation. •There are three types of electricity conversion systems•
Closed-cycle �Open cycle �Hybrid. �
Closedcyclesystemsusetheocean’swarmsurfacewatertovaporizeaworkingfluid,whichhasalowboiling•point, such as ammonia.
The vapour expands and turns a turbine. �The turbine then activates a generator to produce electricity. �Open-cycle systems actually boil the seawater by operating at low pressures. �This produces steam that passes through a turbine / generator. �The hybrid systems combine both closed-cycle and open-cycle systems. �

Energy Performance Assessment
136/JNU OLE
Ocean mechanical energy Ocean mechanical energy is quite different from ocean thermal energy. •Even though the sun affects all ocean activity, tides are driven primarily by the gravitational pull of the moon, •and waves are driven primarily by the winds. A barrage (dam) is typically used to convert tidal energy into electricity by forcing the water through turbines, •activating a generator.
11.16 Waste Minimisation and Resource ConservationTraditionally, waste is viewed as an unnecessary element arising from the activities of any industry. •In reality, waste is a misplaced resource, existing at a wrong place at a wrong time.•Waste is also the inefficientuseofutilities suchaselectricity,water, and fuel,whichareoftenconsidered•unavoidable overheads. The costs of these wastes are generally underestimated by managers. •It is important to realize that the cost of waste is not only the cost of waste disposal, but also other costs such •as:
Disposal cost �Inefficientenergyusecost �Purchase cost of wasted raw material �Production cost for the waste material �Management time spent on waste material �Lost revenue for what could have been a product instead of waste �Potential liabilities due to waste �
11.17 Waste MinimisationWasteminimisationcanbedefinedas"systematicallyreducingwasteatsource".Itmeans:
Prevention and/or reduction of waste generated•Efficientuseofrawmaterialsandpackaging•Efficientuseoffuel,electricityandwater•Improving the quality of waste generated to facilitate recycling and/or reduce hazard•Encouraging re-use, recycling and recovery.•
Waste minimisation is also known by other terms such as waste reduction, pollution prevention, source reduction and cleaner technology. It makes use of managerial and/or technical interventions to make industrial operations inherently pollution free
11.18 Classification of Waste Minimisation (WM) TechniquesThewasteminimisationisbasedondifferenttechniques.Thesetechniquesareclassifiedashereunder.
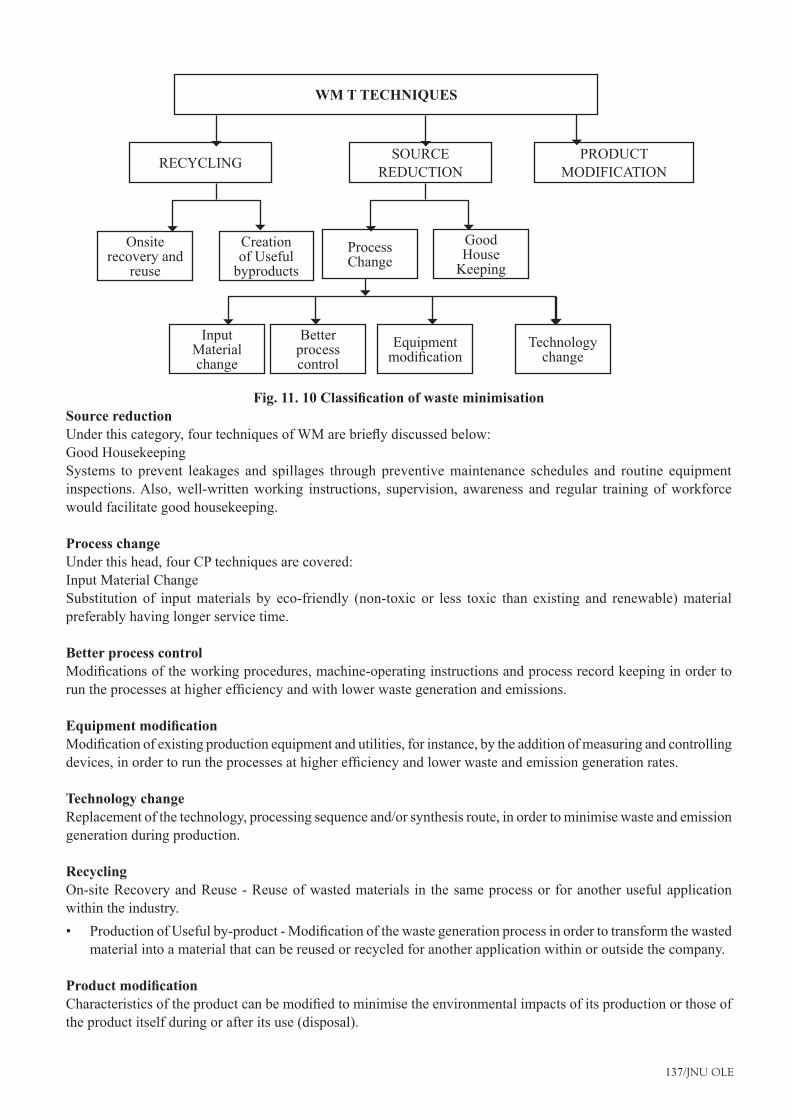
137/JNU OLE
Fig. 11. 10 Classification of waste minimisationSource reductionUnderthiscategory,fourtechniquesofWMarebrieflydiscussedbelow:Good HousekeepingSystems to prevent leakages and spillages through preventive maintenance schedules and routine equipment inspections. Also, well-written working instructions, supervision, awareness and regular training of workforce would facilitate good housekeeping.
Process changeUnder this head, four CP techniques are covered:Input Material ChangeSubstitution of input materials by eco-friendly (non-toxic or less toxic than existing and renewable) material preferably having longer service time.
Better process controlModificationsoftheworkingprocedures,machine-operatinginstructionsandprocessrecordkeepinginordertoruntheprocessesathigherefficiencyandwithlowerwastegenerationandemissions.
Equipment modificationModificationofexistingproductionequipmentandutilities,forinstance,bytheadditionofmeasuringandcontrollingdevices,inordertoruntheprocessesathigherefficiencyandlowerwasteandemissiongenerationrates.
Technology change Replacement of the technology, processing sequence and/or synthesis route, in order to minimise waste and emission generation during production.
RecyclingOn-site Recovery and Reuse - Reuse of wasted materials in the same process or for another useful application within the industry.
ProductionofUsefulby-product-Modificationofthewastegenerationprocessinordertotransformthewasted•material into a material that can be reused or recycled for another application within or outside the company.
Product modificationCharacteristicsoftheproductcanbemodifiedtominimisetheenvironmentalimpactsofitsproductionorthoseofthe product itself during or after its use (disposal).
WM T TECHNIQUES
RECYCLING SOURCE REDUCTION
PRODUCT MODIFICATION
Onsite recovery and
reuse
Creation of Useful
byproductsProcess Change
Good House
Keeping
Input Material change
Better process control
Equipment modification
Technology change

Energy Performance Assessment
138/JNU OLE
11.19 Typical Causes of WastePoor housekeeping •
Leakingtaps/valves/flanges �Spillages �Overflowingtanks �Worn out material transfer belts �
Operational and maintenance negligence• Unchecked water / air consumption �Unnecessary running of equipment �Sub optimal loading �Lack of preventive maintenance �Sub-optimal maintenance of process condition �Ritualistic operation �
Poor raw material quality• Use of substandard cheap raw material �Lackofqualityspecification �Improper purchase management system �Improper storage �
Poor process / equipment design• Mismatched capacity of equipment �Wrong material selection �Maintenance prone design �Adoption of avoidable process steps �Lack of information / design capability �
Poor layout• Unplanned / adhoc expansion �Poor space utilization plan �Bad material movement plan �
Bad technology• Continuation of obsolete technology �Despite product / raw material change �High cost of better technology �Lack of availability of trained manpower �Small plant size �Lack of information �

139/JNU OLE
• Inadequately trained personnelIncreased dependence on casual / contract labour �Lack of formalized training system �Lack of training facilities �Job insecurity �Fear of losing trade secrets �Lack of availability of personnel �Understaffinghenceworkoverpressure �
Employee Demotivation• Lack of recognition �Absence of reward �Emphasis only on production, not on people �Lack of commitment and attention by top management �

Energy Performance Assessment
140/JNU OLE
SummaryPerformingfinancialanalysisisanimportantpartoftheEnergyManager'sjob.Althoughthemanagermaynot•beaspecialistinfinanceitisabsolutelyessentialtoknowthebasics.Withthehelpofaccountingexpertshecan perform this task. Thecalculationsarenotverycomplicatedbuttheyarerequired,asfinanceisthebasicofallactivities.The•chapter gives with examples how to do it in practical cases. The fuel substitution example gives calculations for the project with the important aspect of sensitivity •analysis. Most of the projects are quite critical and it is essential to carry out sensitivity analyses so as to avoid pitfalls •after the execution of the project. With globalization and growing consumerism, the use of energy is on the increase and its effect on the environment •can't be regarded as trivial. The sun is the main source of energy from which the wind, solar, biomass and hydro energy can be •harnessed.Harnessing of non-conventional energy is one of the long term solutions to the problem of growing environmental •degradation. Batteries are going to play an important role in the coming years from the point of view of energy storage and •hence it is prudent to know the developments in this area. The chapter also deals in detail about bio-diesel which is going to be the alternate fuel in the years to come.•What is happening on the global and the Indian scene is also been touched upon.•Waste minimization and resource conservation are equally important. •Waste is not waste but a resource. If we place the resource at wrong place, it becomes waste. However our •attitude has to change and it is absolutely essential to think in terms of resource rather than waste. In fact waste audit should be the essential part of an energy audit. It is also to be remembered that this is a •continual process and can't become one time exercise. With the growing proportion of urban solid waste need to harness energy is most essential part which has been •almost neglected so far.
Recommended ReadingS. Rao, B.B. Parulekar, Energy Technology: Nonconventional, Renewable & Conventional, Khanna Publishers; •3rd edition, p 1144Erich Helfert, Financial Analysis Tools and Techniques: A Guide for Managers, McGraw-Hill; 1 edition, p •480George T. Friendlob(2002), Essentials of Financial Analysis, Wiley; 1 edition, p 288•

141/JNU OLE
Self Assessment
A] Fill in the blanks__________________ are those which vary directly with the output of a particular plant or production process, 1. such as fuel costs.
Variable costsa. Fixed costsb. Total costc. Simple interestd.
___________________ are those costs, which are not dependent on plant or process output, such as site-rent 2. and insurance.
Variable costsa. Fixed costsb. Total costc. Simple interestd.
__________________ sources also called non-conventional energy, are sources that are continuously replenished 3. by natural processes.
Continuouslya. One in a yearb. Twice in yearc. Sometimesd.
__________________ is the most readily available and free source of energy since prehistoric times. 4. Solar energya. Thermal energyb. Electrical energyc. Tidal wave energyd.
India receives solar energy in the region of 5 to 7 kWh/m5. 2 for ________________ in a year.250 to 300 daysa. 300 to 330 daysb. 270 to 300 daysc. 200to 230 daysd.
B] True or False
Which of the following is true?6. Interest charges can be calculated by lending organization in one way: simple interesta. Interest charges can be calculated by borrowing organization in two different ways: simple interest and b. compound interest.Interest charges can be calculated by lending organization in two different ways: simple interest and c. compound interest.Interest charges can be calculated by lending organization in one way: compound interest.d.

Energy Performance Assessment
142/JNU OLE
Which of the following is true?7. The value of the total repayment can be calculated using the equation.a.
TRV=LV+(IR/1000)PThe value of the total repayment can be calculated using the equation.b.
TRV=V+(1+IR/100)PThe value of the total repayment can be calculated using the equation.c.
TRV=L+(1+IR/100)PThe value of the total repayment can be calculated using the equation.d.
TRV=LV+(1+IR/100)P
Which of the following is true?8. Micro turbines have outputs of 25 to 500 kilowatts.a. Micro turbines have outputs of 25 to 600 kilowatts.b. Micro turbines have outputs of 25 to 100 kilowatts.c. Micro turbines have outputs of 25 to 300 kilowatts.d.
Which of the following is true?9. Pyrolysis occurs when biomass is heated in the absence of carbon.a. Pyrolysis occurs when biomass is heated in the absence of oxygen.b. Pyrolysis occurs when biomass is heated in the presence of oxygen.c. Pyrolysis occurs when biomass is heated in the absence of nitrogen.d.
Which of the following is true?10. Cogenerationimprovesviabilityandprofitabilityofsugarindustries.a. Cogenerationdegradesviabilityandprofitabilityofsugarindustries.b. Cogenerationimprovesviabilityandprofitabilityofmanufacturingindustries.c. Cogenerationdegradesviabilityandprofitabilityofmanufacturingindustries.d.
143/JNU OLE
Case Study I
Install steam turbine to existing boiler to generate electricity from superheatedSteamYuanping city Chemical Co. Ltd is a middle-sized chemical plant with 1679 staff, located inShanxi Province in China and is Asia’s largest producers of oxalic acid, and also producedProducts like sodium format and formic acid.
During the plant assessment the Team found that the newly installed #9 boiler yields 35 tonsperhour(t/h)superheatedsteam(3.82MPaand450°C),Butthatthesuperheatedsteamwasused only for process heating. This boiler therefore had a large potential for cogeneration.Coincidentally,thecompanyhadalsoidentifiedthecogenerationpossibilityandhadpurchased a second-hand 3MW turbine. The total investment was US$ 1.43 million, annualelectricity generation was 20196 MWh and the annual savings were US$ 0.61 million. It wascalculated that approximately 1700 tons of coal can be saved each year because cogenerationismoreefficientthanseparateelectricityandheatproduction.Asaresult,CO2 emissionreduction is 4260 tons per year.
During the assessment of the plant following points were observed:Inadditiontothenewlyinstalledboiler#9,thecompanyhasfivesaturatedsteamboilers(1.27MPa)andthree•superheated steam boilers (2.45 MPa, 400oC and 20t/h).Thesteamproductionrateis130t/handonly40t/hofthetotalsteamgeneration(2.45MPa,400°C)isusedto•generateelectricity(3MWh=30%ofallelectricityusedonsite)throughtwonon-condensingturbinegenerators,andtheexitsteamfromturbines(0.3MPa,260°C)isusedinprocessheating.The newly installed boiler #9 uses duns and coal slacks to produce 35 tons superheated steam (3.82 MPa and •450°C).However,thesuperheatedsteamisonlyusedforprocessheating,thismeansthatthereispotentialforcogeneration.
The team proposed an option of using the steam from boiler #9 for cogeneration. A detailed feasibility analysis was notnecessarybecausethecompanyalsohadidentifiedthisoptionpriortotheassessment.Thecompanyinstalledanolder,second-hand3MWhr(duetofinancialconstraints)non-condensingturbinegeneratortogenerateelectricitywiththe3.82MPa,450°Csuperheatedsteam.Theexitsteam(0.7MPa,250°C)fromtheturbinewasusedforprocessheating. Cogeneration at boiler #9 started in February 2005.
Questions:Isinstallationofsteamturbinetoexistingboilerfinancialbenefitingthecompany?Ifyes,thenexplainhow?1.
Suggestions:Theinstallationofstemturbinetoexistingboilerhasdefinitelybenefitedthecompanyfinancial,asthetotal•investment made is US 1.43 million, wherein the annual operation cost incurred is US 11/MWh. Here the annual cost saving was US0.61 million with a payback period of 2.3 years.
Explainhowinstallationofsteamturbinetoexistingboilerbenefitstheenvironment?2. Suggestions:
Theannualcoalsavingsis1700tons,thiswascalculatedbasedona27%efficiencygapbetweencogeneration•and separate production of electricity and heat. It has also been observed that the annual GHG emission reduction to 4260tons CO2.
Whatbenefitdoestheexitsteamfromturbineprovide,whichasuperheatedsteamcannot?3. Suggestions:
Using the exit steam from turbine with a lower pressure and temperature instead of superheated steam, process •heating can improve the heat transfer rate and reduce the heating time
Energy Performance Assessment
144/JNU OLE
Case Study II
Increase of Condensate Recovery from Boiler
TK Chemical Complex Ltd is a privately owned, medium size paper mill located in Chor Khyderpur near Chittagong andproducesofficepaperfortheBangladeshimarket.Condensaterecoverywasincreasedfrom70%to90%byimproved management of condensate that was previously discharged into the sewer. There were no investment costs, annual savings are US$ 8620 and the payback period was immediate. Each year, 12 kiloliters of fuel oil is saved, which is equivalent to 32 tons CO2. In addition, the amount of make up water was reduced.
Condensate recovery was selected as a focus area because steam is mainly used for indirect heating in the paper machinecylindersanditwasconsideredthatsignificantimprovementsinsteamcondensaterecoverycouldbemade.Steam is mostly used for the drying process and is distributed through a 200 mm steam main line.
TheTeamobservedthatcondensaterecoverywasapproximately70%,whichisrelativelylow(idealrecoveryratesarearound90–95%ofthesteamused).Thefacilitatorsandtheconsultantwereinformedthatalargeproportionof condensate that is not recovered is not lost in the process, but is drained during electrical failures and shut downs and is then released into the sewer. As a result, water and furnace oil is wasted because new water must be heated up in the boiler.
The Team proposed to increase the percentage of condensate recovery from the boiler. A tank is needed for the collection of condensate that is currently discharged. An existing in-house condensate tank can be used or it can be sourced locally from the ship-breaking yard. The installation of the tank and connection with the boiler does not needanyprocessorlayoutmodificationandcanbeinstalledwithoutproductiondisruption.However, the companymanaged to increase their condensate recovery from70% to 90%by improvinggoodhousekeeping practice to avoid condensate discharge. The company therefore managed to make savings without investment costs.
Questions:How can condensate recovery boiler be used in paper machine cylinders?1. Explaintheenvironmentalbenefitsfromcondensaterecoveryfromboiler?2. What is the required steam recovery rate? How can one increase the condensate recovery rate?3.

145/JNU OLE
Case Study III
Increase of Inlet Duct Diameter of Circulating Air Fan to Reduce Flow Velocity andPressure Drop
Coromandel Cements Ltd., is a small OPC cement (Ordinary Portland Cement) manufacturingplant in South India, presently producing around 460 tons per day of OPC. The company iscontinuouslystrivingtoimproveitsoperatingefficiencyandhasbenefitedenormouslyafteradopting the methodology for resource and energy conservation in their plant. The unit plans tomodify and expand their plant system and equipment capacities gradually in two phases.
ThefirstphasemodificationsthatwereplannedandwhichareunderwayincludeinstallationofGasConditioning Tower and Electro Static Precipitator, which would result in reduced powerconsumption.Inthesecondphase,modificationofPrecalcinator,Gratecooler,CyclonesandCement mills would take the plant capacity up to 900 TPD.
Thecoalismilledtoafinepowder(45mesh)andisconveyedtothestoragehopperpneumatically by air being sucked through the circulating air fan. Towards this the fan consumespowerwhichisdependantonquantityofmaterialtobeconveyedflowandthepressuredropsithas to encounter in this process. The duct diameter from dust collector outlet to CA fan inlet wasincreased from 500 to 600mm, thereby decreasing the pressure drop and in turn achieving powersaving. This resulted in a reduction in power consumption by CA fan to the tune of 0.2 kWtotaling 744 kWH per year.
Questions:Explain the two phases that the company acquired to expand their plant system and equipment capacities?1. Suggestasubstitutemethodtoreduceflowvelocityandpressuredroptothecompany?2. How can we decrease the pressure drop and yet save power?3.

Energy Performance Assessment
146/JNU OLE
Bibliography
References“• Modern Power Station Practice”–BritishElectricityInternational-Volume–G;Chapter–7–Plantperformanceand performance monitoring. “• Process Heat Transfer” by D.Q.Kern, Edn. 1965. Alternate Energy Sources• by T H Taylor.Adam Hilger Ltd, BristolBritish Standard• : BS 848 : Part 1 : 1980 Compressor performance – Aerodynamics for the user• by M Theodore Gresh-Butterworth HeinemannCoulsons & Richardson’s CHEMICAL ENGINEERING Volume 3 third edition •Energy and Environmental Audit Reports of National Productivity Council • Energy audit Reports of National Productivity Council • Energy Cogeneration Handbook• , George Polimeros, Industrial Press Inc. Energy Hand book• , Second edition, Von Nostrand Reinhold Company - Robert L.Loftness Energy Management, Supply and Conservation• , Dr. Clive Beggs, .Butterworth HeinemannGanapathy. V, “• Fouling factor estimated quickly”, O&G Journal, Aug 1992. Handbook of Energy Conservation for Industrial Furnaces• , Japan Industrial Furnace Association. Improving furnace efficiency• , Energy Management Journal Industrial boilers• ,LongmanScientificTechnical1999www.boiler.comwww.eng-tips.comwww.worldenergy.org Industrial Furnace, Volume 1 and Volume 2• , John Wiley & Sons - Trinks IS 10431:1994: Measurement of airflow of compressors and exhausters by nozzles• IS 5456:1985 code of practice for testing of positive displacement type air compressors and exhausters• Liberman, Norman P, • Trouble shooting Process Operations, Penwell Books, Tulsa, Oklahoma Modern Air Conditioning Practice• by Norman C.Harris - McGraw-Hill International Edition.Motor challenge: Office of Industrial Technologies• , Department of Energy, USA NPC report on ‘Assessing cogeneration potential in Indian Industries’• Pump handbook• by Karassik Refrigeration and Air Conditioning• byRichardC.Jordan&GayleB.Priester–PrenticeHallofIndiapvt.ltdRenewable Energy Sources for rural areas in Asia and Pacific• , APO, Tokyo, 2000Scimod “ • Scientific Modeling Software”, techno software International, India www.ireda.org•www.windenergy.com•
Recommended ReadingAnthony Giampaolo, • Compressor Handbook: Principles and Practice, CRC Press; 1 edition, p 300Arthur Williams(2004), • Pumps as Turbines: A User's Guide, Practical Action; 2nd edition, p 80Bimal K Bose, • Power Electronics and Variable Frequency Drives: Technology and Applications, Wiley-IEEE Press, p 660Bloch, • Calculation Procedure for Nozzle Method , Wiley-Interscience; 2 edition, p 590Erich Helfert, • Financial Analysis Tools and Techniques: A Guide for Managers, McGraw-Hill; 1 edition, p 480Frank Bleier(1997), • Fan Handbook: Selection, Application, and Design, McGraw-Hill Professional; 1 edition,
147/JNU OLE
p 640Fredrick M. Steingress, Harold J. Frost, 2009, • High Pressure Boilers, Amer Technical Publications, p 344George T. Friendlob(2002), • Essentials of Financial Analysis, Wiley; 1 edition, p 288H.S.Lee(2010), • Thermal Design: Heat Sinks, Thermoelectrics, Heat Pipes, Compact Heat Exchangers, and Solar Cells, Wiley; 1 edition, p 648James E. Brumbaugh(2004), • Audel HVAC Fundamentals, Heating Systems, Furnaces and Boilers, 4 edition, Audel, p 720.James Rishel, • Water Pumps and Pumping Systems, McGraw-Hill Professional; 1 edition, p 912Malcolm Barnes CPEng(2003), • Practical Variable Speed Drives and Power Electronics, Newnes; 1 edition, p 304Meherwan P Boyce(2006), • Power Generation Handbook : Selection, Applications, Operation, Maintenance, Gulf Professional Publishing; 3 edition, p 962.Michael Brumbach(2005),• Electronic Variable Speed Drives, Delmar Cengage Learning; 3 edition, p 312Mohammed Malek, • Heating Boiler Operators Manual: Maintenance, Operation and Repair, McGraw-Hill Professional, 1 edition, p 352Philip Kiameh, • Power Generation Handbook : Selection, Applications, Operation, Maintenance, McGraw-Hill Professional, 1edition, p 560.Roger Vizi (1999),• Forced Hot Air Furnaces: Troubleshooting and Repair, McGraw-Hill Professional. p 344.Rolf Kehlohofer, Frank Hannemann, Franz Stirnimann(2009), • Energy performance assessment of cogeneration systems with steam and gas turbines, PennWell Corp, p 430.Royce Brown, Compressors, Third Edition: • Selection and Sizing , Gulf Professional Publishing; 3 edition, p 640.S. Rao, B.B. Parulekar, • Energy Technology: Nonconventional, Renewable & Conventional, Khanna Publishers; 3rd edition, p1144.Sadik Kakac(2002),• Heat Exchangers: Selection, Rating, and Thermal Design, 2 Edition, CRC Press, p 520.Sam G.Duleglow, • The Control of Boilers, Instrument Society of America, p 412.W. M. Kays(1998), • Compact Heat Exchangers, Krieger Publishing Company; 3 Sub edition,p 335.William Cory, • Fans and Ventilation: A practical guide, Elsevier Science; 1 edition, p 424.

Energy Performance Assessment
148/JNU OLE
Self Assessment Answers
Chapter I1. a2. c3. a4. a5. c6. b7. a8. b9. c10. d
Chapter II1. a2. a3. c4. d5. b6. c7. a8. c9. d10. d
Chapter III1. a2. a3. a4. d5. b6. a7. d8. a9. a10. d
Chapter IV1. d2. d3. d4. a5. b6. a7. a8. b9. c10. d

149/JNU OLE
Chapter V 1. a 2. a 3. b 4. b 5. a 6. b 7. c 8. a 9. a 10. a
Chapter VI1. a2. c3. b4. a5. b6. b7. b8. a9. b10. a
Chapter VII 1. a 2. a 3. b 4. b 5. a 6. b 7. b 8. d 9. d 10. c
Chapter VIII 1. a 2. b 3. a 4. a 5. b 6. b 7. b 8. a 9. d 10. a

Energy Performance Assessment
150/JNU OLE
Chapter IX1. a2. b3. b4. b5. c6. b7. a8. c9. a10. b
Chapter X 1. b 2. a 3. a 4. b 5. c 6. d 7. a 8. b 9. b 10. c
Chapter XI1. a2. b3. a4. a5. b6. c7. d8. a9. b10. a