energy performance of commercial buildings with radiant ... · a study within the “optimizing...
TRANSCRIPT

A Study within the “Optimizing Radiant Systems for Energy Efficiency and Comfort” Project
Authors
New Buildings Institute Cathy Higgins Kevin Carbonnier, PhD
Project Lead
UC Berkeley Center for the Built Environment
Prepared for
California Energy Commission EPC-14-009 CEC Manager: Jackson Thatch
June 2017
Energy Performance of
Commercial Buildings
with Radiant Heating
and Cooling

NBI June 2017 ii CEC EPIC 14-009
Abstract
This report is part of Task 5 within the California Energy Commission (CEC) EPIC project (EPIC-14-
009) Optimizing Radiant Systems for Energy Efficiency and Comfort managed through the Center
for the Built Environment at UC Berkeley. The main goal of this research was to determine the
building characteristics of projects with radiant heating and cooling and assess their real world
energy use compared to standard benchmarks for building energy performance. The energy use
was self-reported through surveys and utility data and is based on whole building site energy use
for a minimum of 12 months. System-level efficiency and energy savings opportunities are
addressed in another part of the research project.
The report describes the general building characteristics including type, size, location and climate
zone of 23 buildings in North America with radiant distribution systems for both heating and
cooling the predominant area of the building. The study found that almost all of the 23 buildings
outperformed peer buildings and national benchmarks, suggesting that radiant systems are part of
the integrated approach that can lead to low energy consumption in commercial buildings. Some
operator perspectives from the survey are included to inform design and operation factors
regarding radiant systems.
The findings from other parts of the full project are reported separately and will be available on
CBE and the CEC EPIC site in late 2017 and in 2018.
Acknowledgments
NBI would like to thank the California Energy Commission and the California EPIC (Electric Program
Investment Charge) Grant Program for funding this research, Fred Bauman at UC Berkeley Center
for the Built Environment (CBE) for directing the full research project, and Stefano Schiavon, Paul
Raftery, Lindsay Graham and Caroline Karmann from CBE and Gwelen Paliaga from TRC for their
role on the research team to guide the study and provide valuable technical contributions and
review.
Key Words
Radiant Systems, Benchmarking, Energy Use Intensity, Occupant Feedback, Operator Feedback,
Commercial Buildings, High-Performance, EnergyStar
For more information regarding this study contact:
Cathy Higgins [email protected] Kevin Carbonnier [email protected]
For more information regarding the larger CEC EPIC Radiant Research Project:
Fred Bauman [email protected]

NBI June 2017 CEC EPIC 14-009
Table of Contents Introduction.................................................................................................................................................... 1
Methodology .................................................................................................................................................. 2
Target Building Set .................................................................................................................................... 2
Data collection ........................................................................................................................................... 3
Data Collection Challenges ................................................................................................................... 4
Data analysis ............................................................................................................................................. 4
Energy Performance Metrics ................................................................................................................. 4
Building Characteristics ................................................................................................................................. 5
Climate Zones ........................................................................................................................................... 6
Size ........................................................................................................................................................... 6
Types ......................................................................................................................................................... 7
Heating Ventilation and Air Conditioning (HVAC) Technologies .............................................................. 7
Energy Performance ..................................................................................................................................... 8
Site Energy Use of the Research Dataset ................................................................................................ 8
Comparative Energy Use .......................................................................................................................... 9
Energy Use Intensity ........................................................................................................................... 10
EnergyStar Scores .............................................................................................................................. 12
Radiant within the Context of Overall Energy Use ...................................................................................... 12
Operations Opinions ................................................................................................................................... 13
Summary ..................................................................................................................................................... 14
Building Characteristics ........................................................................................................................... 15
Energy Performance ............................................................................................................................... 15
Comparative Energy Use .................................................................................................................... 16
Radiant Systems Support Low-Energy Results ...................................................................................... 16
Operator Perspective .............................................................................................................................. 17
Next Steps ............................................................................................................................................... 17
Appendix ................................................................................................................................................... A-1
Data Sources ........................................................................................................................................ A-1
Benchmark Sources .............................................................................................................................. A-1
Surveys Used in the Study .................................................................................................................... A-2
EnergyStar Calculation Parameters ...................................................................................................... A-2

NBI June 2017 CEC EPIC 14-009
List of Figures and Tables Figure 1: Building count by climate zone of the studied building set ............................................................ 6
Figure 2: Building size distribution of the studied building set ...................................................................... 7
Figure 3: Building type distribution of the studied building set ...................................................................... 7
Figure 4: Individual building EUIs of the research building set color-coded by building type. n=23 ............. 9
Figure 5: Box plot bounding 25th and 50th percentile EUI of the research set and various benchmarks .. 11
Figure 6: Calculated EnergyStar scores for analyzed buildings. Scaled from 1-100. n=21 ....................... 12
Figure 7: Total site building energy use of the research building dataset n=23 ......................................... 15
Figure 8: Box plot bounding 25th and 50th percentile EUIs of the research set and various benchmarks 16
Table 1: Radiant criteria used to prioritize buildings for outreach efforts ...................................................... 3
Table 2: Online surveys for data collection ................................................................................................... 3
Table 3: Basic building characteristics of studies building set ...................................................................... 5
Table 4: Building characteristics and EUI of the research building set sorted by type and EUI ................... 8
Table 5: Comparison of EUI (kBtu/ft2) of research building to national benchmarks ................................ 10
Table 6: Percent energy use reduction of research buildings compared to national benchmarks ............. 11
Table 7: Highlighted feedback from building operators and designers grouped by recurring themes ....... 14
Table 8: Building dataset and EnergyStar score calculation inputs .......................................................... A-2

NBI June 2017 Page 1 CEC EPIC 14-009
Energy Performance of Commercial Buildings
with Radiant Heating and Cooling
Introduction The Energy Performance of Commercial Buildings with Radiant Heating and Cooling report (Energy
Report) is part of the larger California Energy Commission (CEC) EPIC project managed through the
Center for the Built Environment (CBE) at UC Berkeley: Optimizing Radiant Systems for Energy Efficiency
and Comfort. The Energy Report, led by New Buildings Institute (NBI) is a part of Task 5, whose main
goal is to gather field evidence from buildings to investigate Energy Performance and Occupant Comfort.
The findings from the Occupant Comfort Study are reported separately.
While radiant systems have been commonly used for heating, the application of radiant for the cooling
side is less common. This report documents the whole building site energy performance of a set of 23
commercial buildings in North America that employ both radiant cooling and radiant heating systems.
The research focused on buildings that employ the radiant systems in at least one of three forms: a)
Thermally Activated Building Systems (TABS) – the radiant piping system is embedded in the building
structure (typically concrete floor slab), 2) Embedded Surface Systems (ESS) – the radiant piping system
is embedded within the surface layer (not within the structure), and 3) Radiant ceiling panels (RCP) –
where the radiant piping is in metal panels suspended from the ceiling1. The objectives of the study of
energy performance are three-fold:
1. Document a variety of building types and sizes as real world project examples of buildings that
are meeting both heating and cooling through radiant systems.
2. Increase data on the actual energy performance of buildings using radiant heating and cooling
systems.
3. Benchmark and compare the energy use and related savings of the research radiant buildings
against industry common and best practice buildings.
These outcomes provide a representation of radiant buildings and their overall energy performance,
help establish a baseline from which to compare non-radiant buildings, and provide empirical
performance data to support other parts of the overall project to estimate the energy savings potential
of radiant buildings. The Energy Report findings present the absolute and comparative energy
performance of the study set of buildings based on two industry standard energy use and benchmarking
metrics:
1. Energy Use Intensity (EUI). Energy use intensity is the most common metric of energy
performance and is represented by converting all annual fuel uses to thousands (k) of British
Thermal Units (Btu) divided by the total conditioned square feet (ft2) of the building resulting in
the metric of kBtu/ft2. The EUIs of the study dataset are compared to subsets of a) the U.S
Energy Information Agency (EIA) Commercial Building Energy Consumption Survey (CBECS 2012)
and b) the current Department of Energy (DOE) Building Performance Database (BPD). EUIs are
1 This study did not investigate differences in energy use based on system type as all analysis was on whole building site energy use.

NBI June 2017 Page 2 CEC EPIC 14-009
also shown for NBI’s Getting to Zero database of Zero Net Energy buildings to add the context of
buildings striving for exceptionally low energy performance.
2. EnergyStar Score. EnergyStar is a program of the U.S. Environmental Protection Agency (EPA)
resulting in a score and label based on CBECS with adjustments based on actual building
characteristics and location.
In addition to analysis using the two energy performance metrics above, we summarized other data
collected in the study including HVAC heating and cooling sources, climate zone, LEED status, and other
noteworthy building characteristics. We have also included a small sample of feedback from building
operators on their real-world experiences with radiant cooling and heating systems. This information
can inform other aspects of the larger CEC-CBE study that are investigating design, application and
operational factors of current and emerging radiant system designs. A set of case studies, produced in
summer 2017, provide project specific outcomes for design, energy and occupant satisfaction results.
Methodology The study relied on identification of buildings with radiant systems and the ability to obtain data and
survey responses from representatives of those buildings. The research team utilized the following
sources to find buildings: a) existing datasets of radiant buildings from CBE, b) advanced and zero net
energy buildings from NBI, c) review of industry case studies, and d) relationships the project team had
with leading design firms. The application and modifications to these initial resources within the study
are described below.
Target Building Set We began with a target building set for the study based on CBE’s online database of radiant buildings
(http://bit.ly/RadiantBuildingsCBEv2). To this set, we added other potential building candidates from
NBI’s Getting to Zero (GtZ) database (http://newbuildings.org/resource/getting-to-zero-database/), as
well as selections from industry case studies and outreach to building architect and engineering firms
involved in design for radiant buildings2. At the start of the study, we identified nearly 300 buildings in
the initial list of potential candidates.
To meet the applicability to the research, we culled the list of candidate buildings that met certain
criteria, including: building type, building size, occupancy size, proportion of building served by radiant,
presence of radiant cooling, target types of radiant systems, region, and duration of full occupancy.
Table 1 describes parameters for inclusion in the study set. The goal of this process was to ensure the
candidate buildings were predominantly heated and cooled with one or more of the radiant systems
shown in Table 1 and that they were types, sizes and climates transferable to the California commercial
market and overall research objectives.
2 See Appendix for list of sources

NBI June 2017 Page 3 CEC EPIC 14-009
Table 1: Radiant criteria used to prioritize buildings for outreach efforts
Category Criteria Guideline for Study
Building Type Office, Education, Library, Government, Retail
Building Size 7,500 ft2 or larger
Region North America
Radiant Use Heating and Cooling
Radiant Proportion Primary system in majority of building
Radiant System Type TABS, ESS, and/or RCP
Occupancy 12 month minimum
After screening the initial set for these criteria and conducting extensive outreach to determine the
applicability of the buildings to the study, the revised set of potential participants was approximately
half (146). One significant part of this reduction was the common finding that buildings initially
identified as ‘radiant’ only applied it to a small portion of the building such as a foyer or that it was only
used for heating and not applied to cooling.
Data collection To collect data for each building, we developed two new online surveys to supplement the existing
survey from CBE on Building Characteristics (http://www.cbe.berkeley.edu/survey/). Table 2 outlines
the two new energy-related surveys. For the energy benchmarking we needed participation from both
the building designer and the building operator to gather building characteristics and building energy
and operational data. The Energy Consumption and Operational Parameters were linked so that if the
respondent had the energy performance data and served as the operations person of the building they
could reply to a single survey.
Table 2: Online surveys for data collection
Survey Completed By Data Collected
Building Characteristics Architect or MEP General info, certifications, systems, windows and shading, controls
Energy Consumption Owner, Building Manager and/or Building Operator
Energy usage, system types, energy tracking and targets, benchmarking data
Operational Parameters Building Operator Set points, controls, reliability, and lessons learned
The outreach phase for this project spanned over a year from December 2015 to February 2017. After
initial research to catalog design team information for candidate buildings, NBI and CBE leveraged
existing relationships with building designers to facilitate initial communications. These existing
relationships were helpful in facilitating the data collection process for buildings and identifying a
building operator and getting participation from multiple parties to complete the online surveys.

NBI June 2017 Page 4 CEC EPIC 14-009
Data Collection Challenges We encountered several challenges in the outreach and data collection phase. First, identifying and
getting in touch with the building architect or MEP engineer took considerable effort in cases where
neither NBI nor CBE had an existing relationship. In many cases, the designer was either unresponsive,
too busy to share information, or had left the design firm. The burden to fill out the surveys without
having worked directly on the project in question proved too high for design firms in cases where the
primary architect or engineer had left the company. Even in cases with strong professional relationships
between the study team members and the building design team responses were slow and/or included
references to a variety of other parties which took the study team up to dozens of outreach efforts to
attempt to find the correct contact.
As we first encountered these challenges, we budgeted gift cards to offer an incentive for designers to
participate in the study. The gift cards helped to slightly increase the response rate and, after retiring
projects with no responsiveness after multiple attempts, the team had a next phase set of
approximately 45 buildings with correct contacts that indicated a willingness to respond to the research
surveys.
Of these 45 willing candidates, the resulting study set of 23 represents about a 50% success rate. The
additional reduction was due in part to the continued problem of getting through to the appropriate
parties for these buildings and the inevitable issue of survey completeness. This proved to be another
challenge requiring additional follow up with designers and/or outside research to gather critical pieces
of information omitted in the surveys. Examples of missing data include energy data, heating and
cooling systems, hours of operation, number of occupants, and contradictory building sizes.
Although the original target was 50 buildings the lack of a large number of available buildings that
fulfilled the criteria described above brought the final number of analyzed buildings in this Energy
Report down to 23. This represents data from 16% (23/146) of the final building set that met the criteria
and is a reasonable research participation result. The data set for these 23 buildings provides the largest
dataset of actual radiant heated and cooled building energy performance known to the research team
and provides new references to contribute to the estimation of potential savings from the use of radiant
heating and cooling.
Data analysis The data analysis methodology utilized standard energy performance metrics and datasets from which
to a) represent the research dataset energy performance and b) compare it to national benchmarks and
calculate energy use differences.
Energy Performance Metrics We report and compare energy consumption for the research buildings and the national benchmarks
datasets of actual energy performance as EUI with units of kBtu/ft2. EUI is a widely used metric in the
building and energy industry. The main advantage of this metric is that it is easy to calculate and
understand. The tradeoff is that EUI does not take into account climate, building type, number of
occupants or other factors that affect energy usage. To account for these additional factors and allow

NBI June 2017 Page 5 CEC EPIC 14-009
for a more robust comparison of building performance, we have calculated EnergyStar scores using the
Portfolio Manager Target Finder tool3.
EnergyStar scores are currently available for a wide range of specific building types but do not cover
every building type. For buildings in the dataset that did not precisely align with an EnergyStar building
type we used the nearest building type to estimate the building’s score. Two buildings in our dataset, a
Community and a Visitor Center, did not have a similar building type so do not have a score.
A description of each benchmark is in the Energy Performance Section of this report.
Building Characteristics The buildings in our research building set had several leading design aspects in common. We observed
that efficient HVAC technology, design targets, passive designs, and certifications are common in our
building set. The majority of studied buildings were LEED platinum (74%), with two even reaching Living
Building Challenge4 certification and all but one project reached some level of LEED certification. We
also found a good diversity in size and building type in the research dataset that reflects a broad range
of market applicability. We anonymized and assigned a simple ID number to each building and represent
the basic building characteristic findings from the 23 buildings reflecting four building types in Table 3
including location, type, size, and climate zone.
Table 3: Basic building characteristics of studies building set
Building ID
City State Type Size (ft2) Year Built / Last
Renovation Climate Zone 5
1 Fort Collins CO Education 95,000 1936 / 2014 5B
2 Portland OR Office 10,000 1910 / 2004 4C
3 Vancouver BC Library 36,000 1900 / 2010 4C
4 Berkeley CA Office 45,000 2009 / None 3C
5 Vaughan ON Office 60,000 2004 / None 6A
6 Portland OR Office 440,000 2013 / 2013 4C
7 San Jose CA Office and Lab 50,000 2011 / None 3C
8 San Francisco CA Education 200,000 2013 / 2013 3C
9 Eugene OR Education 92,000 2013 / None 4C
10 Port Coquitlam BC Community Ctr. 14,500 2006 / None 4C
11 Winnipeg MB Office 700,000 2009 / 2009 7A
12 Golden CO Office 360,000 2010 / 2012 5B
13 Salem OR Office 147,000 1950 / 2012 4C
14 Atlanta GA Office 44,000 1986 / 2010 3A
15 Claremont CA Education 75,000 2015 / None 3B
16 Portland OR Office 205,000 2010 / None 4C
17 Victoria BC Office and Lab 16,150 2012 / None 4C
18 Sonoma CA Medical Housing 16,000 2014 / None 3C
3 Portfolio Manager Target Finder: https://portfoliomanager.energystar.gov/pm/targetFinder 4 The Living Building Challenge (LBC) https://living-future.org/lbc/ 5 ASHRAE http://buildingadvisor.com/wp-content/uploads/2014/05/USA-Climate-Zone-Map-ASHRAE.jpg

NBI June 2017 Page 6 CEC EPIC 14-009
Building ID
City State Type Size (ft2) Year Built / Last
Renovation Climate Zone 5
19 Vancouver BC Visitor Ctr. / Public Assembly
19,400 2011 / None 4C
20 Berkeley CA Library 9,400 2013 / None 3C
21 Varennes QC Library 24,000 2012 / None 6A
22 Seattle WA Office 52,000 2013 / None 4C
23 Clemson SC Education 50,300 2012 / None 3A
Climate Zones Although our criteria included buildings from anywhere in North America, the majority of the final
analyzed building set is in temperate marine climate zones, most commonly 4C (42% - Coastal Pacific
Northwest, Mixed Marine) and secondly in 3C (21% - Coastal California, Warm-Marine). The remaining
buildings span 5 other climate zones including: 3A (warm-humid), 3B (warm-dry), 5B (cool-dry), 6A (cool-
humid), and 7A (very cold). Figure 1 shows the distribution of climate zones in the building set.
Figure 1: Building count by climate zone of the studied building set
Size The building sizes are diverse, with buildings greater than 50,000 ft2 representing 52% of the buildings
but 90% of the total square feet in the dataset. Figure 2 further divides this dataset displaying the range
of building sizes. The final set has a relatively even distribution, with three size bins each having six
buildings. Note that the research set of buildings was limited to those larger than 7,500 ft2.

NBI June 2017 Page 7 CEC EPIC 14-009
Figure 2: Building size distribution of the studied building set
Types The study set is distributed between four broad building types as designated by the initial study criteria.
Office buildings were the most common, making up nearly half of the final set. Education, library, and
other building types make up the rest of the sample as shown in Figure 3. The few buildings that had
some mixed uses are categorized by predominant occupancy.
Figure 3: Building type distribution of the studied building set
Heating Ventilation and Air Conditioning (HVAC) Technologies For heating more than half of the studied buildings (58%) use a ground-source heat pump. Other heating
systems used by these projects included air source heat pumps, boilers, or district steam. The use of
boilers was both as primary systems and for supplemental heating to assist the ground or air source
heat pump. One project (ID: 10) used a gas fired rooftop unit as a backup system, which may explain in
part the higher energy usage of that project.
For cooling, systems were diverse and often applied as a mixed-mode approach with cooling provided in
stages starting with operable windows or natural ventilation. Chillers with cooling towers were the most

NBI June 2017 Page 8 CEC EPIC 14-009
common cooling source (30%) for the radiant system. Other cooling systems used ground source, air-
cooled chillers, or heat recovery chillers.
Energy Performance The results in this section highlight the overall site energy performance of the 23 sample set of radiant
buildings collected through our research. These findings on the energy use of the dataset are then
compared to the two metrics previously introduced – Energy Use Intensity and EnergyStar Score.
Site Energy Use of the Research Dataset The energy use of the 23 buildings in the research is based on metered utility bills and thus reflects the
site energy use at the building. The energy use is reported in Table 4 in kBtu/ft2 (EUI) and the buildings
are sorted first by type and then by EUI.
Table 4: Building characteristics and EUI of the research building set sorted by type and EUI
Building ID
City State Type Size (ft2) Year Built / Last Renovation
EUI
22 Seattle WA Office 52,000 2013 / None 12
6 Portland OR Office 440,000 2013 / 2013 32
12 Golden CO Office 360,000 2010 / 2012 36
13 Salem OR Office 147,000 1950 / 2012 36
16 Portland OR Office 205,000 2010 / None 46
2 Portland OR Office 10,000 1910 / 2004 48
5 Vaughan ON Office 60,000 2004 / None 55
11 Winnipeg MB Office 700,000 2009 / 2009 62
4 Berkeley CA Office 45,000 2009 / None 144
14 Atlanta GA Office 44,000 1986 / 2010 176
7 San Jose CA Office and Lab 50,000 2011 / None 37
17 Victoria BC Office and Lab 16.150 2012 / None 48
9 Eugene OR Education 92,000 2013 / None 27
1 Fort Collins CO Education 95,000 1936 / 2014 28
8 San Francisco CA Education 200,000 2013 / 2013 37
23 Clemson SC Education 50,300 2012 / None 43
15 Claremont CA Education 75,000 2015 / None 52
21 Varennes QC Library 24,000 2012 / None 15
20 Berkeley CA Library 9,400 2013 / None 23
3 Vancouver BC Library 36,000 1900 / 2010 154
18 Sonoma CA Medical Housing 16,000 2014 / None 32
19 Vancouver BC Visitor Ctr. / Public Assembly 19,400 2011 / None 38
10 Port Coquitlam BC Community Ctr. 14,500 2006 / None 143
In Figure 4 the energy performance of the research dataset of buildings shows the majority of buildings
in the lower end of energy use with a few outliers. The factors driving the higher energy use in these
outliers are not known but the reasons usually include longer hours of operation, higher density of
occupants, and possible controls issues in addition to design characteristics which may not have
optimized the envelope. More relevant is that the majority of the radiant research buildings are under
50 kBtu/ft2 with few even below 25 kBtu/ft2. The relationship of these energy performance levels to
comparative building sets is discussed in the subsequent section.

NBI June 2017 Page 9 CEC EPIC 14-009
Figure 4: Individual building EUIs of the research building set color-coded by building type. n=23
Comparative Energy Use The energy use of the research dataset is compared to publicly available data on energy use and energy
scores of similar buildings. In this study the following datasets are used in the analysis:
1. U.S Energy Information Agency (EIA) 2012 Commercial Building Energy Consumption Survey
(CBECS 2012)6. CBECS is the national sample survey on the stock of U.S. commercial buildings,
including their energy-related building characteristics and actual energy usage data of 6700 U.S.
buildings representative of the approximate the U.S. non-mall building stock of 5.6 million
buildings and 87 billion square feet of floor space.
2. Department of Energy (DOE) Building Performance Database (BPD)7 is the nation's largest
dataset of information about the energy-related characteristics of commercial and residential
buildings. The BPD combines, cleanses and anonymizes data collected by Federal, State and
local governments, utilities, energy efficiency programs, building owners and private companies.
The BPD is an ongoing database that merges many datasets including the California Commercial
Energy Use Survey (CEUS 2006) as well as self-reported data.
3. New Building Institute’s Getting to Zero (GtZ) Database of Zero Net Energy buildings8. The GtZ
includes information on measured and modeled energy performance, environmental
characteristics, design process, finances, and other aspects of project at or striving to be Zero
Net Energy.
4. The U.S. Environmental Protection Agency (EPA) EnergyStar Program includes a scoring and
certification program for commercial buildings based on CBECS with adjustments based on
actual building characteristics and location. EnergyStar benchmark methodology has been
recently questioned9 but is the most widely market-adopted energy benchmarks in the U.S. with
6 CBECS 2012 https://www.eia.gov/consumption/commercial/ 7 DOE BPD https://energy.gov/eere/buildings/building-performance-database 8 NBI GtZ database http://newbuildings.org/resource/getting-to-zero-database/ 9 Scofield, J. ACEEE proceeding 2014 http://aceee.org/files/proceedings/2014/data/papers/3-725.pdf

NBI June 2017 Page 10 CEC EPIC 14-009
more than 28,000 commercial buildings and 5 billon square feet of commercial floor space
certified10. In addition, the EnergyStar score is used as the basis for city-adopted policies
requiring benchmarking that currently is in place in 19 cities impacting over 5 billion square feet
of commercial floor space11.
The CBECS and BPD subsets are filtered to closely match the radiant building set. Filters include size
(7,000 ft2 to 300,000 ft2), building type (office, education, and library), and location (pacific region for
CBECS; climate zones 3A, 3B, 3C, 4C, 5B for the BPD). To add more context NBI’s GtZ Database,
considered the highest performance buildings in the market, is filtered for Zero Net Energy (ZNE)
buildings with measured energy performance and included as an additional benchmark. Note that CEUS
is omitted as a benchmark in this section due a) unavailable data granularity to compute metrics other
than average energy use and b) the research dataset includes many buildings outside of California
climate zones.
Energy Use Intensity The EUI of the analyzed buildings is lower (better) than national benchmarks. Table 5 shows the EUIs of
the research dataset compared to the three national datasets across the three predominant building
types in the research.
As shown in Table 5, the median EUI of the full research dataset of buildings is 38 kBtu/ft2, while the
average EUI (not shown) is 56 kBtu/ft2. In Table 6, the EUIs of the research set of radiant buildings is
represented as a percent lower energy use than the benchmarks. By building type, offices consume 22-
27% less and education consume 14-23% less energy than the national benchmark references. Library
energy use is the greatest difference with the research dataset consuming 58-66% less energy than the
benchmarks. The full dataset uses 31 and 32% less energy than the BPD and CBECs subset databases,
respectively.
Table 5: Comparison of EUI (kBtu/ft2) of research building to national benchmarks
Building Type Research Set
Median EUI
2012 CBECS12
Subset Median
EUI
BPD13 Subset
Median EUI
Net Zero
Energy14
Median EUI
Office 46 59 63 22
Education 37 48 43 18
Library 23 67 55 18
All Buildings 38 56 55 18
10 EnergyStar 2015 Snapshot www.energystar.gov/sites/default/files/tools/ENERGY%20STAR%202015%20Snapshot_1.pdf 11 Building Rating and Policy Status at The Institute for Market Transformation http://www.buildingrating.org/ 12 The Commercial Building Energy Consumption Survey (CBECS) http://www.eia.gov/consumption/commercial/ 13 Department of Energy Building Performance Database (BPD) https://bpd.lbl.gov/ 14 Source NBI Getting to Zero Database (GtZ) http://newbuildings.org/resource/getting-to-zero-database/

NBI June 2017 Page 11 CEC EPIC 14-009
Table 6: Percent energy use reduction of research buildings compared to national benchmarks
Research Set Percent Energy Use Reduction Compared to:
Building Type Research Set Median EUI
CBECS 2012 Subset Median
BPD Subset Median
Office 46 -22% -27%
Education 37 -23% -14%
Library 23 -66% -58%
All Buildings 38 -32% -31%
In Figure 5 the research building set is compared alongside the three same benchmarks shown in Table
5. The box plot in Figure 5 bounds the two interquartile ranges for each dataset with each horizontal line
representing the 25th, 50th (median) and 75th percentile EUI. The plot shows that the majority (75%) of
the radiant research dataset are equal to or better than the best 50% of the benchmark buildings. In
addition, the energy use of the median research radiant building is near or below the 25th percentile EUI
of the CBECS and the BPD benchmarks. The research dataset energy performance in Figure 5 is also
approaching that of the best performing buildings – the GtZ ZNE dataset.
Figure 5: Box plot bounding 25th and 50th percentile EUI of the research set and various benchmarks
Although this limited set of research buildings is not representative of the entire stock of buildings with
radiant systems, the research dataset are consistently among the top performers compared to peer
buildings of the same size, type, and location. The dataset utilized radiant heating and cooling as one
strategy toward aggressive energy performance targets (95% were LEED buildings with 75% seeking
platinum LEED) and the strong energy performance outcomes found in this research. This pattern of
NBI June 2017 Page 12 CEC EPIC 14-009
using radiant systems to accomplish low-energy outcomes is also seen by over half of the ZNE buildings
in NBI’s GtZ database. The EnergyStar scores of the buildings as discussed in the following section
further support this.
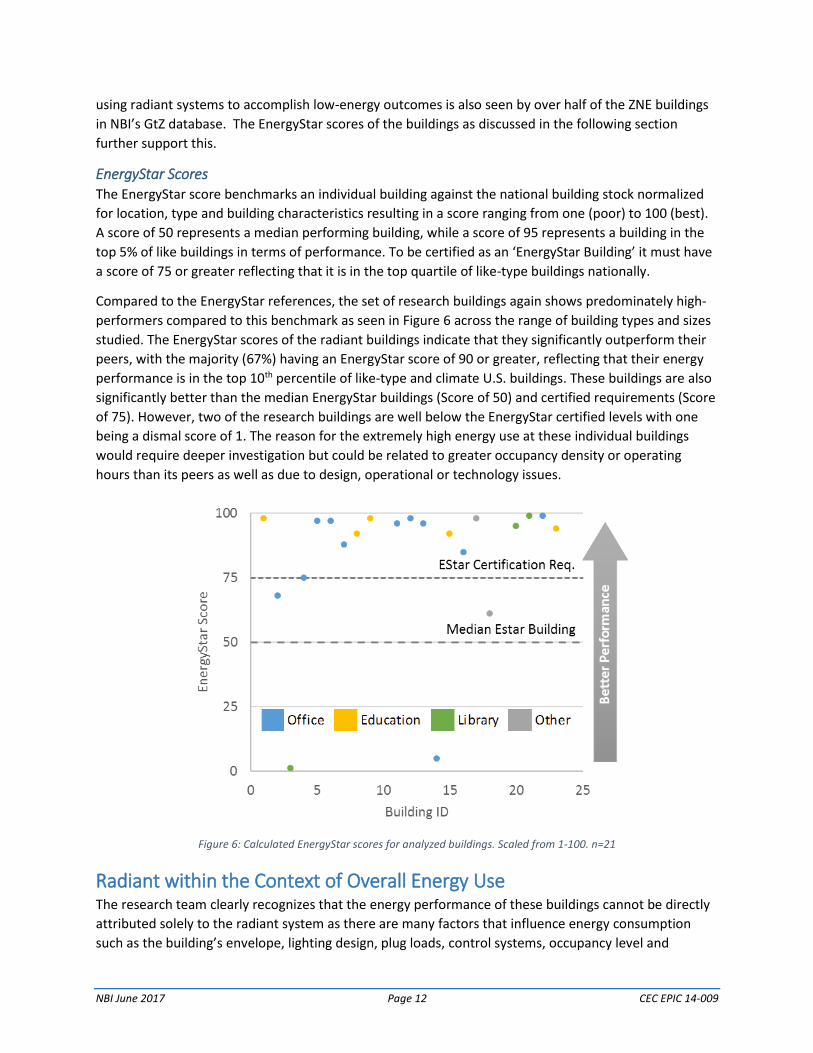
EnergyStar Scores The EnergyStar score benchmarks an individual building against the national building stock normalized
for location, type and building characteristics resulting in a score ranging from one (poor) to 100 (best).
A score of 50 represents a median performing building, while a score of 95 represents a building in the
top 5% of like buildings in terms of performance. To be certified as an ‘EnergyStar Building’ it must have
a score of 75 or greater reflecting that it is in the top quartile of like-type buildings nationally.
Compared to the EnergyStar references, the set of research buildings again shows predominately high-
performers compared to this benchmark as seen in Figure 6 across the range of building types and sizes
studied. The EnergyStar scores of the radiant buildings indicate that they significantly outperform their
peers, with the majority (67%) having an EnergyStar score of 90 or greater, reflecting that their energy
performance is in the top 10th percentile of like-type and climate U.S. buildings. These buildings are also
significantly better than the median EnergyStar buildings (Score of 50) and certified requirements (Score
of 75). However, two of the research buildings are well below the EnergyStar certified levels with one
being a dismal score of 1. The reason for the extremely high energy use at these individual buildings
would require deeper investigation but could be related to greater occupancy density or operating
hours than its peers as well as due to design, operational or technology issues.
Figure 6: Calculated EnergyStar scores for analyzed buildings. Scaled from 1-100. n=21
Radiant within the Context of Overall Energy Use The research team clearly recognizes that the energy performance of these buildings cannot be directly
attributed solely to the radiant system as there are many factors that influence energy consumption
such as the building’s envelope, lighting design, plug loads, control systems, occupancy level and

NBI June 2017 Page 13 CEC EPIC 14-009
operations. While isolating discreet system energy impact is beyond the scope of this study the larger
part of this EPIC project will provide greater analysis of radiant-specific energy impact in a lab setting
and from energy modeling of system design variations. The role of radiant, for this study, is examined
within the context of the larger picture of whole building energy performance outcomes.
High performing dataset. In reviewing the whole building energy performance of this research dataset it
is clear that they are generally very high performing buildings and the radiant system is a part of what is
normally the largest contributor to energy use – the HVAC system. In California, HVAC represents the
highest proportion (32%) of energy use in commercial buildings15. Obtaining low-energy outcomes can
only be accomplished by addressing the HVAC as a system and involves an integrated design approach
wherein the interactive effects of design and technology selections are key to energy performance
results.
Examples of integrated impacts. The HVAC system selection can influence and benefit other energy-
using design decisions. In the case of selecting a radiant system it usually means limiting the overall
design cooling load because there ae physical limitations to how much cooling a radiant system,
particularly ESS & TABS, can achieve. This will translate into a better envelope, lower lighting loads, and
efforts to reduce plug loads which in turn reduce overall building energy consumption. In addition, the
use of radiant systems is most frequently associated with dedicated outside air systems (DOAS) which
reduce fan energy needed for ventilation compared to standard forced-air systems. Also the heating and
cooling sources associated with radiant are typically more efficient such as those seen in this sample set
of buildings. This is partly because large radiant active heat transfer surfaces can effectively cool with
higher temperature water, and heat with lower temperature water, which reduces the energy needed
from the supply source.
Radiant systems support low-energy targets. While forced-air distribution systems remain the
predominant approach to heating and cooling in U.S. commercial buildings16 radiant systems are more
often selected by leading designers striving for low-energy and other ‘green’ building outcomes. For
example, according to NBI’s GtZ Database, more than half of the successful net zero energy buildings in
North America use a radiant system and a survey of 29 advanced ZNE and near ZNE buildings in CA
showed 11 with radiant systems17. As stated earlier in this report, 74% of the research buildings were
targeting the highest levels of LEED (platinum) and selected radiant distribution systems as part of their
approach to optimize energy efficiency. In this context, the radiant system is a documented approach
within an integrated efficient total HVAC system to achieve low energy use outcomes as seen in the
majority of this study set.
Operations Opinions Achieving high performance in buildings relies in part on the role of the building operators and control
systems. Experienced operators and smart control systems are able to minimize energy use while
maintaining occupant comfort. Radiant systems behave differently from traditional forced air systems,
and installers and operators must therefore learn to operate them accordingly.
15 CEUS 2006 16 Energy Information Agency CBECS 17 TRC and PG&E, ACEEE 2016 http://aceee.org/files/proceedings/2016/data/papers/3_636.pdf

NBI June 2017 Page 14 CEC EPIC 14-009
In addition to energy data, we a small sample of the building operators responded to the survey
questions on management of the radiant systems. Table 7 presents these individuals’ perspectives
around several topics. These are not a representative sample of either the building operators within the
research dataset nor of the market at large by any means but do provide insights to these particular
participant’s opinions.
Table 7: Highlighted feedback from building operators and designers grouped by recurring themes
General Comments
We would absolutely use a radiant system again because it is so simple from an O&M perspective. Very few moving parts, good accessibility for the slab pump and manifolds, good comfort, etc.
Very efficient, generally correct temperatures, no fan noise in the office, lower dust and airborne germs circulating than with forced air.
The radiant system is cost effective, energy efficient and provides excellent occupant comfort.
Radiant heating and cooling from ceiling may result in uncomfortable temperatures below desks and horizontal surfaces.
System Response Time
The slow ramp time of the building to heat or cool is challenging.
Slow response to raise/lower temperatures.
Have had difficulty in changing loop temperature - slow to respond to changes.
Staff Experience
Allows for precise zone control, but does require staff with more controls experience to manage.
The biggest challenge we've had is operator training - the tendency is for operators to run a radiant system as they would a forced-air system, making dramatic adjustments if there are complaints and expecting quick results.
We had an inexperienced operator set the slab supply water temperature to 8°C to attempt to eliminate overheating complaints, and you can imagine the issues that caused (implying that low temperature possibly caused condensation among other issues).
Operators need to understand that the radiant slab we have is intended for 'average' heating and cooling, and not meant to respond instantaneously or in a precise area.
Recommended changes for next design
We would simplify the system and provide less control zones.
Just use for heating and allow individual forced air zone control for cooling.
Place 2 slab temperature sensors instead of one as slab temperature sensors tend to fail and are hard to replace.
Possibly provide greater heating capacity - some limits in rate of temperature rise.
Best to break out separate zones for the south and north ends of the building. Our building relies on passive solar heating quite extensively, so our loads were more solar-based rather than internal gains-based.
Summary The Energy Performance of Commercial Buildings with Radiant Heating and Cooling report outlines the
goals, methods, and findings of the energy portion of Task 5 within the broader scope of the CEC EPIC
project, Optimizing Radiant Systems for Energy Efficiency and Comfort. The primary goals of this
research are to report actual energy usage of existing buildings that have both radiant heating and
cooling systems and to compare the research buildings with other benchmarks of energy performance.
The energy data presented provides real-world examples of radiant buildings and their energy outcomes

NBI June 2017 Page 15 CEC EPIC 14-009
and will aid in establishing a baseline from which to estimate potential energy savings from increased
adoption of radiant systems in new construction.
The energy performance of 23 commercial buildings is shown both as kBtu/ft2 (the Energy Use Intensity
or EUI) and as an EnergyStar score, which further contextualizes the energy usage by providing a simple
1-100 score that is widely used in commercial real estate and energy assessment. In addition to energy
data, the building characteristics of the research buildings offer insights to the applicability of radiant
systems. A small set of feedback from building operators is included to provide a sense of the
operational benefits and challenges faced by building operators in these existing buildings.
Building Characteristics The research buildings varied in size, climate zone, and type. Most buildings (43%) were in climate zone
4C represented by Coastal Pacific Northwest, Mixed Marine and secondly in 3C (22%) in the Coastal
California, Warm-Marine climate. Offices made up the largest portion of building types (nearly 50%)
followed by education and library. The number of buildings in the study distributed by size was split
evenly above and below 50,000 ft2 with buildings greater than 50,000 ft2 representing 52% of the
buildings but nearly 90% of the total square feet in the dataset.
Energy Performance The energy performance of the 23 analyzed buildings was predominantly very efficient with a few
outliers using 2-3 times more energy than their study set peers. Figure 7 shows the spread of the EUI for
the research dataset of buildings. The majority of buildings (70%) are below 50 kBtu/ft2 and 14% of them
are below 25 kBtu/ft2 – a threshold often used to define the best energy performance for these
buildings types and used to target zero net energy performance whereby the inclusion of onsite
renewables may be able to offset the full buildings site energy use18.
Figure 7: Total site building energy use of the research building dataset n=23
18 NREL Realizing High-Performance Buildings http://www.nrel.gov/docs/fy15osti/62530.pdf

NBI June 2017 Page 16 CEC EPIC 14-009
Comparative Energy Use Energy Use Intensity (EUI). The median EUI for these buildings was below (better than) both national
benchmarks, CBECS and the BPD, as seen in Figure 8. The analysis also shows clearly that the majority
(75%) of the radiant research dataset are equal to or better than the best 50% of the benchmark
buildings. The median EUI of the full research dataset (38 kBtu/ft2) is 31% and 32% less energy intensive
than the BPD and CBECs subset databases respectively. By building type, offices used 22-27% less and
education used 14-23% less energy than the national benchmark references. Library energy use is the
greatest difference with the research dataset using 58-66% less energy than the benchmarks.
Figure 8: Box plot bounding 25th and 50th percentile EUIs of the research set and various benchmarks
EnergyStar Scores. The EnergyStar scores of the radiant buildings also indicate that they outperform
their peers. 67% of the research dataset buildings have EnergyStar scores above 90 which indicates that
they are in the top 10% of buildings relative to their peers. Further, all but four buildings (81%) had
EnergyStar scores at or above 75, meaning that they quality for EnergyStar certification and almost all of
the research buildings are significantly better than the median EnergyStar buildings (Score of 50).
Zero Net Energy Buildings. The research dataset energy performance is also approaching and mirroring
that of the best performing buildings in North America (NBI GtZ ZNE dataset) with the best performing
research buildings having comparable EUIs in the 20s. In addition, the study noted that two independent
study datasets found the majority of ZNE buildings use radiant systems, which suggests that leading
designers have identified radiant systems as a part of their solution to get to low-energy results.
Radiant Systems Support Low-Energy Results It is not a single system that creates improved energy outcomes, but rather an integrated approach
addressing a wide range of building factors including design, technology, operational and occupancy
factors, but each system matters. An integrated design approach relies on interactive affects and the
selection of radiant systems can be a driver to reduce the overall building cooling load that needs to be

NBI June 2017 Page 17 CEC EPIC 14-009
served and thus influence improved envelope, window selection and ratios, lighting and plug loads. All
but one of the research dataset targeted a LEED certification and 74% aimed for the highest level of
LEED platinum. HVAC is the largest energy use in typical buildings and in this research set the design
firms chose radiant systems as a key component to meet their heating and cooling needs and low-
energy targets. The research dataset shows consistency regarding low-energy targets, the use of radiant
systems, and comparatively low-energy outcomes.
Operator Perspective Based on the small sample of feedback operators often praised radiant systems for energy performance
and air quality, but also mentioned issues arising from the lack of operator experience with radiant
systems. Operators often controlled radiant systems as they would a forced air system and most
operators noted the relatively slow response time to set point changes.
Next Steps This study provides the largest dataset of radiant heated and cooled building’s measured energy
performance known to the research team and provides new references to contribute to the estimation
of potential savings from the use of radiant heating and cooling. A separate study of occupant comfort
within Task 5 will present results from occupant surveys in these, and other, radiant buildings.
The findings of this Energy Report will contribute to the larger CEC EPIC project on radiant systems, led
by UC Berkeley Center for the Built Environment, addressing optimum system design and operational
characteristics for next generation radiant systems. Results and guidance from these studies will support
the improved performance, and potential for increased adoption of, radiant systems in California as a
path to meet state goals for low energy use in commercial buildings.

NBI June 2017 Page A-1 CEC EPIC 14-009
Appendix This appendix provides the data sources and calculation basis from which we established the findings in
the EPIC Energy Use of Commercial Buildings with Radiant Heating and Cooling.
Data Sources These sources were used to identify buildings that met the study criteria.
UC Berkeley Center for the Built Environment database of Radiant Buildings19
http://bit.ly/RadiantBuildingsCBEv2
New Buildings Institute Getting to Zero database of North America Zero Net Energy Buildings
http://newbuildings.org/resource/getting-to-zero-database/
Case Studies of leading buildings:
o PG&E Zero Net Energy Volume I and II
o ASHRAE High Performance Magazine
o International Living Future Institute
o AIA Top Ten
o NBI Getting to Zero Case and High Performance Building Case Studies
Outreach to architecture and engineering firms involved in radiant buildings:
o Integral Group, Oakland and San Francisco CA, Vancouver BC
o Arup
o EHDD Architecture
o Transsolar
o Opsis Architecture
o Perkins+Will Architects
o SERA Architects
o Stantec
o HOK
o AECOM
Benchmark Sources We compared the study set of buildings to these datasets of actual energy performance.
1. Energy Information Agency Commercial Buildings Energy Consumption Survey – CBECS
http://www.eia.gov/consumption/commercial/
2. LBNL-DOE Buildings Performance Database – BPD 0 https://bpd.lbl.gov/
3. U.S. Environmental Protection Agency EnergyStar Portfolio Manager Scores
https://portfoliomanager.energystar.gov/pm/targetFinder?execution=e1s1
4. New Buildings Institute Getting to Zero database of North America Zero Net Energy Buildings
http://newbuildings.org/resource/getting-to-zero-database/
19 CBE was a smaller dataset at the time of the study. Additional buildings found through the research have been added to the CBE dataset and the list and map at the link is frequently updated and expanded.

NBI June 2017 Page A-2 CEC EPIC 14-009
Surveys Used in the Study These are the two questionnaires used in the energy research. We gathered responses through online
links and/or phone interviews. The survey content extends beyond this report focus on energy use and
includes design and operational questions that are informing other tasks within the larger EPIC study of
radiant heating and cooling in commercial buildings.
Building Characteristics Survey
https://berkeley.qualtrics.com/SE/?SID=SV_5nhRtS3b7mZRrmd
Energy Use and Operations Survey
https://berkeley.qualtrics.com/SE/?SID=SV_6EHQwnkwt6ukIND
EnergyStar Calculation Parameters The data in Table 8 is from two online surveys conducted as a part of the research project - the Building
Characteristics survey and the Energy Data Survey identified above. The scores were derived from one
of two sources: a) provided to the research team through the survey or b) calculated by the research
team via the Portfolio Manager Target Finder tool20 in cases where the survey participant (designer or
operator) did not have or provide an EnergyStar score. The parameters needed to establish an
EnergyStar score are represented in the columns in Table 8.
Table 8: Building dataset and EnergyStar score calculation inputs
Bu
ildin
g ID
Cit
y
Stat
e
Typ
e
Size
(ft
2)
EUI
(kB
tu/f
t2)
ESta
r
Sco
re
# o
f St
aff/
Occ
up
ants
Nu
mb
er o
f
Co
mp
ute
rs
Wee
kly
Op
erat
ing
Ho
urs
Sou
rce
of
ESta
r
Sco
re
4 Berkeley CA Office 45,000 143.5 75 Provided in
Survey
6 Portland OR Office 440,000 32 97 Provided in
Survey
11 Winnipeg MB Office 65,000 61.6 96 Provided in
Survey
13 Salem OR Office 147,000 36 96 Provided in
Survey
16 Portland OR Office 205,000 46 85 Provided in
Survey
10 Port Coquitlam
BC Community
Ctr. 14,500 143 NA
Not Applicable, Building Type
19 Vancouver BC Visitor Ctr. /
Public Assembly 19,400 37.7 NA
Not Applicable, Building Type
1 Fort Collins CO Education 95,000 28 98 250 225 56 Calculated via Target Finder
2 Portland OR Office 10,000 48 68 37 39 65 Calculated via Target Finder
3 Vancouver BC Library 36,000 154 1 75 Default Default Calculated via Target Finder
5 Vaughan ON Office 60,000 55.4 97 80 Default Default Calculated via Target Finder
8 San Francisco
CA Education 200,000 37.3 92 2650 Default Default Calculated via Target Finder
20 https://portfoliomanager.energystar.gov/pm/targetFinder?execution=e1s1

NBI June 2017 Page A-3 CEC EPIC 14-009
Bu
ildin
g ID
Cit
y
Stat
e
Typ
e
Size
(ft
2)
EUI
(kB
tu/f
t2 )
ESta
r Sc
ore
# o
f St
aff/
Occ
up
ants
Nu
mb
er
of
Co
mp
ute
rs
We
ekl
y
Op
era
tin
g
Ho
urs
Sou
rce
of
ESta
r Sc
ore
9 Eugene OR Education 92,000 26.9 98 400 Default Default Calculated via Target Finder
12 Golden CO Office 360,000 36 98 1000 2000 60 Calculated via Target Finder
15 Claremont CA Education 75,000 52 92 150 50 150 Calculated via Target Finder
17 Victoria BC Office and Lab 16.150 48.2 98 68 150 45 Calculated via Target Finder
18 Sonoma CA Medical Housing
16,000 32.1 61 10 Default Default Calculated via Target Finder
20 Berkeley CA Library 9,400 23.1 95 100 Default Default Calculated via Target Finder
21 Varennes QC Library 24,000 14.5 99 Default Default Default Calculated via Target Finder
22 Seattle WA Office 52,000 12 99 Default Default Default Calculated via Target Finder
23 Clemson SC Education 50,300 43.3 94 400 350 60 Calculated via Target Finder
7 San Jose CA Office and Lab 50,000 37.5 88 211 211 40 Calculated via Target Finder
14 Atlanta GA Office 44,000 139 5 190 200 60 Calculated via Target Finder