energy policy and conservation quadrennial report 2012 · energy policy and conservation...
TRANSCRIPT
ENERGY POLICY AND
CONSERVATION
QUADRENNIAL REPORT
2012
Submitted in Compliance with Minnesota Statute §216C.18
D IVISION OF E NERGY R ESOURCES
1
This document is made available electronically by the Minnesota Legislative Reference Library as part of an ongoing digital archiving project. http://www.leg.state.mn.us/lrl/lrl.asp
TABLE OF CONTENTS Introduction ELECTRICITY.......................................................................................................... 6
A. RESOURCE ADEQUACY ......................................................................................... 6 1. GROWTH IN DEMAND GREATER THAN GROWTH IN SUPPLY 2. CHANGING ENERGY MIX 3. NEED FOR BASE LOAD RESOURCES 4. INCREASED RELIANCE ON NATURAL GAS GENERATION
B. TRANSMISSION INFRASTRUCTURE ................................................................... 9 1. TRANSMISSION CONSTRUCTION AND UPGRADES 2. ELECTRICITY TRANSMISSION CONSTRAINTS 3. RENEWABLE ENERGY DEVELOPMENT CONSTRAINTS 4. POTENTIAL ELECTRIC TRANSMISSION SOLUTIONS 5. MISO
C. ELECTRICITY DISTRIBUTION AND SERVICE QUALITY ............................... 14
D. POWER GENERATION AND ENVIRONMENTAL PROTECTION.................. 14
E. SUMMARY................................................................................................................ 15
RENEWABLE ELECTRICITY PORTFOLIO ......................................................... 16 A. RENEWABLE ENERGY GENERATION ............................................................... 16
1. WIND POWER 2. SOLAR PHOTOVOLTAIC 3. BIOMASS-BASED POWER 4. HYDROELECTRIC POWER
B. RENEWABLE ENERGY POLICIES ....................................................................... 21 1. EVOLUTION FROM THE RENEWABLE ENERGY OBJECTIVES TO
THE RENEWABLE ENERGY STANDARDS 2. RENEWABLE ENERGY TRADABLE CREDITS
C. RENEWABLE ENERGY PROGRAMS..................................................................... 24 1. GREEN PRICING PROGRAM 2. SOLAR REBATE PROGRAMS 3. MINNEAPOLIS- SAINT PAUL SOLAR AMERICA CITIES PROGRAM 4. RENEWABLE HYDROGEN INITIATIVE
NATURAL GAS ...................................................................................................... 27 A. DEMAND-CHANGING CONSUMPTION PATTERNS...................................... 28
B. SUPPLY AVAILABILITY........................................................................................... 29
C. PRICE VOLATILITY................................................................................................ 30
D. SERVICE QUALITY AND RELIABILITY .............................................................. 30
E. SUMMARY................................................................................................................ 31
2
TRANSPORTATION FUELS.................................................................................. 31 A. OVERVIEW .............................................................................................................. 31
B. FUTURE .................................................................................................................. 33
C. SUPPLY RELIABILITY ............................................................................................. 34 1. REFINERY OPERATING PRACTICES 2. REGULATION CHANGES REGARDING COMMERCIAL DRIVERS'
HOURS OF SERVICE 3. SEASONAL DEMAND FLUCTUATIONS
D. ALTERNATIVE FUELS AND ADVANCED VEHICLE TECHNOLOGIES ......... 35 1. ETHANOL 2. BIODIESEL 3. PROPANE AND NATURAL GAS 4. ELECTRIC VEHICLES 5. HYDRAULIC HYBRID 6. GOVERNOR’S EXECUTIVE ORDER 11-14 - STATE FLEET OPERATIONS
ENERGY CONSERVATION ................................................................................... 39 A. CONSERVATION IMPROVEMENT PROGRAM ................................................. 39
1. DEEMED SAVINGS DATABASE DEVELOPMENT 2. MEASUREMENT AND VERIFICATION 3. RESEARCH AND DEVELOPMENT 4. ENERGY SAVINGS PLATFORM 5. 1.5% ENERGY EFFICIENCY SOLUTIONS PROJECT 6. SUMMARY
B. BUILDING GUIDELINES, BENCHMARKS, AND ENERGY CODES ............... 42 1. SUSTAINABLE BUILDING 2030 2. B3 -- ENERGY BENCHMARKING FOR EXISTING BUILDINGS 3. BUILDING ENERGY CODES
C. COMBINED HEAT AND POWER......................................................................... 43
OTHER KEY PROGRAMS..................................................................................... 45 A. AFFORDABILITY..................................................................................................... 45
1. LOW INCOME HOME ENERGY ASSISTANCE PROGRAM 2. REACH OUT FOR WARMTH 3. MINNESOTA WEATHERIZATION ASSISTANCE PROGRAM
B. CLEAN ENERGY RESOURCE TEAMS (CERTS ................................................... 47
C. ENERGY INFORMATION CENTER..................................................................... 49
D. ENERGY ASSURANCE............................................................................................ 50
E. AMERICAN RECOVERY AND REINVESTMENT ACT (ARRA) ....................... 50
APPENDIX A MINNESOTA PUBLIC UTILITIES COMMISSION (PUC)......................... 52
APPENDIX B MINNESOTA ENERGY DATA, CHARTS AND TABLES.................................61 3
INTRODUCTION
In accordance with Minnesota Statutes section 216C.18, the Minnesota Department of Commerce (Department) issues a State Energy Policy and Conservation Report. Informally referred to as the “Quadrennial” or “Quad Report,” it identifies major emerging trends and issues in Minnesota’s energy supply, consumption, conservation, and costs.
The following statutes provide the powers and responsibilities assigned to the Commissioner of Commerce over the production, distribution and sale of energy in the state. Primary statutes include:
216A and 216B Public Natural Gas and Electric Power Utilities 216C Energy Planning and Energy Conservation 216E Electric Power Facility Permits 216F Wind Energy Conversion Systems 216G Routing of Certain Pipelines
The Department serves as the lead entity to coordinate cooperation, resources, and information between state agencies that have responsibilities for matters relating to energy and represents the public interest to maintain affordable, reliable energy. In general, the Department is charged to:
• Evaluate electric and gas utilities rate increase requests and evaluate utility plans to add new power generation, power lines or natural gas distribution pipelines;
• Serve as an advocate for the public interest at the Public Utilities Commission to assure that additions are needed to maintain reliable, cost-effective and environmentally sound service to ratepayers;
• Assure that utilities achieve Minnesota’s Renewable Energy Standard in a cost-effective manner; • Assure utility energy conservation programs are cost-effective and help Minnesota consumers
achieve energy savings through energy efficiency; • Administer the federal Weatherization Assistance Program to help low-income families make
their homes more energy efficient, and the Low Income Home Energy Assistance Program to help low and fixed income Minnesotans with their winter energy bills;
• Provide specific energy information to consumers about how to save energy in their homes through affordable conservation and efficiency improvements;
• Provide technical assistance to businesses seeking to commercialize emerging technologies, or site or expand clean energy facilities in the state; and
• Monitor liquid fuel supplies (petroleum, biofuels).
The critical role that energy plays in the economic, environmental and social vitality of Minnesota is demonstrated on a daily basis such that the Department is dedicated to ensure that:
• Minnesota has a reliable energy system into the future; • The state’s energy system meets Minnesota’s economic needs; • Minnesota’s energy costs are reasonably priced; and • The environmental impacts of the energy produced and consumed in the state are minimized.
4

Consequently, the Department’s primary focus is to assure the state’s current and long-term energy reliability, including the long-term adequacy of supply, security, quality and sufficiency of the electricity transmission grid and its local distribution system, as well as for natural gas and petroleum products sold in the state.
Because energy conservation and a diversified energy supply and generation mix have shown they improve energy security and stimulate economic vitality in the state, renewable energy and energy efficiency remain key components of that focus.
While the Department focuses on the long-term adequacy of supply, security, quality and sufficiency of energy used in Minnesota, it also continually works with other state agencies to ensure that the energy needs for the system as a whole are balanced with local economic development and other community goals.
This report identifies status, trends and issues in Minnesota’s energy supply, consumption, conservation, and costs for electric power, natural gas and transportation fuels in the state.
5
ELECTRICITY
Minnesota's economy depends on reliable, reasonably priced, environmentally sensitive electric service. Consumers of all types—residential, commercial, industrial—have come to expect and rely on electric utilities to provide a high level of reliability and quality of service. As such, the reliability and quality of electric service in Minnesota is among the top priorities of the Department.
A key to understanding the difficulty of maintaining the reliability of the electric system is that electricity, unlike natural gas and petroleum, cannot be stored cost-effectively. Costs for storing large-scale electricity is not yet commercially viable. At any given moment, there must be enough electric generation and transmission capacity available.
The assessment of reliability discussed in this chapter consists of three sections:
• The long-term adequacy of electric supply in Minnesota; • The transmission system, often referred to as the transmission "grid" or the "bulk power" sys
tem; and • The reliability of and service quality provided by the local retail distribution system, the part of
the electricity delivery system that serves end-use customers.
A. Resource Adequacy
1. Growth in Demand Greater Than Growth in Supply
National - According to the Annual Energy Outlook 2012 Early Release Overview (AEO12),1 total U.S. electricity sales are forecasted to increase by 26 percent from 3,886 billion kilowatt hours (kWh) in 2008 to approximately 4,800 billion in 2035, at an average increase rate of 0.8 percent per year. The relatively slow growth follows the historical trend, with the growth rate slowing in each succeeding decade. Electricity sales, which are strongly affected by economic growth, increase by 36 percent in the high growth forecast case, to 5,272 billion kilowatt hours in 2035, but by only 16 percent in the low growth case, to 4,569 billion kilowatt hours in 2035. In the reference case, the largest increase is in the transportation sector, at 171 percent from 2008 to 2035, reflecting the increasing prevalence of electric vehicles. The U.S. Energy Information Administration (EIA) forecasts that national demand for electricity will grow by 17 percent in the residential sector, by 41 percent in the commercial sector and decrease five percent in the industrial sector resulting in a net increase by 26 percent by 2035.
Regional - Minnesota's utilities are members of the Midwest Reliability Organization (MRO).2 MRO is a nonprofit organization that works to ensure the reliability and security of the bulk power system in the north central region of North America. MRO is a member of North American Electric Reliability Corporation (NERC), which collects the studies done by the regional entities to evaluate the reliability of the interconnected grid as a whole. The generation fuel source mix is made up of fossil/coal, hydroelectric, gas, oil, nuclear, and wind, biomass and other types of renewable energy technologies.
1See http://www.eia.gov/oiaf/aeo/tablebrowser/#release=AEO2011&subject=0-AEO2011&table=8-AEO2011®ion=0-0&cases=ref 2011-d120810c or http://www.eia.gov/forecasts/aeo/ec/early_elecgen.cfm. 2The MRO region covers all or portions of Iowa, Illinois, Minnesota, Montana, Nebraska, North Dakota, South Dakota, Wisconsin, and the Canadian provinces of Manitoba and Saskatchewan. 3MAPP continues to exist as a regional transmission group with a Transmission Planning Committee (TPC), a Reliability Planning and Coordination Committee (RPCC), and a Tariff Services Committee (TSC). 6
This diverse generation mix keeps our power system reliable and economical. The MRO replaced the Mid-Continent Area Power Pool (MAPP) as a reliability organization within NERC in January 2005.3
The MRO region has a peak demand occurring in the summer season. The MRO summer peak demand is expected to increase at an average rate of 1.24 percent per year during 2010-20194 The MRO summer reserve margin during the 2010-2019 period is predicted to range from 22.7 percent to 29.0 percent, exceeding the proxy regional target reserve margin of 15 percent.
State - Conservation programs are in place to help manage load growth in Minnesota. Increased demand for electricity can be met with new generation resources; however, a cheaper way to meet an increase in demand is through conservation. Nevertheless, the Department expects that growth in the demand for electricity in Minnesota will outstrip the contribution of conservation towards balancing supply and demand in a cost-effective manner. In recent years, regulated utilities’ Integrated Resource Plans (IRP) have generally indicated a need for additional resources to meet Minnesota’s projected demand for electricity.5 Analyses done in the IRP process consider energy conservation and demand-side management resources integrally in both the assessment of forecasted demand and in the selection of potential resources to meet an identified need. Moreover, the pressure that demand growth places on utilities is not even. Some utilities may have greater needs for new electric infrastructure due to the fact that their electric demand or "load" is growing faster than the loads of other providers. Minnesota’s electric consumption is expected to increase at an average rate of about 1.1 percent annually over the next few years, based on the combined projections of all utilities serving Minnesota customers.6 Consistent with the nation and region, new generation and transmission facilities will continue to be needed as demand for electricity in the state continues to grow. Electric utilities engage in resource planning to determine the combination of conservation measures, power plants, and transmission lines that most economically meets the projected demand.
Ensuring this new infrastructure is constructed and placed into service in a manner that does not materially adversely impact the environment, energy costs or other public interests is a challenge that the Department as well as state and regional policymakers must continue to address.
2. Changing Energy Mix
The capacity expansion plans of electric utilities demonstrate that the energy sources used to generate electricity have changed over the last decade and indicate that change will continue into the foreseeable future. Use of natural gas to produce electricity increased 250% between 2000 and 2010. Most of that increase has occurred recently as its price dropped from 2008 historic highs. As Appendix B shows, the use of natural gas to produce electricity has increased significantly since that time. Given limits to existing pipeline infrastructure, this increase may have an effect on cost and supply for use as a heating fuel, especially with accelerating use of natural gas as a transportation fuel. Wind power, however, has increased at a faster rate, experiencing more than a 900% increase in power generation over the same time period. Use of biomass has increased 60%, while use of coal decreased about 17% and use of petroleum for power generation decreased 94%.
4See http://www.nerc.com/files/2010_LTRA_v2-.pdf 5See following IRP dockets: IPL – Docket No. 08-673; Xcel Energy – Docket No. 10-825; Minnesota Power – Docket No. 13-53; OtterTail Power – Docket No. 10-623. 6A simple trend line estimated that an increase of between 1 and 2 percent will occur annually over the next few years. 7
3. Need for Base Load Resources
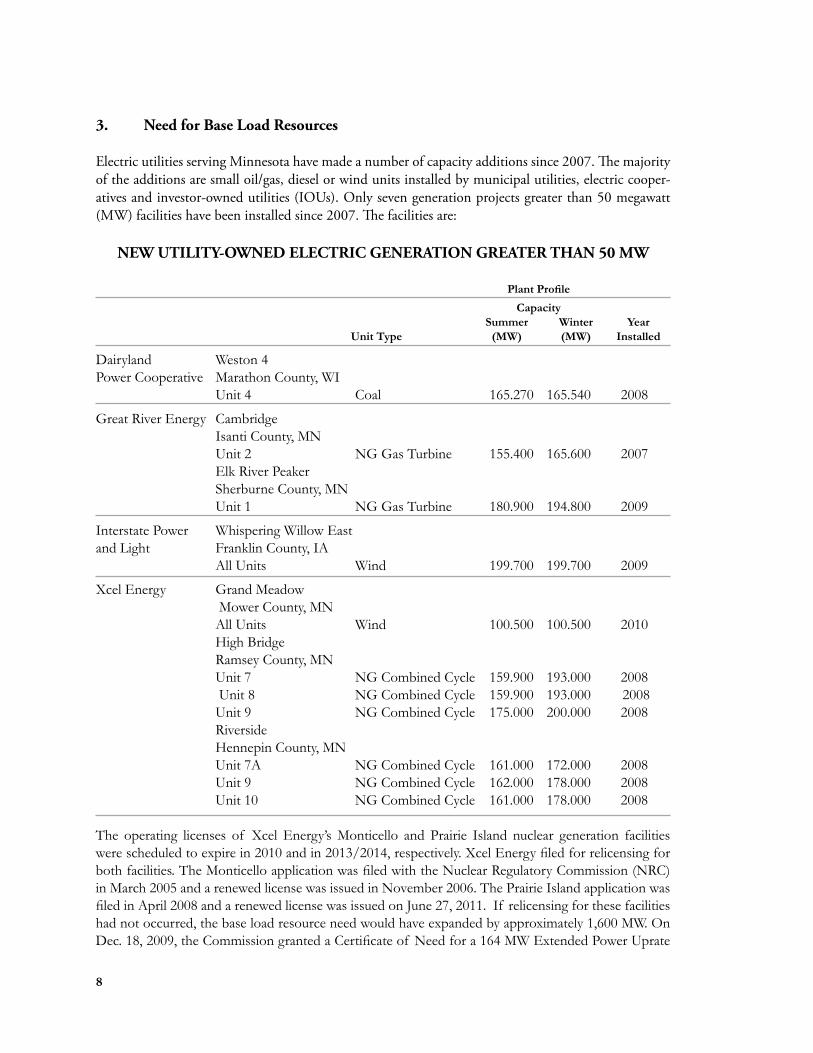
Electric utilities serving Minnesota have made a number of capacity additions since 2007. The majority of the additions are small oil/gas, diesel or wind units installed by municipal utilities, electric cooperatives and investor-owned utilities (IOUs). Only seven generation projects greater than 50 megawatt (MW) facilities have been installed since 2007. The facilities are:
NEW UTILITY-OWNED ELECTRIC GENERATION GREATER THAN 50 MW
Plant Profile Capacity
Summer Winter Year Unit Type (MW) (MW) Installed
Dairyland Power Cooperative
Weston 4 Marathon County, WI Unit 4 Coal 165.270 165.540 2008
Great River Energy Cambridge Isanti County, MN Unit 2 NG Gas Turbine 155.400 165.600 2007 Elk River Peaker Sherburne County, MN Unit 1 NG Gas Turbine 180.900 194.800 2009
Interstate Power and Light
Whispering Willow East Franklin County, IA All Units Wind 199.700 199.700 2009
Xcel Energy Grand Meadow Mower County, MN All Units Wind 100.500 100.500 2010 High Bridge Ramsey County, MN Unit 7 Unit 8 Unit 9 Riverside
NG Combined Cycle NG Combined Cycle NG Combined Cycle
159.900 159.900 175.000
193.000 193.000200.000
2008 2008 2008
Hennepin County, MN Unit 7A Unit 9 Unit 10
NG Combined Cycle NG Combined Cycle NG Combined Cycle
161.000 162.000 161.000
172.000 178.000 178.000
2008 2008 2008
The operating licenses of Xcel Energy’s Monticello and Prairie Island nuclear generation facilities were scheduled to expire in 2010 and in 2013/2014, respectively. Xcel Energy filed for relicensing for both facilities. The Monticello application was filed with the Nuclear Regulatory Commission (NRC) in March 2005 and a renewed license was issued in November 2006. The Prairie Island application was filed in April 2008 and a renewed license was issued on June 27, 2011. If relicensing for these facilities had not occurred, the base load resource need would have expanded by approximately 1,600 MW. On Dec. 18, 2009, the Commission granted a Certificate of Need for a 164 MW Extended Power Uprate
8
(EPU) at the Prairie Island Nuclear Plant. Xcel subsequently indicated that the EPU project size would be reduced to 135 MW, and anticipated that the EPU would be implemented during the 2016 and 2017 scheduled refueling outages. On Oct. 22, 2012, Xcel filed another Notice of Changed Circumstances indicating that further developments led them to conclude that the EPU may not be in the best interest of the Company’s ratepayers at all, and asked the Commission to tell it whether to proceed. The Com-mission decided to terminate Xcel’s Certificate of Need (Order dated Feb. 27, 2013).
Capacity additions require considerable advanced planning. In general, base load and intermediate re-sources are more difficult for utilities to build than peaking or intermittent resources because base load and intermediate resources are more expensive to construct, and generally have greater environmental impacts. Minnesota Rules parts 7843.0100-7843.0600 require electric utilities to file proposed Integrat-ed Resource Plans (IRP) every two years which present the utility's 15-year demand forecast and the utility's proposed capacity additions to meet the forecasted demand. There were a number of IRPs that were filed with the Minnesota Public Utilities Commission in 2010, two filed in 2011, and two in 2012. IRPs may be followed on the e-Docket system through the Public Utilities Commission.
4. Increased Reliance on Natural Gas Generation
Four of the seven new combustion generation resource additions referenced above are fueled by nat-ural gas. As Appendix B shows, 74% of the total 1900 MW generation capacity uses natural gas, 17% comes from wind and 9% from coal. According to the EIA, electric utilities’ summer capacity from natural gas has increased from 20.5 percent of the net electric capacity in 2000 to 30 percent of the net electric capacity in 2010. Natural gas generation facilities have long been a small part of Minnesota's supply mix and have traditionally relied on the summer surplus of natural gas pipeline capacity that is available since most consumer furnaces are not being used to heat homes and businesses. However, the state's usage of natural gas-fueled power generation is increasing. These upward trends are a result of natural gas pricing and the advantages of fewer emissions and shorter construction timeframes of natural gas plants over coal plants. Natural gas-fired generation allows facilities to start up and shut down more quickly and easily than other types of facilities. However, only a limited number of natural gas generation facilities can be added to the existing natural gas pipeline infrastructure without pipeline upgrades to handle the additional capacity and line pressure needs of natural gas-fueled electric gener-ation.
B. Transmission Infrastructure
1. Transmission Construction and Upgrades
Minnesota's transmission system—the high voltage power lines that transmit electric energy from generation plants to the distribution system—is part of an overall regional transmission grid operated on a coordinated basis with other interconnected transmission systems throughout the Upper Midwest and Eastern United States and Canada. Historically designed to reliably deliver power to electric load centers such as the Twin Cities metropolitan area, Duluth, Mankato, Rochester and St. Cloud, and to interconnect utilities for reliability reasons, the transmission grid is now relied on more heavily. It acts as a regional "highway," providing the physical link between sellers and buyers, and facilitates an ever-increasing amount of transactions among an increasing number of market participants, and over increasing distances. At the same time, it continues to serve a critical reliability role.
9
Transmission is in the spotlight on a state/regional/national basis for three reasons:
(1) After decades of the status quo, many new transmission infrastructure additions and upgrades to existing facilities are being proposed and implemented;
(2) There remain a number of electric transmission capacity constraints; and (3) With states enacting Renewable Energy Standards, the need for transmission to deliver
renewable energy from its site of generation to consumers is immediate.
The 2011 Biennial Transmission Projects Report identifies more than 100 projects that may be needed to address present and reasonably foreseeable future inadequacies of the transmission system in Minnesota due to increased demand for power, including more renewable energy.7 Many projects previously identified have been completed since 2005. Transmission planning in Minnesota involves cooperation and coordination among utilities, our neighboring states, and our region’s independent transmission system operator, MISO.
As discussed below, MISO’s primary function is to monitor the bulk power transmission system and develop policies and procedures that ensure every electric industry participant has access to the transmission system, and that transmission lines are used to minimize congestion and maintain system reliability. Several Minnesota electric utilities have contracts with MISO to conduct facility studies identifying their transmission needs and potential solutions. A current MISO study of note is the “Top Congested Flowgate Study” which is designed to identify and implement transmission upgrades to relieve congestion within the MISO footprint and across “seams” with neighboring Regional Transmission Organizations [e.g., PJM Interconnection, Tennessee Valley Authority (TVA), etc.].
In recent years there has been a large number of route permits and certificate of need applications filed and considered by the MPUC. It is expected that this relatively rapid pace of expansion, though slowed somewhat by the recent economic recession, will continue.
2. Electricity Transmission Constraints
As a rule, large electric generators and consumers of electricity typically are not located in the same place. In order for the power to be delivered from the place of generation to the place of consumption, transmission line pathways must be developed. Eventually, transmission constraints, or bottlenecks, develop in areas where production or demand exceed the maximum level of power that the transmission line can safely and reliably carry. Bottlenecks limit energy transactions. In turn, this may lead to higher energy costs. More importantly, such transmission constraints can threaten system reliability.
Many major transmission lines into and out of Minnesota are near or at operational limits that could affect reliability. For example, the major transmission lines from Minnesota into Wisconsin currently operate at reliability limits during summer peak times to satisfy power requirements in the region. The transmission system will not, without future upgrades or new additions, support additional generation from Canada.
3. Renewable Energy Development Constraints
Minnesota has a tremendous capacity for renewable energy development, especially its wind energy resources. As of 2012, Minnesota had over 3,004 megawatts of wind energy capacity installed.
10 7See the “2011 Minnesota Biennial Transmission Project Report” at http://www.minnelectrans.com/2011 Minnesota Biennial Report.pdf
Transmission, however, has been a major factor, limiting further development in the southwest portion of the state that has valuable wind power resources. As discussed below, Xcel Energy is in the process of siting the three major transmission projects, which are designed to cross the southern part of Minnesota. These investments will help bring wind generated electric power from the Southwest Minnesota area to major metro-area markets.
The development of further wind generation will be limited without sufficient transmission capacity to bring that energy to load center markets where it can be used to serve consumer needs. As policymakers decide how to best encourage Minnesota-based renewable energy production, it is important to keep in mind that transmission capacity may be the most significant limiting factor for its development.
Transmission Capacity and Cost Allocation: Given that transmission access and cost allocation are commonly cited as key issues of concern by the distributed generation industry, the Department led a 2008 study to determine opportunities and constraints for adding additional Dispersed Renewable Generation to the existing grid.
In 2010 the Federal Energy Regulatory Commission (FERC) approved the MISO Multi-Value Project (MVP) method of cost allocation for certain large transmission projects that spreads costs across the entire MISO footprint. In Minnesota, the MISO Transmission Expansion Plan (MTEP) portfolio of MVP projects includes the 240-mile Brookings, SD-Twin Cities transmission line, which is planned for completion between 2013-2015. To aid planning efforts for all interested parties, Minnesota requires utilities that own or operate transmission lines or substations in the state to report on Electric Transmission projects which can be tracked at http://www.minnelectrans.com.
4. Potential Electric Transmission Solutions
One obvious way to alleviate constraints on the power system would be to construct additional transmission lines and facilities and upgrade existing power lines.
Transmission Capacity: Minnesota's transmission owning entities submit a report every two years identifying inadequacies in the state's transmission infrastructure that need to be addressed to ensure reliable service to Minnesota consumers. The Department actively encourages those utilities to implement actions to resolve the identified inadequacies in a timely manner.
As an example of that action, Xcel Energy has constructed a major high voltage transmission line in the Buffalo Ridge area. While this project helps to mitigate the area's transmission constraint, additional transmission is necessary for the region, as well as the state, to benefit from this resource. Another project, CAPX2020, is designed to cross the southern part of Minnesota to bring wind generated electric power from the Buffalo Ridge area to the major consuming markets, including the Minneapolis/St. Paul metro area.
Distributed Generation: To help meet the state Renewable Energy Standard with existing transmission lines, in 2007 the state legislature required statewide study of dispersed renewable generation potential. This study was to identify locations in the transmission grid where a total of 1,200 MW of relatively small renewable energy projects could be operated with little or no change to the existing infrastructure. For the purposes of the study, dispersed renewable energy projects were defined as wind, solar and biomass projects that would generate between 10 and 40 MW of power.
11
An analytic team, led by staff from the Department and Great River Energy, in collaboration with the Minnesota electric utilities and MISO, conducted the two-year Dispersed Renewable Generation Study. A Technical Review Committee (TRC) of national, regional and state technical experts representing the national energy laboratories, MISO, wind and community energy advocates and Minnesota's utilities guided and reviewed the work of the analytic team.
On June 16, 2008, the Department released the results of the first phase of the study. The Phase I study goal was to identify locations in the transmission grid where a total of 600 MW of relatively small sized renewable energy projects could be operated with little or no changes required to the existing infrastructure. For Phase I of the study, the analytic team generated the first statewide models of Minnesota's entire electrical system, including higher and lower voltage lines, and developed new methodologies to identify potential opportunities for dispersed renewable generation. The potential locations studied were based on public input, regional availability of renewable resources, current dispersed generation in the MISO queue, and access to existing transmission. Phase II of the study began in October of 2008
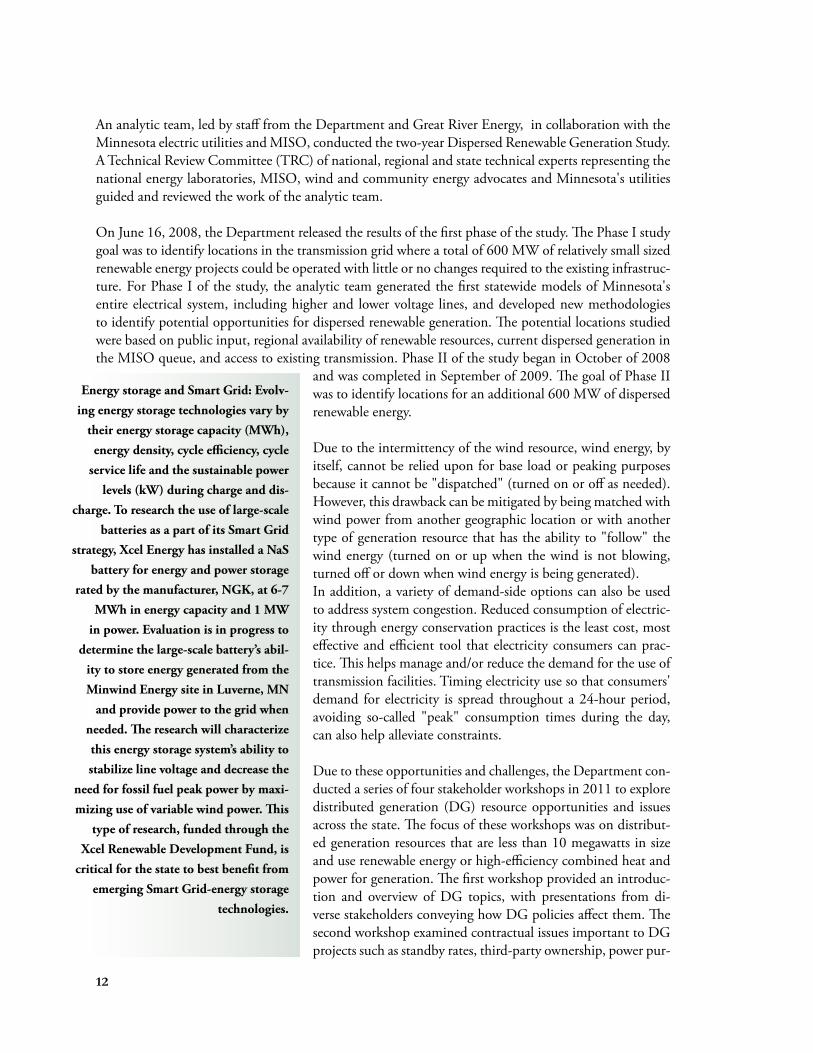
Energy storage and Smart Grid: Evolving energy storage technologies vary by
their energy storage capacity (MWh), energy density, cycle efficiency, cycle
service life and the sustainable power levels (kW) during charge and dis
charge. To research the use of large-scale batteries as a part of its Smart Grid
strategy, Xcel Energy has installed a NaS battery for energy and power storage
rated by the manufacturer, NGK, at 6-7 MWh in energy capacity and 1 MW
in power. Evaluation is in progress to determine the large-scale battery’s abil
ity to store energy generated from the Minwind Energy site in Luverne, MN
and provide power to the grid when needed. The research will characterize this energy storage system’s ability to stabilize line voltage and decrease the
need for fossil fuel peak power by maximizing use of variable wind power. This
type of research, funded through the Xcel Renewable Development Fund, is
critical for the state to best benefit from emerging Smart Grid-energy storage
technologies.
and was completed in September of 2009. The goal of Phase II was to identify locations for an additional 600 MW of dispersed renewable energy.
Due to the intermittency of the wind resource, wind energy, by itself, cannot be relied upon for base load or peaking purposes because it cannot be "dispatched" (turned on or off as needed). However, this drawback can be mitigated by being matched with wind power from another geographic location or with another type of generation resource that has the ability to "follow" the wind energy (turned on or up when the wind is not blowing, turned off or down when wind energy is being generated). In addition, a variety of demand-side options can also be used to address system congestion. Reduced consumption of electricity through energy conservation practices is the least cost, most effective and efficient tool that electricity consumers can practice. This helps manage and/or reduce the demand for the use of transmission facilities. Timing electricity use so that consumers' demand for electricity is spread throughout a 24-hour period, avoiding so-called "peak" consumption times during the day, can also help alleviate constraints.
Due to these opportunities and challenges, the Department conducted a series of four stakeholder workshops in 2011 to explore distributed generation (DG) resource opportunities and issues across the state. The focus of these workshops was on distributed generation resources that are less than 10 megawatts in size and use renewable energy or high-efficiency combined heat and power for generation. The first workshop provided an introduction and overview of DG topics, with presentations from diverse stakeholders conveying how DG policies affect them. The second workshop examined contractual issues important to DG projects such as standby rates, third-party ownership, power pur
12
chase agreements, and interconnection standards. The third workshop focused on net-metering issues: how Minnesota’s net-metering policy compares to that in other states, current best practices, and a discussion with stakeholders on potential areas for change. In the fourth workshop stakeholders split into smaller groups to explore the issues raised in the first three workshops and identified next steps for policy improvements.
Energy Storage: Bulk utility class electrical energy storage systems can be used in a wide spectrum of applications that have unique requirements and economic benefits. The ratings for such systems are typically 200 kilowatts (kW) to 2 MW in power and 50 kilowatt hours (kWh) to 13 MWh in energy capacity. Application requirements range from under a minute of power to stabilize voltage and frequency due to power surges, to up to eight hours to reduce peak consumption, follow changing demand, or defer upgrade transmission investments. Fast transient power demands (within fractions of a second) favor use of technologies that can transfer stored energy at a high rate, such as capacitors, superconducting magnetic storage, flywheels, and batteries. Long period power demands (minutes to hours) favor technologies with a higher level of energy capacity, such as PSB, VRB, NaS, ZnBr flow batteries, pumped hydro storage, or compressed air.
Bulk energy storage allows for:
• System-wide predictability; • Reduced need to invest in new capacity by providing more flexible use of existing generation
capacity; • Minute-by-minute generation/load balance; • Reduced need to purchase electricity on the spot market or during high peak price times of the
day; • Ability to store inexpensive electricity when demand is low to offset higher cost electricity when
the demand is high; • Avoided use of relatively high cost peak generation plants; • Increased line-carrying capacity by improved stability; • Reduced transmission congestion in areas where systems are becoming congested during peri
ods of peak demand; • Reduced or deferred utility investments for transmission and distribution system upgrades;
and, • Improved power quality and reliability.
The benefits of energy storage are significant when they are fully integrated into the grid so that multiple stakeholders can benefit from it as a system resource. System ownership may be with the utility, independent power producer, or large power consumers. Energy storage will allow all parties connected to the grid to either directly or indirectly share benefits.
5. MISO
The day-to-day operation of the electricity system is conducted by the individual utilities and the regional reliability entity, MISO.8
After receiving approval from the Commission, Minnesota's four investor-owned utilities (Xcel Ener
5The acronym “MISO” formerly stood for Midwest Independent Transmission System Operator, however since its territory has expanded beyond the Midwest, MISO is no longer an acronym, but is the literal title of the organization. 13
gy, Minnesota Power, Otter Tail Power Company, and Interstate Power and Light) joined MISO and transferred functional control (but not ownership) of their transmission facilities to MISO. As an "independent system operator," MISO's operations and activities are subject to the approval of the Federal Energy Regulatory Commission (FERC).
MISO's primary function is to monitor the bulk power transmission system and the open-access electricity "market" and develop policies and procedures that ensure every electric industry participant has access to the transmission system, and that transmission lines are used to maximize efficiency, minimize congestion and maintain system reliability.
The Department dedicates significant resources to obtain input from and participate in workgroups within the Organization of MISO States (OMS). These OMS workgroups correspond with MISO workgroup and subcommittees. The Department has found the OMS to be a very useful process for teaming up with other states to provide joint filings to the Federal Energy Regulatory Commission (FERC) on the more significant MISO filings. The OMS has also been a vehicle through which the Department is able to be more proactive in MISO matters. The Department continues to attend or monitor MISO Advisory Meetings (which address key operational and organizational issues), annual stakeholder and sector meetings, Resource Adequacy Workgroup (RAWG) and Supply Adequacy Workgroup (SAWG) meetings, Midwest Transmission Expansion Plan (MTEP) meetings, Demand Response meetings, and more to gain better understanding of MISO proposals prior to implementation and to represent Minnesota’s interests in these matters.
C. Electricity Distribution and Service Quality
If the transmission system is analogous to the interstate highway system whose focus is on moving electricity efficiently and reliably, the local electric distribution system can be thought of as local streets and roads whose focus is on distributing quality electric service to retail customers. The number and frequency of distribution level service quality disturbances or "outages" is much greater than outages in the transmission system, but distribution outages typically affect fewer customers than transmission outages. Accordingly, distribution reliability is an important part of overall electric service quality.
Efforts to address distribution issues tend to focus on individual utilities rather than on the interconnected system as a whole. Minnesota has been addressing the specific issues of customer service quality and customer outages through industry-wide rulemaking and proceedings related to specific utilities. Minnesota’s regulated utilities currently file annual service quality reports, including proposed reliability goals for the next year, for MPUC approval.
D. Power Generation and Environmental Protection
Reliable, reasonably priced energy is necessary to sustain modern life and enable a robust economy. The generation and use of electricity, however, has negative impacts on the environment that must be managed and mitigated. Minnesotans expect a balance between mitigating the environmental impacts of electric generation and the availability of affordable, reliable electric service. The Department strives to reduce the emissions intensity of electric generation, as well as reduce overall emissions, while keeping rates affordable.
14
The Legislature, through Minn. Stat. § 216H.02, established the following greenhouse gas emission reduction goals: 15 percent reduction from 2005 levels by 2015, 30 percent reduction by 2025, and 80 percent reduction by 2050. While the Renewable Energy Standard and improvements to the Conservation Improvement Program will help to achieve those goals as they get closer to full implementation, the Metropolitan Emissions Reduction Project (MERP) is an early and major tool assisting Minnesota to attain the 2015 CO2 reduction goal. In 2010, about 32% of the GHG emissions were from the generation of electricity and about 24% of emissions were from transportation fuels. In 2010, GHG emissions were about 3% less than 2005 emissions.9
Older coal-combustion electric generation facilities contribute a significant portion of the criteria pollutants produced in Minnesota. Three of these coal-fired electric facilities are situated on the banks of the Mississippi and St. Croix rivers within the Twin Cities metropolitan area. In the spring of 2002, Xcel, the owner of the three facilities, filed a petition with the Minnesota Public Utilities Commission (MPUC), known as the "Metropolitan Emissions Reduction Project" (MERP), in fulfillment of a voluntary commitment made to the Izaak Walton League, as part of Xcel's merger proceeding before the Commission in 2000.10 The MPUC ultimately approved this proposal in December 2003. Throughout the approval process, the Department provided leadership and support for MERP with the goal of striking the appropriate balance, striving to reduce both the total amount of emissions from electric generation and the emissions per kilowatt-hour consumed in Minnesota.
MERP is one of the largest energy-related projects ever proposed in Minnesota. In July of 2007, Xcel Energy completed installation of state-of-the-art pollution control equipment at the coal-fired Allen S. King plant situated on the banks of the St. Croix River. Along the Mississippi River, a new natural gas-fired combined cycle facility was completed in May 2008 to replace the coal-fired units at Xcel’s High Bridge Plant. Finally, natural gas-fired equipment went into service at the Riverside Plant in March 2009, replacing coal-fired equipment. These MERP projects were not only environmentally beneficial but also increased Xcel Energy’s generating capacity by approximately 300 megawatts.
In addition to CO2, MERP also reduces emissions at the plants significantly by reducing sulfur dioxide emissions by 95 percent, nitrogen oxide by 95 percent, particulate matters by 70 percent, and mercury emissions to nearly zero. Health authorities have indicated that better air quality in the Twin Cities and in the state should translate into fewer illnesses such as asthma. Moreover, MERP enables electric generation facilities to remain within the Twin Cities, continuing to make use of existing electric transmission facilities.
E. Summary
To have reliable, reasonably priced and environmentally sensitive electric service is one of the guiding principles of Minnesota's energy policy and will remain among the Department’s top priorities in the coming years. The Department, in concert with other state agencies and interested persons, proactively seeks to preserve and enhance the reliability and quality of the electric system in Minnesota while continuing efforts to mitigate environmental impacts, including conservation and renewable energy efforts. The Department will continue to provide independent review and analysis of utility plans and assumptions to ensure that operations, maintenance, and system control measures are demonstrably adequate.
9After three years of reporting, Minnesota greenhouse gas emissions are declining, but at a weak rate that may leave the state short of its reduction goals under the Next Generation Energy Act. http://www.pca.state.mn.us/index.php/topics/climate-change/climate-change-in-minnesota/greenhouse-gas-emissions-in-minnesota.html 10Xcel’s MERP petition in Docket E002/M-02-633 was enabled by 2003 Minnesota Laws, Special Session Chapter 11, Article 3. 15
Additionally, the Department will continue to foster effective investment in transmission infrastructure so that it will be able to handle peak demands and permit the economic and physical flow of power from where it is generated to where it is needed. Reasonably priced, reliable power is critical to Minnesota's economic and social well-being and the Department is dedicated to the task of providing policymakers and regulators with the independent analysis needed so that the economic consequences of issues under consideration are clearly communicated and informed decision making can occur.
RENEWABLE ELECTRICY PORTFOLIO
Minnesota has developed a diversified energy portfolio with a mixture of fossil, nuclear and renewable power generation technologies—coupled with significant energy efficiency and conservation—to reduce risk to the system as whole as well as reduce environmental impacts.
As is historically the case, coal, nuclear, petroleum, and natural gas continue to provide the energy for the majority of the electricity produced in the state today. Since these fuels are not produced in the state they must be imported. Fifty-three percent of the electricity generated in Minnesota came from coal-fired electric power plants in 2011; most of its coal supply was brought in by rail from Montana and Wyoming. For 2011, the majority of natural gas was imported from Texas, Wyoming, and Louisiana, and a large majority of crude oil processed in the state was imported from Canada.
The two nuclear power plants near Minneapolis-St. Paul, the Monticello reactor and the Prairie Island I and II reactors, account for 22 percent of Minnesota’s net electricity generation. Minnesota spends approximately $12.5 billion to import the fossil and fissionable fuel used in the state each year. Over the last decade Minnesota has made substantial progress expanding the use of renewable energy sources to produce electricity to reduce dependence on fossil fuels and mitigating environmental impacts.
A. Renewable Energy Generation
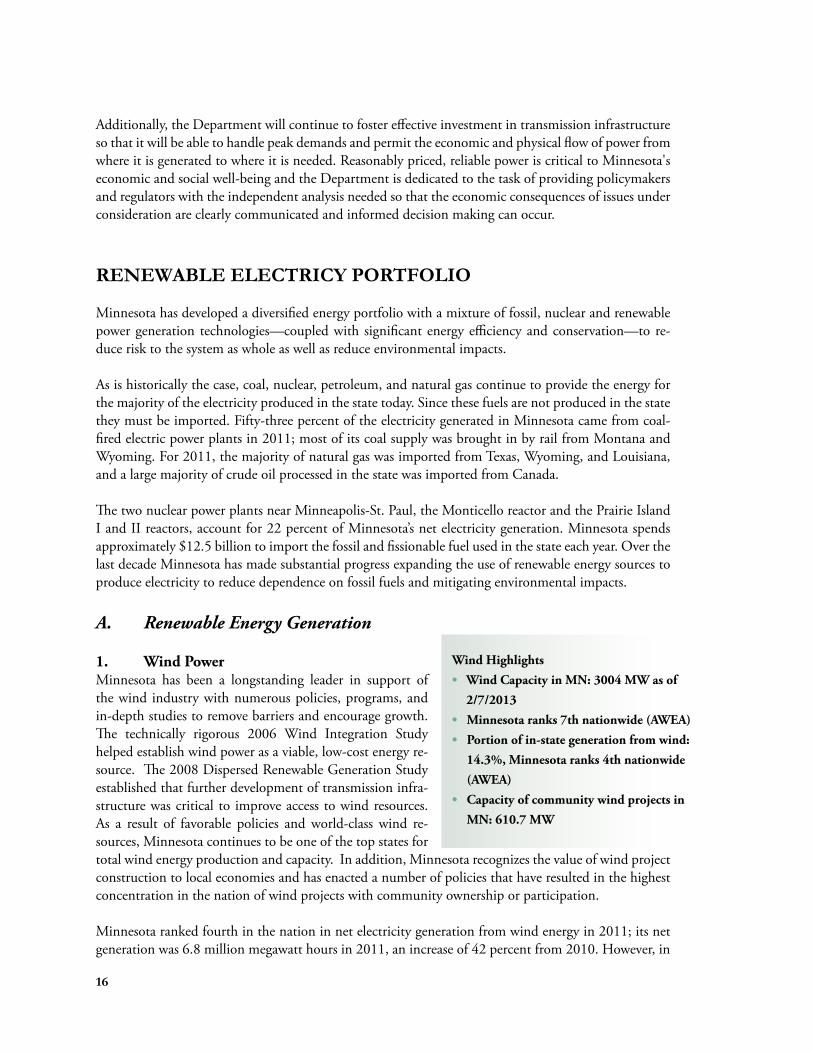
1. Wind Power Wind Highlights
Minnesota has been a longstanding leader in support of • Wind Capacity in MN: 3004 MW as of the wind industry with numerous policies, programs, and 2/7/2013 in-depth studies to remove barriers and encourage growth. • Minnesota ranks 7th nationwide (AWEA) The technically rigorous 2006 Wind Integration Study • Portion of in-state generation from wind: helped establish wind power as a viable, low-cost energy re 14.3%, Minnesota ranks 4th nationwide source. The 2008 Dispersed Renewable Generation Study
(AWEA) established that further development of transmission infra• Capacity of community wind projects in structure was critical to improve access to wind resources.
MN: 610.7 MWAs a result of favorable policies and world-class wind resources, Minnesota continues to be one of the top states for total wind energy production and capacity. In addition, Minnesota recognizes the value of wind project construction to local economies and has enacted a number of policies that have resulted in the highest concentration in the nation of wind projects with community ownership or participation.
Minnesota ranked fourth in the nation in net electricity generation from wind energy in 2011; its net generation was 6.8 million megawatt hours in 2011, an increase of 42 percent from 2010. However, in
16
651-539-1886, toll free 1-800-657-3710 Minnesota Division of Energy Resources www.energy.mn.gov
addition to wind power, the prices of other types of renewable energy have declined significantly, with re-powering existing hydro facilities and biomass co-firing also showing prices that are competitive with natural gas and new coal technologies. Conclusions made after comparing the cost of electricity generated using traditional fuels with the cost of electricity generated by renewable resources are dependent upon many factors besides the amount of capital investment needed to build the generator, such as changes in fuel prices due to international demand, as well as existing and evolving public health, air and water quality laws. In response to investment, the cost for producing electricity from Minnesota’s renewable energy resources has decreased while its contribution to gross state product has increased.
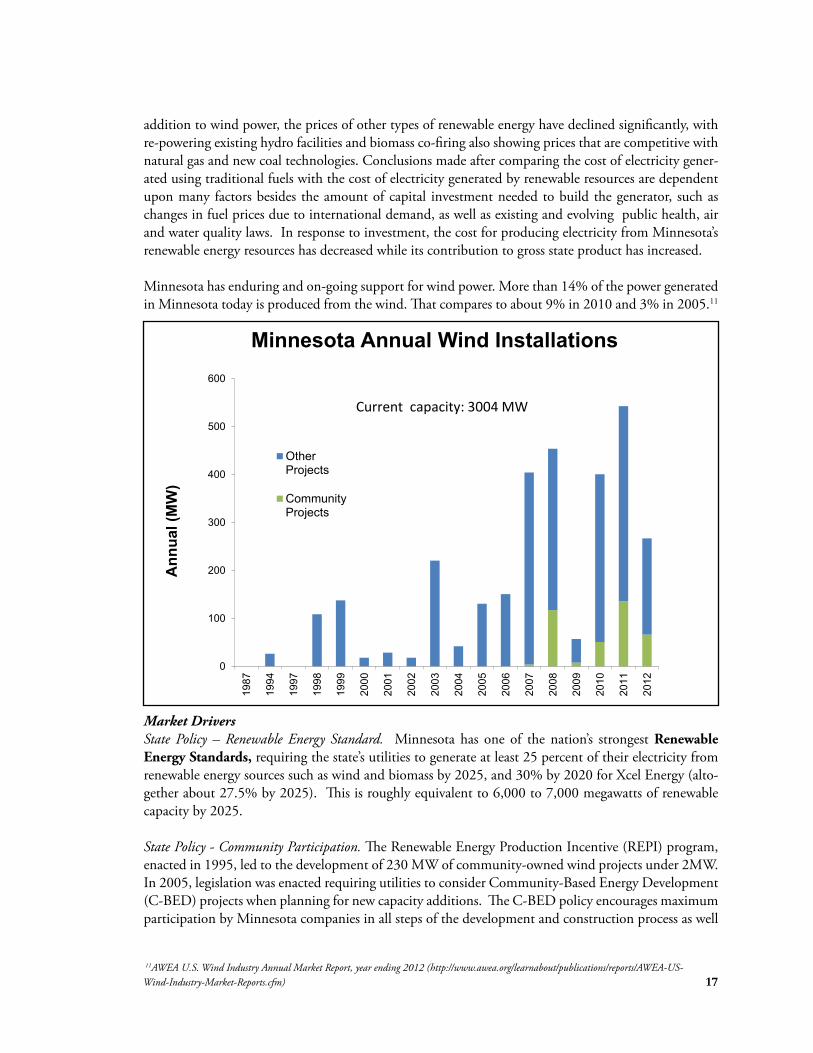
Minnesota has enduring and on-going support for wind power. More than 14% of the power generated in Minnesota today is produced from the wind. That compares to about 9% in 2010 and 3% in 2005.11
0
100
200
300
400
500
600
1987
1994
1997
1998
1999
2000
2001
2002
2003
2004
2005
2006
2007
2008
2009
2010
2011
2012
Ann
ual (
MW
)
Minnesota Annual Wind Installations
Other Projects
Community Projects
Current capacity: 3004 MW
Market Drivers State Policy – Renewable Energy Standard. Minnesota has one of the nation’s strongest Renewable Energy Standards, requiring the state’s utilities to generate at least 25 percent of their electricity from renewable energy sources such as wind and biomass by 2025, and 30% by 2020 for Xcel Energy (altogether about 27.5% by 2025). This is roughly equivalent to 6,000 to 7,000 megawatts of renewable capacity by 2025.
State Policy - Community Participation. The Renewable Energy Production Incentive (REPI) program, enacted in 1995, led to the development of 230 MW of community-owned wind projects under 2MW. In 2005, legislation was enacted requiring utilities to consider Community-Based Energy Development (C-BED) projects when planning for new capacity additions. The C-BED policy encourages maximum participation by Minnesota companies in all steps of the development and construction process as well
11AWEA U.S. Wind Industry Annual Market Report, year ending 2012 (http://www.awea.org/learnabout/publications/reports/AWEA-USWind-Industry-Market-Reports.cfm) 17
as service and maintenance. Minnesota statutes also require the Public Utilities Commission to consider local benefits from renewable energy projects used to satisfy utility Renewable Energy Standards (216B.1691, Subd. 9).
Transmission - As an early adopter of wind power, Minnesota used readily available transmission capacity earlier than other states. A key issue for wind project development has been cost allocation for new transmission lines. In 2010, the Federal Energy Regulatory Commission (FERC) approved the Midwest Independent Transmission Service Operator (MISO) Multi-Value Project (MVP) method of cost allocation for certain large transmission projects that spreads costs across the entire MISO region spanning 15 states plus Manitoba12. In Minnesota, the MISO Transmission Expansion Plan (MTEP) portfolio of MVP projects includes the 240-mile Brookings, SD-Twin Cities transmission line, which is planned for completion between 2013-2015. To aid planning efforts for all interested parties, Minnesota requires utilities that own or operate transmission lines or substations in the state to report on Electric Transmission project detailed on http://www. minnelectrans.com.
Federal Policy - Federal Policy has been an important factor in the timing of wind project development. Much of the activity in 2011 was partly due to projects already in development at the end of 2010, the last time eligibility for the 1603 treasury grant was set to expire. The Tax Relief, Unemployment Insurance Reauthorization, and
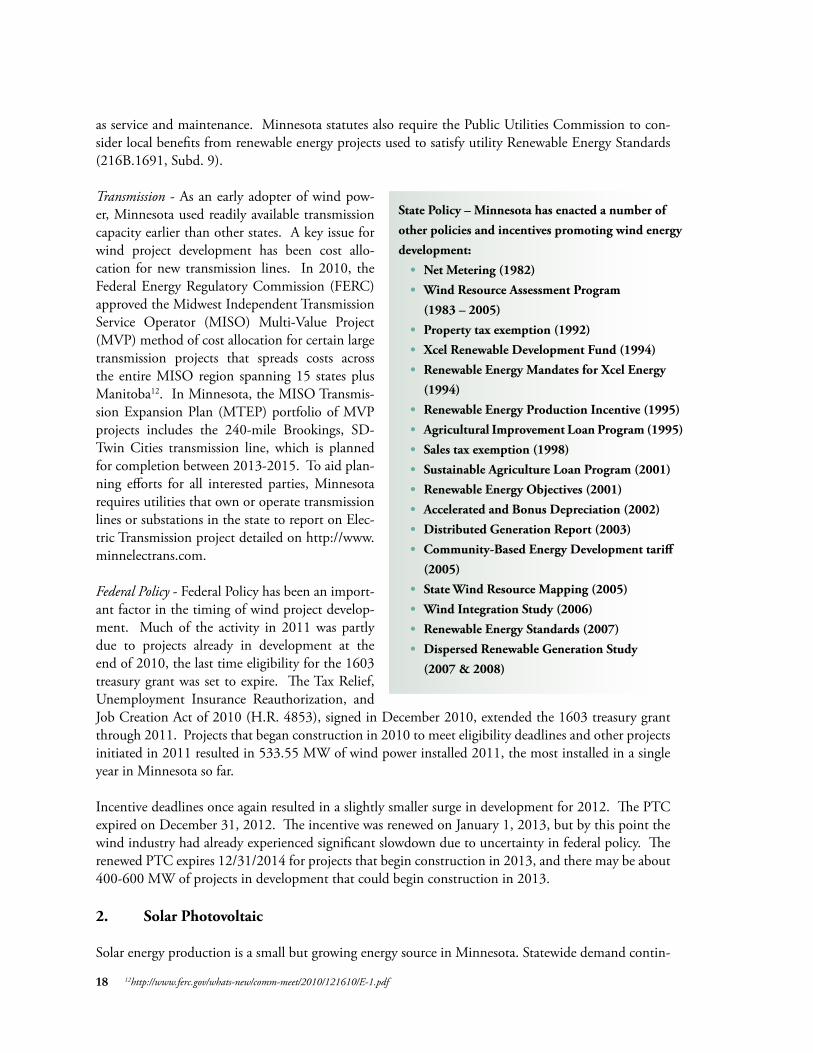
State Policy – Minnesota has enacted a number of other policies and incentives promoting wind energy development: • Net Metering (1982) • Wind Resource Assessment Program
(1983 – 2005) • Property tax exemption (1992) • Xcel Renewable Development Fund (1994) • Renewable Energy Mandates for Xcel Energy
(1994) • Renewable Energy Production Incentive (1995) • Agricultural Improvement Loan Program (1995) • Sales tax exemption (1998) • Sustainable Agriculture Loan Program (2001) • Renewable Energy Objectives (2001) • Accelerated and Bonus Depreciation (2002) • Distributed Generation Report (2003) • Community-Based Energy Development tariff
(2005) • State Wind Resource Mapping (2005) • Wind Integration Study (2006) • Renewable Energy Standards (2007) • Dispersed Renewable Generation Study
(2007 & 2008)
Job Creation Act of 2010 (H.R. 4853), signed in December 2010, extended the 1603 treasury grant through 2011. Projects that began construction in 2010 to meet eligibility deadlines and other projects initiated in 2011 resulted in 533.55 MW of wind power installed 2011, the most installed in a single year in Minnesota so far.
Incentive deadlines once again resulted in a slightly smaller surge in development for 2012. The PTC expired on December 31, 2012. The incentive was renewed on January 1, 2013, but by this point the wind industry had already experienced significant slowdown due to uncertainty in federal policy. The renewed PTC expires 12/31/2014 for projects that begin construction in 2013, and there may be about 400-600 MW of projects in development that could begin construction in 2013.
2. Solar Photovoltaic
Solar energy production is a small but growing energy source in Minnesota. Statewide demand contin
18 12http://www.ferc.gov/whats-new/comm-meet/2010/121610/E-1.pdf
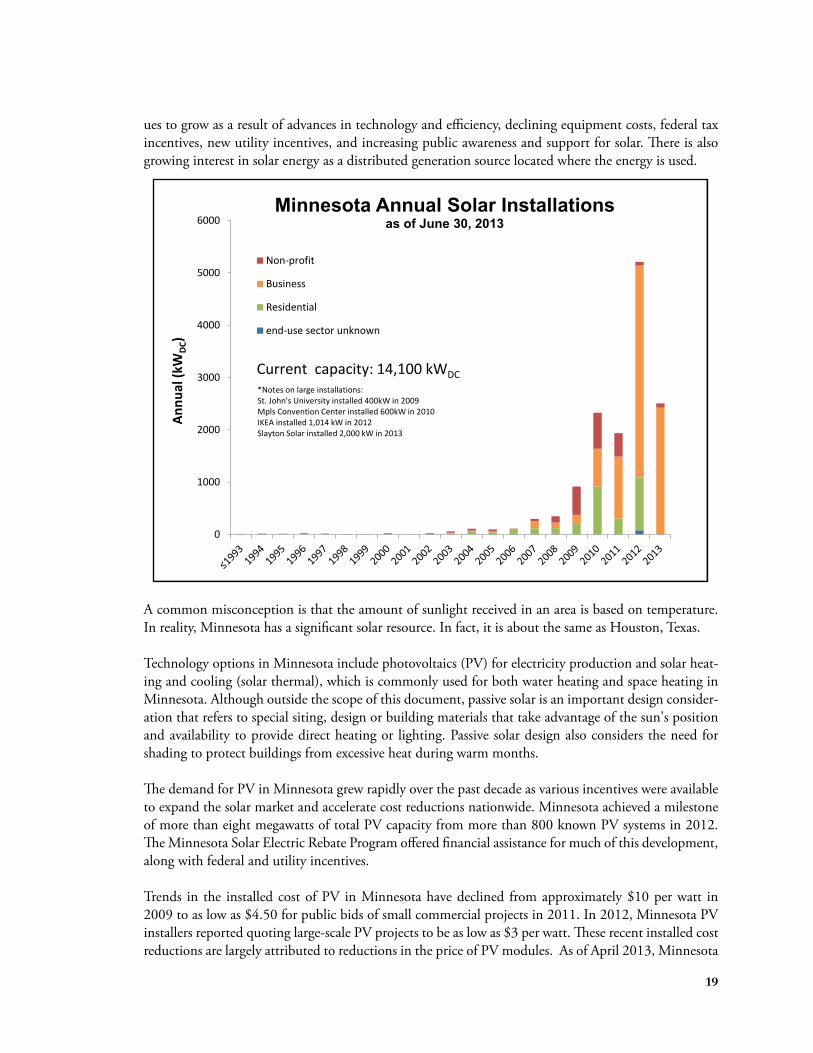
ues to grow as a result of advances in technology and efficiency, declining equipment costs, federal tax incentives, new utility incentives, and increasing public awareness and support for solar. There is also growing interest in solar energy as a distributed generation source located where the energy is used.
0
1000
2000
3000
4000
5000
6000
Annu
al (k
WDC
)
Minnesota Annual Solar Installations as of June 30, 2013
Non-profit
Business
Residential
end-use sector unknown
Current capacity: 14,100 kWDC *Notes on large installations: St. John's University installed 400kW in 2009 Mpls Convention Center installed 600kW in 2010 IKEA installed 1,014 kW in 2012 Slayton Solar installed 2,000 kW in 2013
A common misconception is that the amount of sunlight received in an area is based on temperature. In reality, Minnesota has a significant solar resource. In fact, it is about the same as Houston, Texas.
Technology options in Minnesota include photovoltaics (PV) for electricity production and solar heating and cooling (solar thermal), which is commonly used for both water heating and space heating in Minnesota. Although outside the scope of this document, passive solar is an important design consideration that refers to special siting, design or building materials that take advantage of the sun's position and availability to provide direct heating or lighting. Passive solar design also considers the need for shading to protect buildings from excessive heat during warm months.
The demand for PV in Minnesota grew rapidly over the past decade as various incentives were available to expand the solar market and accelerate cost reductions nationwide. Minnesota achieved a milestone of more than eight megawatts of total PV capacity from more than 800 known PV systems in 2012. The Minnesota Solar Electric Rebate Program offered financial assistance for much of this development, along with federal and utility incentives.
Trends in the installed cost of PV in Minnesota have declined from approximately $10 per watt in 2009 to as low as $4.50 for public bids of small commercial projects in 2011. In 2012, Minnesota PV installers reported quoting large-scale PV projects to be as low as $3 per watt. These recent installed cost reductions are largely attributed to reductions in the price of PV modules. As of April 2013, Minnesota
19
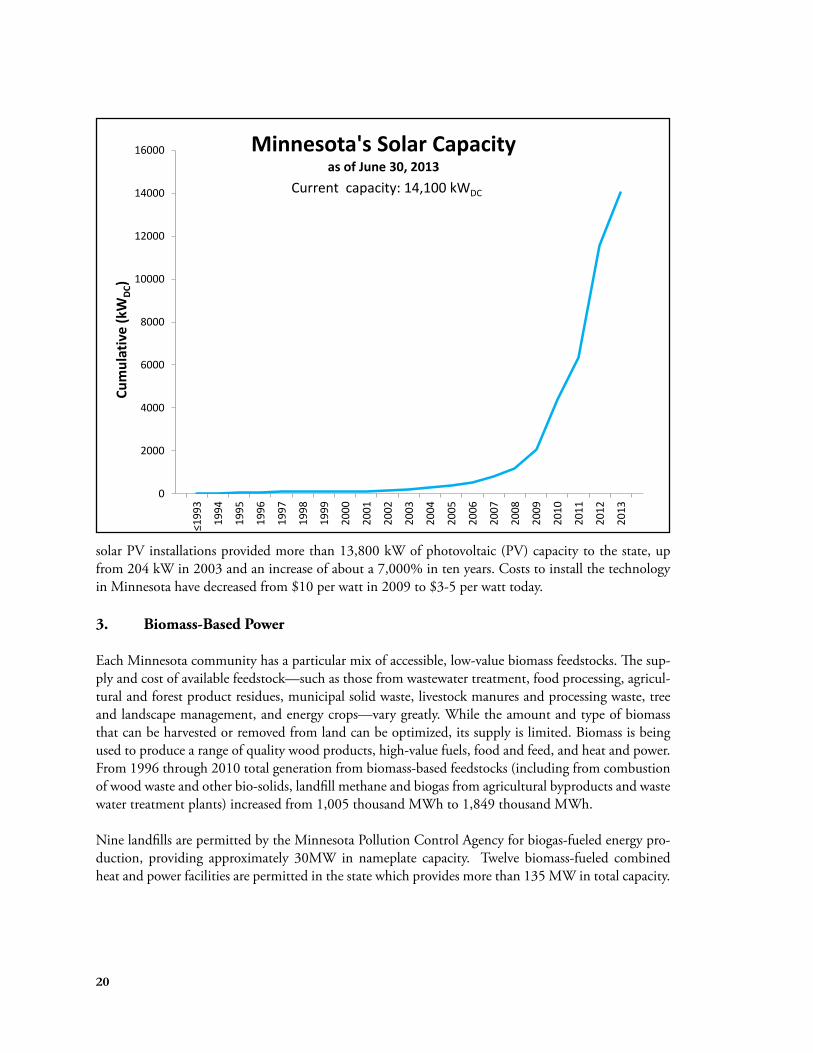
16000 Minnesota's Solar Capacity as of June 30, 2013
0
2000
4000
6000
8000
10000
12000
14000
Cumulative (kWDC )
Current capacity: 14,100 kWDC ≤1993
1994
1995
1996
1997
1998
1999
2000
2001
2002
2003
2004
2005
2006
2007
2008
2009
2010
2011
2012
2013
solar PV installations provided more than 13,800 kW of photovoltaic (PV) capacity to the state, up from 204 kW in 2003 and an increase of about a 7,000% in ten years. Costs to install the technology in Minnesota have decreased from $10 per watt in 2009 to $3-5 per watt today.
3. Biomass-Based Power
Each Minnesota community has a particular mix of accessible, low-value biomass feedstocks. The supply and cost of available feedstock—such as those from wastewater treatment, food processing, agricultural and forest product residues, municipal solid waste, livestock manures and processing waste, tree and landscape management, and energy crops—vary greatly. While the amount and type of biomass that can be harvested or removed from land can be optimized, its supply is limited. Biomass is being used to produce a range of quality wood products, high-value fuels, food and feed, and heat and power. From 1996 through 2010 total generation from biomass-based feedstocks (including from combustion of wood waste and other bio-solids, landfill methane and biogas from agricultural byproducts and waste water treatment plants) increased from 1,005 thousand MWh to 1,849 thousand MWh.
Nine landfills are permitted by the Minnesota Pollution Control Agency for biogas-fueled energy production, providing approximately 30MW in nameplate capacity. Twelve biomass-fueled combined heat and power facilities are permitted in the state which provides more than 135 MW in total capacity.
20
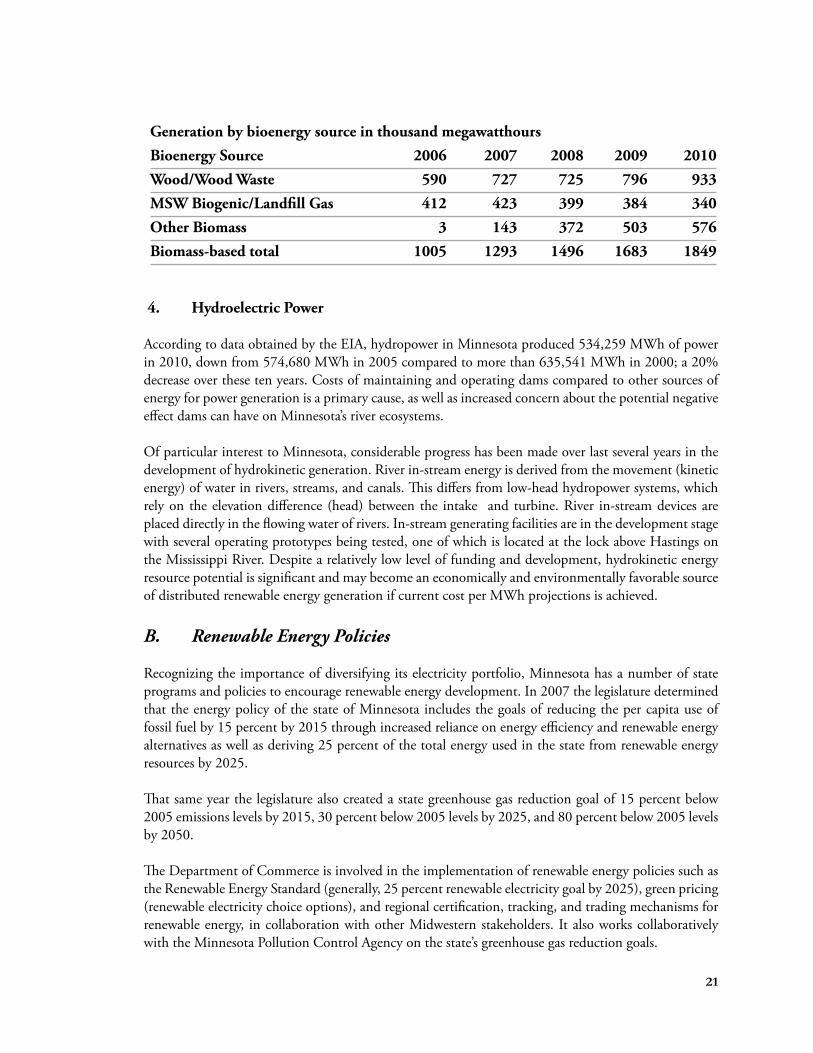
Generation by bioenergy source in thousand megawatthours Bioenergy Source 2006 2007 2008 2009 2010 Wood/Wood Waste 590 727 725 796 933 MSW Biogenic/Landfill Gas 412 423 399 384 340 Other Biomass 3 143 372 503 576 Biomass-based total 1005 1293 1496 1683 1849
4. Hydroelectric Power
According to data obtained by the EIA, hydropower in Minnesota produced 534,259 MWh of power in 2010, down from 574,680 MWh in 2005 compared to more than 635,541 MWh in 2000; a 20% decrease over these ten years. Costs of maintaining and operating dams compared to other sources of energy for power generation is a primary cause, as well as increased concern about the potential negative effect dams can have on Minnesota’s river ecosystems.
Of particular interest to Minnesota, considerable progress has been made over last several years in the development of hydrokinetic generation. River in-stream energy is derived from the movement (kinetic energy) of water in rivers, streams, and canals. This differs from low-head hydropower systems, which rely on the elevation difference (head) between the intake and turbine. River in-stream devices are placed directly in the flowing water of rivers. In-stream generating facilities are in the development stage with several operating prototypes being tested, one of which is located at the lock above Hastings on the Mississippi River. Despite a relatively low level of funding and development, hydrokinetic energy resource potential is significant and may become an economically and environmentally favorable source of distributed renewable energy generation if current cost per MWh projections is achieved.
B. Renewable Energy Policies
Recognizing the importance of diversifying its electricity portfolio, Minnesota has a number of state programs and policies to encourage renewable energy development. In 2007 the legislature determined that the energy policy of the state of Minnesota includes the goals of reducing the per capita use of fossil fuel by 15 percent by 2015 through increased reliance on energy efficiency and renewable energy alternatives as well as deriving 25 percent of the total energy used in the state from renewable energy resources by 2025.
That same year the legislature also created a state greenhouse gas reduction goal of 15 percent below 2005 emissions levels by 2015, 30 percent below 2005 levels by 2025, and 80 percent below 2005 levels by 2050.
The Department of Commerce is involved in the implementation of renewable energy policies such as the Renewable Energy Standard (generally, 25 percent renewable electricity goal by 2025), green pricing (renewable electricity choice options), and regional certification, tracking, and trading mechanisms for renewable energy, in collaboration with other Midwestern stakeholders. It also works collaboratively with the Minnesota Pollution Control Agency on the state’s greenhouse gas reduction goals.
21
1. Evolution from the Renewable Energy Objectives to the Renewable Energy Standards
The 2001 Legislature adopted several provisions to promote the development and use of renewable energy in Minnesota. The most significant of these provisions was the Renewable Energy Objective (REO) codified in Minn. Stat. §216B.1691. As originally enacted, the REO required each of these utilities to make a good faith effort to ensure that at least one percent of the energy the utility provided to Minnesota consumers was generated by an eligible renewable energy source by 2005, and to increase this amount to 10 percent by 2015.
The 2003 legislation amended the REO statute to make the renewable energy objective a requirement for Xcel (rather than a "good faith" objective). Xcel’s REO requirement was in addition to the acquisition of renewable capacity (825 megawatts of wind, 125 megawatts of biomass) mandated in 1994 legislation that allowed the company to increase its storage of nuclear waste at its Prairie Island Nuclear facility. In addition, the legislation required the MPUC to establish criteria and standards to measure an electric utility's efforts to meet the renewable energy objectives and authorized MPUC to establish a renewable energy credits trading program for the REO, whereby utilities could purchase certified renewable energy credits rather than generate or procure the renewable energy directly.
In February 2007, Minnesota enacted legislation that:
• created a Renewable Energy Standard (RES) beginning in 2010; • modified the state's existing non-mandated renewable-energy objective; • required the MPUC to establish a trading system for renewable credits; and • amended the definition of "eligible energy technology.13
The 2007 law required that, by 2010, utilities needed to make a good faith effort to generate or procure 7 percent of their retail electric sales from an eligible energy technology. The standard for Xcel Energy requires that eligible renewable electricity account for 30 percent of total retail electricity sales in Minnesota by 2020. Of the 30 percent renewable energy required of Xcel Energy in 2020, "at least" 25 percent must be generated by wind-energy systems, and "the remaining" 5 percent by other eligible technologies. The standard for other Minnesota utilities requires that eligible renewable electricity account for 25 percent of retail electricity sales to the utility’s retail customers (or to the retail customers of a distribution utility to which a generation-and-transmission (G&T) entity provides wholesale service) in Minnesota by 2025. Utilities subject to the Minnesota RES are:
• Basin Electric, • Central Minnesota Municipal Power Agency, • Dairyland Power Cooperative, • East River Electric Cooperative, • Great River Energy, • Heartland Consumers Power District, • Interstate Power and Light, • L&O Power Cooperative, • Minnkota Power Cooperative, • Minnesota Municipal Power Agency,
13The definition is “electricity generated by solar, wind, hydroelectric facilities less than 100 megawatts (MW), hydrogen and biomass, 22 which includes landfill gas, anaerobic digestion, and municipal solid waste.”
• Minnesota Power, • Missouri River Energy Services, • Northwestern Wisconsin Electric Company, • Otter Tail Power Company, • Southern Minnesota Municipal Power Agency, and • Xcel Energy.
The RES requirements for all utilities, except Xcel Energy, are as follows:
• 2012 12 percent • 2016 17 percent • 2020 20 percent • 2025 25 percent
Xcel is required to meet the following:
• 2010 15% • 2012 18% • 2016 25% • 2020 30%
The 2007 legislation required the MPUC to establish a program for tradable Renewable Energy Credits (RECs) by January 1, 2008. The MPUC approved the Midwest Renewable Energy Tracking System (M-RETS) for this purpose in October 2007 and required all utilities to make a substantial and good faith effort to register renewable generation assets by March 1, 2008. The program treats all eligible renewable energy equally and may not ascribe more or less credit to energy based on the state in which the energy was generated or the technology used to generate the energy.
Under Minn. Stat. §216B.1691, Subd. 4(e), Xcel Energy may not sell RECs to other Minnesota utilities for RES-compliance purposes until 2021. In addition, in December 2007 (in Docket E-999/CI04-1616), the MPUC made certain additional determinations for the operation of the REC trading system.14 This docket remains open to address issues not covered during the first phase of rulemaking, as well as future implementation issues that may arise due to changes in national, state, or M-RETS policies and protocols. Minnesota utilities have been required to register and set up accounts in M-RETS since January 1, 2008.
While the MPUC makes the official determination as to whether utilities are complying with the RES Statute, the Department provides a separate report to the Minnesota Legislature every two years summarizing utility compliance. In the report submitted January 7, 2011, the Department noted that although utilities faced certain obstacles in meeting their RES requirements, the utilities appeared to have met their 2009 obligations and were on track to comply with 2010’s goals.
14In Docket No. E999/CI-04-1616, the MPUC made the following listed determinations: • RECs will have a trading lifetime of 4 years according to the year of generation (i.e., all credits generated during 2008, regardless of the
month, will expire at the end of 2012). • The purchase of RECs through M-RETS may be used in utility green pricing programs, subject to the shelf life described above. • Consistent with M-RETS operating procedures, RECs must remain “whole” and may not be disaggregated into separate environmental
commodities (e.g., carbon emission credits) • The MPUC declined to issue a directive ascribing ownership of RECs where ownership is not addressed in power purchase agreements
(PPAs), instead requiring utilities to pursue negotiations and settlements with the owners of generation units. 23
In 2011, Minn. Stat. §216B.1691 (RES Statute) was amended to require utilities subject to the RES Statute to submit “a report containing an estimate of the rate impact of activities of the electric utility necessary to comply with section 216B.1691.” On November 1, 2011, utilities subject to the RES Statute submitted their reports. Based on the reports filed by the utilities and through our analysis of their respective Integrated Resource Plans, the Department has concluded that RES compliance is generally cost-effective for the utilities subject to Minnesota’s RES Statute.
2. Renewable Energy Tradable Credits
The Renewable Energy Objective (216B.1691) and Green Pricing (216B.169) create the possibility of a market for renewable energy. Under the notion of Renewable Energy Tradable Credits, electricity from renewable sources may be treated as a separate electricity commodity with additional value attributes. Many renewable energy contracts between electric utilities and energy producers now contain language specifying the ownership of the RECs. These green credits could potentially be used for green pricing programs and renewable energy objectives or for emissions credits in pollution reduction markets.
C. Renewable Energy Programs
1. Green Pricing Program
Minnesota's voluntary green pricing program gives consumers the option of purchasing renewable energy beyond the minimum standard set by the state. By paying a premium on their electricity bill, consumers support increased development of renewable energy projects and reduce their reliance on fossil fuels. Increased use of renewable energy sources also benefits the local economy and improves Minnesota's energy security.
The Department regulates green pricing programs (216B.169) in the state to protect consumer interests. Renewable energy procured on behalf of green pricing customers cannot be sold twice or counted toward any state's Renewable Energy Standard. Utilities must report on renewable energy procured for green pricing customers to verify that green pricing sales do not exceed green pricing generation. Starting in July 2009, utilities have recorded renewable energy credits for green pricing generation in the Midwest Renewable Energy Tracking System (MRETS) to verify compliance.
From July 1, 2007-June 30, 2008, electric utility green pricing programs in Minnesota sold 181,550 megawatt-hours of renewable electricity, a 28% increase over the previous fiscal year. In 2010, it became optional for electric utilities to offer green pricing programs to their customers, but most utilities have continued to offer these popular programs as consumer-driven sales of green power have continued to grow.
2. Solar Rebate Programs
The first phases of the Minnesota Solar Rebate Programs were supported by the Xcel Energy Renewable Development Fund (RDF) from 2002-2009 and initially targeted solar photovoltaic (PV) development. The funds were later expanded to include solar thermal technologies as well. The final phase of the program launched in March 2010 and was supported with federal funds from the American Recovery and Reinvestment Act (ARRA). ARRA provided $3 million for capacity-based solar rebates including PV, solar hot water, and solar air heat. 24
Minnesota Solar Electric Rebate Program Much of the state’s early solar PV adoption is a result of the Minnesota Solar Electric Rebate Program along with utility programs and federal tax incentives available through December 31, 2016. Between 2002 and 2006, a $1 million grant from the RDF supported 500 kilowatts (131 installations) of grid-connected solar PV systems. During the first two years, there were few applicants so eligibility was expanded from Xcel Energy’s customers to include electric customers statewide. In 2006, the program was fully reserved. During fiscal years 2008 and 2009, an additional $1.2 million was appropriated from the RDF, and both solar electric and solar hot water technologies were eligible. The $1.1 million Solar Electric Rebate Program in 2008-09 resulted in approximately 150 installations receiving $2,000 per kilowatt rebates for grid-connected solar electric installations of up to 10 kilowatts. The average total cost of a PV system installed under the program was $9,774 per kilowatt installed.
Beginning in 2009, the program was limited to professional installations (by licensed contractors and professional engineers) in an effort to support better performing systems and workforce development. In addition, program guidelines were revised in 2008 to offer an additional $250 per kilowatt to applicants who chose North American Board of Certified Energy Practitioners (NABCEP) certified PV installers. NABCEP certified installers have signed a code of ethics, met specific standards of experience and training, and passed an extensive four-hour exam. This voluntary certification helps protect consumers and enhances the solar profession by promoting training and regular continuing education. The number of certified installers in Minnesota increased from 14 to 63 between 2008 and 2012, largely as a result of the Program’s bonus incentive for NABCEP certification.
The final phase of the program launched in March 2010 and was supported with federal funds from ARRA. ARRA provided $2.3 million in rebates. This final phase of the program resulted in 240 new projects and 1.5 MW of additional PV capacity.
Solar Air Heat Program The ARRA/State Energy Program-funded Solar Air Heat Program launched during spring 2010 and concluded in September 2011. The new program resulted in nine new solar air heat projects totaling 736 square feet of capacity for space heating. These projects voluntarily utilized collectors from two Minnesota manufacturers.
Solar Hot Water Rebate Program The initial residential Minnesota Solar Hot Water Rebate (launched July 2008) promoted investment in solar domestic hot water systems, with state matching funds of up to $2,500 for a single-family home and up to $10,000 for multi-family dwellings. The $100,000 program was fully reserved after five months.
In spring 2010 through fall 2011, the Department offered new funding through ARRA/SEP for residential and small commercial solar hot water systems. The program resulted in 66 new projects totaling 9,815 square feet of capacity. More than half the installations under this program specified Minnesota-made collectors.
3. Minneapolis Saint Paul Solar America Cities Program
The Department was a partner from 2008-2012 in the Minneapolis Saint Paul Solar America Cities
25
initiative. Solar Cities was supported by the U.S. Department of Energy's Solar America Communities Program with the goal of making solar PV cost-competitive by 2020. As part of this effort, the Department worked with the cities and Minnesota organizations to deploy solar technologies widely in the coming decade. The program resulted in a quintupling of PV capacity in the Twin Cities and four new solar thermal installations, including the Midwest’s largest solar installation located at the RiverCentre in Saint Paul. District Energy owns and operates the 23,000-square-foot solar hot water system, which is the first in the United States to be integrated into a district energy system. The solar energy produced is used on-site (at the Saint Paul RiverCentre) for domestic hot water and space heating, with excess energy exported to serve other buildings within the district heating network. The project has been recognized with numerous awards and has drawn hundreds of visitors nationwide and globally.
4. Renewable Hydrogen Initiative
Virtually all of the hydrogen produced in the United States today comes from natural gas and coal. The cheapest and most common method of hydrogen extraction is steam methane reformation of fossil fuel. Although Minnesota has an abundance of renewable wind, solar and biomass resources, all fossil and nuclear fuel must be purchased from other locations and imported into the state. Based in part on an assessment of marketplace economics and Minnesota's competitive strengths to produce renewable hydrogen for that marketplace, Minnesota Session Laws 2007, Minn. Stat. §216B.813 created the Minnesota Renewable Hydrogen Initiative.
Technology developments within the national hydrogen program have not progressed as quickly or successfully as anticipated in 2007. Hydrogen, like batteries, is an energy-storage medium. Other advanced energy storage technologies that do not need the major investment in infrastructure that hydrogen requires have been successfully commercialized over the 2007-2012 time period. High-performance batteries/capacitors represent the largest competitor to hydrogen as an energy carrier.
The overarching technical and economic challenge to hydrogen as an energy carrier is achieving system cost efficiencies to make hydrogen produced from any source price competitive with current fuels. Nationally, as well as for Minnesota, a portfolio of feedstocks and technologies for renewable hydrogen production will be necessary to address energy security and environmental and economic needs.
Hydrogen Delivery and Storage - Hydrogen must be transported from the production site to the end user (e.g., a fueling station or stationary power site) or produced on-site. It also must be compressed, stored, and dispensed at refueling stations or at stationary power generation sites. Due to hydrogen’s relatively low volumetric energy density, the transportation, storage, and final delivery of hydrogen as an energy carrier currently entails significant costs and inefficiencies. Current costs for the transport of hydrogen range from $2 to $8/gasoline gallon equivalent (gge) and are dependent on the quantity of hydrogen and the distance that the hydrogen is transported. Pipeline transport costs are at the lower end of the cost range and are also dependent on transport distance and quantities. These transport costs do not include compression, storage, and dispensing at fueling sites, which can add $2–3/gge of hydrogen. Argonne National Laboratory estimates that hydrogen pipelines will cost an additional 45-75% more than natural gas pipelines, depending on the method used.
Minnesota Hydrogen Code and Standards- In 2008, the Minnesota Departments of Commerce and Labor and Industry conducted a review of the status of existing hydrogen codes and standards in the state
15Report submitted to the Minnesota Legislature by the Minnesota Department of Labor and Industry, in consultation with the Minnesota Department of Commerce Office of Energy Security, Recommendations for the Adoption of Uniform Hydrogen and Fuel Cell Codes and
26 Standards, (State of Minnesota, 2008).
and the results of that effort are included in a 2008 report to the Minnesota Legislature, “Recommendations for the Adoption of Uniform Hydrogen and Fuel Cell Codes and Standards.”15
This report found that the State of Minnesota regulates codes and standards in such a way that all regulatory jurisdictions in the state have the same safety standards with regard to the production, storage, transportation, distribution, use of hydrogen, fuel cells, and related technologies. Except where amended, Minnesota codes and standards cover hydrogen and fuel cells by adoption of national codes and standards developed by the International Codes Council (ICC) and the National Fire Protection Association (NFPA). In 2009, the Minnesota Department of Labor and Industry incorporated the International Mechanical Code and International Fire Gas Code into the Minnesota State Building Code, which included hydrogen provisions that had previously been excluded from Minnesota codes (IMC 304.4 and IFGC 703).
Fuel Cells - Early market penetration is targeted through the development of fuel cell technologies and systems for portable personal-power applications, auxiliary power units (APUs), and applications such as forklifts for material handling and specialty equipment. Fuel cell technologies are providing sufficient performance and durability to be competitive with alternative technologies in some of these applications, while in others relatively modest improvements are required. The expansion of fuel cells into additional applications and markets that have more stringent technical and cost requirements are also being pursued.
Major challenges in the advancement of fuel cell technology are reduction of cost and improvement of durability. Air, thermal, and water management are also key issues for enhancing fuel cell performance.
Future of Hydrogen in Minnesota - Based on an assessment of marketplace economics and Minnesota's competitive strengths, the most prudent investments recommended to further the state’s hydrogen goal [Minn. Stat. 216B.8109] is to invest in technologies that will increase the efficiency, lower costs, or increase profitability of Minnesota’s renewable energy industry. This approach is both consistent with findings of the national hydrogen program and complements Minnesota's competitive strengths in the production of renewable energy.
The potential for production of renewable ammonia or other high-value biochemical products is an example of how progress can occur with renewable hydrogen by leveraging nearer-term market opportunities in parallel technologies. Decreasing costs of producing biomass-based, hydrogen rich chemicals, fuels and gases is a pragmatic step to decrease costs of renewable elemental hydrogen.
Legislative direction diverted all funds that had been appropriated to carry out 216B.813 so the Department is unable to continue activities singular to hydrogen. The Department will continue to encourage promising hydrogen developments within the state and national program, and will continue to include hydrogen in the context of the full range of existing and developing energy efficiency, energy storage and renewable energy technologies.
NATURAL GAS
Domestic natural gas markets and corresponding prices have changed dramatically over the past several years. Although conventional natural gas production, as well as natural gas imports, have decreased,
27
advances in other ways of natural gas extraction, such as horizontal drilling and hydraulic fracturing or “fracking,” have allowed access to large volumes of shale gas that were previously uneconomical to produce, resulting in an increase in natural gas production in the United States and Canada.
These developments in unconventional production have created large natural gas supply surpluses despite increases in natural gas demand. The increase in consumption is expected due to the growing use of natural gas to produce electricity and for other industrial uses. The role of natural gas in electricity production is an ongoing national energy debate.
As the future of natural gas is considered, there are issues that warrant focus. These issues can be categorized into four general areas, each discussed below.
• Increasing Demand • Supply Availability • Price Volatility • Service Quality and Reliability
A. Demand – Changing Consumption Patterns
Natural gas consumption in the residential and commercial sectors is influenced primarily by weather. If winters are mild, use of natural gas to heat homes and businesses normally decreases; if winters are severe, weather-related consumption is higher. However, natural gas consumption is also affected by the general level of economic activity and the relative prices of natural gas and alternative fuels. Consumption of natural gas, or demand, is projected to increase in the near term.
Statewide, Minnesotans consumed a total of 394 billion cubic feet of natural gas in 2009, a decrease from the 2008 consumption level of 425 billion cubic feet. In 2010, Minnesotans consumed 423 billion cubic feet of natural gas. The decline in 2009 was consistent with a general trend in the United States of decreased use due to the significant economic downturn. In 2010, Minnesota’s natural gas consumption was nearly as high as the historically high level in 2008. In 2011, the state’s natural gas consumption was 421 billion cubic feet, slightly less than the 423 billion cubic feet consumed the previous year.
As shown in Appendix B, there are three notable consumption trends. First, over time, more natural gas is being used for electric generation. During the energy crisis in the middle and late 1970s, use of natural gas for electric generation declined sharply. Recently, however, natural gas has been used at significantly higher rates to generate electricity. One of the reasons for turning to natural gas as a fuel source for electricity is that gas-fired plants have fewer harmful environmental effects than other traditional fossil fuels, such as coal or fuel oil. Another reason is that natural gas-fired electric generation is more flexible than coal-fired generation because it can be brought on- and off-line quickly.
The second notable consumption trend in Minnesota is the significant increase in natural gas used by industrial customers. The increase in natural gas used by this sector dominates the overall trends in Minnesota, overriding the decreases in natural gas used by residential customers.
28
Thirdly, as shown in Appendix B, after removing the effects of weather, residential consumption of natural gas per customer has declined from 161.6 thousand cubic feet per year in 1965 to 91.4 thousand cubic feet per year in 2008 (or approximately 43.5 percent over the last 43 years). One of the reasons for this trend is the increased efficiency of household gas-fueled appliances as well as the construction of energy-efficient new housing as specified by building code requirements.
On a national level, total demand for natural gas has been growing since 1949 with consumption of 4.971 trillion cubic feet (Tcf ) in 1949 to 24.369 Tcf in 2011.16 National gas consumption shows an increase of 2.5 percent (from 23.775 Tcf to 24.369 Tcf ) between 2010 and 2011. Residential natural gas consumption grew from 0.993 Tcf in 1949 to 4.735 Tcf in 2011; consumption by residential customers generally peaked in 1970 and has since either stayed the same or declined. Commercial consumption of natural gas grew from 0.39 Tcf in 1949 to 3.16 Tcf in 2011. Consumption by commercial customers peaked in the 1970s, but unlike the residential sector, use of natural gas for commercial purposes increased again in the 1990s, reaching a higher plateau in the 2000s. EIA’s 2011 Annual Energy Outlook (AEO2011) projects an increase in natural gas consumption to 26.6 trillion cubic feet (Tcf ) by 2035.17
According to the EIA, the largest potential near-future increase in the use of natural gas will come from electric generation. This trend is only starting to be evident in Minnesota, as shown in Appendix B. At a national level, natural gas consumption for electricity generation increased from 6.85 Tcf in 2008 to 7.18 Tcf in 2011, an average, annual growth rate of approximately 5.9 percent.18 The projected path of natural gas consumption depends almost entirely on the amount consumed in the electric power sector and a few other industrial uses in Minnesota, such as mining.
B. Supply Availability
A discussion of natural gas demand is not complete without a corresponding discussion of natural gas supply. Because Minnesota has no native source of natural gas supplies, Minnesota utilities must obtain natural gas from other locations through interstate pipelines. Currently, these interstate pipelines enter the state predominately from Canada, the Gulf Coast, and North Dakota. Nationally, net imports are expected to decline as a percentage of U.S. natural gas supplies, from 13 percent in 2008 to 0.7 percent in 2035.19
Natural gas is critical to the U.S. economy and security as a fuel source for residential home heating, industrial processing, and electric generation. Thus, more attention will continue to be focused on potential sources of natural gas supplies to meet such demand. As of 2011, the EIA states there is 862 Tcf of technically recoverable U.S. (domestic) natural gas resources waiting to be tapped.20
According to EIA's AEO2011, total U.S. natural gas production will grow, in the reference case, from 21.0 Tcf in 2009 to 26.3 Tcf in 2035. The percent of total U.S. production coming from shale gas production will increase from 16 percent in 2009 to 47 percent in 2035. The environmental impacts of shale gas production, along with changes in market conditions, may alter projections going forward.
16http://www.eia.doe.gov/dnav/ng/hist/n9140us2a.htm 17http://www.eia.doe.gov/forecasts/archive/aeo11/IF_all.cfm#propspectshale 18http://www.eia.doe.gov/oiaf/aeo/tablebrowser/#release=AEO2011&subject=0-AEO2011&table=2-AEO2011®ion=1-0&cases=ref2011-d020911a 19http://www.eia.gov/oiaf/aeo/tablebrowser/#release=AEO2011&subject=0-AEO2011&table=13-AEO2011®ion=0-0&cases=ref2011-d020911a 20http ://www.eia.gov/analysis/studies/worldshalegas/ 29
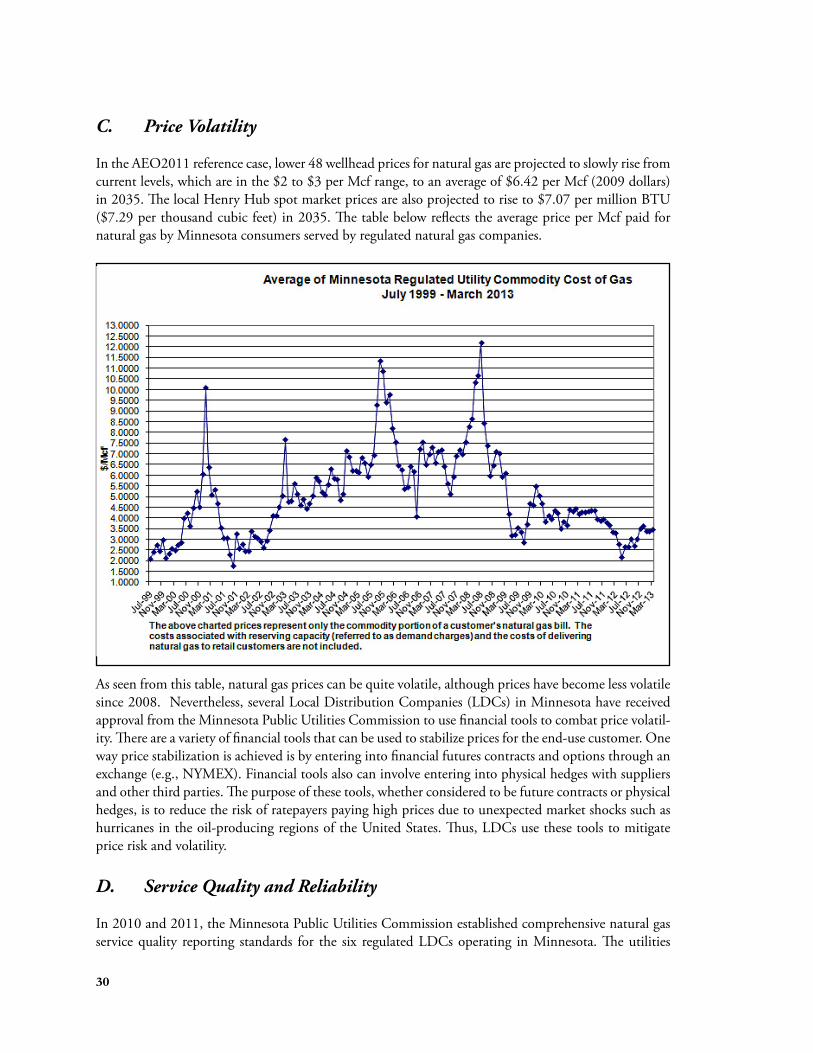
C. Price Volatility
In the AEO2011 reference case, lower 48 wellhead prices for natural gas are projected to slowly rise from current levels, which are in the $2 to $3 per Mcf range, to an average of $6.42 per Mcf (2009 dollars) in 2035. The local Henry Hub spot market prices are also projected to rise to $7.07 per million BTU ($7.29 per thousand cubic feet) in 2035. The table below reflects the average price per Mcf paid for natural gas by Minnesota consumers served by regulated natural gas companies.
As seen from this table, natural gas prices can be quite volatile, although prices have become less volatile since 2008. Nevertheless, several Local Distribution Companies (LDCs) in Minnesota have received approval from the Minnesota Public Utilities Commission to use financial tools to combat price volatility. There are a variety of financial tools that can be used to stabilize prices for the end-use customer. One way price stabilization is achieved is by entering into financial futures contracts and options through an exchange (e.g., NYMEX). Financial tools also can involve entering into physical hedges with suppliers and other third parties. The purpose of these tools, whether considered to be future contracts or physical hedges, is to reduce the risk of ratepayers paying high prices due to unexpected market shocks such as hurricanes in the oil-producing regions of the United States. Thus, LDCs use these tools to mitigate price risk and volatility.
D. Service Quality and Reliability
In 2010 and 2011, the Minnesota Public Utilities Commission established comprehensive natural gas service quality reporting standards for the six regulated LDCs operating in Minnesota. The utilities
30
file annual service quality reports detailing performance on such metrics as the number and type of customer complaints, involuntary service disconnections, gas line mislocates resulting in damage to the line, and gas service interruptions. This information will be invaluable over time to assess each utility’s ability to meet customer service expectations and continue to provide safe, reliable natural gas service in Minnesota.
E. Summary
The overall domestic demand for natural gas has continued to grow, as has the domestic supply, through the new methods of gas production. There is a need to develop infrastructure to further develop these new supplies, but Minnesota is well positioned in this regard as it has been the recipient of significant investment by Northern Natural Gas (NNG), the largest interstate pipeline in Minnesota, to improve and expand interstate pipeline capacity. Although increased shale gas production has resulted in lower prices, the natural gas market remains dynamic and potentially volatile. Unexpected changes in regulation of natural gas production, unconventional gas well production levels, or the export of domestically produced gas into the global market may push prices higher in a relatively short period of time. Finally, the safe and reliable delivery of natural gas in Minnesota is assured through close monitoring of our LDCs’ customer service performance.
TRANSPORTATION FUELS
Minnesotans consumed a total of 117.2 million barrels21 (4,922 million gallons) or the equivalent of 626 trillion BTUs22 of total petroleum products in 2009. Total petroleum products include asphalt and road oil, aviation fuel, distillate fuel, jet fuel (all types), kerosene, liquid petroleum gases, lubricants, motor gasoline, and residual fuel. Motor gasoline accounted for 61.2 million barrels of the 2009 total, a reduction of approximately 8.2 million gallons below 2008 consumption. Since Minnesota has no oil reserves, Minnesota imports all of its petroleum products in the form of crude oil or finished product, which is estimated at over $10 billion for 2009.23
A. Overview
In 2009, Minnesotans used about 75 percent of all petroleum products for air, land, and water transportation. These products include asphalt and road oil as well as actual fuels like diesel, jet fuel, and motor gasoline. Most agricultural use of petroleum falls under the transportation category. Commercial, electric utility, industrial, and institutional space heating and processing uses accounted for about 25 percent of petroleum products. Most current reported information from EIA for the year 2000 indicated that about 16 percent of Minnesota households use either fuel oil or propane for their heating source. This use constituted about 9 percent of the total petroleum products used.
Most petroleum products enter and leave Minnesota by pipeline. Some are transported by barge, rail, ship, or truck. All but a small portion of the United States' imported Canadian crude oil and liquid petroleum gases (LPG) pass through Minnesota on their way to other parts of the Midwest, Eastern Canada, and New England.
21 http://www.eia.doe.gov/emeu/states/sep sum/html/pdf/sum use tot.pdf 22http://www.eia.doe.gov/emeu/states/sep sum/html/pdf/sum btu tot.pdf 23http://www.eia.doe.gov/emeu/states/sep sum/html/pdf/sum ex tot.pdf 31
Refined petroleum products are available in Min-
The EIA’s Early Release Overview of the United States
Annual Energy Outlook 2012 (AEO 2012), states:
“Projected transportation energy demand grows at an
annual rate of 0.2 percent from 2010 through 2035 in
the Reference case.”
“Domestic crude oil production has increased over the
past few years, reversing a decline that began in 1986.
U.S. crude oil production increased from 5.1 million
barrels per day in 2007 to 5.5 million barrels per day
in 2010. Over the next 10 years, continued develop
ment of tight oil, in combination with the ongoing
development of offshore resources in the Gulf of
Mexico, pushes domestic crude oil production in the
Reference case to 6.7 million barrels per day in 2020, a
level not seen since 1994. Even with a projected decline
after 2020, U.S. crude oil production remains above
6.1 million barrels per day through 2035.”
“With modest economic growth, increased efficiency,
growing domestic production, and continued adoption
of nonpetroleum liquids, net petroleum imports make
up a smaller share of total liquids consumption.”
“U.S. dependence on imported petroleum liquids
declines in the AEO2012 Reference case, primarily as
a result of growth in domestic oil production by more
than 1 million barrels per day by 2020; an increase
in biofuels use to more than 1 million barrels per day
crude oil equivalent by 2024; and modest growth
in transportation sector demand through 2035. Net
petroleum imports as a share of total U.S. liquid
fuels consumed drop from 49 percent in 2010 to 36
percent in 2035 in AEO2012. Proposed fuel economy
standards covering vehicle model years 2017 through
2025 that are not included in the Reference case would
further reduce projected liquids use and the need for
liquids imports.”
nesota through area refineries or via pipelines. Electric utility and other industrial customers then use barge, rail or trucks to transport the finished products to their individual locations. Smaller volume customers, such as farms, homes, and gas stations, receive their petroleum products via truck delivery.
The price of petroleum products is largely comprised of the basic cost of crude oil, processing, transportation, and assessed taxes. World political and economic market forces primarily determine the cost of crude oil. Federal and state governments assess taxes on petroleum products.
Many factors influence the other aspects of the price of finished petroleum products. Some price changes are due to supply and demand imbalances. For example, supply shortages sometimes occur due to maintenance, damage on the pipelines or at refineries, or increased consumption in developing markets, such as India and China. Since each petroleum product needs to be stored individually, some supply shortages result from simple logistical problems associated with coordinating production and storage to meet current and future demand.
Higher than expected demand for a particular product can also create temporary shortages that lead to higher prices. Very cold weather increases the heating use of heating oil, natural gas, and propane products and very wet or very dry weather increases the agricultural use of petroleum products.
Activity in the commodities market can further influence price changes. Spikes or sudden drops in prices are sometimes the markets' response to perceptions of future supply and demand imbalances. The cost per barrel of crude oil reached a peak price around the $145 per barrel mark in July 2008 and declined to under $40 per barrel in December
2008. The price has varied up and down within this range during the time period 2008 to the end of 2011. These crude price fluctuations have translated into variable prices at the gas pump up to or above $4 per gallon during early summer 2008 and again by early summer 2012. Consumption is impacted by increased price.
32
B. Future
Residential, commercial and industrial uses of petroleum products for non-transportation purposes have been steady or declining in the past several years and the trend is expected to continue. The transportation sector, which consumes nearly three-quarters of all petroleum products, has shown a general trend of increasing levels of consumption. This trend appears to be affected by changes in fuel costs. When gas prices reached the $4 per gallon level, consumers appear to consider altering transportation behavior.
One factor that impacts the price of petroleum products is supply. Crude oil is necessary for the production of petroleum products. The world's annual supply of crude oil depends on the interplay of many complex factors including demand, weather, politics, technology, and economics. In 2008, the total world consumption of crude oil was estimated at approximately 85 million barrels of crude oil per day.24
Scientists estimate that ongoing natural processes create new crude oil at the rate of 7 million barrels per year. These numbers indicate an eventual depletion of the available crude oil, although it may be possible to find or manufacture new sources and substitutes for these products.
One possible new source of oil is from the tar sands in Alberta, Canada, which could be a reserve of as much as 170 billion barrels. Development of these tar sands began in the 1960s but production ramped up in 2009 as other supplies declined and prices increased. While this means that the United States may get more of its oil from Canada in future decades, it may also come with a larger environmental price. Extracting this oil requires more energy than conventional drilling, which means more greenhouse gases before the oil even reaches the pump.
As with natural gas and electricity, the available infrastructure such as ocean shipping and pipeline capacity also has a large impact on petroleum prices. Higher prices for petroleum, however, allow development of lower grades of crude that were previously too costly to produce. Four trends may impact the price of petroleum products. First, in the 1990s, crude oil and refined petroleum products, like natural gas, became publicly traded commodities on world mercantile exchanges. During times of actual or perceived supply disruptions or shortages, prices now fluctuate more erratically. Second, nearly every major international oil company and most independent marketers are forming E-commerce sites to trade commodities independently. Their effect on energy prices and supply will depend largely on which sites survive. Third, petroleum refiners significantly changed their operations in the 1990s. They reduced refining costs by moving toward just-in-time production. Storage is now more in the control of independent terminal and pipeline operators. Finally, international demand has increased due to the expansion of overseas markets, particularly in India and China.
The United States imported about 49% of its petroleum consumed in 2010, which includes crude oil and refined products. This is down from 58% in 2007, 60% in 2006, and 62% in 2002. About 49% of U.S. crude oil and petroleum product imports came from the Western Hemisphere (North, South, and Central America, and the Caribbean, including U.S. territories) during 2010. About 18% of our imports of crude oil and petroleum products come from the Persian Gulf countries (Bahrain, Iraq, Kuwait, Qatar, Saudi Arabia, and United Arab Emirates.) Our largest sources of net crude oil and petroleum product imports were Canada (25%) and Saudi Arabia (12%). Much of the crude oil that is fed into refineries in Minnesota is delivered by pipelines from Canada. However, since political pressures in all oil producing areas impact the market, the fact that Minnesota does not receive a large
24 EIA at: Total World Petroleum Consumption 33
percentage of its crude oil feedstock from areas such as Mexico (9%), Venezuela (10%), Nigeria (11%), and the Middle East (18%) does not mean that Minnesotans are insulated from price fluctuations due to political and economic unrest in those areas, as described at http://www.eia.gov/energy_in_brief/ foreign_oil_dependence.cfm.
C. Supply Reliability
Limitations on production and supply infrastructure will continue to be a challenge for the industry throughout the country.
1. Refinery Operating Practices
Inventories of petroleum products are often maintained on a "just-in-time" basis. That is, refineries are operated at or near the lower operational inventories for all products. This results in a market that is not as capable of adjusting to significant changes in demand. Some areas of the state are more adversely affected during these times of product shortfalls. Low inventories often cause price increases, as retailers are forced to try to curb demand in order to have sufficient product to get through these periods.
2. Regulations Regarding Commercial Drivers' Hours of Service
The Federal Motor Carriers Safety Administration has rules concerning the maximum number of hours that commercial drivers who deliver petroleum products may operate a vehicle. These rules require all drivers to account for the amount of time that they are actually waiting for product to be loaded in their vehicle towards their hours of service allotment.
During periods of high demand for all petroleum products, which includes gasoline, diesel, home heating oil and propane, drivers oftentimes need to drive longer distances and encounter long truck-filling wait times. These occurrences may cause drivers to approach their maximum hours of service without satisfying the demand for those fuels. Fuel suppliers may choose to have additional drivers on hand to satisfy these periods of peak demand, although employing additional drivers may lead to increases in delivered fuel prices. In times of extreme hardship, Minnesota's Governor has the authority to extend drivers' allowed hours of service.
3. Seasonal Demand Fluctuations
September is typically a time of reduced demand for petroleum products, because the peak summer driving season comes to an end. However, generally at this same time there is a demand for diesel fuel for the autumn harvest and transport of crops to market. Also this is the time of year when a spike in demand for fuel oil and propane occurs for the heating season’s “first fill” of heating fuel. Also petroleum refineries in the United States tend to choose September or later winter months when there is a lower than normal demand for products as the time to schedule routine maintenance for critical equipment, known as refinery turnaround. In the late autumn to mid winter in 2011-2012, Minnesota experienced a considerable shortage of diesel and heating fuel oil. Fortunately this period of time had a reduced demand for heating fuel because it was one of the mildest winters on record in the state of Minnesota and surrounding states.
34
Scarce petroleum inventory issues introduce increased price uncertainty and less supply resilience into the market. There is less flexibility in the supply chain to buffer the market from supply disruptions such as refinery fires or even routine maintenance. Where these events used to cause regional disruptions in supply and price, they now cause upward price pressures on all areas of the country, not just those affected by infrastructure changes. These factors, combined with the ongoing political unrest in many petroleum exporting countries, underscore the importance of diversifying transportation fuel supplies in order to decrease Minnesota's dependence on factors outside the state's control.
D. Alternative Fuels and Advanced Vehicle Technologies
1. Ethanol
Ethanol is an alternative fuel made from a variety of plant-based feedstocks collectively known as "biomass." Fuel ethanol contains the same chemical compound as beverage alcohol. It is produced by fermenting sugar from starch crops such as corn or found in plants like sugar cane. Ethanol can also be made from cellulosic materials, such as grass, wood, crop residues, or newspapers. Minnesota's fueling stations are required to sell E10, a blend of 10% ethanol with gasoline for use in gasoline powered engines. Ethanol is now available in Minnesota in mid- and high-blends ranging from E20 to E85. These blends are for use in fuel flex vehicles (FFVs). FFVs are manufactured by many major domestic vehicle manufacturers and are designed to operate on gasoline, E85 or a combination of the two fuels. Based on registration records, there were approximately 225,000 FFVs registered in Minnesota in 2011.
In 2005, legislation was enacted requiring all of Minnesota's gasoline to be blended with 20 percent ethanol under certain conditions. In 2007, a statute aimed at a petroleum replacement promotion goal (239.7911) required that at least 20 percent of the liquid fuel sold in the state be derived from renewable sources by December 31, 2015, and at least 25 percent of the liquid fuel sold in the state be derived from renewable sources by December 31, 2025.
Currently, this statute is in conflict with U.S. Environmental Protection Agency (EPA) Clean Air Act regulations regarding the use of mid-blends of ethanol in non FFVs. The E20 requirement is due to take effect in 2015 unless ethanol has already replaced 20 percent of the state's motor vehicle fuel use by 2010 or if EPA fails to approve a waiver of the federal Clean Air Act. The first condition is not likely to be met since E85 makes up only a small portion of the state’s fuel purchases. The second condition seems unlikely to be met as well.
However, the EPA recently granted two partial waivers that allow but do not require the introduction into commerce of gasoline that contains greater than 10 volume percent (vol%) ethanol and up to 15 vol% ethanol (E15) for use in model year (MY) 2001 and newer light-duty motor vehicles, subject to certain conditions. On October 13, 2010, EPA granted the first partial waiver for E15 for use in model year 2007 and newer light-duty motor vehicles (i.e., cars, light-duty trucks and medium-duty passenger vehicles). On January 21, 2011, EPA granted the second partial waiver for E15 for use in model year 2001-2006 light-duty motor vehicles.
E15 may be lawfully sold by a fuel or fuel additive manufacturer only after the manufacturer has registered E15 and met the conditions of the partial waivers. There are retail fueling stations in Minnesota interested in offering E15 for sale. Since 1998, approximately $13 million has been invested in pro
35
grams to make Minnesota an international leader in E85 retail infrastructure development.25
Due in large part to this investment, the number of E85 fueling stations has grown dramatically, and Minnesota leads the nation for the number of E85 retail stations in operation. In 1997, there were approximately seven E85 fueling stations in Minnesota. At the beginning of 2004, there were 285 E85 fueling stations in the United States with 104 located in Minnesota. In 2008 there were 320. As of June 2012, Minnesota continues to lead the nation with 353 E85 fueling stations.
Demand for mid-ethanol blends has grown substantially, and 73 Minnesota service stations offer various blends of ethanol, such as E50, E40, E30, and E20, for use in FFVs. In 2011 (the latest year with complete annual data), Minnesota sold 19.8 million gallons of E85 and 704,000 gallons of mid blends of ethanol from E20 to E50. The combined total of E85 and mid-blend sales is 20.5 million gallons and represents a decrease of approximately 2%, or 500,000 gallons from the 2008 total E85 sales of 21 million gallons.
In January 2012, E85 prices ranged from $2.32 per gallon to $3.49 per gallon, averaging $2.89 per gallon, which is $0.43 per gallon or 11 percent less than 87 octane (E10) gasoline. However, ethanol has lower energy content than gasoline and E85 vehicles average fuel economy is about 15 percent less, which varies depending on the model and driving habits.
On January 1, 2012, the federal ethanol tax credit expired for ethanol manufacturers. This expiration is expected to decrease the difference between the price of E85 and gasoline and may result in decreased wholesale and retail fuel sales. A May 2012 survey of Minnesota E85 retail stations returned 26 responses. The results suggested that 16 of the 26 retailers have observed minimal or no loss in E85 sales with no hardship (14) or only a temporary decline in sales with minimal hardship. Ten retailers responded that the loss of the tax credit has created a moderate (8) to extreme (2) hardship.
As of April 2012, Minnesota had 21 ethanol plants with a production capacity of 1.1 billion gallons.26
This represents an increase of 253 million gallons (or approximately 30 percent) in production capacity over the previous four year period.
2. Biodiesel
According to the Minnesota Department of Agriculture, as of April 2012, Minnesota had three production facilities.27 The three Minnesota plants and their production capacities are:
• REG Corp (formerly SoyMor), Albert Lea -- annual production capacity of 30 million gallons • The Minnesota Soybean Processors (MnSP) plant, Brewster -- annual production capacity of
30 million gallons • EverCat Fuels, Isanti, opened in 2009 – annual production capacity of 3 million gallons
Minnesota’s biodiesel mandate (MS§239.77) requires the blending of 5 percent biodiesel, or B5, into the state’s diesel supply. By law, the percent of biodiesel fuel will increase to 10 percent from April through October each year beginning May 1, 2012 and to 20 percent during the same months begin
25To date, approximately 20% of this total has been state-funded with the remainder contributed by station owners, Minnesota Corn Growers, U.S. Department of Energy, automakers, foundations and nonprofits. 26http://www.mda.state.mn.us/renewable/ethanol/capacities.htm
36 27http://www.mnsoybean.org/Biodiesel/MinnesotaBiodieselPlants.cfm
ning May 1, 2015. There are a few exceptions to the requirement, including #1 diesel from October – March, railroad locomotives, off-road taconite and copper mining equipment, and heating equipment motors located at nuclear power plants.
Before the increased mandate levels can be implemented, the statute requires that the commissioners of Commerce, Agriculture, and the Pollution Control Agency certify that there are federal standards for these higher blend concentrations, sufficient biodiesel production capacity in the state to meet the increased demand, adequate infrastructure for distribution of the product, and sufficient regulatory protocols to enforce the new mandate levels. As of November 2011, the commissioners determined that not all of those requirements had been met and implementation of the B10 mandate was delayed.
The Biodiesel Task Force was created by the legislature in March 2003 to help the state carry out its biodiesel blending mandate and ensure a smooth introduction of biodiesel into the marketplace. The Biodiesel Task Force is charged with advising the Minnesota Department of Agriculture on methods to increase the production and use of biodiesel in Minnesota. Since its creation, the Task Force has helped promote and educate possible biodiesel developers, marketers, consumers and manufacturers throughout the state.
3. Propane and Natural Gas
Propane and natural gas (compressed and liquefied) are options for fueling Minnesota vehicles that feature low tailpipe emissions. Recently, because of the decrease in price of natural gas, there has been growing interest in natural gas vehicles. Despite higher up-front costs for natural gas fleets, long-term operating costs are significantly reduced at today’s prices.
Minnesota Valley Transit Authority operates three natural gas buses and Schwan's Food Services operates nearly all of its vehicles on propane. CenterPoint Energy has a compressed natural gas (CNG) public fueling station in Minneapolis. McNeilus Cos., based in Dodge Center, Minnesota, the nation's largest supplier of garbage and cement trucks, has a small, private on-site fueling station in Minnesota. Fleets for two Minnesota companies, Andersen Windows and Dart, are using CNG from fueling sites in Wisconsin. Randy’s Sanitation in Delano also fuels with CNG. In the Twin Cities area, Dick's Sanitation of Lakeville, Waste Management's Blaine operation, and Ace Sanitation of Ramsey report acquiring CNG trucks and fueling infrastructure in order to transition fleets to CNG as well. (sources below)
Positive Connections in Chaska, Minnesota operates school buses that began using propane autogas in 2011. There is strong interest from Minnesota school bus companies and shuttle services in converting fleets to propane.
4. Electric Vehicles
Electric vehicles (EVs) are becoming more commonly available to consumers, with new models being introduced every year. Air quality benefits from zero tailpipe emissions and the option to use locally produced renewable energy for power are additional attributes of EVs.
To date there are nearly 50 known publicly accessible EV charging stations installed in Minnesota with others planned. Several of these stations are coupled with grid-connected solar electricity that offsets
37
The DNR purchased its first all-electric vehicle in 1982.
Now, 21 DNR facilities have all-electric vehicles. At some
facilities they’re even charged by power from the facility’s
photovoltaic installation. The DNR’s fleet includes 18
neighborhood electric vehicles.
e-ride electric vehicles are manufactured in Princeton,
MN. When the job needs a rugged all-terrain vehicle, the
DNR uses the e-ride, a sturdy emission-free vehicle that
the U.S. military has also adopted. The e-ride is as strong
as a half-ton pickup and extremely low-maintenance.
The DNR typically uses E-Z-Go electric vehicles from
Augusta, GA for park maintenance activities.
DNR’s first electric vehicle was a Cushman GC400, pur
chased in 1982. The Cushman GC400 has provided the
DNR with three decades of service.
e-ride also offers a neighborhood electric vehicle with a
range of up to 55 miles and maximum speed of 25 mph.
In addition to e-ride, Minnesota is home to a range of
other leading electric vehicle and equipment companies.
• Polaris Industries headquarters in Medina, MN and
owns Global Electric Motorcars which produces GEM
electric vehicles in Spirit Lake, IA. GEM battery-elec
tric vehicles are street legal in nearly all 50 states on
public roads posted at 35 mph (56 km/h) or less.
• Toro in Bloomington, MN, produces grounds
maintenance Utility Electric Vehicles which are sold
worldwide.
• DJProducts, Inc. in Little Falls, MN manufactures
battery powered “walk-behind” units that move
trailers, heavy carts and wheeled containers safely and
quickly.
Due to such expertise and production infrastructure,
Minnesota is in a competitive position to influence devel
opment of these battery powered vehicle and equipment
sectors. Supporting such manufacturers in their effort to
develop and deploy these systems can best position the
state to benefit from growth of the industry as a whole.
conventional grid energy used to charge an EV. Station owners can also choose to purchase wind-sourced electricity through their utility for charging electric vehicles. This option to use locally produced renewable solar or wind generated electricity for charging is unique to electric vehicles.
A map showing electric vehicle charging station (http://www.afdc.energy.gov/afdc/fuels/electricity_ locations.htm) locations across the country is maintained by the U.S. Department of Energy (USDOE). This national map offers comprehensive information by state, then city. There are three types of Levels for EV charging stations:
• Level 1- Common household circuit, rated to 120 volts AC . These chargers use the standard three-prong household connection, and are usually considered portable equipment. • Level 2- Permanently wired electric vehicle sup
ply equipment used especially for electric vehicle charging; rated at 240 volts AC. This level charges twice as fast as a Level 1 charger. • Level 3- A charger can be considered a fast charger
if it can charge an average electric vehicle battery pack in 30 minutes or less. This DC or direct-current high voltage charging should not be used more than once per day for current battery technology. A complete charge can be achieved in 30 minutes or less. Currently there is no national standard for this charging that can be accepted only by some of the current EVs.
Early charging data through the USDOE EV Project has indicated a residential draw time to charge an electric vehicle at about 2 hours per day. Typically these vehicles are plugged in by their owners in the evening. This allows for overnight charging to be potentially rotated by 2-hour time periods throughout the night to minimize demand on the grid. As use of EVs increases, a greater understanding of how to optimize use of electricity to power them is expected to become apparent.
38
1. Hydraulic Hybrid
The interest in hybrid technology as a way to achieve fuel economy is not limited to gasoline-electric hybrids. A potentially less expensive technology, the hydraulic hybrid, is also making its debut. In 2007, the U.S. Environmental Protection Agency demonstrated a new hydraulic hybrid technology in a UPS delivery vehicle. In laboratory tests, this technology achieved a 60-70 percent improvement in fuel economy and 40 percent reduction in emissions over a conventional vehicle. The University of Minnesota's Engineering Research Center for Compact and Efficient Fluid Power has also developed a promising hydraulic technology, which it hopes to scale up and demonstrate in Minnesota if funding is available. Larger trucks and buses are the target market for hydraulic hybrids until such time when hydraulic components can be sized appropriately for passenger vehicles.
2. Governor’s Executive Order 11-14 - State fleet operations
A Governor’s Executive Order 11-14 has been issued mandating a 50% reduction in state fleet petroleum use by 2015 from 2005 usage levels through increased use of efficiency, biofuels and telecommuting.
ENERGY CONSERVATION
To provide a long-term adequate supply of secure, high-quality energy, it is important to need as little of it as possible. Minnesota has, for decades, supported strong conservation programs—through its utility conservation programs as well as strong building energy codes. These conservation programs have helped Minnesotans by reducing the number of power plants and pipelines that have been needed, as well as the need for fewer new transmission lines. The reduction in generation has also helped with keeping greenhouse gas emissions lower, too.
A. Conservation Improvement Program
The Minnesota Conservation Improvement Program (CIP), first enacted by the Minnesota Legislature in 1982, requires Minnesota natural gas and electric utilities to invest a portion of their revenues in energy efficiency and conservation programs. These programs are intended to incent consumers and businesses to save energy by purchasing energy efficient equipment and/or changing behaviors. Typical conservation improvement programs include furnace rebates, lighting rebates, and building design assistance. Utility CIPs are funded through surcharges added to the electric and natural gas rates charged to utility customers. The Department provides regulatory oversight over the use of CIP funds.
There are three primary benefits of conservation. First, conservation helps the utilities and their customers avoid the operating costs of providing more electricity and natural gas, such as buying fuel and operating and maintaining power plants. Second, conservation helps the utilities and their customers avoid or delay the capital costs of adding new system capacity such as new power plants, transmission lines, natural gas pipelines, and distribution systems. Third, conservation reduces carbon dioxide and other emissions released by burning fossil fuels.
Conservation is a critical part of Minnesota's efforts to meet its residents' energy needs and reduce greenhouse gases. In 2010, Minnesota's electric utilities devoted approximately $224 million to CIP activities and achieved total annual energy savings of 900,000 MWh of electricity and 2.6 million MCF
39
of natural gas, resulting in approximately 978,000 tons of avoided carbon dioxide emissions. In 2010, CIP projects have reduced electricity consumption in Minnesota by approximately 1.3 percent out of an estimated growth rate of 2.3 percent without CIP.28 In 2007, the Minnesota Legislature passed The Next Generation Energy Act (NGEA) of 2007 (Laws of 2007, Chapter 136), which strengthened Minnesota's commitment to energy savings.
Specifically, NGEA established an annual savings goal of 1.5 percent of retail sales for electric and natural gas utilities. Previously the law required that each natural gas and electric utility spend between 0.5 percent and 2.0 percent of its gross operating revenues annually on their CIPs. The revised statute added an energy savings goal for each utility equal to 1.5 percent of its average annual retail energy sales in Minnesota, excluding sales to certain facilities that have been granted exemption from CIP charges. As a result of this change, utilities have become significantly more aggressive in their overall conservation efforts. The CIP savings goal is related to the broader state goal of reducing per capita fossil fuel use by 15 percent by 2015, and is ultimately an integral part of any effort to reduce statewide CO2 emissions.
To address the 2007 NGEA requirements, the Department is proceeding in several general areas:
1. Deemed Savings Database Development
To better understand what efficiency measures produce the most cost-effective energy savings, and how to calculate those energy savings in a scientifically accurate manner, the Department hired an experienced engineering firm to identify, review and assess the assumptions used to determine energy savings for many standard efficiency measures. The contractor identified a range of energy savings estimates for each typical conservation improvement measure, many of which are implemented by utilities and energy service companies around the nation. While there is a vast body of energy saving estimates associated with these measures, the estimated energy savings for each measure can vary broadly, depending on climate, facility type, and end use of a measure. This, in turn, can call into question the validity of the engineering calculations used to determine energy savings and lead to an array of different energy savings calculations between utilities.
The Deemed Savings Database project assessed the methodologies used in determining the energy savings for a number of measures and determined which assumptions and calculations are most reliable for Minnesota utilities to use in their conservation improvement projects. The utilities are currently using the Deemed Savings Database as an integral part of their conservation improvement programs. In addition, the Department convenes ongoing stakeholder workgroups to revise the calculations as necessary, e.g., to reflect a change in baseline standards and to add new measures as they become available.
2. Measurement and Verification
In 2008, the Department established Measurement &Verification (M&V) protocols (version1.0) for all utilities, requiring that utility projects with first-year savings of 1,000,000 kWh of electricity or 20,000 MCF of natural gas undergo specific M&V activities to ensure that the savings are being realized. M&V protocols are widely used by the utilities for defining an acceptable methodology to evaluate energy savings, establish the level of financial incentive, and ensure accuracy of measured savings for large energy efficiency projects. Utilities claim measured savings in their yearly reporting as required by Minnesota CIP statute. The Department maintains a 21-page document entitled “Measurement and Verification
28The 2005 Legislative Auditors Report on the Energy Conservation Improvement Program may be viewed at: http://www.auditor.leg.state. 40 mn.us/Ped/2005/pe0504.htm.
Protocols for Large Custom CIP Projects - Version 1.0 - April 2008.”
3. Research and Development
Since 2007, the Department has assessed all utilities $3.6 million annually for the Conservation Applied Research and Development (CARD) Program. The R&D grant program’s goal is to find new technologies and strategies that utilities can implement that will maximize energy savings by improving the effectiveness of their conservation programs. A Request for Proposal has been held every year since 2010, resulting in several dozen projects. Several smaller projects were also funded by CARD funds based upon specific needs identified by the Department. Reports for completed projects are typically available on the Commerce website, where they are accessible to stakeholders and other interested parties.
4. Energy Savings Platform (ESP)
In 2010, the Department awarded a Conservation Applied Research and Development CARD grant to Energy Platforms, a Minnesota-based company, to create a standards-based information technology platform to enable Minnesota utilities to design, implement, administer and report on their conservation improvement programs. The establishment of this system has led to increased CIP reporting compliance among Minnesota utilities and has increased the accuracy of the energy savings and expenditures reported. This tool, called Energy Savings Platform (ESP), has allowed for greater analysis of the reported data to ensure that the Department is making sound policy decisions on timely, accurate data. ESP includes tools to validate and cleanse the data to help eliminate errors and gives stakeholders the ability to see program results for the entire state—by utility, by fuel type and by program category.
5. 1.5% Energy Efficiency Solutions Project
In 2010, the Department hired the Minnesota Environmental Initiative to facilitate a series of meetings and technical work groups surrounding elements of the legislation that allowed utilities to count energy savings. Those areas included code compliance, electric utility infrastructure projects, and behavioral change programs. The project also included discussions on low-income programs. Progress was made in many subject areas, with guidance released on a variety of issues. How to count the energy savings that come from a utility’s support of code compliance or evaluating the energy savings impacts of electric utility infrastructure projects is ongoing. The Department anticipates providing further guidance for utilities as more issues are clarified.
6. Summary
In summary, the Department strives to ensure that the electricity and natural gas savings reported through CIP are accurate and that programs are operated cost-effectively29 through the CIP planning and review process. Minnesota's conservation and efficiency programs have been widely heralded in their successes and achievements. The American Council for an Energy Efficient Economy, a highly respected research and advocacy organization, has ranked Minnesota in the top ten states in the nation since they began issuing the annual State Energy Efficiency Scorecard.30 With the 2010 changes to the
29Cost-effectiveness in Minnesota CIPs are defined according to four benefit-cost tests: Societal, Ratepayer, Participant, and Utility. More information on these tests is provided in the Legislative Auditor’s Report noted above. The DER focuses on the Societal test as a measure of program cost-effectiveness consistent with its mission as a public agency. 30See “The 2008 State Energy Efficiency Scorecard” (Washington, DC: American Council for an Energy-Efficient Economy, December 2002), page 2. 41
CIP statutes discussed above, utilities and the Department are challenged to increase the energy and carbon dioxide savings from CIP even further, while still maintaining cost-effective programs.
B. Building Guidelines, Benchmarks and Energy Codes
1. SUSTAINABLE BUILDING 2030
In 2000, the Minnesota Legislature required the Departments of Administration and Commerce to develop sustainable building design guidelines mandatory for all new buildings receiving funding from the bond proceeds fund after January 1, 2004. In 2008, the guidelines expanded to become the Sustainable Building 2030 program—guidelines with cost-effective, energy-efficiency performance standards that can significantly reduce carbon dioxide emissions by lowering energy use in new and substantially reconstructed buildings. Sustainable Building 2030 (SB2030) is administered by the Center for Sustainable Building Research at the University of Minnesota with annual funding coming from Commerce, through a utility assessment. All new and substantially renovated buildings funded in whole or part by Minnesota bond monies must comply with the guidelines. While the Sustainable Building 2030 standards are voluntary for all other buildings, they have served as a model for reducing both energy and carbon. It’s a model that can be cost-effective and beneficial for both the building owners and the citizens throughout Minnesota. The 40 buildings designed to the SB 2030 Energy Standard so far are predicted to save approximately 250 million kBtus/year–a savings of $3.25 million per year. When new projects are added each year and standards rise in 2015, recurring annual savings to the State and other building owners will grow significantly.
2. B3 -- ENERGY BENCHMARKING FOR EXISTING BUILDINGS
The same legislation that created the initial sustainable building guidelines also required the departments of Administration and Commerce to benchmark all public buildings by 2004. Eight years later, Minnesota has a vibrant benchmarking tool – B3 Benchmarking – that has benchmarked almost 6500 public buildings in the state. Benchmarking is a building energy management system for public buildings in Minnesota including state, local government, and public school buildings. B3 Benchmarking provides public entities with a means to help manage individual buildings, improve their building portfolio efficiently, and monitor energy improvements.
Measures for cost-effective energy savings are most likely to be found in buildings with poor energy performance. The relative energy performance of most buildings can readily be determined by energy benchmarking. Energy benchmarking is also valuable to:
• Quantify the success of a maintenance or operation change to improve energy performance; • Track effectiveness of capital improvements or a performance contract intended to reduce en
ergy; and • Be alerted to significant variance from a performance track record which could be a sign of an
otherwise unrecognized operational problem.
The ENERGY STAR Portfolio Manager (www.energystar.gov/istar/pmpam/) is another popular energy benchmarking tool used by both private and public facility managers. The Portfolio Manager statistics for Minnesota as of mid-2011 are 4,723 buildings benchmarked representing more than 564 million square feet. 42
Governor Dayton signed Executive Order 11-12 in April 2011 entitled “Providing for Job Creation through Energy Efficiency and Renewable Energy Programs for Minnesota’s Public Buildings.” EO 11-12 established the Office of Guaranteed Energy Savings Program (GESP) within the Department. Technical, contractual and financial assistance is provided to state agencies, local government units, school districts, and institutions of higher learning that elect to implement energy efficiency and renewable energy improvements through the Guaranteed Energy Savings Master Contract program.
GESP utilizes an Energy Performance Contract (ESPC), which is a performance-based procurement and financing mechanism that leverages energy and operational savings achieved through the installation of energy efficient and renewable energy equipment and implementation of operational best practices, to finance the cost of the building retrofit and renewal project, with no net cost increase to the public entity. To date several state agencies, colleges and cities are working with department GESP staff.
3. Building Energy Codes
The American Recovery and Reinvestment Act of 2009 (ARRA) established minimum energy codes for all states to qualify to receive USDOE State Energy Program formula grant funding. In a March 23, 2009 letter to the Secretary of Energy, the Governor certified that Minnesota would satisfy all of the ARRA requirements:
• Implement a residential building energy code that meets or exceeds the 2009 edition of the Internal Energy Conservation Code (IECC);
• Implement a commercial building energy code throughout the state that meets or exceeds the ASHRAE Standard 90.1–2007; and
• Create a plan to achieve 90 percent compliance with the above energy codes within eight years.
Minnesota’s energy code is already well underway to surpassing those minimum energy standards. The Department has been working with the Department of Labor and Industry toward adoption of the 2012 IECC and ASHRAE 90.1-2010. These new standards are expected to be part of the state code sometime in 2013. Three studies are already underway to determine energy code compliance rates.
C. Combined Heat and Power Generation
Combined heat and power (CHP) systems, also known as cogeneration, generate electricity and useful thermal energy in a single, integrated system. CHP is not a technology, but an approach to applying technologies. Heat that is normally wasted in conventional power generation is recovered as useful energy, which avoids the losses that would otherwise be incurred from separate generation of heat and power. While the conventional method of producing usable heat and power separately has a typical combined efficiency of 45 percent, CHP systems can operate at levels as high as 80 percent.
Technically, CHP is a highly viable and reliable option that can help lower peak demand and reduce transmission congestion. During the last two years, the Department organized two educational workshops on CHP technology in collaboration with Minnesota utilities, International District Energy Association, and USDOE’s Midwest Clean Energy Center. The workshops provided technical and economic justification for CHP technology for district energy, hospital and healthcare, colleges and universities, and agricultural (dairy farm) and food processing industries. Significant potential exists in Minnesota
43
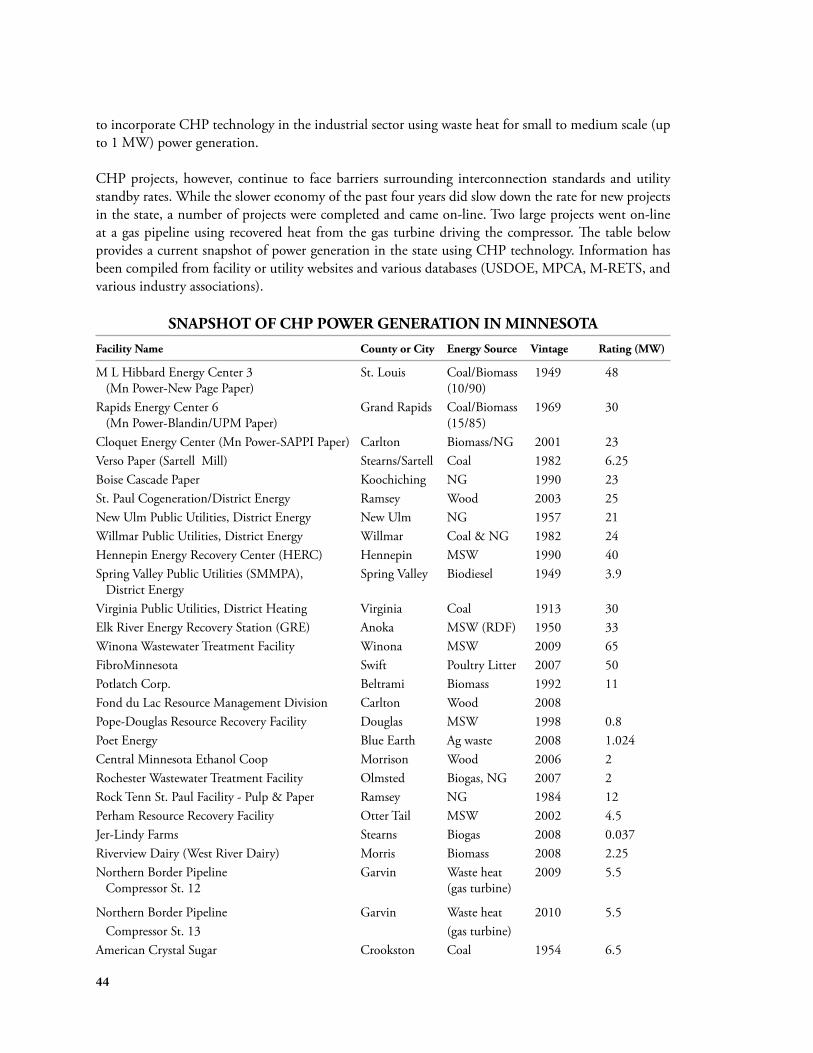
to incorporate CHP technology in the industrial sector using waste heat for small to medium scale (up to 1 MW) power generation.
CHP projects, however, continue to face barriers surrounding interconnection standards and utility standby rates. While the slower economy of the past four years did slow down the rate for new projects in the state, a number of projects were completed and came on-line. Two large projects went on-line at a gas pipeline using recovered heat from the gas turbine driving the compressor. The table below provides a current snapshot of power generation in the state using CHP technology. Information has been compiled from facility or utility websites and various databases (USDOE, MPCA, M-RETS, and various industry associations).
SNAPSHOT OF CHP POWER GENERATION IN MINNESOTA Facility Name County or City Energy Source Vintage Rating (MW)
M L Hibbard Energy Center 3 St. Louis Coal/Biomass 1949 48 (Mn Power-New Page Paper) (10/90) Rapids Energy Center 6 Grand Rapids Coal/Biomass 1969 30 (Mn Power-Blandin/UPM Paper) (15/85) Cloquet Energy Center (Mn Power-SAPPI Paper) Carlton Biomass/NG 2001 23 Verso Paper (Sartell Mill) Stearns/Sartell Coal 1982 6.25 Boise Cascade Paper Koochiching NG 1990 23 St. Paul Cogeneration/District Energy Ramsey Wood 2003 25 New Ulm Public Utilities, District Energy New Ulm NG 1957 21 Willmar Public Utilities, District Energy Willmar Coal & NG 1982 24 Hennepin Energy Recovery Center (HERC) Hennepin MSW 1990 40 Spring Valley Public Utilities (SMMPA), Spring Valley Biodiesel 1949 3.9 District Energy Virginia Public Utilities, District Heating Virginia Coal 1913 30 Elk River Energy Recovery Station (GRE) Anoka MSW (RDF) 1950 33 Winona Wastewater Treatment Facility Winona MSW 2009 65 FibroMinnesota Swift Poultry Litter 2007 50 Potlatch Corp. Beltrami Biomass 1992 11 Fond du Lac Resource Management Division Carlton Wood 2008 Pope-Douglas Resource Recovery Facility Douglas MSW 1998 0.8 Poet Energy Blue Earth Ag waste 2008 1.024 Central Minnesota Ethanol Coop Morrison Wood 2006 2 Rochester Wastewater Treatment Facility Olmsted Biogas, NG 2007 2 Rock Tenn St. Paul Facility - Pulp & Paper Ramsey NG 1984 12 Perham Resource Recovery Facility Otter Tail MSW 2002 4.5 Jer-Lindy Farms Stearns Biogas 2008 0.037 Riverview Dairy (West River Dairy) Morris Biomass 2008 2.25 Northern Border Pipeline Garvin Waste heat 2009 5.5 Compressor St. 12 (gas turbine)
Northern Border Pipeline Garvin Waste heat 2010 5.5 Compressor St. 13 (gas turbine) American Crystal Sugar Crookston Coal 1954 6.5
44
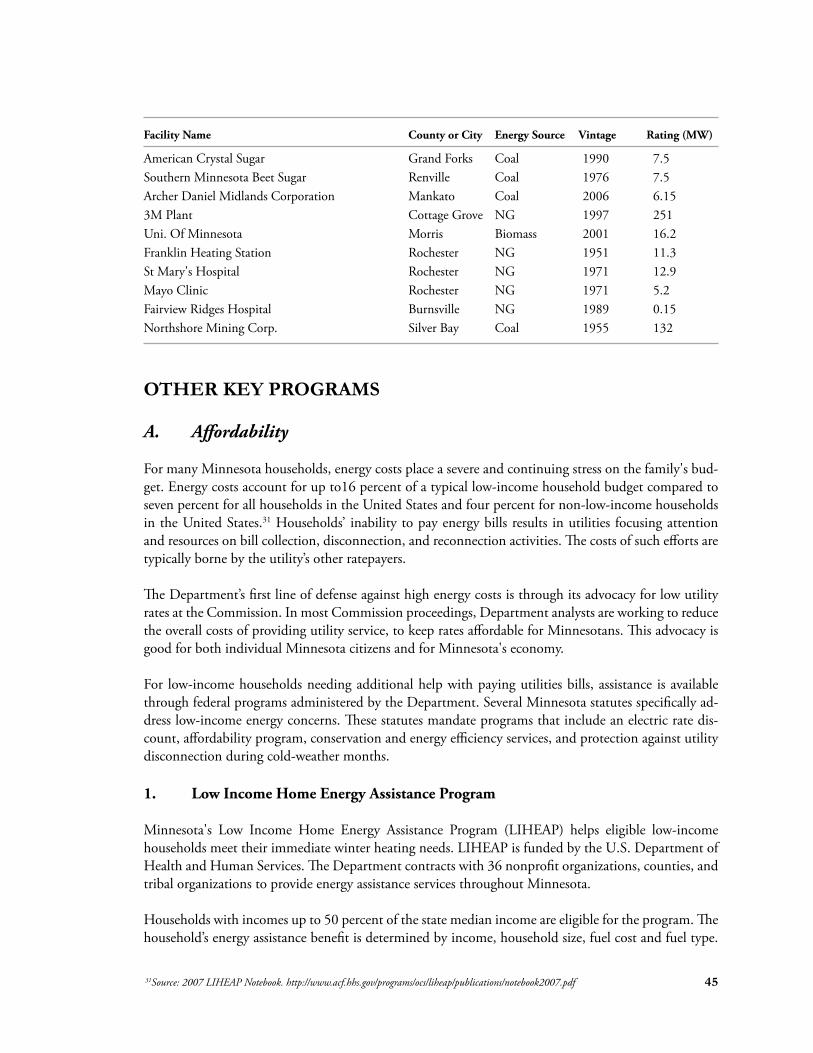
Facility Name County or City Energy Source Vintage Rating (MW)
American Crystal Sugar Grand Forks Coal 1990 7.5 Southern Minnesota Beet Sugar Renville Coal 1976 7.5 Archer Daniel Midlands Corporation Mankato Coal 2006 6.15 3M Plant Cottage Grove NG 1997 251 Uni. Of Minnesota Morris Biomass 2001 16.2 Franklin Heating Station Rochester NG 1951 11.3 St Mary's Hospital Rochester NG 1971 12.9 Mayo Clinic Rochester NG 1971 5.2 Fairview Ridges Hospital Burnsville NG 1989 0.15 Northshore Mining Corp. Silver Bay Coal 1955 132
OTHER KEY PROGRAMS
A. Affordability
For many Minnesota households, energy costs place a severe and continuing stress on the family's budget. Energy costs account for up to16 percent of a typical low-income household budget compared to seven percent for all households in the United States and four percent for non-low-income households in the United States.31 Households’ inability to pay energy bills results in utilities focusing attention and resources on bill collection, disconnection, and reconnection activities. The costs of such efforts are typically borne by the utility’s other ratepayers.
The Department’s first line of defense against high energy costs is through its advocacy for low utility rates at the Commission. In most Commission proceedings, Department analysts are working to reduce the overall costs of providing utility service, to keep rates affordable for Minnesotans. This advocacy is good for both individual Minnesota citizens and for Minnesota's economy.
For low-income households needing additional help with paying utilities bills, assistance is available through federal programs administered by the Department. Several Minnesota statutes specifically address low-income energy concerns. These statutes mandate programs that include an electric rate discount, affordability program, conservation and energy efficiency services, and protection against utility disconnection during cold-weather months.
1. Low Income Home Energy Assistance Program
Minnesota's Low Income Home Energy Assistance Program (LIHEAP) helps eligible low-income households meet their immediate winter heating needs. LIHEAP is funded by the U.S. Department of Health and Human Services. The Department contracts with 36 nonprofit organizations, counties, and tribal organizations to provide energy assistance services throughout Minnesota.
Households with incomes up to 50 percent of the state median income are eligible for the program. The household’s energy assistance benefit is determined by income, household size, fuel cost and fuel type.
31Source: 2007 LIHEAP Notebook. http://www.acf.hhs.gov/programs/ocs/liheap/publications/notebook2007.pdf 45
Households with the lowest incomes and highest bills receive the largest grants. Assistance provided to households is usually in the form of a payment to their energy vendor. The program assists both renters and homeowners.
LIHEAP remains dependent on the federal appropriations process for its funding, and the amount granted to the program varies from year to year. Although the number of eligible households has risen dramatically, the federal fuel assistance funds have not kept pace.
During the past 32 years, the number of Minnesota households receiving LIHEAP assistance ranged from a high of 172,065 in FFY 2011 to a low of 81,486 in FY1998. In those 32 years, the average energy assistance benefit has ranged from a high of $634 in FFY 2010 to a low of $286 in FFY 1999. The FFY 2011 average benefit was $503. Variations in the average benefit amount result primarily from inconsistencies in the amount of funding received by the program and the estimated number of applicant households.
Additional money is available to households in jeopardy of losing their heat due to emergency situations including:
• Faulty heating equipment that must be fixed or replaced; • Disconnection from utility service; and • Pending insufficient fuel or utility service disconnection.
Assistance with emergency situations is available 24 hours a day, seven days a week, during the heating season. The local service providers also provide advocacy and referral services throughout the program year.
2. Reach Out for Warmth
Households with incomes too high to be eligible for the LIHEAP program but under 50 percent of the state median income are eligible for help through the Reach Out for Warmth (ROFW) program. This program was established in 1992 by the Minnesota State Legislature and is delivered by the same energy assistance providers delivering LIHEAP services. ROFW is community-based and supported by individuals, businesses, churches, civic groups, school children, energy vendors, and private foundations. All funds raised locally stay in the area to help local residents and are matched 2 to 1 with federal LIHEAP dollars.
3. Minnesota Weatherization Assistance Program (WAP)
The Department administers the Weatherization Assistance Program (WAP) funds for income eligible households in Minnesota. The goal of the program is to provide cost-effective energy conservation measures and education to low-income seniors and families faced with high energy costs. Typically, less than one percent of the state’s 400,000 EAP/WAP-eligible households receive weatherization services annually due to funding limitations. WAP contracts with 31 local service providers, including six tribal governments.
USDOE provides the majority of the program resources. Services include an energy audit, energy conservation measures, general repairs to mechanical systems, and measures to protect the health and safety
46
of occupants due to the weatherization services. Additional funding is provided through LIHEAP resources and local partnerships with gas and electric utilities.
The USDOE-approved Weatherization Assistant (WA) software determines a savings-to-investment ratio (SIR) for each of the conservation measures implemented in a home. National studies indicate that cost-effective weatherization, energy education, and replacing old furnaces with high-efficiency units by WAP provide energy savings from 30% to 45% in each low-income home weatherized.
One of the most significant funding increases in the history of the Weatherization Assistance Program came from the 2009 American Recovery and Reinvestment Act (ARRA). A total of $138,092,080 was allocated to the Minnesota Weatherization Assistance Program. The three-year ARRA grant was scheduled to end on March 31, 2012 but was extended to December 31, 2012. Minnesota was able to weatherize over 19,500 homes using ARRA funds; in a typical year, only 3,000-4,000 homes receive service.
The regular USDOE weatherization grant is an annual contract based on an allocation awarded by Congress. For the fiscal year ending in June 2012, the amount received was $7,739,554. The next year, in part because many states still had ARRA funds, Congress only allocated $65 million. Minnesota was among the 25 states receiving no funds for the program year 2012-2013. Additional LIHEAP funds were made available to ensure the state continued a weatherization program.
In 2010, the Department helped fund a study conducted by the University of Minnesota Extension Service. The study found that for every direct job funded by WAP in Minnesota, an additional three-quarters of one job was created in the private sector in the state. The study also found that for each dollar spent on weatherization, an additional $1.67 was generated to boost the local economy.
The Minnesota WAP is guided by USDOE rules and regulations. Department field staff are required to monitor five percent of all dwellings weatherized. During the ARRA grant time period, 10 percent were monitored. Both fiscal and on-site field monitoring visits examine internal controls, local expenditures, procurement and actual work completions. On-site inspections of completed jobs are assessed for compliance with USDOE rules, regulations, and the Minnesota Policy Manual. Detailed analysis of Weatherization Assistant (WA) data from monitoring reports and electronic client files submitted to the state by the service providers were completed on over 350,000 separate measures during the past four-year period.
The Minnesota WAP provided technical support and training for staff members of service providers and other weatherization contractors. Training included topics such as mechanical training, WA software, insulation installation, air sealing, ventilation, client education, and auditing.
B. Clean Energy Resource Teams (CERTs)
Clean Energy Resource Teams (CERTs) is an innovative partnership between the Minnesota Department of Commerce, University of Minnesota Extension and Regional Sustainable Development Partnerships, The Minnesota Project, Eureka Recycling, and Southwest Regional Development Commission. The program connects citizens with the resources they need to identify and implement community-scale renewable energy and energy efficiency projects (see: www.cleanenergyresourceteams.org).
47
Established in 2003, CERTs was initially funded by a grant from the Minnesota Legislative-Citizen Commission on Minnesota Resources (LCCMR). In FY 2008–FY2011, funding came from the Renewable Energy Development Fund (see Laws of Minnesota 2007 Chapter 57, Sec. 3, Subd 6(2), and Subd. 25). Additional support has come from several foundations including Bush, Carolyn and McKnight. At present, CERTs’ core funding comes from the CIP R&D fund.
There are seven Minnesota CERT regions; six across greater Minnesota and one in the metro area. Teams are comprised of small business owners, farmers, utility representatives, members of environmental groups, government staff, elected leaders, and academics.
CERTs provide technical and grant support to communities throughout the state by offering seed grants to implement clean energy projects. Additionally, CERTs implements direct energy savings projects with its CERTified Campaigns. CERTs offer a robust communication pathway that enables Minnesota residents to identify clean energy opportunities in their areas through a wide variety of media outlets. Finally, CERTs is instrumental in providing networking support to Minnesota programs that encourage people to participate in clean energy projects.
Seed Grants - CERTs has offered community energy project seed grants twice since the last Quad Report. CERTs provided seed grant funding in 2010 (55 projects) and in 2012 (27 projects). Some of the seed grant projects CERTs supported included:
1. Central: 1. Park Rapids Armory: energy efficiency feasibility study; 2. Northland Arboretum (Brainerd): induction lighting demonstration; 3. Rural Renewable Energy Alliance: local government solar assessments; and 4. St. Cloud Joint Planning District: Sustainability Framework Plan
2. Metro: 1. Chisago Lakes Middle School: Solar photovoltaic installation; 2. Mahtomedi Area Green Initiative: Zephyr Wind Project; 3. Bakken Museum: renewable energy exhibits feasibility study; and 4. Shakopee Environmental Learning Center: Installation of solar and wind
3. Northeast: 1. Ely: Analysis of biomass generation and combined heat and power; 2. Adventure Inn in Ely: Green building design for construction; 3. Grand Marais Recreational Park: Solar hot water panel installations; and 4. Mountain Iron: 2010 Iron Range Earth Fest
4. Northwest: 1. Clear Waters Life Center in Gonvick: Energy efficiency improvements; 2. Bemidji State Univ. and U of MN Crookston: Energy Plan; 3. East Grand Forks: Ice arena energy study; and
4. Warren: City shop energy efficiency improvements
48
5. Southeast : 1. ARTech School in Northfield: Construction of a greenhouse; 2. Three Rivers CAP: Energy efficient rehabilitation of foreclosed homes; 3. Perpetual Harvest: Installation of solar thermal on a dairy farm; 4. Habitat for Humanity: Homeowner education for green homes; and 5. Region 9 Development Commission: Small-wind bulk buy program
6. Southwest: 1. Youth Energy Summit/Springfield Schools: Green roof assessment and education; 2. Western CAP: energy audits for non-eligible low-income homes; 3. AURI and RDC #9: Renewable energy template planning tool; and 4. Minnesota Renewable Energy Society: Renewable Energy Guide for Schools
7. West Central: 1. Damstrom Farm, Alexandria: Installation of a 3MW community wind project; 2. Prairie Woods Environmental Learning Center: Solar hot water panels installation; 3. Greater Milan Initiative: Community energy efficiency education workshops; 4. Little Theater in New London: Solar air panels installation Youth Energy Summit; and 5. UMN -Morris: Solar thermal installation for Regional Fitness Center Pool
CERTified Campaigns - In 2010, CERTified Campaigns was launched to provide Minnesotans with actionable ways to implement clean energy projects. The campaigns target broad scale adoption of under-deployed and cost-effective energy technologies for residents, businesses, and institutions. The campaigns have saved or displaced over 20 billion BTUs since 2009. These campaigns covered Vending Miser bulk buys, solar thermal rebates, programmable thermostat rebates, pre-rinse spray valves and faucet aerators bulk buys, and distribution of a lighting options guide.
Networking & Communication - CERTs holds regularly scheduled forums, workshops, and conferences that provide opportunities for small business owners, farmers, utility representatives, members of environmental groups, government staff, elected leaders, and academics to meet and share energy efficiency and clean energy experiences from across Minnesota.
C. Energy Information Center
The objective of the Energy Information Center is to develop an energy literate citizenry by promoting energy efficiency and renewable energy technologies through the development and dissemination of unbiased, accurate energy-related information. A core function of the State Energy Office, the Energy Information Center provides energy data collection, analyses, and tools for the dissemination of information and education by the entire MN State Energy Office. Highlights of the last four years include:
• Informed the public of the range of stimulus-funded rebate, grant and loan programs to help fund energy-saving projects
• Publicized programs such as the Weatherization Assistance Program, which weatherized the homes of nearly 20,000 low-income Minnesotans and created a sizable uptick in jobs.
• Redesigned and enhanced content of the Department website (www.energy.mn.gov) • Exhibited at the Minnesota State Fair Eco Experience. At the 2012 State Fair, DER staff coor
49
dinated the Energy Solutions Home, a 7,000-square-foot exhibit created in cooperation with many partners. A dozen displays offered energy efficiency information to thousands of visitors on everything from energy audits and efficient lighting options to insulation and ice dams.
• Created two excellent consumer guides—the Home Envelope and Appliances, Lighting, Electronics—that are downloadable from the website and available in hard copy. More than 20,000 copies of these energy-saving publications have been distributed in the past two years.
• Continued the long tradition of responding to energy-related questions via email (energy.info@ state.mn.us) and a designated phone line (800-657-3710).
D. Energy Assurance
The Department is required to have an energy emergency plan to receive USDOE funds for the State Energy Program and also received an American Recovery and Reinvestment Act (ARRA) funded grant for Energy Assurance Planning. The planning initiative focused on building energy assurance capability to allow the state to better coordinate and communicate statewide on energy security, reliability, and emergency response issues.
The objectives of this initiative are to:
1. Strengthen and expand state and local government energy assurance planning and resiliency efforts by incorporating response actions for new energy portfolios and smart grid applications;
2. Create jobs; and 3. Build in-house state and local government energy assurance expertise.
The Energy Assurance Planning process is underway and is being coordinated with the Minnesota Department of Public Safety-Division of Homeland Security and Emergency Management, and will be incorporated into the State of Minnesota Emergency Operations Plan.
E. American Recovery and Reinvestment Act (ARRA)
On February 17, 2009, President Obama signed into law the American Recovery and Reinvestment Act (ARRA). In May 2009, the Minnesota Legislature passed and the governor signed SF 657 (codified as Laws of Minnesota 2009, Chapter 138), appropriating energy-related ARRA formula grants to the Department of Commerce and allocating those funds to various programs.
The majority of ARRA funds, $131.9 million, were allocated to the state's Weatherization Assistance Program, which uses energy conservation techniques to reduce the use of energy in low-income households. Another $54.2 million was slated for the State Energy Program, which promotes energy conservation, energy efficiency and renewable energy. $10.6 million was provided to the Department to work with cities and counties on energy efficiency projects. Finally, over $500,000 was provided to the state for appliance rebates.
Chapter 138 required periodic reports for the first year. As ARRA ends, there are substantial closeout reports that provide information on all programs for each grant. Additional information is available on the Minnesota Department of Commerce website at: http://mn.gov/commerce/energy/media/Stimulus-Program-Tracking. Final reports for SEP and Energy Efficiency and Conservation Block Grant are
50

also available on the Department website.
The ARRA-funded programs retained and created jobs as well as promoted awareness and achievement of energy efficiency upgrades resulting in long-term energy conservation.
51
APPENDIX A
MINNESOTA PUBLIC UTILITIES COMMISSION (MPUC)
RATE PLAN
Minnesota Statutes, 2009, Chapter 216C.18, Subdivision 1a requires the Public Utilities Commission (MPUC) to prepare a Rate Plan as part of the Quadrennial Report. The Rate Plan is to address the MPUC’s rate design policy pertaining to certain statutory energy goals; specifically, those dealing with cogeneration and small power production (Minn. Stat. Chapters 216B.164); energy conservation improvement (Minn. Stat. Chapter 216B.241) and the use of fossil fuels and renewable energy (Minn. Stat. Chapter 216C.05). In addition, the MPUC is to make recommendations on possible administrative or legislative actions to accomplish those goals.
The Commission’s duty is to ensure adherence to the policy set forth in statutes. The Commission’s role is to take actions to carry out those policies. Commission actions with regard to energy, in the most general sense, take two forms: establishing reasonable rates and assuring resource choices that are in the public interest. Both the rate making and the resource selection process play a central role in addressing the policy goals cited above. In addition, transmission planning and development of the transmission grid are taking on increasing importance as well.
RATE MAKING
POLICY DIRECTION Minnesota statutes include the following direction to the Commission in carrying out its rate-making responsibilities:
$ Rates shall be just and reasonable, not unreasonably preferential or discriminatory, and consistent with the financial need of public utilities to provide service. (Minn. Stat. Chapter 216B.03)
$ Rates shall, to the maximum extent possible, be set to encourage energy conservation and the use of renewable energy. (Minn. Stat. Chapter 216B.03)
$ Cogeneration and small production shall be encouraged consistent with the protection of ratepayers and the public (Minn. Stat. Chapter 216B.164).
$ Special rate riders and other special cost recovery provisions authorized in statute assure single issue cost recovery for a wide variety of activities, including far more than just energy conservation improvements and renewable energy. Attachment A to this Rate Report provides a list with statutory citations.
COMMISSION ACTIVITY REGARDING ENERGY RATE-MAKING Rate cases: Rate cases are a primary means by which the MPUC establishes energy rates. Since the 2008 Energy Policy and Conservation Report, the MPUC has had 11 general rate cases:
CenterPoint Energy, Dakota Electric Association, Greater Minnesota Gas, Interstate Power and Light (Gas and Electric), Minnesota Energy Resources Corporation, Minnesota Power, Northwest
52
ern Wisconsin Electric Company, Otter Tail Power Company, and Xcel (Electric and Gas)32
In addition, the MPUC has an earnings investigation pending for Great Plains Natural Gas Company; to correct an over-earnings situation, the company must file a rate case by the end of July 2012 or reach a settlement to lower rates.33
This level of activity continues to be a significant increase in rate case filings over the 2000 and 2004 Quadrennial Report periods. During the 2012 report period, all of the largest investor-owned utilities in Minnesota (i.e., CenterPoint Energy, Minnesota Power, Otter Tail Power, and Xcel [both electric and gas]) filed major proceedings. In each of these rate case proceedings, the MPUC has deliberately taken into account the statutory factors cited above as they applied to the particular proceeding.
It is also important to note that the numerous special rate riders and “out-of-rate case” recovery mechanisms (Attachment A) have had a major role in the MPUC’s rate-making process. In a general rate proceeding, the MPUC looks at all categories of costs, i.e., those that are increasing as well as those that are decreasing. The rates ultimately established are significantly affected by this weighing of fluctuating costs across utility operations. Factoring in cost reductions offsets the upward pressure of cost increases that often drive rate requests, and by doing so, limit the impact on rates. However, special recovery mechanisms take certain cost categories “off the table,” i.e., place them out of consideration in this balancing process.
While many of these mechanisms are intended to and, in fact, do promote worthy public policy goals, it should also be understood that by making decisions outside of the overall general rate case, these mechanisms diminish the MPUC’s ability to effectively use rate design to accomplish policy goals.
Other rate-making activities: In addition to the general rate proceedings, the Commission has undertaken several proceedings focusing more generally on rate-related issues for energy utility services.
Decoupling: Minnesota Statutes, 2009, Chapter 216B.2412 directed the MPUC to establish criteria and standards by which decoupling could be adopted by rate-regulated utilities and authorized one or more utilities to participate in a pilot program to assess the merits of a rate-decoupling strategy to promote energy efficiency and conservation. The MPUC issued its Order Establishing Criteria and Standards to be Utilized in Pilot Proposals for Revenue Decoupling on June 19, 2009 (MPUC Docket Number E,G-999/CI-08-132). CenterPoint Energy proposed a pilot decoupling program in its general rate case filed in late 2008 (MPUC Docket Number G-008/GR-08-1075); the Commission approved a 3-year decoupling pilot on January 11, 2010. Minnesota Energy Resources Corporation (MERC) has proposed revenue decoupling in its pending rate case; the Commission is expected to hear this matter in spring 2012.34 The Commission approved the program and has since required annual decoupling reports.
Smart Grid: In a 2009 Order, the Commission adopted a definition of smart grid, required annual reports of rate-regulated utilities, and established requirements for consideration of smart grid investments. In January 2012, the Commission began hosting workshops on various topics related to smart
32The docket numbers, in chronological order, are: E002/GR-08-1065; G008/GR-08-1075; E111/GR-09-175; G022/GR-09-962; E015/GR-09-1151; G002/GR-09-1153; E017/GR-10-239; E001/GR-10-276; E002/GR-10-971; G007, 011/GR-10-977, and E016/GR-12-42. 33Docket No. G004/CI-11-1110. 34Docket No. G007, G011/GR-10-977. 53
grid. The Commission has continued to monitor the issue through reviews of the annual reports and by discussions at the workshops.
Gas Affordability: Minnesota Laws, 2007, Chapter 57 provides for low-income affordability programs which affect the rates paid for utility services by eligible households. The MPUC approved affordability programs for all affected utilities prior to 2008, the previous Quad Report and has continued to monitor these programs since that time.
Green pricing: Minn.Stat. Chapter 216B.169 provides for renewable and high-efficiency energy rate options. The MPUC has adopted tariff changes for each utility to implement this provision.35
DSM Financial Incentives: Under Minn. Stat. § 216B.16, subd. 6c, the Commission has established financial mechanisms to encourage utility conservation efforts, mainly by reducing the financial losses that result from lower energy sales. After a year of collaboration, the Commission approved a new DSM financial incentive in 201036 that awards a utility a percentage of the net benefits created by a utility’s energy conservation investments. Adjustments were made to the new incentive in 2012.
RES Cost Impact: 2011 legislation required all 16 utilities subject to the state’s renewable energy standards to file a report due October 25, 2011 outlining cost issues related to compliance with Minnesota Statutes §216B.1691.37
RESOURCE SELECTION
POLICY DIRECTION:
Minnesota statutes provide for a wide variety of proceedings and other requirements that are not part of rate making or rate design, per se, but nevertheless affect the resources used in Minnesota. There have been a significant number of filings to the MPUC since 2008 relating to these provisions (excluding those prohibited). The following list identifies the major proceedings:
Resource Planning: Electric utilities are required to file biennial integrated resource plans which identify and justify the mix of supply and demand-side resource options to meet projected energy demand over a 15-year planning period. Since its inception in Minnesota in the early 1990s, the Legislature has expanded the scope of resource planning beyond the state’s four investor-owned utilities to also include four generation and transmission cooperatives and three municipal joint action agencies. (Minn. Stat. Chapter 216B.2422)
Advanced Determination of Prudence: Utilities now have the option, under 2010 legislation, to apply for an Advanced Determination of Prudence (ADP) for certain generation projects undertaken to comply with Clean Air Act Standards. The Commission to date has addressed one petition for an ADP. (Minn. Stat. §216B.1695)
Transmission Planning: Electric utilities are required to biennially submit a transmission project report which must contain the following: (1) present and foreseeable future inadequacies in the trans
35Legislation passed in 2010 no longer obligates utilities to offer these rates, but rate regulated utilities have continued to do so. 36Docket No. E,G999/CI-08-133, Order issued January 27, 2010.
54 37These reports can be found in edockets under E-999/CI-11-852. Future reports are required in resource plans.
mission system in Minnesota; (2) alternative means of addressing each inadequacy listed; (3) general economic, environmental, and social issues associated with each alternative, and (4) a summary of public input related to the list of inadequacies gathered through a required public hearing process as well as the role of local government officials and other interested persons in assisting to develop the list and analyze alternatives. Certification of need for new lines may also be obtained through this process as an alternative to a conventional certificate of need filing. (Minn. Stat. Chapter 216B.2425)
Certificate of Need: Since the mid 1970s, Minnesota law has required a certificate of need be issued before large energy facilities, e.g., electric generating plants and high-voltage transmission lines, can be built in the state. This process provides an important and in-depth review of the size, type and timing of a proposed facility, and reaches a determination whether such a facility is needed and in the public interest. Applicants are required to show that the asserted need cannot be met more cost effectively through energy conservation and load-management measures. (Minn. Stat. §216B.243).
Site or Route Permitting: In 2005, the authority for permitting specific large energy facilities was transferred from the Minnesota Environmental Quality Board (EQB) to the MPUC (Minnesota Laws, 2005, Chapter 97). It is through this permitting process that the specific location (or route) of an energy facility is determined. The permitting process facilitates the timely issuance of permits in a manner that is compatible with environmental preservation and the efficient use of resources. The MPUC is to choose locations that minimize adverse human and environmental impact while insuring electric reliability and integrity and insuring that electric energy needs are met and fulfilled in an orderly and timely fashion. (Minn. Stat. Chapters 216E (Electric Power Facilities); 216F (Wind Energy Conversion Systems); and 216G (Pipelines).
Renewable Energy Standards: In 2007, renewable energy standards were established for electric utilities (See PORTFOLIO DIVERSIFICATION – RENEWABLE AND MODERN ENERGY TECHNOLOGIES: B. Renewable Energy Policies and Programs.) The statute requires electric utilities to procure, according to a prescribed schedule, renewable energy generation resources up to a specified percentage of their generation portfolios. Electric utilities are to report biennially on the progress they are making toward complying with these standards. The MPUC is to regularly investigate whether utilities are in compliance, and if it finds a utility is not, it can order corrective measures, including imposing a penalty. In addition, the MPUC can delay implementation of a utility’s activities in this regard if the delay is found to be in the public interest. (Minn. Stat. Chapter 216B.1691)
Environmental Cost Values: The Commission is required by statute to establish a range of environmental costs for each method of electricity generation and is to use that information in all resource selection decisions, including resource planning, competitive bidding and certificate of need (Minn. Stat. Chapter 216B.2422). A separate statute requires the Commission to establish an estimate of the likely range of costs of future carbon dioxide regulation on electricity generation, which must be used in all electricity generation resource acquisition proceedings. (Minn. Stat. Chapter 216H.06)
Performance-Based Gas Purchasing: The MPUC may approve performance-based natural gas purchasing plans proposed by utilities. The law is intended to provide financial incentives for Minnesota natural gas distribution companies to the lowest cost natural gas commodity from the deregulated gas market. (Minn. Stat. Chapter 216B.167)
55
Prohibitions on specific resources:
Nuclear generation: The MPUC is prohibited from approving a certificate of need for a new nuclear power generating plant. For an existing nuclear facility, the MPUC must address “the impacts of continued operations over the period for which approval is sought” for any additional storage of spent nuclear fuel. (Minn. Stat. Chapter 216B.243)
Generation using carbon emitting fuels: There are prohibitions on certain types of facilities or arrangements that would contribute to the statewide power sector carbon dioxide emission: i.e., a) the construction in Minnesota of such a large energy facility (i.e., fossil fuel plant); b) importing power from such a facility; c) entering into a long-term power purchase agreement for power from such a facility. (Minn. Stat. Chapter 216H.03)
Pumped hydro generation facility: No Minnesota state agency may issue a permit for a generation facility that is located in top of the bluffs along the Mississippi River and would pump water from any portion of the river, store the water on top of the bluffs, and release the water to generate electricity.
COMMISSION ACTIVITY REGARDING RESOURCE SELECTION:
Resource Planning: Since the 2008 Report, the Commission has received resource plans for the following utilities:
Dairyland Power Cooperative, , Interstate Power Company, Minnesota Power, Minnesota Municipal Power Agency, Minnkota Power Cooperative, Missouri River Energy Services, Otter Tail Power, Southern Minnesota Municipal Power Agency, and Xcel Energy.38
Transmission Planning: Utilities, organizations or companies that own or operate electric transmission lines in Minnesota are required to submit a transmission projects report biennially, on November 1 of each odd-numbered year. Currently the 16 utilities subject to this requirement submit a report jointly; the last report was submitted in 2011.
In the past several years, transmission planning has become a more comprehensive effort on the part of the utilities. Due to the demand for new and regional transmission lines, joint venture groups (most notably the CapX2020 consortium) have planned large-scale, collaborative transmission expansion projects. CapX2020 is a joint initiative of 11 transmission-owning utilities in Minnesota and the surrounding region. It is anticipated that this regional-based approach will continue into the future.
The role of the Midwest ISO in transmission planning has become much more significant as it has evolved and applies active Federal Energy Regulatory Commission (FERC) development of planning requirements. This more active role in region wide planning will require increased and more transparent participation by Minnesota’s transmission owners and regulators, and portends adaptation of regulatory reviews to reflect changing planning processes.
Certificate of Need: Since 2007, the Commission has granted the following certificates of need:
38Docket numbers ET3/RP-11-918, E001/RP-08-673, E015/RP-09-1088, ET6, ET6132/RP-10-782, ET10/RP-10-735, E017/RP-10-623, ET9/RP-09-536, and E002/RP-10-825 respectively. 56
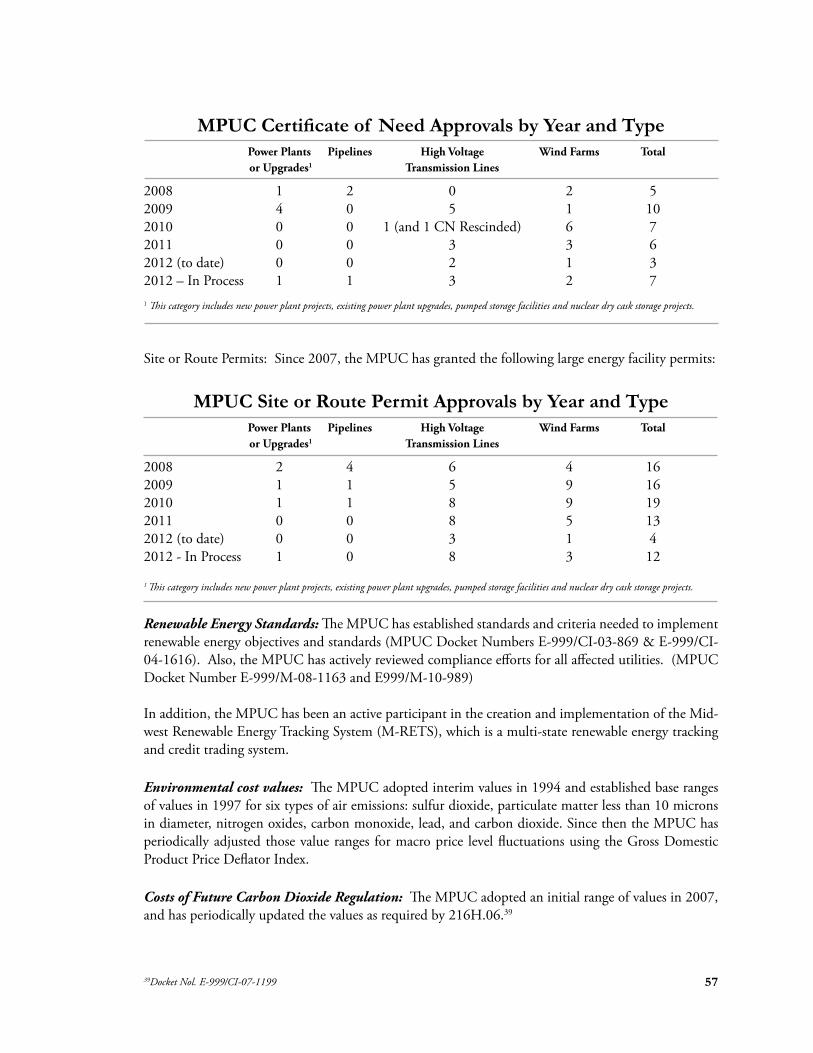
MPUC Certificate of Need Approvals by Year and TypePower Plants Pipelines High Voltage Wind Farms Total or Upgrades1 Transmission Lines
2008 1 2 0 2 5 2009 4 0 5 1 10 2010 0 0 1 (and 1 CN Rescinded) 6 7 2011 0 0 3 3 6 2012 (to date) 0 0 2 1 3 2012 – In Process 1 1 3 2 7 1 This category includes new power plant projects, existing power plant upgrades, pumped storage facilities and nuclear dry cask storage projects.
Site or Route Permits: Since 2007, the MPUC has granted the following large energy facility permits:
MPUC Site or Route Permit Approvals by Year and Type Power Plants Pipelines High Voltage Wind Farms Total or Upgrades1 Transmission Lines
2008 2 4 6 4 16 2009 1 1 5 9 16 2010 1 1 8 9 19 2011 0 0 8 5 13 2012 (to date) 0 0 3 1 4 2012 - In Process 1 0 8 3 12
1 This category includes new power plant projects, existing power plant upgrades, pumped storage facilities and nuclear dry cask storage projects.
Renewable Energy Standards: The MPUC has established standards and criteria needed to implement renewable energy objectives and standards (MPUC Docket Numbers E-999/CI-03-869 & E-999/CI04-1616). Also, the MPUC has actively reviewed compliance efforts for all affected utilities. (MPUC Docket Number E-999/M-08-1163 and E999/M-10-989)
In addition, the MPUC has been an active participant in the creation and implementation of the Midwest Renewable Energy Tracking System (M-RETS), which is a multi-state renewable energy tracking and credit trading system.
Environmental cost values: The MPUC adopted interim values in 1994 and established base ranges of values in 1997 for six types of air emissions: sulfur dioxide, particulate matter less than 10 microns in diameter, nitrogen oxides, carbon monoxide, lead, and carbon dioxide. Since then the MPUC has periodically adjusted those value ranges for macro price level fluctuations using the Gross Domestic Product Price Deflator Index.
Costs of Future Carbon Dioxide Regulation: The MPUC adopted an initial range of values in 2007, and has periodically updated the values as required by 216H.06.39
39Docket Nol. E-999/CI-07-1199 57
Performance-Based Gas Purchasing: Over the years, the Commission has reviewed and approved a number of proposals to enhance customer choice, including: clarification of transportation tariffs, a pilot aggregation service which allows marketers to combine transportation customers, a pilot fixed-price commodity tariff, and seasonal gas rates. The Commission has also examined whether procurement of natural gas supplies by a marketer or other third party, rather than the traditional gas distribution utility, would be appropriate.
REGIONAL AND NATIONAL ISSUES
The advent of restructuring in the electric industry has moved the industry away from its traditional vertically integrated nature which offered generation, transmission, and distribution services as a bundled package. Historically, the price for electricity was designed to reflect the aggregate cost of the three services.
The Federal Energy Regulatory Commission (FERC) has taken several bold steps over the last 15 years to foster competitive wholesale electric utility markets throughout the United States. A key component of FERC’s strategy is the creation of regional transmission organizations (RTOs) to oversee the use and development of regional transmission systems and the linkages between those systems. For Minnesota, the RTO is the Midwest Independent System Operator (Midwest ISO), which has a service area encompassing 13 states (from Kentucky to Missouri to Montana) and the Province of Manitoba. State regulators, including the Minnesota Public Utilities Commission, are involved in Midwest ISO matters primarily through the Organization of Midwest ISO States (OMS), which is designed to monitor activities of the Midwest ISO, as well as FERC, in order to protect ratepayer interests. In addition, the Commission will intervene independently and, at times, jointly with the Minnesota Division of Energy Resources , in matters before FERC when it believes issues unique to Minnesota’s interests need to be represented.
The creation of the Midwest ISO has focused industry and regulatory attention on regional transmission issues. Foremost of these is planning transmission infrastructure to ensure reliability, keep rates reasonable, as well as meet state, and, perhaps, national, renewable energy goals. A central issue has been and continues to be the method by which the costs of transmission projects are allocated among states in the footprint. This is a multi-state, multi-sector endeavor and a number of initiatives have occurred since 2008.
• The Upper Midwest Transmission Development Initiative (UMTDI) was initiated by the governors of Iowa, Minnesota, South Dakota, North Dakota, and Wisconsin to develop a transmission plan by which those five states could meet their renewable energy goals, including a method for allocating the cost of needed transmission upgrades.
• The Cost Allocation Resource Plan (CARP) was an initiative, led by the Organization of MISO States, that developed a cost allocation methodology for transmission projects that provide benefits across the entire Midwest ISO footprint. That effort ultimately culminated in a tariff filing by the Midwest ISO at FERC.
• In addition, the Eastern Interconnection Planning Collaborative is focusing similar efforts on the entire U.S. Eastern Interconnection; i.e., an area encompassing the states in the Central
58
Time Zone on the west (except Texas) to the Atlantic Ocean. This is a first-of-its-kind effort to involve planning authorities in the Eastern Interconnection in modeling the impact on the grid of various state, provincial and federal policymakers and other stakeholders. The intended outcome is a coordinated interregional analysis for the entire Eastern Interconnection guided by the consensus input of a broad stakeholder process.
These initiatives carry major implications for states’ abilities to meet reliability standards as well as renewable energy goals. In addition, they carry important implications for utility rates.
In addition, the Environmental Protection Agency (EPA) has initiated several major rulemaking projects which propose to set new standards for emissions, including those from electric power plants. Depending on the standards ultimately established by the EPA, numerous coal-fired generating plants could be affected; i.e., requiring emission control technology upgrades where cost-effective to do so, or where technology upgrades are not cost-effective, requiring the shutdown of older coal plants. This initiative carries important implications for electric utility operations and their costs of operation. Also, inasmuch as natural gas is the major and most cost-effective alternative fuel, the proposed rules also carry implications for natural gas utilities as well. These changes are expected to put greater upward pressure on utility rates.
FUTURE POLICY DIRECTIONS
Energy utilities today face changing market conditions, emergence of new technologies, as well as active pursuit of alternative public policy options. Achieving reliable, affordable and environmentally sound energy services requires pursuit of creative policy alternatives balanced with the proprietary interests of ratepayers and shareholders alike. As noted, electric resource planning is increasingly becoming a regional endeavor. Policymakers will need to consider the full implications of this changing condition. The Commission will continue to engage in regional and national issues that have direct bearing on Minnesota’s interests.
OUTSIDE OF RATE CASE COST RECOVERY ADJUSTMENTS PERMITTED OR REQUIRED UNDER MINNESOTA LAW
Outside rate case recovery provisions in Minnesota Statutes:
Fuel Clause Adjustment ........................................................................ 216B.16, subd. 7 Conservation Improvement/Incentive ...................................... 216B.16, subd. 6b [c], 6c Performance-based Gas Purchasing Adj. .............................................. 216B.16, subd. 7a Transmission Cost Adjustment............................................................216B.16, subd. 7b Transmission Asset Transfer ............................................................216B.16, subd. 7c [b] Low-income Electric Discount (Xcel only) ..........................................216B.16, subd. 14 Natural Gas Utility Infrastructure .................................................................. 216B.1635 Renewable PPA/Invest./Exp/RDF.....................................................216B.1645, subd. 2 Settlement w/ Mdewakanton-Prairie Island(Xcel only)......................216B.1645, subd. 4 Emissions Reduction Rider ...............................................................216B.1692, subd. 3 Mercury Emissions Reduction.......................................................................... 216B.683 CIP/Real & Personal Property Taxes.................................................... 216.241, subd. 2b
59

ReliAdmin/State Bldg................................................... 216C.052, subd. 2 (d) & subd. 3 Gas Affordability Program Costs .........................................................216B.16, subd. 15 Certain Greenhouse Gas Infrastructure .......................................................... 216B.1637 Electric Infrastructure Costs (EIUC) .............................................................. 216B.1636 Utility-owned Renewable Facilities.................................................. 216B.1645, subd. 2a Decoupling .................................................................................................... 216B.2412 Central Corridor Costs........................................................................216B.16, subd. 7d
60
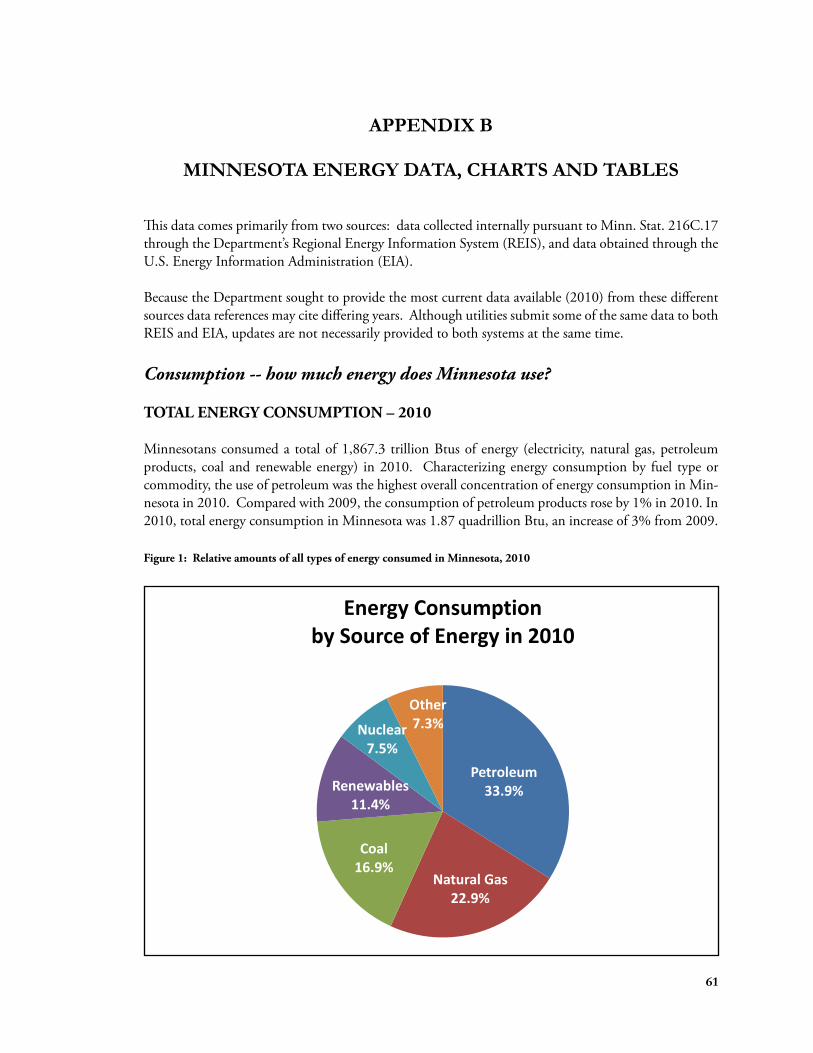
APPENDIX B
MINNESOTA ENERGY DATA, CHARTS AND TABLES
This data comes primarily from two sources: data collected internally pursuant to Minn. Stat. 216C.17 through the Department’s Regional Energy Information System (REIS), and data obtained through the U.S. Energy Information Administration (EIA).
Because the Department sought to provide the most current data available (2010) from these different sources data references may cite differing years. Although utilities submit some of the same data to both REIS and EIA, updates are not necessarily provided to both systems at the same time.
Consumption -- how much energy does Minnesota use?
TOTAL ENERGY CONSUMPTION – 2010
Minnesotans consumed a total of 1,867.3 trillion Btus of energy (electricity, natural gas, petroleum products, coal and renewable energy) in 2010. Characterizing energy consumption by fuel type or commodity, the use of petroleum was the highest overall concentration of energy consumption in Minnesota in 2010. Compared with 2009, the consumption of petroleum products rose by 1% in 2010. In 2010, total energy consumption in Minnesota was 1.87 quadrillion Btu, an increase of 3% from 2009.
Figure 1: Relative amounts of all types of energy consumed in Minnesota, 2010
Energy Consumptionby Source of Energy in 2010
Petroleum 33.9%
Natural Gas 22.9%
Coal 16.9%
Renewables 11.4%
Nuclear 7.5%
Other 7.3%
61
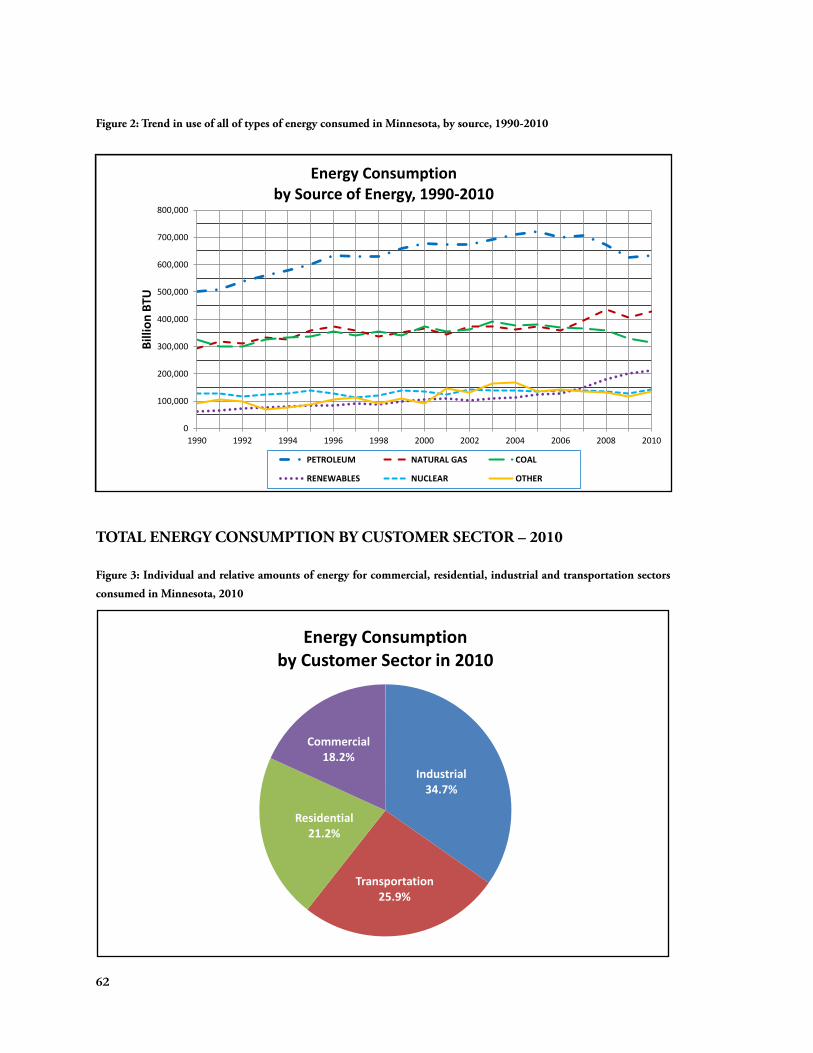
Industrial 34.7%
Transportation 25.9%
Commercial 18.2%
Figure 2: Trend in use of all of types of energy consumed in Minnesota, by source, 1990-2010
0
100,000
200,000
300,000
400,000
500,000
600,000
700,000
800,000
1990 1992 1994 1996 1998 2000 2002 2004 2006 2008 2010
Billi
on B
TU
Energy Consumption by Source of Energy, 1990-2010
PETROLEUM NATURAL GAS COAL
RENEWABLES NUCLEAR OTHER
TOTAL ENERGY CONSUMPTION BY CUSTOMER SECTOR – 2010
Figure 3: Individual and relative amounts of energy for commercial, residential, industrial and transportation sectors
consumed in Minnesota, 2010
Energy Consumption by Customer Sector in 2010
Residential 21.2%
62
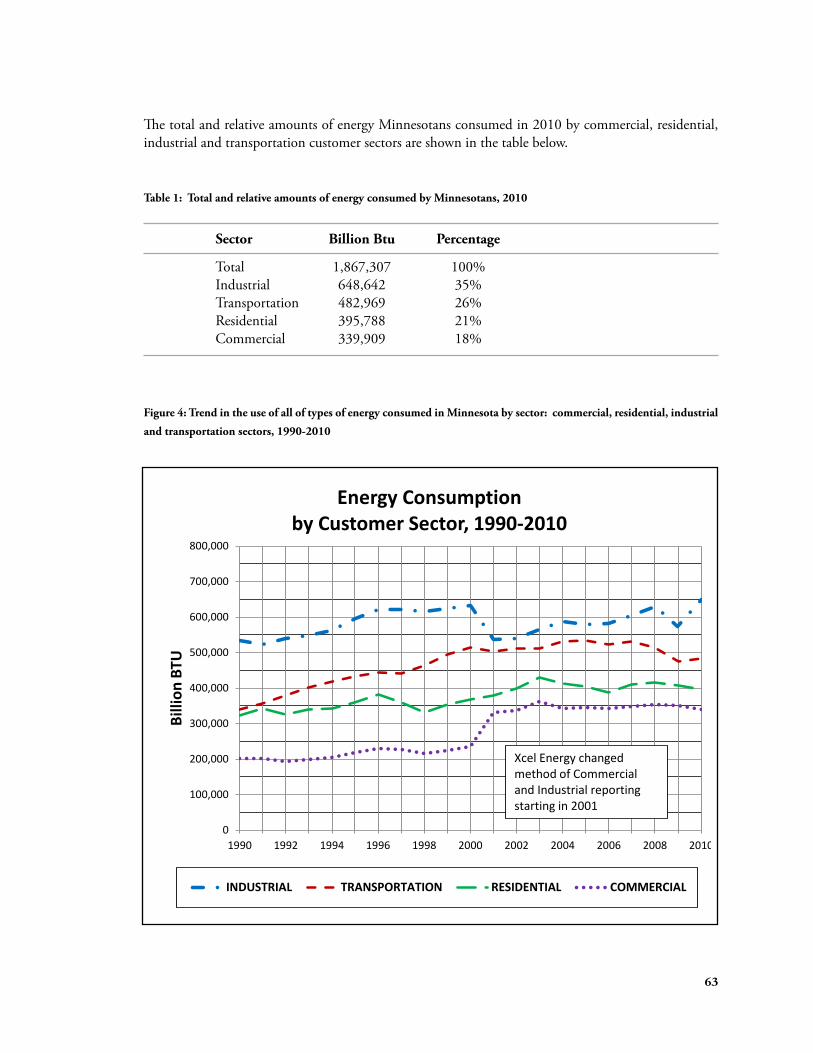
The total and relative amounts of energy Minnesotans consumed in 2010 by commercial, residential, industrial and transportation customer sectors are shown in the table below.
Table 1: Total and relative amounts of energy consumed by Minnesotans, 2010
Sector Billion Btu Percentage
Total Industrial Transportation Residential Commercial
1,867,307 648,642 482,969 395,788 339,909
100% 35% 26% 21% 18%
Figure 4: Trend in the use of all of types of energy consumed in Minnesota by sector: commercial, residential, industrial
and transportation sectors, 1990-2010
Energy Consumption by Customer Sector, 1990-2010
1990 1992 1994 1996 1998 2000 2002 2004 2006 2008 2010 0
100,000
200,000
300,000
400,000
500,000
600,000
700,000
800,000
Billi
on B
TU
Xcel Energy changed method of Commercial and Industrial reporting starting in 2001
INDUSTRIAL TRANSPORTATION RESIDENTIAL COMMERCIAL
63
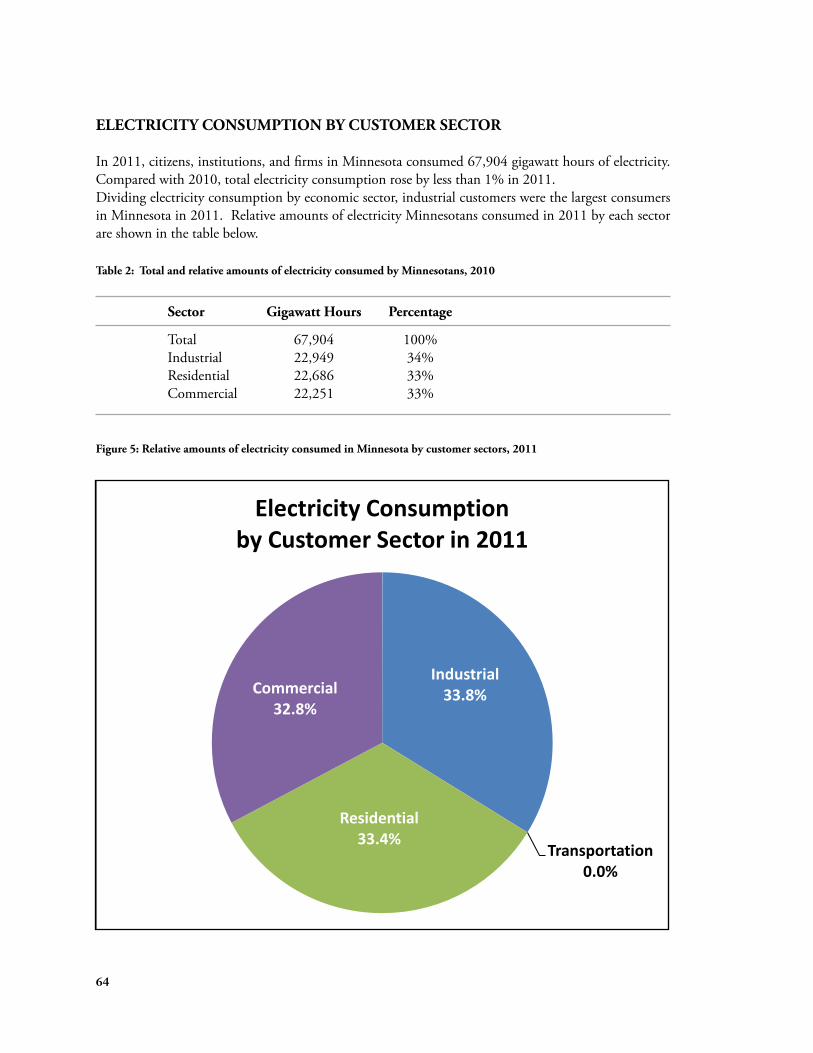
ELECTRICITY CONSUMPTION BY CUSTOMER SECTOR
In 2011, citizens, institutions, and firms in Minnesota consumed 67,904 gigawatt hours of electricity. Compared with 2010, total electricity consumption rose by less than 1% in 2011. Dividing electricity consumption by economic sector, industrial customers were the largest consumers in Minnesota in 2011. Relative amounts of electricity Minnesotans consumed in 2011 by each sector are shown in the table below.
Table 2: Total and relative amounts of electricity consumed by Minnesotans, 2010
Sector Gigawatt Hours Percentage
Total Industrial Residential Commercial
67,904 22,949 22,686 22,251
100% 34% 33% 33%
Figure 5: Relative amounts of electricity consumed in Minnesota by customer sectors, 2011
Industrial 33.8%
Transportation 0.0%
Residential 33.4%
Commercial 32.8%
Electricity Consumption by Customer Sector in 2011
64
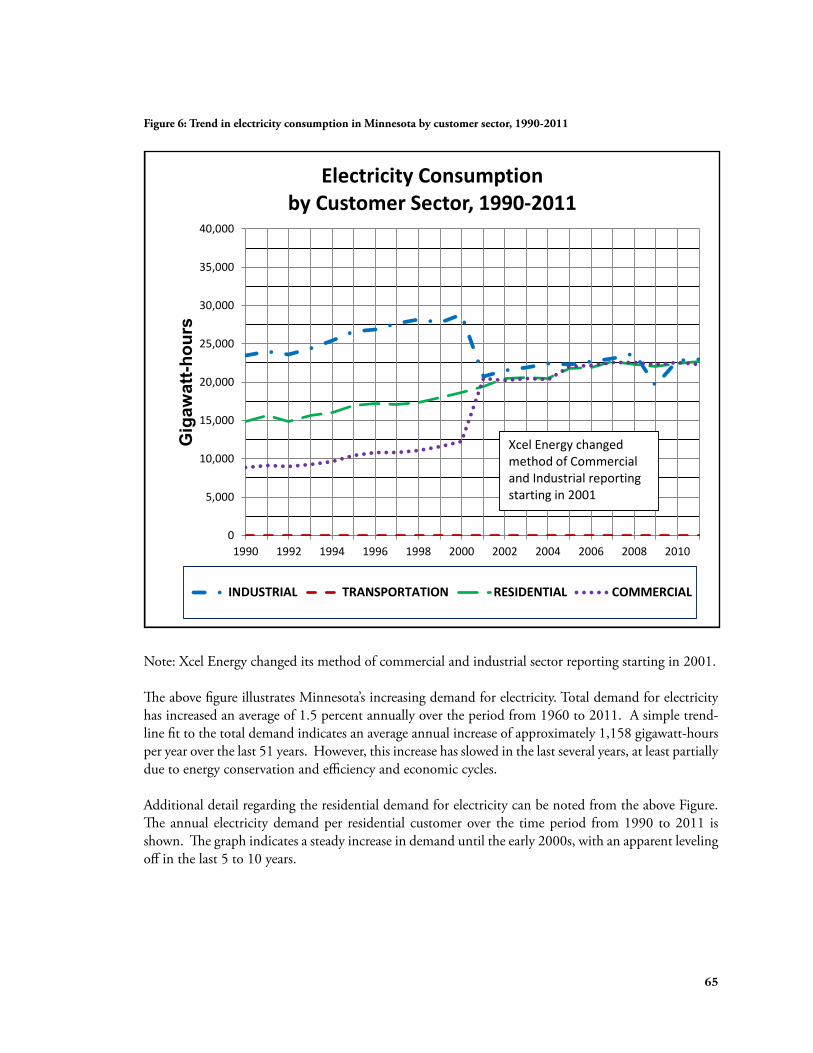
Figure 6: Trend in electricity consumption in Minnesota by customer sector, 1990-2011
0
5,000
10,000
15,000
20,000
25,000
30,000
35,000
40,000
1990 1992 1994 1996 1998 2000 2002 2004 2006 2008 2010
Gig
awat
t-hou
rs
Electricity Consumption by Customer Sector, 1990-2011
INDUSTRIAL TRANSPORTATION RESIDENTIAL COMMERCIAL
Xcel Energy changed method of Commercial and Industrial reporting starting in 2001
Note: Xcel Energy changed its method of commercial and industrial sector reporting starting in 2001.
The above figure illustrates Minnesota’s increasing demand for electricity. Total demand for electricity has increased an average of 1.5 percent annually over the period from 1960 to 2011. A simple trend-line fit to the total demand indicates an average annual increase of approximately 1,158 gigawatt-hours per year over the last 51 years. However, this increase has slowed in the last several years, at least partially due to energy conservation and efficiency and economic cycles.
Additional detail regarding the residential demand for electricity can be noted from the above Figure. The annual electricity demand per residential customer over the time period from 1990 to 2011 is shown. The graph indicates a steady increase in demand until the early 2000s, with an apparent leveling off in the last 5 to 10 years.
65
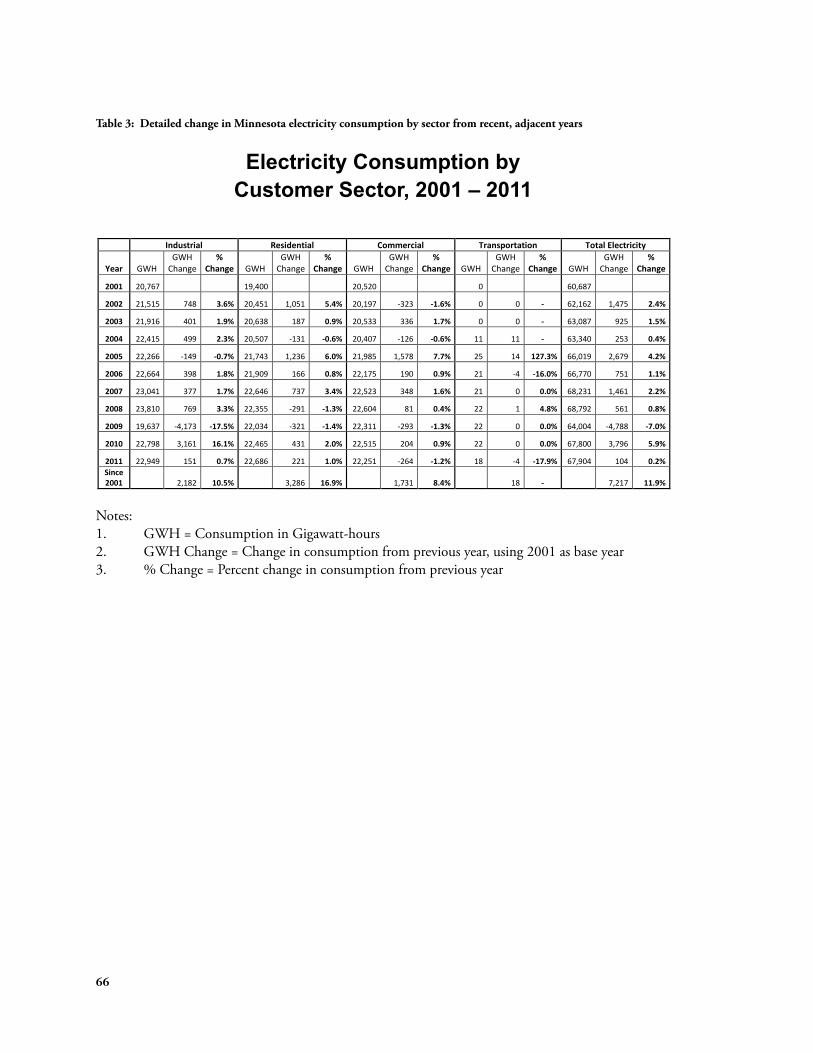
Electricity Consumption by Customer Sector, 2001 – 2011
Notes:GWH = Consumption in Gigawatt-hoursGWH Change = Change in consumption from previous year, using 2001 as base year% Change = Percent change in consumption from previous year
Table 3: Detailed change in Minnesota electricity consumption by sector from recent, adjacent years
Electricity Consumption by Customer Sector, 2001 – 2011
Industrial Residential Commercial Transportation Total Electricity
Year GWH GWH
Change %
Change GWH GWH
Change %
Change GWH GWH
Change %
Change GWH GWH
Change %
Change GWH GWH
Change %
Change
2001 20,767 19,400 20,520 0 60,687
2002 21,515 748 3.6% 20,451 1,051 5.4% 20,197 -323 -1.6% 0 0 - 62,162 1,475 2.4%
2003 21,916 401 1.9% 20,638 187 0.9% 20,533 336 1.7% 0 0 - 63,087 925 1.5%
2004 22,415 499 2.3% 20,507 -131 -0.6% 20,407 -126 -0.6% 11 11 - 63,340 253 0.4%
2005 22,266 -149 -0.7% 21,743 1,236 6.0% 21,985 1,578 7.7% 25 14 127.3% 66,019 2,679 4.2%
2006 22,664 398 1.8% 21,909 166 0.8% 22,175 190 0.9% 21 -4 -16.0% 66,770 751 1.1%
2007 23,041 377 1.7% 22,646 737 3.4% 22,523 348 1.6% 21 0 0.0% 68,231 1,461 2.2%
2008 23,810 769 3.3% 22,355 -291 -1.3% 22,604 81 0.4% 22 1 4.8% 68,792 561 0.8%
2009 19,637 -4,173 -17.5% 22,034 -321 -1.4% 22,311 -293 -1.3% 22 0 0.0% 64,004 -4,788 -7.0%
2010 22,798 3,161 16.1% 22,465 431 2.0% 22,515 204 0.9% 22 0 0.0% 67,800 3,796 5.9%
2011 22,949 151 0.7% 22,686 221 1.0% 22,251 -264 -1.2% 18 -4 -17.9% 67,904 104 0.2% Since 2001 2,182 10.5% 3,286 16.9% 1,731 8.4% 18 - 7,217 11.9%
Notes: 1. GWH = Consumption in Gigawatt-hours 2. GWH Change = Change in consumption from previous year, using 2001 as base year 3. % Change = Percent change in consumption from previous year
66
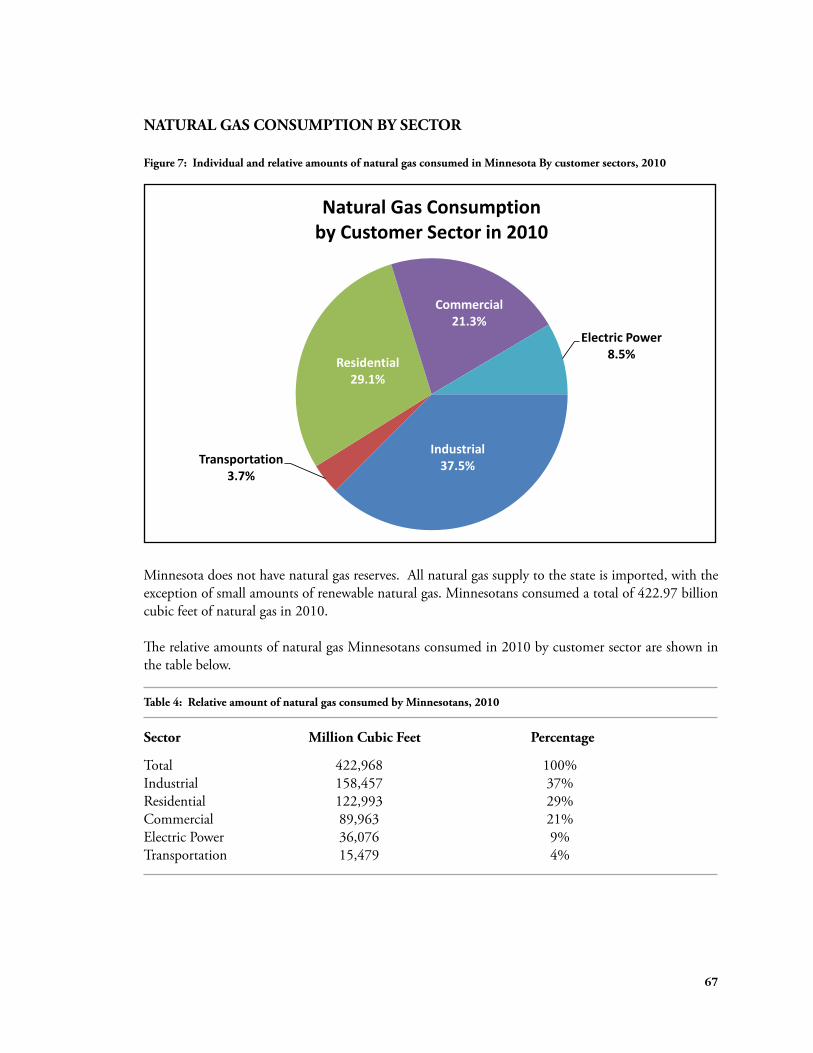
NATURAL GAS CONSUMPTION BY SECTOR
Figure 7: Individual and relative amounts of natural gas consumed in Minnesota By customer sectors, 2010
Natural Gas Consumption by Customer Sector in 2010
Industrial 37.5%Transportation
3.7%
Residential 29.1%
Commercial 21.3%
Electric Power 8.5%
Minnesota does not have natural gas reserves. All natural gas supply to the state is imported, with the exception of small amounts of renewable natural gas. Minnesotans consumed a total of 422.97 billion cubic feet of natural gas in 2010.
The relative amounts of natural gas Minnesotans consumed in 2010 by customer sector are shown in the table below.
Table 4: Relative amount of natural gas consumed by Minnesotans, 2010
Sector Million Cubic Feet Percentage
Total 422,968 100% Industrial 158,457 37% Residential 122,993 29% Commercial 89,963 21% Electric Power 36,076 9% Transportation 15,479 4%
67
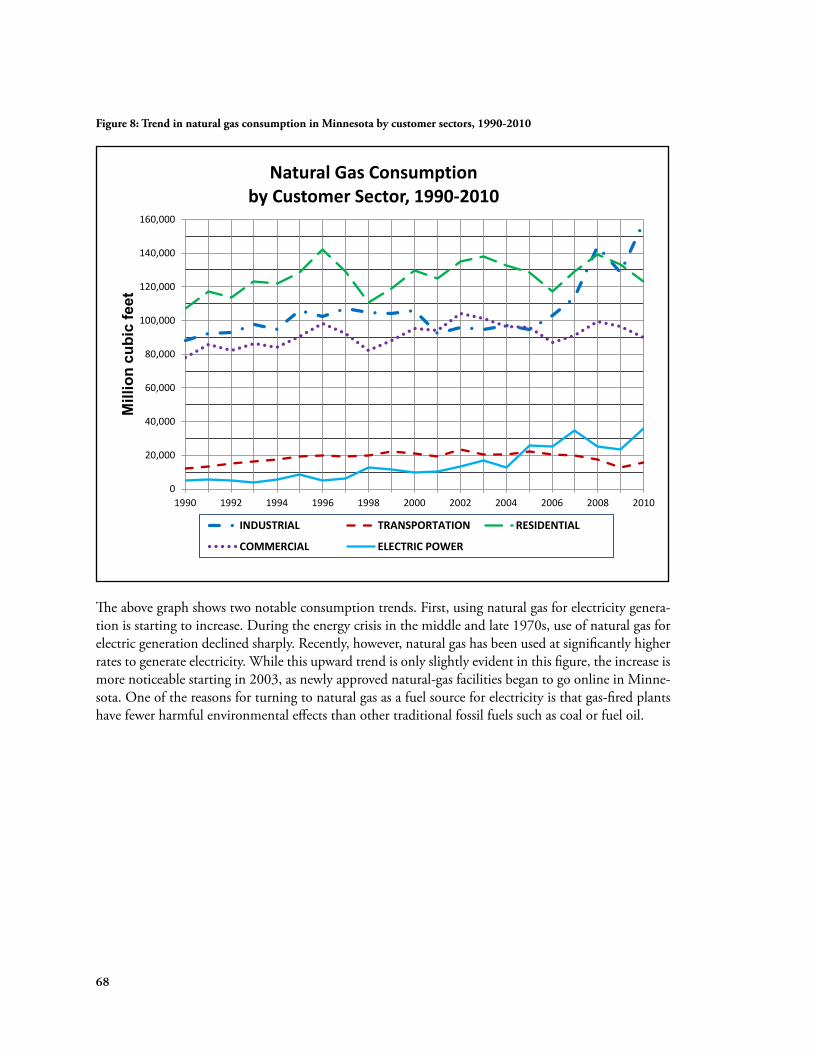
Figure 8: Trend in natural gas consumption in Minnesota by customer sectors, 1990-2010
Natural Gas Consumption by Customer Sector, 1990-2010
0
20,000
40,000
60,000
80,000
100,000
120,000
140,000
160,000
1990 1992 1994 1996 1998 2000 2002 2004 2006 2008 2010
Mill
ion
cubi
c fe
et
INDUSTRIAL TRANSPORTATION RESIDENTIAL
COMMERCIAL ELECTRIC POWER
The above graph shows two notable consumption trends. First, using natural gas for electricity generation is starting to increase. During the energy crisis in the middle and late 1970s, use of natural gas for electric generation declined sharply. Recently, however, natural gas has been used at significantly higher rates to generate electricity. While this upward trend is only slightly evident in this figure, the increase is more noticeable starting in 2003, as newly approved natural-gas facilities began to go online in Minnesota. One of the reasons for turning to natural gas as a fuel source for electricity is that gas-fired plants have fewer harmful environmental effects than other traditional fossil fuels such as coal or fuel oil.
68
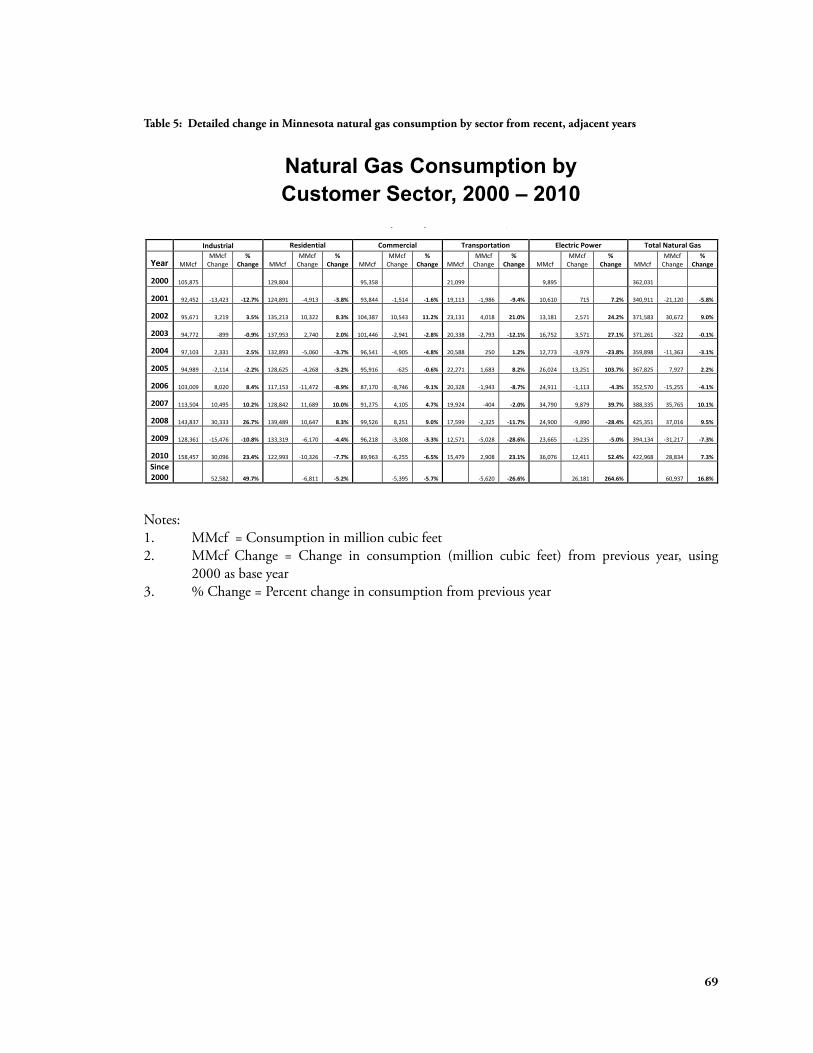
Natural Gas Consum io Customer Sector 2000 – 2010
Notes:MMcf = Consumption in million cubic feetMMcf Change = Change in consumption (million cubic feet) from previous year, using 2000 as base year% Change = Percent change in consumption from previous year
Table 5: Detailed change in Minnesota natural gas consumption by sector from recent, adjacent years
Natural Gas Consumption by Customer Sector, 2000 – 2010
pt n by ,
Industrial Residential Commercial Transportation Electric Power Total Natural Gas
Year MMcf MMcf
Change %
Change MMcf MMcf
Change %
Change MMcf MMcf
Change %
Change MMcf MMcf
Change %
Change MMcf MMcf
Change %
Change MMcf MMcf
Change %
Change
2000 105,875 129,804 95,358 21,099 9,895 362,031
2001 92,452 -13,423 -12.7% 124,891 -4,913 -3.8% 93,844 -1,514 -1.6% 19,113 -1,986 -9.4% 10,610 715 7.2% 340,911 -21,120 -5.8%
2002 95,671 3,219 3.5% 135,213 10,322 8.3% 104,387 10,543 11.2% 23,131 4,018 21.0% 13,181 2,571 24.2% 371,583 30,672 9.0%
2003 94,772 -899 -0.9% 137,953 2,740 2.0% 101,446 -2,941 -2.8% 20,338 -2,793 -12.1% 16,752 3,571 27.1% 371,261 -322 -0.1%
2004 97,103 2,331 2.5% 132,893 -5,060 -3.7% 96,541 -4,905 -4.8% 20,588 250 1.2% 12,773 -3,979 -23.8% 359,898 -11,363 -3.1%
2005 94,989 -2,114 -2.2% 128,625 -4,268 -3.2% 95,916 -625 -0.6% 22,271 1,683 8.2% 26,024 13,251 103.7% 367,825 7,927 2.2%
2006 103,009 8,020 8.4% 117,153 -11,472 -8.9% 87,170 -8,746 -9.1% 20,328 -1,943 -8.7% 24,911 -1,113 -4.3% 352,570 -15,255 -4.1%
2007 113,504 10,495 10.2% 128,842 11,689 10.0% 91,275 4,105 4.7% 19,924 -404 -2.0% 34,790 9,879 39.7% 388,335 35,765 10.1%
2008 143,837 30,333 26.7% 139,489 10,647 8.3% 99,526 8,251 9.0% 17,599 -2,325 -11.7% 24,900 -9,890 -28.4% 425,351 37,016 9.5%
2009 128,361 -15,476 -10.8% 133,319 -6,170 -4.4% 96,218 -3,308 -3.3% 12,571 -5,028 -28.6% 23,665 -1,235 -5.0% 394,134 -31,217 -7.3%
2010 158,457 30,096 23.4% 122,993 -10,326 -7.7% 89,963 -6,255 -6.5% 15,479 2,908 23.1% 36,076 12,411 52.4% 422,968 28,834 7.3%
Since 2000 52,582 49.7% -6,811 -5.2% -5,395 -5.7% -5,620 -26.6% 26,181 264.6% 60,937 16.8%
Notes: 1. MMcf = Consumption in million cubic feet 2. MMcf Change = Change in consumption (million cubic feet) from previous year, using
2000 as base year 3. % Change = Percent change in consumption from previous year
69
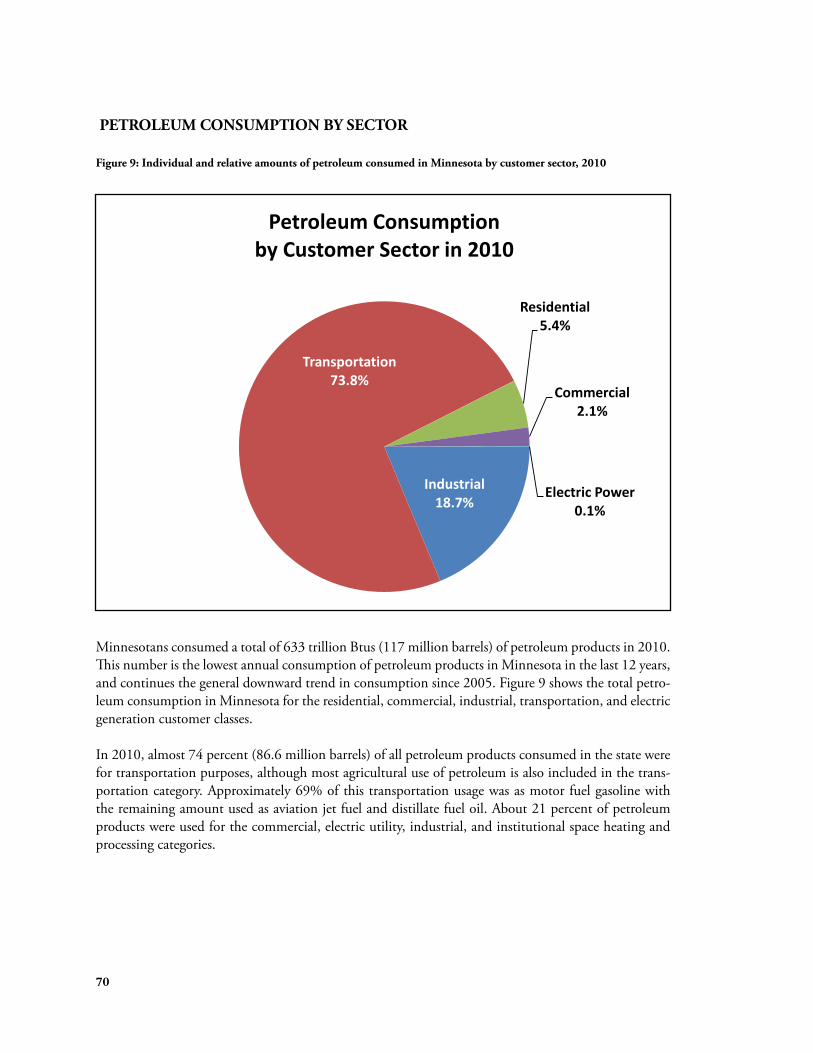
PETROLEUM CONSUMPTION BY SECTOR
Figure 9: Individual and relative amounts of petroleum consumed in Minnesota by customer sector, 2010
Petroleum Consumption by Customer Sector in 2010
Residential 5.4%
Industrial 18.7%
Transportation 73.8%
Commercial 2.1%
Electric Power 0.1%
Minnesotans consumed a total of 633 trillion Btus (117 million barrels) of petroleum products in 2010. This number is the lowest annual consumption of petroleum products in Minnesota in the last 12 years, and continues the general downward trend in consumption since 2005. Figure 9 shows the total petroleum consumption in Minnesota for the residential, commercial, industrial, transportation, and electric generation customer classes.
In 2010, almost 74 percent (86.6 million barrels) of all petroleum products consumed in the state were for transportation purposes, although most agricultural use of petroleum is also included in the transportation category. Approximately 69% of this transportation usage was as motor fuel gasoline with the remaining amount used as aviation jet fuel and distillate fuel oil. About 21 percent of petroleum products were used for the commercial, electric utility, industrial, and institutional space heating and processing categories.
70
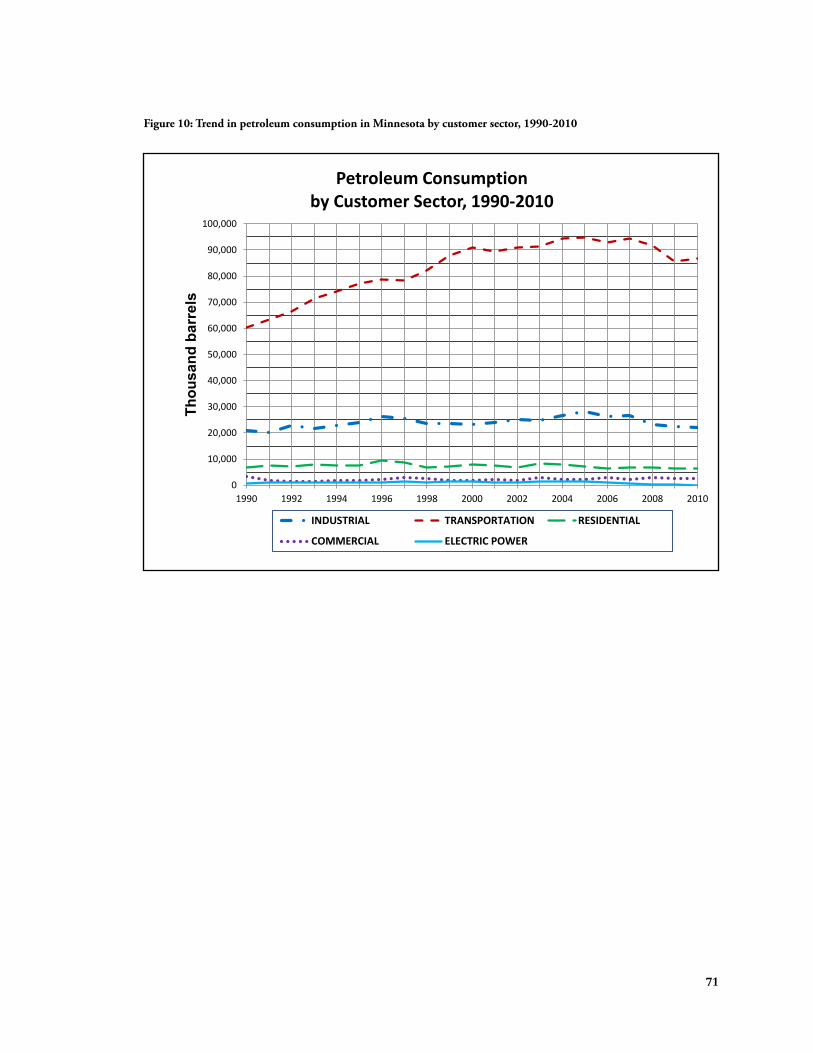
Figure 10: Trend in petroleum consumption in Minnesota by customer sector, 1990-2010
0
10,000
20,000
30,000
40,000
50,000
60,000
70,000
80,000
90,000
100,000
1990 1992 1994 1996 1998 2000 2002 2004 2006 2008 2010
Thou
sand
bar
rels
Petroleum Consumption
by Customer Sector, 1990-2010
INDUSTRIAL TRANSPORTATION RESIDENTIAL
COMMERCIAL ELECTRIC POWER
71
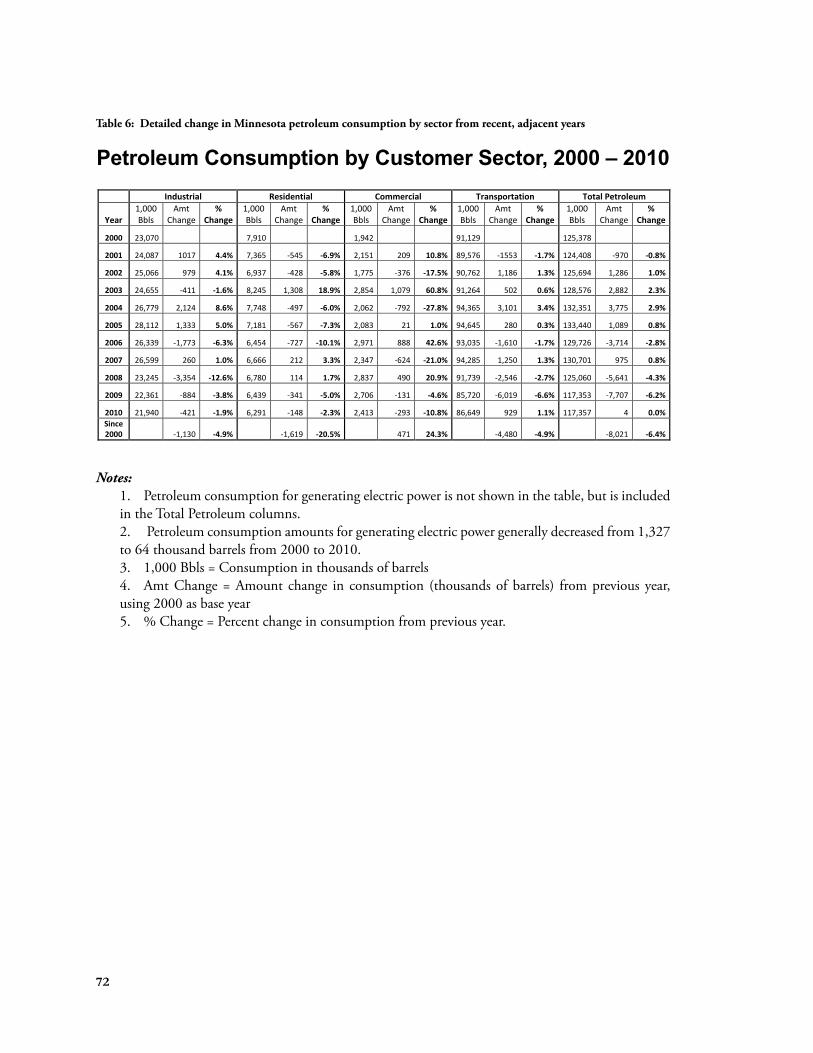
Petroleum Consumption by Customer Sector, 2000 – 2010
Notes:Petroleum consumption for generating electric power is not shown in the table, but is included in the Total Petroleum columns.
Petroleum consumption amounts for generating electric power generally decreased from 1,327 to 64 thousand barrels from 2000 to 2010.1,000 Bbls = Consumption in thousands of barrelsAmt Change = Amount change in consumption (thousands of barrels) from previous year, using 2000 as base year% Change = Percent change in consumption from previous year
Table 6: Detailed change in Minnesota petroleum consumption by sector from recent, adjacent years
Petroleum Consumption by Customer Sector, 2000 – 2010 Industrial Residential Commercial Transportation Total Petroleum
Year 1,000 Bbls
Amt Change
% Change
1,000 Bbls
Amt Change
% Change
1,000 Bbls
Amt Change
% Change
1,000 Bbls
Amt Change
% Change
1,000 Bbls
Amt Change
% Change
2000 23,070 7,910 1,942 91,129 125,378
2001 24,087 1017 4.4% 7,365 -545 -6.9% 2,151 209 10.8% 89,576 -1553 -1.7% 124,408 -970 -0.8%
2002 25,066 979 4.1% 6,937 -428 -5.8% 1,775 -376 -17.5% 90,762 1,186 1.3% 125,694 1,286 1.0%
2003 24,655 -411 -1.6% 8,245 1,308 18.9% 2,854 1,079 60.8% 91,264 502 0.6% 128,576 2,882 2.3%
2004 26,779 2,124 8.6% 7,748 -497 -6.0% 2,062 -792 -27.8% 94,365 3,101 3.4% 132,351 3,775 2.9%
2005 28,112 1,333 5.0% 7,181 -567 -7.3% 2,083 21 1.0% 94,645 280 0.3% 133,440 1,089 0.8%
2006 26,339 -1,773 -6.3% 6,454 -727 -10.1% 2,971 888 42.6% 93,035 -1,610 -1.7% 129,726 -3,714 -2.8%
2007 26,599 260 1.0% 6,666 212 3.3% 2,347 -624 -21.0% 94,285 1,250 1.3% 130,701 975 0.8%
2008 23,245 -3,354 -12.6% 6,780 114 1.7% 2,837 490 20.9% 91,739 -2,546 -2.7% 125,060 -5,641 -4.3%
2009 22,361 -884 -3.8% 6,439 -341 -5.0% 2,706 -131 -4.6% 85,720 -6,019 -6.6% 117,353 -7,707 -6.2%
2010 21,940 -421 -1.9% 6,291 -148 -2.3% 2,413 -293 -10.8% 86,649 929 1.1% 117,357 4 0.0% Since 2000 -1,130 -4.9% -1,619 -20.5% 471 24.3% -4,480 -4.9% -8,021 -6.4%
Notes: 1. Petroleum consumption for generating electric power is not shown in the table, but is included in the Total Petroleum columns. 2. Petroleum consumption amounts for generating electric power generally decreased from 1,327 to 64 thousand barrels from 2000 to 2010. 3. 1,000 Bbls = Consumption in thousands of barrels 4. Amt Change = Amount change in consumption (thousands of barrels) from previous year, using 2000 as base year 5. % Change = Percent change in consumption from previous year.
72
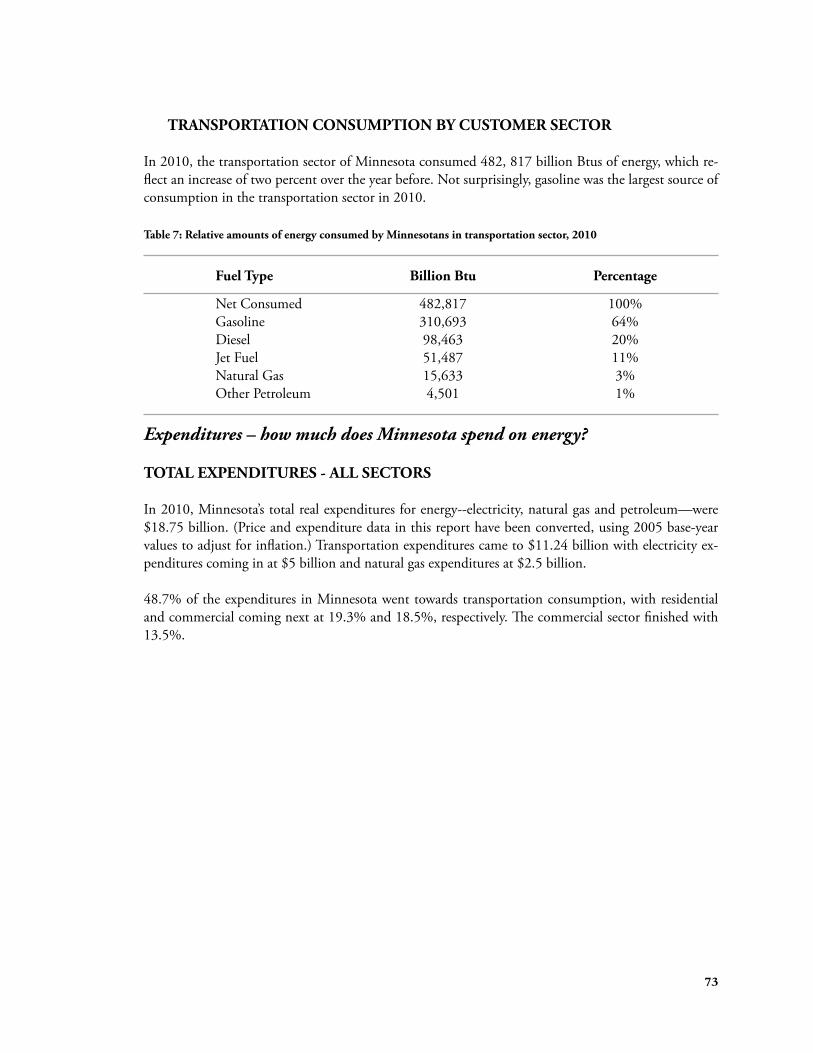
TRANSPORTATION CONSUMPTION BY CUSTOMER SECTOR
In 2010, the transportation sector of Minnesota consumed 482, 817 billion Btus of energy, which reflect an increase of two percent over the year before. Not surprisingly, gasoline was the largest source of consumption in the transportation sector in 2010.
Table 7: Relative amounts of energy consumed by Minnesotans in transportation sector, 2010
Fuel Type Billion Btu Percentage
Net Consumed Gasoline Diesel Jet Fuel Natural Gas Other Petroleum
482,817 310,693 98,463 51,487 15,633 4,501
100% 64% 20% 11% 3% 1%
Expenditures – how much does Minnesota spend on energy?
TOTAL EXPENDITURES - ALL SECTORS
In 2010, Minnesota’s total real expenditures for energy--electricity, natural gas and petroleum—were $18.75 billion. (Price and expenditure data in this report have been converted, using 2005 base-year values to adjust for inflation.) Transportation expenditures came to $11.24 billion with electricity expenditures coming in at $5 billion and natural gas expenditures at $2.5 billion.
48.7% of the expenditures in Minnesota went towards transportation consumption, with residential and commercial coming next at 19.3% and 18.5%, respectively. The commercial sector finished with 13.5%.
73
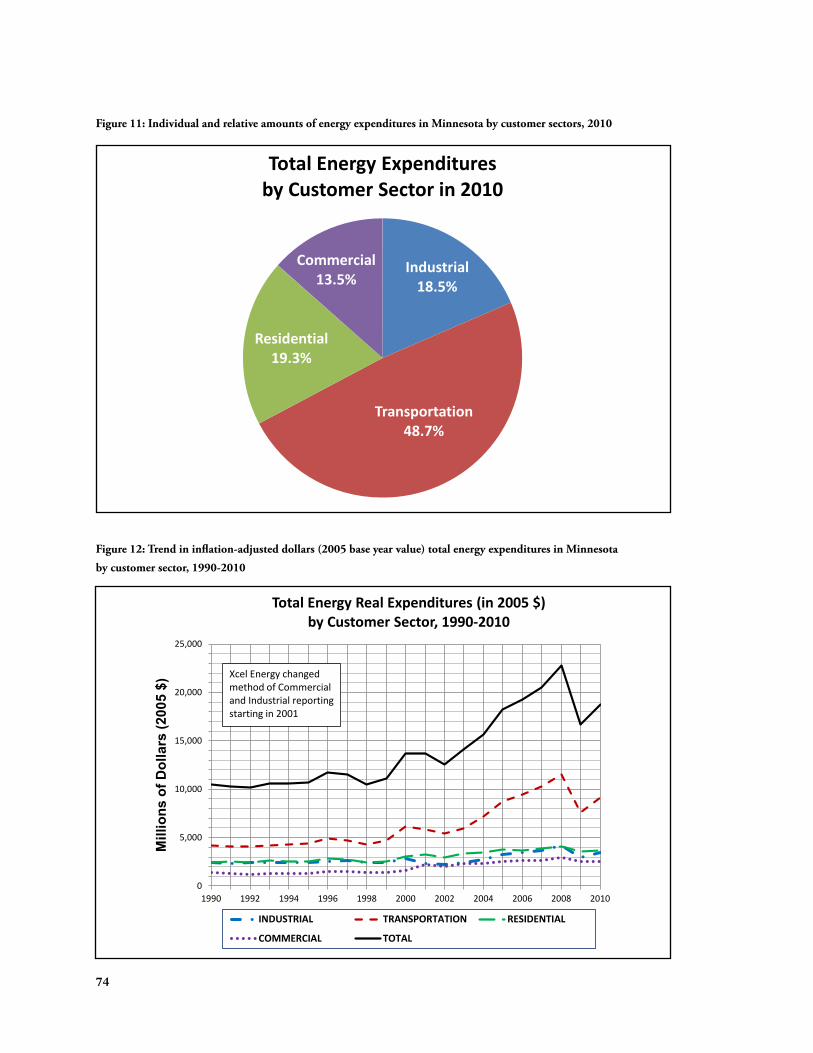
Figure 11: Individual and relative amounts of energy expenditures in Minnesota by customer sectors, 2010
Total Energy Expenditures by Customer Sector in 2010
Industrial 18.5%
Transportation 48.7%
Residential 19.3%
Commercial 13.5%
Figure 12: Trend in inflation-adjusted dollars (2005 base year value) total energy expenditures in Minnesota
by customer sector, 1990-2010
0
5,000
10,000
15,000
20,000
25,000
1990 1992 1994 1996 1998 2000 2002 2004 2006 2008 2010
Mill
ions
of D
olla
rs (2
005
$)
Total Energy Real Expenditures (in 2005 $) by Customer Sector, 1990-2010
INDUSTRIAL TRANSPORTATION RESIDENTIAL
COMMERCIAL TOTAL
Xcel Energy changed method of Commercial and Industrial reporting starting in 2001
74
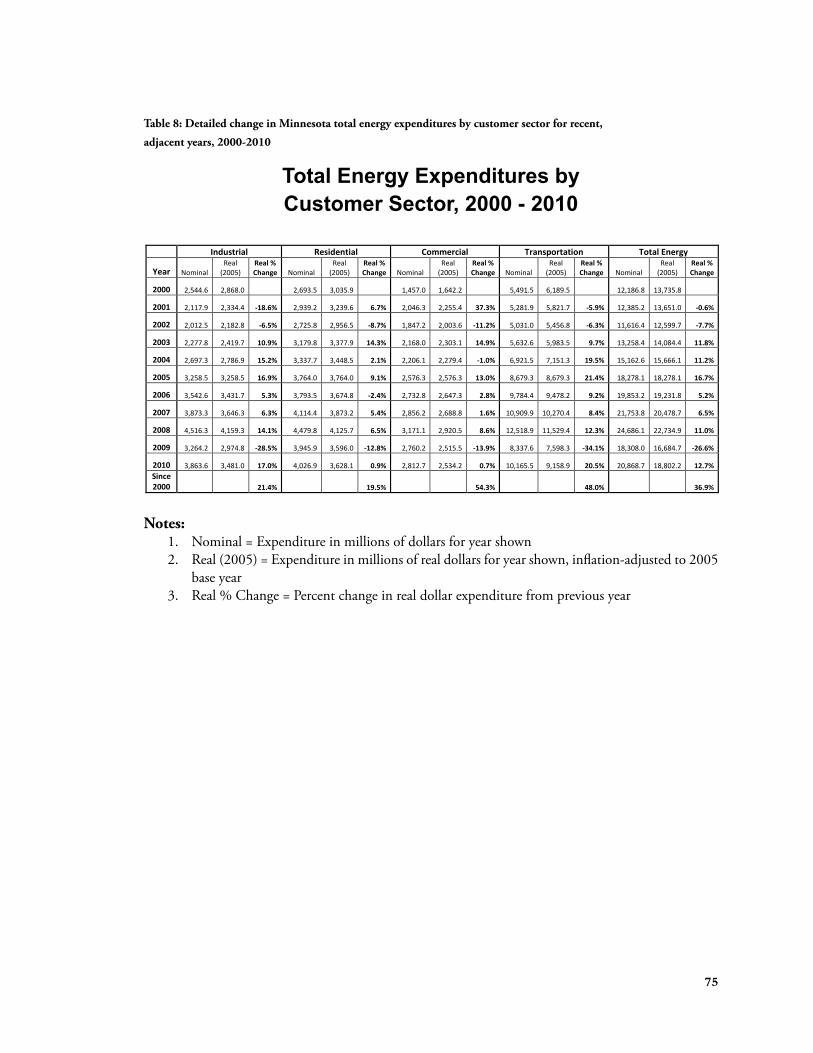
Total Energy Expenditures by Customer Sector, 2000 - 2010
Notes:Nominal = Expenditure in millions of dollars for year shownReal (2005) = Expenditure in millions of real dollars for year shown, inflation-adjusted to 2005 base yearReal % Change = Percent change in real dollar expenditure from previous year
Table 8: Detailed change in Minnesota total energy expenditures by customer sector for recent,
adjacent years, 2000-2010
Total Energy Expenditures by Customer Sector, 2000 - 2010
Industrial Residential Commercial Transportation Total Energy
Year Nominal Real
(2005) Real % Change Nominal
Real (2005)
Real % Change Nominal
Real (2005)
Real % Change Nominal
Real (2005)
Real % Change Nominal
Real (2005)
Real % Change
2000 2,544.6 2,868.0 2,693.5 3,035.9 1,457.0 1,642.2 5,491.5 6,189.5 12,186.8 13,735.8
2001 2,117.9 2,334.4 -18.6% 2,939.2 3,239.6 6.7% 2,046.3 2,255.4 37.3% 5,281.9 5,821.7 -5.9% 12,385.2 13,651.0 -0.6%
2002 2,012.5 2,182.8 -6.5% 2,725.8 2,956.5 -8.7% 1,847.2 2,003.6 -11.2% 5,031.0 5,456.8 -6.3% 11,616.4 12,599.7 -7.7%
2003 2,277.8 2,419.7 10.9% 3,179.8 3,377.9 14.3% 2,168.0 2,303.1 14.9% 5,632.6 5,983.5 9.7% 13,258.4 14,084.4 11.8%
2004 2,697.3 2,786.9 15.2% 3,337.7 3,448.5 2.1% 2,206.1 2,279.4 -1.0% 6,921.5 7,151.3 19.5% 15,162.6 15,666.1 11.2%
2005 3,258.5 3,258.5 16.9% 3,764.0 3,764.0 9.1% 2,576.3 2,576.3 13.0% 8,679.3 8,679.3 21.4% 18,278.1 18,278.1 16.7%
2006 3,542.6 3,431.7 5.3% 3,793.5 3,674.8 -2.4% 2,732.8 2,647.3 2.8% 9,784.4 9,478.2 9.2% 19,853.2 19,231.8 5.2%
2007 3,873.3 3,646.3 6.3% 4,114.4 3,873.2 5.4% 2,856.2 2,688.8 1.6% 10,909.9 10,270.4 8.4% 21,753.8 20,478.7 6.5%
2008 4,516.3 4,159.3 14.1% 4,479.8 4,125.7 6.5% 3,171.1 2,920.5 8.6% 12,518.9 11,529.4 12.3% 24,686.1 22,734.9 11.0%
2009 3,264.2 2,974.8 -28.5% 3,945.9 3,596.0 -12.8% 2,760.2 2,515.5 -13.9% 8,337.6 7,598.3 -34.1% 18,308.0 16,684.7 -26.6%
2010 3,863.6 3,481.0 17.0% 4,026.9 3,628.1 0.9% 2,812.7 2,534.2 0.7% 10,165.5 9,158.9 20.5% 20,868.7 18,802.2 12.7% Since 2000 21.4% 19.5% 54.3% 48.0% 36.9%
Notes: 1. Nominal = Expenditure in millions of dollars for year shown 2. Real (2005) = Expenditure in millions of real dollars for year shown, inflation-adjusted to 2005
base year 3. Real % Change = Percent change in real dollar expenditure from previous year
75
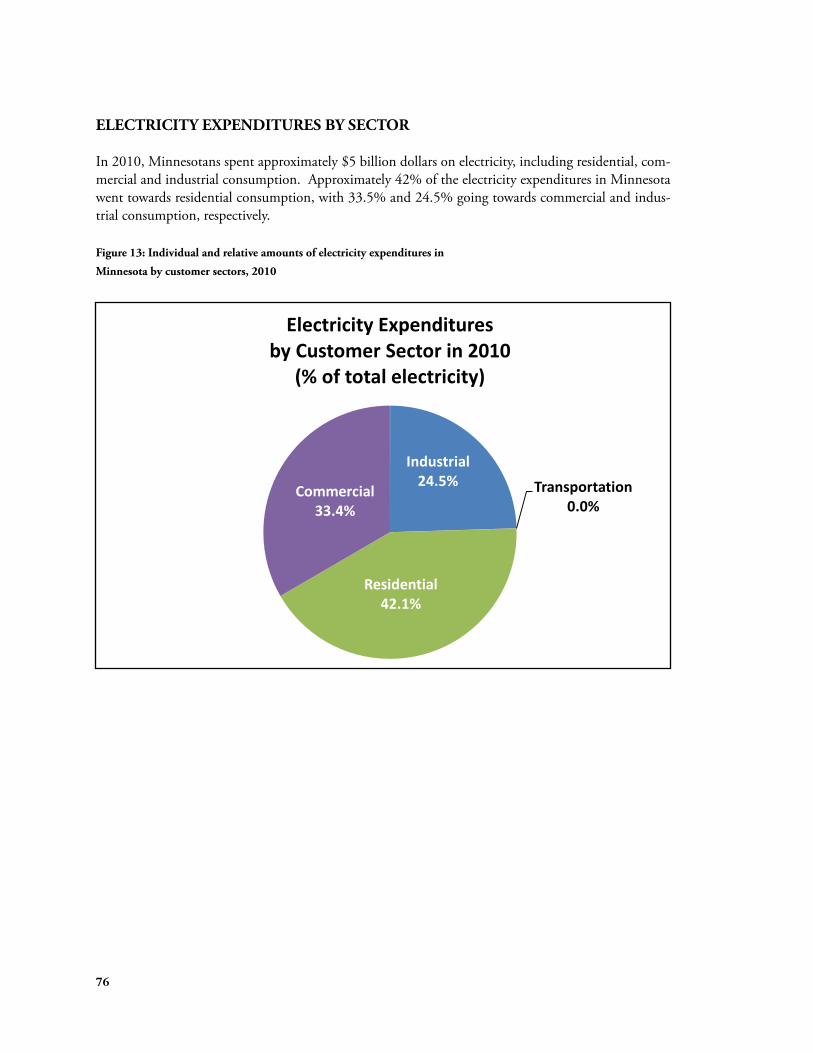
ELECTRICITY EXPENDITURES BY SECTOR
In 2010, Minnesotans spent approximately $5 billion dollars on electricity, including residential, commercial and industrial consumption. Approximately 42% of the electricity expenditures in Minnesota went towards residential consumption, with 33.5% and 24.5% going towards commercial and industrial consumption, respectively.
Figure 13: Individual and relative amounts of electricity expenditures in
Minnesota by customer sectors, 2010
Industrial 24.5%
Residential 42.1%
Commercial 33.4%
Electricity Expenditures by Customer Sector in 2010
(% of total electricity)
Transportation 0.0%
76
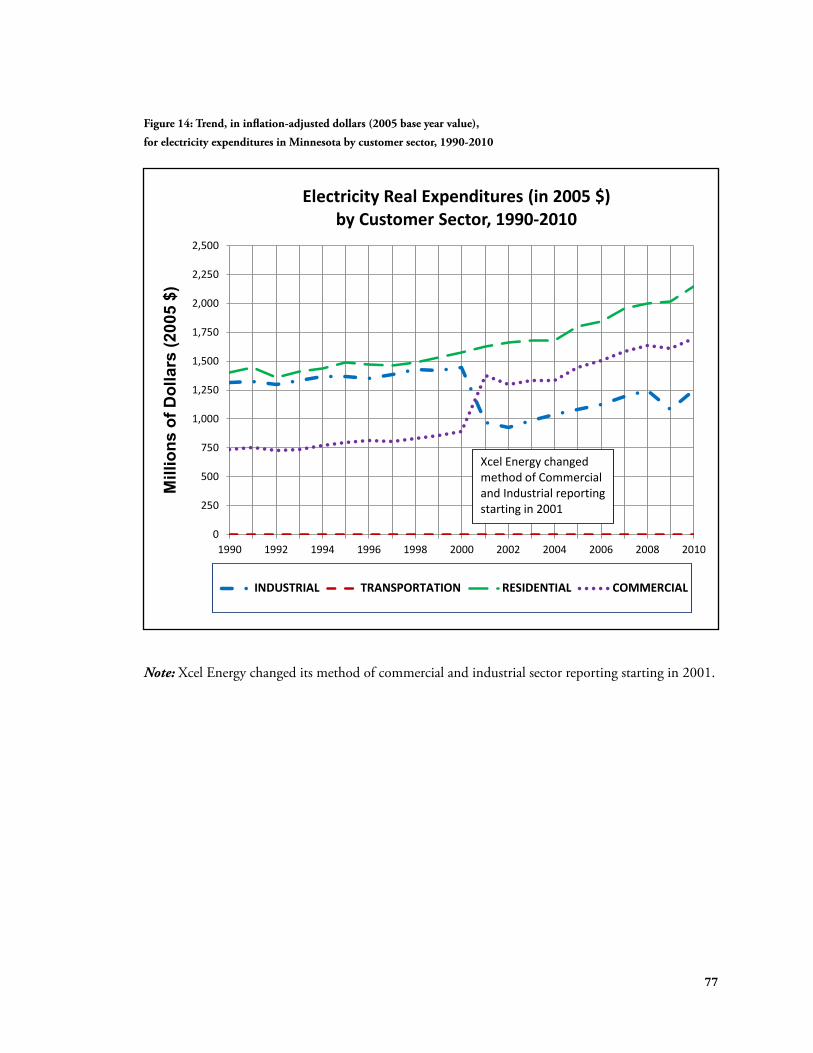
Figure 14: Trend, in inflation-adjusted dollars (2005 base year value),
for electricity expenditures in Minnesota by customer sector, 1990-2010
0
250
500
750
1,000
1,250
1,500
1,750
2,000
2,250
2,500
1990 1992 1994 1996 1998 2000 2002 2004 2006 2008 2010
Mill
ions
of D
olla
rs (2
005
$)
Electricity Real Expenditures (in 2005 $) by Customer Sector, 1990-2010
INDUSTRIAL TRANSPORTATION RESIDENTIAL COMMERCIAL
Xcel Energy changed method of Commercial and Industrial reporting starting in 2001
Note: Xcel Energy changed its method of commercial and industrial sector reporting starting in 2001.
77
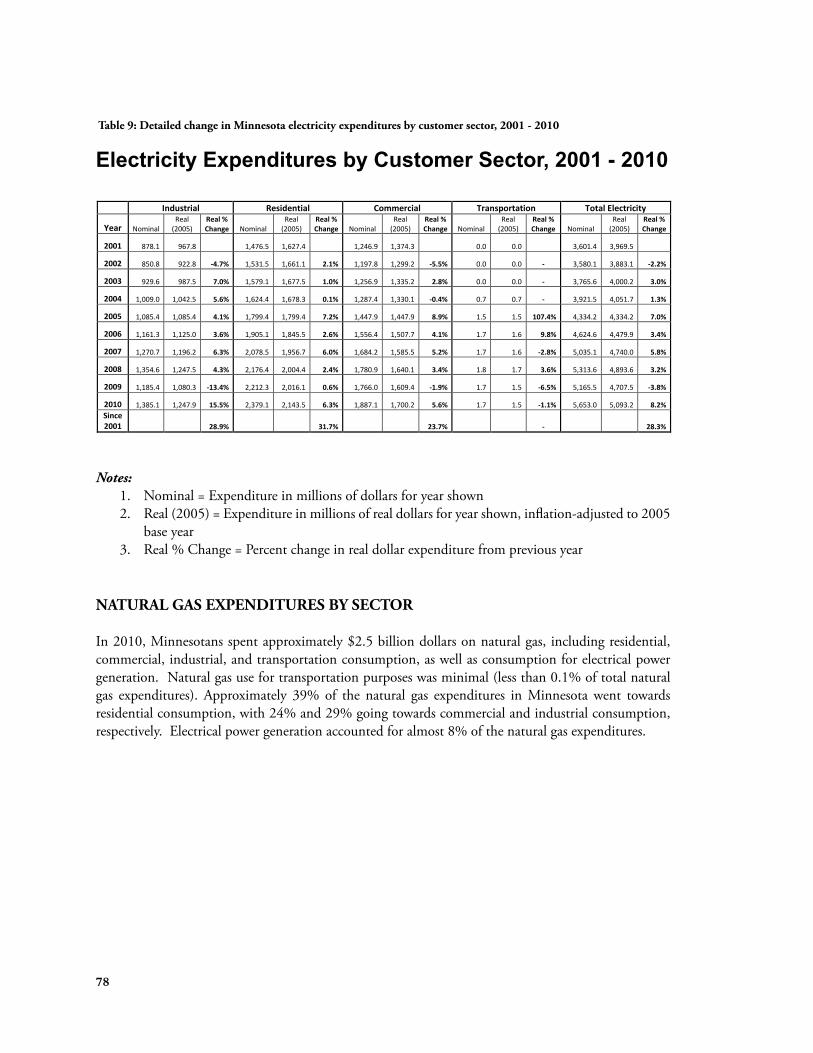
Electricity Expenditures by Customer Sector, 2001 - 2010
Notes:Nominal = Expenditure in millions of dollars for year shownReal (2005) = Expenditure in millions of real dollars for year shown, inflation-adjusted to 2005 base yearReal % Change = Percent change in real dollar expenditure from previous year
Table 9: Detailed change in Minnesota electricity expenditures by customer sector, 2001 - 2010
Electricity Expenditures by Customer Sector, 2001 - 2010
Industrial Residential Commercial Transportation Total Electricity
Year Nominal Real
(2005) Real % Change Nominal
Real (2005)
Real % Change Nominal
Real (2005)
Real % Change Nominal
Real (2005)
Real % Change Nominal
Real (2005)
Real % Change
2001 878.1 967.8 1,476.5 1,627.4 1,246.9 1,374.3 0.0 0.0 3,601.4 3,969.5
2002 850.8 922.8 -4.7% 1,531.5 1,661.1 2.1% 1,197.8 1,299.2 -5.5% 0.0 0.0 - 3,580.1 3,883.1 -2.2%
2003 929.6 987.5 7.0% 1,579.1 1,677.5 1.0% 1,256.9 1,335.2 2.8% 0.0 0.0 - 3,765.6 4,000.2 3.0%
2004 1,009.0 1,042.5 5.6% 1,624.4 1,678.3 0.1% 1,287.4 1,330.1 -0.4% 0.7 0.7 - 3,921.5 4,051.7 1.3%
2005 1,085.4 1,085.4 4.1% 1,799.4 1,799.4 7.2% 1,447.9 1,447.9 8.9% 1.5 1.5 107.4% 4,334.2 4,334.2 7.0%
2006 1,161.3 1,125.0 3.6% 1,905.1 1,845.5 2.6% 1,556.4 1,507.7 4.1% 1.7 1.6 9.8% 4,624.6 4,479.9 3.4%
2007 1,270.7 1,196.2 6.3% 2,078.5 1,956.7 6.0% 1,684.2 1,585.5 5.2% 1.7 1.6 -2.8% 5,035.1 4,740.0 5.8%
2008 1,354.6 1,247.5 4.3% 2,176.4 2,004.4 2.4% 1,780.9 1,640.1 3.4% 1.8 1.7 3.6% 5,313.6 4,893.6 3.2%
2009 1,185.4 1,080.3 -13.4% 2,212.3 2,016.1 0.6% 1,766.0 1,609.4 -1.9% 1.7 1.5 -6.5% 5,165.5 4,707.5 -3.8%
2010 1,385.1 1,247.9 15.5% 2,379.1 2,143.5 6.3% 1,887.1 1,700.2 5.6% 1.7 1.5 -1.1% 5,653.0 5,093.2 8.2% Since 2001 28.9% 31.7% 23.7% - 28.3%
Notes: 1. Nominal = Expenditure in millions of dollars for year shown 2. Real (2005) = Expenditure in millions of real dollars for year shown, inflation-adjusted to 2005
base year 3. Real % Change = Percent change in real dollar expenditure from previous year
NATURAL GAS EXPENDITURES BY SECTOR
In 2010, Minnesotans spent approximately $2.5 billion dollars on natural gas, including residential, commercial, industrial, and transportation consumption, as well as consumption for electrical power generation. Natural gas use for transportation purposes was minimal (less than 0.1% of total natural gas expenditures). Approximately 39% of the natural gas expenditures in Minnesota went towards residential consumption, with 24% and 29% going towards commercial and industrial consumption, respectively. Electrical power generation accounted for almost 8% of the natural gas expenditures.
78
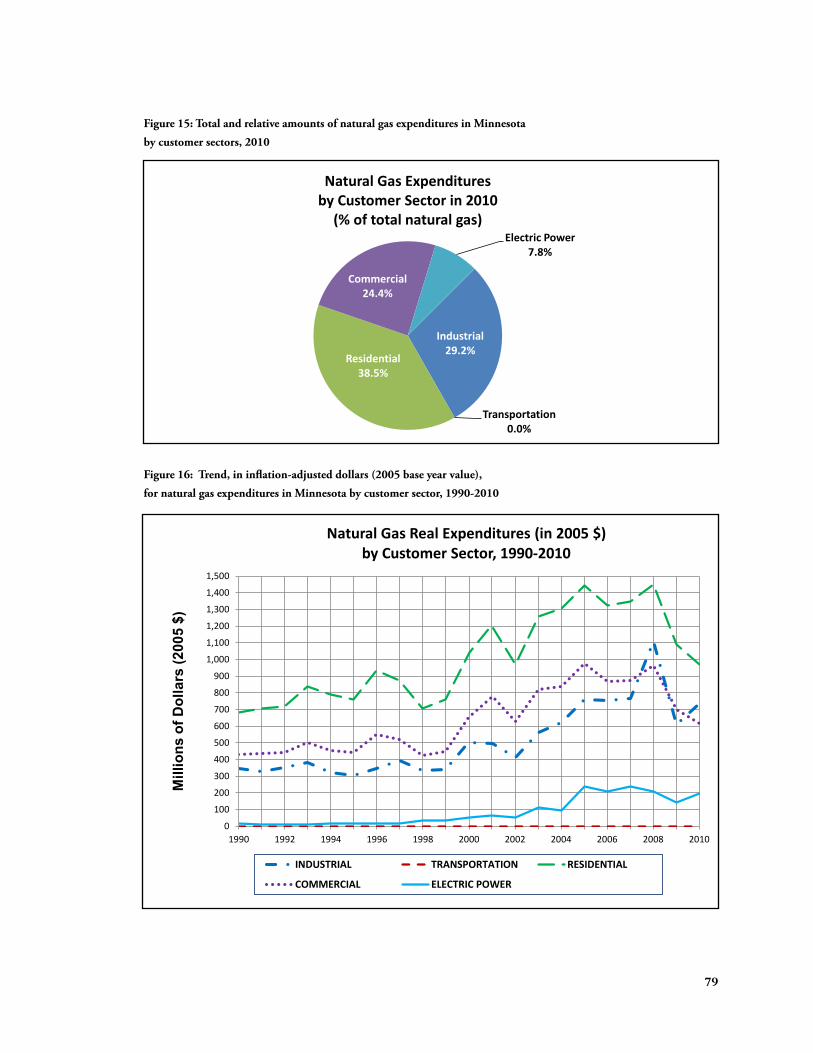
Industrial 29.2%
Transportation 0.0%
Commercial 24.4%
Electric Power 7.8%
Figure 15: Total and relative amounts of natural gas expenditures in Minnesota
by customer sectors, 2010
Natural Gas Expenditures by Customer Sector in 2010
(% of total natural gas)
Residential 38.5%
Figure 16: Trend, in inflation-adjusted dollars (2005 base year value),
for natural gas expenditures in Minnesota by customer sector, 1990-2010
0
100
200
300
400
500
600
700
800
900
1,000
1,100
1,200
1,300
1,400
1,500
1990 1992 1994 1996 1998 2000 2002 2004 2006 2008 2010
Mill
ions
of D
olla
rs (2
005
$)
Natural Gas Real Expenditures (in 2005 $) by Customer Sector, 1990-2010
INDUSTRIAL TRANSPORTATION RESIDENTIAL
COMMERCIAL ELECTRIC POWER
79
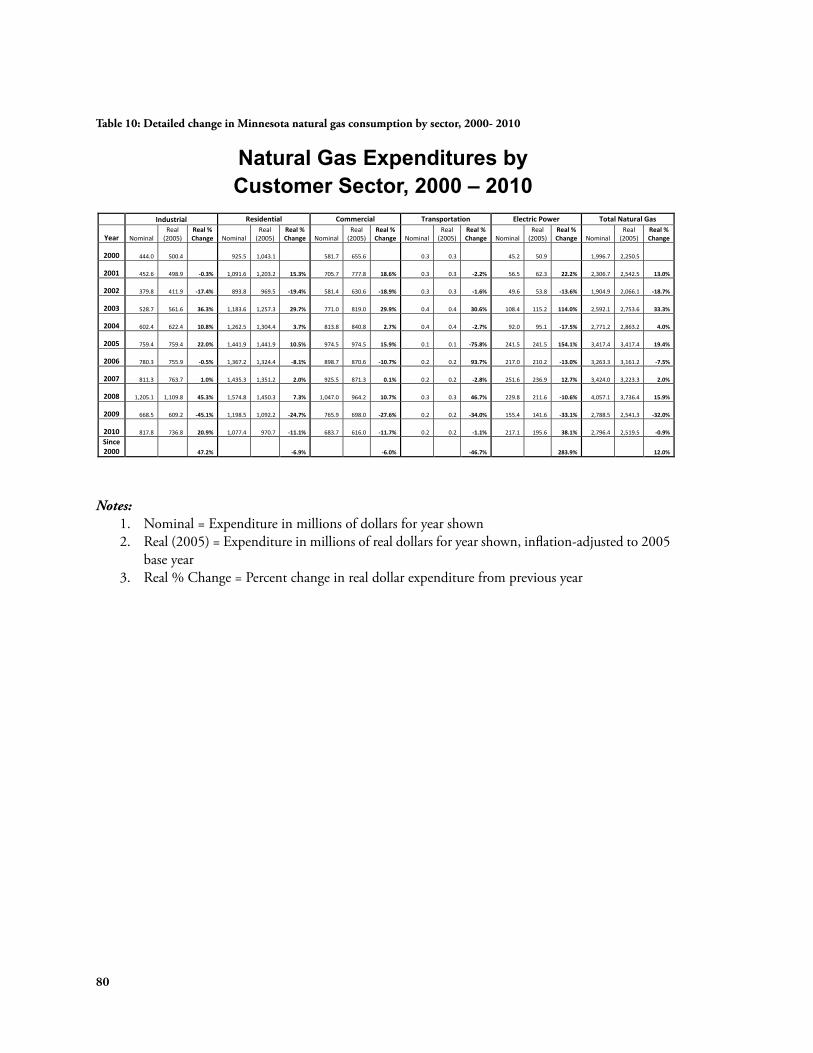
Natural Gas Expenditures by Customer Sector, 2000 – 2010
Notes:Nominal = Expenditure in millions of dollars for year shownReal (2005) = Expenditure in millions of real dollars for year shown, inflation-adjusted to 2005 base yearReal % Change = Percent change in real dollar expenditure from previous year
Table 10: Detailed change in Minnesota natural gas consumption by sector, 2000- 2010
Natural Gas Expenditures by Customer Sector, 2000 – 2010
Industrial Residential Commercial Transportation Electric Power Total Natural Gas
Year Nominal Real
(2005) Real % Change Nominal
Real (2005)
Real % Change Nominal
Real (2005)
Real % Change Nominal
Real (2005)
Real % Change Nominal
Real (2005)
Real % Change Nominal
Real (2005)
Real % Change
2000 444.0 500.4 925.5 1,043.1 581.7 655.6 0.3 0.3 45.2 50.9 1,996.7 2,250.5
2001 452.6 498.9 -0.3% 1,091.6 1,203.2 15.3% 705.7 777.8 18.6% 0.3 0.3 -2.2% 56.5 62.3 22.2% 2,306.7 2,542.5 13.0%
2002 379.8 411.9 -17.4% 893.8 969.5 -19.4% 581.4 630.6 -18.9% 0.3 0.3 -1.6% 49.6 53.8 -13.6% 1,904.9 2,066.1 -18.7%
2003 528.7 561.6 36.3% 1,183.6 1,257.3 29.7% 771.0 819.0 29.9% 0.4 0.4 30.6% 108.4 115.2 114.0% 2,592.1 2,753.6 33.3%
2004 602.4 622.4 10.8% 1,262.5 1,304.4 3.7% 813.8 840.8 2.7% 0.4 0.4 -2.7% 92.0 95.1 -17.5% 2,771.2 2,863.2 4.0%
2005 759.4 759.4 22.0% 1,441.9 1,441.9 10.5% 974.5 974.5 15.9% 0.1 0.1 -75.8% 241.5 241.5 154.1% 3,417.4 3,417.4 19.4%
2006 780.3 755.9 -0.5% 1,367.2 1,324.4 -8.1% 898.7 870.6 -10.7% 0.2 0.2 93.7% 217.0 210.2 -13.0% 3,263.3 3,161.2 -7.5%
2007 811.3 763.7 1.0% 1,435.3 1,351.2 2.0% 925.5 871.3 0.1% 0.2 0.2 -2.8% 251.6 236.9 12.7% 3,424.0 3,223.3 2.0%
2008 1,205.1 1,109.8 45.3% 1,574.8 1,450.3 7.3% 1,047.0 964.2 10.7% 0.3 0.3 46.7% 229.8 211.6 -10.6% 4,057.1 3,736.4 15.9%
2009 668.5 609.2 -45.1% 1,198.5 1,092.2 -24.7% 765.9 698.0 -27.6% 0.2 0.2 -34.0% 155.4 141.6 -33.1% 2,788.5 2,541.3 -32.0%
2010 817.8 736.8 20.9% 1,077.4 970.7 -11.1% 683.7 616.0 -11.7% 0.2 0.2 -1.1% 217.1 195.6 38.1% 2,796.4 2,519.5 -0.9% Since 2000 47.2% -6.9% -6.0% -46.7% 283.9% 12.0%
Notes: 1. Nominal = Expenditure in millions of dollars for year shown 2. Real (2005) = Expenditure in millions of real dollars for year shown, inflation-adjusted to 2005
base year 3. Real % Change = Percent change in real dollar expenditure from previous year
80
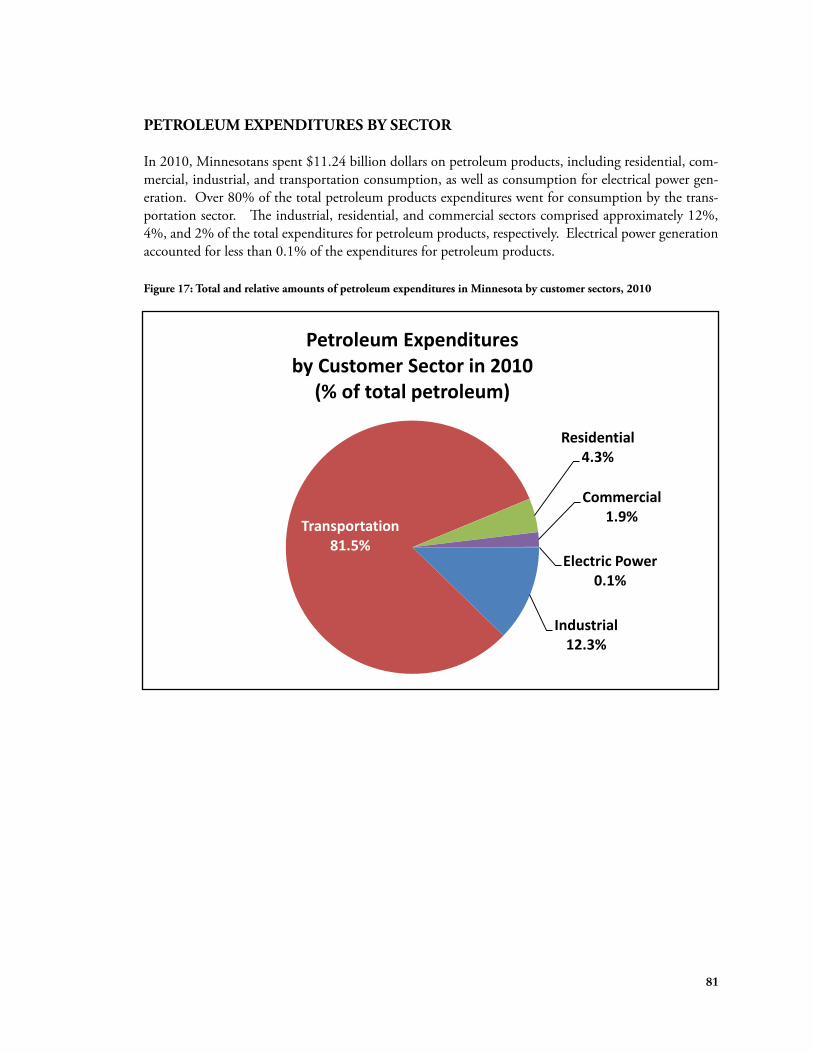
PETROLEUM EXPENDITURES BY SECTOR
In 2010, Minnesotans spent $11.24 billion dollars on petroleum products, including residential, commercial, industrial, and transportation consumption, as well as consumption for electrical power generation. Over 80% of the total petroleum products expenditures went for consumption by the transportation sector. The industrial, residential, and commercial sectors comprised approximately 12%, 4%, and 2% of the total expenditures for petroleum products, respectively. Electrical power generation accounted for less than 0.1% of the expenditures for petroleum products.
Figure 17: Total and relative amounts of petroleum expenditures in Minnesota by customer sectors, 2010
Petroleum Expenditures by Customer Sector in 2010
(% of total petroleum)
Residential 4.3%
Industrial 12.3%
Transportation 81.5%
Commercial 1.9%
Electric Power 0.1%
81
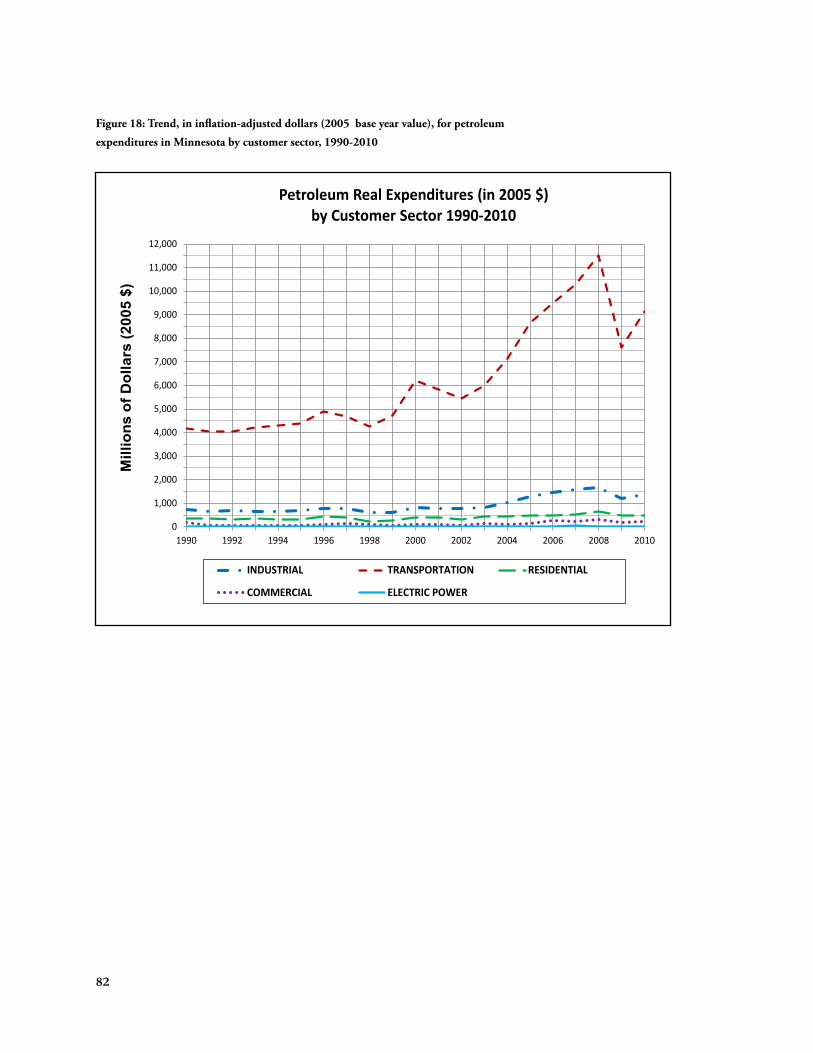
Figure 18: Trend, in inflation-adjusted dollars (2005 base year value), for petroleum
expenditures in Minnesota by customer sector, 1990-2010
0
1,000
2,000
3,000
4,000
5,000
6,000
7,000
8,000
9,000
10,000
11,000
12,000
1990 1992 1994 1996 1998 2000 2002 2004 2006 2008 2010
Mill
ions
of D
olla
rs (2
005
$)
Petroleum Real Expenditures (in 2005 $) by Customer Sector 1990-2010
INDUSTRIAL TRANSPORTATION RESIDENTIAL
COMMERCIAL ELECTRIC POWER
82
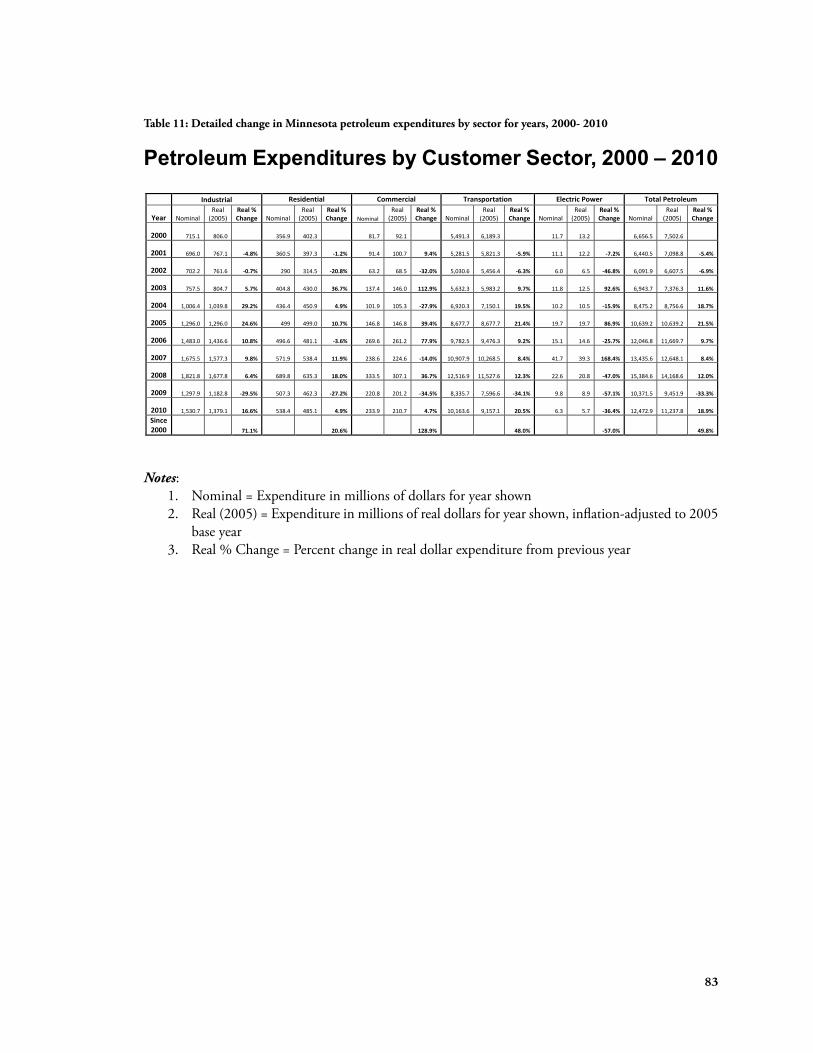
Petroleum Expenditures by Customer Sector, 2000 – 2010
Notes:Nominal = Expenditure in millions of dollars for year shownReal (2005) = Expenditure in millions of real dollars for year shown, inflation-adjusted to 2005 base yearReal % Change = Percent change in real dollar expenditure from previous year
Table 11: Detailed change in Minnesota petroleum expenditures by sector for years, 2000- 2010
Petroleum Expenditures by Customer Sector, 2000 – 2010
Industrial Residential Commercial Transportation Electric Power Total Petroleum
Year Nominal Real
(2005) Real % Change Nominal
Real (2005)
Real % Change Nominal
Real (2005)
Real % Change Nominal
Real (2005)
Real % Change Nominal
Real (2005)
Real % Change Nominal
Real (2005)
Real % Change
2000 715.1 806.0 356.9 402.3 81.7 92.1 5,491.3 6,189.3 11.7 13.2 6,656.5 7,502.6
2001 696.0 767.1 -4.8% 360.5 397.3 -1.2% 91.4 100.7 9.4% 5,281.5 5,821.3 -5.9% 11.1 12.2 -7.2% 6,440.5 7,098.8 -5.4%
2002 702.2 761.6 -0.7% 290 314.5 -20.8% 63.2 68.5 -32.0% 5,030.6 5,456.4 -6.3% 6.0 6.5 -46.8% 6,091.9 6,607.5 -6.9%
2003 757.5 804.7 5.7% 404.8 430.0 36.7% 137.4 146.0 112.9% 5,632.3 5,983.2 9.7% 11.8 12.5 92.6% 6,943.7 7,376.3 11.6%
2004 1,006.4 1,039.8 29.2% 436.4 450.9 4.9% 101.9 105.3 -27.9% 6,920.3 7,150.1 19.5% 10.2 10.5 -15.9% 8,475.2 8,756.6 18.7%
2005 1,296.0 1,296.0 24.6% 499 499.0 10.7% 146.8 146.8 39.4% 8,677.7 8,677.7 21.4% 19.7 19.7 86.9% 10,639.2 10,639.2 21.5%
2006 1,483.0 1,436.6 10.8% 496.6 481.1 -3.6% 269.6 261.2 77.9% 9,782.5 9,476.3 9.2% 15.1 14.6 -25.7% 12,046.8 11,669.7 9.7%
2007 1,675.5 1,577.3 9.8% 571.9 538.4 11.9% 238.6 224.6 -14.0% 10,907.9 10,268.5 8.4% 41.7 39.3 168.4% 13,435.6 12,648.1 8.4%
2008 1,821.8 1,677.8 6.4% 689.8 635.3 18.0% 333.5 307.1 36.7% 12,516.9 11,527.6 12.3% 22.6 20.8 -47.0% 15,384.6 14,168.6 12.0%
2009 1,297.9 1,182.8 -29.5% 507.3 462.3 -27.2% 220.8 201.2 -34.5% 8,335.7 7,596.6 -34.1% 9.8 8.9 -57.1% 10,371.5 9,451.9 -33.3%
2010 1,530.7 1,379.1 16.6% 538.4 485.1 4.9% 233.9 210.7 4.7% 10,163.6 9,157.1 20.5% 6.3 5.7 -36.4% 12,472.9 11,237.8 18.9% Since 2000 71.1% 20.6% 128.9% 48.0% -57.0% 49.8%
Notes: 1. Nominal = Expenditure in millions of dollars for year shown 2. Real (2005) = Expenditure in millions of real dollars for year shown, inflation-adjusted to 2005
base year 3. Real % Change = Percent change in real dollar expenditure from previous year
83
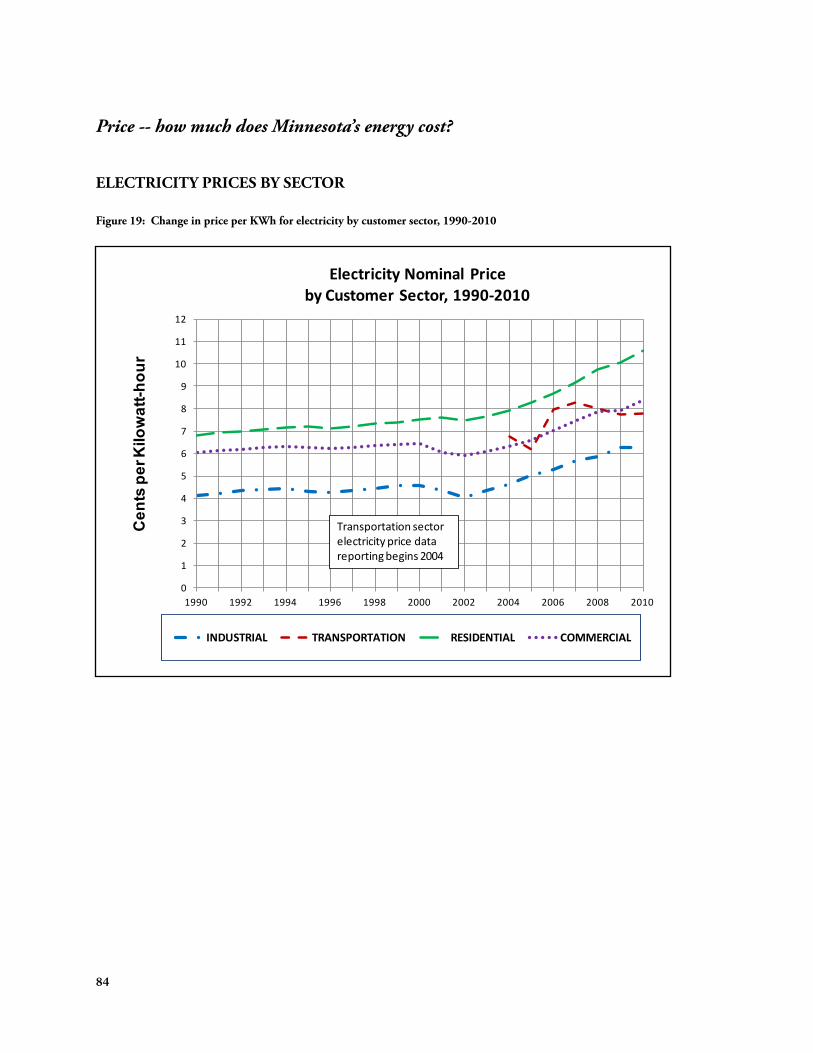
Price -- how much does Minnesota’s energy cost?
ELECTRICITY PRICES BY SECTOR
Figure 19: Change in price per KWh for electricity by customer sector, 1990-2010
0
1
2
3
4
5
6
7
8
9
10
11
12
1990 1992 1994 1996 1998 2000 2002 2004 2006 2008 2010
Cen
ts p
er K
ilow
att-h
our
Electricity Nominal Price by Customer Sector, 1990-2010
INDUSTRIAL TRANSPORTATION RESIDENTIAL COMMERCIAL
Transportation sector electricity price data reporting begins 2004
84
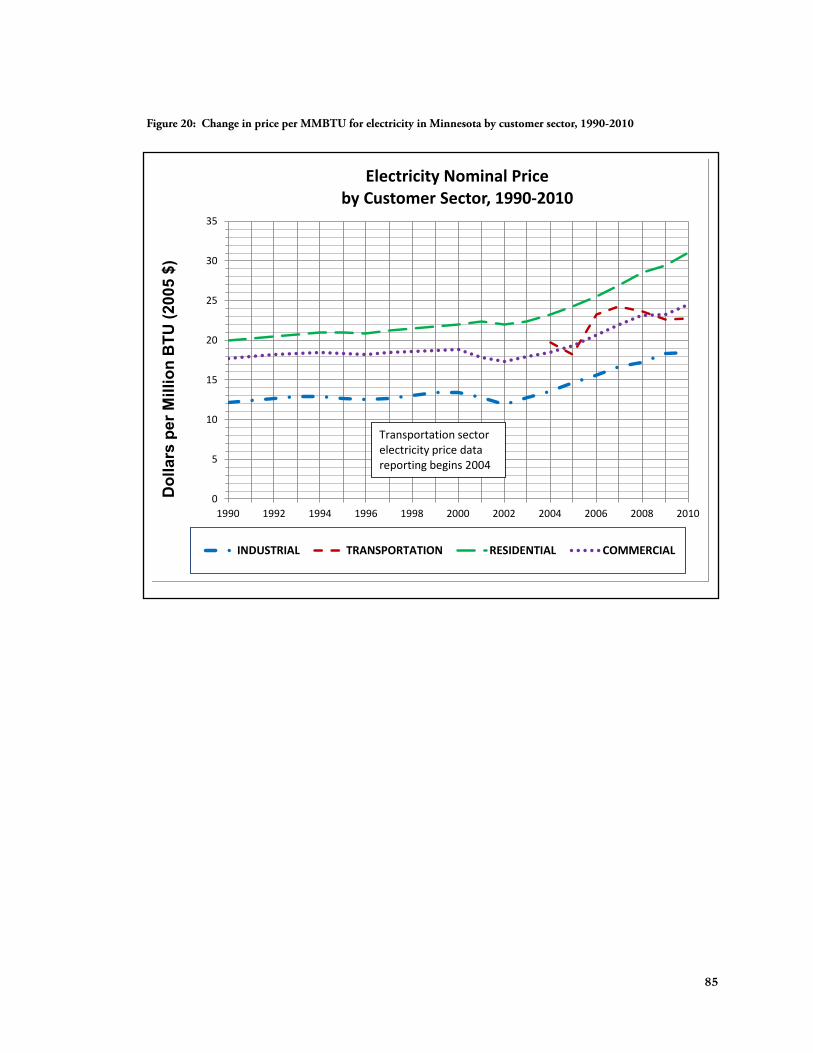
Figure 20: Change in price per MMBTU for electricity in Minnesota by customer sector, 1990-2010
0
5
10
15
20
25
30
35
1990 1992 1994 1996 1998 2000 2002 2004 2006 2008 2010
Dol
lars
per
Mill
ion
BTU
(200
5 $)
Electricity Nominal Price
by Customer Sector, 1990-2010
INDUSTRIAL TRANSPORTATION RESIDENTIAL COMMERCIAL
Transportation sector electricity price data reporting begins 2004
85
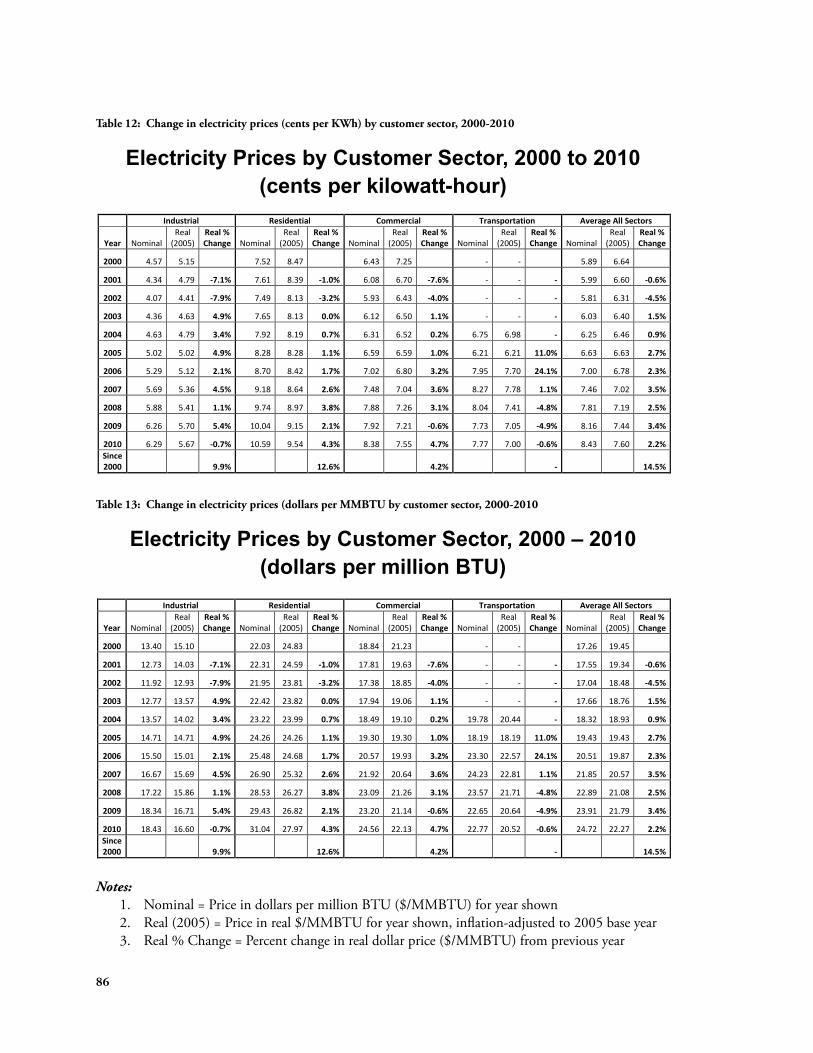
Electricity Prices by Customer Sector, 2000 to 2010(cents per kilowatt-hour)
Notes:Nominal = Price in cents per kilowatt-hour (cents/KWH) for year shownReal (2005) = Price in real cents/KWH for year shown, inflation-adjusted to 2005 base yearReal % Change = Percent change in real dollar price (cents/KWH) from previous year
Electricity Prices by Customer Sector, 2000 – 2010(dollars per million BTU)
Notes:Nominal = Price in dollars per million BTU ($/MMBTU) for year shownReal (2005) = Price in real $/MMBTU for year shown, inflation-adjusted to 2005 base yearReal % Change = Percent change in real dollar price ($/MMBTU) from previous year
Table 12: Change in electricity prices (cents per KWh) by customer sector, 2000-2010
Electricity Prices by Customer Sector, 2000 to 2010 (cents per kilowatt-hour)
Industrial Residential Commercial Transportation Average All Sectors
Year Nominal Real
(2005) Real % Change Nominal
Real (2005)
Real % Change Nominal
Real (2005)
Real % Change Nominal
Real (2005)
Real % Change Nominal
Real (2005)
Real % Change
2000 4.57 5.15 7.52 8.47 6.43 7.25 - - 5.89 6.64
2001 4.34 4.79 -7.1% 7.61 8.39 -1.0% 6.08 6.70 -7.6% - - - 5.99 6.60 -0.6%
2002 4.07 4.41 -7.9% 7.49 8.13 -3.2% 5.93 6.43 -4.0% - - - 5.81 6.31 -4.5%
2003 4.36 4.63 4.9% 7.65 8.13 0.0% 6.12 6.50 1.1% - - - 6.03 6.40 1.5%
2004 4.63 4.79 3.4% 7.92 8.19 0.7% 6.31 6.52 0.2% 6.75 6.98 - 6.25 6.46 0.9%
2005 5.02 5.02 4.9% 8.28 8.28 1.1% 6.59 6.59 1.0% 6.21 6.21 11.0% 6.63 6.63 2.7%
2006 5.29 5.12 2.1% 8.70 8.42 1.7% 7.02 6.80 3.2% 7.95 7.70 24.1% 7.00 6.78 2.3%
2007 5.69 5.36 4.5% 9.18 8.64 2.6% 7.48 7.04 3.6% 8.27 7.78 1.1% 7.46 7.02 3.5%
2008 5.88 5.41 1.1% 9.74 8.97 3.8% 7.88 7.26 3.1% 8.04 7.41 -4.8% 7.81 7.19 2.5%
2009 6.26 5.70 5.4% 10.04 9.15 2.1% 7.92 7.21 -0.6% 7.73 7.05 -4.9% 8.16 7.44 3.4%
2010 6.29 5.67 -0.7% 10.59 9.54 4.3% 8.38 7.55 4.7% 7.77 7.00 -0.6% 8.43 7.60 2.2% Since 2000 9.9% 12.6% 4.2% - 14.5%
Table 13: Change in electricity prices (dollars per MMBTU by customer sector, 2000-2010
Electricity Prices by Customer Sector, 2000 – 2010 (dollars per million BTU)
Industrial Residential Commercial Transportation Average All Sectors
Year Nominal Real
(2005) Real % Change Nominal
Real (2005)
Real % Change Nominal
Real (2005)
Real % Change Nominal
Real (2005)
Real % Change Nominal
Real (2005)
Real % Change
2000 13.40 15.10 22.03 24.83 18.84 21.23 - - 17.26 19.45
2001 12.73 14.03 -7.1% 22.31 24.59 -1.0% 17.81 19.63 -7.6% - - - 17.55 19.34 -0.6%
2002 11.92 12.93 -7.9% 21.95 23.81 -3.2% 17.38 18.85 -4.0% - - - 17.04 18.48 -4.5%
2003 12.77 13.57 4.9% 22.42 23.82 0.0% 17.94 19.06 1.1% - - - 17.66 18.76 1.5%
2004 13.57 14.02 3.4% 23.22 23.99 0.7% 18.49 19.10 0.2% 19.78 20.44 - 18.32 18.93 0.9%
2005 14.71 14.71 4.9% 24.26 24.26 1.1% 19.30 19.30 1.0% 18.19 18.19 11.0% 19.43 19.43 2.7%
2006 15.50 15.01 2.1% 25.48 24.68 1.7% 20.57 19.93 3.2% 23.30 22.57 24.1% 20.51 19.87 2.3%
2007 16.67 15.69 4.5% 26.90 25.32 2.6% 21.92 20.64 3.6% 24.23 22.81 1.1% 21.85 20.57 3.5%
2008 17.22 15.86 1.1% 28.53 26.27 3.8% 23.09 21.26 3.1% 23.57 21.71 -4.8% 22.89 21.08 2.5%
2009 18.34 16.71 5.4% 29.43 26.82 2.1% 23.20 21.14 -0.6% 22.65 20.64 -4.9% 23.91 21.79 3.4%
2010 18.43 16.60 -0.7% 31.04 27.97 4.3% 24.56 22.13 4.7% 22.77 20.52 -0.6% 24.72 22.27 2.2% Since 2000 9.9% 12.6% 4.2% - 14.5%
Notes: 1. Nominal = Price in dollars per million BTU ($/MMBTU) for year shown 2. Real (2005) = Price in real $/MMBTU for year shown, inflation-adjusted to 2005 base year 3. Real % Change = Percent change in real dollar price ($/MMBTU) from previous year
86
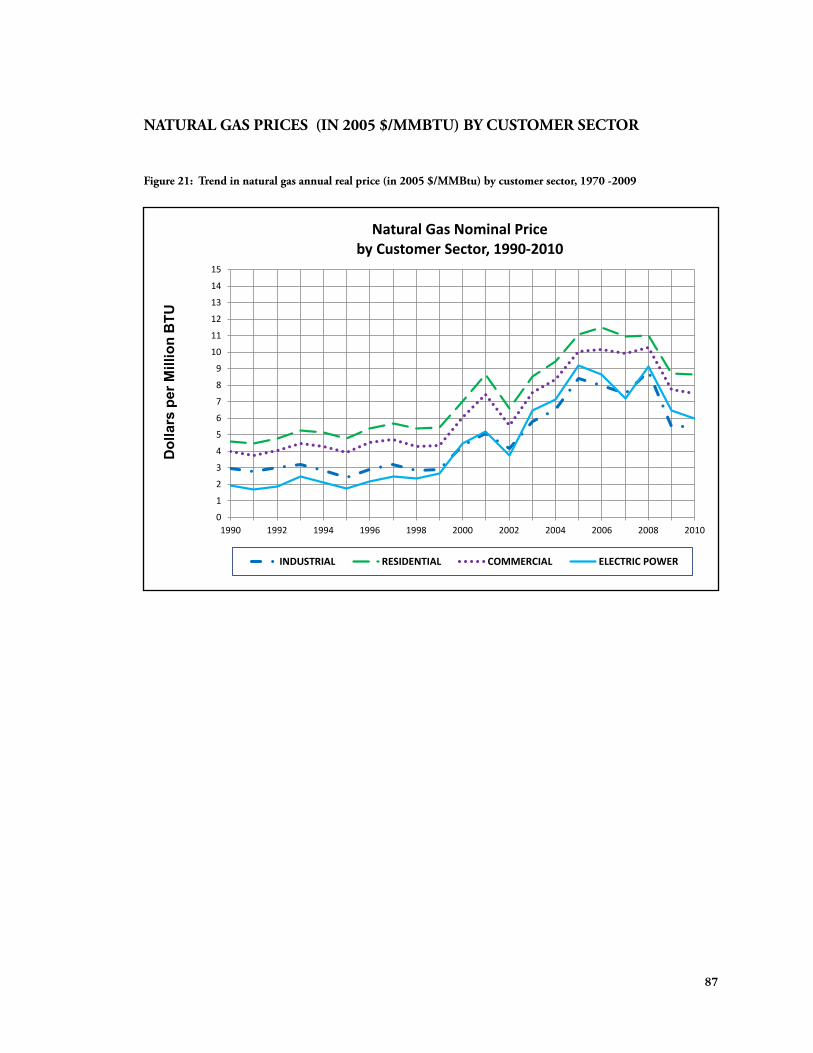
NATURAL GAS PRICES (IN 2005 $/MMBTU) BY CUSTOMER SECTOR
Figure 21: Trend in natural gas annual real price (in 2005 $/MMBtu) by customer sector, 1970 -2009
0
1
2
3
4
5
6
7
8
9
10
11
12
13
14
15
1990 1992 1994 1996 1998 2000 2002 2004 2006 2008 2010
Dol
lars
per
Mill
ion
BTU
Natural Gas Nominal Price by Customer Sector, 1990-2010
INDUSTRIAL RESIDENTIAL COMMERCIAL ELECTRIC POWER
87
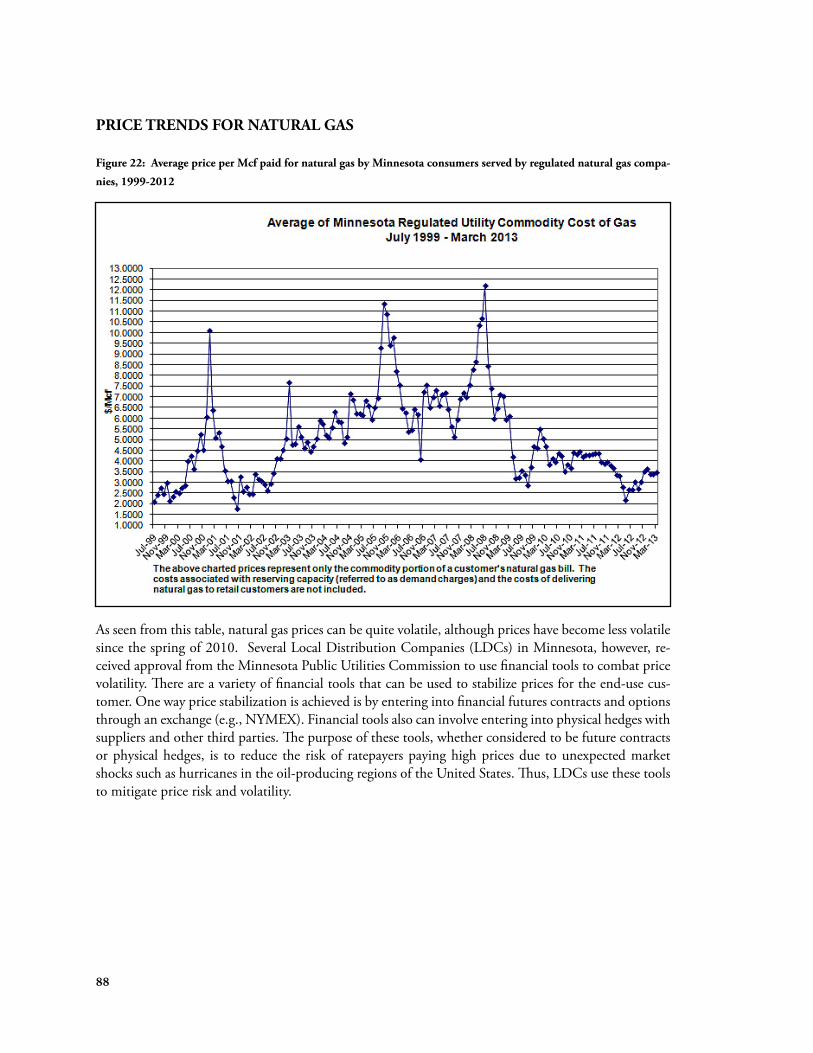
PRICE TRENDS FOR NATURAL GAS
Figure 22: Average price per Mcf paid for natural gas by Minnesota consumers served by regulated natural gas compa
nies, 1999-2012
As seen from this table, natural gas prices can be quite volatile, although prices have become less volatile since the spring of 2010. Several Local Distribution Companies (LDCs) in Minnesota, however, received approval from the Minnesota Public Utilities Commission to use financial tools to combat price volatility. There are a variety of financial tools that can be used to stabilize prices for the end-use customer. One way price stabilization is achieved is by entering into financial futures contracts and options through an exchange (e.g., NYMEX). Financial tools also can involve entering into physical hedges with suppliers and other third parties. The purpose of these tools, whether considered to be future contracts or physical hedges, is to reduce the risk of ratepayers paying high prices due to unexpected market shocks such as hurricanes in the oil-producing regions of the United States. Thus, LDCs use these tools to mitigate price risk and volatility.
88
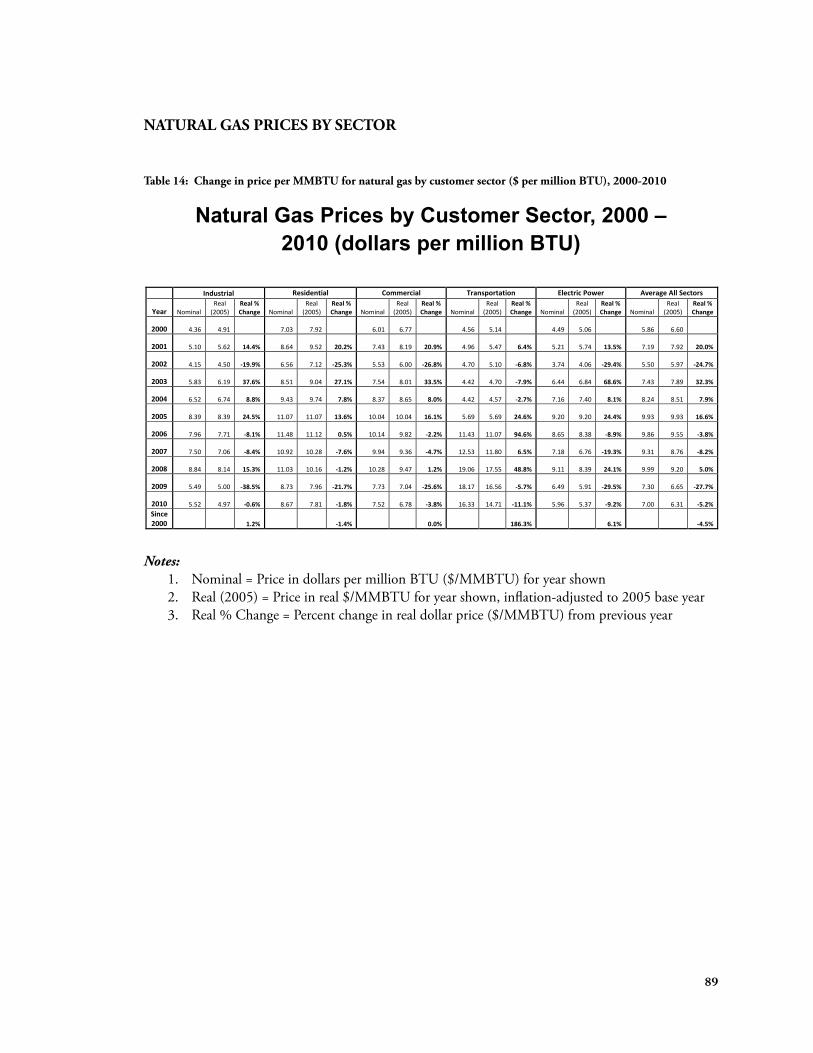
Natural Gas Prices by Customer Sector, 2000 – 2010(dollars per million BTU)
Notes:Nominal = Price in dollars per million BTU ($/MMBTU) for year shownReal (2005) = Price in real $/MMBTU for year shown, inflation-adjusted to 2005 base yearReal % Change = Percent change in real dollar price ($/MMBTU) from previous year
NATURAL GAS PRICES BY SECTOR
Table 14: Change in price per MMBTU for natural gas by customer sector ($ per million BTU), 2000-2010
Natural Gas Prices by Customer Sector, 2000 – 2010 (dollars per million BTU)
Industrial Residential Commercial Transportation Electric Power Average All Sectors
Year Nominal Real
(2005) Real % Change Nominal
Real (2005)
Real % Change Nominal
Real (2005)
Real % Change Nominal
Real (2005)
Real % Change Nominal
Real (2005)
Real % Change Nominal
Real (2005)
Real % Change
2000 4.36 4.91 7.03 7.92 6.01 6.77 4.56 5.14 4.49 5.06 5.86 6.60
2001 5.10 5.62 14.4% 8.64 9.52 20.2% 7.43 8.19 20.9% 4.96 5.47 6.4% 5.21 5.74 13.5% 7.19 7.92 20.0%
2002 4.15 4.50 -19.9% 6.56 7.12 -25.3% 5.53 6.00 -26.8% 4.70 5.10 -6.8% 3.74 4.06 -29.4% 5.50 5.97 -24.7%
2003 5.83 6.19 37.6% 8.51 9.04 27.1% 7.54 8.01 33.5% 4.42 4.70 -7.9% 6.44 6.84 68.6% 7.43 7.89 32.3%
2004 6.52 6.74 8.8% 9.43 9.74 7.8% 8.37 8.65 8.0% 4.42 4.57 -2.7% 7.16 7.40 8.1% 8.24 8.51 7.9%
2005 8.39 8.39 24.5% 11.07 11.07 13.6% 10.04 10.04 16.1% 5.69 5.69 24.6% 9.20 9.20 24.4% 9.93 9.93 16.6%
2006 7.96 7.71 -8.1% 11.48 11.12 0.5% 10.14 9.82 -2.2% 11.43 11.07 94.6% 8.65 8.38 -8.9% 9.86 9.55 -3.8%
2007 7.50 7.06 -8.4% 10.92 10.28 -7.6% 9.94 9.36 -4.7% 12.53 11.80 6.5% 7.18 6.76 -19.3% 9.31 8.76 -8.2%
2008 8.84 8.14 15.3% 11.03 10.16 -1.2% 10.28 9.47 1.2% 19.06 17.55 48.8% 9.11 8.39 24.1% 9.99 9.20 5.0%
2009 5.49 5.00 -38.5% 8.73 7.96 -21.7% 7.73 7.04 -25.6% 18.17 16.56 -5.7% 6.49 5.91 -29.5% 7.30 6.65 -27.7%
2010 5.52 4.97 -0.6% 8.67 7.81 -1.8% 7.52 6.78 -3.8% 16.33 14.71 -11.1% 5.96 5.37 -9.2% 7.00 6.31 -5.2% Since 2000 1.2% -1.4% 0.0% 186.3% 6.1% -4.5%
Notes: 1. Nominal = Price in dollars per million BTU ($/MMBTU) for year shown 2. Real (2005) = Price in real $/MMBTU for year shown, inflation-adjusted to 2005 base year 3. Real % Change = Percent change in real dollar price ($/MMBTU) from previous year
89
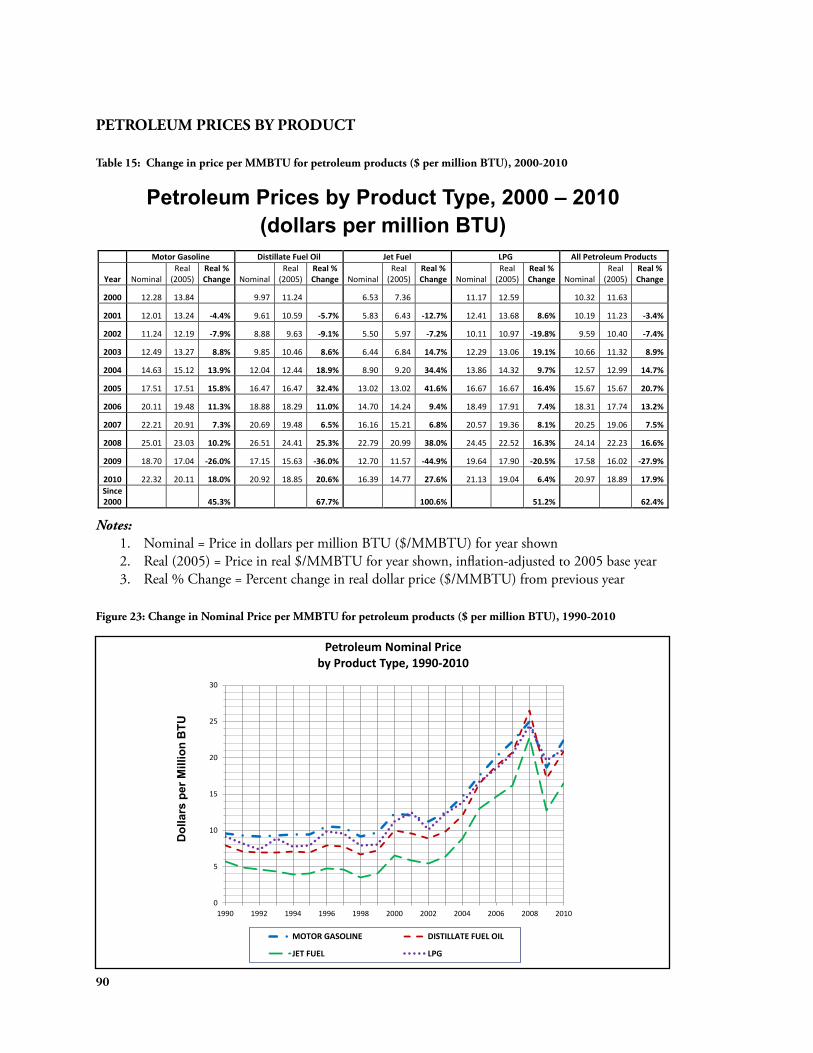
Petroleum Prices by Product Type, 2000 – 2010(dollars per million BTU)
Notes:Nominal = Price in dollars per million BTU ($/MMBTU) for year shownReal (2005) = Price in real $/MMBTU for year shown, inflation-adjusted to 2005 base yearReal % Change = Percent change in real dollar price ($/MMBTU) from previous year
PETROLEUM PRICES BY PRODUCT
Table 15: Change in price per MMBTU for petroleum products ($ per million BTU), 2000-2010
Petroleum Prices by Product Type, 2000 – 2010 (dollars per million BTU)
Motor Gasoline Distillate Fuel Oil Jet Fuel LPG All Petroleum Products
Year Nominal Real
(2005) Real % Change Nominal
Real (2005)
Real % Change Nominal
Real (2005)
Real % Change Nominal
Real (2005)
Real % Change Nominal
Real (2005)
Real % Change
2000 12.28 13.84 9.97 11.24 6.53 7.36 11.17 12.59 10.32 11.63
2001 12.01 13.24 -4.4% 9.61 10.59 -5.7% 5.83 6.43 -12.7% 12.41 13.68 8.6% 10.19 11.23 -3.4%
2002 11.24 12.19 -7.9% 8.88 9.63 -9.1% 5.50 5.97 -7.2% 10.11 10.97 -19.8% 9.59 10.40 -7.4%
2003 12.49 13.27 8.8% 9.85 10.46 8.6% 6.44 6.84 14.7% 12.29 13.06 19.1% 10.66 11.32 8.9%
2004 14.63 15.12 13.9% 12.04 12.44 18.9% 8.90 9.20 34.4% 13.86 14.32 9.7% 12.57 12.99 14.7%
2005 17.51 17.51 15.8% 16.47 16.47 32.4% 13.02 13.02 41.6% 16.67 16.67 16.4% 15.67 15.67 20.7%
2006 20.11 19.48 11.3% 18.88 18.29 11.0% 14.70 14.24 9.4% 18.49 17.91 7.4% 18.31 17.74 13.2%
2007 22.21 20.91 7.3% 20.69 19.48 6.5% 16.16 15.21 6.8% 20.57 19.36 8.1% 20.25 19.06 7.5%
2008 25.01 23.03 10.2% 26.51 24.41 25.3% 22.79 20.99 38.0% 24.45 22.52 16.3% 24.14 22.23 16.6%
2009 18.70 17.04 -26.0% 17.15 15.63 -36.0% 12.70 11.57 -44.9% 19.64 17.90 -20.5% 17.58 16.02 -27.9%
2010 22.32 20.11 18.0% 20.92 18.85 20.6% 16.39 14.77 27.6% 21.13 19.04 6.4% 20.97 18.89 17.9% Since 2000 45.3% 67.7% 100.6% 51.2% 62.4%
Notes: 1. Nominal = Price in dollars per million BTU ($/MMBTU) for year shown 2. Real (2005) = Price in real $/MMBTU for year shown, inflation-adjusted to 2005 base year 3. Real % Change = Percent change in real dollar price ($/MMBTU) from previous year
Figure 23: Change in Nominal Price per MMBTU for petroleum products ($ per million BTU), 1990-2010
0
5
10
15
20
25
30
1990 1992 1994 1996 1998 2000 2002 2004 2006 2008 2010
Dol
lars
per
Mill
ion
BTU
Petroleum Nominal Price by Product Type, 1990-2010
MOTOR GASOLINE DISTILLATE FUEL OIL
JET FUEL LPG
90
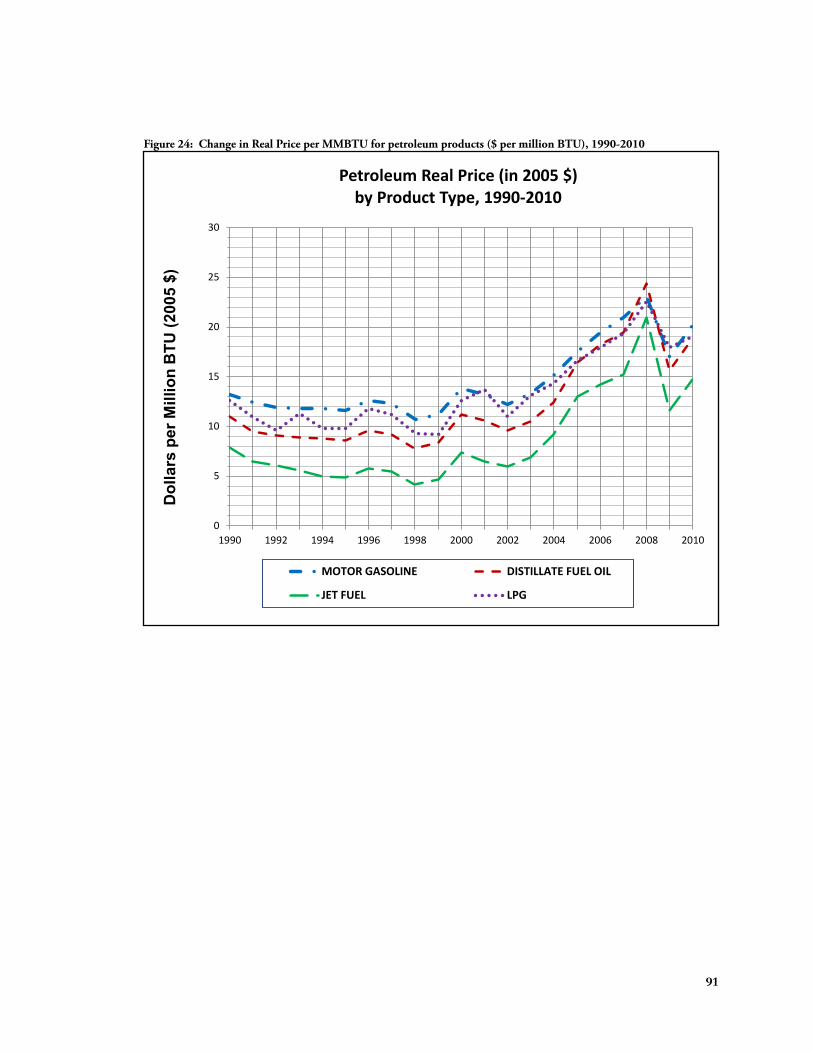
Figure 24: Change in Real Price per MMBTU for petroleum products ($ per million BTU), 1990-2010
0
5
10
15
20
25
30
1990 1992 1994 1996 1998 2000 2002 2004 2006 2008 2010
Dol
lars
per
Mill
ion
BTU
(200
5 $)
Petroleum Real Price (in 2005 $)
by Product Type, 1990-2010
MOTOR GASOLINE DISTILLATE FUEL OIL
JET FUEL LPG
91
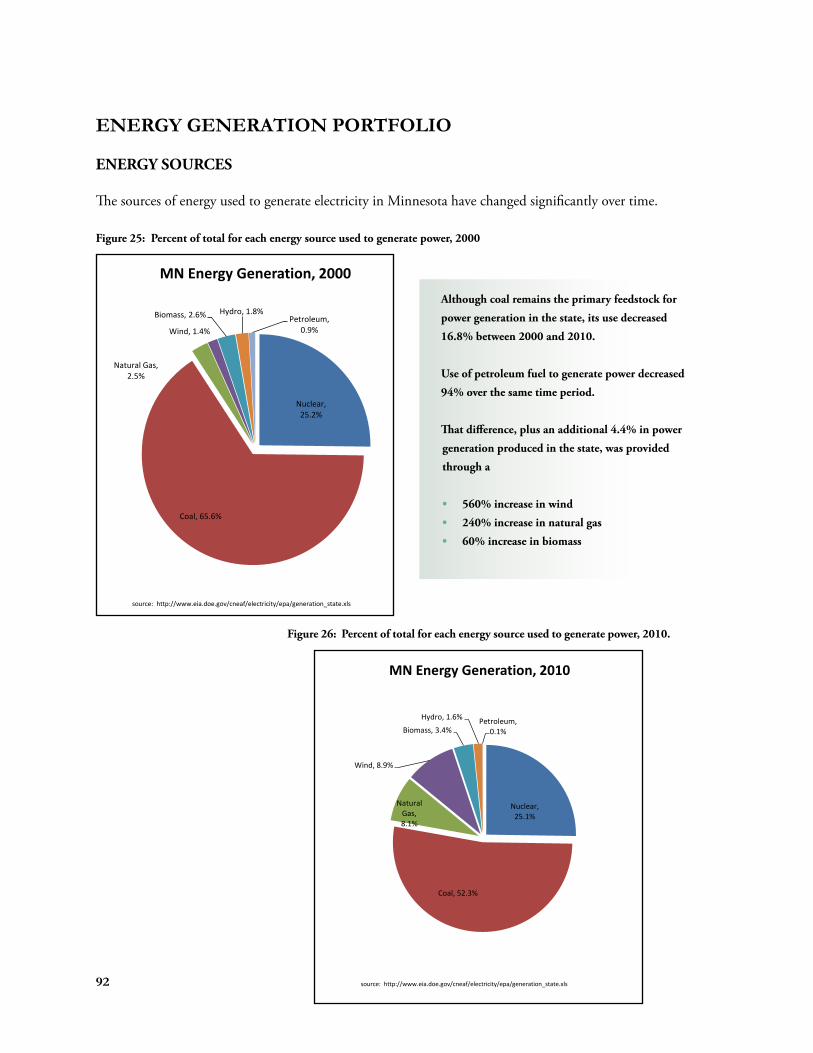
ENERGY GENERATION PORTFOLIO
ENERGY SOURCES
The sources of energy used to generate electricity in Minnesota have changed significantly over time.
Figure 25: Percent of total for each energy source used to generate power, 2000
MN Energy Generation, 2000 Although coal remains the primary feedstock for
power generation in the state, its use decreased
16.8% between 2000 and 2010.
Use of petroleum fuel to generate power decreased
94% over the same time period.
That difference, plus an additional 4.4% in power
generation produced in the state, was provided
through a
• 560% increase in wind
• 240% increase in natural gas
• 60% increase in biomass
Nuclear, 25.2%
Coal, 65.6%
Natural Gas, 2.5%
Wind, 1.4%
Biomass, 2.6% Hydro, 1.8% Petroleum,
0.9%
source: http://www.eia.doe.gov/cneaf/electricity/epa/generation_state.xls
Figure 26: Percent of total for each energy source used to generate power, 2010.
MN Energy Generation, 2010
Nuclear, 25.1%
Coal, 52.3%
Natural Gas, 8.1%
Wind, 8.9%
Biomass, 3.4%
Hydro, 1.6% Petroleum, 0.1%
source: http://www.eia.doe.gov/cneaf/electricity/epa/generation_state.xls 92
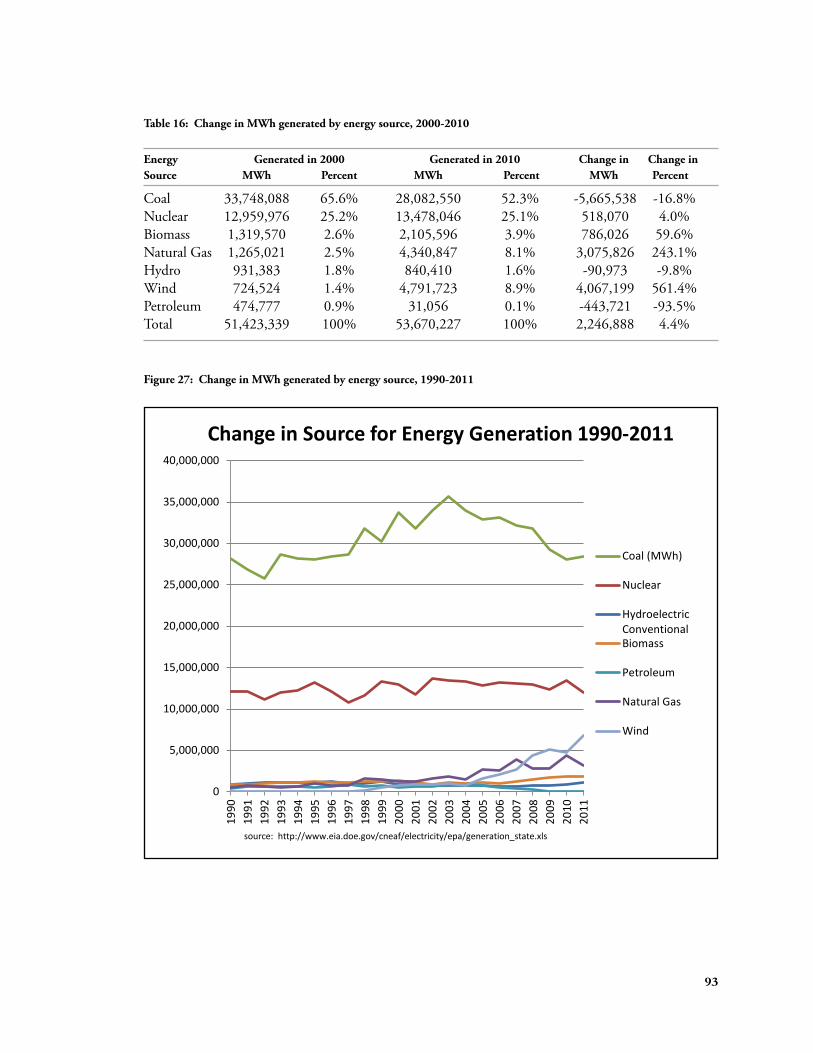
Table 16: Change in MWh generated by energy source, 2000-2010
Energy Generated in 2000 Generated in 2010 Change in Change in Source MWh Percent MWh Percent MWh Percent
Coal 33,748,088 65.6% 28,082,550 52.3% -5,665,538 -16.8% Nuclear 12,959,976 25.2% 13,478,046 25.1% 518,070 4.0% Biomass 1,319,570 2.6% 2,105,596 3.9% 786,026 59.6% Natural Gas 1,265,021 2.5% 4,340,847 8.1% 3,075,826 243.1% Hydro 931,383 1.8% 840,410 1.6% -90,973 -9.8% Wind 724,524 1.4% 4,791,723 8.9% 4,067,199 561.4% Petroleum 474,777 0.9% 31,056 0.1% -443,721 -93.5% Total 51,423,339 100% 53,670,227 100% 2,246,888 4.4%
Figure 27: Change in MWh generated by energy source, 1990-2011
25,000,000
30,000,000
35,000,000
40,000,000
Change in Source for Energy Generation 1990-2011
Coal (MWh)
Nuclear
Hydroelectric Conventional Biomass
Petroleum
Natural Gas
Wind
10,000,000
15,000,000
20,000,000
0
5,000,000
source: http://www.eia.doe.gov/cneaf/electricity/epa/generation_state.xls
1990
1991
1992
1993
1994
1995
1996
1997
1998
1999
2000
2001
2002
2003
2004
2005
2006
2007
2008
2009
2010
2011
93
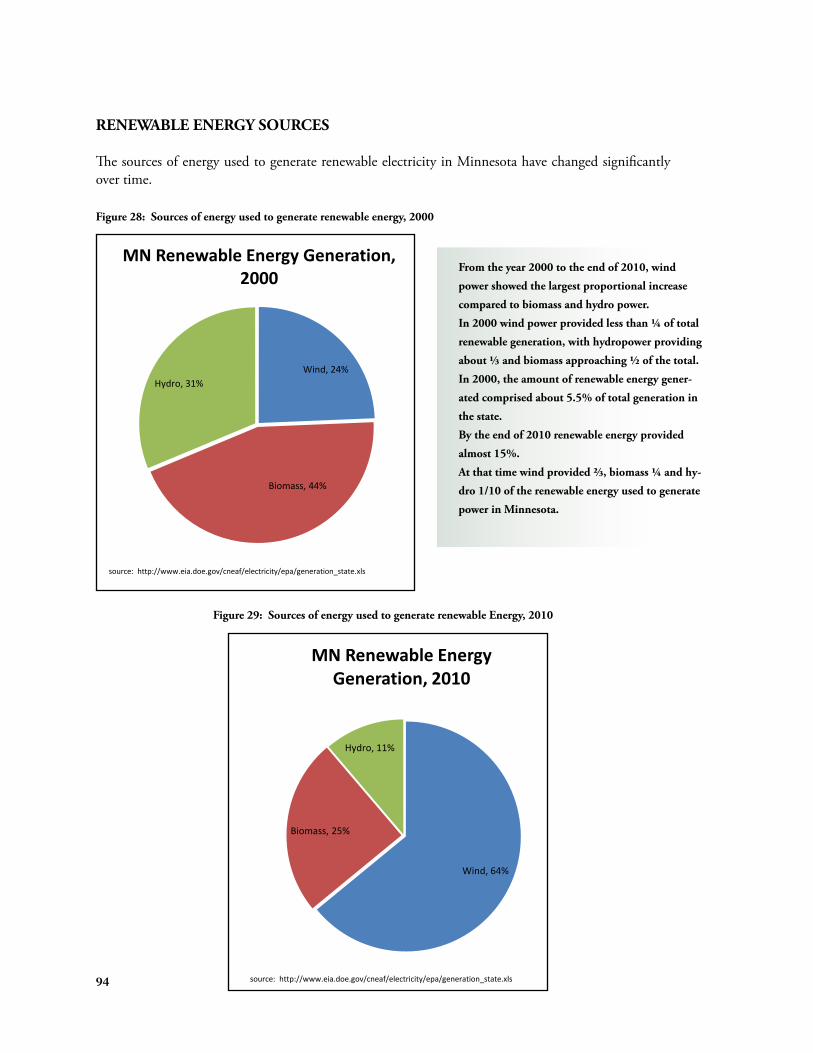
RENEWABLE ENERGY SOURCES
The sources of energy used to generate renewable electricity in Minnesota have changed significantly over time.
Figure 28: Sources of energy used to generate renewable energy, 2000
MN Renewable Energy Generation, From the year 2000 to the end of 2010, wind
2000 power showed the largest proportional increase
compared to biomass and hydro power.
In 2000 wind power provided less than ¼ of total
renewable generation, with hydropower providing
about ⅓ and biomass approaching ½ of the total.
In 2000, the amount of renewable energy gener
ated comprised about 5.5% of total generation in
the state.
By the end of 2010 renewable energy provided
almost 15%.
At that time wind provided ⅔, biomass ¼ and hy
dro 1/10 of the renewable energy used to generate
power in Minnesota.
Wind, 24%
Biomass, 44%
Hydro, 31%
source: http://www.eia.doe.gov/cneaf/electricity/epa/generation_state.xls
Figure 29: Sources of energy used to generate renewable Energy, 2010
MN Renewable Energy Generation, 2010
Wind, 64%
Biomass, 25%
Hydro, 11%
source: http://www.eia.doe.gov/cneaf/electricity/epa/generation_state.xls 94
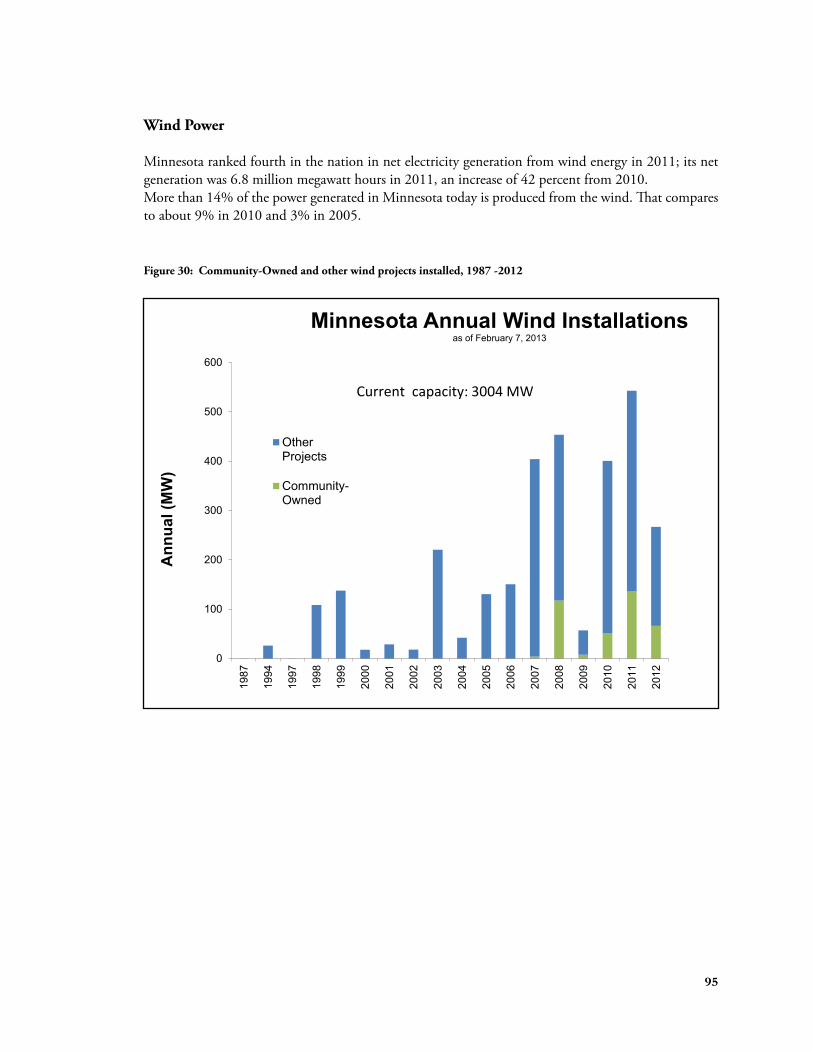
Wind Power
Minnesota ranked fourth in the nation in net electricity generation from wind energy in 2011; its net generation was 6.8 million megawatt hours in 2011, an increase of 42 percent from 2010. More than 14% of the power generated in Minnesota today is produced from the wind. That compares to about 9% in 2010 and 3% in 2005.
Figure 30: Community-Owned and other wind projects installed, 1987 -2012
Minnesota Annual Wind Installations as of February 7, 2013
0
100
200
300
400
500
600
Ann
ual (
MW
)
Other Projects
Community-Owned
Current capacity: 3004 MW
1987
1994
1997
1998
1999
2000
2001
2002
2003
2004
2005
2006
2007
2008
2009
2010
2011
2012
95
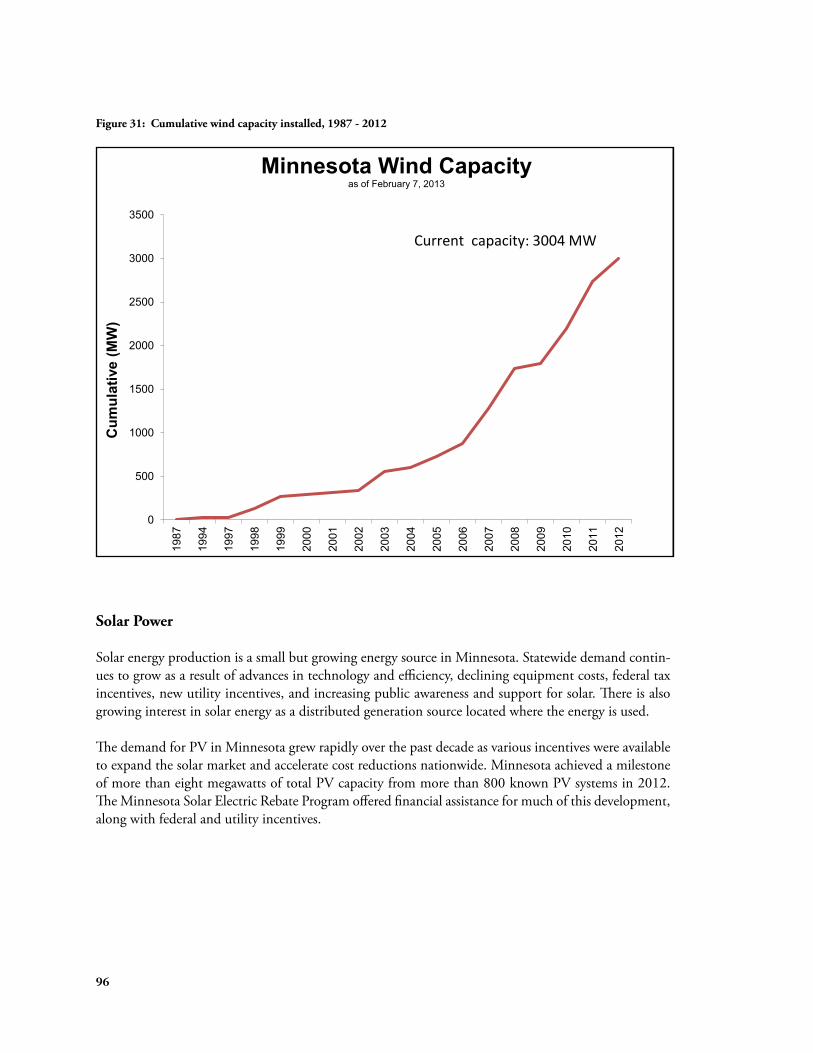
Figure 31: Cumulative wind capacity installed, 1987 - 2012
0
500
1000
1500
2000
2500
3000
3500
1987
1994
1997
1998
1999
2000
2001
2002
2003
2004
2005
2006
2007
2008
2009
2010
2011
2012
Cum
ulat
ive
(MW
)
Minnesota Wind Capacityas of February 7, 2013
Current capacity: 3004 MW
Solar Power
Solar energy production is a small but growing energy source in Minnesota. Statewide demand continues to grow as a result of advances in technology and efficiency, declining equipment costs, federal tax incentives, new utility incentives, and increasing public awareness and support for solar. There is also growing interest in solar energy as a distributed generation source located where the energy is used.
The demand for PV in Minnesota grew rapidly over the past decade as various incentives were available to expand the solar market and accelerate cost reductions nationwide. Minnesota achieved a milestone of more than eight megawatts of total PV capacity from more than 800 known PV systems in 2012. The Minnesota Solar Electric Rebate Program offered financial assistance for much of this development, along with federal and utility incentives.
96
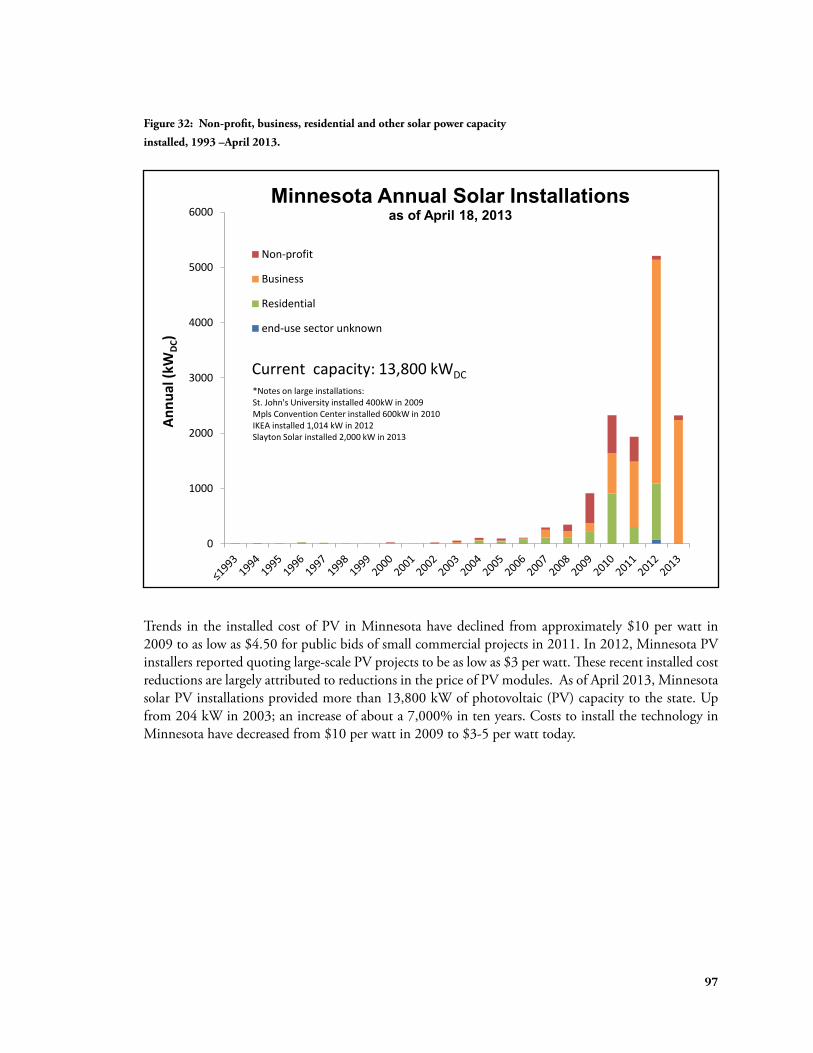
Figure 32: Non-profit, business, residential and other solar power capacity
installed, 1993 –April 2013.
0
1000
2000
3000
4000
5000
6000
Annu
al (k
WDC
)
Minnesota Annual Solar Installations as of April 18, 2013
Non-profit
Business
Residential
end-use sector unknown
Current capacity: 13,800 kWDC *Notes on large installations: St. John's University installed 400kW in 2009 Mpls Convention Center installed 600kW in 2010 IKEA installed 1,014 kW in 2012 Slayton Solar installed 2,000 kW in 2013
Trends in the installed cost of PV in Minnesota have declined from approximately $10 per watt in 2009 to as low as $4.50 for public bids of small commercial projects in 2011. In 2012, Minnesota PV installers reported quoting large-scale PV projects to be as low as $3 per watt. These recent installed cost reductions are largely attributed to reductions in the price of PV modules. As of April 2013, Minnesota solar PV installations provided more than 13,800 kW of photovoltaic (PV) capacity to the state. Up from 204 kW in 2003; an increase of about a 7,000% in ten years. Costs to install the technology in Minnesota have decreased from $10 per watt in 2009 to $3-5 per watt today.
97
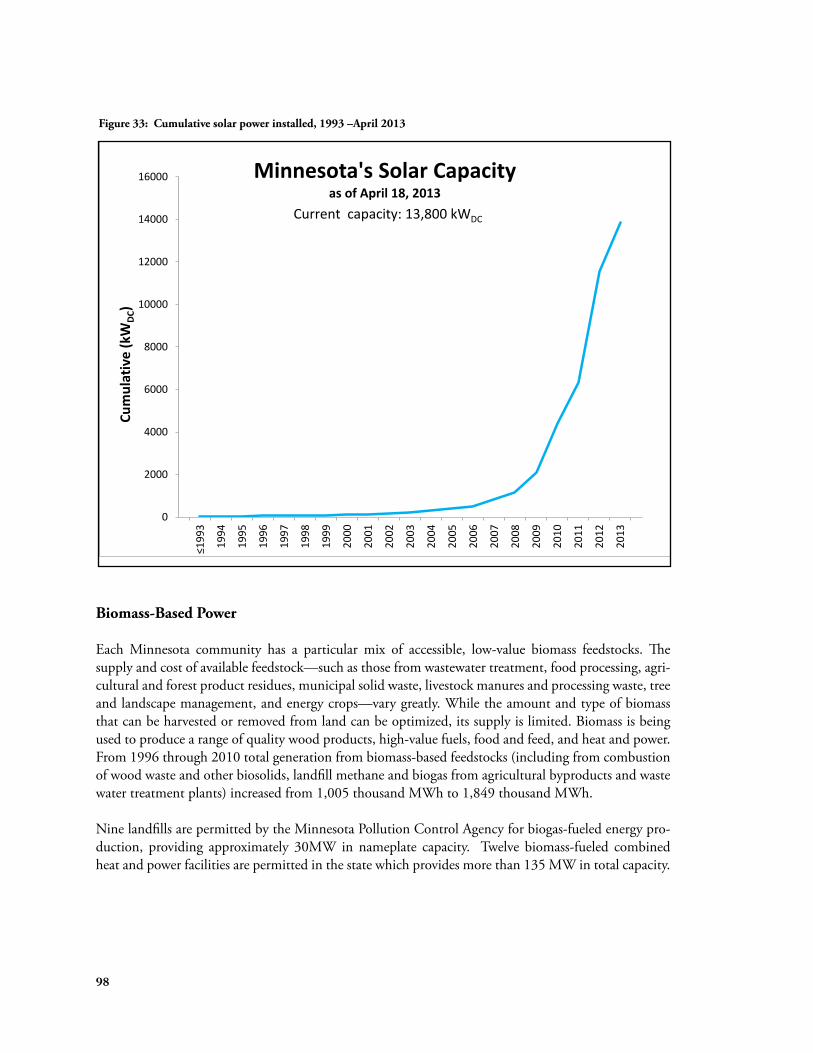
Figure 33: Cumulative solar power installed, 1993 –April 2013
16000 Minnesota's Solar Capacity as of April 18, 2013
14000 Current capacity: 13,800 kWDC
12000
10000
Cum
ulat
ive
(kW
DC )
8000
6000
4000
2000
0
≤1993
1994
1995
1996
1997
1998
1999
2000
2001
2002
2003
2004
2005
2006
2007
2008
2009
2010
2011
2012
2013
Biomass-Based Power
Each Minnesota community has a particular mix of accessible, low-value biomass feedstocks. The supply and cost of available feedstock—such as those from wastewater treatment, food processing, agricultural and forest product residues, municipal solid waste, livestock manures and processing waste, tree and landscape management, and energy crops—vary greatly. While the amount and type of biomass that can be harvested or removed from land can be optimized, its supply is limited. Biomass is being used to produce a range of quality wood products, high-value fuels, food and feed, and heat and power. From 1996 through 2010 total generation from biomass-based feedstocks (including from combustion of wood waste and other biosolids, landfill methane and biogas from agricultural byproducts and waste water treatment plants) increased from 1,005 thousand MWh to 1,849 thousand MWh.
Nine landfills are permitted by the Minnesota Pollution Control Agency for biogas-fueled energy production, providing approximately 30MW in nameplate capacity. Twelve biomass-fueled combined heat and power facilities are permitted in the state which provides more than 135 MW in total capacity.
98
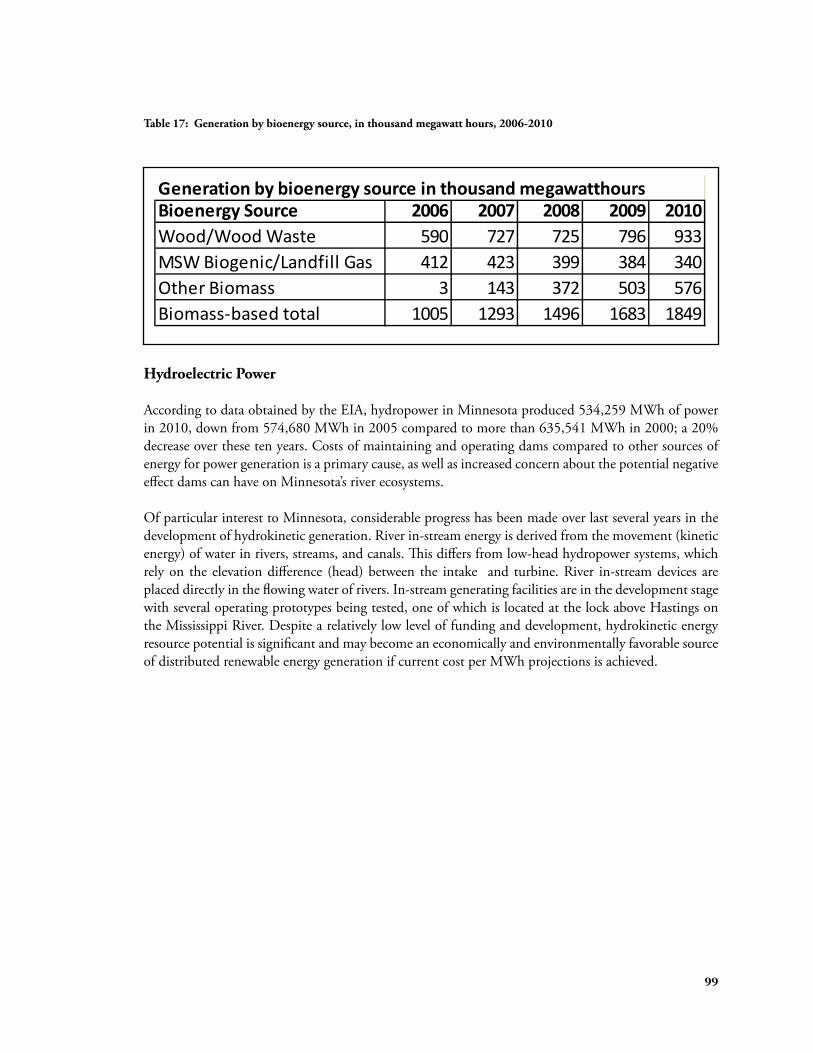
Table 17: Generation by bioenergy source, in thousand megawatt hours, 2006-2010
Generation by bioenergy source in thousand megawatthours Bioenergy Source 2006 2007 2008 2009 2010 Wood/Wood Waste 590 727 725 796 933 MSW Biogenic/Landfill Gas 412 423 399 384 340 Other Biomass 3 143 372 503 576 Biomass-based total 1005 1293 1496 1683 1849
Hydroelectric Power
According to data obtained by the EIA, hydropower in Minnesota produced 534,259 MWh of power in 2010, down from 574,680 MWh in 2005 compared to more than 635,541 MWh in 2000; a 20% decrease over these ten years. Costs of maintaining and operating dams compared to other sources of energy for power generation is a primary cause, as well as increased concern about the potential negative effect dams can have on Minnesota’s river ecosystems.
Of particular interest to Minnesota, considerable progress has been made over last several years in the development of hydrokinetic generation. River in-stream energy is derived from the movement (kinetic energy) of water in rivers, streams, and canals. This differs from low-head hydropower systems, which rely on the elevation difference (head) between the intake and turbine. River in-stream devices are placed directly in the flowing water of rivers. In-stream generating facilities are in the development stage with several operating prototypes being tested, one of which is located at the lock above Hastings on the Mississippi River. Despite a relatively low level of funding and development, hydrokinetic energy resource potential is significant and may become an economically and environmentally favorable source of distributed renewable energy generation if current cost per MWh projections is achieved.
99

100
D IVISION OF E NERGY R ESOURCES