energy report - strange brew: adapting to changing fundamentals
TRANSCRIPT

Vol. 15 - Issue 2
ENERGY
STRANGE BREW: ADAPTING TO CHANGING
FUNDAMENTALS
The ScottMadden
INDUSTRYUPDATE

SCOTTMADDEN, INC. | 2
Energy Practice: ScottMadden Knows Energy 39
Executive Summary
Straight from the CEOs: Selected Comments from Energy and Utility Company Annual Reports
4
View from the Executive Suite
U.S. Gas Resources Still Growing: Equivalent to More Than 140 Years’ Worth at 2014 Consumption Levels
5-7
9
10
Energy Supply, Demand, and Markets
FERC “Moneyball”: FERC Approves Metrics to Measure Transmission Investment Policy Effectiveness
28-29
New York’s REV: Working Through the Details of NY Grid Transformation
30-31
Rate and Regulatory Developments
Everything Under the Sun: Community Solar Is About to Shine
EPA’s Coal Combustion Residuals Rule: Utilities Must Develop a Compliance Approach
33-34
Clean Tech and Environment
Cybersecurity: Improving Utility-Government Information Sharing
35-37
The Energy Industry: By the Numbers 38
Managing the Utility Enterprise
The Clean Power Plan: EPA Releases Its Final Rule
Energy Storage: When Will Reality Catch Up to the Hype?
New York’s REV: PSC Staff Envisions Significant Ratemaking Reforms
Renewables vs. Gas Generation: Levelized Cost of Energy
Natural Gas Production: Are Low Prices Having an Impact?
Gas Pipelines: Getting Marcellus and Utica Gas to Market 11
18
13-15
20-25
16-17
26-27
TABLE OF CONTENTS

VIEW FROM THE EXECUTIVE SUITE

SCOTTMADDEN, INC. | 4EXECUTIVE SUMMARY
The electric industry seems to be on the cusp of great change. Regulators are rethinking the hundred-year-old rate-of-return paradigm, renewables costs are falling (especially for solar photovoltaic technology), and the final rule is out on power sector greenhouse gas emissions. Grid transformation is breaking down traditional boundaries between customers and producers, supply and demand, and roles of the center and the edge of the electric grid. It is unclear what industry environment this “strange brew” will yield.
Strange (adj.):not previously visited, seen, or encountered; unfamiliar or alien
Brew (n.):any concoction produced by a mixture of unusual ingredients
Strange Brew
EPA Tightens Its Regulations
Energy Technologies:Moving Down the Experience Curve?
• EPA has released its long-awaited Clean Power Plan, and utilities, state regulators, and other stakeholders are sifting through it to assess implications. While EPA has provided some flexibility, all agree that the rule will dramatically alter the North American energy mix
• Separately, EPA’s final rule governing coal combustion residuals (CCRs) provides a pragmatic approach to use of CCRs, but generators have much work ahead to create compliance programs
• Solar power—both distributed and utility-scale—continues to gain rapidly in installed capacity, albeit from a small base, as it decreases significantly in price. But there remains some question about the continuing pace of installed cost reduction and its ability to compete with combined-cycle units fueled by cheap natural gas
• In part due to declining installed costs, community solar is gaining in popularity and may offer an alternative to rooftop solar for the electric customers
• Meanwhile, Elon Musk’s Tesla continues to grab headlines in energy with the introduction of its end-user Powerwall energy storage device, but the cost is too steep for widespread adoption, at least for now
Utility Regulatory Compacts “Re-Imagined”
• Jurisdictions like New York and California are shaking up their energy industries, seeking lower- or non-emitting energy resources like energy efficiency and renewables
• Seeking to alter perceived disincentives to such low-emission resources, New York is taking a bold step: changing the role of utility distribution company to that of a platform provider that will enable innovative and “clean” third-party asset development and services. This could alter the long-standing cost-of-service model that has dominated utility regulation for more than a century and upend the current utility paradigm and ecosystem
Some Highlights of This ScottMadden Energy Industry Update
Strange Brew: Adapting to Changing Fundamentals
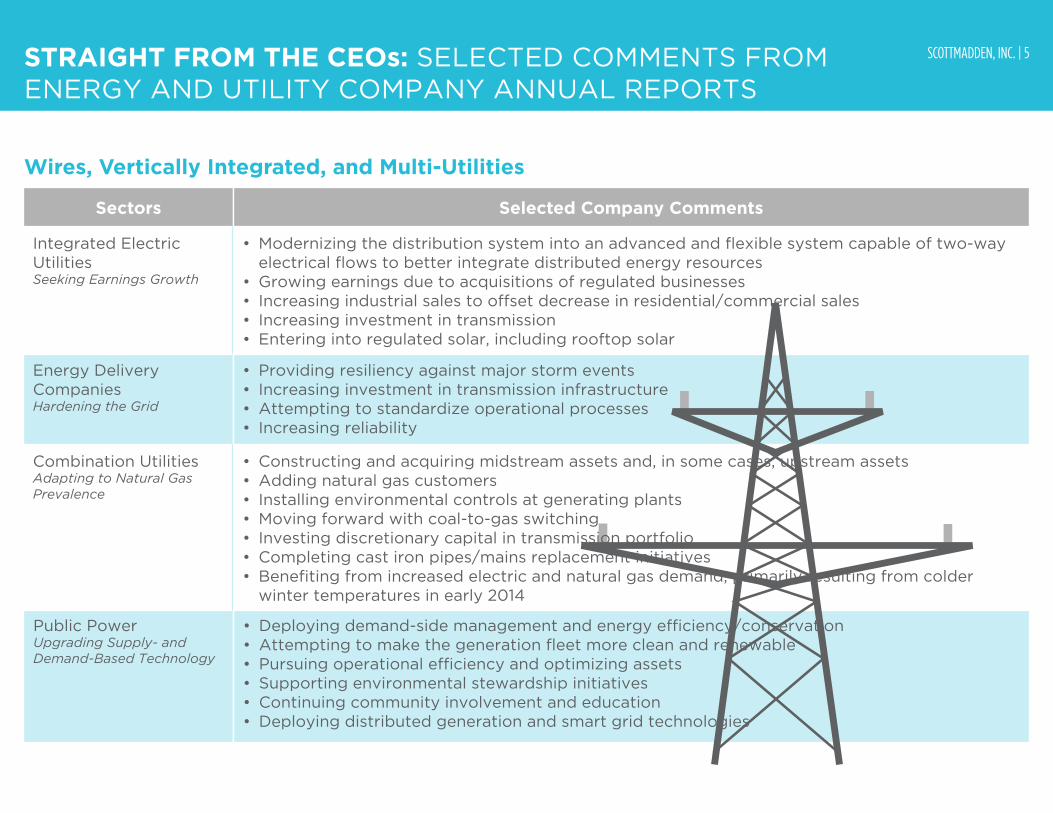
SCOTTMADDEN, INC. | 5STRAIGHT FROM THE CEOs: SELECTED COMMENTS FROM ENERGY AND UTILITY COMPANY ANNUAL REPORTS
Sectors Selected Company Comments
Integrated Electric UtilitiesSeeking Earnings Growth
Energy Delivery CompaniesHardening the Grid
Combination UtilitiesAdapting to Natural Gas Prevalence
Public PowerUpgrading Supply- and Demand-Based Technology
Wires, Vertically Integrated, and Multi-Utilities
• Modernizing the distribution system into an advanced and flexible system capable of two-way electrical flows to better integrate distributed energy resources
• Growing earnings due to acquisitions of regulated businesses• Increasing industrial sales to offset decrease in residential/commercial sales• Increasing investment in transmission• Entering into regulated solar, including rooftop solar
• Providing resiliency against major storm events• Increasing investment in transmission infrastructure• Attempting to standardize operational processes• Increasing reliability
• Constructing and acquiring midstream assets and, in some cases, upstream assets• Adding natural gas customers• Installing environmental controls at generating plants• Moving forward with coal-to-gas switching• Investing discretionary capital in transmission portfolio• Completing cast iron pipes/mains replacement initiatives• Benefiting from increased electric and natural gas demand, primarily resulting from colder
winter temperatures in early 2014
• Deploying demand-side management and energy efficiency/conservation• Attempting to make the generation fleet more clean and renewable• Pursuing operational efficiency and optimizing assets• Supporting environmental stewardship initiatives• Continuing community involvement and education• Deploying distributed generation and smart grid technologies
SCOTTMADDEN, INC. | 6
STRAIGHT FROM THE CEOs: COMMENTS FROM ANNUAL REPORTS
Sectors Selected Company Comments
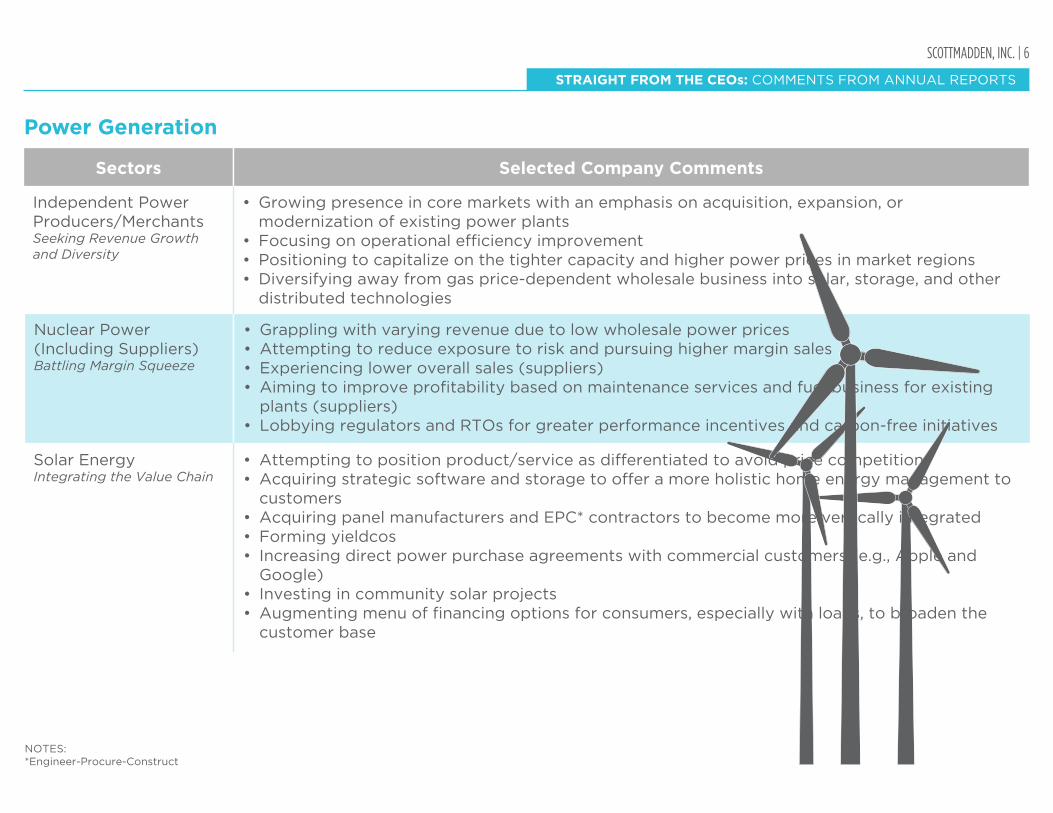
Power Generation
Independent Power Producers/MerchantsSeeking Revenue Growth and Diversity
Nuclear Power (Including Suppliers)Battling Margin Squeeze
Solar EnergyIntegrating the Value Chain
• Growing presence in core markets with an emphasis on acquisition, expansion, or modernization of existing power plants
• Focusing on operational efficiency improvement• Positioning to capitalize on the tighter capacity and higher power prices in market regions• Diversifying away from gas price-dependent wholesale business into solar, storage, and other
distributed technologies
• Grappling with varying revenue due to low wholesale power prices• Attempting to reduce exposure to risk and pursuing higher margin sales• Experiencing lower overall sales (suppliers)• Aiming to improve profitability based on maintenance services and fuel business for existing
plants (suppliers)• Lobbying regulators and RTOs for greater performance incentives and carbon-free initiatives
• Attempting to position product/service as differentiated to avoid price competition• Acquiring strategic software and storage to offer a more holistic home energy management to
customers• Acquiring panel manufacturers and EPC* contractors to become more vertically integrated• Forming yieldcos• Increasing direct power purchase agreements with commercial customers (e.g., Apple and
Google)• Investing in community solar projects• Augmenting menu of financing options for consumers, especially with loans, to broaden the
customer base
NOTES:*Engineer-Procure-Construct

SCOTTMADDEN, INC. | 7
• Continuing investment in new product development, such as larger wind turbines• Increasing revenue from services business (e.g., O&M, construction services)• Renewing orders from large independent power producers and utilities• Increasing onshore wind turbine orders because of economic recovery and from a low basis of
comparison due to expiration of the federal production tax credit in 2013• Investing in the higher-margin offshore wind segment• Working with customers to deliver tailored solutions
Wind EnergyDeveloping New Projects
STRAIGHT FROM THE CEOs: COMMENTS FROM ANNUAL REPORTS
Sectors Selected Company Comments
Natural Gas
Gas DistributionInvesting in Infrastructure
• Drastically reducing capital budgets as a result of persistent low gas prices, though production levels still forecast to remain level or increase
• Transitioning to become an oil- and liquids-focused domestic producer• Spinning off natural gas distribution business• Increasing gathered and processed natural gas volumes significantly• Suspending capital spending on natural gas and natural gas liquids growth projects• Softening of earnings due largely to declining natural gas liquids prices
Natural GasManaging Capital Spending
Gas PipelinesExpanding Lines from Resources to Markets
SOURCES:Company annual reports
• Executing infrastructure replacement programs with cost recovery via non-rate case recovery mechanisms
• Encountering unprofitable conditions in the storage market• Investing in major transmission pipelines• Growing customer base fueled by new residential construction activity• Investing in compressed natural gas fueling infrastructure
• Linking growing oil-producing regions to the best markets and providing refineries with reliable feedstock
• Positioning to capitalize on growth in gas-fired generation in select regions• Investing in carbon capture technology• Investing in crude oil pipelines• Focusing on business segment charging fees for use of the capacity of its pipelines, terminals,
and other assets to weather the commodity price downturn

ENERGY SUPPLY, DEMAND, AND MARKETS

SCOTTMADDEN, INC. | 9U.S. GAS RESOURCES STILL GROWING: EQUIVALENT TO MORE THAN 140 YEARS’ WORTH AT 2014 CONSUMPTION LEVELS
Estimates for proved and potential gas reserves in the United States are at record levels.
America’s Gas Resources Continue to Grow
• Estimated reserves* increased from 2012 to 2014 by 267 trillion cubic feet (TCF) to 3,832 TCF of “most likely” total gas resource for the United States, per the Potential Gas Committee’s (PGC) April 2015 estimate. This is equivalent to 140 years’ supply at current consumption levels
• Future gas supply estimates* (excluding cumulative production) rose 9% from PGC’s last (2012) estimate
The Marcellus Monster
• Total proved reserves are highest in Pennsylvania and West Virginia at 15.8 TCF and 10.1 TCF, respectively
• Largest absolute and percentage gains seen by the prolific Marcellus, Utica, and Rogersville shale plays, amounting to 137 TCF
Shale Resources Dominate
• As a share of total natural gas proved reserves, shale gas increased more than 30% from 2008 to 2013**
• Total shale gas reserves as a percentage of the country’s total potential resources is nearly 57%
NOTES:Biennial Potential Gas Committee estimates for 1970-2014 (values carried over for odd years as well as 1974 for continuity); excludes Hawaii; includes traditional (conventional, tight, shale) as well as coalbed, on- and offshore. 2014 total U.S. gas consumption was 26.8 million MMCF, or 26.8 TCF*“Most likely” estimates (see PGC report below, at pp. 2, 107) **EIA estimates for 1973-2013SOURCES:EIA; Potential Gas Committee, Potential Supply of Natural Gas in the United States (Apr. 2015), Tables 24, 2, and press presentation
0
500
1,000
1,500
2,000
2,500
3,000
3,500
4,000
1980 2012201020082006200420022000199819961994199219901988198619841982 2014
Total U.S. Future Gas Supply and Ultimately Recoverable Resources (“Most Likely” Values)
TC
F
Coalbed Gas Resources
Proved Reserves
Cumulative Production
Traditional Gas ResourcesFuture Gas
SupplyUltimately
Recoverable Resources
0
500
1,000
1,500
2,000
2,500
3,000
201220102008200620042002200019981996199419921990 2014
Coalbed Gas Resources
Volume of Shale Gas (“Most Likely”) Within Traditional Resources
Traditional Gas Resources
Total U.S. Potential Gas Resources(Mean Values)
TC
FSource: Potential Gas Committee
Source: Potential Gas Committee
SCOTTMADDEN, INC. | 10
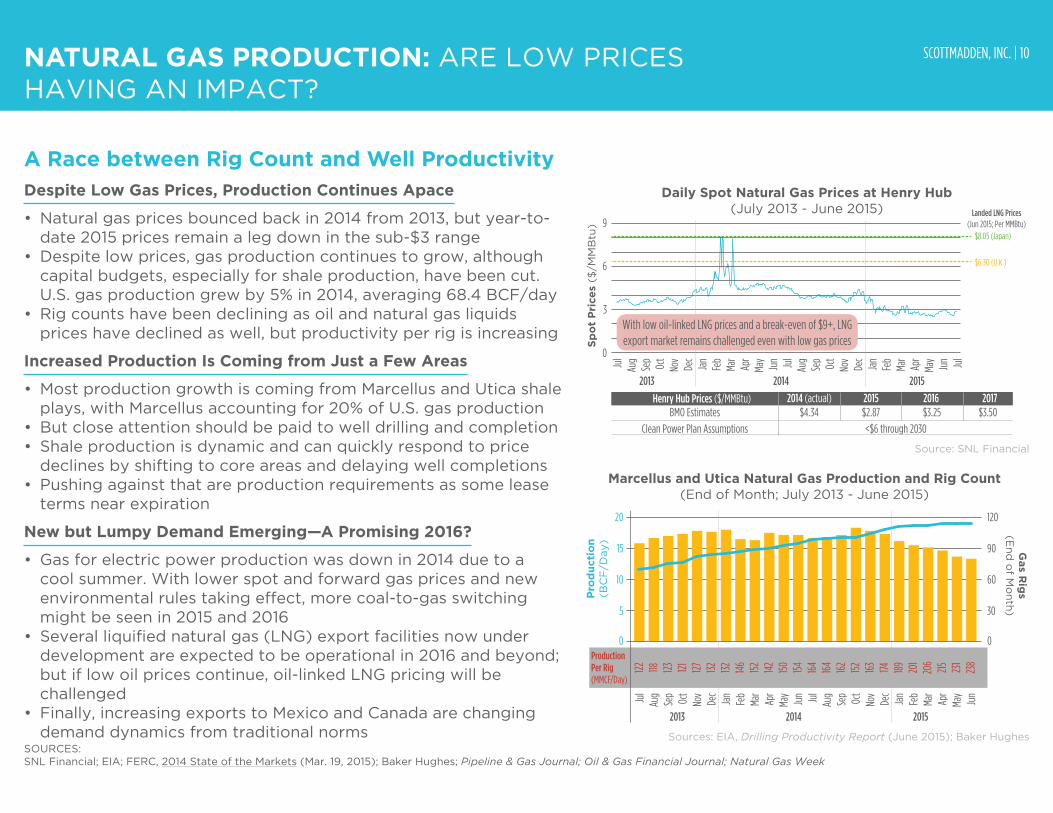
Despite Low Gas Prices, Production Continues Apace
• Natural gas prices bounced back in 2014 from 2013, but year-to-date 2015 prices remain a leg down in the sub-$3 range
• Despite low prices, gas production continues to grow, although capital budgets, especially for shale production, have been cut. U.S. gas production grew by 5% in 2014, averaging 68.4 BCF/day
• Rig counts have been declining as oil and natural gas liquids prices have declined as well, but productivity per rig is increasing
Increased Production Is Coming from Just a Few Areas
• Most production growth is coming from Marcellus and Utica shale plays, with Marcellus accounting for 20% of U.S. gas production
• But close attention should be paid to well drilling and completion• Shale production is dynamic and can quickly respond to price
declines by shifting to core areas and delaying well completions• Pushing against that are production requirements as some lease
terms near expiration
New but Lumpy Demand Emerging—A Promising 2016?
• Gas for electric power production was down in 2014 due to a cool summer. With lower spot and forward gas prices and new environmental rules taking effect, more coal-to-gas switching might be seen in 2015 and 2016
• Several liquified natural gas (LNG) export facilities now under development are expected to be operational in 2016 and beyond; but if low oil prices continue, oil-linked LNG pricing will be challenged
• Finally, increasing exports to Mexico and Canada are changing demand dynamics from traditional norms
NATURAL GAS PRODUCTION: ARE LOW PRICES HAVING AN IMPACT?
A Race between Rig Count and Well Productivity
SOURCES:SNL Financial; EIA; FERC, 2014 State of the Markets (Mar. 19, 2015); Baker Hughes; Pipeline & Gas Journal; Oil & Gas Financial Journal; Natural Gas Week
0
Sp
ot
Pri
ce
s ($
/MM
Btu
) 9
6
3
2013 2014 2015
Jul
Jun
May
Apr
Mar
Feb
Jan
Dec
Nov
Oct
Sep
AugJul
Jun
May
Apr
Mar
Feb
Jan
Dec
Nov
Oct
Sep
Aug Jul
Daily Spot Natural Gas Prices at Henry Hub(July 2013 - June 2015)
$8.05 (Japan)
$6.30 (U.K.)
Henry Hub Prices ($/MMBtu) 2017201620152014 (actual)BMO Estimates
Clean Power Plan Assumptions
$4.34
<$6 through 2030
$2.87 $3.25 $3.50
Landed LNG Prices (Jun 2015; Per MMBtu)
Pro
du
cti
on
(BC
F/D
ay)
Marcellus and Utica Natural Gas Production and Rig Count(End of Month; July 2013 - June 2015)
Gas R
igs
(En
d o
f Mo
nth
)
2013 2014 2015
Jul
Jun
May
Apr
Mar
Feb
Jan
Dec
Nov
Oct
Sep
AugJul
Jun
May
Apr
Mar
Feb
Jan
Dec
Nov
Oct
Sep
Aug
0
90
60
30
120
0
15
10
5
20
122
238
231
215
206
201
189174163
152
162
164
164
154
150
142
152
146
132
132
127121
123118
Production Per Rig(MMCF/Day)
With low oil-linked LNG prices and a break-even of $9+, LNG export market remains challenged even with low gas prices
Source: SNL Financial
Sources: EIA, Drilling Productivity Report (June 2015); Baker Hughes

SCOTTMADDEN, INC. | 11
Despite Low Gas Prices, Production Continues Apace
• Northeast basis differentials (vs. Henry Hub) have been largely flat or negative for the past 24 months except during peak heating season (Dec.–Mar.)
• Additional transportation and processing capacity is needed due to:
› Continued Appalachian gas production growth (despite declining rig counts)
› Increasing demand from power generation › Basis reversals
• About 29 BCF/day of takeaway capacity is under development in 43 new build and reversal projects to unlock Northeast gas and move it east, west, and south
• Development is shifting from reversals—like the 1.8 BCF/day Rockies Express, now taking gas from the Appalachian Basin to Midwest markets—to new build
• As bi-directional flows increase and additional greenfield takeaway capacity is developed, low basis differentials should continue
• This wave of construction is expected to peak in 2017–18
GAS PIPELINES: GETTING MARCELLUS AND UTICA GAS TO MARKET
Expansion and flow reversal projects continue: low natural gas and liquids prices have yet to dim enthusiasm.
SOURCES:EIA; RBN Energy; FERC; Northeast Gas Association; SNL Financial; Baker Hughes; Pittsburgh Post-Gazette; The Wall Street Journal
Noteworthy Proposed Pipelines
Project Capacity* Location
Constitution Pipeline
Ohio Valley Connector
Rover Pipeline Project
0.67
1.2
3.25
Marcellus to New England
WV to OH
WV to Canada
*capacity measured in BCF/Day
Day-A
he
ad
Basi
s A
ve
rag
ed
Mo
nth
ly
($/M
MB
tu)
$25
$20
$15
$10
$5
$0
-$5
2013 2014 2015
Jul
Jun
May
Apr
Mar
Feb
Jan
Dec
Nov
Oct
Sep
AugJul
Jun
May
Apr
Mar
Feb
Jan
Dec
Nov
Oct
Sep
Aug Jul
Transco Zone 6 NY Basis
Transco Zone 6 Non-NY Basis
Columbia TCO Pool Bases
Algonquin Citygate Basis
Northeast Day-Ahead Basis Compared to Henry Hub Averaged Monthly
Source: SNL Financial
Source: RBN Energy
Northeast Gas Pipeline Additions

RATE AND REGULATORY DEVELOPMENTS

SCOTTMADDEN, INC. | 13NEW YORK’S REV: WORKING THROUGH THE DETAILS OF NY GRID TRANSFORMATION
The New York PSC seeks details on a new market construct, but progress is halting.
Details Being Sorted Out by Various Working Groups
• New York’s “Reforming the Energy Vision” (REV) initiative is setting the stage for increased promotion of distributed energy resources (DER) and energy efficiency
• Market Design and Platform Technology Working Group (MDPT) report identified and framed design and technology issues focused on distributed resource deployment
• In early June, the PSC created a separate docket to consider policy options for large-scale renewables under REV, including (among other things) bundled procurement of RECs and energy by utility competitive solicitation
Some Important Questions Are Still to Be Addressed
• How large and at what “level” will the REV market be, and how fast can or will it be created?
• What will REV implementation cost?
NOTES:PSC is the New York Public Service Commission; REC means renewable energy credit; CH is Central Hudson Gas & Electric Co.SOURCES:New York Public Service Commission; industry news; ScottMadden analysis
Some Key REV Activities and Policies
DER Ownership• Concerned about vertical market power, NYPSC said that utilities cannot own DER,
except in limited circumstances: › Market failure › Storage integrated into distribution system architecture › Low- or moderate-income customers underserved by DER › Demonstration projects (now being tested by Central Hudson’s ratepayer-paid
community solar)
Distribution System Implementation Plan (DSIP)• Utility REV filings must address:
› Advanced metering needs › Actual, forecast system loads, and capex projections › DER needs analysis, forecasts, and development plans › Cost estimates for DSIP capabilities › Other areas as suggested by MDPT
• Staff guidance is expected to be issued October 15
Small Resource Interconnection Streamlining and Enhancement• Standard processes contemplated for larger DER (≤5 MWs from current 2 MWs)
› Phase I: Online application; quick impact studies and decisions (initial DSIP) › Phase II: Feeder-level analysis, more granular studies; system risk assessment
• Utilities and EPRI jointly working on interconnection process and interim improvements, with proposed processes to be outlined in the DSIPs
REV Demonstration Projects• On July 1, utilities filed proposals with the PSC for demonstration projects, testing REV
goals, including: › Solar/storage virtual power plant (ConEd) › Web-based exchange for energy management products/services (CH) › “Flexible interconnect capacity” for controllable DER (NYSEG)

SCOTTMADDEN, INC. | 14
Getting a Clear Idea of REV Costs and Benefits Is Now a Priority
• NYPSC has said that energy efficiency should go beyond “dollar-for-dollar” savings and MW/MWh reduction, but should also be judged on contribution to “market transformation” and move beyond “ratepayer contributions through system benefits charges”—it is unclear on how these programs will be paid for
• PSC Staff issued the Benefit-Cost Analysis (or BCA), which is a framework by which utilities will assess DER vs. traditional infrastructure to address system needs. The PSC has stated that a formalized benefit-cost analysis will not be definitive in every instance. A description of those proposed criteria is shown on the next page
Utilities and Regulators Must Understand Practical Implications of the Proposed REV Model
• How quickly can REV be implemented given the industry’s experience with wholesale energy markets?• Exactly how big is the potential “transactive energy market” that this is trying to serve?• What is the financial case for a distribution-level market?
NEW YORK’S REV: DETAILS OF NY GRID TRANSFORMATION
NOTES:REV is “Reforming the Energy Vision”; † means deadline was extended from originalSOURCES:New York Public Service Commission; industry news; ScottMadden analysis
NY utilities and the Commission will look at implications of REV.
Latest Major REV Filing Deadlines: The Timeline Has Had Several Extensions
July
• Utilities file Energy Efficiency Transition Implementation Plan
2015 2016
June
• Utilities file DSIP†
July
• Staff proposals on potential utility ratemaking changes (Track Two)† and DER supplier oversight†
• PSC Staff REV benefit-cost framework†
• MDPT initial report due†
September
• Staff reports on DG emission rules, billing initiatives
Utility Activity
PSC Staff, working group activity October
• PSC Staff guidance on DSIPs†
May
• Utilities file annual Energy Efficiency Transition Implementation Plan

SCOTTMADDEN, INC. | 15
NEW YORK’S REV: DETAILS OF NY GRID TRANSFORMATION
BENEFITSRate Impact
MeasureSocietalUtility Cost
NOTES:*BCA means benefit-cost analysis. **These are item- and project-specific. BCA table is from NYPSC Staff’s white paper on REV BCA dated July 1, 2015 (Table 1, p. 12)SOURCES:New York Public Service Commission; industry news; ScottMadden analysis
Avoided Generation Capacity (ICAP), including Reserve Margin
Avoided Energy (LBMP)
Avoided Ancillary Services
Avoided Distribution Capacity Infrastructure
Avoided Water Impacts**
Incremental Transmission & Distribution and Distribution System Platform Costs
Avoided Transmission Capacity Infrastructure and Related Operations and Maintenance (O&M)
Wholesale Market Price Impacts
Avoided O&M
Net Avoided Restoration Costs
Net Avoided Greenhouse Gases
Avoided Land Impacts**
Program Administration Costs
Participant Distributed Energy Cost
Lost Utility Revenue
Shareholder Incentives
Avoided Transmission Losses
Avoided Distribution Losses
Net Avoided Outage Costs
Net Avoided Criteria Air Pollutants
Net Non-Energy Benefits (e.g., avoided service terminations)**
Added Ancilliary Service Costs
Net Non-Energy Costs**
COSTS
Reliability/Resiliency
External
Distribution System
Bulk System
BCA* Test Perspective
NYPSC Staff’s Benefit-Cost Analysis Framework

SCOTTMADDEN, INC. | 16
Foundational Principles for Staff’s Proposals
• Align earning opportunities with customer value• Maintain flexibility• Provide accurate and appropriate value signals• Maintain a sound electric industry• Shift balance of regulatory incentives to market incentives• Achieve public policy objectives
Three Categories of Suggested Reforms
• Utility business model reforms, including opportunities for market-based earnings• Incremental ratemaking reforms to the utility revenue model• Rate design reforms to reflect the needs of the evolving energy marketplace
PSC Staff’s Position on Key Ratemaking Issues
The Ratemaking Construct
NEW YORK’S REV: PSC STAFF ENVISIONS SIGNIFICANT RATEMAKING REFORMS
NYPSC Staff releases a white paper (and an alphabet soup of acronyms) proposing fundamental changes in the utility business model and rate paradigm.
The ratemaking paradigm should be used to encourage, not deter or delay, …optimal investment in and management of the system
including the deployment and use of [distributed energy resources].– NYPSC Staff
• Deems traditional cost-of-service approach to ratemaking “insufficient” to realize the NYPSC’s vision of a multi-sided platform (like Amazon)
› In a platform model, buyers, sellers, and the platform provider each interact with two or more parties (vs. a linear transaction system between buyer and seller)
› But because market investments could displace utility investments, PSC Staff believes utilities may have a disincentive to encourage an efficient market and use lowest-cost funding
• Advocates gradual changes in rate design, phasing carefully to assess bill impact, and using earnings impact mechanisms (EIM) as a temporary transition toward more market-based earnings (MBE) and less rate-base earnings
• Indicates ratemaking treatment should vary between that derived from utility-monopoly functions and from competitive functions
NYPSC recommends utility earnings be derived from three sources:
Rate-base Earnings (at least for an interim period)
Earnings Impact Mechanisms – essentially performance-based rates for things like peak reduction
Market-Based Earnings*
Utility earnings from facilitating transaction of value-added services on distributed system platform
*

SCOTTMADDEN, INC. | 17
NY’S REV: PSC STAFF ENVISIONS SIGNIFICANT RATEMAKING REFORMS
NOTES:DER means distributed energy resourcesSOURCES:NYPSC Staff; ScottMadden analysis
• Recognizes implementation issues such as ratepayer impact, degree of utility control over outcomes, novelty of metrics proposed, and impact on utilities’ financial opportunities
• Favors long-term rate plans (three to five years) with possible extensions (two years)
• Promotes net energy metering as successful tool and advocates expansion for use with DER
• Calls for review of net plant reconciliation mechanism (also known as “clawback”)
› Makes utilities indifferent between a rate-based approach (utility capital) vs. third-party capital or operating expenses
› Encourages the most cost-efficient approach to investment
• Provides for MBEs for value-added services• Expects utilities to derive increasing share of earnings from
MBEs from value-added services• Expects that a primary vehicle for MBEs will be platform
service revenues (PSR) such as microgrid engineering, data analysis, platform access fees, and enhanced power quality
• Believes that MBEs and PSRs should supplant EIMs in a full-scale market
• Recommends earnings sharing mechanisms (ESMs) (between utilities and customers), currently being used in NY, be adapted to outcome-based ratemaking (not a cap on earnings)
The Role of Market-Based Services
Changing the Utilities’ Incentives
The Implementation Challenge and Adaptation over Time
PSC Staff proposes possible scorecards for NY REV business model
effectiveness using several metrics
R System utilization and efficiency
R Distributed generation, energy efficiency, and dynamic load management penetration
R Opt-in time-of-use rate efficacy
R Market development
R Market-based revenues use
R Carbon reduction
R Customer satisfaction
R Customer enhancement
R Conversion of fossil-fueled end uses (e.g., electric vehicles)
Proposed Categories for EIMs (Near Term)
Energy Efficiency
Affordability
Interconnection
Peak Reduction
Customer Engagement and Information Access

SCOTTMADDEN, INC. | 18FERC “MONEYBALL”: FERC APPROVES METRICS TO MEASURE TRANSMISSION INVESTMENT POLICY EFFECTIVENESS
Commissioner Clark compares the effort to statistics-driven baseball decision making.
FERC Seeks Tangible Measures of Policy Effectiveness
• In April, FERC Staff proposed, and all Commissioners supported, six metrics to assess FERC transmission policy effectiveness
• Metrics focus on timeliness and cost effectiveness of transmission investment and will compare performance before and after Order 1000
• These are different from those proposed by staff in 2014 to measure reliability, operations, and market performance• Staff has yet to report on these 2015 metrics and will use its initial assessment for industry outreach, refinement of analysis,
and consideration of other metrics• Given differences in territory, local siting rules, costs, and markets across the country, deriving a true “apples-to-apples”
transmission-effectiveness comparison from standardized metrics could prove challenging
People…operate with beliefs and biases. To the extent you can eliminate both and replace them with data, you gain a clear advantage.
– Michael Lewis, Moneyball: The Art of Winning an Unfair Game
Area
Whether appropriate levels of transmission infrastructure exist
FERC Staff’s Six Proposed Transmission Investment Policy Effectiveness Measures
Metric and Description Comments
Load-weighted curtailment frequency: Number of transmission loading relief orders or unscheduled flow events of a transmission owner, state, or region in bilateral markets, normalized on retail load
• Applicable in bilateral markets• Indicates unmet need for transmission upgrades
RTO/ISO market price differential: Persistence (in years) of pricing differentials for zonal, nodal, or trading hub pairs of locational marginal prices, forward capacity prices, and trading hub prices
• Needed because RTOs use pricing, not curtailment, to manage congestion
Relative transmission levels and cost effectiveness of investment
Load-weighted circuit miles: Circuit miles of transmission added to the grid (cumulative and incremental), weighted by retail load (kWh)
• Must normalize for factors like population density, terrain, state siting rules, etc.
• Could facilitate comparison of RTO/ISO to bilateral markets
• For investment cost, must normalize for regional labor costs, design standards, etc.
Load-weighted transmission investment: Incremental dollars spent on new transmission capital additions, weighted by retail load (kWh)
Circuit miles per dollar of investment: Number of circuit miles added by an entity in a given year divided by total dollars invested
Evaluation of key goals of Order 1000
Percentage of non-incumbent transmission bids or proposals: Number of bids/proposals in a given year from non-incumbents divided by total bids/proposals
• Need to confirm incumbency status of bidders for potential affiliates and JVs and adjust for state rights of first refusal
• Will not provide a good barometer for Order 1000—focus should be on process effectiveness
SOURCES:FERC; ScottMadden analysis

CLEAN TECH AND ENVIRONMENT

SCOTTMADDEN, INC. | 20THE CLEAN POWER PLAN: EPA RELEASES ITS FINAL RULE
On August 3, EPA released its 1,500-page final rule governing performance standards for greenhouse gas emissions for existing and new power generation sources, termed the Clean Power Plan (CPP). The energy industry continues to try to untangle the rule and its implications.
SOURCES:EPA; ScottMadden analysis
3,000
2012 Emissions Rate (Est.)
State and Tribal Lands CO2 Emissions Rate Interim and Final Goals
vs. 2012 Estimated Actual CO2 Emissions Rates
(in Pounds of CO2 per MWh)
Po
un
ds
of
CO
2 p
er
MW
h
2,500
2,000
1,500
1,000
500
0
MT IDND CT
Mojav
e Lan
dsMERICAMAORNJNVNHNYMSFLDEVAALAZOKTXWALAPAGANCARSCNMUTOHMICOWI
MOINMDMNWV
Nava
jo La
ndsTN
Uint
ah La
nds
NEKYILIASDKSWY
Interim Goal (2022-29 Avg.)
Final Goal (2030-On)

SCOTTMADDEN, INC. | 21
THE CLEAN POWER PLAN: EPA RELEASES ITS FINAL RULE
EPA Emissions Rate Targets Vary by Technology and State
• Final individual state goals lie between these fossil steam and combustion turbine (CT) technology targets shown at right, depending upon the amount of a state’s existing and anticipated generation mix
• Existing technology (supercritical and natural gas CT) emissions well exceed targeted levels, so states will likely have to employ other measures (renewables, early action, trading) to comply
• Effectively requiring “outside the fence” will lead to legal challenges to the rule
Po
un
ds
of
CO
2 p
er
MW
h
Interim Rate (2022-29 Avg.)
1,800
1,600
1,000
400
0Fossil Steam Units Combustion Turbine Units
Final Rate (2030-On)
Supercritical Coal:~1,705*
NG Combustion Turbine: ~1,110**
NG Combined Cycle: ~786*
Target Existing Source Emissions Rates and Illustrative Emissions Rates by Technology (in Pounds of CO
2 per MWh)
1,400
800
200
1,200
600
NOTES:Dotted lines show current technology emissions rates based upon illustrative configurations; *Emissions based on net power; **CT without combined heat and power; ***2012 emissions are unadjusted and exclude under construction units; goals exclude New Source Complement, which increases emissions limits to accommodate load growth but pegs incremental emissions at compliance rates.SOURCES:EPA; DOE Nat’l Energy Technology Laboratory; industry reports; ScottMadden analysis
Clean Power Plan Finalization and Compliance Timing
Aug. 2015: Clean Power Plan issued
TBD: Publication in the Federal Register
60 days after publication in the Federal Register: deadline for petitions for court review
Summer 2016: Proposed federal plan issued
Sept. 2017: Progress updates (for states with extensions) due
Sept. 2019 (or 12 months after submission): EPA deadline to accept or reject state plans
2025-2027: Interim compliance period 2
2030-On: Final compliance
90 days after publication in the Federal Register: comments on proposed federal model plan
Sept. 2016: State implementation plans—or petitions for extension—due
Sept. 2018: Final state implementation plans due
2022-2024: Interim compliance period 1
2028-2029: Interim compliance period 3
“Glide Path” Goals: Targeted Emissions Change (in Tons) from 2012 Observed CO2 Emissions***
2022-2024: Decrease of 9%
2025-2027: Decrease of 17%
2028-2029: Decrease of 21%
2030-On: Decrease of 23%
Source: ScottMadden analysis
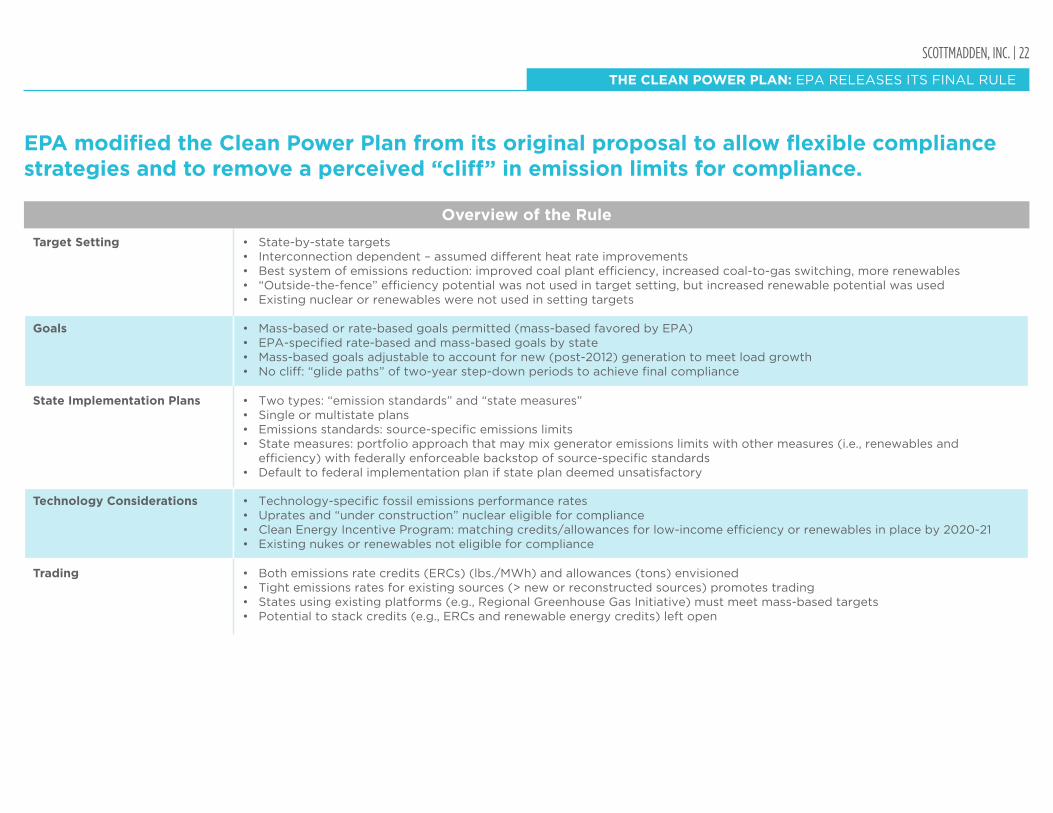
SCOTTMADDEN, INC. | 22
THE CLEAN POWER PLAN: EPA RELEASES ITS FINAL RULE
Target Setting
Goals
• State-by-state targets• Interconnection dependent – assumed different heat rate improvements• Best system of emissions reduction: improved coal plant efficiency, increased coal-to-gas switching, more renewables • “Outside-the-fence” efficiency potential was not used in target setting, but increased renewable potential was used• Existing nuclear or renewables were not used in setting targets
• Mass-based or rate-based goals permitted (mass-based favored by EPA)• EPA-specified rate-based and mass-based goals by state• Mass-based goals adjustable to account for new (post-2012) generation to meet load growth• No cliff: “glide paths” of two-year step-down periods to achieve final compliance
State Implementation Plans • Two types: “emission standards” and “state measures”• Single or multistate plans• Emissions standards: source-specific emissions limits• State measures: portfolio approach that may mix generator emissions limits with other measures (i.e., renewables and
efficiency) with federally enforceable backstop of source-specific standards• Default to federal implementation plan if state plan deemed unsatisfactory
Overview of the Rule
Technology Considerations • Technology-specific fossil emissions performance rates• Uprates and “under construction” nuclear eligible for compliance• Clean Energy Incentive Program: matching credits/allowances for low-income efficiency or renewables in place by 2020-21• Existing nukes or renewables not eligible for compliance
Trading • Both emissions rate credits (ERCs) (lbs./MWh) and allowances (tons) envisioned• Tight emissions rates for existing sources (> new or reconstructed sources) promotes trading• States using existing platforms (e.g., Regional Greenhouse Gas Initiative) must meet mass-based targets• Potential to stack credits (e.g., ERCs and renewable energy credits) left open
EPA modified the Clean Power Plan from its original proposal to allow flexible compliance strategies and to remove a perceived “cliff” in emission limits for compliance.

SCOTTMADDEN, INC. | 23
THE CLEAN POWER PLAN: EPA RELEASES ITS FINAL RULE
Area
Compliance Time Frame
Comparing the Final Rule with the Proposed Rule
Proposed Rule Final Rule
• Begins 2020 • Begins 2022 (with credit for early action)
• Four building blocks, including “outside-the-fence” demand-side efficiency and renewables
• Three building blocks, but still includes “outside-the-fence” renewables
Building Blocks to Set Targets
• State “estimates” for emissions with one size fits all (e.g., nuclear generation endowment)
• Assumed 6% improvement in fossil steam heat rates• Energy efficiency potential part of portfolio• Nuclear generation used in goal setting• Natural gas combined cycle assumed to operate at 70% of
nameplate capacity• Renewables targeted at 22% of MWh generation• Projected 30% cut in CO
2 from 2005 levels
• Interconnection-level estimates, apportioned to states• Interconnection-dependent improvement in fossil steam heat
rates of 2.1% to 4.3%• Energy efficiency not used in goal setting; potential part of state
plans• Nuclear generation not used in goal setting; new build and
uprates may be in state plans• Natural gas combined cycle assumed to operate at 75% of net
summer capacity• Renewables targeted at 28% of MWh generation due to lower
installed costs• Projected 32% cut in CO
2 from 2005 levels
Portfolio and Emissions Assumptions for Targets
• S-curve creates “cliff” • Step-down glide path in three two-year periods prior to final compliance
Timing of Reductions
• Direct emissions limits and “portfolio” approach • Similar to proposed rule: “emissions standards” and “state measures”
State Plan Options
• Up-front agreements required • No up-front interstate agreements needed• Trading-ready option proposed
Interstate Trading Mechanisms
• Not addressed • Requirement for states to address reliability issues in plans• Mechanism for states to seek plan revision if unanticipated
reliability issues arise• Reliability safety valve to address “unanticipated” circumstances
requiring affected power plant to generate despite CO2
emissions constraints
Reliability Impacts
The final rule differs from the 2014 proposed rule in some meaningful ways.

SCOTTMADDEN, INC. | 24
THE CLEAN POWER PLAN: EPA RELEASES ITS FINAL RULE
EPA Says That under the Clean Power Plan:
• Mass-based approaches are less expensive, on a national basis, than rate-based approaches, according to EPA’s “illustrative analysis”
• States have “unlimited flexibility” to leverage efficiency investments under mass-based plans• States currently implementing mass-based trading programs (e.g., Regional Greenhouse Gas Initiative) have a “ready path
forward” under a mass-based “state measures” compliance approach
EPA’s Compliance Pathways
Source: EPA
Type Requirements, Plan Type, and Trading Options
EPA Mass Goal for Existing Units with EPA New Unit
Complement
EPA Mass Goal for Existing Units Only
State Measures (Can include Mass Limit for
Existing and New)
Use Sub-Categorized CO2
Emission Performance Rates
Use State CO2 Emission Goal
Rate for Existing Units
Use Varied CO2 Emission
Rates among Existing Units
Demonstration to Address Potential Leakage
Demonstration to Address Potential Leakage
Projection that Plan will Achieve the Goal
Backstop Emission Standards
Additional Reports
EM&V Plan
Measurement & Verification of EE/RE Savings
Documentation of EE/RE Savings
EM&VPlan
Measurement & Verification of EE/RE Savings
Documentation of EE/RE Savings
Projection that Plan will Achieve the Goal
EM&VPlan
Measurement & Verification of EE/RE Savings
Documentation of EE/RE Savings
Legend
EPA Model Rule for Emissions Trading
STATE MEASURESTrading: Can Be Made
Trading Ready
EMISSION STANDARDSTrading: Trading Ready
EMISSION STANDARDSTrading: Intrastate; Intrastate
with Multistate Plan
EMISSION STANDARDSTrading: Intrastate
STATE MEASURESTrading: Trading Ready
Mass
Rate
State Must Choose a Path
SCOTTMADDEN, INC. | 25
THE CLEAN POWER PLAN: EPA RELEASES ITS FINAL RULE
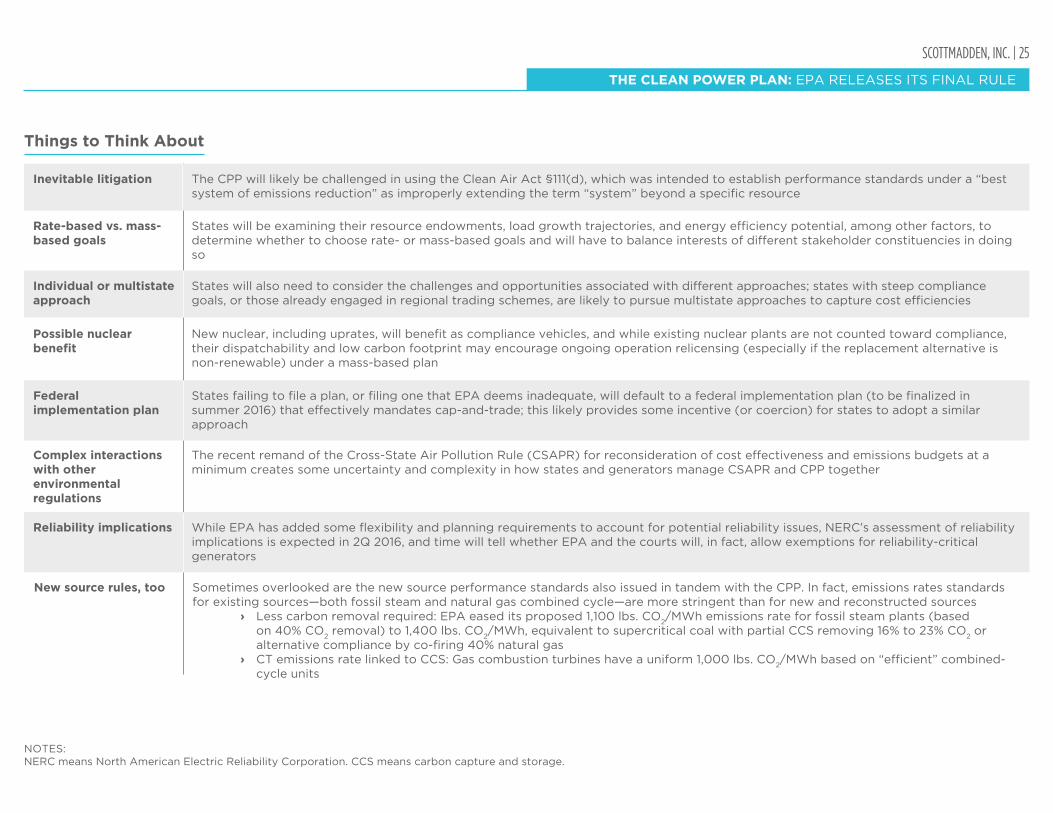
Things to Think About
Rate-based vs. mass-based goals
States will be examining their resource endowments, load growth trajectories, and energy efficiency potential, among other factors, to determine whether to choose rate- or mass-based goals and will have to balance interests of different stakeholder constituencies in doing so
Possible nuclear benefit
New nuclear, including uprates, will benefit as compliance vehicles, and while existing nuclear plants are not counted toward compliance, their dispatchability and low carbon footprint may encourage ongoing operation relicensing (especially if the replacement alternative is non-renewable) under a mass-based plan
Complex interactions with other environmental regulations
The recent remand of the Cross-State Air Pollution Rule (CSAPR) for reconsideration of cost effectiveness and emissions budgets at a minimum creates some uncertainty and complexity in how states and generators manage CSAPR and CPP together
New source rules, too Sometimes overlooked are the new source performance standards also issued in tandem with the CPP. In fact, emissions rates standards for existing sources—both fossil steam and natural gas combined cycle—are more stringent than for new and reconstructed sources
› Less carbon removal required: EPA eased its proposed 1,100 lbs. CO2/MWh emissions rate for fossil steam plants (based
on 40% CO2 removal) to 1,400 lbs. CO
2/MWh, equivalent to supercritical coal with partial CCS removing 16% to 23% CO
2 or
alternative compliance by co-firing 40% natural gas › CT emissions rate linked to CCS: Gas combustion turbines have a uniform 1,000 lbs. CO
2/MWh based on “efficient” combined-
cycle units
Inevitable litigation The CPP will likely be challenged in using the Clean Air Act §111(d), which was intended to establish performance standards under a “best system of emissions reduction” as improperly extending the term “system” beyond a specific resource
Individual or multistate approach
States will also need to consider the challenges and opportunities associated with different approaches; states with steep compliance goals, or those already engaged in regional trading schemes, are likely to pursue multistate approaches to capture cost efficiencies
Federal implementation plan
States failing to file a plan, or filing one that EPA deems inadequate, will default to a federal implementation plan (to be finalized in summer 2016) that effectively mandates cap-and-trade; this likely provides some incentive (or coercion) for states to adopt a similar approach
Reliability implications While EPA has added some flexibility and planning requirements to account for potential reliability issues, NERC’s assessment of reliability implications is expected in 2Q 2016, and time will tell whether EPA and the courts will, in fact, allow exemptions for reliability-critical generators
NOTES:NERC means North American Electric Reliability Corporation. CCS means carbon capture and storage.

SCOTTMADDEN, INC. | 26EPA’S COAL COMBUSTION RESIDUALS RULE: UTILITIES MUST DEVELOP A COMPLIANCE APPROACH
EPA publishes its long-awaited final Coal Combustion Residuals (CCR) Rule, but spares CCRs “hazardous” treatment.
• Originally proposed in July 2010 and previewed in December 2014, EPA formally published its final CCR rule in April 2015
• The rule regulates the disposal of CCRs from active electric generating units as nonhazardous waste under Subtitle D of the Resource Conservation and Recovery Act. The rule becomes effective October 14, 2015
› Hazardous waste classification would have increased costs by an estimated $10B to $15B per year
• The final rule establishes minimal national criteria for CCR landfills and CCR surface impoundments. Specific criteria include:
› Location restrictions › Structural integrity requirements › Liner design criteria › Groundwater monitoring and corrective action
requirements › Operating criteria (e.g., fugitive dust) › Closure and post-closure care requirements › Recording, notification, and internet posting requirements
• Sites must retrofit or close if they fail to meet the criteria established by the new rule
• Owners and operators have historically lacked rigorous management of CCR sites. This rule will require owners and operators to follow a programmatic approach to build an effective compliance strategy and organizational capabilities
A Tall Order: Timeline of Implementation Deadlines
2015
2016
2017
2018
December
• Permanent marker (surface impoundment)
October
• Air criteria• Record-keeping• Notification• Internet req.• Weekly/monthly
inspections
January
• Annual inspection
October
• Design criteria (surface impoundments)
• Structural integrity (surface impoundments)
• Hydrologic and hydraulic capacity (surface impoundments)
• Run-on and run-off controls (landfills)
• Closure and post-closure care
April
• Emergency action plan (surface impoundments)
October
• Groundwater monitoring and corrective action
October
• Location restrictions
SOURCES:EPA; SNL Financial; Scientific American; ScottMadden analysis
SCOTTMADDEN, INC. | 27
EPA’S CCR RULE: UTILITIES MUST DEVELOP A COMPLIANCE APPROACH
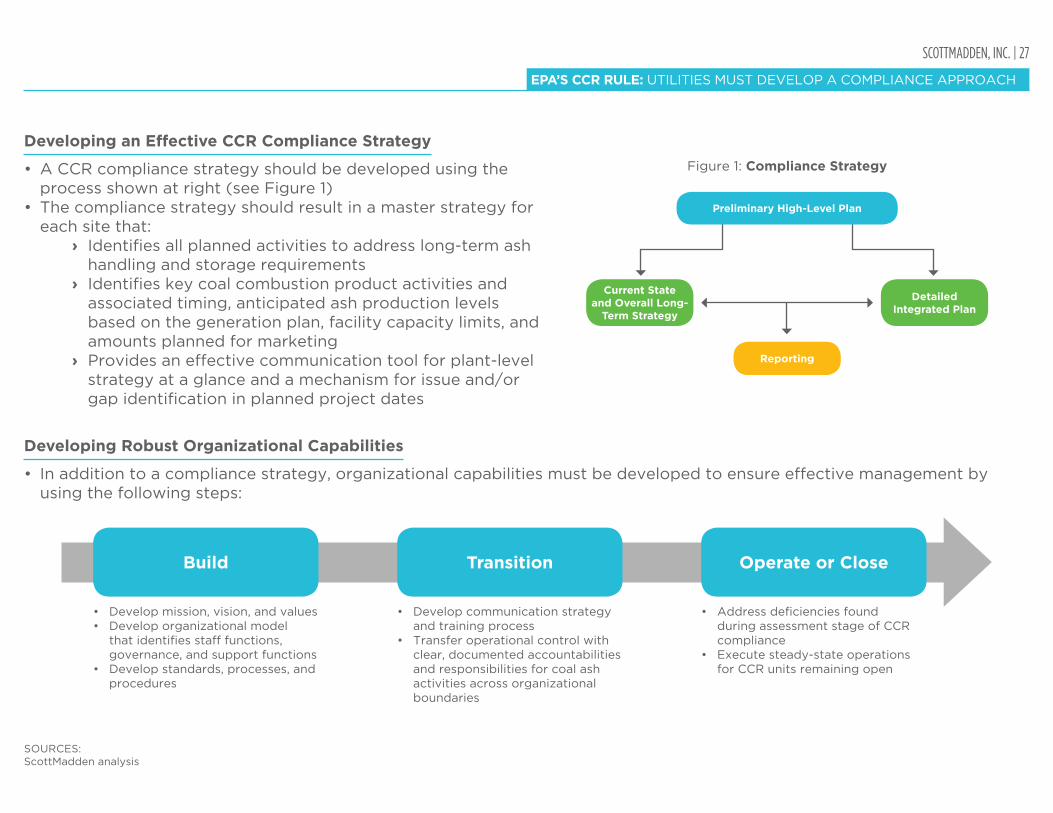
Developing an Effective CCR Compliance Strategy
• A CCR compliance strategy should be developed using the process shown at right (see Figure 1)
• The compliance strategy should result in a master strategy for each site that:
› Identifies all planned activities to address long-term ash handling and storage requirements
› Identifies key coal combustion product activities and associated timing, anticipated ash production levels based on the generation plan, facility capacity limits, and amounts planned for marketing
› Provides an effective communication tool for plant-level strategy at a glance and a mechanism for issue and/or gap identification in planned project dates
Developing Robust Organizational Capabilities
• In addition to a compliance strategy, organizational capabilities must be developed to ensure effective management by using the following steps:
SOURCES:ScottMadden analysis
• Develop mission, vision, and values• Develop organizational model
that identifies staff functions, governance, and support functions
• Develop standards, processes, and procedures
• Develop communication strategy and training process
• Transfer operational control with clear, documented accountabilities and responsibilities for coal ash activities across organizational boundaries
• Address deficiencies found during assessment stage of CCR compliance
• Execute steady-state operations for CCR units remaining open
Build Transition Operate or Close
Figure 1: Compliance Strategy
Preliminary High-Level Plan
Detailed Integrated Plan
Current State and Overall Long-
Term Strategy
Reporting

SCOTTMADDEN, INC. | 28EVERYTHING UNDER THE SUN: COMMUNITY SOLAR IS ABOUT TO SHINE
Community solar programs are beginning to take off nationwide, but are especially promising in California, Colorado, Massachusetts, and Minnesota.
Community Solar Defined
• Multiple end users purchase a portion of the capacity or output produced from a solar photovoltaic (PV) facility and get a benefit on their electric bill
• The project is often, but not always, located near the end customer or within the utility’s jurisdiction
• Community solar increases customer choice and engagement and leverages some of the economic and operational advantages of utility-scale solar. Community solar is cheaper than rooftop, but usually not as cheap as utility scale
• Regulatory and business model considerations are important (e.g., who owns the asset, what is the rate treatment, what are the rules around customer aggregation, what constitutes a utility, etc.)
SOURCES:GTM Research; California PUC; Shared Renewables HQ; DSIRE; ScottMadden research
600
500
400
300
200
100
0
2,000
1,500
1,000
500
0An
nu
al
Inst
all
ati
on
s (M
W-d
c)
Cu
mu
lativ
e In
stalla
tion
s (MW
-dc)
Actual and Projected Community Solar Installations (2010-2020)
2010 2019E2018E2017E2016E2015E2014201320122011 2020E
CumulativeAnnual
Active Community Solar Legislation
Status of Community Solar in the United States
Shared Renewable Net Metering
Developing Community Solar Legistlation
No Major Activity
Top Community Solar States
120
100
80
60
40
20
0
Total U.S. Households
Homeownership Status
Residential Rooftop Solar Limitations and Market Potential
U.S
. H
ou
seh
old
s (M
illio
ns)
Unfavorable Net Metering
Low Credit Score
Unsuitable Rooftop
Rooftop Solar Market
Note: Customers who rent or have rooftops unsuitable for solar can participate in the solar market via community solar
Source: GTM Research and Vox
Source: GTM Research
Source: GTM Research and Vox
Residential solar has great potential, but a number of factors may limit its availability or attractiveness to
certain customers
SCOTTMADDEN, INC. | 29
EVERYTHING UNDER THE SUN: COMMUNITY SOLAR IS ABOUT TO SHINE
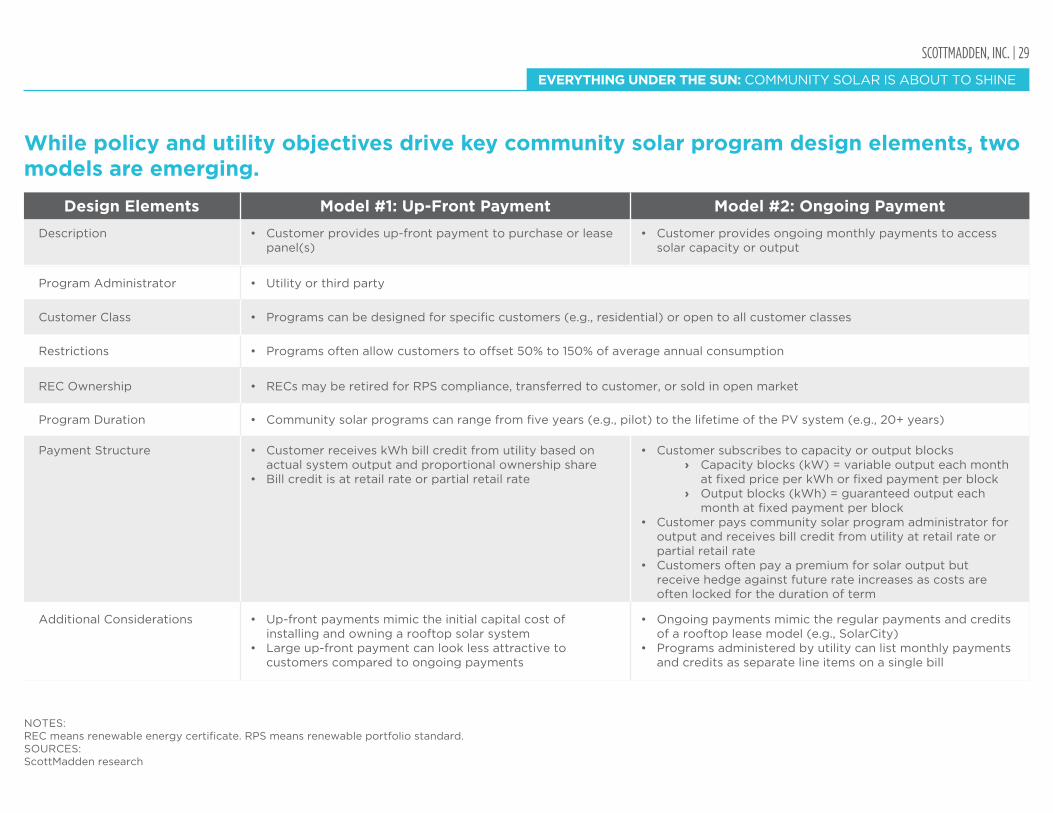
While policy and utility objectives drive key community solar program design elements, two models are emerging.
NOTES:REC means renewable energy certificate. RPS means renewable portfolio standard.SOURCES:ScottMadden research
Design Elements Model #1: Up-Front Payment Model #2: Ongoing Payment
Description
REC Ownership
Payment Structure
Customer Class
Program Administrator
• Customer provides up-front payment to purchase or lease panel(s)
• Customer provides ongoing monthly payments to access solar capacity or output
• Utility or third party
• RECs may be retired for RPS compliance, transferred to customer, or sold in open market
• Programs can be designed for specific customers (e.g., residential) or open to all customer classes
Restrictions • Programs often allow customers to offset 50% to 150% of average annual consumption
Program Duration • Community solar programs can range from five years (e.g., pilot) to the lifetime of the PV system (e.g., 20+ years)
• Customer receives kWh bill credit from utility based on actual system output and proportional ownership share
• Bill credit is at retail rate or partial retail rate
• Customer subscribes to capacity or output blocks › Capacity blocks (kW) = variable output each month
at fixed price per kWh or fixed payment per block › Output blocks (kWh) = guaranteed output each
month at fixed payment per block• Customer pays community solar program administrator for
output and receives bill credit from utility at retail rate or partial retail rate
• Customers often pay a premium for solar output but receive hedge against future rate increases as costs are often locked for the duration of term
Additional Considerations • Up-front payments mimic the initial capital cost of installing and owning a rooftop solar system
• Large up-front payment can look less attractive to customers compared to ongoing payments
• Ongoing payments mimic the regular payments and credits of a rooftop lease model (e.g., SolarCity)
• Programs administered by utility can list monthly payments and credits as separate line items on a single bill
SCOTTMADDEN, INC. | 30ENERGY STORAGE: WHEN WILL REALITY CATCH UP TO THE HYPE?
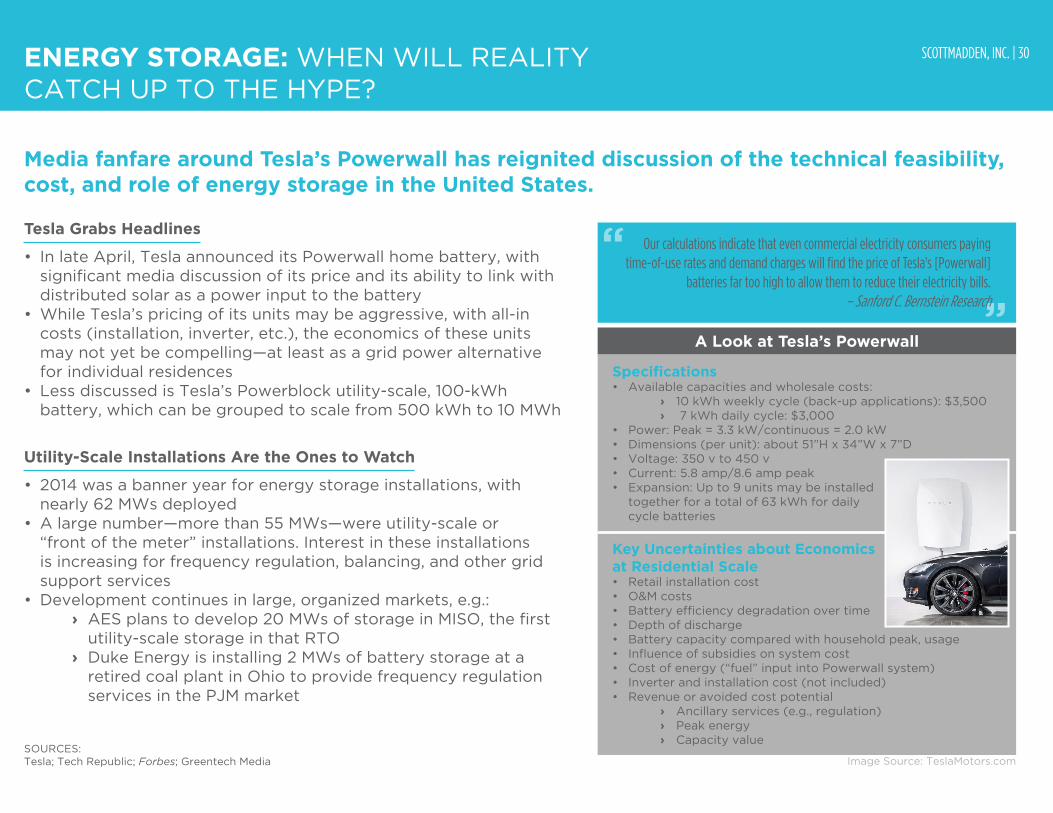
Media fanfare around Tesla’s Powerwall has reignited discussion of the technical feasibility, cost, and role of energy storage in the United States.
Tesla Grabs Headlines
• In late April, Tesla announced its Powerwall home battery, with significant media discussion of its price and its ability to link with distributed solar as a power input to the battery
• While Tesla’s pricing of its units may be aggressive, with all-in costs (installation, inverter, etc.), the economics of these units may not yet be compelling—at least as a grid power alternative for individual residences
• Less discussed is Tesla’s Powerblock utility-scale, 100-kWh battery, which can be grouped to scale from 500 kWh to 10 MWh
Utility-Scale Installations Are the Ones to Watch
• 2014 was a banner year for energy storage installations, with nearly 62 MWs deployed
• A large number—more than 55 MWs—were utility-scale or “front of the meter” installations. Interest in these installations is increasing for frequency regulation, balancing, and other grid support services
• Development continues in large, organized markets, e.g.: › AES plans to develop 20 MWs of storage in MISO, the first
utility-scale storage in that RTO › Duke Energy is installing 2 MWs of battery storage at a
retired coal plant in Ohio to provide frequency regulation services in the PJM market
SOURCES:Tesla; Tech Republic; Forbes; Greentech Media
Specifications• Available capacities and wholesale costs:
› 10 kWh weekly cycle (back-up applications): $3,500 › 7 kWh daily cycle: $3,000
• Power: Peak = 3.3 kW/continuous = 2.0 kW• Dimensions (per unit): about 51”H x 34”W x 7”D• Voltage: 350 v to 450 v• Current: 5.8 amp/8.6 amp peak• Expansion: Up to 9 units may be installed
together for a total of 63 kWh for daily cycle batteries
Key Uncertainties about Economics at Residential Scale• Retail installation cost• O&M costs• Battery efficiency degradation over time• Depth of discharge• Battery capacity compared with household peak, usage• Influence of subsidies on system cost• Cost of energy (“fuel” input into Powerwall system)• Inverter and installation cost (not included)• Revenue or avoided cost potential
› Ancillary services (e.g., regulation) › Peak energy › Capacity value
A Look at Tesla’s Powerwall
Image Source: TeslaMotors.com
Our calculations indicate that even commercial electricity consumers paying time-of-use rates and demand charges will find the price of Tesla's [Powerwall]
batteries far too high to allow them to reduce their electricity bills. – Sanford C. Bernstein Research

SCOTTMADDEN, INC. | 31
• Through Q1 2015, nearly 6 MWs of energy storage systems were installed, outpacing Q1 2014, and Greentech Media forecasts 220 MWs in deployments in 2015
Looking for Ways to Play
• Business models continue to evolve, as companies like EnerNOC and SolarCity see battery storage as demand response and as a complement to its solar installations, respectively. For aggregators like EnerNOC, demand response compensation could be critical to its economic attractiveness
• Utilities are also testing the waters, preparing for a day when installed battery costs are significantly lower
› Oncor and Southern Company are partnering with Tesla on demonstration projects
› Green Mountain Power is also working with Tesla as a sales channel for its Powerwall product
• Australia may be a test bed for residential solar/battery applications even as its economics are a “push” in the United States. Morgan Stanley recently surveyed Australian households and found half would adopt solar PV with battery storage at a A$10,000 price point and 10-year payback period
ENERGY STORAGE: WHEN WILL REALITY CATCH UP TO THE HYPE?
Utility-Scale Energy Storage Cost and Maturity
Storage Technology Cost ($/kW) Cost ($/kWh) Tech. Maturity
Compressed Air (underground) 960-1,250 60-150 Demo to Mature
Pumped Hydro 1,500-2,700 138-338 Mature
Flow Batteries (zinc batteries) 1,450-2,420 290-1,350 Develop to Demo
Lead Acid Batteries 960-5,800 350-3,800 Demo to Mature
Compressed Air (above ground) 1,950-2,150 390-430 Demo to Deploy
Sodium Sulfur 3,100-4,000 445-555 Demo to Deploy
Flow Batteries (vanadium redox) 3,000-3,700 620-830 Demo to Deploy
Lithium-Ion 1,085-4,100 900-6,200 Demo to Mature
Flywheels 1,950-2,200 7,800-8,800 Demo to Mature
Power to Gas 1,370-2740 N/A Demo
0
20
40
80
60
Me
gaw
att
s
Annual U.S. Energy Storage Deployments (By Year)
Behind the Meter
Front of the Meter (Utility-Scale)
2013 2014
2.1
42.1
58
6.8
+47%
44.2
64.8
SOURCES:Greentech Media; Energy Storage Association; Dept. of Energy; SNL Financial; Forbes; Renew Economy; Sydney Morning Herald
Source: DOE, Grid Energy Storage (Dec. 2013)
Source: Greentech Media
MANAGING THE UTILITY ENTERPRISE

SCOTTMADDEN, INC. | 33CYBERSECURITY: IMPROVING UTILITY-GOVERNMENT INFORMATION SHARING
Lack of cyber threat data is a major concern for critical infrastructure industries.In a recent survey, participants were divided on the clarity and thoroughness of the federal government’s strategy. But nearly half of responding critical infrastructure organizations believe the U.S. government should create better ways to share security information with the private sector.
The Problem
• ScottMadden research shows many utilities lack actionable cybersecurity intelligence• Historically, utilities and other private firms have been reluctant to share their own cybersecurity information, either with
industry peers or the government due to: › Concerns about legal liability › Possibility of antitrust violations › Regulatory requirements › Protection of intellectual property and other proprietary information › A security emphasis on secrecy and confidentiality
Which statement best reflects your opinion on the cybersecurity strategy of the U.S. federal government?
Don’t know/no opinion (2%)
The U.S. government’s cybersecurity strategy is clear and thorough (22%)
The U.S. government’s cybersecurity strategy is somewhat clear and thorough (47%)
The U.S. government’s cybersecurity strategy is somewhat unclear and not very thorough (25%)
The U.S. government’s cybersecurity strategy is extremely unclear and not at all thorough (~5%)
If the U.S. federal government were to become more involved with cybersecurity, which of the following actions do you believe it should take?
40%30%20%10% 50%0%
38%Enact legislation with high fines for data breaches
Enact more stringent cybersecuirty legislation along the lines of PCI* 40%
Limit federal government IT purchasing to vendors that demostrate superior level of security in their products and processes
40%
Create better ways to share security information with the private sector 47%
Create and publicize a “black list” of vendors with poor product security 44%
Source: Enterprise Strategy Group Source: Enterprise Strategy Group
NOTES:Surveys reflect percentage of respondents out of 303 polled. On upper left, sums do not equal 100% due to independent rounding. Upper right results reflect multiple responses accepted; selected results displayed. *PCI stands for Payment Card Industry standardsSOURCES:Enterprise Strategy Group; ScottMadden research

SCOTTMADDEN, INC. | 34
CYBERSECURITY: IMPROVING UTILITY-GOV’T INFO. SHARING
NOTES:DHS is U.S. Dept. of Homeland Security; DOE is U.S. Dept. of Energy; NSA is the U.S. National Security Agency.SOURCES:Heritage Foundation; ISACA; Congressional Research Service; PC World; ScottMadden research
Some Proposed Legislative Solutions How the Proposed Bills Compare
• To address these concerns, in 2015, five federal cyber threat sharing bills were introduced, targeting these information-sharing barriers. The House passed two bills in April:
› H.R. 1731, the National Cybersecurity Protection Advancement Act of 2015 (NCPAA)
› H.R. 1560, the Protecting Cyber Networks Act (PCNA)
• The House bills encourage voluntary information sharing about cyber threats between the private sector and with the federal government
• NCPAA authorizes the use of DHS’s National Cybersecurity and Communications Integration Center to act as the primary hub for voluntary public and private cybersecurity information sharing
• PCNA does not authorize a hub, but rather provides a framework for sharing information with a number of federal agencies. Companies may share cyber threat information with the agency to which they are most aligned (e.g., DOE for utilities)
• Both bills provide protection for any liability that could result from information sharing
• Both require “reasonable” measures be taken to remove any personal information that is unrelated to a cyber risk or incident before sharing, but (for timely sharing) all unnecessary information need not be removed
• Privacy concerns have been raised: several digital rights groups and cybersecurity researchers oppose the bill, saying it requires data shared with civilian agencies, including potentially personal information, to be passed on to the NSA
• The Obama administration supported the House bills but has asked for significant changes to improve privacy and limit liability protections
• A Senate bill—the Cybersecurity Information Sharing Act of 2015—also opposed on privacy objections, has been stalled this summer and may finally get put to vote this session
• Observers expect that PCNA and NCPAA will be combined, but it is unclear how the bills will be reconciled
The Objections and Outlook

SCOTTMADDEN, INC. | 35
LC
OE
($
/MW
h)
Unsubsized Wind Compared to Natural Gas†(2015)
$140
$120
$100
$80
$60
$40
$20
$0
Natural Gas Price ($/MMBtu)
$2 $10$8$6$4 $12
Natural Gas
Onshore Wind(High Resource)
Onshore Wind(Low Resource)
RENEWABLES vs. GAS GENERATION: LEVELIZED COST OF ENERGY
At the right location, subsidized utility-scale solar and unsubsidized wind are close to competing with new natural gas-fired generation.
• Siting of solar and wind facilities in high-resource locations significantly improves project economics. Solar and wind levelized costs of energy (LCOE) improve 36% and 55%, respectively, when comparing a low-resource location to a high one
• This will be a critical factor for states and utilities to consider in developing Clean Power Plan strategies and/or trading regimes
• The charts on this page and the next compare the LCOE of wind and fixed-tilt solar to gas combined-cycle generation at various gas prices, using current installed costs, policy conditions, and high and low resource levels
› High wind and solar resources are 47% and 21% capacity factors, respectively › Low wind and solar resources are 21% and 13.6% capacity factors, respectively
• With high-resource locations, resulting in these higher capacity factors, wind and solar can be cost-competitive with gas-fired generation at reasonable gas prices (although not necessarily at current low gas prices)
NOTES:†The charts and calculations on this page and the next assume (i) fixed-tilt solar using premium panels; (ii) solar and wind installed costs represent most recent reported U.S. capacity-weighted industry average; (iii) residential solar includes accelerated depreciation, thereby reflecting third-party ownership; (iv) 25-year economic life for LCOE estimates; NV Energy calculation assumes 20-year economic life; (v) financing includes 60% debt at 5.5% interest over 20 years; 12% cost of equity; 40% tax rate. Solar projects receive 30% investment tax credit; wind projects do not receive any subsidies. Analyses in 2015 dollars. SOURCES:GTM/SEIA; NREL; DOE; EIA; DSIRE; ScottMadden analysis
Sources: DOE, NREL, EIA, DSIRE, ScottMadden analysis
$2.84/MMBtu—Average Henry Hub Price in July 2015
SCOTTMADDEN, INC. | 36
RENEWABLES vs. GAS GENERATION: LEVELIZED COST OF ENERGY
LC
OE
($
/MW
h)
$180
$160
$140
$120
$100
$80
$60
$40
$20
$0
Subsidized Solar Compared to Natural Gas†(2015)
Natural Gas Price ($/MMBtu)
$2 $10$8$6$4 $12
Natural Gas
Utility-Scale Solar(High Resource)
Utility-Scale Solar(Low Resource)
Residential Solar(High Resource)
Residential Solar(Low Resource)
Source: GTM/SEIA, NREL, EIA, DSIRE, ScottMadden analysis
$2.84/MMBtu—Average Henry Hub Price in July 2015
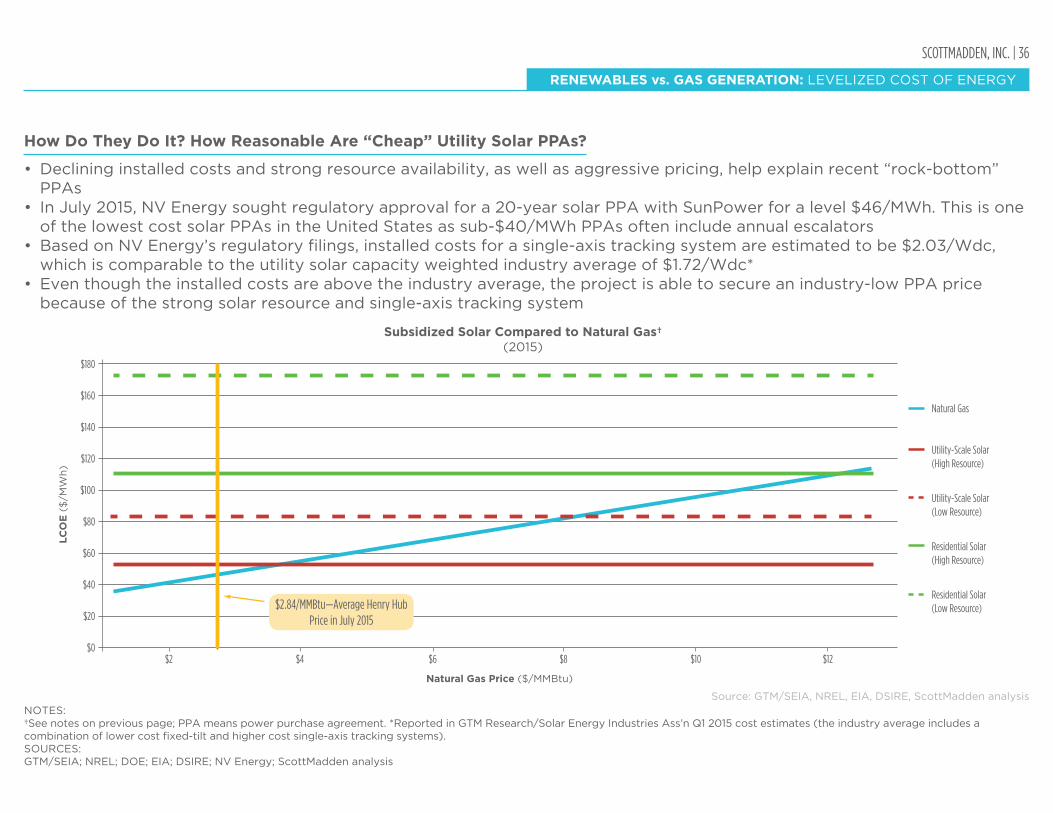
How Do They Do It? How Reasonable Are “Cheap” Utility Solar PPAs?
• Declining installed costs and strong resource availability, as well as aggressive pricing, help explain recent “rock-bottom” PPAs
• In July 2015, NV Energy sought regulatory approval for a 20-year solar PPA with SunPower for a level $46/MWh. This is one of the lowest cost solar PPAs in the United States as sub-$40/MWh PPAs often include annual escalators
• Based on NV Energy’s regulatory filings, installed costs for a single-axis tracking system are estimated to be $2.03/Wdc, which is comparable to the utility solar capacity weighted industry average of $1.72/Wdc*
• Even though the installed costs are above the industry average, the project is able to secure an industry-low PPA price because of the strong solar resource and single-axis tracking system
NOTES:†See notes on previous page; PPA means power purchase agreement. *Reported in GTM Research/Solar Energy Industries Ass’n Q1 2015 cost estimates (the industry average includes a combination of lower cost fixed-tilt and higher cost single-axis tracking systems).SOURCES:GTM/SEIA; NREL; DOE; EIA; DSIRE; NV Energy; ScottMadden analysis

SCOTTMADDEN, INC. | 37
RENEWABLES vs. GAS GENERATION: LEVELIZED COST OF ENERGY
NOTES:Analysis assumes (i) utility-scale fixed-tilt solar facility using premium panels in Kingman, Arizona; (ii) 7% per year decline in installed cost reflects the decrease in capacity-weighted average utility PV system price from Q1 2014 to Q1 2015; (iii) fixed O&M equals $25.66/kW and escalates 2.5%/year; (iv) 25-year economic life; (v) financing includes 60% debt at 5.5% interest over 20 years; 12% cost of equity; 40% tax rate. Analysis in nominal dollars.SOURCES:GTM/SEIA; NREL SAM; DOE; EIA; DSIRE; ScottMadden analysis
A thought experiment: Just how bright is the long-term outlook for utility-scale solar?Utility-Scale Solar as the “Least-Cost” Resource?
• After estimating average installed costs through 2025, ScottMadden finds the potential for utility-scale solar becoming the least-cost resource is primarily a function of changes in the investment tax credit and declining installed costs
• In the absence of carbon trading or Clean Power Plan impacts, solar subsidized with a 30% federal investment tax credit (ITC) competes with $4/MMBtu natural gas in 2016 (see chart at right)
• After changes to the ITC, solar subsidized with a 10% ITC does not compete with $4/MMBtu natural gas until 2024, assuming continued but decreasing experience curve effects will reduce the cost of solar (for reference, Henry Hub prices remained below $3/MMBtu in August 2015)
• If solar were to become the “least-cost” resource in the next decade, utilities and regulators would need to address the variable output in order to ensure system reliability
Key Assumptions to Thought Experiment
• ScottMadden calculated the LCOE of utility-scale solar in a high-resource location from 2010 to 2025
• Recent cost declines (7% per year) were applied to estimate installed costs in 2016 through 2025. This figure is significantly lower than the 26% and 14% decline reported in 2013 and 2014, respectively
• The analysis assumes the ITC drops from 30% to 10% in 2017• Impacts of the Clean Power Plan, state incentives, and
renewable portfolio requirements were not considered
Estimated LCOE of Utility-Scale Solar and Natural Gas(2010-2015)
$120
$110
$100
$90
$80
$70
$60
$50
$40
LC
OE
($
/MW
h)
2010 202420182017201620152014201320122011 202520232022202120202019
Natural Gas@ $4/MMBtu
Natural Gas@ $6/MMBtu
Utility-Scale Solar(actual)
Utility-Scale Solar(projected)
2010 202420182017201620152014201320122011 202520232022202120202019$4, 800 $893$1,382$1,487$1,599$1,720$1,850$2,140$2,900$3,850 $830$960$1,033$1,111$1,195$1,285
Installed Cost ($/kW-dc) (Actual and forecast at 7%/year decline)
Source: GTM/SEIA, NREL, EIA, DSIRE, ScottMadden analysis
Federal ITC decreases from 30% to 10% in 2017

SCOTTMADDEN, INC. | 38
Figure 1: Historic and Projected Expansion of Net Power Transmission Circuit Miles*
6,000
Cir
cu
it M
ile
s
-2,000
5,000
4,000
3,000
2,000
0
1960 2010200520001995199019851980197519701965 2015
NERC (>200kV)
Ventyx (>200kV)
Projected Transmission Additions from NERC under Form EIA-411 (>200kV)
EEI (>132kV) Projected Transmission Additions from NERC under Form EIA-411 (all)
THE ENERGY INDUSTRY: BY THE NUMBERS
Four Overarching Findings
• Transmission build out for replacement, market development, and reliability continues (Fig. 1)
• Pipelines are getting old (Fig. 2)• Weather events are becoming more frequent and expensive
(Fig. 3)• Utility workforces are still aging and now nearing retirement
(Fig. 4)
The first installment of the U.S. government’s Quadrennial Energy Review focuses on energy transmission, storage, and distribution infrastructure.
Figure 2: Age by Decade of U.S. Gas Transmission and Gathering Pipelines
1990s
2000s
Pre-1940s
1940s
1950s
1960s
1970s
1980s23%
24%
11%
10% 11%
9%
4%
8%
Figure 4: Workforce Age Distribution in the Electric and Natural Gas Utilities by Total Percent of Employees
25
2006
Pe
rce
nt
of
Em
plo
ye
es
20
15
10
5
0
2007
2010
2012
18-22 23-27 28-32 33-37 38-42 43-47 48-52 53-57 58-62 63-67 67+
Figure 3: Billion-Dollar Disaster Event Types by Year20
15
10
5
0
Nu
mb
er
of
Eve
nts
1980 1985 1990 1995 2000 2005 2010 2014
Drought
Flooding
Freeze
Severe Storm
Tropical Cyclone
Wildfire
Winter Storm
NOTES:*Figure 1 reflects data in Quadrennial Energy Review as of Sept. 2013.SOURCES:Dept. of Energy, Quadrennial Energy Review, Figs. 1-1, 2-2, 3-2, and 8-1
Period of Major Base Load Generator Additions and NERC-coordinated Construction of
Regional Interties between Major Utilities to Improve Reliability in Response to Blackouts

SCOTTMADDEN, INC. | 39
Contact Us
ENERGY PRACTICE: SCOTTMADDEN KNOWS ENERGY
Brad Kitchens [email protected] 404-814-0020
Stuart PearmanPartner and Energy Practice [email protected]
Chris VlahoplusPartner and Clean Tech & Sustainability Practice Leader [email protected]
Cristin LyonsPartner and Grid Transformation Practice [email protected]
Greg LitraPartner and Energy, Clean Tech & Sustainability Research [email protected] 919-714-7613
About ScottMadden
Since 1983, we have been energy consultants. We have served more than 300 clients, including 20 of the top 20 energy utilities. We have performed more than 2,400 projects across every energy utility business unit and every function. We have helped our clients develop strategies, improve operations, reorganize companies, and implement initiatives. Our broad and deep energy utility expertise is not theoretical—it is experience based.
Part of knowing where to go is understanding where you are. Before we begin any project, we listen to our client, understand their situation, and then personalize our work to help them succeed. Our clients trust us with their most important challenges. They know that, chances are, we have seen and solved a problem similar to theirs. They know we will do what we say we will do, with integrity and tenacity, and we will produce real results.
The energy industry is our industry. We are personally invested in every project we take on. For more information about our Energy Practice, contact Stuart Pearman.
Stay Connected
This fall, we will join the Solar Electric Power Association (SEPA) to lead U.S. energy industry officials to Hawaii for a fact-finding mission to learn about the electric utility market in Oahu. We look forward to presenting top findings and insights learned from the trip.
Get the latest highlights and noteworthy developments related to renewables, efficiency, or sustainability in our weekly Clean Tech Minute. See scottmadden.com for more.