energy research and development division final project report€¦ · energy research and...
TRANSCRIPT
Energy Research and Development Division
FINAL PROJECT REPORT
Effect of Variable Fuel Composition on Emissions and Lean Blowoff Stability Performance Analysis of Nine Industrial Combustion Applications
Appendix G - Burner Configuration #7: Gas Turbine Combuster
California Energy Commission Edmund G. Brown Jr., Governor
June 2017 | CEC-500-2017-026-APG
UCI Combustion Laboratory Burner Config. #7. Radiant tube
Burner Configuration # 7: Radiant Tube
Emissions and Stability Performance
CEC Agreement No. 500-13-004
Prepared by:
Andrés Colorado and Vincent McDonell1
Version1: 15 September 2015
1 949 824 5950 x 11121; [email protected]

UCI Combustion Laboratory Burner Config. #7. Radiant tube
1 | P a g e
Contents
EXECUTIVE SUMMARY ......................................................................................................................................................... 4
Key Features .............................................................................................................................................................................. 1
Virtual AeroThermal Field - Computational Fluid Dynamics ................................................................................ 1
1.1. Domain and Mesh ................................................................................................................................................. 2
1.2. Boundary conditions........................................................................................................................................... 2
Chemical Reactor Network .................................................................................................................................................. 3
1.3. Effect of Fuel Composition on Emissions ................................................................................................... 3
1.3.1. Fuel class I - Hydrogen enriched natural gas .................................................................................. 5
1.3.2. Fuel class II- Landfill / digester biogas .............................................................................................. 8
1.3.3. Fuel class III-Mixtures with heavier hydrocarbons .................................................................... 10
Appendix A: Interchangeability analysis ...................................................................................................................... 1
1.3.4. Interchangeability under the criterion of Flashback (AGA) ..................................................... 2
1.3.5. Interchangeability under the criterion of Lifting (AGA) ............................................................. 3
1.3.6. Interchangeability under the criterion of yellow tipping (AGA)............................................. 4
Appendix B: NOx pathways ................................................................................................................................................ 1
References ................................................................................................................................................................................ 43

UCI Combustion Laboratory Burner Config. #7. Radiant tube
2 | P a g e
List of Figures
Figure 1. a) An schematic of the radiant tube assembly. b) typical heat pattern .......................................... 1 Figure 2. Radiation tube burner. Virtual domain. .................................................................................................... 2 Figure 3. Boundary conditions. Radiant tube. ............................................................................................................. 3 Figure 4, Comparision of the temperature contours (four injectors plane) for three fuel compositions. The boundary conditions are set up to guarantee a constant adiabatic flame temperature 1850K ................................................................................................................................................................ 4 Figure 5. Concentration of NOx (see left axis-notice part per Million) & Emission index (read right vertical axis)-Fuel class I. Hydrogen enriched NG ..................................................................................................... 6 Figure 6. Concentration of CO (see left axis- part per Million) & Emission index (read right vertical axis)-Fuel class I. Hydrogen enriched NG ...................................................................................................................... 7 Figure 7. NOx concentration [ppmdv corrected at 3%O2] and Emission index as a function of the Equivalence ratio for natural gas and biogas fuels. The exhaust temperature was held constant at 850K- fuel class II-Biogas ..................................................................................................................................................... 8 Figure 8. Concentration of CO (see left axis- part per Million) & Emission index (read right vertical axis)-Fuel class II-biogas ...................................................................................................................................................... 9 Figure 9. NOx concentration [ppmdv corrected at 3%O2] and Emission index as a function of the Equivalence ratio for natural gas mixed with C3H8. The exhaust temperature was held constant at 850K- fuel class III-C3H8 mixed with CH4 ................................................................................................................... 11 Figure 10. NOx concentration [ppmdv corrected at 3%O2] and Emission index as a function of the Equivalence ratio for natural gas mixed wth C2H6. The exhaust temperature was held constant at 850K- fuel class III-C2H6 mixed with CH4 ................................................................................................................... 11 Figure 11. CO emissions in ppmdv @15% O2 and emission index vs Equivalence ratio-C3H8 hydrocarbon mixed with natural gas . .......................................................................................................................... 12 Figure 12. CO emissions in ppmdv @15% O2 and emission index vs Equivalence ratio-C2H6 hydrocarbon mixed with natural gas . .......................................................................................................................... 13 Figure 13. AGA Flashback index. ....................................................................................................................................... 2 Figure 14. AGA Lifting index. ............................................................................................................................................. 3 Figure 15. AGA Yellow tipping index. Analysis of interchangeability for mixtures CH4-H2 and CO-H2
................................................................................................................................................................................................ ......... 4
UCI Combustion Laboratory Burner Config. #7. Radiant tube
3 | P a g e
List of Tables Table 1. Summary of emissions and stability/1 ......................................................................................................... 4 Table 2. Summary of emissions for interchangeable mixtures (AGA)/3 .......................................................... 5 Table 3. Hydrogen enriched natural gas –Test fuels ................................................................................................ 5 Table 4. Biogas –Test fuels/1 .............................................................................................................................................. 8 Table 5. Mixtures with heavier hydrocarbons - Test fuels .................................................................................. 10 Table 6. Summary of emissions for interchangeable mixtures (AGA) ............................................................. 5
UCI Combustion Laboratory Burner Config. #7. Radiant tube
4 | P a g e
Burner Configuration # 7: Radiant tube
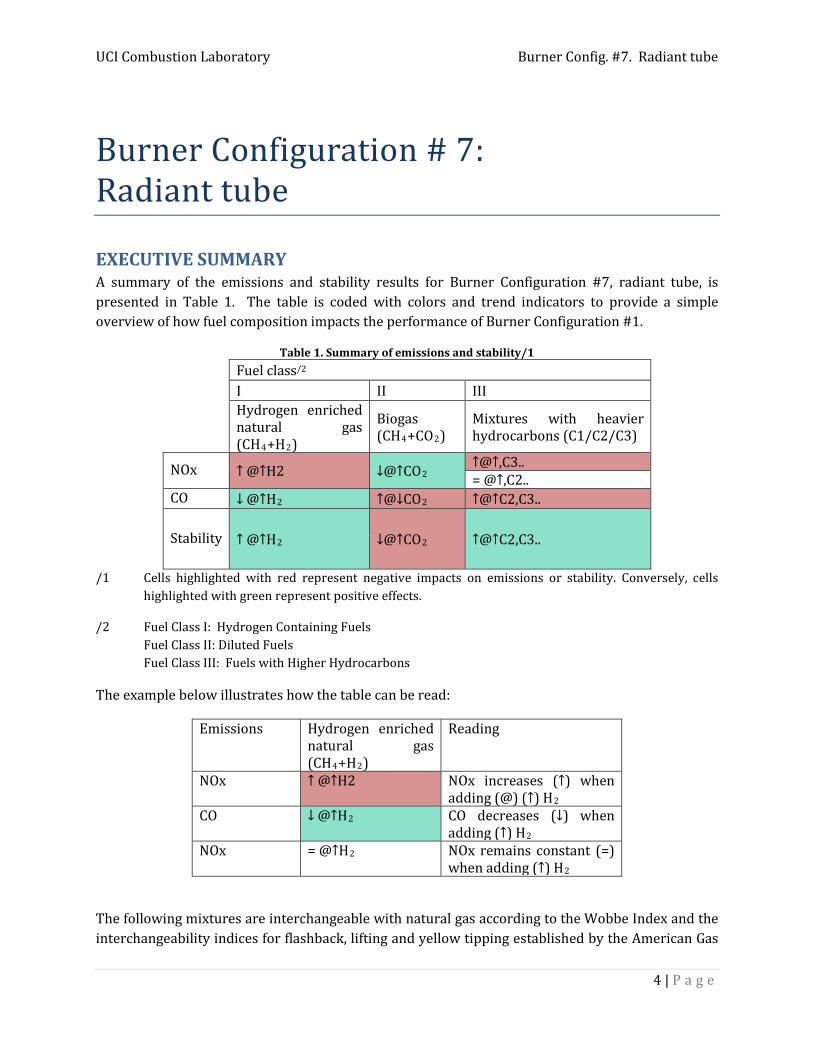
EXECUTIVE SUMMARY A summary of the emissions and stability results for Burner Configuration #7, radiant tube, is presented in Table 1. The table is coded with colors and trend indicators to provide a simple overview of how fuel composition impacts the performance of Burner Configuration #1.
Table 1. Summary of emissions and stability/1 Fuel class/2 I II III
Hydrogen enriched natural gas (CH4+H2)
Biogas (CH4+CO2)
Mixtures with heavier hydrocarbons (C1/C2/C3)
NOx ↑ @↑H2 ↓@↑CO2 ↑@↑,C3.. = @↑,C2..
CO ↓ @↑H2 ↑@↓CO2 ↑@↑C2,C3..
Stability ↑ @↑H2 ↓@↑CO2 ↑@↑C2,C3..
/1 Cells highlighted with red represent negative impacts on emissions or stability. Conversely, cells highlighted with green represent positive effects.
/2 Fuel Class I: Hydrogen Containing Fuels Fuel Class II: Diluted Fuels Fuel Class III: Fuels with Higher Hydrocarbons
The example below illustrates how the table can be read:
Emissions Hydrogen enriched natural gas (CH4+H2)
Reading
NOx ↑ @↑H2 NOx increases (↑) when adding (@) (↑) H2
CO ↓ @↑H2 CO decreases (↓) when adding (↑) H2
NOx = @↑H2 NOx remains constant (=) when adding (↑) H2
The following mixtures are interchangeable with natural gas according to the Wobbe Index and the interchangeability indices for flashback, lifting and yellow tipping established by the American Gas
UCI Combustion Laboratory Burner Config. #7. Radiant tube
5 | P a g e
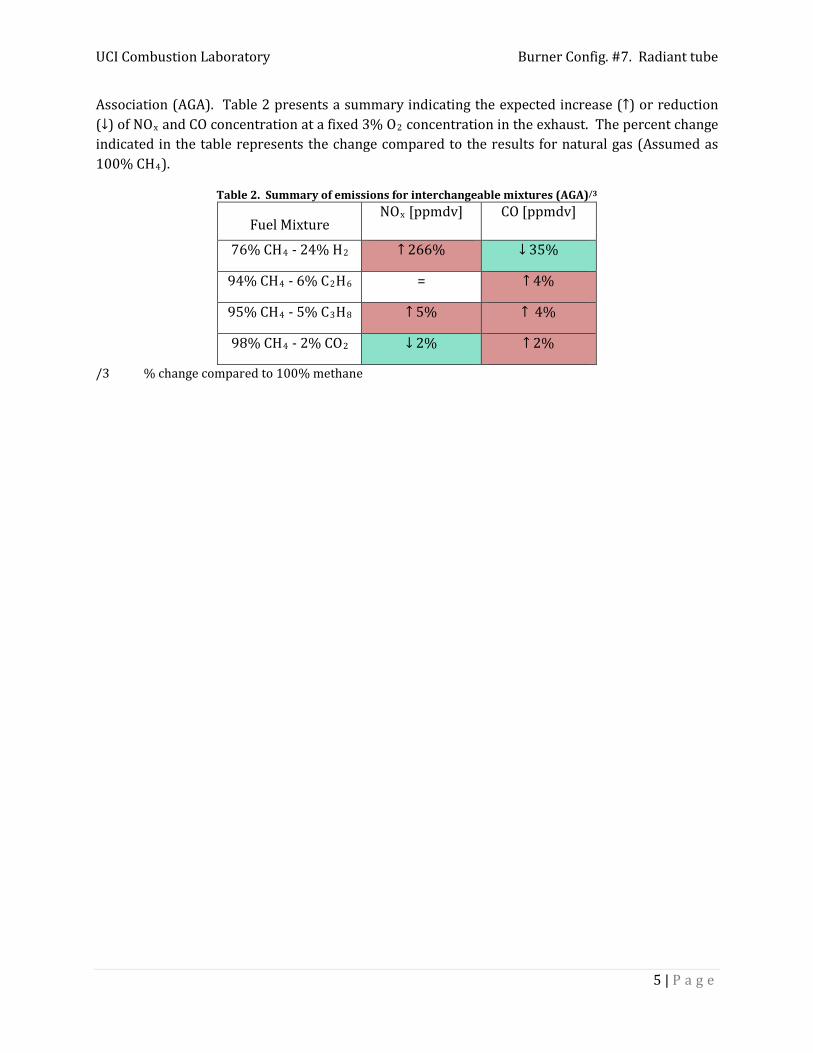
Association (AGA). Table 2 presents a summary indicating the expected increase (↑) or reduction (↓) of NOx and CO concentration at a fixed 3% O2 concentration in the exhaust. The percent change indicated in the table represents the change compared to the results for natural gas (Assumed as 100% CH4).
Table 2. Summary of emissions for interchangeable mixtures (AGA)/3
Fuel Mixture NOx [ppmdv] CO [ppmdv]
76% CH4 - 24% H2 ↑ 266% ↓ 35%
94% CH4 - 6% C2H6 = ↑ 4%
95% CH4 - 5% C3H8 ↑ 5% ↑ 4%
98% CH4 - 2% CO2 ↓ 2% ↑ 2%
/3 % change compared to 100% methane
UCI Combustion Laboratory Burner Config. #7. Radiant tube
1 | P a g e
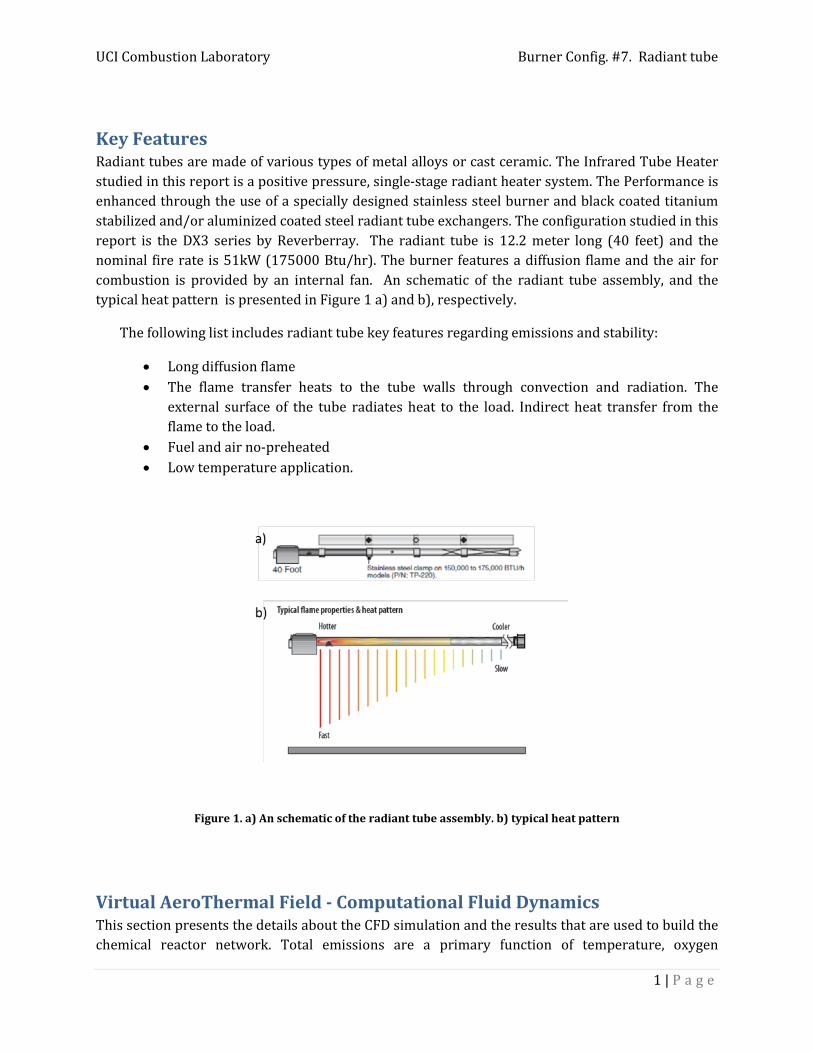
Key Features Radiant tubes are made of various types of metal alloys or cast ceramic. The Infrared Tube Heater studied in this report is a positive pressure, single-stage radiant heater system. The Performance is enhanced through the use of a specially designed stainless steel burner and black coated titanium stabilized and/or aluminized coated steel radiant tube exchangers. The configuration studied in this report is the DX3 series by Reverberray. The radiant tube is 12.2 meter long (40 feet) and the nominal fire rate is 51kW (175000 Btu/hr). The burner features a diffusion flame and the air for combustion is provided by an internal fan. An schematic of the radiant tube assembly, and the typical heat pattern is presented in Figure 1 a) and b), respectively.
The following list includes radiant tube key features regarding emissions and stability:
• Long diffusion flame • The flame transfer heats to the tube walls through convection and radiation. The
external surface of the tube radiates heat to the load. Indirect heat transfer from the flame to the load.
• Fuel and air no-preheated • Low temperature application.
Figure 1. a) An schematic of the radiant tube assembly. b) typical heat pattern
Virtual AeroThermal Field - Computational Fluid Dynamics This section presents the details about the CFD simulation and the results that are used to build the chemical reactor network. Total emissions are a primary function of temperature, oxygen
UCI Combustion Laboratory Burner Config. #7. Radiant tube
2 | P a g e
concentration, and the time the species spend under those conditions. The temperature profile, flow field and concentration of species are presented and analyzed in this section.
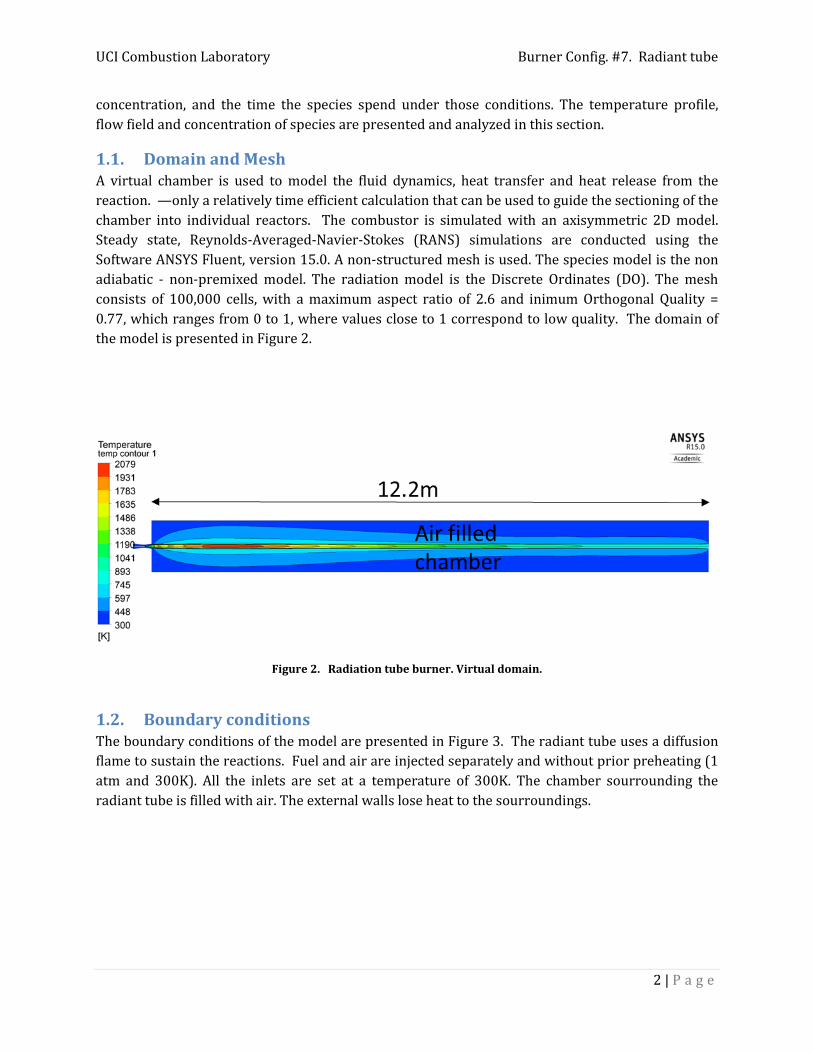
1.1. Domain and Mesh A virtual chamber is used to model the fluid dynamics, heat transfer and heat release from the reaction. —only a relatively time efficient calculation that can be used to guide the sectioning of the chamber into individual reactors. The combustor is simulated with an axisymmetric 2D model. Steady state, Reynolds-Averaged-Navier-Stokes (RANS) simulations are conducted using the Software ANSYS Fluent, version 15.0. A non-structured mesh is used. The species model is the non adiabatic - non-premixed model. The radiation model is the Discrete Ordinates (DO). The mesh consists of 100,000 cells, with a maximum aspect ratio of 2.6 and inimum Orthogonal Quality = 0.77, which ranges from 0 to 1, where values close to 1 correspond to low quality. The domain of the model is presented in Figure 2.
Figure 2. Radiation tube burner. Virtual domain.
1.2. Boundary conditions The boundary conditions of the model are presented in Figure 3. The radiant tube uses a diffusion flame to sustain the reactions. Fuel and air are injected separately and without prior preheating (1 atm and 300K). All the inlets are set at a temperature of 300K. The chamber sourrounding the radiant tube is filled with air. The external walls lose heat to the sourroundings.

UCI Combustion Laboratory Burner Config. #7. Radiant tube
3 | P a g e
Figure 3. Boundary conditions. Radiant tube.
Chemical Reactor Network The chemical reactor modeling is found to be a valuable tool in the evaluation of pollutant formation and the blow-out performance of combustion systems. The methodologies of the development vary between authors [2]. In this study, the chemical reactor network is constructed based on the computational fluid dynamics (CFD) results presented above. The concept of modeling a combustor using chemical reactors such as perfectly stirred reactors (PSR), plug flow reactors (PFR) was first introduced by S. L. Bragg [3]. A reactor network is defined to model the pollutant formation with a detailed chemistry. The methodology to build a CRN consists on using the results of CFD simulations to automatically divide the combustor volume into zones represented by idealized reactor elements. Ansys Fluent includes a post –processor tool to automatically divide the domain into a user-defined number of reactos. The automated network fills the volume of the chamber with perfectly stirred reactors (PSRs) and clusters them by temperature and composition, in order to speed up the convergence of the set of equations. The method is sensitive to the number of reactors in the domain. 500 reactors were necessary to make the solution independent of the number of reactors. With 500 reactors the computing turnaround time for each design point is ~ 30 minutes.
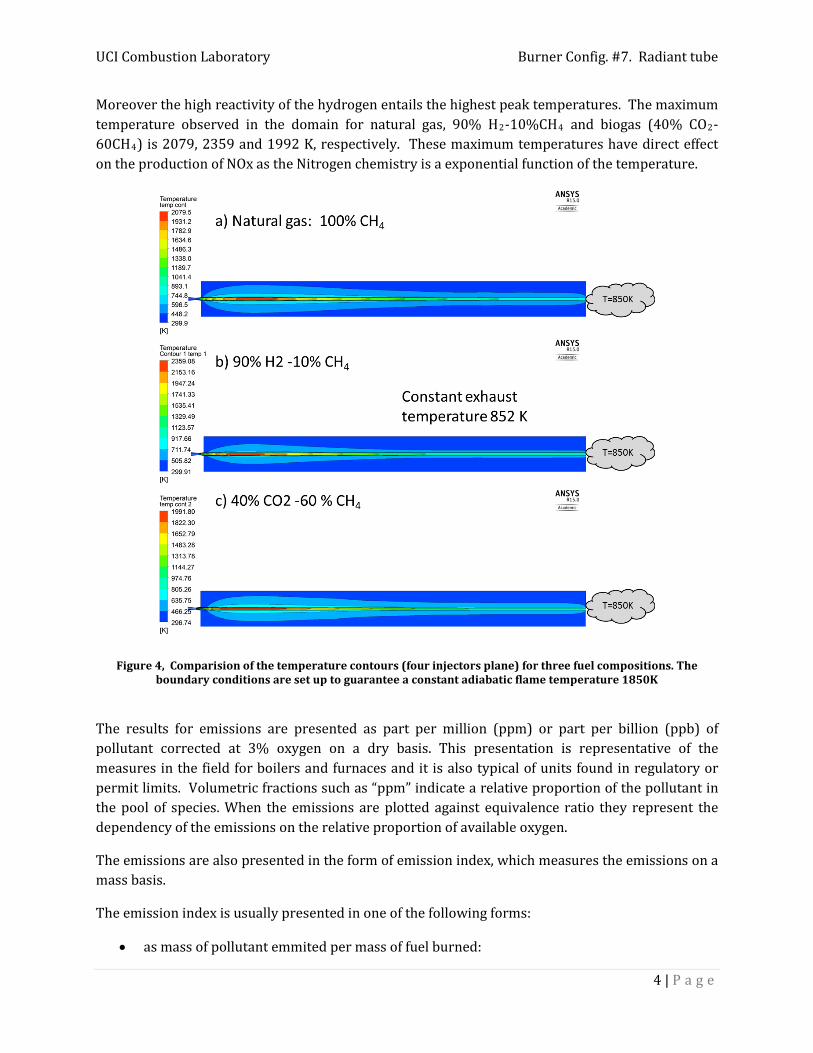
1.3. Effect of Fuel Composition on Emissions In this section, the evaluation of the effect of the fuel composition on the emissions is assessed using the automated CRN methodology. The fire input to the burner is held constant at 51kW. Also for the control strategy, it is assumed that the temperature of the combustion products in the outlet is fixed at 850K. This would mimic the typical operation of a radiation tube, in which the goal is achieve the similar temperature distribution, while ensuring the integrity of the tube materials. A Comparision of the temperature contours for three fuel compositions is presented in Figure 4, notice that the boundary conditions are set up to guarantee a constant exit temperature (850K). The figure shows shorter flames for the hydrogen mix and longer flames for natural gas and biogas mixtures. The use of diffusion flames has the disadvantage of not uniform mixing and it is expected to find high peak temperatures leading to the formation fo NOx through the Zeldovich route.
UCI Combustion Laboratory Burner Config. #7. Radiant tube
4 | P a g e
Moreover the high reactivity of the hydrogen entails the highest peak temperatures. The maximum temperature observed in the domain for natural gas, 90% H2-10%CH4 and biogas (40% CO2-60CH4) is 2079, 2359 and 1992 K, respectively. These maximum temperatures have direct effect on the production of NOx as the Nitrogen chemistry is a exponential function of the temperature.
Figure 4, Comparision of the temperature contours (four injectors plane) for three fuel compositions. The boundary conditions are set up to guarantee a constant adiabatic flame temperature 1850K
The results for emissions are presented as part per million (ppm) or part per billion (ppb) of pollutant corrected at 3% oxygen on a dry basis. This presentation is representative of the measures in the field for boilers and furnaces and it is also typical of units found in regulatory or permit limits. Volumetric fractions such as “ppm” indicate a relative proportion of the pollutant in the pool of species. When the emissions are plotted against equivalence ratio they represent the dependency of the emissions on the relative proportion of available oxygen.
The emissions are also presented in the form of emission index, which measures the emissions on a mass basis.
The emission index is usually presented in one of the following forms:
• as mass of pollutant emmited per mass of fuel burned:
UCI Combustion Laboratory Burner Config. #7. Radiant tube
5 | P a g e
gNOxkgFuel_burned
• Pollutant emmited per energy contained in the fuel:
gNOxkWhFuel_burned
• Pollutant emmited per electricity generated. In this case the emission index includes the efficiency of the system and it would be read as:
gNOxkWhelectricity_generated
The CRN results for emissions were obtained using the GRI 3.0 reaction mechanism [4]. While it is recognized that the specific chemistry mechanism used can influence the absolute values of the emissions predicted [5], the trends are generally insensitive to the mechanism used.
1.3.1. Fuel class I - Hydrogen enriched natural gas
The fuel class I is hydrogen enriched natural gas. The fuel compositions are presented in Table 3 . Notice that the addition of Hydrogen to the fuel increases the flame temperature, therefore the hydrogen mixtures are diluted with more air to counteract this effect. Note: the exhaust temperature is held constant for all the fuel compositions.
Table 3. Hydrogen enriched natural gas –Test fuels Hydrogen enriched natural gas Wobbe index
(BTU/scf) 10% CH4 – 90% H2 1095 30% CH4 – 70% H2 1095 50% CH4 – 50% H2 1144 70% CH4 – 30% H2 1205
The emissions trends for CO, NOx, UHC, and VOC were obtained using the reactor network analysis and are presented on a concentration of part per million (ppm) on a dry basis corrected @ 3% O2 vs equivalence ratio (see Figure 5). Also The CRN emission results for emissions in the form of emission index are presented on the same figure, and can be read on the right axis. Emission index (EI) measures emissions on a mass basis. All the species included in the reaction mechanism can be predicted, for example pollutant species such as Nitrous Oxide (N2O) and Formaldehyde (CH2O) can also be quantified using the reactor network analisys. Formaldehyde can be found among the products of incomplete combustion (PIC), and nitrous oxide is one of the reactive species of the nitrogen chemistry at found for fuel lean and low temperature conditions.

UCI Combustion Laboratory Burner Config. #7. Radiant tube
6 | P a g e
Figure 5. Concentration of NOx (see left axis-notice part per Million) & Emission index (read right vertical axis)-Fuel class I. Hydrogen enriched NG
A summary of the key points regarding the behavior of NOx emissions for Fuel Class I include:
• When adding hydrogen to the fuel, up to 100% as indicated with the H2 mole fraction in the fuel mix (horizontal axis) of fig. 5, a significant increase of NOx emissions is observed. The models indicate and increase of ppmdv from 30 to 900, when the burner was fuel with methane (CH4) and hydrogen (H2) respectively. The higher temperatures of a hydrogen diffusion flame are the reason for the high rise of NOx emissios. While for methane, the maximum temperature in the flame region is 2080K, for a 90%H2 -10% CH4 mix the maximum tmpereature in the flame zone is 2360K. Also higher concentration of OH radicals and H-atoms, the same species attack molecular oxygen releasing O-atoms. Those O atoms also enhance the production of NOx. In a hydrogen flame the rich pool of reactive species and high temperatures break the N2 bonds producing NOx through Zeldovich, NNH and N2O pathways. For more details about NOx pathways see Apendix B.
• Also the addition of H2 promotes the formation of intermediate species like OH and H, which form more NOx through the NNH, thermal and N2O routes compared to pure hydrocarbon flame. On the other hand, the prompt path is initiated by rapid reactions of hydrocarbon radicals with molecular nitrogen; therefore the addition of H2 to the fuel reduces the formation of NOx through the prompt route.
• The results in form of emission index display the same trends as the concentration results in ppmdv. However, the emission index form allows an easy estimation, for example, of the mass of pollutant emited per year; in contrast the concentration in ppm form gives a relative idea of volume occupied by the pollutant on a dry basis (after removing the water from the combustion products), which again biases the results for the Hydrogen samples,

UCI Combustion Laboratory Burner Config. #7. Radiant tube
7 | P a g e
since hydrongen enriched fuels produce more water than carbon dioxide, when compared to any hydrocarbon fuel.
Regarding the emissions of CO, UHC and VOC, which can be referred as products of incomplete combustion (PICs). The results indicate only trace values for CO, VOC and UHC. These species follow the same trends and only the CO trends are presented for brevity.
Figure 6. Concentration of CO (see left axis- part per Million) & Emission index (read right vertical axis)-Fuel class I. Hydrogen enriched NG
The key points regarding the behavior of PICS for Fuel Class I include:
• The addition of hydrogen to the fuel reduces the emissions of PICs. • The high reactivity of hydrogen helps to complete the oxidation reactions avoiding
incomplete combustion products. Moreover, the additional hydrogen displaces carbon from the fuel, so inherently less CO, UHC and VOC can form.
• The predicted levels of VOC and UCH are below 20 ppb @ 3% O2. • The predicted levels of CO are below 1ppmdv @ 3% O2 and decreases with the addition of
hydrogen. • The predicted levels of Formaldehyde (CH2O), which can be considered a VOC and UHC
where found in the order of part per billion (not shown). Formaldehyde can cause irritation of the skin, eyes, nose and throat. High levels of exposure may cause some types of cancer2.
2www2.epa.goev/formaldehyde
UCI Combustion Laboratory Burner Config. #7. Radiant tube
8 | P a g e
1.3.2. Fuel class II- Landfill / digester biogas
The test fuels for Fuel Class II are shown in Table 4. These fuels represent those that would be found in landfills or anaerobic digestion processes. The final fuel (96% CH4-4% CO2) reflects one which would be meet minimum Wobbe Index requirements. The air to fuel ratio that guarantees constant exhaust temperature (850K) was varied as a function of the mole fraction of CO2 in the mix. Notice that the addition of CO2 to the fuel reduces the flame temperature, therefore less excess of air is required to counteract this effect.
Table 4. Biogas –Test fuels/1
Fuel class III: landfill-digester-biogas
Wobbe index (BTU/scfm)
35% CH4 – 65% CO2 312
60% CH4 – 40% CO2 599
80% CH4 –20% CO2 895
96% CH4 – 4%CO2 1279
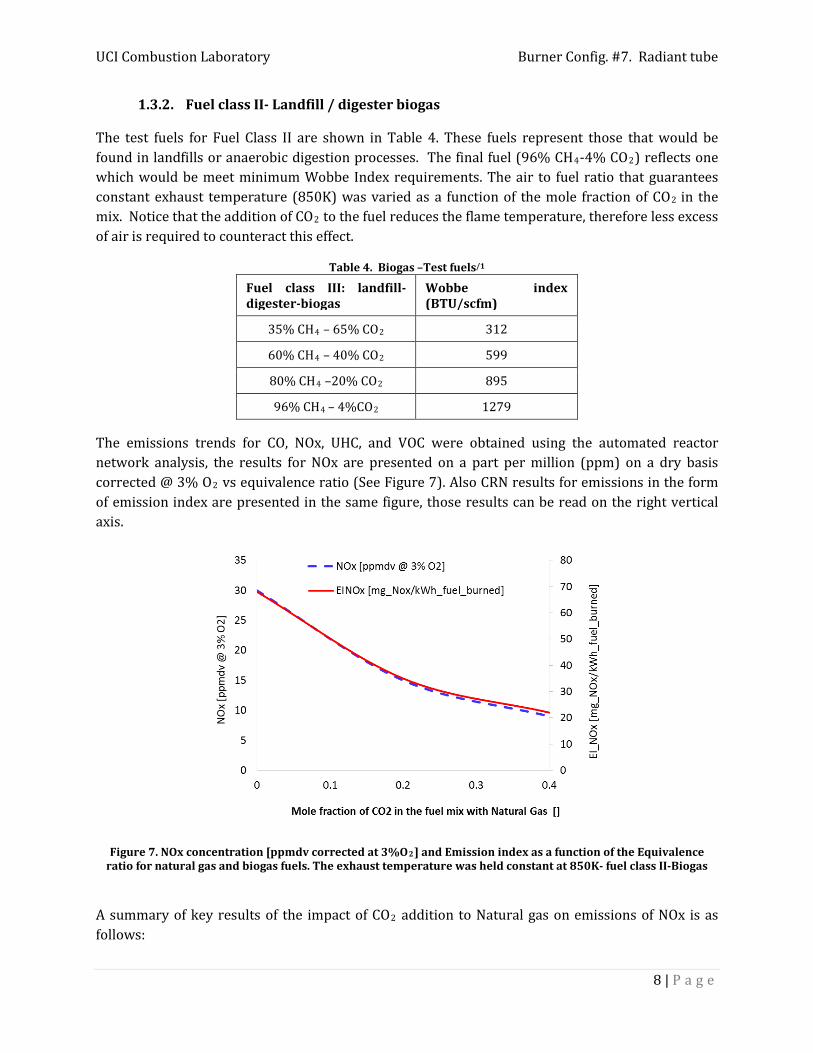
The emissions trends for CO, NOx, UHC, and VOC were obtained using the automated reactor network analysis, the results for NOx are presented on a part per million (ppm) on a dry basis corrected @ 3% O2 vs equivalence ratio (See Figure 7). Also CRN results for emissions in the form of emission index are presented in the same figure, those results can be read on the right vertical axis.
Figure 7. NOx concentration [ppmdv corrected at 3%O2] and Emission index as a function of the Equivalence ratio for natural gas and biogas fuels. The exhaust temperature was held constant at 850K- fuel class II-Biogas
A summary of key results of the impact of CO2 addition to Natural gas on emissions of NOx is as follows:
UCI Combustion Laboratory Burner Config. #7. Radiant tube
9 | P a g e
• Figure 7 presents volumetric concentration of NOx in ppmdv @ 3% O2 vs. equivalence ratio. It is clear from that figure that the concentration of NOx decreases with the addition of CO2 to the fuel, with the highest levels of diluent producing the lowest NOx and highest level of CO. Since the results represent the emission at the same exhaust temperature (850K) it can be concluded that dilution with CO2 acts as heat sink that cools down the reactions. A similar heat sink effect can be achieaved by using a larger excess of air or lean combustion. Also the dilution of the reactions with CO2 depletes the formation of radicals such as OH, this is the same concept applied to systems with exhaust gas recirculation and internal recirculation of gases to reduce NOx emissions.
• The effect of diluting the fuel with CO2 is similar to using a leaner mixture (air excess), although the presence of CO2 is expected to have a greater impact on reaction temperatures emissions than N2 because it has a greater specific heat. As a result, it might be expected that each species may impact emissions somewhat differently.
• Fuel dilution follows the same physics behind the injection of water or steam to the reaction zone and the strategy of ultra-lean combustion. By diluting the fuel with CO2 a reduction of NOx emissions can be achieved.
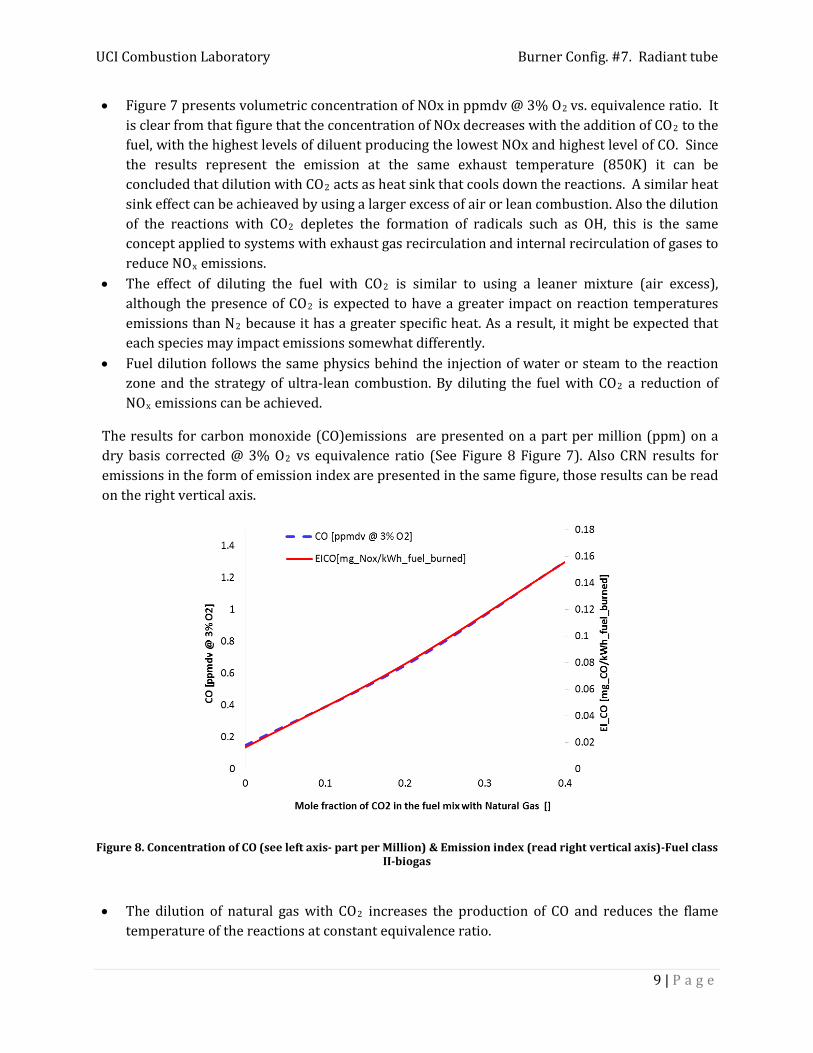
The results for carbon monoxide (CO)emissions are presented on a part per million (ppm) on a dry basis corrected @ 3% O2 vs equivalence ratio (See Figure 8 Figure 7). Also CRN results for emissions in the form of emission index are presented in the same figure, those results can be read on the right vertical axis.
Figure 8. Concentration of CO (see left axis- part per Million) & Emission index (read right vertical axis)-Fuel class II-biogas
• The dilution of natural gas with CO2 increases the production of CO and reduces the flame temperature of the reactions at constant equivalence ratio.
UCI Combustion Laboratory Burner Config. #7. Radiant tube
10 | P a g e
• The addition of fuel diluent (CO2) depletes the formation of O-atoms, OH radicals that form NOx through the thermal route. The increase of CO2 concentration indicates a proportional reduction on the O and H atoms.
• The addition of CO2 hinders the formation of NOx through the thermal and N2O routes. • The emissions of UHC and VOC are below 1ppmdv @3% O2. The trends for VOC and UHC are
similar to those of CO and are not presented for brevity.
1.3.3. Fuel class III-Mixtures with heavier hydrocarbons
The effect of blending natural gas with ethane (C2H6) and propane(C3H8) is examined in this section. Fuel mixtures of methane with heavier alkane gases were assessed with the reactor network. The first fuel is a mixture of ethane balanced with methane and the second blend is propane balanced with methane; both compositions are expressed by their volumetric concentrations. These mixtures represent expected variation in natural gas content within the United States [6]. The fuels tested in terms of mixtures of natural gas with heavier hydrocarbons are shown in Table 5. The analyisis of the pure gases, 100% Ethane (C2H6) and 100% Propane (C3H8), was also included for a direct comparison with NG.
Table 5. Mixtures with heavier hydrocarbons - Test fuels
Mixtures with heavier hydrocarbons
Wobbe index (BTU/scf)
75% CH4 – 25% C2H6 1399
85% CH4 – 15% C2H6 1360
75% CH4 – 25% C3H8 1489
85% CH4-15% C3H8 1416
100% C2H6 1663
100% C3H8 1954
The equivalence ratio that guarantees constant exhaust temperature (850K) is around constant for all the mix between C1, C2 and C3 mix. The addition of C2H6 or C3H8 slightly increases the flame temperature at a constant air to fuel ratio.
The CRN results for NOx emissions of NG mixed with propane are shown in Figure 9. The NOx trends for mixtures with ethane are presented in Figure 10. The results are presented on a concentration basis ppmdv on the left axis, and on emission index form on the right axis.

UCI Combustion Laboratory Burner Config. #7. Radiant tube
11 | P a g e
Figure 9. NOx concentration [ppmdv corrected at 3%O2] and Emission index as a function of the Equivalence ratio for natural gas mixed with C3H8. The exhaust temperature was held constant at 850K- fuel class III-C3H8
mixed with CH4
Figure 10. NOx concentration [ppmdv corrected at 3%O2] and Emission index as a function of the Equivalence ratio for natural gas mixed wth C2H6. The exhaust temperature was held constant at 850K- fuel class III-C2H6
mixed with CH4
A summary of key impacts of the addition of Ethane and Propane to the natural gas composition on NOx are as follows:
• The addition of propane to methane yields an increase of the concentration of NOx. At temperatures below 1900K, the thermal NOx pathway is not expected to produce most of the NOx. Below this temperature, other NOx pathways play a more significant role. In this case, the N2O pathway plays a significant role in the overall levels of NOx emitted from lean premixed reactions with equivalence ratios less the 0.80. The N2O reaction is also pressure dependent. At high pressures NO formation via N2O becomes important. The pressure

UCI Combustion Laboratory Burner Config. #7. Radiant tube
12 | P a g e
influence on NO formed from this mechanism is evidenced in the reaction O + N2 + M ↔ N2O + M; with “M” representing a chemically unchanged third body species. Per Le’ Chatelier’s principle, increasing pressure drives the equation to the right, thus enabling NO formation through the subsequent reactions.
• The results indicate that a diffusion flame of pure propane emits 60 ppmdv of NOx compared to the reactions with methane, which produce 30 ppmdv (all results corrected @ 3% O2)
• The addition of ethane does not significantly affect the production of NOx. The trends indicate that with the addition of ethane to natural gas the NOx levels remain around constant.
The CO results for mixtures of NG with C2H6 and C3H8 are presented in Figure 11 and Figure 12, respectively.
Figure 11. CO emissions in ppmdv @15% O2 and emission index vs Equivalence ratio-C3H8 hydrocarbon mixed with natural gas .

UCI Combustion Laboratory Burner Config. #7. Radiant tube
13 | P a g e
Figure 12. CO emissions in ppmdv @15% O2 and emission index vs Equivalence ratio-C2H6 hydrocarbon mixed with natural gas .
The key result regarding the impact of mixing natural gas with heavier alkane fuels on CO, VOC and UHC emissions is as follows:
• The addition of heavier alkanes (ethane or propane) enhances the emissions of carbon monoxide. At equal exhaust temperature (850K) CH4 produces the least amount of CO.
• The addition of ethane to natural gas slightly increases the production of CO. Propane has a more significant effect on the formation of CO relative to Ethane and Methane.
• For the conditions of the experiment, the concentration of UHC and VOC remains below 1 ppmdv @ 3% O2 for all the fuel composition. Propane displays a tendency to emit more UHC when compared to Ethane and Methane.
• The addition of heavier hydrocarbons enhances VOC emissions. The trends indicate that heavier alkanes will tend to emit larger quantities of VOC compared to the simplest hydrocarbon (CH4) .
UCI Combustion Laboratory Burner Config. #7. Radiant tube
A-1 | P a g e
Appendix A: Interchangeability analysis In this section an interchangeability analysis is presented. For the analysis we take into account the Wobbe index and the rule 30. The former regulates the content of other constituents of the natural gas distributed in California.
According to rule 30 the gas shall have a minimum Wobbe Number of 1279 Btu/scf and shall not have a maximum Wobbe Number greater than 1385 Btu/scf. The gas shall meet American Gas Association's Lifting Index, Flashback Index and Yellow Tip Index interchangeability indices for high methane gas relative to a typical composition of gas in the Utility system serving the area.
Acceptable specification ranges are:
AGA Indices Acceptable specification ranges Lifting Index (IL) IL <= 1.06 Flashback Index (IF) IF <= 1.2 Yellow Tip Index (IY) IY >= 0.8
Regarding the fuel composition, rule 30 specifies:
Carbon Dioxide: The gas shall not have total carbon dioxide content in excess of three percent (3%) by volume.
Inerts: The gas shall not contain in excess of four percent (4%) total inerts (the total combined carbon dioxide, nitrogen, oxygen and any other inert compound) by volume.
Since the Wobbe Index is only concerned with matching heat release for a given burner, other indices have been developed to assess the interchangeability of other flame properties such as lifting, yellow tipping, flash back, air supply, incomplete combustion, and burner load.
In 1946 the American Gas Association (AGA) carried out extensive experimental research on fuel gas interchangeability [7]. AGA Tests were done on a specially developed partial premixing Bunsen-type burner and focused on establishing criteria for blending “supplemental” or “peaking gases” with base load supplies or adjustment gases; those adjustment gases were the three most historically representative natural gases available in the U.S at that time [6]. Based on this experimental work, AGA developed several empirical indices to address the effects of fuel interchange on Yellow Tipping ( YI ), Flame Lifting ( LI ) and Flash Back ( FI ). The methodology to calculate these indices is presented in the AGA bulletin#36 of 1946 [7]. These indices may not be applicable to the typical complex turbulent premixed flames found in current practical systems. The inaccuracies expected from applying AGA indices to current fuels may be even greater, since current fuels of interest include coal derived syngas, landfill and biomass gases, imported liquefied natural gas (LNG) and hydrogen augmented fuels whose composition is completely different to those natural gases used to set the stability criteria. Nonetheless, these indices were considered as
UCI Combustion Laboratory Burner Config. #7. Radiant tube
A-2 | P a g e
the most advanced methods and effective tools to predict interchangeability in the United States and should be considered as a starting point.
Considerations before applying the AGA indices:
• AGA Tests were done on a specially developed partial premixing Bunsen-type burner. The results of these experiments may not be feasible for other kind of systems where the conditions are different to those of the atmospheric burner.
• AGA developed a set of preferable limits for each of the three indices. Those limits establish if a fuel is interchangeable with the adjustment gases under each criterion (flashback, lifting and yellow tipping).
• AGA set the preferable limits for three adjustment natural gases. Thus, the same limits may not be suitable if other adjustment gases are selected as reference fuels.
1.3.4. Interchangeability under the criterion of Flashback (AGA)
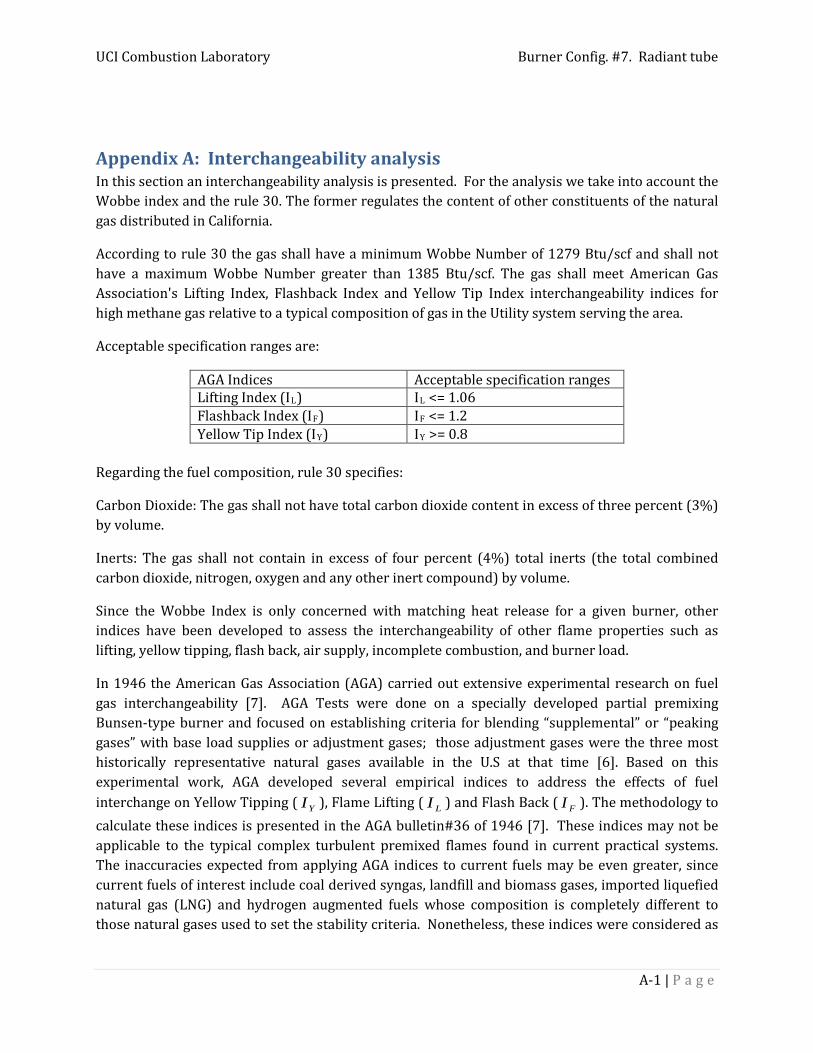
Figure 1. AGA Flashback index. • Mixtures of CO-H2 , CH4-H2 , CH4-C2H6, CH4-C3H8 and biogases (CH4-CO2) were analyzed
with AGA criteria. Flashback indices were calculated for every mixture. Pure gases such as H2, CO and CH4 were analyzed and are depicted with single markers in Figure . Every point in the figure represents a mixture; the volumetric content varies every 10% (by volume) starting with the pure substance.
• According to the Wobbe Index only a narrow region (1279-1385) is interchangeable. This region excludes most mixtures and is bounded by two vertical lines.
• According to AGA if the flashback index is lower than 1.2 (IF<1.2) the fuels are Interchangeable. 100% CH4, all mixtures of methane with propane and ethane, biogas up to
0
1
2
3
4
5
0 200 400 600 800 1000 1200 1400 1600 1800 2000 2200
Flas
hbac
k in
dex
AG
A (I
F)
Wobbe index (based on the higher heating value) [Btu/scf]
100% CO 100% H2 100% CH4 100% C3H8IF=1.2 Mixtures CH4-H2 Mixtures CO-H2 Biogases (CH4-CO2)Mixtures CH4-C2H6 Mixtures CH4-C3H8 Min Wobbe Index Max Wobbe Index
IF<=1.2: interchangeable under flashback index

UCI Combustion Laboratory Burner Config. #7. Radiant tube
A-3 | P a g e
30% CO2 and mixtures of CH4 with H2 up to around 20% H2 are flashback interchangeable with the original adjustment natural gases. Most of these mixtures are outside of the interchangeable region defined with the Wobbe Index.
• Mixtures CH4-H2 with a concentration of H2 higher than 20% are prone to flashback, therefore they are not interchangeable with the adjustment gases. Enrichment of the methane with H2 makes the mixture more prone to flashback; a higher concentration of H2
increases the pool of OH and H radicals that makes the mixture more reactive, this translates into a higher flame speed that entails a higher flashback propensity.
• No mixtures of CO-H2 are feasible to interchange with the adjustment gases. Since all their flashback indices are higher than 1.18; according to the AGA index all these mixtures would experience flashback. Again the higher reactivity of CO and H2, when compared to that of CH4, makes these mixtures more likely to flashback.
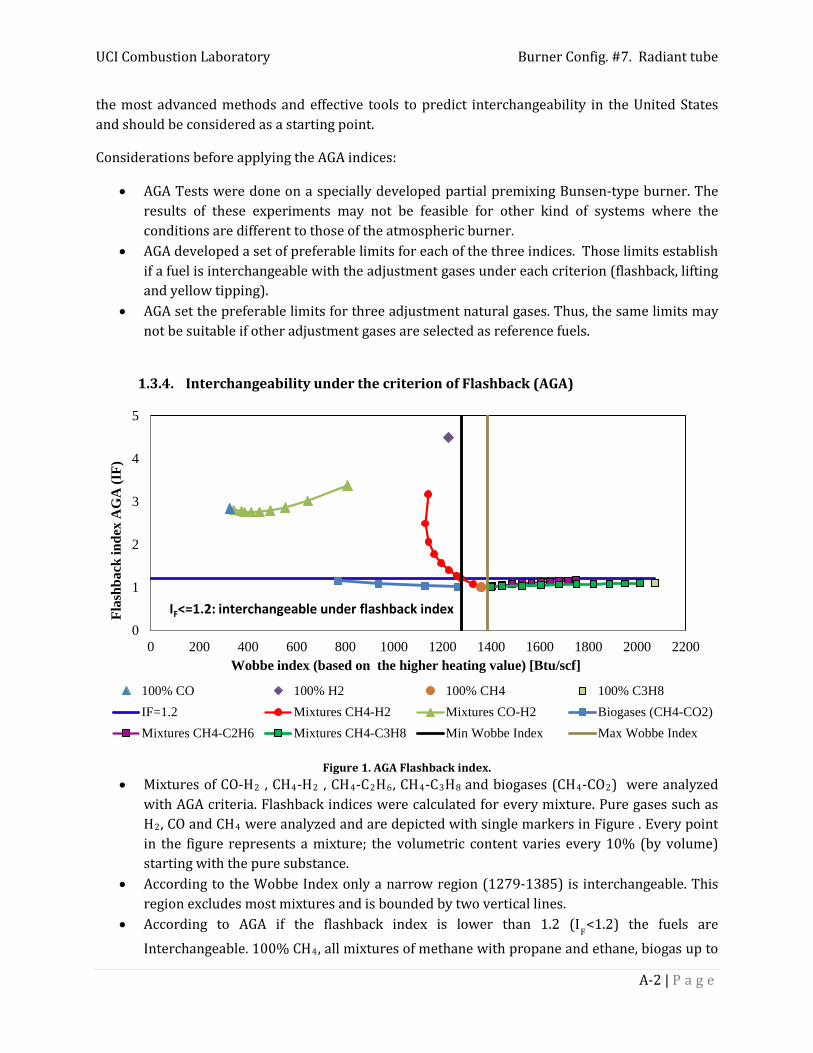
1.3.5. Interchangeability under the criterion of Lifting (AGA)
Figure A-2. AGA Lifting index. • AGA lifting indices were calculated for CO-H2 and CH4-H2 mixtures and pure fuels (H2, CO
and CH4). The results indicate that CH4-H2, CH4-C2H6 and CH4-C3H8 mixtures are not susceptible to experience lifting.
• The addition of hydrogen, with its high reactivity, tends to reduce the lifting index of a mixture. According to this, all the mixtures CH4-H2 are interchangeable under the lifting index.
• Notice that pure CO and mixtures of CO-H2 failed under the flashback criterion, and for mixtures H2-CO with CO content higher than 40%, they fail again under the lifting condition. These results show that the AGA indices are not suitable to predict the interchangeability of natural gas with this kind of fuels. Besides, the range of Wobbe indices for these mixtures is
0
0.5
1
1.5
2
2.5
3
200 400 600 800 1000 1200 1400 1600 1800 2000
Lift
ing
inde
x A
GA
(IL)
Wobbe index (based on the higher heating value) [Btu/scf]
LI=1.06 100% H2 100% CO100% CH4 Mixtures CH4-H2 Mixtures CO-H2Mixtures CH4-CO2 (biogas) CH4-C2H6 CH4-C3H8Minumum Wobbe Index Maximun Wobbe Index
IL<=1.06: interchangeable for Lifting
UCI Combustion Laboratory Burner Config. #7. Radiant tube
A-4 | P a g e
far from the region expected for natural gas. As mentioned before, these indices were intended to predict the interchangeability between natural gasses.
• Most biogas mixtures fall in the non-interchangeable region. Only biogas up to 3% CO2 is interchangeable under the lifting condition.
• Even though all CH4-H2 mixtures are interchangeable under the lifting criterion, only 100% CH4 and mixtures up to 20% H2-80%CH4 were interchangeable under the flashback criterion, therefore only the mixtures that are interchangeable under all the criteria are really interchangeable.
1.3.6. Interchangeability under the criterion of yellow tipping (AGA)
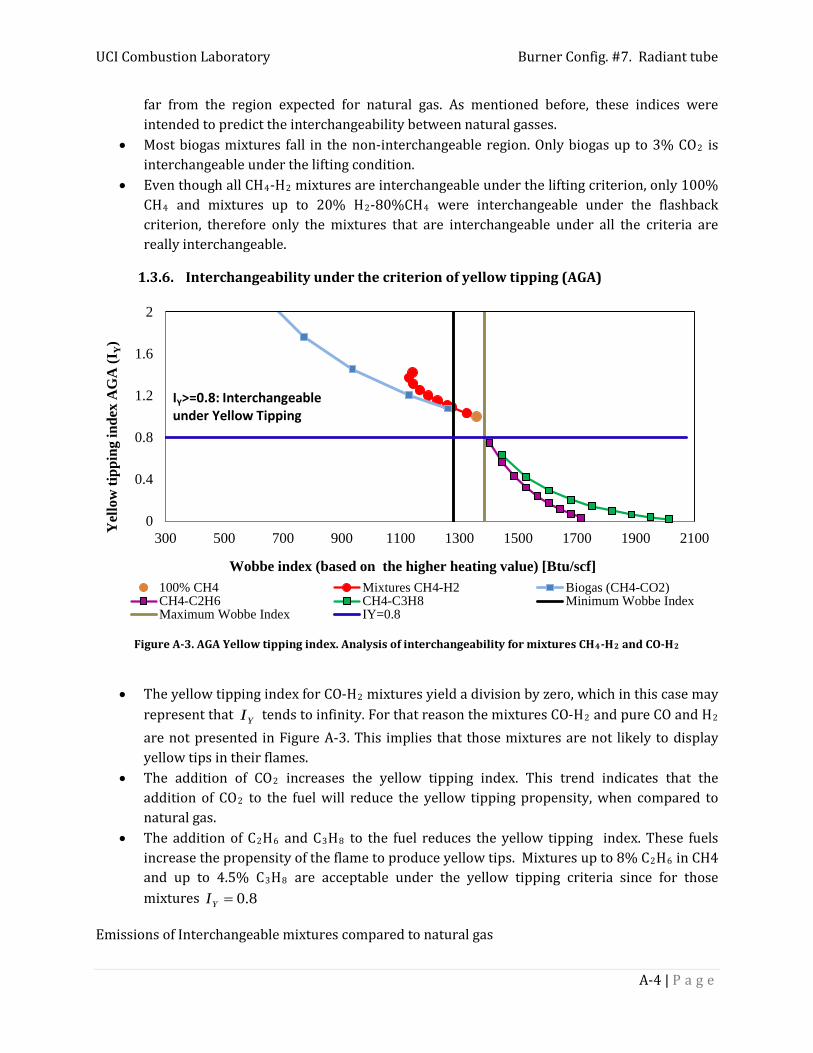
Figure A-3. AGA Yellow tipping index. Analysis of interchangeability for mixtures CH4-H2 and CO-H2
• The yellow tipping index for CO-H2 mixtures yield a division by zero, which in this case may represent that YI tends to infinity. For that reason the mixtures CO-H2 and pure CO and H2 are not presented in Figure A-3. This implies that those mixtures are not likely to display yellow tips in their flames.
• The addition of CO2 increases the yellow tipping index. This trend indicates that the addition of CO2 to the fuel will reduce the yellow tipping propensity, when compared to natural gas.
• The addition of C2H6 and C3H8 to the fuel reduces the yellow tipping index. These fuels increase the propensity of the flame to produce yellow tips. Mixtures up to 8% C2H6 in CH4 and up to 4.5% C3H8 are acceptable under the yellow tipping criteria since for those mixtures 8.0=YI
Emissions of Interchangeable mixtures compared to natural gas
0
0.4
0.8
1.2
1.6
2
300 500 700 900 1100 1300 1500 1700 1900 2100
Yel
low
tipp
ing
inde
x A
GA
(IY)
Wobbe index (based on the higher heating value) [Btu/scf]
100% CH4 Mixtures CH4-H2 Biogas (CH4-CO2)CH4-C2H6 CH4-C3H8 Minimum Wobbe IndexMaximum Wobbe Index IY=0.8
IY>=0.8: Interchangeable under Yellow Tipping

UCI Combustion Laboratory Burner Config. #7. Radiant tube
A-5 | P a g e
The following mixtures are interchangeable with natural gas according to the Wobbe Index and the interchangeability indices for flashback, lifting and yellow tipping established by the American Gas Association (AGA)
Table 6. Summary of emissions for interchangeable mixtures (AGA)
Fuel Mixture NOx [ppmdv] CO [ppmdv]
76% CH4 - 24% H2 ↑ 266% ↓ 35%
94% CH4 - 6% C2H6 = ↑ 4%
95% CH4 - 5% C3H8 ↑ 5% ↑ 4%
98% CH4 - 2% CO2 ↓ 2% ↑ 2%
Using the CFD to CRN methodology, the NOx and CO emissions for the fuel mixtures presented above were compared to the emissions of pure natural gas under conditions that gurantee a consntat exhaust temperature 850K.
• A mixture of 76% CH4 and 24% H2 is interchangeable according to the Wobbe Index and the AGA interchangeability indices. The CRN results indicate that the addition of hydrogen to natural gas increases the concentration of NOx by 266% in comparison to pure natural gas and the production of CO is reduced by 35%.
• For the interchangeable mixture of 94% CH4 and 6% C2H6 the concentration of NOx remains
close to constant, but the emission of of CO is increased by 4% • The dilution of natural gas with a small amount of CO2 increases the production of CO by
2% and reduces the concentration of NOx by 2%.
UCI Combustion Laboratory Burner Config. #7. Radiant tube
B-1 | P a g e
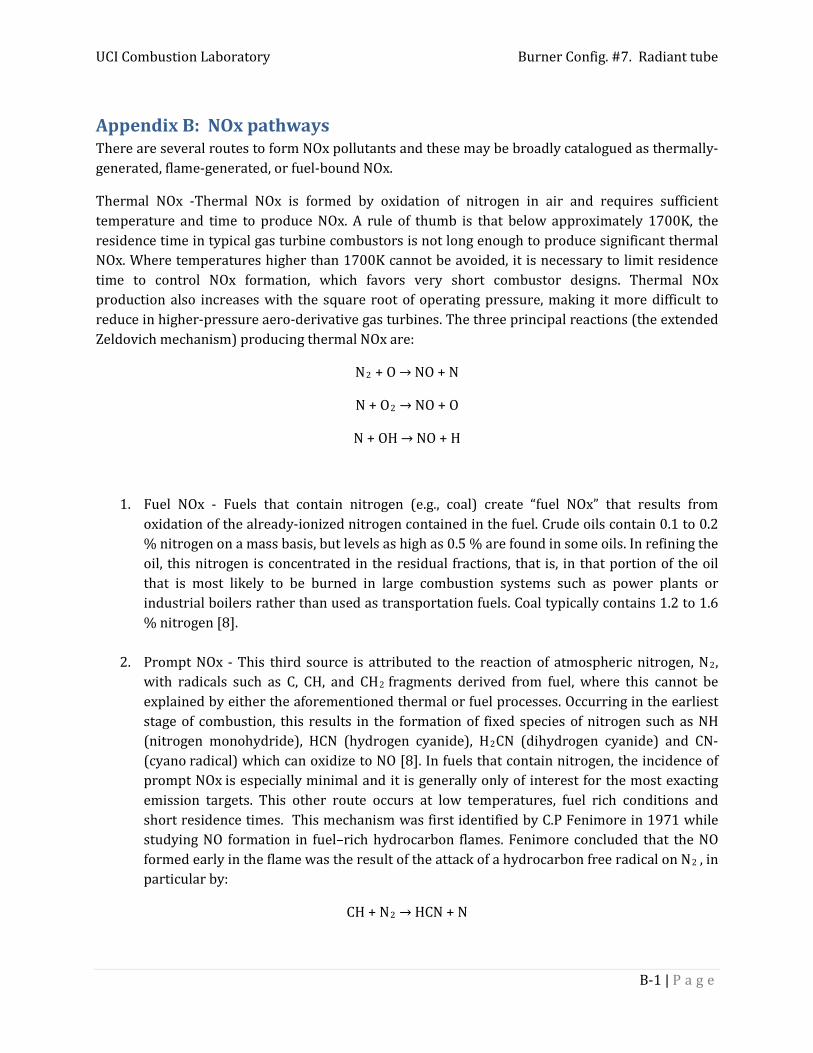
Appendix B: NOx pathways There are several routes to form NOx pollutants and these may be broadly catalogued as thermally-generated, flame-generated, or fuel-bound NOx.
Thermal NOx -Thermal NOx is formed by oxidation of nitrogen in air and requires sufficient temperature and time to produce NOx. A rule of thumb is that below approximately 1700K, the residence time in typical gas turbine combustors is not long enough to produce significant thermal NOx. Where temperatures higher than 1700K cannot be avoided, it is necessary to limit residence time to control NOx formation, which favors very short combustor designs. Thermal NOx production also increases with the square root of operating pressure, making it more difficult to reduce in higher-pressure aero-derivative gas turbines. The three principal reactions (the extended Zeldovich mechanism) producing thermal NOx are:
N2 + O → NO + N
N + O2 → NO + O
N + OH → NO + H
1. Fuel NOx - Fuels that contain nitrogen (e.g., coal) create “fuel NOx” that results from oxidation of the already-ionized nitrogen contained in the fuel. Crude oils contain 0.1 to 0.2 % nitrogen on a mass basis, but levels as high as 0.5 % are found in some oils. In refining the oil, this nitrogen is concentrated in the residual fractions, that is, in that portion of the oil that is most likely to be burned in large combustion systems such as power plants or industrial boilers rather than used as transportation fuels. Coal typically contains 1.2 to 1.6 % nitrogen [8].
2. Prompt NOx - This third source is attributed to the reaction of atmospheric nitrogen, N2, with radicals such as C, CH, and CH2 fragments derived from fuel, where this cannot be explained by either the aforementioned thermal or fuel processes. Occurring in the earliest stage of combustion, this results in the formation of fixed species of nitrogen such as NH (nitrogen monohydride), HCN (hydrogen cyanide), H2CN (dihydrogen cyanide) and CN- (cyano radical) which can oxidize to NO [8]. In fuels that contain nitrogen, the incidence of prompt NOx is especially minimal and it is generally only of interest for the most exacting emission targets. This other route occurs at low temperatures, fuel rich conditions and short residence times. This mechanism was first identified by C.P Fenimore in 1971 while studying NO formation in fuel–rich hydrocarbon flames. Fenimore concluded that the NO formed early in the flame was the result of the attack of a hydrocarbon free radical on N2 , in particular by:
CH + N2 → HCN + N
UCI Combustion Laboratory Burner Config. #7. Radiant tube
B-2 | P a g e
NO from N2O Under favorable conditions, which are elevated pressures and oxygen-rich conditions, this intermediate mechanism can contribute as much as 90% of the NOx formed during combustion. This makes it particularly important in equipment such as gas turbines and compression-ignition engines. Because these devices are operated at increasingly low temperatures to prevent NOx formation via the thermal NOx mechanism, the relative importance of the N2O-intermediate mechanism is increasing. It has been observed that about 30% of the NOx formed in these systems can be attributed to the N2O- intermediate mechanism [9].
At high pressures NO formation via N2O becomes important. The pressure influence on NO formed from this mechanism is evidenced in the reaction O + N2 + M ↔ N2O + M; with “M” representing a chemically unchanged third body species. Per Le’ Chatelier’s principle, increasing pressure drives Equation 1 to the right, thus enabling NO formation through the subsequent reactions.
O + N2 + M ↔ N2O + M
N2O + H ↔ NO + NH
O + N2O ↔ NO + NO
UCI Combustion Laboratory Burner Config. #7. Radiant tube
43 | P a g e
References
[1] P. Therkelsen, T. Werts, V. McDonell, and S. Samuelsen, “Analysis of NO[sub x] Formation in a Hydrogen-Fueled Gas Turbine Engine,” J. Eng. Gas Turbines Power, vol. 131, no. 3, p. 031507, 2009.
[2] I. Novosselov and P. Malte, “Development and Application of an Eight-step Global Mechanism for CFD and CRN Simulations of Lean-Premixed Combustors,” in Proceedings of GT2007, 2007, pp. 1–11.
[3] S. L. Bragg, “Application of Reaction Rate Theory to Combustion Chamber Analysis,” Aeronaut. Res. Counc., pp. 1629–1633, 1953.
[4] G. P. Smith, D. M. Golden, M. Frenklach, N. W. Moriarty, B. Eiteneer, M. Goldenberg, C. T. Bowman, R. K. Hanson, S. Song, J. William C. Gardiner, V. V. Lissianski, and Z. Qin, “GRI-MECH 3.0,” http://www.me.berkeley.edu/gri_mech/. .
[5] A. Colorado and V. McDonell, “Reactor network analysis to assess fuel composition effects on NOx emissions from a recuperated gas turbine,” in Proceedings of ASME Turbo Expo 2014: Turbine Technical Conference and Exposition GT2014. June 16 – 20, 2014.
[6] I. W. Group, “White Paper on Natural Gas Interchangeability and Non-Combustion End Use NGC + Interchangeability Work Group,” 2005.
[7] R. Halchuk-harrington, X. Energy, R. D. Wilson, and K. Energy, “AGA Bulletin# 36 and Weaver Interchangeability methods: Yesterday’s Research and today's Challenges. Gas interchangeability today.,” pp. 1–22.
[8] C. Flagan and J. Seinfeld, Fundamental of air pollution engineering. 1988.
[9] “ANSYS® Fluent, Release 14.0, Help System, NOx Formation, Theory Guide, ANSYS, Inc.,” Ansys Fluent v.14\. .