energy resource recovery account (erra) review of … · 4. el segundo startup cost exceptions...
TRANSCRIPT

Application No.: A.17-04-___
Exhibit No.: SCE-01 Witnesses: T. Champ S. Lelewer
T. Condit E. Lopez D. Cox M. Palmstrom S. DiBernardo M. Wallenrod S. Handschin T. Watson R. Hite S. Willis
(U 338-E)
Energy Resource Recovery Account (ERRA) Review Of Operations, 2016 Chapters I-VII
Before the
Public Utilities Commission of the State of California
Rosemead, California
April 3, 2017
PUBLIC VERSION

Testimony of Southern California Edison Company in Support of its Energy Resource Recovery Account (ERRA) Review Of Operations, 2016
Chapters I-VII Table Of Contents
Section Page Witness
i
EXECUTIVE SUMMARY ...........................................................................................1 S. DiBernardo
I. INTRODUCTION .............................................................................................2
A. Organization of Testimony ....................................................................3
B. Comparison Between the Forecast and Recorded Fuel and Purchased Power Revenue Requirement ...............................................4
C. Disallowance Cap ..................................................................................6
D. Safety .....................................................................................................7
II. LEAST-COST DISPATCH ...............................................................................9 T. Watson
A. Introduction and Commission Standard Review ...................................9
1. Information in SCE’s Testimony and Workpapers ....................9
2. The Commission’s LCD Standard ...........................................10
B. Overview of LCD in the CAISO Wholesale Market ...........................12
1. Supply and Demand Bidding/Scheduling ................................12
2. Spot Market Electrical and Natural Gas Transactions .............................................................................13
C. LCD Principles During The Record Period .........................................13
D. Implementing the LCD Standard .........................................................14
1. SCE’s Bidding Strategy ...........................................................14
a) Supply Bidding Strategy ..............................................14
b) Opportunity Cost Bidding ............................................15
c) Dispatch Efficiency Bidding ........................................16
d) Import Bidding .............................................................16
(1) Must-Take Hedged Imports .............................16

Testimony of Southern California Edison Company in Support of its Energy Resource Recovery Account (ERRA) Review Of Operations, 2016
Chapters I-VII Table Of Contents (Continued)
Section Page Witness
ii
(2) Other Hedged Imports......................................16
(3) Unhedged Imports ............................................17
e) Demand Bidding Strategy ............................................17
(1) Bidding Response to High Price Movements .......................................................17
(2) Bidding Response to Low Price Movement ........................................................18
f) Demand Response Bidding Strategy ...........................18
2. Daily LCD Process ..................................................................18
3. SCE Managed Its Resources in Compliance with SOC 4 .......................................................................................19
E. Summary Reports – Annual Exception Rates ......................................20
1. Incremental Bid Cost Calculations ..........................................20
2. Self-Commitment Exceptions ..................................................21
3. Master File (RDT) Change Exceptions ....................................21
4. El Segundo Startup Cost Exceptions .......................................23
F. Market and Business Process Changes ................................................24
1. Flexible Ramping Product .......................................................24
2. Resource Adequacy Availability Incentive Mechanism ...............................................................................25
3. Capacity Procurement Mechanism Enhancement ...................25
4. LCD-Related Process Changes ................................................25
G. Background Summary Tables ..............................................................25
H. Demand Response Resources ..............................................................26

Testimony of Southern California Edison Company in Support of its Energy Resource Recovery Account (ERRA) Review Of Operations, 2016
Chapters I-VII Table Of Contents (Continued)
Section Page Witness
iii
I. SCE’s Market Purchase and Sales .......................................................27
1. Day-Ahead Transaction Summary ...........................................28
2. SCE’s Day-Ahead Transactions Were Competitive and in Compliance with SOC4 ................................................29
3. Criteria Utilized in Selecting the Volume to Buy and Sell in the Hour-Ahead Market .........................................29
4. Hour-Ahead Transaction Summary .........................................30
5. SCE’s Hour-Ahead Transactions Were Competitive and in Compliance with SOC 4 ...............................................30
6. Gas Procurement Supporting LCD ..........................................31
7. Gas Transaction Summary .......................................................31
8. SCE’s Spot Gas Transactions Were Competitive and in Compliance With SOC4 ................................................32
J. SCE’s Spot Electric and Gas Transactions Met LCD Compliance Requirements ...................................................................32
K. Conclusion ...........................................................................................32
III. HYDROELECTRIC GENERATION .............................................................34 T. Condit
A. Characteristics of SCE’s Hydro Generation Resources .......................34
B. SCE Hydro Assets................................................................................36
1. Big Creek .................................................................................37
a) Powerhouse Arrangement ............................................37
b) Environmental/Regulatory Requirements and Constraints Affecting Water Flow, Storage, Release, Etc....................................................38
Testimony of Southern California Edison Company in Support of its Energy Resource Recovery Account (ERRA) Review Of Operations, 2016
Chapters I-VII Table Of Contents (Continued)
Section Page Witness
iv
c) System Operation to Fulfill Requirements/Constraints ............................................39
d) Factors Affecting Operations .......................................40
2. Other SCE Hydro Assets .........................................................40
a) Environmental/Regulatory Requirements and Constraints .............................................................41
b) System Operation Constraints in the Bishop Area ..............................................................................42
c) Factors Affecting Operations .......................................42
d) Storm Debris ................................................................42
e) Canal Restrictions Due to Moss ...................................43
f) Flowline Restrictions Due to Root Intrusion or Lime Deposits in Cement Flowlines and Penstocks......................................................................43
C. Recorded Hydro Production Summary ................................................43
D. Hydro Performance During the Record Period ....................................44
1. EAF Results .............................................................................44
2. FOF Results .............................................................................45
3. Conditions Affecting Operating Results ..................................46
a) Spill Bypassed Energy .................................................47
(1) Big Creek .........................................................47
(2) Other Assets .....................................................47
b) Outage Events ..............................................................49
(1) Scheduled Outages ...........................................50

Testimony of Southern California Edison Company in Support of its Energy Resource Recovery Account (ERRA) Review Of Operations, 2016
Chapters I-VII
Table Of Contents (Continued)
Section Page Witness
v
(2) Unscheduled Outages .......................................51
c) Eastwood Pumped Storage ..........................................54
IV. NATURAL GAS GENERATION ...................................................................56 S. Handschin
A. SCE Peaker Introduction......................................................................56
B. SCE Peakers Performance During the Record Period .........................57
1. Fuel Usage Cost .......................................................................57
2. Results of Operation ................................................................58
a) EAF Results .................................................................58
b) FOF Results .................................................................59
3. Outage Events ..........................................................................60
a) Scheduled Outages .......................................................60
b) Unscheduled Outages ...................................................61
C. SCE Mountainview Generating Station Introduction ..........................62 T. Condit
1. Mountainview’s Performance During the Record Period .......................................................................................63
2. Fuel Usage and Cost ................................................................64
3. Mountainview’s Reliability During the Record Period .......................................................................................65
4. Outage Events ..........................................................................70
a) Scheduled Outages .......................................................70
b) Unscheduled Outage Events ........................................71
V. OTHER GENERATION .................................................................................72 R. Hite

Testimony of Southern California Edison Company in Support of its Energy Resource Recovery Account (ERRA) Review Of Operations, 2016
Chapters I-VII Table Of Contents (Continued)
Section Page Witness
vi
A. Catalina Diesel Fuel / Liquefied Propane Gas and Transportation ......................................................................................72
B. SCE’s Solar Photovoltaic Program ......................................................74 S. Handschin
1. Introduction ..............................................................................74
2. Overview of Solar PV Operations ...........................................76
a) Performance Monitoring ..............................................76
b) Routine Operations ......................................................77
c) Factors Affecting Output .............................................78
d) Maintenance Program ..................................................79
3. SPV Generating Facilities’ Performance During the Record Period...........................................................................79
a) Outage Events ..............................................................80
(1) Scheduled Maintenance ...................................81
(2) Unscheduled Maintenance ...............................82
b) Summary ......................................................................83
C. Fuel Cell Introduction ..........................................................................83
1. UC Santa Barbara ....................................................................84
2. CSU San Bernardino ................................................................84
D. Fuel Cell Performance During the Record Period ...............................84
1. Fuel Usage and Cost ................................................................85
2. Results of Operation ................................................................85
VI. NUCLEAR GENERATION AND FUEL .......................................................87 T. Champ
A. Introduction ..........................................................................................87
Testimony of Southern California Edison Company in Support of its Energy Resource Recovery Account (ERRA) Review Of Operations, 2016
Chapters I-VII Table Of Contents (Continued)
Section Page Witness
vii
B. SCE Oversight Responsibilities for Palo Verde ..................................87
C. Types of Nuclear Outage Activities .....................................................88
1. Refueling and Maintenance Outages .......................................88
2. Forced Outage Activities .........................................................89
D. Palo Verde Record Period Performance ..............................................89
1. Palo Verde Generation .............................................................89
a) Palo Verde Outages ......................................................91
(1) Palo Verde Unit 1.............................................91
(2) Palo Verde Unit 2.............................................93
(3) Palo Verde Unit 3.............................................93
E. Nuclear Fuel Expense ..........................................................................96 S. Lelewer
1. Overview ..................................................................................96
2. Generation Related Nuclear Fuel Expense ..............................96
a) Palo Verde Generation Related Expenses ....................96
3. Non-Generation-Related Expenses ..........................................97
F. Nuclear Fuel Purchases ........................................................................97
1. Natural Uranium Concentrates U3O8 .......................................98
2. Conversion ...............................................................................99
3. Enrichment ...............................................................................99
4. Design and Fabrication ..........................................................100
G. Palo Verde Nuclear Fuel Purchases ...................................................100
1. Uranium Purchases ................................................................100

Testimony of Southern California Edison Company in Support of its Energy Resource Recovery Account (ERRA) Review Of Operations, 2016
Chapters I-VII
Table Of Contents (Continued)
Section Page Witness
viii
2. Conversion to and/or Purchase of UF6...................................100
3. Enrichment and EUP..............................................................101
VII. CONTRACT ADMINISTRATION AND COSTS .......................................102 D. Cox
A. Introduction ........................................................................................102
1. Conventional and Natural Gas Products ................................102
2. PURPA and CHP ...................................................................103 M. Palmstrom
3. RPS ........................................................................................104
4. Behind-The-Meter Contracts .................................................105 M. Wallenrod
B. Safety .................................................................................................105
1. Non-BTM Contract Administration Safety Practices ............105
2. BTM Contract Developing Project Monitoring and Safety .....................................................................................108
C. Authorization for Recovery of Contract Expenses ............................108
1. The Standard of Review for Cost Recovery ..........................110
D. Summary of Contract Administration and Management Processes ............................................................................................111
1. Conventional and Natural Gas ...............................................112 D. Cox
a) Physical Gas Contracts ..............................................113
b) Financial Gas Contracts .............................................114
c) Contract Administration.............................................114
d) Summary of Contract Activity ...................................114
e) Conventional Contract Delivery ................................114
f) Contract Development ...............................................115

Testimony of Southern California Edison Company in Support of its Energy Resource Recovery Account (ERRA) Review Of Operations, 2016
Chapters I-VII Table Of Contents (Continued)
Section Page Witness
ix
g) Contract Amendment Administration ........................117
(1) GenOn Energy Management, LLC (Ellwood 2016-2018) .....................................118
(2) GenOn Energy Management, LLC (Mandalay 2016-2020) ...................................118
(3) Western Power Administration ......................119
(4) Freepoint Commodities, LLC ........................119
(5) Powerex Corp.................................................119
(6) Evolution Markets Futures, LLC ...................120
(7) BGC Financial, L.P. .......................................120
h) LCR RFO Contract Amendments ..............................120
i) Contract Assignment Administration ........................122
(1) Stem DRAM LLC ..........................................122
(2) Sempra Generation, LLC ...............................123
j) Affiliate Transactions and Contract Information ................................................................123
k) Dispute Resolution and Litigation .............................123
(1) Blythe Energy, Inc. ........................................123
(2) NRG/GenOn Energy Management, LLC (RA Confirm – Ormond Beach Unit 1 and 2 and Etiwanda Unit 4) ................124
l) Contract Termination .................................................124
m) Interutility Contracts ..................................................125
(1) WAPA Agreement .........................................126

Testimony of Southern California Edison Company in Support of its Energy Resource Recovery Account (ERRA) Review Of Operations, 2016
Chapters I-VII Table Of Contents (Continued)
Section Page Witness
x
(2) MWD Agreement...........................................126
(3) City of Pasadena Corporation Grant Deed ...............................................................126
2. PURPA AND CHP ................................................................127 M. Palmstrom
a) Contract Administration.............................................127
b) Summary of Contract Activity ...................................129
c) PURPA and CHP Projects That Achieved Commercial Operation or Started Delivering to SCE Under a New Contract ...................................131
d) Contract Development ...............................................131
e) Contract Amendment Administration ........................131
(1) Loma Linda University (ID 2010) .................133
(2) AltaGas Pomona Energy, Inc. (ID 2050) ..............................................................133
(3) AltaGas Pomona Energy, Inc. (ID 2050) ..............................................................133
(4) Elk Hills Power, LLC (ID 2824)....................134
(5) Heber Geothermal Company LLC (ID 3001) ........................................................134
(6) Desert Water Agency (ID 4025) ....................134
(7) Desert Water Agency (ID 4025) ....................135
(8) Calleguas Municipal Water District - Springville Hydroelectric Generating Facility (ID 4152) ..........................................135

Testimony of Southern California Edison Company in Support of its Energy Resource Recovery Account (ERRA) Review Of Operations, 2016
Chapters I-VII Table Of Contents (Continued)
Section Page Witness
xi
(9) Calleguas Municipal Water District - Springville Hydroelectric Generating Facility (ID 4152) ..........................................135
(10) EUI Management PH, Inc. (ID 6031) ............136
(11) AES Tehachapi Wind, LLC (85-A) (ID 6043) ........................................................136
(12) AES Tehachapi Wind, LLC (85-A) (ID 6043) ........................................................136
(13) AES Tehachapi Wind LLC (85-B) (ID 6044) ........................................................137
(14) AES Tehachapi Wind LLC (85-B) (ID 6044) ........................................................137
(15) Difwind Farms Limited V (ID 6053) .............137
(16) Section 16-29 Power Purchase Contract Trust (Altech III) (ID 6087) ............137
(17) Section 16-29 Power Purchase Contract Trust (Altech III) (ID 6087) ............138
(18) Difwind Partners Trust (ID 6088) ..................138
(19) Difwind Partners Trust (ID 6088) ..................138
(20) Section 22 Power Contract Trust (San Jacinto) (ID 6094) ..................................139
(21) Section 22 Power Contract Trust (San Jacinto) (ID 6094) ..................................139
(22) Westwind Trust (ID 6096) .............................139
(23) Westwind Trust (ID 6096) .............................140
(24) Painted Hills Wind Developers (ID 6112) ..............................................................140

Testimony of Southern California Edison Company in Support of its Energy Resource Recovery Account (ERRA) Review Of Operations, 2016
Chapters I-VII Table Of Contents (Continued)
Section Page Witness
xii
(25) The Bank of New York Mellon Trust Company, N.A. (ID 6213) .............................140
(26) Oak Creek Energy Trust (ID 6234) ...............141
(27) Energy Development & Construction Corp. (ID 6462) ..............................................141
(28) Energy Development & Construction Corp. (ID 6462) ..............................................141
f) Contract Assignment Administration ........................142
(1) E.F. Oxnard Inc. (ID 2205) ............................142
(2) Exxon Mobil Oil Corporation (ID 2215) ..............................................................142
(3) AES Tehachapi Wind, LLC (85-A) (ID 6043) ........................................................143
(4) Terra-Gen 251 Wind, LLC (Monolith X) (ID 6105) .................................143
(5) Terra-Gen 251 Wind, LLC (Monolith XI) (ID 6106) ................................143
g) Affiliate Transactions and Contract Information ................................................................143
h) Uncontrollable Force Administration ........................143
(1) Del Ranch - CalEnergy Operating Corporation (ID 3004) ...................................145
(2) Elmore – CalEnergy Operating Corporation (ID 3009) ...................................146
(3) Salton Sea Unit 3 – CalEnergy Operating Corporation (ID 3025) ..................146
Testimony of Southern California Edison Company in Support of its Energy Resource Recovery Account (ERRA) Review Of Operations, 2016
Chapters I-VII Table Of Contents (Continued)
Section Page Witness
xiii
(4) Salton Sea Unit 3 – CalEnergy Operating Corporation (ID 3025) ..................147
(5) Leathers – CalEnergy Operating Corporation (ID 3026) ...................................147
(6) Leathers – CalEnergy Operating Corporation (ID 3026) ...................................147
(7) Salton Sea Unit 2 – CalEnergy Operating Corporation (ID 3028) ..................148
(8) Salton Sea Unit 1 – CalEnergy Operating Corporation (ID 3039) ..................148
(9) Salton Sea Unit 4 – CalEnergy Operating Corporation (ID 3050) ..................149
i) Forced Outage Claim Administration ........................149
j) Dispute Resolution and Litigation .............................149
(1) Ormesa LLC (ID 3104) ..................................150
(2) Coso Energy Developers (BLM) (ID 3030) ..............................................................151
k) Contract Terminations ...............................................151
3. RPS ........................................................................................153
a) Contract Administration.............................................153
b) Summary of Contract Activity ...................................153
c) RPS Contracts that Achieved Commercial Operation....................................................................156
d) Contract Development ...............................................158
e) Contract Amendment Administration ........................158

Testimony of Southern California Edison Company in Support of its Energy Resource Recovery Account (ERRA) Review Of Operations, 2016
Chapters I-VII Table Of Contents (Continued)
Section Page Witness
xiv
(1) MM Tajiguas Energy LLC (ID 1210) ............162
(2) Coso Geothermal Power Holdings, LLC (ID 3103) ...............................................162
(3) Geysers Power Company, LLC (ID 3117) ..............................................................162
(4) TKO Power, LLC (South Bear Creek) (ID 4213) ............................................163
(5) Regulus Solar, LLC (ID 5297).......................163
(6) Central Antelope Dry Ranch C, LLC (ID 5463) ........................................................163
(7) North Lancaster Ranch (ID 5468) ..................164
(8) McCoy Solar (ID 5494) .................................164
(9) Soccer Center, Mound Solar Partnership XI, LLC (ID 5625) ......................165
(10) FTS Master Tenant 2, LLC (SEPV18 Little Rock project) (ID 5629) .......................165
(11) RE Adams East, LLC (ID 5630) ....................166
(12) DG Solar Lessee, LLC (ID 5650) ..................166
(13) DG Solar Lessee, LLC (ID 5650) ..................166
(14) Catalina Solar 2, LLC (ID 5755) ...................166
(15) Adelanto Solar (ID 5758)...............................167
(16) SEPV Mojave West, LLC (ID 5778) .............167
(17) AVS Lancaster, Mound Solar Partnership XI, LLC (ID 5788) ......................167
(18) SunE Solar (ID 5791).....................................168
Testimony of Southern California Edison Company in Support of its Energy Resource Recovery Account (ERRA) Review Of Operations, 2016
Chapters I-VII Table Of Contents (Continued)
Section Page Witness
xv
(19) Adelanto Solar II (ID 5801) ...........................168
(20) North Rosamond Solar, LLC (ID 5814) ..............................................................168
(21) Luz Solar Partners III, LLC (ID 5817) ..............................................................169
(22) Luz Solar Partners IV, LLC (ID 5818) ..............................................................169
(23) Luz Solar Partners V, LLC (ID 5819) ..............................................................169
(24) Longboat Solar, LLC (ID 5822) ....................170
(25) Portal Ridge Solar B, LLC (ID 5826) ............170
(26) Rio Bravo Solar I, LLC (ID 5827) .................170
(27) Rio Bravo Solar II, LLC (ID 5828) ...............171
(28) Wildwood Solar II, LLC (ID 5829) ...............171
(29) RE Garland A, LLC (ID 5834) ......................171
(30) RE Garland A, LLC (ID 5834) ......................172
(31) RE Garland A (ID 5834) ................................172
(32) Mesquite Solar 2, LLC (ID 5880) ..................172
(33) Sun Streams, LLC (ID 5882) .........................173
(34) Sun Streams, LLC (ID 5882) .........................173
(35) Willow Springs, LLC (ID 5883) ....................173
(36) Sunshine Valley Solar, LLC (ID 5884) ..............................................................174
(37) Blythe Solar II, LLC (ID 5885) .....................174

Testimony of Southern California Edison Company in Support of its Energy Resource Recovery Account (ERRA) Review Of Operations, 2016
Chapters I-VII Table Of Contents (Continued)
Section Page Witness
xvi
(38) Valentine Solar, LLC (ID 5886) ....................174
(39) RE Garland LLC (ID 5888) ...........................175
(40) RE Garland, LLC (ID 5888) ..........................175
(41) RE Garland LLC (ID 5888) ...........................175
(42) RE Garland, LLC (ID 5888) ..........................176
(43) Blythe Solar III, LLC (ID 5889) ....................176
(44) Mountain View Power Partners IV (ID 6304) ........................................................176
(45) Alta Wind VIII (ID 6321) ..............................176
(46) Caithness Shepherds Flat (IDs 6330, 6331, 6332) ....................................................177
(47) Mountain View Power Partners LLC (ID 6333) ........................................................177
(48) Coram Energy, LLC (ID 6355) ......................177
(49) Coram Energy (ID 6355) ...............................178
(50) Broadview Energy KW, LLC (ID 6368) ..............................................................178
(51) Broadview Energy JN, LLC (ID 6379) ..............................................................179
(52) Voyager Wind I, LLC (ID 6380) ...................179
(53) Yavi Energy, LLC (ID 6452) .........................180
(54) TGP Energy Management, LLC Energy and REC Sale (ID 8012) ....................180
f) Contract Assignment Administration ........................180
Testimony of Southern California Edison Company in Support of its Energy Resource Recovery Account (ERRA) Review Of Operations, 2016
Chapters I-VII Table Of Contents (Continued)
Section Page Witness
xvii
(1) RE Tranquillity 8 Azul, LLC (ID 5246) ..............................................................181
(2) Central Antelope Dry Ranch C, LLC (ID 5463) ........................................................182
(3) Central Antelope Dry Ranch C, LLC (ID 5463) ........................................................182
(4) North Lancaster Ranch, LLC (ID 5468) ..............................................................182
(5) North Lancaster Ranch, LLC (ID 5468) ..............................................................183
(6) Soccer Center, Mound Solar Partnership XI, LLC (ID 5625) ......................183
(7) RE Adams East, LLC (ID 5630) ....................183
(8) California PV Energy, LLC (Champagne) (ID 5652) .................................183
(9) California PV Energy, LLC (Jurupa) (ID 5653) ........................................................184
(10) Milliken Landfill Solar, LLC (ID 5744) ..............................................................184
(11) Milliken Landfill Solar, LLC (ID 5744) ..............................................................184
(12) Catalina Solar 2, LLC (ID 5755) ...................184
(13) Citizen Solar B LLC (ID 5756) .....................185
(14) SEPV Mojave West, LLC (ID 5778) .............185
(15) SEPV Mojave West, LLC (ID 5778) .............185
(16) Adera Solar, LLC (ID 5781) ..........................185

Testimony of Southern California Edison Company in Support of its Energy Resource Recovery Account (ERRA) Review Of Operations, 2016
Chapters I-VII Table Of Contents (Continued)
Section Page Witness
xviii
(17) AVS Lancaster, LLC (ID 5788) .....................186
(18) Copper Mountain Solar 4, LLC (ID 5804) ..............................................................186
(19) Mount Signal Solar II, LLC (ID 5805) ..............................................................186
(20) Mount Signal Solar II, LLC (ID 5805) ..............................................................187
(21) Mount Signal Solar II, LLC (ID 5805) ..............................................................187
(22) Mount Signal Solar V, LLC (ID 5808) ..............................................................187
(23) Mount Signal Solar V, LLC (ID 5808) ..............................................................187
(24) Longboat Solar, LLC (ID 5822) ....................187
(25) Algonquin SKIC 10 Solar, LLC (ID 5823) ..............................................................188
(26) Portal Ridge Solar B, LLC (ID 5826) ............188
(27) Portal Ridge Solar B, LLC (ID 5826) ............188
(28) Portal Ridge Solar B, LLC (ID 5826) ............189
(29) Rio Bravo Solar I, LLC (ID 5827) .................189
(30) Rio Bravo Solar I, LLC (ID 5827) .................189
(31) Rio Bravo Solar II, LLC (ID 5828) ...............189
(32) Rio Bravo Solar II, LLC (ID #5828) .............190
(33) Wildwood Solar II, LLC (ID 5829) ...............190
(34) Wildwood Solar II, LLC (ID 5829) ...............190
Testimony of Southern California Edison Company in Support of its Energy Resource Recovery Account (ERRA) Review Of Operations, 2016
Chapters I-VII Table Of Contents (Continued)
Section Page Witness
xix
(35) CED Ducor Solar 1 LLC (f/k/a SR Solis Vestal Almond LLC) (ID 5835) ..............................................................190
(36) CED Ducor Solar 2 LLC (f/k/a SR Solis Vestal Herder LLC) (ID 5836) .............191
(37) CED Ducor Solar 4 LLC (f/k/a SR Solis Vestal Fireman) (ID 5837) ....................191
(38) CED Ducor Solar 3 LLC (f/k/a SR Solis Crown) (ID 5838) .................................191
(39) Mesquite Solar 2, LLC (ID 5880) ..................191
(40) Blythe Solar II LLC (ID 5885) ......................192
(41) Mountain View Power Partners IV LLC (ID 6304) ...............................................192
(42) Mountain View Power Partners LLC (ID 6333) ........................................................192
(43) Broadview Energy KW, LLC (ID 6368) ..............................................................192
(44) Broadview Energy JN, LLC (ID 6379) ..............................................................193
(45) Voyager Wind I, LLC (ID 6380) ...................193
g) Affiliate Transactions and Contract Information ................................................................194
h) Uncontrollable Force Administration ........................194
(1) Geysers Power Company, LLC (ID 3107) ..............................................................195
(2) Geysers Power Company, LLC (ID 3107) ..............................................................196

Testimony of Southern California Edison Company in Support of its Energy Resource Recovery Account (ERRA) Review Of Operations, 2016
Chapters I-VII Table Of Contents (Continued)
Section Page Witness
xx
(3) Solar Partners I, LLC (ID 5208) ....................196
(4) Solar Partners I, LLC (ID 5208) ....................196
(5) Solar Star XIX (ID 5412) ...............................197
(6) Solar Star XIX (ID 5412) ...............................197
(7) Nicolis, LLC (ID 5485)..................................197
(8) Tropico, LLC (ID 5490) ................................198
i) Energy Delivery Performance Administration ...........................................................198
(1) Ventura Regional Sanitation District (ID 1221) ........................................................199
(2) Coso Clean Power (ID 3103) .........................199
(3) ORNI 18, LLC (ID 3108) ..............................199
(4) Alta Wind IV, LLC (ID 6317) .......................199
(5) Alta Wind V, LLC (ID 6318) ........................200
j) Dispute Resolution and Litigation .............................200
(1) Satsuma Solar, LLC (ID 5300) ......................200
(2) Sand Canyon of Tehachapi LLC (ID 6341) ..............................................................201
(3) Western Water and Power Production Limited (ID 1223) .......................202
(4) Coso Clean Power (ID 3103) .........................202
(5) Caithness Shepherds Flat (IDs 6330, 6331, 6332) ....................................................203
k) Contract Terminations ...............................................204

Testimony of Southern California Edison Company in Support of its Energy Resource Recovery Account (ERRA) Review Of Operations, 2016
Chapters I-VII Table Of Contents (Continued)
Section Page Witness
xxi
l) Other Contract Administration Activities ..................208
(1) Berry Petroleum (IDs 2814 & 2819) .............208
(2) La Paloma (ID 11117) ...................................208
(3) Little Rock - Pham Solar (ID 5512) ...............208
(4) Supplier Diversity ..........................................209
(5) Contract Management & Settlement System ............................................................209
(6) Portfolio Optimization ...................................210
4. BTM Contracts Executed .......................................................210 M. Wallenrod
a) Contract Administration.............................................211
b) Summary of Contract Activity ...................................211
c) Contract Development ...............................................211
d) Contract Amendment Administration ........................212
(1) (Lines 1-2) Solar Star California XXXIV, LLC (Offer 490001 - Solar LCR Energy Savings Agreements) ................230
(2) (Line 3) Solar Star California XXXIV, LLC (Offer 490001 - Solar LCR Energy Savings Agreements) ................230
(3) (Line 4) Solar Star California XXXIV, LLC (Offer 490001 - Solar LCR Energy Savings Agreements) ................231
(4) (Line 5) Solar Star California XXXIV, LLC (Offer 490001 - Solar LCR Energy Savings Agreements) ................231

Testimony of Southern California Edison Company in Support of its Energy Resource Recovery Account (ERRA) Review Of Operations, 2016
Chapters I-VII Table Of Contents (Continued)
Section Page Witness
xxii
(5) (Item 6) Solar Star California XXXV, LLC (Offer 490002 - Solar LCR Energy Savings Agreements) ................232
(6) (Item 7) Solar Star California XXXV, LLC (Offer 490002 - Solar LCR Energy Savings Agreements) ................232
(7) (Item 8) Solar Star California XXXV, LLC (Offer 490002 - Solar LCR Energy Savings Agreements) ................233
(8) (Item 9) Solar Star California XXXV, LLC (Offer 490002 - Solar LCR Energy Savings Agreements) ................234
(9) (Items 10) Solar Star California XXXVI, LLC (Offer 490003 - Solar LCR Energy Savings Agreements) ................234
(10) (Items 11) Solar Star California XXXVI, LLC (Offer 490003 - Solar LCR Energy Savings Agreements) ................235
(11) (Item 12) Solar Star California XXXVI, LLC (Offer 490003 - Solar LCR Energy Savings Agreements) ................235
(12) (Item 13) Solar Star California XXXVI, LLC (Offer 490003 - Solar LCR Energy Savings Agreements) ................236
(13) (Item 14) Solar Star California XXXVII, LLC (Offer 490004 - Solar LCR Energy Savings Agreements) ................237
(14) (Item 15) Solar Star California XXXVII, LLC (Offer 490004 - Solar LCR Energy Savings Agreements) ................237

Testimony of Southern California Edison Company in Support of its Energy Resource Recovery Account (ERRA) Review Of Operations, 2016
Chapters I-VII Table Of Contents (Continued)
Section Page Witness
xxiii
(15) (Item 16) Solar Star California XXXVII, LLC (Offer 490004 - Solar LCR Energy Savings Agreements) ................238
(16) (Item 17) Solar Star California XXXVII, LLC (Offer 490004 - Solar LCR Energy Savings Agreements) ................238
(17) (Item 18) Solar Star California XXXVII, LLC (Offer 490004 - Solar LCR Energy Savings Agreements) ................239
(18) (Items 19-20) Solar Star California XXXIX, LLC (Offer 490005 - Solar LCR Energy Savings Agreements) ................239
(19) (Item 21) Solar Star California XXXIX, LLC (Offer 490005 - Solar LCR Energy Savings Agreements) ................240
(20) (Item 22) Solar Star California XXXIX, LLC (Offer 490005 - Solar LCR Energy Savings Agreements) ................240
(21) (Item 23) Solar Star California XXXIX, LLC (Offer 490005 - Solar LCR Energy Savings Agreements) ................241
(22) (Item 24) Solar Star California XXXVIII, LLC (Offer 490006 - Solar LCR Energy Savings Agreements) ...................................................241
(23) (Item 25) Solar Star California XXXVIII, LLC (Offer 490006 - Solar LCR Energy Savings Agreements) ...................................................241

Testimony of Southern California Edison Company in Support of its Energy Resource Recovery Account (ERRA) Review Of Operations, 2016
Chapters I-VII Table Of Contents (Continued)
Section Page Witness
xxiv
(24) (Item 26) Solar Star California XXXVIII, LLC (Offer 490006 - Solar LCR Energy Savings Agreements) ...................................................242
(25) (Item 27) Solar Star California XXXVIII, LLC (Offer 490006 - Solar LCR Energy Savings Agreements) ...................................................243
(26) (Items 28-47) NRG Energy Efficiency-P, LLC (Offers 447153, 447150, 447151, and 447152 – Energy Efficiency Savings Agreements) ...................................................243
(27) (Items 48-63) NRG Energy Efficiency-L, LLC (Offers 447103, 447102, 447101, and 447100 Energy Efficiency Savings Agreements) ....................244
(28) (Items 64-131) Onsite Energy Corporation (Offers 408001, 408002, 408003, 408004, 408005, 408006, 408007, 408008, 408009, 408010, 408011, 408012, 408013, 408014, 408015, 408016 and 408017 Energy Efficiency Savings Agreements) ....................245
(29) (Items 133-159) Sterling Analytics, LLC (Offers 429001, 429003, 429002, 429004, 429006, and 429007 Energy Efficiency Savings Agreements) ...................................................245
(30) (Item 160) NRG Curtailment Solutions (Offer 447250) ...............................246
(31) (Item 161) NRG Curtailment Solutions (Offer 447250) ...............................246

Testimony of Southern California Edison Company in Support of its Energy Resource Recovery Account (ERRA) Review Of Operations, 2016
Chapters I-VII Table Of Contents (Continued)
Section Page Witness
xxv
(32) (Item 162) NRG Curtailment Solutions (Offer 447250) ...............................247
(33) (Item 163-166) Hybrid-Electric Building Technologies Irvine 1, Irvine 2, West LA 1 and West LA 2 LLC (Offer 467009, 467010, 467022, 467025) ............................................247
(34) (Items 167-170) Hybrid-Electric Building Technologies Irvine 1, Irvine 2, West LA 1 and West LA 2 LLC (Offer 467009, 467010, 467022, 467025) ............................................247
(35) (Items 171-174) Hybrid-Electric Building Technologies Irvine 1, Irvine 2, West LA 1 and West LA 2 LLC (Offer 467009, 467010, 467022, 467025) ............................................248
(36) (Item 175) Stem Energy Southern California LLC (Offer 402039, 402040) ..........................................................248
(37) (Item 176) Stem Energy Southern California LLC (Offer 402039, 402040) ..........................................................248
(38) (Item 177) Stem Energy Southern California LLC (Offer 402039, 402040) ..........................................................249
(39) (Item 178) Stem Energy Southern California LLC (Offer 402040) .....................249

Testimony of Southern California Edison Company in Support of its Energy Resource Recovery Account (ERRA) Review Of Operations, 2016
Chapters I-VII Table Of Contents (Continued)
Section Page Witness
xxvi
(40) (Items 179-258) NRG, SPV #1 LLC (Offers 431166, 431163, 431160, 431157, 431154, 431151, 431148, 431145, 431070, 431067, 431064, 431061, 431058, 431055, 431052, and 431049) ...................................................249
e) Contract Assignment Administration ........................250
f) Contract Terminations ...............................................251
g) Contracts that Achieved Commercial Operation....................................................................252
h) Other Contract Activities ...........................................253
(1) Letter of Agreements .....................................253
E. Contract Collateral .............................................................................254 D. Cox
1. Conventional ..........................................................................254
a) Development Security and Performance Assurance ...................................................................254
2. PURPA and CHP ...................................................................254
3. RPS ........................................................................................254
a) Development Security ................................................254
b) Performance Assurance .............................................255
4. BTM Contracts.......................................................................255 M. Wallenrod
5. Contribution in Aid of Construction (CIAC) Tax ..................256
F. Contract Compliance .........................................................................256 E. Lopez
1. Conventional ..........................................................................256
a) Insurance Verification ................................................256

Testimony of Southern California Edison Company in Support of its Energy Resource Recovery Account (ERRA) Review Of Operations, 2016
Chapters I-VII Table Of Contents (Continued)
Section Page Witness
xxvii
2. PURPA and CHP ...................................................................257
a) Capacity Performance Programs and Verification ................................................................257
(1) CapDemo Program.........................................257
(2) CapPerformance Program ..............................260
b) Metering Energy Deliveries .......................................261
(1) PURPA and CHP Projects Within SCE’s Territory ..............................................262
(2) Out-of-Service Territory PURPA Projects ...........................................................264
c) Prescribed Dispatch ...................................................265
(1) Wheelabrator Norwalk (ID 2064) ..................265
(2) E.F. Oxnard (ID 2205) ...................................265
d) Protection Equipment Testing Program .....................265
e) QF Efficiency Monitoring Program ...........................266
f) Scheduled Maintenance .............................................267
g) Wind Operating Programs .........................................268
(1) Turbine Inventory ..........................................269
(2) Real-time Wind Monitoring System ..............269
(3) Wind Curtailments .........................................270
(4) Maintenance and Upgrades of the Electrical System ...........................................270
(5) SCE Transmission System Expansion .......................................................271

Testimony of Southern California Edison Company in Support of its Energy Resource Recovery Account (ERRA) Review Of Operations, 2016
Chapters I-VII Table Of Contents (Continued)
Section Page Witness
xxviii
h) Insurance Verification ................................................271
i) Forecasting and Scheduling Accuracy .......................271
3. RPS ........................................................................................272
a) Renewable Capacity Verification ..............................272
b) Metering Energy Deliveries .......................................274
c) Active Monitoring ......................................................274
d) Western Renewable Energy Generation Information System (WREGIS) .................................277
e) RPS Insurance Verification........................................277
f) Wind Operating Programs .........................................277
g) Renewable Energy Credit (REC) Retirement ............278
G. Contract Payment Process..................................................................280 S. Willis
1. Conventional ..........................................................................281
a) RA ..............................................................................281
b) Gas Transactions ........................................................281
c) Transmission ..............................................................281
d) Power Purchase Tolling Agreements .........................282
e) Power Transactions ....................................................282
2. PURPA and CHP ...................................................................282
a) Energy Rates for PURPA and CHP Contracts ....................................................................282
b) Capacity for PURPA and CHP Contracts ...................284
c) Performance Bonus – Capacity ..................................284

Testimony of Southern California Edison Company in Support of its Energy Resource Recovery Account (ERRA) Review Of Operations, 2016
Chapters I-VII Table Of Contents (Continued)
Section Page Witness
xxix
d) Out of Service Territory Projects ...............................285
e) Line Loss Factor ........................................................285
f) Time of Delivery (TOD) Periods ...............................285
3. RPS ........................................................................................286
a) Out of Service Territory Projects ...............................286
b) Energy Payment Calculations ....................................286
(1) Time of Delivery (TOD) Periods ...................286
4. Other Impacts to Payments ....................................................286
a) CAISO Charges .........................................................286
b) Scheduled Delivery Deviation Adjustments (SDD) .........................................................................287
c) Scheduling Coordinator Fees .....................................287
d) Mean Absolute Error (MAE) .....................................287
e) Energy Delivery Performance Administration ...........................................................287

Testimony of Southern California Edison Company in Support of its Energy Resource Recovery Account (ERRA) Review Of Operations, 2016
Chapters I-VII List Of Tables
Table Page
xxx
Table I-1 2016 Forecast & Recorded Fuel and Purchased Power Revenue Requirement
($000) .....................................................................................................................................................5
Table I-2 Standard of Conduct (SOC) 4 Disallowance Cap ($000) ...........................................................7
Table II-3 Summary of 2016 Thermal Resource Incremental Bid Cost Exceptions .................................21
Table II-4 Summary of 2016 Proxy and Registered Cost Change Exceptions ..........................................23
Table II-5 December 2016 El Segundo Startup Cost Exceptions ..............................................................24
Table II-6 Background Summary of 2016 Resource Capacity and Awards ..............................................26
Table II-7 Summary of 2016 Day-Ahead Spot Electric Transactions (Physical and
Financial) .............................................................................................................................................28
Table II-8 Summary of 2016 Hour-Ahead Spot Electric Transactions (Physical and
Financial) .............................................................................................................................................30
Table II-9 Summary of 2016 Spot Gas Transactions .................................................................................32
Table III-10 SCE Hydro – 2016 Recorded Hydro Production ..................................................................44
Table III-11 SCE Hydro – Equivalent Availability Factor (EAF) .............................................................45
Table III-12 SCE Hydro – Forced Outage Factor (FOF) ...........................................................................46
Table III-13 SCE Hydro – 2016 Generation and Outage Bypassed Energy ..............................................47
Table III-14 2016 Bypassed Energy Events ..............................................................................................48
Table III-15 SCE-Hydro – 2016 Scheduled Outages ................................................................................50
Table III-16 SCE Hydro – 2016 Unscheduled Outages (Lasting Longer than 24 Hrs on
Units Greater Than 25MW) .................................................................................................................52
Table IV-17 SCE Peakers - 2016 Generation and Starts ...........................................................................57
Table IV-18 SCE Peakers - 2016 Fuel Usage & Cost ...............................................................................58
Table IV-19 SCE Peakers - 2016 Reliability .............................................................................................59

Testimony of Southern California Edison Company in Support of its Energy Resource Recovery Account (ERRA) Review Of Operations, 2016
Chapters I-VII List Of Tables (Continued)
Table Page
xxxi
Table IV-20 SCE Peakers - 2016 Scheduled Outage Results ....................................................................61
Table IV-21 SCE Mountainview - 2016 Generation .................................................................................63
Table IV-22 SCE Mountainview – 2016 Fuel Usage & Cost ....................................................................64
Table IV-23 SCE Mountainview - Availability Targets ............................................................................67
Table IV-24 SCE Mountainview - 2016 Availability ................................................................................68
Table IV-25 SCE Mountainview – 2016 Reliability .................................................................................69
Table V-26 Catalina Operations Diesel Fuel 2016 Recorded Delivered Diesel Costs ..............................73
Table V-27 Catalina Operation Propane Fuel 2016 Recorded Delivered Propane Costs .........................74
Table V-28 SCE-Owned Solar PV Plants ..................................................................................................75
Table V-29 SPVP 2016 Outages Exceeding 24 Hours in Duration ...........................................................81
Table V-30 SCE Fuel Cells - 2016 Performance .......................................................................................84
Table V-31 SCE Fuel Cell - 2016 Fuel Usage & Cost ..............................................................................85
Table VI-32 2016 Record Period Generation ............................................................................................89
Table VI-33 EAF and FOF Palo Verde Generation ...................................................................................90
Table VI-34 2016 Palo Verde Generation (Net MWh, 100% Share) ........................................................91
Table VI-35 2016 Palo Verde Unit 1 Forced/Scheduled Shutdowns ........................................................91
Table VI-36 2016 Palo Verde Unit 3 Forced/Scheduled Shutdowns ........................................................94
Table VI-37 Nuclear Fuel Energy Production and Expense ......................................................................96
Table VI-38 Typical Reload Nuclear Fuel Procurement Schedule – Months ...........................................98
Table VII-39 Conventional Projects Costs Recovered Through CAM and ERRA January
2, 2016 Through December 31, 2016 ................................................................................................110
Table VII-40 Conventional Projects that Began Operations January 1, 2016 Through
December 31, 2016 ............................................................................................................................115

Testimony of Southern California Edison Company in Support of its Energy Resource Recovery Account (ERRA) Review Of Operations, 2016
Chapters I-VII List Of Tables (Continued)
Table Page
xxxii
Table VII-41 New Conventional and Natural Gas Contracts January 1, 2016 Through
December 31, 2016 ............................................................................................................................116
Table VII-42 Conventional and Gas Amendments and Letter Agreements January 1, 2016
Through December 31, 2016 .............................................................................................................118
Table VII-43 LCR RFO Contract Amendments January 1, 2016 Through December 31,
2016....................................................................................................................................................121
Table VII-44 Conventional and Gas Contract Consents January 1, 2016 Through
December 31, 2016 ............................................................................................................................122
Table VII-45 Conventional Contract Terminations January 1, 2016 Through December
31, 2016..............................................................................................................................................125
Table VII-46 Non-Coincident Contract Capacity Quantities and Expiration Dates for
SCE’s Major Interutility Contract ......................................................................................................126
Table VII-47 PURPA and CHP Contract Costs Recovered Through CAM and ERRA .........................129
Table VII-48 PURPA and CHP Contracts that Achieved Commercial Operation January
1, 2016 Through December 31, 2016 ................................................................................................131
Table VII-49 PURPA and CHP New Contracts Executed January 1, 2016 Through
December 31, 2016 ............................................................................................................................131
Table VII-50 PURPA and CHP Contract Amendments and Letter Agreements January 1,
2016 Through December 31, 2016 ....................................................................................................132
Table VII-51 CHP and PURPA Contract Consents and Consents to Assignments January
1, 2016 Through December 31, 2016 ................................................................................................142
Table VII-52 PURPA and CHP Uncontrollable Force Claims Tendered and/or Pending
January 1, 2016 Through December 31, 2016 ...................................................................................145

Testimony of Southern California Edison Company in Support of its Energy Resource Recovery Account (ERRA) Review Of Operations, 2016
Chapters I-VII List Of Tables (Continued)
Table Page
xxxiii
Table VII-53 PURPA and CHP Contract Terminations January 1, 2016 Through
December 31, 2016 ............................................................................................................................152
Table VII-54 RPS Contracts that Achieved Commercial Operation January 1, 2016
Through December 31, 2016 .............................................................................................................157
Table VII-55 New RPS Contracts Executed January 1, 2016 Through December 31, 2016 ..................158
Table VII-56 RPS Contracts Amendments and Letter Agreements January 1, 2016
Through December 31, 2016 .............................................................................................................159
Table VII-57 RPS Contracts Assignments January 1, 2016 Through December 31, 2016 .....................181
Table VII-58 RPS Uncontrollable Force Claims Tendered and/or Pending January 1,
2016 Through December 31, 2016 ....................................................................................................195
Table VII-59 RPS Contract Terminations January 1, 2016 Through December 31, 2016 ......................205
Table VII-60 New BTM Contracts January 1, 2016 Through December 31, 2016 ................................212
Table VII-61 SCE LCR BTM Contract Amendments January 1, 2016 Through December
31, 2016..............................................................................................................................................213
Table VII-62 SCE BTM Contract Consents and Consents to Assignments ............................................251
Table VII-63 BTM Contracts that Terminated January 1, 2016 Through December 31,
2016....................................................................................................................................................252
Table VII-64 BTM Contracts that Achieved Commercial Operation January 1, 2016
Through December 31, 2016 .............................................................................................................253
Table VII-65 CapPerformance Failures January 1, 2016 Through December 31, 2016 .........................261
Table VII-66 Projects That Failed to Submit Operation and Efficiency Data for Calendar
Year 2015 ...........................................................................................................................................267

Testimony of Southern California Edison Company in Support of its Energy Resource Recovery Account (ERRA) Review Of Operations, 2016
Chapters I-VII List Of Tables (Continued)
Table Page
xxxiv
Table VII-67 Renewable Capacity Verifications January 1, 2016 Through December 31,
2016....................................................................................................................................................273
Table VII-68 RPS Active Monitoring January 1, 2016 Through December 31, 2016 ............................276
Table VII-69 QF Legacy Amendment Energy Pricing Options ..............................................................284

Testimony of Southern California Edison Company in Support of its Energy Resource Recovery Account (ERRA) Review Of Operations, 2016
Chapters I-VII List Of Figures
Figure Page
xxxv
Figure III-1 .................................................................................................................................................35

1
EXECUTIVE SUMMARY 1
In this testimony, Southern California Edison (SCE): 2
1. Demonstrates that 2016 Record Period Fuel & Purchased Power (F&PP) expenses were 3
reasonably incurred; 4
2. Presents explanations of variances between 2016 forecast and recorded F&PP expenses; 5
3. Demonstrates that the dispatch of generation resources and related spot market 6
transactions complied with SCE’s 2014 Assembly Bill (AB) 57 Procurement Plan and 7
Standard of Conduct 4; 8
4. Shows that SCE’s contract administration activities and management of utility-retained 9
generation (URG) outages were reasonable; 10
5. Presents the operation of various regulatory accounts (i.e., balancing and memorandum 11
accounts). The majority of these accounts, such as the ERRA Balancing Account, are 12
audited by the Commission to ensure that recorded entries are accurate and consistent 13
with Commission decisions; 14
6. Provides support for the return of the net over-collected balance of $3.605 million 15
recorded in the Project Development Division Memorandum Account, the Purchase 16
Agreement Administrative Costs Balancing Account, and the Renewables Portfolio 17
Standard Costs Memorandum Account and; 18
7. Proposes to return to customers $79.182 million in unspent, uncommitted funds from 19
prior period Demand Response (DR) funding periods; and 20
8. Presents a review of other procurement-related activities and expenses and/or activities 21
and expenses that the Commission has deemed within the scope of ERRA Review 22
proceedings. 23

2
I. 1
INTRODUCTION 2
In compliance with Decision (D.)02-10-062, D.03-07-029, and D.04-01-048, SCE is submitting 3
its April 3, 2017 Energy Resources Recovery Account (ERRA) application, which sets forth SCE’s 4
operations from January 1, 2016 through December 31, 2016 (Record Period). SCE’s supporting 5
testimony is included in Exhibits SCE-1 and SCE-2. Among other things, in these exhibits SCE 6
demonstrates that for the Record Period: (1) dispatch of generation resources and related spot market 7
transactions complied with SCE’s 2014 Assembly Bill (AB) 57 Procurement Plan and Standard of 8
Conduct 4;1 (2) procurement expenses eligible to be recovered through the ERRA Balancing Account 9
were accurately recorded; and (3) SCE’s contract administration activities and URG outage-10
management operations were reasonable. 11
In D.02-10-062, the Commission determined that certain procurement operations should be 12
reviewed annually in the ERRA review proceeding. The review contemplated in D.02-10-062 and 13
D.02-12-074 includes URG expenses and contract administration of existing qualifying facility (QF) 14
contracts, bilateral contracts, inter-utility power contracts and renewable resource contracts. 15
Additionally, D.02-10-062 and D.02-12-074 require a compliance review of the utilities’ least-cost 16
dispatch operations of its generation portfolio. 17
Pursuant to D.02-10-062, SCE is required to set forth the entries recorded in the ERRA 18
Balancing Account for review. These entries, along with entries recorded in the Base Revenue 19
Requirement Balancing Account, the Nuclear Decommissioning Adjustment Mechanism, the Public 20
Purpose Programs Adjustment Mechanism, the California Alternate Rates for Energy (CARE) 21
Balancing Account, and the New System Generation Balancing Account, are supported in Section B of 22
Chapter XI.2 Sections C through E of Chapter XI support the 2016 operations of 12 accounts.3 Chapter 23 1. The Commission clarified the scope of review applicable to least-cost dispatch decisions in D.05-01-054,
D.13-11-005 and D.15-05-007. 2. SCE’s preliminary statements require that the recorded entries be reviewed in SCE’s annual April ERRA
Review proceedings.

3
XII supports the 2016 operations of the Pole Loading and Deteriorated Pole Programs Balancing 1
Account. Chapter XIII supports the 2016 operations of the Demand Response Program Balancing 2
Account. As summarized in Table XI-11 of SCE-2, in this Application, SCE seeks to return to 3
customers the net over-collected balance of $3.605 million recorded in the Project Development 4
Division Memorandum Account, the Purchase Agreement Administrative Costs Balancing Account, and 5
the Renewables Portfolio Standard Costs Memorandum Account. In addition, SCE proposes to return to 6
customers $79.182 million in unspent, uncommitted funds from prior DR funding periods. 7
Therefore, SCE requests a net revenue requirement decrease of $83.748 million (including 8
franchise fees & uncollectibles expense) in 2018 rate levels upon a Commission finding in this 9
proceeding that the balances in the four accounts, shown in Table XI-11, are reasonable and 10
appropriately recorded in compliance with applicable Commission decisions and resolutions. 11
A. Organization of Testimony 12
Exhibits SCE-1 through SCE-4 are organized as follows: 13
SCE-1 14
Chapter I – Introduction 15
Chapter II – Least-Cost Dispatch 16
Chapter III – Hydroelectric Generation 17
Chapter IV – Natural Gas Generation 18
Chapter V – Other Generation 19
Chapter VI – Nuclear Generation and Fuel 20
Chapter VII – Contract Administration and Costs 21
SCE-2 22
Chapter VIII – Natural Gas Procurement 23
Continued from the previous page 3 See Table XI-12, lines 7-20 for a list of these accounts. SCE’s preliminary statements require that these
accounts be reviewed in SCE’s annual April ERRA Review proceeding.

4
Chapter IX – Inventory and GHG Carrying Cost Rates, Collateral Costs, Security and 1
Performance Assurance 2
Chapter X – California Independent System Operator (CAISO) - Related Costs 3
Chapter XI – Operation of Ratemaking Accounts 4
Chapter XII – Pole Loading and Deteriorated Pole Programs Balancing Account 5
Chapter XIII – Audits 6
Chapter XIV – Compliance Requirements 7
SCE-3 8
Witness Qualifications and Confidentiality Declarations 9
SCE-4 10
Appendices for SCE-1 and SCE-2.4 11
B. Comparison Between the Forecast and Recorded Fuel and Purchased Power Revenue 12
Requirement 13
In SCE’s ERRA review proceeding for Record Year 2013, SCE responded to a request from 14
Commissioner Florio at the Commission’s Least-Cost Dispatch workshop for SCE in A.11-04-001, held 15
on February 25, 2014. The request was for SCE to provide a table that documented the difference 16
between its 2013 forecast ERRA-related costs, and SCE’s actual, recorded 2013 ERRA-related costs. 17
SCE provided this information in its last two ERRA Review proceedings. This reconciliation is now 18
included in all ERRA Review applications going forward. This data is being provided for informational 19
purposes only, and is not relevant to any reasonableness or compliance review of SCE’s actual recorded 20
costs. The corresponding table for 2016 is provided in Table I-1 below. 21
4 SCE-4 includes a table of acronyms used throughout testimony in SCE-01 and SCE-02.

5
Table I-1 2016 Forecast & Recorded Fuel and Purchased Power Revenue Requirement
($000)
A.15-05-007November
UpdateLine 2016 2016No. Forecast Recorded Variance Variance % Variance Explanation
1. Fuel
2. Palo Verde - Nuclear 10,764 28.29%
One-time correction of costs associated with Unit 1 Cycle 16. An additional $8.1 million was included in nuclear fuel expense for the 2016 record period.
3. Diesel 7,196 4,901 (2,295) -31.90% NA4. Propane 257 117 (141) -54.66% NA5. Peakers/Fuel Cell 2,961 165.06% NA
6. Mountainview (14,327) -11.91%
Gas price lower than forecast causing low fuel related costs. Mountainview dispatched lower on some months than forecast due to lower Implied Market Heat Rate compared to forecast.
7. Four Corners Surtax Settlement 698 0.00% NA8. Fuel Inventory Carrying Cost (585) -44.84% NA9. Subtotal Fuel 168,857 165,933 (2,924) -1.73%
10. Purchased Power
11. CHP and Renewables 66,263 3.18%Increase in renewable generation compared to forecast. Wind and Solar produced more energy than forecast.
12. Interutility (11,048) -129.91%Difference in costs due to indifferences in Metropolitan Water District (MWD) load.
13. Demand Response - 184 184 0.00% NA14. Tolling Contracts Energy & RA Costs (RFOs) 469,793 484,191 14,398 3.06% NA15. Direct and Tolling Contract GHG Costs 89,677 95,513 5,836 6.51% NA
16. ISO & Short Term Market Activity Costs 1,315,912 1,153,414 (162,498) -12.35%
1. Energy price lower than forecast causing lower costs from open market procurement. 2. Increased Hydro generation than forecast.
17. Power & Gas Hedging 54,682 -100223.92% Costs incurred due to hedging during 2016.18. Gas Transportation and Storage (1,751) -71.50% NA19. Green Rate Program (7,832) -98.41% Costs are low due to lower subscription than forecast.20. Collateral Fees (ERRA) (1,774) -35.46% NA21. LADWP Returned Energy 4,091 4,091 0.00% NA22. Independent Evaluator Cost - 489 489 0.00% Non-forecasted items.23. Lower Colorado Species - 173 173 0.00% NA24. Mountainview Incentive - (351) (351) 0.00% NA25. Subtotal Purchased Power 3,980,608 3,941,470 (39,138) -0.98%
26. Total - Generation Service (Fuel & PP) (Lines 9 +25) 4,149,465 4,107,403 (42,062) -1.01%
27. Delivery Service
28. New Gen RFO Capacity (13,234) -3.12%
Cost Allocation Mechanism (CAM) contracts had higher revenue than forecast due to Joint Party Proposal (JPP) methodology.
29. CHP Settlement 31,263 70.69%Market prices were lower than forecast causing higher allocation of costs.
30. CAM-Related Peakers (20,061) 3647.43% Higher revenue due to JPP methodology.31. Total - Delivery Service 467,555 465,524 (2,031) -0.43%
32. TOTAL F&PP (Lines 26 +31) 4,617,020 4,572,927 (44,093) -0.96%
33. FF&U & Municipal Surcharge 55,567 55,071 (495) -0.89%34. Total F&PP Revenue Requirement 4,672,587 4,627,999 (44,588) -0.95%
Component

6
C. Disallowance Cap 1
In compliance with D.15-11-011, SCE is required to set forth the calculation of the Standard of 2
Conduct 4 (SOC 4) disallowance cap in its ERRA Review applications, and to provide a breakdown of 3
the disallowance cap administrative expenses by procurement functional category. 4
Pursuant to D.02-12-074, the maximum risk of potential disallowance is set at twice the annual 5
expenditures on administrative expenses for all procurement activities, as established in a General Rate 6
Case (GRC). The 2016 administrative expenses for procurement activities that the Commission 7
approved in SCE’s 2015 GRC (D.15-11-021) is $36.586 million.5 Therefore, the maximum potential 8
disallowance for SOC 4-related violation(s) is twice $36.586 million, for a total of $73.172 million, in 9
the 2016 Record Period.6 10
Table I-2 below shows the maximum potential disallowance for SOC 4-related violations by 11
procurement function in the 2016 Record Period. 12
5 Advice Letter 3314-E, implemented a CPUC-authorized GRC revenue requirement for 2016 consistent with
D.15-11-021. 6 Cf. D.03-06-067.

7
Table I-2 Standard of Conduct (SOC) 4 Disallowance Cap
($000)
D. Safety 1
D.16-01-017 approved an amendment to Rule 2.1(c) of the Commission’s Rules of Practice and 2
Procedure (Title 20, Division 1, of the California Code of Regulations) to require all applications to 3
identify all relevant safety considerations implicated by the application. One of SCE’s core values is to 4
assure public and employee safety. As such, the dispatch of generation, whether SCE-owned, contracted 5
through Power Purchase Agreements, or purchased through CAISO or other power exchanges, 6
inherently assumes that all power providers are fully compliant with laws, rules, regulations and 7
internally-managed controls to assure that their generating facilities are operated and maintained in a 8
safe working condition. Likewise, SCE’s purchasing decisions regarding fuel, and SCE's management 9
of air emissions costs (i.e., Greenhouse Gas Cap and Trade costs and other similar costs), and 10
transmission capacity procurement activities, also assume the counter-parties to these transactions are 11
fully compliant with laws, rules, regulations and internally-managed controls to assure that their 12
facilities are operated and maintained in a safe working condition. 13
8
The safety performance of the counter-parties involved (once contracted) is not directly related 1
to SCE's activities at issue in this proceeding, which include sales and purchases of power, fuel, 2
transmission capacity and air emissions credits and allowances. Nevertheless, these activities do support 3
public and employee safety, as these transactions are an inherent part of assuring a reliable supply of 4
electricity to SCE customers. Costs incurred by SCE to operate and maintain the SCE office and public 5
spaces, shops, warehouses, transmission, distribution, and power plants in a safe condition are reviewed 6
in SCE's GRC Application. In addition, per D.14-12-025, SCE filed a Safety Model Assessment 7
Proceeding (SMAP) Application “to provide Commission staff and other parties with the opportunity to 8
analyze and understand the various models and methodologies that the energy utilities will be using to 9
prioritize safety in their GRC proceedings. This prioritization of safety is to be achieved through the use 10
of models and methodologies to assess the energy utility’s risk, and the mitigation measures the energy 11
utility plans to take to reduce and minimize such risks.”712
7 D.14-12-025, p. 24.

9
II. 1
LEAST-COST DISPATCH 2
A. Introduction and Commission Standard Review 3
In this chapter, SCE discusses its compliance with least-cost dispatch (LCD) principles and 4
requirements as specified by applicable Commission orders. The fundamental design of the California 5
Independent System Operator’s (CAISO) Market Redesign and Technology Upgrade (MRTU) 6
environment impacts how SCE “achieves” LCD. In D.11-10-002 (on SCE’s 2009 Record Period ERRA 7
compliance proceeding) the Commission acknowledged this, stating “[o]n April 1, 2009, the CAISO 8
began implementation of [MRTU], which substantially changed the least-cost dispatch processes of SCE 9
and other utilities.”8 More recent Commission guidance defines how SCE must demonstrate that it 10
adhered to LCD principles, and the Commission formalized that guidance in D.15-05-007. 11
1. Information in SCE’s Testimony and Workpapers 12
SCE’s testimony and workpapers provide detailed documentation for the Record Period, 13
as required by D.15-05-007. The testimony includes information on: 14
Overview/narrative of LCD in the CAISO markets. 15
Description of the SCE’s bidding and scheduling processes. 16
Summary reports/tables documenting dispatchable thermal resource aggregated 17
annual exception rates for: 18
o Incremental cost bid calculations 19
o Self-commitment decisions 20
o Master File data changes 21
Narratives reviewing significant strategy changes, internal software and/or process 22
changes, and CAISO market design changes during the Record Period, including 23
documentation of SCE’s review of market changes. 24
8 D.11-10-002, Finding of Fact 1.

10
Background summary tables including: 1
o Total capacity of the dispatchable portfolio 2
o Total dispatchable capacity lost due to planned or forced outages 3
o Total capacity of the non-dispatchable portfolio 4
o Total non-dispatchable capacity lost due to planned or forced outages 5
o Total energy awards (dispatchable and non-dispatchable) by resource type (e.g., 6
hydro, pumped storage, thermal) broken down by self-scheduled versus market 7
awards 8
Spot market electric and natural gas transactions made by SCE. 9
SCE’s workpapers provide other information required by the relevant decisions and fully 10
document all key LCD-related activities as well as spot market transactions SCE made during the 11
Record Period.9 Close examination of SCE’s LCD practices, or of any particular decision or energy 12
transaction made during the Record Period, will confirm that SCE has followed SOC 4 and its LCD 13
protocols (keeping in mind that any ex post analysis must appropriately consider the contemporaneous 14
information SCE had when making ex ante LCD decisions). 15
2. The Commission’s LCD Standard 16
In D.02-12-074, which was issued pre-MRTU, the Commission placed the following 17
explanation of SOC 4 in the utilities’ approved procurement plans: 18
Prudent contract administration includes administration of all contracts within the 19 terms and conditions of those contracts, to include dispatching dispatchable 20 contracts when it is most economical to do so. In administering contracts, the 21 utilities have the responsibility to dispose of economic long power and to 22 purchase economic short power in a manner that minimizes ratepayer costs. 23 Least-cost dispatch refers to a situation in which the most cost-effective mix of 24 total resources is used, thereby minimizing the cost of delivering electric services. 25 . . . The utility bears the burden of proving compliance with the standard set forth 26 in its plan.10 27
9 Dispatchable resource commitment and dispatch decisions are largely made by the CAISO, not SCE, although
these decisions are based on the bids SCE submits to the CAISO. 10 D.02-12-074, Ordering Paragraph (OP) 24b. The ellipsis indicates language deleted by D.03-06-076, p. 27
and OP 16.
11
In D.05-01-054, also issued pre-MRTU, the Commission affirmed that in conducting the 1
daily economic dispatch of energy, utilities must comply with Standard of Conduct No. 4 (SOC 4), 2
which states: 3
The utilities shall prudently administer all contracts and generation resources and 4 dispatch the energy in a least-cost manner. Our definitions of prudent contract 5 administration and least-cost dispatch are the same as our existing standard.11 6
According to the Commission, once this definition of SOC 4 was placed in the utilities’ 7
procurement plans, it became the “upfront standard” under AB 57 regarding prudent contract 8
administration and the daily dispatch of energy. As a result, the question to be addressed in the ERRA 9
proceeding regarding LCD is whether the utility has complied with this standard – that is: (1) whether 10
the utility has dispatched12 the dispatchable contracts and Utility-Owned Generation (UOG) under its 11
control “when it is most economical to do so;” (2) whether it has “disposed of economic long power and 12
purchased economic short power in a manner that minimizes customer costs;” and (3) whether it has 13
used “the most cost-effective mix of its total resources, thereby minimizing the cost of delivering 14
electrical services.” 15
Based on past Commission guidance and the application of basic economic principles, 16
SCE bases its compliance with the LCD standard set forth in SOC 4 on the following operating 17
objectives: (1) a dispatchable resource should run only when its variable costs can be expected to be 18
recovered from the market; (2) SCE bids its dispatchable resources at their marginal cost (or, when 19
applicable, opportunity cost), then CAISO commits and dispatches the resources through its market co-20
optimization mechanism;13 (3) SCE purchases power bilaterally when it anticipates doing so will reduce 21
11 D.02-10-062, Conclusion of Law 11. 12 In this context, “SCE’s dispatch” of dispatchable resources is submitting cost-based bids to the CAISO
market, with the CAISO making resource commitment and dispatch decisions based on the bids all market participants submit for their respective resources. SCE complies with SOC 4 by appropriately executing processes under its control (e.g., bidding its resources correctly), thus enabling the CAISO to commit the resources in a least-cost manner.
13 The CAISO’s market co-optimization process includes a full network model that also reflects transmission loss and congestion costs, producing locational prices at thousands of points across the system.

12
price risk and result in a lower cost than purchasing from the CAISO market; and (4) SCE sells surplus 1
power in a manner that reduces customer costs.14 For the first objective, it should be understood that the 2
CAISO will frequently force-commit certain resources out of economic order, solely for grid reliability 3
reasons (e.g., to provide voltage support, to ameliorate transmission congestion, etc.). For the second 4
objective, Resource Adequacy (RA) resources must be presented to the market in order for SCE to 5
comply with the Commission’s reliability requirements. For discretionary resource bidding, SCE 6
employed a strategy (discussed below) to address the cost-minimization objective set forth in SOC 4. 7
This strategy was implemented through the actions of personnel in SCE’s Energy Procurement and 8
Management (EPM) organization, including the Trading & Market Operations (TMO) and Portfolio 9
Planning & Analysis (PPA) departments. In the sections below, SCE explains how its procurement 10
processes and activities aligned with these LCD principles. 11
B. Overview of LCD in the CAISO Wholesale Market 12
The CAISO operates a market environment in which it determines the resource mix that will be 13
utilized to serve each day’s demand, based on supply and demand bids that all market participants 14
(including SCE) submit. Below is a summary of SCE’s LCD-related activities in the 2016 CAISO 15
market: 16
1. Supply and Demand Bidding/Scheduling 17
During the Record Period SCE, as a CAISO Scheduling Coordinator (SC), submitted bids 18
and schedules for its available generator capacity and interchange schedules to the CAISO for 19
commitment and dispatch evaluation in the day-ahead Integrated Forward Market (IFM) and Real-Time 20
Market (RTM). SCE also submitted ancillary services (AS) bids to the CAISO markets, in which the 21
CAISO’s market optimization mechanism determines how to utilize resources for energy, for AS, a 22
combination of both, or neither if the resources are not economic relative to other resources. This 23
process is referred to as “co-optimization,” and results in more efficient commitment and dispatch of 24
14 Power purchases and/or sales can be through the bilateral or CAISO markets.

13
generating resources across the CAISO-controlled grid. SCE also submitted bids for its forecast 1
bundled service customer demand to the CAISO, to acquire energy in the IFM. 2
2. Spot Market Electrical and Natural Gas Transactions 3
SCE used market15 energy transactions, when appropriate, to manage its forecast residual 4
net short (RNS) and residual net long (RNL) CAISO16 energy positions prior to the CAISO IFM. SCE 5
also managed, when appropriate, its post-IFM residual net position (RNP) that developed because of 6
changing supply availability or load forecast changes through the hour-ahead power market and/or the 7
CAISO RTM. SCE also made physical natural gas transactions based on its forecast of the CAISO IFM 8
results and exceptional dispatch (ED) activity. 9
C. LCD Principles During The Record Period 10
During the Record Period, SCE complied with SOC 4 by concurrently managing all its resources 11
– including contracts under its control – and engaging in spot market transactions in a manner designed 12
to reduce price risk and minimize costs to its bundled service customers. In making decisions regarding 13
its supply and demand bidding, scheduling, power trading and natural gas trading, SCE sought to 14
balance the following goals: 15
Minimize the cost of energy to SCE’s customers. 16
Maximize reliability for each operating day by adhering to the Commission’s RA 17
requirements. 18
Reduce SCE’s hourly RNP prior to real-time, when appropriate. 19
15 In this context, “market” refers to electrical energy transactions executed outside of the CAISO’s IFM and
includes transactions executed directly (bilaterally) with counterparties, through voice or electronic brokers (e.g., ICE Brokerage) and through exchanges (e.g., ICE Clear). Trading generally takes place between 5 a.m. and 7 a.m. PPT, Monday through Friday, excluding holidays.
16 SCE managed the electrical energy positions outside of the CAISO from SCE’s ownership share of the Palo Verde Nuclear Generating Station and through other renewable and non-renewable contracts. These energy positions are managed to minimize SCE customer costs, and may include scheduling and selling the energy outside of the CAISO system and markets.

14
Submit economic bids and schedules to the CAISO and other control areas in accordance 1
with the applicable area timelines and reliability protocols. 2
Mitigate financial credit risk by ensuring that counterparties meet certain credit criteria. 3
D. Implementing the LCD Standard 4
In implementing the LCD standard, SCE evaluates the economics of its dispatchable resource 5
portfolio before submitting bids and schedules to the CAISO. These resources include UOG and utility-6
contracted resources, as well as spot market transactions in the day-ahead, hour-ahead, and real-time 7
markets.17 8
1. SCE’s Bidding Strategy 9
In the CAISO environment, market participants (including SCE) submit bids to offer 10
energy and AS from resources available to the grid (supply bids), and to acquire energy from the grid to 11
serve customer load (demand bids). 12
13
SCE’s strategy guided its supply and demand bidding activities during the Record Period, and is 14
described in more detail below. 15
a) Supply Bidding Strategy 16
SCE’s supply bidding strategy is designed to make all dispatchable resources 17
available to the CAISO at 18
19
20
21
22
17 As the Commission explained: “It is true that the existing scope of SOC 4 does not encompass all
procurement activities. Specifically, ERRA filings review the reasonableness of contract administration and least-cost dispatch. . . . On the other hand, forward purchase and sale transactions done months prior to the time of dispatch are considered procurement activities and as such, should be reviewed in the quarterly compliance Advice Letter filings.” D.05-01-054 at p. 9.

15
1
.18 2
Prior to the month (in its month-ahead RA showing), SCE designates sufficient 3
RA resources to meet Commission and CAISO requirements for load-serving entities (RA capacity at 4
least equal to 115% of SCE’s forecast monthly peak load). 5
For dispatchable resources, SCE’s bid prices are based on 6
7
8
9
During the Record Period, 10
11
12
13
14
15
. 16
b) Opportunity Cost Bidding 17
18
19
20
21
22
23
24
18 Uplift charges are based in part on the portion of a market participant’s demand that is served by energy
supplied through the CAISO market (i.e., not served by self-scheduled supply).

16
1
2
3
4
5
. 6
c) Dispatch Efficiency Bidding 7
. 8
9
10
11
12
13
14
15
16
d) Import Bidding 17
18
. Import bids are grouped into the three categories discussed below. 19
(1) Must-Take Hedged Imports 20
21
22
(2) Other Hedged Imports 23
24
25
26
27

17
In circumstances when market 1
prices were below negative $150/MWh, which are indicative of administrative curtailments, 2
3
4
. 5
(3) Unhedged Imports 6
7
8
. 9
e) Demand Bidding Strategy 10
In the CAISO market environment, SCE must submit hourly bids (price and 11
quantity) to obtain the power needed to serve SCE’s forecast bundled customer demand. 12
13
. 14
, 15
16
17
18
19
(1) Bidding Response to High Price Movements 20
21
22
23
24
25
26
. 27

18
(2) Bidding Response to Low Price Movement 1
2
. 3
4
5
6
f) Demand Response Bidding Strategy 7
SCE’s economically-triggered Demand Response (DR) resources 8
Proxy Demand Resources (PDR) are bid into the CAISO 9
IFM, and Reliability Demand Response Resources (RDRR) are bid into the CAISO IFM and/or RTM. 10
2. Daily LCD Process 11
SCE implements the guiding principles described above in its daily operations. LCD-12
related processes are primarily based on load and resource forecasts, as well as forecast and actual 13
power and gas prices. These forecasts are documented in the daily resource plans, and are in part based 14
on continuous monitoring of market conditions. The daily forecasting and resource planning process for 15
each operating day requires close coordination between the various EPM and PPA departments. 16
For each day of the Record Period, SCE prepared and utilized the daily resource plans to, 17
among other things, identify the mix of available resources in the SCE portfolio, document SCE’s 18
forecast of CAISO IFM results, and estimate SCE’s hourly RNP. The following discussion summarizes 19
the processes and actions that were employed by SCE personnel during the Record Period to prepare 20
robust daily resource plans. 21
PPA’s Demand Forecasters developed hourly load forecasts for each operating day for 22
use in creating the daily resource plan. Such load forecasts incorporated short-term weather forecasts 23
prepared by Demand Forecasting’s meteorologists, in addition to weather forecasts obtained from other 24
meteorological forecasting services. 25
PPA’s Price Forecasters developed wholesale power price projections using data gathered 26
from multiple sources. These hourly price forecasts were an important element in SCE’s daily resource 27

19
plans because they guided TMO personnel in formulating their CAISO IFM results and SCE RNP 1
forecasts, for use in power and gas trading activities. 2
TMO personnel integrated the load forecast, short-term price forecast and projected 3
resource availability in their planning models to prepare daily resource plans. Each plan contained the 4
following key elements: 5
Projected hourly availability of SCE’s non-dispatchable resources. 6
Projected hourly availability of SCE’s dispatchable resources. 7
Forecast hourly electricity prices in southern California.19 8
Forecast natural gas prices delivered to key California locations. 9
Projected economic dispatch of SCE’s dispatchable resources. 10
Exceptions to marginal cost bidding for SCE’s dispatchable resources. 11
Energy transactions executed prior to day-ahead trading. 12
Forecast hourly demand (load). 13
Projected hourly RNP. 14
Projected gas requirements at each generating facility for which SCE had 15
procurement responsibility. 16
3. SCE Managed Its Resources in Compliance with SOC 4 17
As evidenced by the documentation provided herein and in SCE’s workpapers, SCE’s 18
market processes and actions throughout the Record Period enabled the CAISO to commit and dispatch 19
SCE’s resource portfolio in an economic manner, as described in SOC 4 and relevant Commission 20
decisions interpreting SOC 4. 21
19 At the SP-15 EZ Gen Hub, SCE’s Load Aggregation Point (LAP) and at the Locational Marginal Pricing
(LMP) nodes with dispatchable generation from SCE’s portfolio.
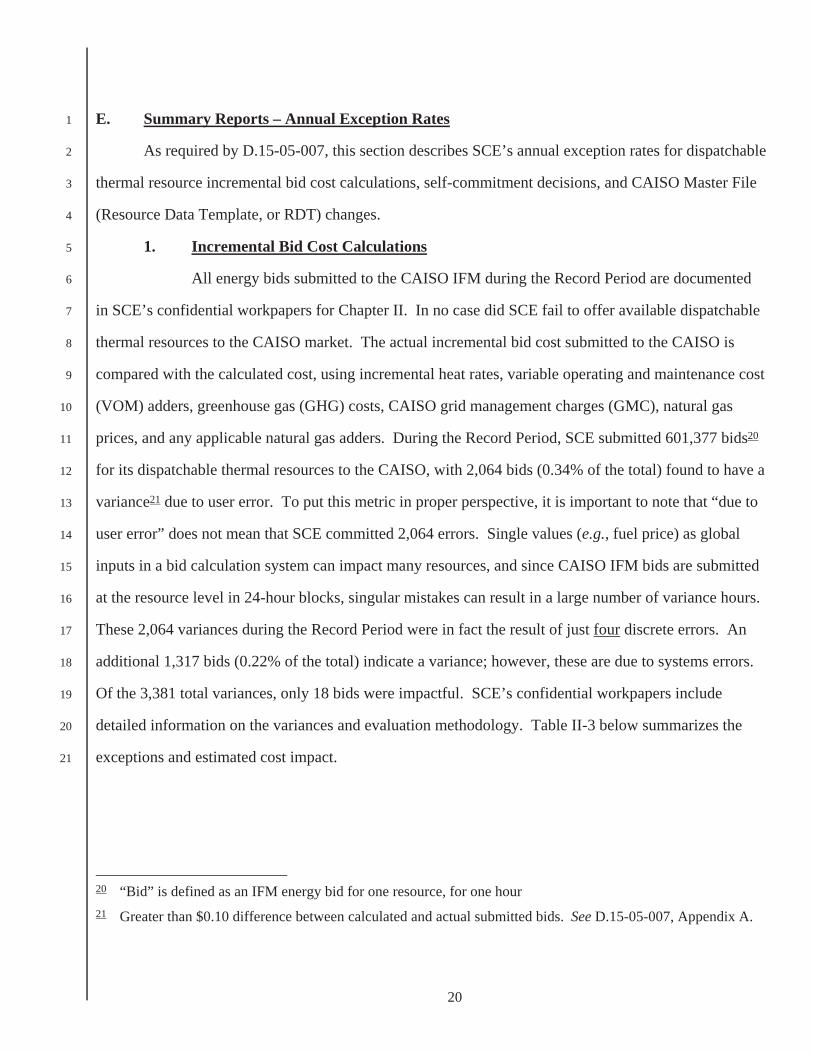
20
E. Summary Reports – Annual Exception Rates 1
As required by D.15-05-007, this section describes SCE’s annual exception rates for dispatchable 2
thermal resource incremental bid cost calculations, self-commitment decisions, and CAISO Master File 3
(Resource Data Template, or RDT) changes. 4
1. Incremental Bid Cost Calculations 5
All energy bids submitted to the CAISO IFM during the Record Period are documented 6
in SCE’s confidential workpapers for Chapter II. In no case did SCE fail to offer available dispatchable 7
thermal resources to the CAISO market. The actual incremental bid cost submitted to the CAISO is 8
compared with the calculated cost, using incremental heat rates, variable operating and maintenance cost 9
(VOM) adders, greenhouse gas (GHG) costs, CAISO grid management charges (GMC), natural gas 10
prices, and any applicable natural gas adders. During the Record Period, SCE submitted 601,377 bids20 11
for its dispatchable thermal resources to the CAISO, with 2,064 bids (0.34% of the total) found to have a 12
variance21 due to user error. To put this metric in proper perspective, it is important to note that “due to 13
user error” does not mean that SCE committed 2,064 errors. Single values (e.g., fuel price) as global 14
inputs in a bid calculation system can impact many resources, and since CAISO IFM bids are submitted 15
at the resource level in 24-hour blocks, singular mistakes can result in a large number of variance hours. 16
These 2,064 variances during the Record Period were in fact the result of just four discrete errors. An 17
additional 1,317 bids (0.22% of the total) indicate a variance; however, these are due to systems errors. 18
Of the 3,381 total variances, only 18 bids were impactful. SCE’s confidential workpapers include 19
detailed information on the variances and evaluation methodology. Table II-3 below summarizes the 20
exceptions and estimated cost impact. 21
20 “Bid” is defined as an IFM energy bid for one resource, for one hour 21 Greater than $0.10 difference between calculated and actual submitted bids. See D.15-05-007, Appendix A.

21
Table II-3 Summary of 2016 Thermal Resource Incremental Bid Cost Exceptions
2. Self-Commitment Exceptions 1
During the Record Period, 2
3
4
3. Master File (RDT) Change Exceptions 5
During the Record Period, SCE made 421 Master File (RDT) submissions to declare 6
startup (SU) and minimum load (ML) costs for its dispatchable use-limited thermal resources, with 16 of 7
these changes (3.8% of the total) found to include exceptions, all of which were related to the Registered 8
cost cap calculation. The CAISO tariff provides two methodologies – “Proxy” or “Registered” – to 9
declare resource SU/ML costs: 10
Proxy cost option: The SU and/or ML costs are automatically calculated each day 11
based on pre-defined fuel quantities for each, multiplied by an indexed gas price plus 12
a variable operations and maintenance (VOM) adder.22 The costs thus reflect any 13
daily natural gas price variations, and certain additional non fuel-based (i.e., 14
22 Electing the Proxy cost option also allows Market Participants to submit daily SU and/or ML cost bids, to the
extent they are lower than the resulting CAISO-calculated costs.
Description Variances >$0.10 (Hours)
% Of Bid Hours
Resources Not Bid (Hours)
Est. Cost Impact
External System Error 237 0.04% 0 $ - SCE System Error 1,080 0.18% 0 $ -
User Error 2,064 0.34% 0 $ 3,340
Totals 3,381 0.56% 0 3,340$

22
“fixed”23) SU cost components can also be included with CAISO approval; however, 1
this option does not account for opportunity cost. 2
Registered cost option: The SU and/or ML costs are pre-defined as static dollar 3
amounts for the election period.24 This option does not reflect the daily natural gas 4
price changes, but allows other non-fuel based (e.g., contractual) costs to be included 5
(within certain limits). However, the declared SU and ML costs cannot exceed 150% 6
of the calculated Proxy cost for each. The CAISO tariff allows this option only for 7
use-limited resources. During the Record Period, 8
9
This 10
benefitted customers by more effectively enabling the CAISO to dispatch the 11
resources in a least-cost manner. 12
In calculating Registered cost values applicable for the first several weeks of the Record 13
Period, SCE misapplied the CAISO cost cap calculation formula for several of its resources and, in some 14
cases, slightly understated the resource costs. SCE originally discovered the error in early 2016, while 15
preparing its Record Period 2015 ERRA Review and fully disclosed it in that proceeding25; however, by 16
that time the Registered costs applicable through early February 2016 could not be changed. SCE 17
submitted correct values to CAISO for February 5, 2016 and beyond. SCE’s confidential workpapers 18
include detailed information on the evaluation methodology. Table II-4 below summarizes the 19
exceptions and estimated cost impact. 20
23 “Fixed” SU cost is a static component that does not vary with fuel price changes, but applies only when (and
every time) the resource is started. As such, it is truly a variable operating cost, as it would not be incurred but for running the resource.
24 The CAISO tariff allows SU and ML cost updates every 30 days. Elections and defined values carry forward until changed.
25 See A.16-04-001, Vol. SCE-01C, pp. 20-22.

23
Table II-4 Summary of 2016 Proxy and Registered Cost Change Exceptions
4. El Segundo Startup Cost Exceptions 1
El Segundo Units 5/6 and 7/8 joined SCE’s portfolio as contract resources on December 2
1, 2016 with SCE also assuming CAISO SC responsibilities. Both resources are essentially identical, 3
with similar characteristics, output, heat rates and other costs. They are also defined as CAISO Multi-4
Stage Generation (MSG) resources, with three possible physical configurations each.26 5
While preparing its internal bid calculation systems, SCE inadvertently entered an 6
incorrect SU cost calculation parameter for one MSG configuration of both resources. This resulted in 7
8
. SCE discovered the issue in 9
January 2017 during a routine data review and immediately corrected it. The associated data input 10
process has been strengthened to include parameter reviews by multiple employees, and improved 11
communications among staff. 12
Though not Master File-related, this is a commitment cost exception, thus SCE used the 13
same methodology to calculate the resulting impacts as for the Master File change exceptions. SCE’s 14
confidential workpapers include detailed information on the exceptions and evaluation methodology. 15
Table II-5 below summarizes the exceptions and estimated cost impact. 16
26 CAISO’s MSG mechanism allows it to more accurately model resources with multiple possible physical
configurations. Market participants can define the operating parameters and costs for each configuration, and time/costs of transitioning between configurations.
Category Proxy Elections
Registered Elections
Incorrect Submissions
Error Rate Est. Cost Est. Gain Net Cost Impact
Startup 15 192 8 3.86% $ 2,424 $ - 2,424$ Min. Load 36 178 8 3.74% $ 26,302 $ - 26,302$
Totals 51 370 16 3.80% $ 28,726 $ - 28,726$

24
Table II-5 December 2016 El Segundo Startup Cost Exceptions
F. Market and Business Process Changes 1
On June 2, 2016, the CAISO implemented a market change to address intra-day gas price 2
volatility related to the Aliso Canyon natural gas storage facility limitation. Market Participants were 3
allowed to submit revised SU/ML cost bids post-IFM, for resources not committed in the IFM. No 4
change was required for SCE’s market systems and daily processes. SCE did, however, strengthen its 5
process to ensure that any gas supply issues (particularly Aliso Canyon-related events) are properly 6
addressed and SCE’s resource bids reflect appropriate costs.27 This also includes ongoing, proactive 7
communications and coordination with CAISO and SoCalGas personnel. 8
On November 1, 2016, the CAISO implemented three market initiatives, none of which required 9
changes to SCE’s market systems. SCE’s approach to the initiatives was focused on the viability of 10
market results and settlements data, participation in the CAISO stakeholder processes, market 11
simulations and implementing applicable changes to the daily business processes. 12
1. Flexible Ramping Product 13
The Flexible Ramping Product (FRP) initiative allows CAISO to procure resource 14
ramping attributes as a market product. This enhancement is intended to help CAISO offset the 15
increasing and variable effects of intermittent resources by procuring ramping capacity to pre-defined 16
27 Impacts of such events could include gas penalty cost adders, reflecting the risk and potential cost of gas use
beyond the contemporary SoCalGas-defined tolerances.
Resource SU Cost Bid (Avg)
SU Cost Actual (Avg)
SU Cost Delta (Avg)
Est. Cost Impact
ELSEGN_2_UN1011 76,487$
ELSEGN_2_UN2021 82,290$
Total N/A N/A N/A 158,777$
25
regional target levels, with dynamic market pricing (i.e., reflective of need). Previously, this was 1
embedded in the CAISO’s market engine as a simple constraint with static pricing. 2
2. Resource Adequacy Availability Incentive Mechanism 3
The Resource Adequacy Availability Incentive Mechanism (RAAIM) makes the flexible 4
(dispatchable) RA attributes of a Market Participant’s supply plan financially binding. CAISO can 5
assess additional charges to resources that limit flexibility (e.g., by self-scheduling) in the CAISO 6
markets. This replaces the Standard Capacity Product (SCP) mechanism, in which CAISO could only 7
assess charges to resources that were not available. 8
3. Capacity Procurement Mechanism Enhancement 9
The Capacity Procurement Mechanism (CPM) enhancement allows Market Participants 10
to submit monthly bids for remaining available non-RA generator capacity into the “backstop” RA 11
procurement mechanism. CAISO evaluates its requirements on an annual, monthly and intra-monthly 12
basis, and can procure additional capacity to address any emergent shortfalls. Previously, Market 13
Participants were limited to annual CPM bid submissions. 14
4. LCD-Related Process Changes 15
Other than the previously described topics, SCE did not implement any significant LCD 16
process changes. 17
G. Background Summary Tables 18
Table II-6 below provides annual summary data for SCE’s resource portfolio broken down by 19
dispatchable and non-dispatchable resources; including capacity,28 unavailable capacity,29 day-ahead 20
self-schedules (SS) and day-ahead market awards. 21
28 “Capacity” is calculated as the aggregate of the applicable resources’ maximum capacity ratings multiplied by
the number of hours during the Record Period each resource was under SCE control. 29 “Unavailable capacity” is defined as zero availability (i.e., excludes partial de-rates) for the applicable
resources.

26
Table II-6 Background Summary of 2016 Resource Capacity and Awards
H. Demand Response Resources 1
During the Record Period, all of SCE’s economically triggered Demand Response (DR) 2
resources were available for CAISO market dispatch. This represents approximately 1,178 MW and 3
includes Proxy Demand Resources (PDR) and Reliability Demand Response Resources (RDRR).30 4
SCE’s confidential workpapers include detailed information on program parameters, dispatch,31 5
opportunity cost methodology (when applicable), dispatch exceptions and estimated cost impacts. 6
In addition, D.16-10-028, which settled SCE’s Record Period 2014 ERRA Review proceeding, 7
contemplates (in part) potential refinements to the existing DR LCD metrics and directs the Settling 8
Parties (SCE and ORA) to conduct discussions on the topic.32 SCE and ORA are taking steps to arrange 9 30 PDR includes customers in the Capacity Bidding Program (CBP) and Aggregator Managed Portfolio (AMP)
program. RDRR includes customers in the Base Interruptible Program (BIP), Agricultural Pumping Interruptibles (API) and Summer Discount Plan (SDP).
31 RDRR includes provisions for SCE’s Grid Control Center to issue reliability-based dispatches, which are considered outside the scope of LCD and thus not included in this discussion.
32 See D.16-10-028, Section 3.1, p. 8.
Dispatchable Capacity (MWh) Unavailable Capacity (MWh)
DA SS Awards (MWh)
DA Market Awards (MWh)
Thermal 78,121,078Hydro 12,015,107
Pump Storage 1,756,800
Totals 91,892,985
Non-Dispatchable Capacity (MWh) Unavailable Capacity (MWh)
DA SS Awards (MWh)
DA Market Awards (MWh)
Other 16,348,827Renewable 53,922,271
Nuclear 5,577,840Hydro 1,368,567
Totals 77,217,505

27
such discussions; however, SCE also believes any changes to LCD metrics should be addressed only in 1
the context of a joint effort with ORA and all three IOUs in a Rulemaking or other appropriate 2
procedural forum (such as a petition for modification). 3
I. SCE’s Market Purchase and Sales 4
The CAISO determines which resources will be dispatched and ensures that physical supply and 5
demand is matched (cleared) through its market operations. Consequently, the focus of SCE’s trading 6
activity is to manage financial risk associated with SCE’s RNP. Transactions can be for physical or 7
financial products; both serve to hedge against the unknown IFM price at the time of the trade. 8
The clearing process that takes place in the IFM, where the difference between a market 9
participant’s awarded supply and demand (i.e., the RNP) is cleared at the IFM price, effectively meets 10
SCE’s IFM RNP. 11
However, during the Record Period SCE continued to participate in the non-CAISO market 12
(trading physical and financial electricity products) in order to diversify its exposure. For example, 13
14
15
Furthermore, SCE is still required to manage open positions outside the CAISO 16
system with physical electricity transactions. 17
As the CAISO IFM will usually clear all of SCE’s RNP, SCE’s Power Traders do not have the 18
objective of reducing the CAISO-delivered RNP to (or near) zero; rather, the objective is price-risk 19
mitigation. For example, 20
21
22
23
24
25

28
1. Day-Ahead Transaction Summary 1
Table II-7 below summarizes SCE’s Record Period day-ahead purchases and sales. The 2
majority (98%) of the day-ahead transactions (i.e., number of trades) shown in Table II-7 were standard 3
on-peak and off-peak products. However, as discussed above, in its price-risk minimization efforts SCE 4
also relied on the IFM to transact energy in order to manage the RNP. 5
Table II-7 Summary of 2016 Day-Ahead Spot Electric Transactions
(Physical and Financial)
Deal Type Energy (GWh)
No. of Deals
Broker/Exchange PurchasesStandard On-Peak 1,009 1,139Standard Off-Peak 526 867Other Non-Standard Products 41 39 Subtotal Broker/Exchange 1,575 2,045
Bilateral PurchasesStandard On-Peak 218 161Standard Off-Peak 169 115Other Non-Standard Products 5 5 Subtotal Bilateral 391 281
Total Purchased 1,966 2,326
Broker/Exchange SalesStandard On-Peak 10 16Standard Off-Peak 0 0Other Non-Standard Products 0 0 Subtotal Broker/Exchange 10 16
Bilateral SalesStandard On-Peak 3 4Standard Off-Peak 1 2Other Non-Standard Products 1 3 Subtotal Bilateral 5 9
Total Sold 14 25
Total Broker/Exchange 1,585 2,061Total Bilateral 396 290
Total Transacted 1,981 2,351

29
2. SCE’s Day-Ahead Transactions Were Competitive and in Compliance with SOC4 1
As discussed above, SCE’s day-ahead purchase and sale transactions during the Record 2
Period were conducted via brokers/exchanges and bilateral processes in accordance with its LCD 3
transaction protocols and SCE’s Commission-approved procurement plan. Details of these transactions 4
are included in SCE’s confidential workpapers. 5
3. Criteria Utilized in Selecting the Volume to Buy and Sell in the Hour-Ahead Market 6
Moderating SCE’s potential exposure to the CAISO’s RTM was a consideration in SCE’s 7
determination of the energy quantities to potentially be transacted in the hour-ahead market. In addition, 8
the criteria previously discussed regarding day-ahead transactions also applied to SCE’s transaction 9
decisions in the hour-ahead market. 10
Unlike the day-ahead spot market, which usually has many potential credit-worthy 11
counterparties who trade standard and non-standard on-peak and off-peak products, the hour-ahead spot 12
market is usually far less liquid, with a low number of potential credit-worthy counterparties. 13
The IFM clears most open positions in the day-ahead timeframe down to the hourly level, 14
significantly reducing the amount of potential energy to transact in the hour-ahead markets. In general, 15
low liquidity associated with hour-ahead trading is due to the following reasons: 16
The IFM clearing most open positions for most market participants, prior to real-time. 17
Many non-load-serving market participants (e.g., banks and hedge funds, etc.) close 18
out their positions prior to the hour-ahead market. 19
The products transacted are for non-standard deliveries, typically for only up to a few 20
hours on a given day. 21
Given SCE’s estimated hour-ahead RNP is usually determined just a few hours 22
before, it is often difficult to find credit-worthy counterparties whose energy positions 23
can offset SCE’s energy positions. 24
SCE followed SOC 4 in its hour-ahead transacting during the Record Period by 25
appropriately reducing its RNP, when feasible, through competitively-priced sales or purchases. This 26

30
compliance can be confirmed by understanding the market conditions that existed at the time of a given 1
transaction and reviewing SCE’s daily resource plans.33 2
4. Hour-Ahead Transaction Summary 3
Table II-8 below is a summary of SCE’s hour-ahead purchases and sales during the 4
Record Period. The total volume of SCE’s hour-ahead spot transactions (7 GWh) was less than 1% of 5
the total volume of SCE’s day-ahead spot transactions (1,981 GWh). This is to be expected because the 6
day-ahead market is generally more liquid than the real-time market. 7
Table II-8 Summary of 2016 Hour-Ahead Spot Electric Transactions
(Physical and Financial)
5. SCE’s Hour-Ahead Transactions Were Competitive and in Compliance with SOC 4 8
SCE’s hour-ahead transactions during the Record Period were conducted in accordance 9
with its LCD transaction protocols. In the absence of reliable price indices for the hour-ahead market 10
(which, if available, would undoubtedly show a range of reported prices for each hour), SCE’s price 11
surveys are the best indicators SCE had available for hour-ahead market prices for the various products, 12
locations and market conditions. 13
33 SCE provides this information to the Commission through the Quarterly Compliance Report (QCR) process.
Deal Type Energy (GWh)
No. of Deals
Broker/Exchange Purchases 0 0Bilateral Purchases 0 3
Total Purchased 0 3
Broker/Exchange Sales 0 0Bilateral Sales 6 54
Total Sold 6 54
Total Broker/Exchange 0 0Total Bilateral 7 57
Total Transacted 7 57

31
6. Gas Procurement Supporting LCD 1
During the Record Period, SCE transacted, transported, stored, and hedged natural gas 2
supplies in conjunction with SCE gas agreements. Only the short-term (i.e., daily spot and intra-day) 3
gas transactions executed in support of dispatchable resources are reviewed in this ERRA Review 4
proceeding; SCE’s long-term transactions are reviewed in its quarterly compliance advice letter 5
submissions. 6
SCE’s overall objective in providing gas supplies under the agreements34 for which it was 7
responsible during the Record Period was to minimize costs, while ensuring operational reliability and 8
flexibility to respond to continuously-changing generation requirements of SCE’s resource portfolio, as 9
dictated by LCD requirements. 10
In order to cost-effectively manage SCE’s physical gas position, SCE’s Gas Traders 11
review the daily resource plan to determine the quantity of day-ahead gas needed to meet SCE’s gas 12
requirements. The Traders purchase the majority of the required gas volumes utilizing daily index call 13
options and baseload agreements. SCE typically sets up the daily index call options as term deals 14
(monthly) with the right to purchase gas up to the maximum volume on a daily basis, at a daily index 15
price. These daily index call options allow SCE to secure reliable supply on a day-ahead basis at the 16
daily index price. Because the forecasted day-ahead gas requirements must be purchased before the 17
CAISO’s daily IFM results are published, SCE utilizes the daily spot or intra-day gas markets to transact 18
gas volumes due to unexpected IFM results or intra-day generation schedule changes. 19
7. Gas Transaction Summary 20
Table II-9 below is a summary of the daily spot and intra-day gas transactions during the 21
Record Period. A portion of SCE’s gas purchases were daily index call options which were set up as 22
term deals; as such, their volumes are not included here. Please refer to Chapter VIII for additional 23
information regarding gas transactions. 24
34 Relevant information regarding gas agreements is discussed in Chapter VIII.

32
Table II-9 Summary of 2016 Spot Gas Transactions
8. SCE’s Spot Gas Transactions Were Competitive and in Compliance With SOC4 1
During the Record Period, all of SCE’s spot gas transactions were at prices competitive 2
with spot gas index prices published in recognized surveys. Accordingly, these transactions complied 3
with SOC 4. 4
J. SCE’s Spot Electric and Gas Transactions Met LCD Compliance Requirements 5
As evidenced by the foregoing discussion and the documentation provided in SCE’s workpapers, 6
with immaterial exceptions SCE’s electric and gas transactions and processes minimized costs to its 7
customers throughout the Record Period. 8
K. Conclusion 9
During the Record Period, SCE consistently followed prudent procurement and bidding 10
processes and practices to satisfy SOC 4. As evidenced by this testimony and the supporting 11
workpapers, SCE has also provided qualitative and quantitative documentation that its actions met the 12
Commission’s LCD Compliance Standard, and this showing complies with the requirements established 13
Deal Type Volume (Billion Btu)
No. Of Deals
Broker/Exchange Purchases 15,304 1,224Bilateral Purchases 6,500 169
Total Purchased 21,804 1,393
Broker/Exchange Sales 5,644 488Bilateral Sales 2,816 109
Total Sold 8,460 597
Total Broker/Exchange 20,948 1,712Total Bilateral 9,316 278
Total Transacted 30,264 1,990

33
in D.15-05-007. Accordingly, the Commission should find that all LCD-related activities SCE 1
performed during the Record Period were in compliance with the applicable Commission standards. 2

34
III. 1
HYDROELECTRIC GENERATION 2
During the Record Period, SCE operated and maintained 33 hydroelectric generating plants 3
including 33 dams, 43 stream diversions, and approximately 143 miles of tunnels, conduits, flumes, and 4
flow lines. These resources have an aggregate 1,176 MW of nameplate generating capacity. However, 5
hydro facility operations were impacted by the ongoing drought. With the drought continuing into its 6
sixth consecutive year, precipitation levels for the 2016 calendar year were only approximately 53% of 7
the historic annual average.35 Nevertheless, SCE hydro generation energy output during 2016 was 8
approximately equal to the annual average recorded over the past 20 years (i.e., 1996-2015). This 9
chapter demonstrates that SCE’s hydro facilities were operated in a reasonable and prudent manner 10
during the Record Period. 11
A. Characteristics of SCE’s Hydro Generation Resources 12
Hydroelectric generation facilities can be roughly divided into two categories: (1) water storage 13
and conveyance facilities; and (2) powerhouses and associated auxiliary equipment. Hydroelectric 14
storage and conveyance facilities capture, store, and direct water to powerhouse facilities using a series 15
of reservoirs, forebays, flumes, canals, conduits, flowlines, and penstocks. The water arrives at the 16
powerhouse under pressure after having dropped from the forebay elevation, through the penstock, to 17
the powerhouse elevation. At the powerhouse, the potential energy of the pressurized water turns the 18
turbine wheels, causing the turbine and generator to rotate and produce electricity. Figure III-1 19
illustrates a typical hydroelectric generating station. 20
35 The 2015 calendar year was the driest year on record in California, based on records dating to the 1800s.
Fortunately, to date, 2017 is on pace to significantly exceed average precipitation levels. While calendar year statistics are sometimes used, per industry convention, precipitation statistics are more often given on a “water year” basis, which runs from October through September (e.g., October 1, 2015 through September 30, 2016 for the 2016 water year).

35
Figure III-1
SCE has three types of hydroelectric plants, based on the physical characteristics of the plant’s 1
hydro resources: (1) stream flow or “run-of the-river;”36 (2) reservoir storage; and (3) pumped storage 2
(plants where the water can be pumped back to a storage facility for reuse during peak hours). 3
Run-of-the-river facilities operate when water is available in the streams and rivers associated 4
with the project. Water is diverted to the turbine-generators through various water conduits such as 5
open flumes and canals, flowlines, tunnels, and finally into the penstock where it drops to the elevation 6
36 A run-of-the-river project typically does not have control of a storage reservoir as part of the project.
Although these projects generally have dams that divert water from the river into the hydro project water conveyance facility, the dam impoundment does not store significant amounts water.

36
of the turbine. The water pressure in the penstock is greatest at the bottom where the water turns the 1
turbine. 2
Hydroelectric projects with storage facilities have the added benefit of storing water during the 3
spring and early summer to allow increased utilization of the water. Storing water in reservoirs extends 4
the window of opportunity for generation months beyond the runoff period and allows utilization of the 5
water during peak power periods. 6
SCE has one pumped storage facility, the John S. Eastwood Power Station, which is operated as 7
a reservoir storage facility with the added value of pump-back. The pump-back capabilities are used 8
when available water for generation has dropped below full reservoir levels and lower-cost, off-peak 9
power is available. This operation allows reuse of limited water resources during peak operating hours. 10
B. SCE Hydro Assets 11
For discussion purposes, SCE’s Hydro assets can be divided into two groups; the Big Creek 12
(formerly known as Northern) and all other assets (formerly known as Eastern). Big Creek assets are the 13
larger group, encompassing all SCE hydro facilities in the upper San Joaquin River watershed in the 14
western Sierra Nevada Mountains. 37 Big Creek is a composite of six major reservoirs, 16 tunnels driven 15
through solid granite, and nine powerhouses, most of which are reservoir storage plants. Most of the 16
Big Creek plants are directly connected to the 220kV bulk power transmission system. In aggregate, the 17
Big Creek generating capacity is approximately 1,015 MW, or about 86% of SCE’s total hydro 18
generation capacity. Most of the Big Creek plants have been in service since the early- to mid-twentieth 19
century. 20
SCE’s remaining hydro assets are located in the Bishop and Mono Basin areas of the eastern 21
Sierra Nevada Mountains, the Kern, Kaweah, and Tule River areas in the southern Sierra Nevada 22
Mountains, and the Ontario, San Bernardino, and Banning areas in the San Gabriel and San Bernardino 23
Mountains. These plants are connected to SCE’s sub-transmission or distribution systems and 24
37 The Big Creek system is located approximately 50 miles north and east of Fresno, California, in the Sierra
Nevada mountain range.

37
collectively total approximately 161 MW of generating capacity, or about 14% of SCE’s hydro 1
generation capacity. Most of these assets are run-of-the-river plants, and most have operated since the 2
late-nineteenth and early-twentieth centuries. 3
1. Big Creek 4
Big Creek utilizes six major reservoirs for water storage, as well as smaller reservoirs that 5
supply some of the powerhouses. The maximum storage for the six major reservoirs is approximately 6
560,000 acre-feet (AF). Due to operational planning and contractual constraints, the reservoirs are 7
typically lowered during the winter months to minimum levels and filled to maximum levels during 8
spring runoff from melting snowpack. The average annual runoff (with significant yearly variations) 9
from the Big Creek watershed is approximately 1,152,000 AF, with the majority of the runoff occurring 10
during the months of April through August. This creates a challenge for Big Creek to utilize as much of 11
the runoff as possible for generation, while minimizing spill. Once a reservoir reaches a full level, 12
inflows that exceed the hydraulic capacity of the downstream powerhouse will bypass the powerhouse 13
as spill. If an outage occurs at the powerhouse during this time, it will cause an increase of water 14
bypassing the powerhouse as spill. SCE defines the energy in MWh lost due to water bypassing a 15
powerhouse due to an outage as “outage bypassed energy.” It is additional generation production that 16
would have been possible had the hydro unit not been out of service. 17
In the case of a unit outage when reservoirs levels are not at full capacity, SCE can either 18
store the water for later use, or utilize a standby unit. This action does not result in outage bypassed 19
energy. Therefore, many of the unit outages that occur in the fall, winter, or spring may not have 20
associated outage bypassed energy because the water has been stored for generation production at a later 21
date. 22
a) Powerhouse Arrangement 23
Big Creek system consists of nine hydro generating plants with a total generating 24
capacity of approximately 1,015 MW. These powerhouses are arranged in essentially three parallel 25
chains in the upper elevations, which then join together in the lower elevations. Water stored in Lake 26
Edison and Florence Lake is channeled to Huntington Lake, where SCE then divides the water between 27

38
the Huntington Chain38 of powerhouses and the Shaver Chain39 of powerhouses, which includes 1
Eastwood. Water passing through the Shaver Chain collects in Shaver Lake, and is then fed to Dam 5 2
where it rejoins water passing through the Huntington Chain. Below Dam 5, the water joins flows from 3
the Mammoth Pool Chain at Dam 6, and continues down the mountain through Powerhouse 3 to 4
Redinger Lake.40 The Big Creek system ends at Powerhouse 4, which is fed from Redinger Lake and is 5
at the edge of PG&E’s Kerckhoff Reservoir. 6
b) Environmental/Regulatory Requirements and Constraints Affecting Water Flow, 7
Storage, Release, Etc. 8
Operation of Big Creek is subject to environmental and regulatory constraints. 9
The overriding objective for using all the SCE Hydro powerhouses and water storage facilities is the 10
prudent use of the water resource, and safety. Water management on the project is governed by FERC 11
licenses, U.S. Forest Service agreements, water rights, and contractual commitments, which include 12
provisions for water releases and storage levels.41 Each reservoir has required storage levels at 13
particular times of the year. The summer season typically requires nearly-full levels to satisfy 14
recreational interests. Additionally, there are limits on seasonal carry-over storage that apply to the 15
whole Big Creek project that relate to downstream water users (largely for agricultural irrigation). 16
Water management includes the necessity to lower reservoir levels for spring 17
runoff, the conveyance of water downstream pursuant to contractual agreements, and the desire to create 18
power when it is most economical to do so. The total reservoir capacity of the Big Creek system is only 19
about one-third of the average annual runoff of the watershed. The majority of the peak runoff occurs 20
within two to three months when late spring temperatures start to rise. A large volume of water must be 21
38 The Huntington Chain utilizes the BC 1, BC 2, BC 8, BC 3 and BC 4 plants. 39 The Shaver Chain utilizes the Eastwood, BC 2A, BC 8, BC 3 and BC 4 plants. 40 The Mammoth Pool Chain utilizes the Mammoth Pool Powerhouse, BC 3 and BC 4 plants. 41 Revenue received by SCE from water purveyors or water rights holders, given in exchange for SCE agreeing
to operate in a manner which benefits the purveyor or rights holder, but is beyond the contractual obligations governing SCE’s water operations, is credited to ERRA.

39
moved downhill within a specific period to either meet obligations or reduce the risk of causing spill at 1
various reservoirs that would reduce total generation. The runoff during the 2016 water year was 2
approximately 53% of a normal (i.e., average) year. That combined with high EAF, low FOF and 3
effective management of fuel (water) available allowed generation levels during the record period to 4
essentially match (i.e., approximately 98%) the 20-year historical average (1996-2015). 5
c) System Operation to Fulfill Requirements/Constraints 6
Water planning largely depends upon the runoff volume of the present and prior 7
water year. Ample snowpack and high reservoir levels are indicative of large quantities of generation 8
available for the market. There is a relationship between one year and the next, with many reservoirs 9
being lowered by the spring prior to the runoff from snowmelt, yet possibly retaining water depending 10
upon the projected runoff forecast. This is always a balancing act with some risk associated with the 11
decisions. The Mammoth Pool watershed is large when compared with the capacity of the Mammoth 12
Pool power plant. The Mammoth Pool reservoir will spill even in a normal water year, and must be 13
lowered to a minimum level in the spring. Due to far-lower-than-normal precipitation there no excess 14
runoff to produce a “spill” condition at Mammoth Pool in 2016. 15
Florence, Edison, Huntington, and Shaver Lakes have much smaller watershed 16
areas than Mammoth Pool. Therefore these reservoirs do not have as high a risk of spill as Mammoth 17
Pool. There was no non-outage spill in these areas during 2016 because of below-average precipitation. 18
All reservoirs have certain restrictions affecting the water levels at certain times of the year. Generally, 19
the levels of Edison and Shaver reservoirs are more flexible than Huntington and Florence reservoirs. 20
The Big Creek reservoir inflows are monitored continually to maintain required contract water flows. 21
Contractual water releases are determined by reservoir inflows and are monitored for daily compliance. 22
The monitoring also identifies reservoir levels for controlling the required maximum and/or minimum 23
storage levels with minimal storage level fluctuations. The Big Creek generation schedules are adjusted 24
daily to provide the best use of the required water releases for generating during periods when it is most 25
economic, and to meet water release requirements as established in the FERC licenses for fish, water 26
and wildlife enhancement. 27

40
d) Factors Affecting Operations 1
The amount of generation available in a given year depends upon the precipitation 2
received plus carryover reservoir storage from the previous year, less the required storage commitments. 3
As mentioned previously, facility operations were significantly impacted by the ongoing drought. The 4
runoff during the 2016 water year was approximately 53% of an average year, following 2015, which 5
had a runoff of approximately 16% of an average year. Long-term planning is used to generate a 6
forecast of power available for scheduling each month during the year and includes consideration of: 7
Current reservoir storage levels and capacities. 8
Operational constraints including water contracts, environmental 9
commitments, and recreational requirements. 10
Plant and unit capabilities and efficiencies. 11
Plant and unit outage planning data. 12
Hydrological forecasts including precipitation and snow surveys. 13
During the likely runoff period of May through July, there may be little Big Creek 14
Project flexibility, as most of the plants will be at full load or the water would otherwise be spilled. At 15
most other times of the year, there is generally flexibility to allow the CAISO to economically dispatch 16
the project. The Big Creek automation system schedules the most efficient units to operate to deliver the 17
amount of generation requested. By combining the most efficient plant equipment with the optimum 18
operational schedule, SCE hydro maximizes the value of available water resources. Outages are planned 19
to minimize the impact on generation schedules and are therefore typically scheduled to occur during the 20
fall and winter months when water for generation is least available. 21
2. Other SCE Hydro Assets 22
As mentioned above, in addition to Big Creek, SCE hydro assets include 24 hydro 23
generating plants with a total capacity of approximately 161 MW. The 24 plants range in capacity from 24
less than one MW at several plants, up to approximately 40 MW at the Kern River 3 plant. These assets 25
are located in the Bishop and Mono Basin areas, the Kern, Kaweah, and Tule River areas, and the 26
Ontario, San Bernardino, and Banning areas in the San Gabriel and San Bernardino Mountains. Some 27

41
of these powerhouses utilize flow from diversion dams on rivers, whereas others utilize flow from 1
relatively small (i.e., as compared to Big Creek) storage dams. 2
Due to the smaller size of the dams and operational constraints, most of these 3
powerhouses are operated as run-of the-river plants. In those cases, the powerhouse will divert from the 4
stream the volume available to maximize generation. If the maximum water available is not utilized due 5
to a unit outage, then the water not utilized is not diverted to the powerhouse. As noted above, this will 6
result in outage bypassed energy. If the flow in the stream or volume available from the reservoir is less 7
than the maximum capacity of the powerhouse, or a unit is on standby due to low water flow, the unit 8
outage does not result in outage bypassed energy. 9
The Bishop and Mono Basin areas have reservoir storage capacities to assist in seasonally 10
levelizing the operation of the plants in those locations. Additionally, storage released from Isabella 11
Reservoir, operated by the U.S. Army Corps of Engineers based on the requests of the Kern River 12
Watermaster, often allows the Borel and the Kern River 1 plants to produce power during naturally 13
occurring low river flows.42 14
a) Environmental/Regulatory Requirements and Constraints 15
These 24 powerhouses are subject to various environmental and regulatory 16
constraints. Many of the FERC licenses specify minimum releases from diversion dams to maintain fish 17
life and riparian habitat. Plants located along rivers with heavy recreational use such as the Kern are 18
also subject to boating (rafting) release requirements. 19
42 Isabella Reservoir is subject to storage level restrictions that are currently in place for dam structure seismic
risk mitigation. These restrictions, combined with the drought and other factors, resulted in Lake Isabella storage levels being insufficient to provide water flow to the 12 MW Borel powerhouse primary intake structure from June 2013 through May 2016. In May 2016, although still significantly restricted due to seismic concerns, Isabella Reservoir water levels became sufficient to return the Borel powerhouse water conveyance to service (i.e., this conveyance routes water from Isabella Reservoir to the powerhouse). However, because of various issues, the Borel powerhouse was not returned to service and continues to remain out of service.
42
b) System Operation Constraints in the Bishop Area 1
To keep the electrical system stable, generation must be curtailed when 2
transmission capacity that normally delivers power from the Bishop area to the Southern California area 3
is reduced below normal. Curtailment is accomplished by reducing local cogeneration resources and 4
SCE’s local hydro generation until total generation matches the area load requirements and the 5
remaining transmission capacity out of the area. SCE’s Bishop Area hydro generation resources were 6
curtailed one time during the Record Period. 7
c) Factors Affecting Operations 8
Like Big Creek, the amount of generation available in a given year from these 24 9
powerhouses depends upon precipitation during that year, and were impacted by the drought. However, 10
for the diversion pools and reservoirs associated with these 24 powerhouses, there is no carryover or 11
target for storage to consider. Therefore, hydrology planning is unnecessary to the same extent as at Big 12
Creek, but incorporates the following similar parameters: 13
Current reservoir storage levels and capacities. 14
Operational constraints including water contracts, environmental 15
commitments, and recreational requirements. 16
Plant and unit capabilities and efficiencies. 17
Plant and unit outage planning data. 18
Hydrological forecasts including precipitation and snow surveys. 19
However, there is limited flexibility for run schedules, because the plants must 20
take advantage of water in the river, or it is lost as spill. 21
d) Storm Debris 22
Due to the river geology of many of these 24 powerhouses, there is high debris 23
loading during storms that typically does not occur in the granite-walled canyons of Big Creek. This 24
often requires taking a plant off-line during this period until the intakes can be cleared or until water 25
turbidity decreases to an acceptable level. High turbidity indicates sand or silt in the water, which will 26
cause damage to hydro turbines and associated equipment such as cooling systems. High turbidity water 27

43
that flows past a powerhouse is not considered bypassed energy, because it is not suitable water for 1
operation of the powerhouse. No records are kept on the amount of high turbidity water that bypasses 2
powerhouses. 3
e) Canal Restrictions Due to Moss 4
Periodically it is necessary to control the accumulation of moss in canals 5
associated with several projects. If the moss is not removed, it can cause the flowline to back up and 6
spill, which causes loss of water and potential environmental damage. Previously, copper sulfate and 7
citric acid were introduced into these canals to control the moss. The California Regional Water Quality 8
Control Board no longer permits the use of these chemicals. When it is necessary to remove moss from 9
a flowline, it is taken out of service and allowed to dry out, which kills the moss. This procedure is 10
typically applied at the Borel, Kaweah 1, Kaweah 2, and Tule flowlines. During the Record Period one 11
canal restriction was required for removal of moss. 12
f) Flowline Restrictions Due to Root Intrusion or Lime Deposits in Cement 13
Flowlines and Penstocks 14
Flows through the Mill Creek No. 3, Lytle Creek, Ontario No. 1, and Tule 15
projects are periodically restricted when large plant roots grow through the cement pipes. When 16
restrictions become evident, outages are scheduled to manually remove roots from within the pipes. The 17
Fontana and Lytle Creek penstocks accumulate lime deposits, which restrict the flow to the Fontana and 18
Lytle Creek powerhouses. During the Record Period no flowline restrictions were required due to root 19
intrusion or lime deposits in cement flowlines or penstocks. 20
C. Recorded Hydro Production Summary 21
Table III-10 below summarizes SCE’s Hydro generation for the Record Period, as well as the 22
average annual generation recorded during 1996 through 2015 on a calendar-year basis.43 23
43 SCE hydro-transmitted load statistics comprise the net metered generation from the hydro plants as
documented in FERC Form 1 and in other regulatory filings.

44
Table III-10 SCE Hydro – 2016 Recorded Hydro Production
As shown, the combined 2016 generation of Big Creek and the Other Assets was essentially 1
equal to the average of the previous 10-year period. This demonstrates the effective management of the 2
limited water resources available during the record period. 3
D. Hydro Performance During the Record Period 4
The efficient use and availability of SCE hydro generation resources are ensured through 5
attentive management of the facilities. Efficiency and availability are demonstrated through two 6
metrics: (1) Equivalent Availability Factor (EAF), and (2) Forced Outage Factor (FOF). This section 7
provides data on these metrics for Big Creek and the Other Assets. 8
1. EAF Results 9
EAF (equivalent availability factor) is expressed as the percentage of time that a 10
generating unit was available for service (regardless of whether it was actually in service) during the 11
time period in question. EAF takes into account scheduled outages and forced outages, and includes 12
both outages and derates (i.e., partial outages). EAF does not include outages or derates resulting from 13
issues that were external to the SCE-managed powerhouse, reservoir, dam site and flowline equipment 14
including: (a) transmission system constraints or outages that impact the powerhouse, and (b) 15
insufficient water flows to operate the turbines, or time periods when the water contains excessive levels 16
of storm debris (whereby using the water would damage the turbine). EAF is calculated on a monthly 17
basis for each powerhouse, which is then combined into a total aggregate EAF. Ideally, the EAF level is 18
Line No. Region1996-2015 Average
Net Generation (MWh)
2016Net Generation
(MWh)1 Big Creek 3,182,799 3,211,1452 Other Assets 590,976 500,6773 TOTAL 3,773,775 3,711,822
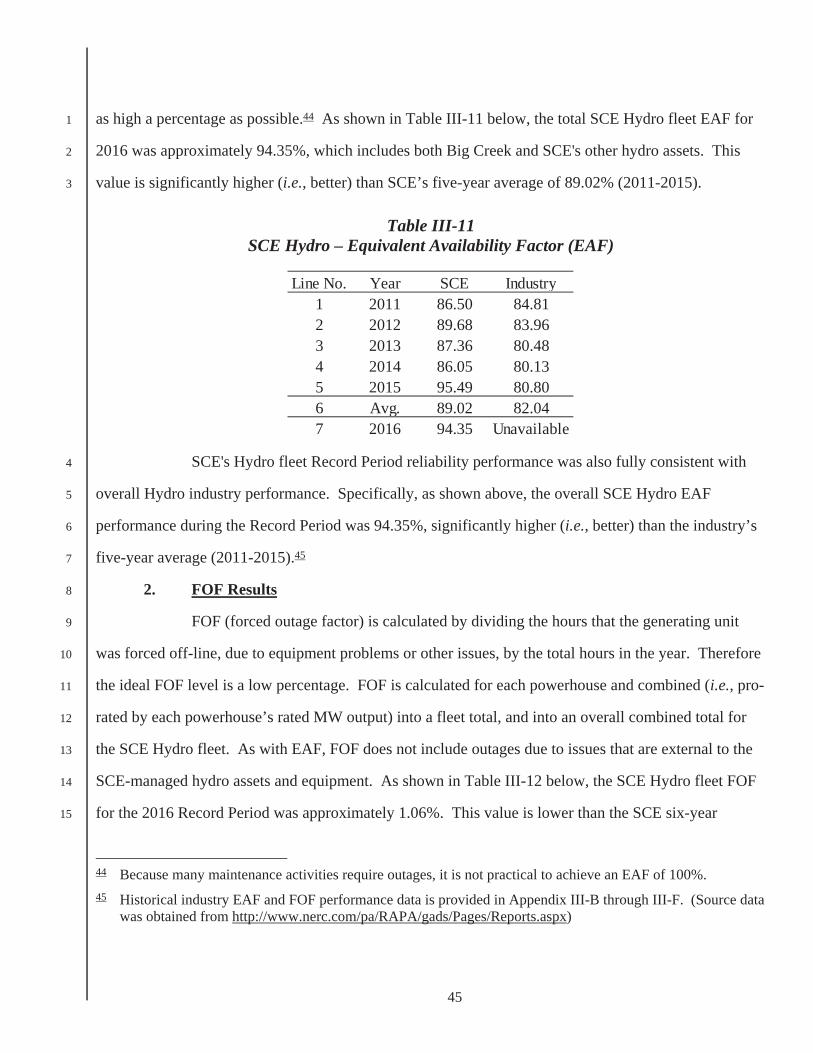
45
as high a percentage as possible.44 As shown in Table III-11 below, the total SCE Hydro fleet EAF for 1
2016 was approximately 94.35%, which includes both Big Creek and SCE's other hydro assets. This 2
value is significantly higher (i.e., better) than SCE’s five-year average of 89.02% (2011-2015). 3
Table III-11 SCE Hydro – Equivalent Availability Factor (EAF)
SCE's Hydro fleet Record Period reliability performance was also fully consistent with 4
overall Hydro industry performance. Specifically, as shown above, the overall SCE Hydro EAF 5
performance during the Record Period was 94.35%, significantly higher (i.e., better) than the industry’s 6
five-year average (2011-2015).45 7
2. FOF Results 8
FOF (forced outage factor) is calculated by dividing the hours that the generating unit 9
was forced off-line, due to equipment problems or other issues, by the total hours in the year. Therefore 10
the ideal FOF level is a low percentage. FOF is calculated for each powerhouse and combined (i.e., pro-11
rated by each powerhouse’s rated MW output) into a fleet total, and into an overall combined total for 12
the SCE Hydro fleet. As with EAF, FOF does not include outages due to issues that are external to the 13
SCE-managed hydro assets and equipment. As shown in Table III-12 below, the SCE Hydro fleet FOF 14
for the 2016 Record Period was approximately 1.06%. This value is lower than the SCE six-year 15
44 Because many maintenance activities require outages, it is not practical to achieve an EAF of 100%. 45 Historical industry EAF and FOF performance data is provided in Appendix III-B through III-F. (Source data
was obtained from http://www.nerc.com/pa/RAPA/gads/Pages/Reports.aspx)
Line No. Year SCE Industry1 2011 86.50 84.812 2012 89.68 83.963 2013 87.36 80.484 2014 86.05 80.135 2015 95.49 80.806 Avg. 89.02 82.047 2016 94.35 Unavailable

46
average of 1.21% (2010-2015) and significantly lower (i.e., better) than the six-year industry average of 1
5.05% (2010-2015). 2
Table III-12 SCE Hydro – Forced Outage Factor (FOF)
3. Conditions Affecting Operating Results 3
SCE strives to maintain a high level of Hydro fleet reliability. Due to the seasonal nature 4
of the water supply, outages are generally scheduled in the fall or winter when the lowest amount of 5
water is available for generation. 6
If an unplanned unit outage occurs at Big Creek when reservoirs levels are not at full 7
capacity, SCE can either store the water for later use, or utilize a standby unit. This action does not 8
result in outage bypassed energy. Therefore, many of the unit outages that occur in the fall, winter, or 9
spring may not have associated outage bypassed energy because the water has been stored for generation 10
production at a later date. 11
Unlike those at Big Creek, most of SCE's other 24 powerhouses do not have significant 12
water storage capacity. Therefore, when powerhouse outages occur during periods of available stream 13
flow, water typically passes by the plant causing outage bypassed energy (i.e., which is measured in 14
Acre-Feet and then computed into an equivalent MWh figure). As a result, there are generally more 15
outage bypassed energy events for these other 24 powerhouses than for the Big Creek powerhouses, 16
which have the ability to store the water for later use or direct it into another Big Creek generation chain. 17
Table III-13 below provides the generation produced and the outage bypassed energy that occurred 18
Line No. YEAR SCE Industry1 2010 3.70 4.422 2011 1.20 3.873 2012 1.27 3.634 2013 0.22 5.825 2014 0.71 6.416 2015 0.17 6.177 Avg. 1.21 5.058 2016 1.06 Unavailable

47
during the Record Period. As shown, Big Creek experienced zero bypassed energy and the other assets 1
recorded a small percentage of bypass energy loss. 2
Table III-13 SCE Hydro – 2016 Generation and Outage Bypassed Energy
a) Spill Bypassed Energy 3
(1) Big Creek 4
As previously noted, in a normal water year, there is generally some spill 5
associated with the Big Creek project as spring runoff rates can quickly exceed water storage capacity 6
even with all generating units in full operation. In addition, as outages are needed each year for 7
scheduled maintenance and unplanned repairs, additional spill can occur during these outages if 8
reservoirs reach capacity. The average annual water year flow in the San Joaquin River is 9
approximately 1,152,000 AF of water.46 During the 2016 water year California experienced lower 10
levels of precipitation, and the flow in the San Joaquin River was approximately 606,400 AF, or 53% of 11
normal. This lower than average water level, combined with low outage rates, resulted in zero acre-feet 12
of spill during the Record Period for Big Creek, including zero outage bypassed energy events. 13
(2) Other Assets 14
During portions of the Record Period, SCE's 24 powerhouses located 15
outside of Big Creek had sufficient run-of-the-river water flow rates available to achieve full MW 16
output. However, in some instances outages prevented full MW output, resulting in outage bypassed 17
46 California Department of Water Resources, water flow summaries available at
http://cdec.water.ca.gov/snow/current/flow/index2.html
Line No. Region2016
Net Generation (MWh)
Bypassed Energy (MWh)
% Loss
1 Big Creek 3,211,145 0 0.0%2 Other Assets 500,677 10,744 2.1%3 TOTAL 3,711,822 10,744 0.3%

48
energy (i.e., 10,744 MWh).47 Specifically, as summarized in Table III-14 below, during the Record 1
Period these 24 powerhouses experienced nine outages (six Planned and three Forced) that individually 2
incurred more than 500 MWh of outage bypassed energy. These nine outages account for 3
approximately 63% (6,821 MWh) of the outage bypassed energy recorded during the Record Period. 4
All nine of these outages affected less than 25 MW of generation capacity. 5
Table III-14 2016 Bypassed Energy Events
On July 1, 2016, while in operation, Bishop Creek 5 Unit 2 experienced a 6
brush failure. Brush replacements are common and are typically performed once a year during annual 7
maintenance outages. Occasionally brushes can wear more quickly than expected and as a result in-8
service failures can occur. Replacement was completed and the unit returned to service on August 10, 9
2016. This outage accounted for approximately 15% (1,662 MWh) of the total bypass energy incurred. 10
Due to the routine nature of this event a Root Cause evaluation report was not produced. 11
47 Total bypassed energy does not include the bypassed energy incurred during the Bishop 4 U1-5 Intake
Upgrade or the Bishop 4 Unit 5 Stator Winding Failure (both continued into the 2017 record period) nor those outages that were outside of management control (i.e., transmission/distribution system disturbances). Bishop 4 consists of five generating units with a combined total capacity of 7.96 MW.
Line No. Plant and Unit NERC Event Type Beginning Date Ending Date Outage Duration
(Hours:Minutes)Bypassed Energy
(MWh)
1 Outage 1-62 Bishop 2 Unit 1, Bishop 6 Unit 1, Kern River 1 Unit 2&3, Poole and Rush Creek
3 PO Various Various 2808:39 3,7614 Cause: Annual Inspections at various powerhouses
5 Outage 76 Bishop 5 Unit 2 U1 July 1, 2016 August 10, 2016 954:44 1,662
7 Cause: Brush Replacement
8 Outage 89 Rush Creek Units 1&2 U1 May 2, 2016 May 19, 2016 409:36 1,398
10 Cause: Air Valve Replacement
11 Outage 912 Kaweah 3 Unit 1 U1 December 15, 2016 December 29, 2016 321:14 771
13 Cause: Exicitation Issues

49
On May 2, 2016, while in operation, the penstock air valve at the Rush 1
Creek powerhouse failed. During initial filling, water flowing into the empty penstock displaces air and 2
pushes it to a higher elevation. If this air is not removed from the penstock it can be compressed to such 3
an extent that the penstock pipe can burst. Similarly, during emptying, the penstock pipe has to be filled 4
with air at a rate equal to emptying rate. In the absence of air supply, a vacuum is created and the 5
penstock pipe will collapse. Replacement of the air valve was completed and the powerhouse returned 6
to service on May 19, 2016. This outage accounted for approximately 13% (1,398 MWh) of the total 7
bypass energy incurred. Due to the routine nature of this event a Root Cause evaluation report was not 8
produced. 9
On December 15, 2016 the Kaweah 3 Unit 1 generator experienced 10
excitation issues. These were corrected and the unit returned to service December 29. This outage 11
accounted for approximately 7% (771 MWh) of the total bypass energy incurred. Due to the routine 12
nature of this event a Root Cause evaluation report was not produced. 13
b) Outage Events 14
Since 1982, SCE has utilized the North American Electric Reliability Corporation 15
(NERC) GADS (Generating Availability Data System) to track outage events (scheduled and 16
unscheduled outages)48 at its hydro facilities. GADS was developed by utility designers, operating 17
engineers, and system planners to meet the information needs of the electric utility industry. For this 18
purpose, objectives for the GADS program were established: compilation and maintenance of an 19
accurate, dependable, and comprehensive database capable of monitoring the performance of electric 20
generating units and major pieces of equipment. The following sections provide summary statistics for 21
48 NERC GADS is a group of databases used to collect, record, and retrieve operating information from power
plants in North America. The data is used to improve performance of electric generating equipment, and to support equipment reliability and availability analysis by GADS data users. For information on outage report code definitions, please refer to Appendix III-A and the NERC-GADS Data Reporting Instructions, available at http://www.nerc.com/pa/RAPA/gads/DataReportingInstructions/Entire%20GADS%20Data%20Reporting%20Instructions%20Effective%20January%201,%202015.pdf.

50
all of the outage events that occurred during the Record Period, regardless of whether or not the outage 1
resulted in outage bypassed energy. 2
(1) Scheduled Outages 3
Scheduled outages include planned and maintenance outages as well as 4
planned and maintenance outage extensions. Planned outages are typically scheduled at the start of each 5
year. For example, it is common to schedule planned outages in the spring to prepare for the summer 6
peak season, and in the fall to address issues observed during the summer peak season. During the year, 7
maintenance outages are scheduled when needed to perform non-emergency repairs, typically during a 8
time better suited for the bulk power grid (e.g., on weekends). During the Record Period, as 9
summarized in Table III-15 below, there were 90 scheduled outages (73 planned, zero planned 10
extensions, 17 maintenance and zero maintenance extensions) that occurred at SCE hydro facilities 11
during the Record Period. 12
Table III-15 SCE-Hydro – 2016 Scheduled Outages
Twenty-three of these scheduled outages occurred at plants having a total 13
rated capacity of 25 MW or greater and exceeded 24 hours in duration. None of these 23 outages were 14
extended by more than one week past the scheduled end date that was in place at the start of the outage. 15
49 Additional details regarding Hydro scheduled outages are provided in SCE’s response to the Master 16
Data Request for this proceeding. 17 49 D. 15-03-023, p. 3 requires that SCE provide certain information in its annual ERRA Review Phase filings for
scheduled outage extensions that lasted more than one week past the scheduled end date for the outage, where the scheduled outage extension affected a generating unit with a rated capacity exceeding 25 MW, or affected multiple generating units at a given power plant having a combined capacity exceeding 25 MW.
Line No. Outage Classification Quantity1 Planned (PO) 732 Planned Extension (PE) 03 Maintenance Outage (MO) 174 Maintenance Outage Extension (ME) 05 TOTAL 90

51
(2) Unscheduled Outages 1
An unscheduled outage occurs when either equipment suddenly fails or 2
must be removed from service relatively quickly because of control problems or to prevent damage. 3
The unit either immediately trips or a shutdown is initiated, at which time the required repair proceeds. 4
During the 2016 Record Period there were a total of 54 unscheduled (i.e., 5
forced) outages on SCE Hydro generating units. Fifty-one of these outages affected a total generation 6
capacity of less than 25 MW and/or had a duration of less than 24 hours. The other three outages lasted 7
longer than 24 hours and either occurred on a generating unit larger than 25 MW or affected a 8
generation capacity of greater than 25 MW. 50 These three outages are summarized in Table III-16. As 9
indicated, none of these three outages incurred outage bypassed energy because of available storage at 10
Big Creek at the time of the outages. 11
50 D.15-03-023, p. 3, requires that SCE provide certain information in its annual ERRA Review Phase filings for
forced outages exceeding 24 hours, where the forced outage affected a generating unit with a rated capacity exceeding 25 MW, or affected multiple generating units at a given power plant having a combined capacity exceeding 25 MW.

52
Table III-16 SCE Hydro – 2016 Unscheduled Outages
(Lasting Longer than 24 Hrs on Units Greater Than 25MW)
On March 31, 2016, following a return to service from a generator rewind, 1
Big Creek 3 Unit 3 was forced off-line due to low lubricating oil levels which resulted in damage to the 2
Line No. Plant and Unit NERC Event Type Beginning Date Ending Date Outage Duration
(Hours:Minutes)Bypassed Energy
(MWh)
1 Outage 1
2 Big Creek 3 Unit 3 U1 March 31, 2016 June 1, 2016 1488:00 0
345
Cause:
6789
Action Taken:
10 Outage 2
11 Big Creek 3 Unit 4 U1 August 4, 2016 August 10, 2016 144:00 0
121314
Cause:
1516171819
Action Taken:
20 Outage 3
21 Big Creek 2A Units 1&2 U1 August 5, 2016 August 8, 2016 72:00 0
222324
Cause:
252627
Action Taken:
The penstock developed a leak at the joint between pipe sections. Penstock leaks can occur when: (a) water remains stagnant within a penstock (such as occurs when hydro units are used for Peaking duty rather than around-the-clock operation) and thereby can undergo freeze/thaw
The penstock joint leak was repaired. A root cause analysis was not documented for this outage as the likely causes of joint leaks are well known, and current maintenance practices are generally effective in preventing the problem to the extent practical.
Low tube oil levels allowed the thrust runner plate to dry rub the bearing pads. The subsequent heat generated from friction damaged the thrust runner plate, the thrust bearings and shaft seal.
During a routine inspection by operating personnel, an oil leak was discovered in the oil cooler heat exchange cooling coils, which had allowed water to enter the turbine lube oil system.
The damaged section of cooling coil was replaced. A root cause analysis was not documented for this outage as the likely causes of leaks are well known, and current maintenance practices are generally effective in preventing the problem to the extent practical. The apparent cause of the leak was erosion of the coil over its many years of service.
Necessary repairs were performed on the thrust runner plate, the thrust bearings and shaft seal. A root cause analysis was performed for this outage and has been provided in workpapers. The apparent cause was a partially closed valve which prevented full supply of oil to the bearings during operations.

53
thrust runner plate, the thrust bearings and shaft seal. The apparent cause was a partially closed valve 1
which prevented full supply of oil to the bearings during operations. Repairs were performed and the 2
unit was returned to a ready for service condition on June 1, 2016. A root cause analysis was performed 3
for this outage and a copy of the resulting report is included in workpapers. No outage bypassed energy 4
was incurred during this outage. 5
On August 4, 2016, during a routine inspection by operating personnel of 6
Big Creek 3 Unit 4, an oil leak was discovered in the oil cooler heat exchange cooling coils, which had 7
allowed water to enter the turbine lube oil system. The apparent cause of the leak was erosion of the 8
coil over its many years of service. Corrective actions include the continuation of daily inspections, 9
installation of a high level oil alarm and replacement of the cooling water coils. A root cause analysis 10
was not documented for this outage as the likely causes of leaks are well known, and current 11
maintenance practices are generally effective in preventing the problem to the extent practical. No 12
outage bypassed energy was incurred during this outage. 13
On August 5, 2016, the penstock feeding the Big Creek 2A Powerhouse 14
developed a leak between pipe sections that required repairs. Penstock leaks can occur when: (a) water 15
remains stagnant within a penstock (such as occurs when hydro units are used for Peaking duty rather 16
than around-the-clock operation) and thereby can undergo freeze/thaw conditions with associated 17
expansion and contraction inside the penstock, causing joint leakage, or (b) there is insufficient water 18
(such as due to the ongoing drought) to maintain the penstock in a completely full condition, which can 19
cause gaskets to dry out at the penstock joint connections. The penstock joint leak was repaired and the 20
unit was placed back in-service. A root cause analysis was not documented for this outage as the likely 21
causes of joint leaks are well known, and current maintenance practices are generally effective in 22
preventing the problem to the extent practical. No outage bypassed energy was incurred during this 23
outage. 24
SCE personnel investigate essentially all unscheduled outages. Specialists 25
(e.g., engineers from the Generation Department home office) provide assistance to these investigations 26
where needed. Often, the cause of the outage as well as the needed repairs and other corrective actions 27

54
are readily apparent, and a more extensive analysis of the outage (such as a root cause analysis) is not 1
conducted or documented. Outage repairs are summarized in the Hydro maintenance data base, and if 2
the outage involved extensive repairs, additional documentation is typically also prepared (e.g., a 3
contractor repair report). As explained above, during the Record Period, SCE management determined 4
that one of the Hydro generation forced outages required additional investigation into the cause of the 5
outage, including the preparation of a Root Cause report. 6
c) Eastwood Pumped Storage 7
Eastwood is SCE’s largest hydroelectric generating unit, and the only one with 8
pump back capability. It consists of an underground powerhouse located at Shaver Lake with a single 9
pump/turbine rated at 200 MW. The powerhouse is fed water from a small reservoir known as the 10
Balsam Meadow forebay. This forebay is located geographically and in elevation between Huntington 11
Lake and Shaver Lake. Balsam Meadow forebay has a maximum storage capacity of approximately 12
1,547 AF of water. The forebay is fed primarily by a water conveyance tunnel bringing water from 13
Huntington Lake. In addition, some water is diverted from Pitman Creek into the Balsam Meadow 14
forebay. Water exiting the forebay to Eastwood enters another tunnel which later transitions into a 15
penstock that feeds the Eastwood turbine. When generating, water from the Balsam Meadow forebay 16
flows through Eastwood and is discharged into Shaver Lake. This is the customary way for water to 17
flow from Huntington Lake to Shaver Lake. 18
Over its history, much of Eastwood’s operation has been in the conventional 19
manner, capturing the potential energy of the water resource as it flows from higher to lower elevations, 20
as described above. Eastwood also provides pumped storage capacity, whereby the generator can also 21
be operated as a motor.51 This turns the turbine in the reverse direction, which allows the turbine to 22
operate as a pump. When used in this manner for pumped storage, Eastwood consumes electric power 23
51 Pump-back mode operation also requires the use of a “pony motor” which is mounted above the generator.
This pony motor assists in accelerating the generator to operating speed at the initiation of each pump-back mode operating cycle.

55
during low-cost hours (usually during early morning hours) to pump water uphill to the Balsam Meadow 1
forebay, so it can be used to generate power during higher-priced hours. Under typical operations, 2
Eastwood Pump schedules are determined by SCE’s Short-Term Market Planning (STP) group in order 3
to maximize the value of Eastwood’s Pumped Storage capabilities. For pump operations to add value to 4
Eastwood, the on-peak/off-peak differential needs to be large enough so that the cost to pump is less 5
than the value of generation.52 In recent years, peak and off-peak prices have evolved with the increased 6
penetration of renewable resources leading to higher price uncertainty. Lower gas prices have also lead 7
to lower absolute differences between peak and off-peak prices thus reducing the margin prices between 8
pump and generation. As a result, during the record period year it was not economical to operate 9
Eastwood as a pumpback facility and it was solely used as a generation resource. SCE continues to 10
monitor changing market conditions and will continue to utilize Eastwood in a way that maximizes 11
value for SCE customers.12
52 Pump-back operation is approximately 75% efficient and consumes approximately 1.33 MWh of electricity
for each 1.0 MWh of electricity subsequently generated when that same volume of water is later released back through the generator. While no pumpback operation occurred during the 2016 record period, when viewing generation statistics over multiple years, it should be noted that Eastwood Net Generation statistics typically represent the total MWh of generation produced not including MWh of electricity consumed while Eastwood was operating in pump-back mode.

56
IV. 1
NATURAL GAS GENERATION 2
A. SCE Peaker Introduction 3
SCE owns and operates five natural-gas fired peaking generating plants (known as the SCE 4
Peakers). The five Peakers are: (1) Barre Peaker, located at SCE’s Barre Substation in Stanton, CA; (2) 5
Center Peaker, located at SCE’s Center Substation in Norwalk, CA; (3) Grapeland Peaker, located at 6
SCE’s Etiwanda Substation in Rancho Cucamonga, CA; (4) Mira Loma Peaker, located at SCE’s Mira 7
Loma Substation in Ontario, CA; and (5) McGrath Peaker located next to NRG’s Mandalay Generating 8
Station in Oxnard, CA. Each Peaker plant consists of a single simple cycle combustion turbine 9
generator of approximately 49 MW rated net capacity, for an aggregate 245 MW of generating net 10
capacity for the five plants. The first four Peakers became operational in August 2007 and the fifth 11
Peaker (McGrath) became operational in November 2012. 53 12
The SCE Peaker units contribute to bulk power grid reliability with quick starting and rapid 13
ramping capabilities, and can run several times per day if necessary. Their relatively low startup costs 14
and ability to start up and shut down quickly means the Peakers can be run only when necessary, thus 15
helping to reduce overall customer costs.54 SCE offers the Peakers to the CAISO energy and Ancillary 16
Services markets, where the units can be run to meet unexpected customer demand, respond to 17
unplanned system contingencies, or simply provide required system operating reserves by remaining 18
off-line but immediately available. Because the Peakers can be started without an external source of 19
electrical power (i.e., a “black-start”), they can be used to help restore power if the grid experiences a 20
total shutdown or “black-out.” The operation of the SCE Peakers during the Record Period and the 21
related fuel costs for these facilities is described below. 22 53 Pursuant to Commission Resolution E-4791, two of the peakers (i.e., the Grapeland and Center Peakers)
underwent Enhanced Gas Turbine upgrades during 2016, which included the integration of a battery energy storage system into each of these peakers. SCE is filing a separate Application for Commission review of these enhancements.
54 However, Peaker operating hours per day and per year must be managed such that their respective daily and annual air emissions do not exceed their respective air permit limits.

57
B. SCE Peakers Performance During the Record Period 1
The five SCE Peakers provided 153,462 MWh of energy and were started an aggregate 1,125 2
times during the Record Period as shown in Table IV-17. This yields an average of approximately 4.3 3
starts per Peaker per week, and an average of approximately 2.8 hours of run-time per Peaker start. 4
Table IV-17 SCE Peakers - 2016 Generation and Starts
This was the highest total annual MWh production recorded to date (an increase of 5
approximately 2% from the previous generation record produced in 2015) by the SCE Peakers. As more 6
renewable energy sources, such as solar and wind generation, are being utilized, SCE’s Peakers are 7
increasingly being called upon to generate power in order to assist in leveling grid generation output 8
when renewable generation resources experience unpredictable variations in generation output. 9
1. Fuel Usage Cost 10
During the Record Period the SCE Peakers consumed 1,554,223 mmBtu of natural gas at 11
a cost of approximately $4.330 million. Table IV-18 shows the monthly sums of fuel usage and cost for 12
all five Peakers.55 13
55 Each monthly accounting entry for fuel cost includes a forecast of the cost expected to be incurred in that
month, as well as an entry which reconciles the prior month’s cost forecast with the prior month’s actual recorded cost. The cost data provided herein reflects this accounting practice and does not include fuel delivery (i.e., transportation) costs, while the fuel usage data provided herein is the actual fuel consumed as recorded at the end of each month.
Line No.
PeakerSite
Generation(MWh) Starts
1 Barre 28,750 1972 Center 27,383 1943 Grapeland 33,439 2444 Mira Loma 31,297 2565 McGrath 32,593 2346 TOTAL 153,462 1,125

58
Table IV-18 SCE Peakers - 2016 Fuel Usage & Cost
2. Results of Operation 1
The efficient use and reliability of SCE Peaker generation resources are ensured through 2
attentive management of the facilities. Reliability is primarily demonstrated through the use of two 3
metrics: (1) Equivalent Availability Factor (EAF), and (2) Forced Outage Factor (FOF). This section 4
provides data on these metrics for the Peakers facilities. 5
a) EAF Results 6
EAF is a measure of plant reliability that reflects the percentage of time that the 7
generating unit is available for rated production. EAF accounts for potential production losses resulting 8
from full outages and derates, and includes both scheduled and unscheduled outages. EAF does not 9
include activities external to the Peaker plant that cause the Peaker to be out of service, such as 10
transmission or gas pipeline outages. The combined average EAF for the five Peakers for the 2016 11
Record Period was 96.42% as shown in Table IV-19 below. This is higher (i.e., better) than the five-12
year average of approximately 95.86% (2011-2015) as well as significantly higher than the five-year 13
Line No. Month Usage (mmBtu) Cost ($)1 January 236,014 640,2562 February 237,724 533,2003 March 165,730 316,6674 April 102,662 216,3485 May 6,080 13,2696 June 18,864 54,9747 July 43,924 147,4888 August 65,381 205,7549 September 156,247 493,34810 October 190,626 601,24111 November 171,410 484,04512 December 159,563 624,30413 TOTAL 1,554,223 4,330,895

59
industry average of approximately 85.65% (2011-2015), reflecting excellent performance during the 1
Record Period. 56 2
b) FOF Results 3
FOF is a measure of plant reliability that reflects the extent of unscheduled (i.e., forced) unit 4
outages during the Record Period. Specifically, FOF is the percent of time a Peaker was not available 5
for service due to an unscheduled outage. The ideal FOF level is a low percentage.57 As shown in Table 6
IV-19 below, the combined average FOF for the five Peakers during the Record Period was 0.68%. This 7
is lower (i.e., better) than SCE’s Peaker plants’ annual FOF average of approximately 1.02% (2011-8
2015) and significantly lower than the industry average of 5.16% (2011-2015).58 9
Table IV-19 SCE Peakers - 2016 Reliability
SCE’s Peaker plant operations during the Record Period were demonstrably prudent and 10
reasonable given the overall outstanding high EAF of approximately 96.42% and low FOF of 0.68%. 11
56 The Industry Average EAF and FOF provided herein are computed from all simple cycle combustion turbine
power plant generating units reporting into the NERC GADS data base. There is not a distinct GADS category for “Peaker” power plants. While it is common for simple cycle combustion turbine power plants to be used for Peaking service, other technologies can also be used for Peaking service, such as diesel generators.
57 Although the ideal FOF is a low percentage, in practice the power industry has not been able to eliminate all forced outages while sustaining cost-effective maintenance practices.
58 Historical industry EAF and FOF performance data is provided in Appendices III-B through III-F. (Source data was obtained from http://www.nerc.com/pa/RAPA/gads/Pages/Reports.aspx).
Line No. SCE Industry SCE Industry
1 2011 90.84 84.05 1.05 6.192 2012 96.07 83.53 1.90 6.793 2013 97.19 85.48 1.00 5.034 2014 97.53 85.21 0.31 4.605 2015 97.67 90.00 0.82 3.186 Avg. 95.86 85.65 1.02 5.167 2016 96.42 Unavailable 0.68 Unavailable
Year EAF FOF

60
3. Outage Events 1
Since 2007 (the first year of operation for four of the five Peaker plants), SCE has 2
utilized the North American Electric Reliability Corporation (NERC) GADS (Generating Availability 3
Data System) to track outage events (scheduled and unscheduled outages) at its Peaker facilities.59 4
GADS was developed by utility designers, operating engineers, and system planners to meet the 5
information needs of the electric utility industry. For this purpose, specific objectives for the GADS 6
program were established: compilation and maintenance of an accurate, dependable, and comprehensive 7
database capable of monitoring the performance of electric generating units and major pieces of 8
equipment. The following sections discuss outage events that occurred during the Record Period. 9
a) Scheduled Outages 10
Scheduled outages include planned and maintenance outages as well as planned 11
and maintenance outage extensions. Planned outages are typically scheduled at the start of each year. 12
For example, it is common for peaking-duty and intermediate-duty generating units to schedule planned 13
outages in the spring to prepare for the summer peak season, and in the fall to address issues observed 14
during the summer peak season. During the course of the year, maintenance outages are scheduled 15
when needed to perform non-emergency repairs, typically during a time better suited for the bulk power 16
grid (e.g., on weekends). 17
As shown in Table IV-20 below, there were 11 maintenance outages performed 18
on the Peakers (i.e., roughly two per unit) during the Record Period, which accounted for approximately 19
791 outage hours or approximately 69% of the 1,145 total scheduled outage hours. Additional 20
scheduled outages included 309 hours for project installation and testing of the Peaker Enhanced Gas 21
Turbine upgrades (including the integration of battery energy storage) at the Grapeland and Center 22
59 For information on outage report code definitions, please refer to Appendix III-A and the NERC-GADS Data
Reporting Instructions, available at http://www.nerc.com/pa/RAPA/gads/DataReportingInstructions/Entire%20GADS%20Data%20Reporting%20Instructions%20Effective%20January%201,%202015.pdf.

61
peakers.60 The remaining scheduled outages included 10 hours for gas supply line repairs, 21 hours to 1
perform the NERC/CAISO-required annual black-start testing, and 14 hours of miscellaneous other 2
short-duration scheduled outages. 61 3
Table IV-20 SCE Peakers - 2016 Scheduled Outage Results
b) Unscheduled Outages 4
An unscheduled outage occurs when either equipment suddenly fails or must be 5
removed from service relatively quickly because of control problems or to prevent damage. The unit 6
either immediately trips or a shutdown is initiated, at which time the required repair proceeds. There 7
were 28 unscheduled outages during the Record Period, which totaled approximately 293 hours. The 8
majority of unexpected equipment problems that arose were rapidly diagnosed and quickly corrected. 9
As a result only three of the 28 unscheduled outages exceeded a duration of 24 hours. 62 These three 10
outages are discussed below. 11
60 Pursuant to Commission Resolution E-4791, two of the peakers (i.e., the Grapeland and Center Peakers)
underwent Enhanced Gas Turbine upgrades during 2016, which included the integration of a battery energy storage system into each of these peakers. SCE is filing a separate Application for Commission review of these enhancements.
61 Those Out of Management Control (OMC) outages that include transmission system outages, gas supply line repair outages and black-start testing outages are not included in either the EAF or FOF computations presented herein.
62 D.15-03-023, p. 3, requires that SCE provide certain information in its annual ERRA Review Phase filings for forced outages exceeding 24 hours, where the forced outage affected a generating unit with a rated capacity exceeding 25 MW, or affected multiple generating units at a given power plant having a combined capacity exceeding 25 MW.
Line No. Number Hours1 Annual Maintenance Inspections 11 7912 Battery Storage Project Installation and Testing 6 3093 Gas Supply Line Maintenanace/Repairs 1 104 Black-start and Performance Testing 6 215 Miscellaneous 8 146 TOTAL 32 1,145
Outage Purpose

62
On October 20, 2016, the Grapeland Peaker experienced a failure of the silencers 1
located inside the variable bleed valve duct work (i.e., this duct provides air passage to compressor bleed 2
valves during start up and shut down). Necessary repairs required removal of the duct work via crane 3
and re-welding of the silencers to the duct work. Repairs were completed on October 22, 2016 and the 4
plant was returned to service. Given the apparent nature of the cause of the failure and required repair, 5
SCE did not formally document a Root Cause evaluation for this event. SCE has scheduled preventative 6
inspection and repair for the other Peaker plants. 7
On July 23, 2016, the power supply to the generator protective relay system at the 8
McGrath Peaker failed. The power supply was promptly replaced with an on-hand spare, the relay 9
reprogrammed and tested, and the plant returned to service on July 24, 2016. Given the apparent nature 10
of the cause of the failure and required repair, SCE did not formally document a Root Cause evaluation 11
for this event. 12
On December 14, 2016, the SPRINT Control Valve on the Mira Loma Peaker 13
failed while in-service. The SPRINT system is designed to increase efficiency and power of the turbine 14
via injection of demineralized water into the engine either upstream of the low pressure compressor or 15
between the low pressure and high pressure compressors. The valve was replaced with an on-hand spare 16
and the plant returned to service on December 16, 2016. Given the apparent nature of the cause of the 17
failure and required repair, SCE did not formally document a Root Cause evaluation for this event. 18
During the Record Period planned outage durations were aggressively managed 19
and unexpected repairs were expedited to the extent possible, demonstrating that SCE managed its 20
Peaker facilities in a reasonable and prudent manner. 21
C. SCE Mountainview Generating Station Introduction 22
Mountainview is a two-unit (Units 3 and 4) combined cycle gas-fired power plant located in 23
Redlands, California. Units 3 and 4 have a combined total nominal capacity of 1,050 MW. Each unit 24
consists of two combustion turbines and one steam turbine, and produces approximately 525 MW. 25
Mountainview typically is operated as “intermediate duty” capacity, consistent with market 26
conditions and SCE’s LCD objectives. This means that the units are dispatched by the CAISO in a 27

63
manner that generally follows market prices and the ability of the plant to recover its variable costs. 1
Mountainview can thus generate at full load during higher-priced periods, and then reduce generation in 2
lower-priced periods. Compared with many other conventional thermal generating units, Mountainview 3
can start relatively quickly and is very fuel efficient. 4
Mountainview was originally owned by a wholly-owned subsidiary of SCE, Mountainview, LLC 5
(MVL). In D.09-03-025, the Commission ordered SCE to transfer ownership of Mountainview from 6
MVL to SCE, and also ordered that the Reliability and Heat Rate (i.e., Fuel Use Efficiency) Incentives 7
be retained with slight modification. These incentives were part of the Commission and FERC-8
approved Mountainview Power Purchase Agreement between MVL and SCE (MVL PPA). Ownership 9
was transferred in 2009 and, as a result, the MVL PPA was terminated. Since this transfer of ownership, 10
all of Mountainview’s capital and O&M costs recorded are recovered through SCE’s base rates, and the 11
fuel costs and incentive mechanism payments through the annual ERRA review proceedings. 12
In this chapter, SCE discusses Mountainview’s operations and recorded fuel costs for the Record 13
Period. Mountainview’s availability and heat rate incentives are based on actual plant performance 14
compared to target performance. Mountainview’s performance relative to these incentives is also 15
discussed in this chapter. 16
1. Mountainview’s Performance During the Record Period 17
As shown in Table IV-21, Mountainview Units 3 and 4 provided 4,900,355 MWh of 18
power during the Record Period (i.e., a capacity factor of approximately 53%). 19
Table IV-21 SCE Mountainview - 2016 Generation
Line No. Unit Net Generation (MWh)
1 3 2,334,6972 4 2,565,6583 TOTAL 4,900,355

64
2. Fuel Usage and Cost 1
During the Record Period the Mountainview units consumed 35,658,348 mmBtu of 2
natural gas at a cost of approximately $104.8 million. Table IV-22 below provides the monthly fuel 3
usage and fuel cost for the Record Period.63 4
Table IV-22 SCE Mountainview – 2016 Fuel Usage & Cost
Fuel is commonly the major operating cost component of gas turbine-based power plants 5
(like Mountainview) that burn natural gas and operate for significant time periods during the year. To 6
encourage fuel efficiency, the Mountainview PPA included a fuel efficiency (i.e., heat rate) incentive 7
program.64 The incentive was retained by the Commission in its decision in SCE’s 2009 General Rate 8
Case (GRC), D.09-03-025. The incentive requires that Mountainview conduct a test of its heat rate 9
63 Each monthly accounting entry for fuel cost includes a forecast of the cost expected to be incurred in that
month, as well as an entry which reconciles the prior month’s cost forecast with the prior month’s actual recorded cost. The cost data provided herein reflects this accounting practice and does not include fuel delivery (i.e., transportation) costs, while the fuel usage data provided herein is the actual fuel consumed as recorded at the end of each month.
64 Heat rate is a measure (in Btu per kWh) of the average amount of natural gas fuel consumed for each kWh of electricity produced, over a given period of time.
Line No. Month Usage (mmBtu) Cost ($000)1 January 3,780,793 10,2502 February 3,235,045 7,2513 March 2,698,966 5,1544 April 26,558 565 May 1,600,955 3,4916 June 3,306,669 9,6367 July 3,907,215 13,1208 August 4,445,248 13,9899 September 3,521,895 11,120
10 October 3,624,807 11,43311 November 2,104,661 5,94312 December 3,405,538 13,32513 TOTAL 35,658,348 104,767

65
twice a year.65 The test results are adjusted for variables beyond the control of Mountainview personnel, 1
such as weather and expected normal equipment degradation. The adjusted “as tested” heat rate is then 2
compared to the adjusted “as new” heat rate established when the plant first entered service in January 3
2006. The incentive provides for a bonus (or penalty) of 50% of the incremental fuel costs when the 4
tested heat rate is more than a 3% bandwidth above, or a 3% bandwidth below, the “as new” heat rate 5
(i.e., a total bandwidth of 6%). Specifically, SCE earns a bonus if the tested heat rate is less than 97% of 6
the “as new” heat rate, and conversely, SCE incurs a penalty if the tested heat rate exceeds 103% of the 7
“as new” heat rate.66 8
Consistent with prior years, the heat rate tests conducted for the Record Period showed 9
that Mountainview continued to operate within the 6% bandwidth. Therefore, during the Record Period, 10
Mountainview did not earn any heat rate incentive bonuses, and did not pay any heat rate incentive 11
penalties. This demonstrates excellent fuel efficiency performance, as it is not realistically possible to 12
achieve a 3% or more fuel efficiency improvement compared to the heat rate target that was established 13
when the plant was new. 14
3. Mountainview’s Reliability During the Record Period 15
Reliable operation is also an important objective for Mountainview. To encourage plant 16
reliability (measured as plant “availability”), Mountainview is subject to a reliability incentive program. 17
This incentive program was retained by the Commission in D.09-03-025 and upheld in SCE’s 2010 18
Record Period ERRA review proceeding (D.13-11-005). Mountainview availability is computed for 19
65 During this testing both units must be operating at full rated output, and the test takes several hours to
conduct. The tests are to be conducted each April and October, to determine the fuel efficiency performance (relative to the incentive) for each immediately preceding six month time period. When outages prevent the test from being performed during April and October, the testing is instead performed as soon as practical upon completion of the outage (i.e., typically within 30 days).
66 For example, if the April test revealed a lower heat rate (i.e., a better heat rate) that was 95% of the “as new” heat rate, then SCE would receive half of 2% (97% minus 95%) of its natural gas fuel cost as a bonus for superior heat rate performance. This 1% bonus would then be applied to the total cost of fuel for the proceeding “winter” (i.e., for the just-ended six month time frame of November through April). So, if that fuel cost was $200 million, then SCE would be awarded a bonus of $2.0 million. Likewise, results of the October test are applied to the just-ended “summer” time frame of May through October.

66
each summer and winter season, and is compared to a target value.67 The computation of Mountainview 1
availability is very similar to the computation of EAF, as discussed for the SCE Peakers. Like EAF, the 2
Mountainview availability computation is based on the hours of forced outages, scheduled outages, and 3
derates during a calendar year.68 4
Mountainview’s summer availability target is 97%, which is appreciably higher than the 5
winter target because the value of capacity is generally higher during summer. With such a high target, 6
routine maintenance outages are generally not scheduled for the summer. 7
The winter availability target varies between 92% and 79% as shown in Table IV-23. 8
The winter target incorporates expected planned outages for routine annual maintenance, including Hot 9
Gas Path Inspection (HGPI) overhauls and Major Inspection (MI) overhauls that are periodically 10
conducted on the gas turbines. During 2016, the winter availability incentive target was 85% because 11
GE performed combustion turbine upgrades on both units, which included the HGPI overhaul 12
workscope that was scheduled to be performed (i.e., these upgrades included all of the combustion 13
turbine overhaul work normally performed during an HGPI as well as additional combustion turbine 14
work).69 15
67 For the Availability Incentive, summer is defined as June through September, and winter is defined as
October through May. The availability incentive is administered on a calendar year basis. 68 Under the PPA, the availability computation also included Mountainview’s adherence to the hourly scheduled
output requested of it each day. In D.09-03-025, the Commission also approved a revision to the hourly scheduled output component of the availability calculation formula given that Mountainview is not being used as an hourly block-loaded resource. Rather, Mountainview plant output is routinely ramped up and down within and across each clock hour, in conjunction with LCD practices and in conformance with the current CAISO real-time market structure. In 2015, winter and summer availability were determined in accordance with the revision approved in D.09-03-025. This practice was discussed in detail in SCE’s 2010 Record Period ERRA review proceeding.
69 Pursuant to SCE's Contract Services Agreement with General Electric (GE), GE performs combustion turbine maintenance and other prescribed work, including periodic Hot Gas Path Inspection overhauls and Major Overhauls. The schedule for these overhauls is based on factored fired hours, or alternatively, number of start-ups (i.e., the overhaul is undertaken when whichever of these service limits - hours or start-ups - is first achieved).

67
Table IV-23 SCE Mountainview - Availability Targets
The summer availability annual incentive provides an award/penalty of $360,000 for each 1
percentage point of availability performance above/below the 97% target.70 The maximum annual 2
summer availability award/penalty is $1,080,000. To receive the maximum award SCE must attain 3
perfect summer performance (i.e., 100% availability), which is 3% higher than the 97% summer target. 4
The 3% is then multiplied by the bonus factor of $360,000 per percentage point, which yields a bonus 5
potential of $1,080,000. Conversely, to incur the maximum penalty of $1,080,000, SCE’s performance 6
would need to be at least 3% below the 97% summer target (i.e., 94% or lower). 7
Likewise, the annual winter availability incentive provides an award/penalty of $60,000 8
per percentage point of performance above/below the target. In theory, Mountainview could achieve a 9
winter availability of 100% in years where no overhauls were performed, and assuming no other planned 10
outages were taken that winter for routine annual maintenance. Achieving a winter availability of 100% 11
would be 8% higher than the 92% winter target implicit in such a scenario, which equates to a maximum 12
winter bonus of $480,000 (i.e., 8% multiplied by the $60,000 bonus per percentage point).71 The 13
availability incentive mechanism was therefore designed so that the maximum penalty is also $480,000 14
70 Unless otherwise indicated, all heat rate and reliability incentive amounts discussed in this section are in 2003
dollars. The incentive mechanism includes annual adjustment of these 2003 dollar amounts to account for inflation.
71 In a best case scenario, it would take several days of outage time to conduct either an HGPI or MI overhaul. Thus, it is not possible to achieve 100% winter availability if that work is conducted during the winter season. Also, because the summer availability incentive bonus rate is higher than the winter bonus rate, and because capacity prices are generally higher during the summer, it is not economic to conduct routine maintenance, including HGP inspections or major overhauls, in summer rather than winter.
Maximum Target Minimum Maximum Target Minimum1 Base (No Major Maint) 100% 97% 94% 100% 92% 84%2 HGPI (1 Unit) 100% 97% 94% 96% 88% 80%3 HGPI (2 Unit) 100% 97% 94% 93% 85% 77%4 MI (1 Unit) 100% 97% 94% 93% 85% 77%5 MI (2 Units) 100% 97% 94% 87% 79% 71%
Line No. Planned Maintenance Summer Winter

68
per winter season (i.e., if actual winter availability performance is more than 8% lower than the winter 1
target, then the bonus calculation uses a default value that is set at 8% below the target). 2
As shown in Table IV-24 below, Mountainview achieved a summer availability of 3
97.58% (bonus eligible) and recorded a winter availability of 70.40% (penalty). Thus, in aggregate, 4
Mountainview achieved a net Availability Incentive penalty of $353,748.10 (in $2016) for the Record 5
Period, including the inflation adjustment. A summary of the 2016 Mountainview Availability Incentive 6
calculations are provided in Appendix IV-A. The reason that the recorded winter availability was less 7
than the incentive target is explained below. 8
Table IV-24 SCE Mountainview - 2016 Availability
As shown in Table IV-25 below, during the Record Period Mountainview’s overall 9
(summer and winter combined) recorded EAF was 83.18% and FOF was 0.38%.72 As shown, the 10
recorded FOF for the record period was lower (i.e., better) than Mountainview's previous 5-year 11
average, and substantially better than Industry Average, demonstrating very good performance for the 12
record period. That is, Mountainview incurred very few unscheduled (i.e., forced) outage hours during 13
the record period. 14
72 Historical industry EAF and FOF performance data is provided in Appendices III-B though III-F. (Source
data was obtained from http://www.nerc.com/pa/RAPA/gads/Pages/Resports.aspx).
Line No. Summer Winter1 Target 97.00 85.002 Achieved 97.58 70.403 Variance 0.58 (14.60)

69
Table IV-25 SCE Mountainview – 2016 Reliability
While FOF performance was very good, the recorded EAF during the Record Period was 1
lower (i.e., not as good) as Mountainview's previous 5-year average, and was also slightly less than the 2
Industry average. This was because Mountainview underwent a substantial scheduled outage to perform 3
Advanced Gas Path (AGP) and Dry Low NOx 2.6 (DLN) Combustion Turbine Upgrades as part of the 4
scheduled Hot Gas Path Inspection (HGPI) overhauls. 73 As they involved significant additional work 5
and follow-on testing and control system tuning, these upgrades took longer to implement than a typical 6
HGPI overhaul would take. 7
The combustion turbine upgrades provide many benefits to SCE customers including 8
extending the interval between combustion turbine overhauls, an approximate 1.1% improvement (i.e., 9
betterment) in heat rate, a lower minimum MW operating point (i.e., lower turndown), and a faster MW-10
per-minute generator output ramp rate. The upgrade will also allow Mountainview to operate at its 11
1,072 MW maximum output transmission limit more frequently during each year; i.e., the upgrade 12
increases plant output by up to 48 MW depending on ambient temperature.74 13
73 The upgrades were performed on all four of the plant's combustion turbines; i.e., on both combustion turbines
on Unit 3 and Unit 4, respectively. Overlapping outages on Unit 3 and Unit 4 were required to achieve all of the planned outage work, which include other work in addition to the turbine work.
74 The station’s nominal rated output is 1,050 MW; however, actual maximum output varies above and below this figure depending on ambient weather, as is typical for combined cycle power plants. For example, plantmaximum output has been measured as low as approximately 985 MW during peak ambient temperatures. The 1,050 MW nominal figure reflects typical maximum output prior to the turbine upgrades.
(Continued)
Line No. SCE Industry SCE Industry
1 2011 96.12 84.02 0.37 2.492 2012 96.17 84.50 0.45 2.953 2013 87.36 85.49 2.91 2.774 2014 89.23 83.34 6.52 3.565 2015 96.07 84.80 0.66 2.206 Avg. 92.99 84.43 2.18 2.797 2016 83.18 Unavailable 0.38 Unavailable
Year EAF FOF

70
4. Outage Events 1
Since 2006 (the year Mountainview began operations), SCE has utilized the North 2
American Electric Reliability Corporation (NERC) GADS (Generating Availability Data System) to 3
track outage events (scheduled and unscheduled outages) at Mountainview. GADS was developed by 4
utility designers, operating engineers, and system planners to meet the information needs of the electric 5
utility industry. For this purpose, specific objectives for the GADS program were established: 6
compilation and maintenance of an accurate, dependable, and comprehensive database capable of 7
monitoring the performance of electric generating units and major pieces of equipment. The following 8
sections discuss outage events that occurred during the Record Period. 9
a) Scheduled Outages 10
Scheduled outages include planned and maintenance outages as well as planned 11
and maintenance outage extensions. Planned outages are typically scheduled at the start of each year. 12
For example, it is common to schedule planned outages in the spring to prepare for the summer peak 13
season, and in the fall to address issues observed during the summer peak season. During the course of 14
the year, maintenance outages are scheduled when needed to perform non-emergency repairs, typically 15
during a time better suited for the bulk power grid (e.g., on weekends). 16
During the Record Period Mountainview incurred four planned, zero planned 17
extensions, one maintenance, and zero maintenance outage extensions. Two of the planned outages that 18
occurred during the Record Period were initiated to perform the combustion turbine upgrades (and other 19
planned work) while the other two were initiated to perform annual fall maintenance activities. In all, 20
these four outages totaled approximately 3,100 outage hours. 21
Continued from the previous page
During the plant’s design, as part of the plant’s California Energy Commission approval process, the plant’s rating was determined to be 1,056 MW, based on its maximum design gross output at site average ambient weather conditions, minus its minimum sustainable auxiliary load. Actual auxiliary load varies based on, for example, gas pipeline pressure at the plant’s gas meter (i.e., a lower pressure requires the plant to run an additional gas compressor).

71
The single maintenance outage was a result of a sanitary sewage backup that 1
occurred in the Mountaiview Operations Control Room on September 22, 2016. The apparent cause of 2
the outage (classified as a maintenance outage because it did not require the immediate shutdown of the 3
units) was the failure of an automated float switch which controls sewage sump pump operation. 4
Evacuation of the operations control room (sewage backed up under the control room’s raised floor) was 5
required for cleanup and was completed on September 26, 2016. A root cause analysis has not been 6
completed for this outage. 7
b) Unscheduled Outage Events 8
During the Record Period the two generating units at Mountainview experienced 9
a combined total of three unplanned (i.e., forced) outages, totaling approximately 16 hours, none of 10
which exceeded a duration of 24 hours.75 11
During the Record Period, SCE managed its Mountainview facility in a 12
reasonable and prudent manner. Planned outage durations were aggressively managed and unexpected 13
repairs were expedited to the extent possible. 14
75 D.15-03-023 requires that SCE provide certain information in its annual ERRA Review Phase filings for
forced outages exceeding 24 hours, where the forced outage affected a generating unit with a rated capacity exceeding 25 MW, or affected multiple generating units at a given power plant having a combined capacity exceeding 25 MW.

72
V. 1
OTHER GENERATION 2
A. Catalina Diesel Fuel / Liquefied Propane Gas and Transportation 3
During the 2016 Record Period, SCE purchased 51,911 barrels of diesel fuel and burned 4
approximately 52,519 barrels of diesel fuel for electric generation on Santa Catalina Island. The average 5
total cost per barrel was $95.41, for a total cost of approximately $4.952 million. 6
SCE has 23 propane-fired combustion turbines, which for the Record Period used approximately 7
101,163 gallons of propane. The average total cost per gallon was $1.31 for a total cost of 8
approximately $0.133 million. Note: Table V-27 below reflects the “total” propane used for Santa 9
Catalina Island. In addition to using propane to produce electricity, propane is also used residentially for 10
cooking and heating. 11
Due to the isolated nature of Santa Catalina Island, limited storage capacity footprint and 12
complexity of delivery, diesel fuel and propane supply must be reliable and is of the utmost importance. 13
Therefore, rather than relying on an unstable spot wholesale diesel market, SCE purchases fuel from a 14
major supplier to meet ongoing demand for Santa Catalina Island. 15
In 2013, SCE negotiated a 3-year contract with California Fuels and Lubricant at the Oil Price 16
Information Services (OPIS) low, plus a supplier margin. After 2016, the terms for this contract allow 17
for yearly extensions for two consecutive years at SCE’s discretion. 18
Considering the contract structure (which is the lowest competitive pricing available) and the 19
integrity of the supply provided under the contract (which is essential to providing an uninterrupted 20
supply of utility services to Catalina Island) SCE’s fuel purchases for the Record Period should be found 21
reasonable. 22
On April 1, 2016, SCE executed a contract with California Fuels and Lubricant to additionally 23
provide truck and barge transportation from the Wilmington, California area refinery loading racks to 24
SCE’s Pebbly Beach Generation Station on Santa Catalina Island. This transportation service was 25
previously contracted with Seaway Company of Catalina. 26

73
The transportation cost for the truck and barge delivery was approximately $0.46 per gallon for 1
diesel and approximately $0.56 per gallon for propane during the 2016 Record Period. California Fuel 2
and Lubricants is a Commission-regulated common carrier and provides service to SCE at a bulk 3
wholesale rate that is less than the tariff rate normally charged for deliveries to the island. SCE’s costs 4
for diesel and propane fuel for the 2016 Record Period are summarized below in Table V-26 and Table 5
V-27. SCE’s diesel fuel, propane gas and transportation costs should be found reasonable. 6
Table V-26 Catalina Operations Diesel Fuel
2016 Recorded Delivered Diesel Costs
DateQuantity
(bbls)Commodity Cost(bbls)
Fuel Cost-Taxable Subtotal Subtotal
AB 32 Green House Fee Environ. fee
Fed Env Rec Fee
Avalon Taxes & CA Advance
Collection DSL Combined
Federal L.U.S.T Tax
CFL Barge Transport.
CostSeaway
Transport. CostCFL Freight Fee
(Delivery) Total Fuel CostTotal
Cost(bbls)
Jan-16 4937 $55.69 $274,930.41 $274,930.41 $704.96 $329.00 $393.94 $46,651.81 $207.34 $95,037.72 $418,255.18 $84.72
Feb-16 3736 $55.15 $206,046.25 $206,046.25 $533.58 $246.75 $298.17 $35,309.52 $156.93 $72,613.67 $315,204.87 $84.37
Mar-16 3912 $62.06 $242,787.81 $242,787.81 $558.65 $258.50 $312.20 $36,969.58 $164.32 $72,087.72 $353,138.78 $90.27
Apr-16 3550 $67.91 $241,091.04 $241,091.04 $507.00 $235.00 $283.32 $33,551.16 $149.14 $50,600.93 $15,105.00 $341,522.59 $96.20
May-16 4437 $68.74 $305,009.71 $305,009.71 $633.51 $293.75 $354.03 $41,925.22 $186.36 $65,857.32 $19,875.00 $434,134.90 $97.84
Jun-16 4426 $73.15 $323,777.34 $323,777.34 $632.03 $293.75 $353.17 $41,824.64 $185.90 $65,811.93 $19,875.00 $452,753.76 $102.29
Jul-16 4209 $66.68 $280,667.85 $280,667.85 $601.04 $293.75 $335.85 $31,533.18 $176.79 $62,692.77 $19,875.00 $396,176.23 $94.13
Aug-16 4995 $65.01 $324,718.39 $324,718.39 $713.35 $329.00 $398.66 $35,664.68 $209.80 $74,817.51 $23,055.00 $459,906.39 $92.07
Sep-16 5309 $69.16 $367,177.57 $367,177.57 $758.12 $352.50 $423.66 $37,905.75 $223.00 $79,617.12 $23,850.00 $510,307.72 $96.12
Oct-16 3720 $76.40 $284,222.07 $284,222.07 $531.16 $246.75 $296.82 $26,557.40 $156.22 $56,464.14 $16,695.00 $385,169.56 $103.54
Nov-16 3370 $73.46 $247,576.93 $247,576.93 $481.21 $223.25 $268.89 $24,060.27 $141.55 $50,535.39 $15,105.00 $338,392.49 $100.41
Dec-16 5310 $76.02 $403,668.33 $403,668.33 $758.28 $352.50 $423.71 $37,912.21 $223.03 $79,352.94 $23,850.00 $546,541.00 $102.93
Total 51911 $809.45 $3,501,673.70 $3,501,673.70 $7,412.89 $3,454.50 $4,142.43 $429,865.42 $2,180.38 $585,750.05 $239,739.11 $177,285.00 $4,951,503.48 $1,144.90
Averages $291,806.14 $412,625.29 $95.41

74
Table V-27 Catalina Operation Propane Fuel
2016 Recorded Delivered Propane Costs
B. SCE’s Solar Photovoltaic Program 1
1. Introduction 2
SCE owns and operates twenty-five UOG solar photovoltaic (SPV) facilities in its service 3
area. The twenty-five sites include one ground-mounted and twenty-four rooftop SPV facilities, ranging 4
in size from 0.5 to 8 MW AC (alternating current). The total size of SCE’s SPV fleet is 67.5 MW AC 5
(or 91.4 MW DC - direct current). Facility locations and rated capacity for each SPV facility is 6
summarized in in Table V-28 below. 7

75
Table V-28 SCE-Owned Solar PV Plants
As approved by the Commission on June 18, 2009, the goal of the program was to drive 1
installation costs down, improve technology and pricing of certain component parts, increase installation 2
efficiency, and improve installation methods for solar rooftop technology.76 In approving the SCE SPV 3
Program (SPVP), the Commission articulated that this program was “about driving the costs of 4
deploying an existing technology down by creating a new market opportunity.”77 5
76 D.09-06-049. 77 Id. at 53.
76
SCE believes the SPVP has significantly contributed to these objectives and 1
demonstrated in its 2015 GRC application78 that SPVP construction costs were below $3.85/Watt, 2
approximately half of typical industrial SPV installed cost when the program commenced.79 However, 3
gathering operational experience continues for both SCE and the SPV industry. At this time there is 4
only limited industry data upon which to compare SCE’s SPV plant performance. There is relatively 5
little published data on SPV power plant outage causes, such as on the various equipment failures that 6
can cause SPV plant outages and associated repair times. 7
While external performance comparisons are not readily possible, SCE believes that the 8
performance of the SCE-owned SPV plants during the Record Period was entirely reasonable. SCE 9
bases these conclusions on the fact that Record Period performance was consistent with SCE SPV 10
program forecasts and with prior years’ performance, and the outages that occurred were reasonable and 11
necessary to address equipment problems and safety concerns. 12
2. Overview of Solar PV Operations 13
a) Performance Monitoring 14
Rooftop and ground-mounted SPV facilities are distributed energy resources that provide 15
renewable energy. SCE has adopted capacity factor (CF) as a primary indicator of SPV plant and fleet 16
performance. Following the same convention as used by other types of power plants, SCE computes 17
SPV plant CF as the percentage of actual generation as compared to the theoretical maximum generation 18
that could be produced by a site (or by the entire fleet of sites) assuming the plant (or fleet) operated at 19
rated MW output for all hours of the year. SPV plants are essentially not capable of night-time 20
operation. Consistent with how other SPV operators appear to be reporting their statistics (i.e., to the 21
limited extent such statistics are available), the CF computations discussed include night-time hours in 22
the denominator. 23
78 2015 GRC A.13-11-003, SCE-02, Vol. 10. SCE’s capital expenditures for the construction of the 25 sites
were reviewed by the Commission in that proceeding. 79 See generally, SCE Solar Photovoltaic Program Testimony, A.08-03-015.

77
When the SPV Program was initiated, based on conversations with panel suppliers and 1
other research, SCE forecasted that, once constructed, the SCE-owned SPV would operate with a 20% 2
system capacity factor.80 During the Record Period, SCE-owned SPV plants recorded a capacity factor 3
of 18.2%. This is consistent with past performance as the SCE-owned SPV plants have recorded an 4
overall capacity factor of 19.1% from the inception of the program through 2016. Further discussion of 5
the recorded CF is provided later in this chapter. Immediately below we discuss various issues that 6
impact the recorded CF. 7
There is not yet a universally adopted industry-wide process for computing and reporting 8
SPV power plant production and reliability statistics.81 This complicates efforts to directly compare 9
SCE SPV operating statistics to those of other SPV operators. SCE computes CF using AC 10
measurements (i.e., on the distribution grid side of the inverter), whereas others might use DC 11
measurements (i.e. on the panel side of the inverter) which would yield a higher computed CF, as it 12
would not include the inherent efficiency losses caused by the plant’s inverters. 13
b) Routine Operations 14
Solar panels generate voltage shortly after sunrise each day, depending on the 15
factors affecting plant output as described below. At approximately 50% of the designed voltage of 16
each inverter (i.e., at approximately 300 volts DC), the inverter connects the panel array to SCE’s 17
electrical distribution system, while simultaneously converting the output from DC to AC. Likewise, as 18
the sunlight is reduced (e.g., at sunset) the inverters shut down, disconnecting the panels from the 19
distribution system. 20
80 See A.08-03-015, Solar Photovoltaic (PV) Program Testimony, March 27, 2008, Page 7, Line 23; and A.08-
03-015, Reply of Southern California Edison Company’s (U-338-E) to Responses or Protests of DRA, TURN, IEP, CAL SEIA, CCEnergy, Joint Solar Parties, Recurrent Energy, and A-1 Sun, Inc. May 8, 2008, Appendix B, “Declaration of Rudy Perez,” Declaration 3.
81 Power plant reliability and production statistics are reported by most US power plant operators using NERC GADS. GADS utilizes very precise definitions for the various statistics being reported. While it may in the future, at the current time GADS does not include reporting for SPV power plants. Therefore, a single uniform industry-wide SPV plant reliability and production statistical data reporting process and data base does not yet exist for SPV plants in the same manner as it exists via GADS for other power plant types.
78
c) Factors Affecting Output 1
SCE strives to ensure that the solar panels in its SPV facilities operate at the 2
highest efficiency possible. However, the amount of SPV generation capability is dependent on many 3
factors, several of which are beyond SCE’s control. These factors are explained below. 4
Time of year and available daylight hours: The time of year and associated daylight hours 5
affect the cumulative output of SPV projects. There are more daylight hours during summer 6
months than in the winter months, offering increased opportunity for the panels to generate 7
electricity. 8
Weather and cloud cover: Weather and varying degrees of cloud cover can also affect the 9
output of the SPV projects. SPV modules generate the most electricity on cool, sunny days, 10
and become less efficient as they heat up on hot days. Partially cloudy skies can also cause 11
rapid swings in solar facility output. 12
Changes in temperature: Changes in temperature can affect the generating efficiency of the 13
solar panels. Most SPV panels have a rating between 20 and 25 degrees Celsius (i.e., 14
between 68 and 77 degrees Fahrenheit). A panel’s generating efficiency decreases when the 15
air temperature surrounding the panel (known as ambient temperature) is warmer than the 16
panel’s rating. 17
Panel soiling: During extended periods without rain, the SPV panels become soiled with the 18
dust, emissions, and particulates that are in the air. This panel soiling can cause decreased 19
panel efficiency. 20
Panel age: The efficiency of SPV panels also degrades with age. Newly-installed panels will 21
generate electricity more efficiently than panels that have been operating for a number of 22
years. 23
Aerosol scattering: Aerosol scattering occurs when direct light from the sun passes through 24
small aerosol particles in the air. Aerosol particles can include dust, saltwater droplets, 25
smog, or smoke. The direct sunlight hits the particles and reflects off in many different 26
directions, becoming scattered light. SPV panels produce electricity most efficiently with 27

79
direct light. In inland areas where air pollution is more prevalent (and where all of SCE’s 1
SPV plants are located), aerosol scattering can have a degrading effect on the ability of 2
panels to generate electricity. 3
Maintenance Activities: Maintenance activities can temporarily hamper the panel’s ability to 4
produce electricity; however, performing required maintenance is necessary to keep the 5
panels functioning properly and to enhance the project’s power production efficiency over 6
the long term. SCE’s project maintenance schedule was established in accordance with 7
manufacturer recommendations. Maintenance activities also include performing plant 8
modifications that are needed in response to outages or similar events that occur as operating 9
experience is gained with this relatively new technology.82 One such modification was the 10
2013 installation of an Electrical Fault Protection Systems installed at the SCE SPV plants.83 11
d) Maintenance Program 12
SPV plants contain few moving parts and incur only a limited amount of 13
preventive maintenance. Routine preventive maintenance mainly consists of visual inspection of the 14
plant’s various components. Maintenance work load and costs are largely driven by needed repairs to 15
damaged or failed plant components that are discovered during these visual inspections or during 16
investigations of changes to normal operating parameters such as MW output. 17
3. SPV Generating Facilities’ Performance During the Record Period 18
SCE’s 25 SPV sites provided 107,929 MWh AC of energy during the 2016 Record Period. The 19
CF for the Record Period was 18.2%, compared to a recorded CF of 19.1% since project inception. As 20
described in Section 2.c of this chapter, recorded CF performance is affected by a number of factors, 21
including maintenance and repair outages that have occurred over the program’s lifetime. The following 22
82 While SPV panels have been manufactured for three or more decades, panel technology has continued to
evolve. Also, the use of such panels in medium-scale rooftop solar arrays, such as found in SCE’s SPV plants, is still relatively new. Relatively few medium-scale SPV plants (i.e., plants 1-2 MW in size) existed prior to the start of SCE’s SPV Program.
83 Discussed in A.14-04-006, ERRA Review of Operation, 2013, Exhibit SCE-01, Chapter I-VIII.
80
sections provide further discussion and statistics for these scheduled and forced outages during the 1
Record Period. 2
a) Outage Events 3
Table V-29 below summarizes outage information for the Record Period for each 4
SPV plant.84 Both scheduled outages and forced outages are included. SCE undertook no scheduled 5
outages during the 2016 record period. Forced outages were taken in response to equipment issues that 6
immediately tripped the plant off-line, or for similar needs that could not be significantly postponed.85 7
As shown, SCE's solar fleet incurred 31 forced outages exceeding 24 hours. Outage hours provided in 8
the table represent full site outages (no generation) where the outage duration was 24 hours or more. 9
84 Outage hours include night time hours even though the plant would not have been able to generate electricity
during those hours regardless of the outage. 85 This is typically defined as meaning the work cannot be postponed until the upcoming weekend or later, when
the need for or the cost of power might be lower, thereby reducing the potential impact of the outage.

81
Table V-29 SPVP 2016 Outages Exceeding 24 Hours in Duration
Work undertaken during scheduled for the Record Period outages, as well as the 1
causes and corrective actions for the outages, are discussed in more detail below. 2
(1) Scheduled Maintenance 3
Much of SCE's planned routine maintenance can be performed while the 4
plant is on line. Other routine maintenance is performed during scheduled outages, or when forced 5
outages for other reasons provide the opportunity to also perform routine maintenance requiring an 6
outage. As SCE has become more familiar with the maintenance requirements of these SPV systems, 7
maintenance personnel have adopted preventative inspection processes that limit scheduled outage 8

82
occurrences. These inspections usually include a visual inspection of all panels and electrical 1
connections, and inverter preventative maintenance which includes air filter replacement, vacuuming of 2
the inverter cabinet, checking and tightening all wire lugs, and conducting a thermal scan of the 3
components. When necessary, vacuuming of the inverter cabinet and the torqueing of electrical 4
connections requires a scheduled outage. SPV personnel have adopted the practice of performing 5
thermal imaging of the electrical connections while the inverter and panel array remain in service. 6
Loose connections appear as hot spots on the thermal image. For these instances, torqueing of the 7
connections can be addressed by scheduling an outage as necessary... 8
Additionally, inspections can often be performed when the site or inverter 9
circuit is offline for other maintenance reasons (e.g., during a forced outage taken for other needed 10
repairs). Assuming no significant repairs or plant modifications are needed, an inspections typically 11
requires less than eight hours. In some cases the inspection duration may exceed 24 hours. This can be 12
attributed to the size or configuration of a facility, building owner access requirements and the relative 13
distance of a facility to the SPVP base of operations and/or distance to other sites that may require more 14
immediate attention during an outage. 15
(2) Unscheduled Maintenance 16
Unscheduled maintenance, such as break down repairs, sometimes cause 17
or require a forced outage. As shown in Table V-29 above, in 2016 there were 31 forced outages that 18
exceeded 24 hours in duration (each), producing a combined total of approximately 4,021 outage hours. 19
All of these outages were associated with operation of the Electric Fault 20
Protection Systems (EFPS). In 2013, EFPS systems were installed at each site to protect personnel, 21
building and property where the rooftop SPV panels are installed. These installations were undertaken 22
in response to a fire which occurred at SPVP022 in 2011. The purpose of the EFPS is to sense current 23
changes in the SPV plant electrical circuits (i.e., as a means of detecting electrical shorts or faults to 24
ground, which can pose an electrical shock or fire hazard). When these current changes are sufficient, 25
the EFPS switches off power to the circuit (i.e., the circuit breaker is opened and the circuit, including 26
the associated inverter, is taken offline). 27

83
It is not always known what causes the ground faults. For some 1
occurrences, no apparent electrical deficiency is found with the SPV plant equipment or wiring. In those 2
cases, the system is reset and the inverter, or site, is returned to service. In many instances, the ground 3
fault trip can be directly attributed to rain, fog or high humidity days, as the moisture in the air can enter 4
the electrical circuitry and cause a temporary, partial electrical ground. SCE has explored, and made 5
adjustments to the sensitivity of the EFPS to reduce the number outages caused by electrical transients 6
that do not appear to pose a significant safety or fire risk. SCE will continue to monitor the causes of 7
these trips. However, SCE is highly committed to assuring SPV site safety and avoiding damage to the 8
third-party structures where the SPV panels are installed. As such, SCE expects that EFPS operation 9
could continue to be a significant cause of future SPV plant outages. 10
b) Summary 11
SCE’s SPV power plant fleet continues to perform at an overall capacity factor 12
that is near to or at what was predicted at the start of the program. Many of the forced outages during 13
the Record Period appear to be mainly the result of the installation of the additional electrical fault 14
detection equipment that was installed in 2013 to assure the continued safety of the SCE SPV plant host 15
building sites. SCE continues to gain experience through operation and maintenance of its SPV fleet. 16
This information is available to other parties, such as through the filing of this testimony, to help 17
advance SPV technology and deployment. SCE has effectively managed its SPVP generating units to 18
achieve appropriate system performance, and to support the continued advancement of SPV technology. 19
C. Fuel Cell Introduction 20
SCE’s Fuel Cell Program is a unique partnership between SCE and two California universities 21
for educational and demonstration purposes.86 The program consists of the installation and operation of 22
two utility-owned fuel cell generating facilities with a combined capacity of 1.6 megawatts (MW), and 23
which are located at the University of California Santa Barbara (UC Santa Barbara) and California State 24
University San Bernardino (CSU San Bernardino), respectively. 25 86 See D.10-04-028, p. 27.

84
1. UC Santa Barbara 1
The UC Santa Barbara fuel cell facility is a 200 kilowatt (kW) facility located on the 2
campus of UC Santa Barbara in Santa Barbara, California. This fuel cell uses a solid oxide fuel cell 3
technology manufactured by Bloom Energy (Bloom), and is an electric-only fuel cell. The Bloom fuel 4
cell converts natural gas to electricity, providing electricity to SCE’s local distribution electrical grid. 5
The unit has been operational since September 6, 2012. 6
2. CSU San Bernardino 7
The CSU San Bernardino fuel cell facility is a 1.4 MW facility located on the campus of 8
CSU San Bernardino in San Bernardino, California. This fuel cell uses a molten carbonate fuel cell 9
technology manufactured by Fuel Cell Energy (FCE). The FCE fuel cell converts natural gas to 10
electricity and heat, providing electricity to SCE’s local distribution electrical grid and heat for CSU San 11
Bernardino’s use in its campus heating operations. The unit has been operational since October 3, 2013. 12
D. Fuel Cell Performance During the Record Period 13
The two SCE Fuel Cell projects provided 8,359 MWh of energy during the Record Period as 14
shown in Table V-30. 15
Table V-30 SCE Fuel Cells - 2016 Performance
Note 1: The UCSB fuel cell is an electric-only fuel cell and does not provide any thermal output. 16

85
1. Fuel Usage and Cost 1
During the Record Period the SCE Fuel Cells consumed 77,683 MMBtu of natural gas at 2
a cost of $0.320 million. Table V-31 shows the monthly sums of fuel usage and cost for both fuel cell 3
projects.87 4
Table V-31 SCE Fuel Cell - 2016 Fuel Usage & Cost
2. Results of Operation 5
The Record Period capacity factors (i.e., for electrical generation only, relative to the 6
rated kW electrical output of the fuel cell) for the UC Santa Barbara and CSU San Bernardino 7
87 Each monthly accounting entry for fuel cost includes a forecast of the cost expected to be incurred in that
month, as well as an entry which reconciles the prior month’s cost forecast with the prior month’s actual recorded cost. The cost data provided herein reflects this accounting practice, while the fuel usage data provided herein is the actual fuel consumed as recorded at the end of each month.

86
generating facilities were 94% and 55%, respectively. No full site outages of 24 hours or greater were 1
experienced at the UC Santa Barbara facility in 2016. 2
The capacity factor for the CSU San Bernardino facility was primarily affected by the 3
poor performance of cells in a fuel stack (diagnosed in 2015) and the fall scheduled outage undertaken 4
to replace these cells. The scheduled outage to replace these cells accounted for 463 hours of the 592 5
total hours of the six scheduled outages in 2016. The remaining outage hours consisted of preventative 6
and miscellaneous maintenance. Also during the record period, there were two forced outage events, 7
totaling 66 hours related to issues with Power Conditioner Unit (PCU) chiller system. 8
SCE continues to work with the manufacturers and the host sites to study the use of fuel 9
cells in a distributed generation utility grid environment. The parties appropriately responded to the 10
limited number of outages incurred, by performing appropriate diagnosis and corrective repairs in a 11
reasonably expedited fashion. Relatively little data currently exists to compare the two SCE-owned fuel 12
cells with other similar fuel cell sites. SCE will continue to monitor and report on the operations of the 13
two fuel cells, and will share the results as part of the annual SCE ERRA proceeding, and through other 14
appropriate venues. 15
87
VI. 1
NUCLEAR GENERATION AND FUEL 2
A. Introduction 3
SCE owns 15.8% of Palo Verde Nuclear Generating Station (Palo Verde) Units 1, 2, and 3, 4
located approximately 50 miles west of Phoenix, Arizona. Arizona Public Service Company (APS) is 5
the operating agent for Palo Verde, which is the nation’s largest nuclear installation. The rated electrical 6
generating capacities of Palo Verde Units 1, 2, and 3 are 1,311 MWe, 1,314 MWe, and 1,312 MWe, 7
respectively. 8
This chapter sets forth Palo Verde Nuclear Generating Station (Palo Verde) generation and 9
nuclear fuel expenses incurred by SCE during the Record Period. In addition, this chapter also 10
summarizes SCE’s oversight responsibilities; the planning, procurement, and scheduling of nuclear fuel 11
materials and services; and the reasonableness of nuclear fuel material and services purchased by SCE 12
during the Record Period for its ownership share in Palo Verde. 13
B. SCE Oversight Responsibilities for Palo Verde 14
SCE participates in various committees at Palo Verde to oversee administration as described 15
below. 16
The Palo Verde Administrative Committee is chaired by an APS officer, the Executive Vice 17
President, Nuclear. The Administrative Committee also consists of other members as appointed by the 18
co-owner utilities. SCE’s member of the Palo Verde Administrative Committee is SCE’s Vice President 19
& Chief Nuclear Officer. The Palo Verde Administrative Committee meets quarterly to focus on 20
strategy and planning for the station. 21
The Palo Verde Engineering and Operations (E&O) Committee is responsible for final review 22
and approval of the annual O&M budget as prepared by APS; review of O&M budget status and 23
variance reports; review of recommended corrective actions to budget variances; and approval of those 24
actions as necessary. The E&O Committee also provides for oversight of engineering and plant 25
operations, and outage schedule review and approval. SCE’s Nuclear Finance Manager represents SCE 26
on the E&O Committee. SCE’s Manager actively participates in E&O Committee meetings discussing 27
88
and approving significant cost, schedule, and resource issues, and confirms that the development, 1
approval, monitoring, and control of the O&M budget is acceptable to SCE. The Palo Verde E&O 2
Committee typically meets eight times per year. SCE receives routine reports from Palo Verde and 3
reviews plant information at routine meetings, usually at the Palo Verde site or at APS headquarters in 4
Phoenix. 5
SCE also provides input and oversight of nuclear fuel purchases, audits, and decommissioning 6
funding through its involvement in other committees. 7
C. Types of Nuclear Outage Activities 8
1. Refueling and Maintenance Outages 9
A fossil-fueled unit can be refueled continually while it is operating, therefore, fossil unit 10
outages are scheduled around the necessity to do maintenance on the unit. In contrast, a nuclear unit can 11
only be refueled when it is offline. After a nuclear unit is refueled, it contains a finite quantity of fuel to 12
consume during that fuel cycle before it must again be refueled. The forecasted rate of consumption for 13
this quantity of fuel determines the scheduling of the next refueling outage. Maintenance work that is 14
required to be performed while a nuclear unit is offline is performed during scheduled refueling outages 15
(RFOs). 16
Planning the duration of each RFO is a complex task. Every RFO has work activities that 17
are similar in scope and outage time requirements including: (1) shutdown and cooldown of the reactor; 18
(2) disassembly of the reactor; (3) fuel replacement; and (4) reassembly of the reactor, followed by 19
heatup and startup of the plant. During these periods, scheduled maintenance is conducted, surveillance 20
tests88 are performed, and plant modifications are completed. Because the three Palo Verde units do not 21
shut down routinely for non-refueling outages (as do fossil fueled units when maintenance is required), a 22
great deal of maintenance work is planned for these RFOs. 23
88 These tests are required by Nuclear Regulatory Commission (NRC)-approved technical specifications.

89
2. Forced Outage Activities 1
When an unplanned or forced outage to a nuclear unit occurs, the primary objective is to 2
repair the item that led to the outage. While minimizing the outage period is important, a certain amount 3
of work is required for every forced shutdown. This includes surveillance testing and complying with 4
all regulatory requirements and emergent maintenance requirements that cannot be deferred to a later 5
planned outage. 6
D. Palo Verde Record Period Performance 7
1. Palo Verde Generation 8
The Capacity Factor (CF), Equivalent Availability Factor (EAF), Forced Outage Factor 9
(FOF), and net generation for the Record Period for Palo Verde Units 1, 2, and 3 are shown in the Table 10
VI-32 and Table VI-33. As shown in Table VI-32, Palo Verde Units 1, 2, and 3 generated 32,243,117 11
MWh of energy during the Record Period, with an average combined CF of 93.2%. This was the fourth 12
highest combined capacity factor in Palo Verde’s history.89 SCE’s share of the generation output was 13
5,094,412 MWh. 14
Table VI-32 2016 Record Period Generation
89 The Palo Verde site capacity factors for 2015 and 2014 were 94.3% and 93.7%, respectively. These were
the two highest site capacity factors in Palo Verde’s history. The Palo Verde site capacity factor for 2002 was originally calculated as 94.4%. However, APS subsequently determined that the Palo Verde site capacity factors from 1999 to 2004 were overstated by approximately 1% due to a feedwater flow error. Consequently, the 2002 Palo Verde site capacity factor was revised to 93.4%, the third highest in Palo Verde’s history.
LineNo.
PaloVerdeUnit
CapacityFactor
GenerationMWh(Net)
1 1 87.4% 10,068,7402 2 101.3% 11,696,9513 3 90.9% 10,477,4264 Site Avg 93.2% 10,747,706
5,094,412SCE's 15.8% Share

90
As previously stated in Chapter III Hydroelectric Generation, the EAF considers 1
scheduled outages and forced outages. The ideal percentage is as high a level as possible. The FOF is 2
calculated using the hours that the generating unit was forced off-line. The ideal percentage is as low as 3
possible. The EAFs and FOFs for five years of plant generation for Palo Verde are shown in Table VI-4
33 and as shown, Palo Verde’s five-year averages for both factors were better than the industry 5
averages.90 6
Table VI-33 EAF and FOF Palo Verde Generation
Table VI-34 shows that for the Record Period, Palo Verde Unit 2 generated 1,133,079 7
MWh more than the five-year average, and Palo Verde Units 1 and 3 generated a combined amount of 8
786,187 MWh less than the five-year average. 9
90 Table VI-33 includes revised 2014 and 2015 EAF and FOF values for Palo Verde, as submitted by Arizona
Public Services Company. The industry values were obtained from the NERC GADS database for Pressurized Water Reactor plants greater than 1,000 MW.
Line No. Year Palo Verde Industry Palo Verde Industry1 2011 88.90 88.44 0.90 1.362 2012 90.40 82.53 0.86 7.063 2013 89.30 89.23 1.03 4.554 2014 91.66 89.34 0.61 1.415 2015 92.21 89.95 0.00 1.086 5 Year Avg. 89.76 88.25 0.78 3.137 2016 91.44 Unavailable 0.82 Unavailable
EAF FOF
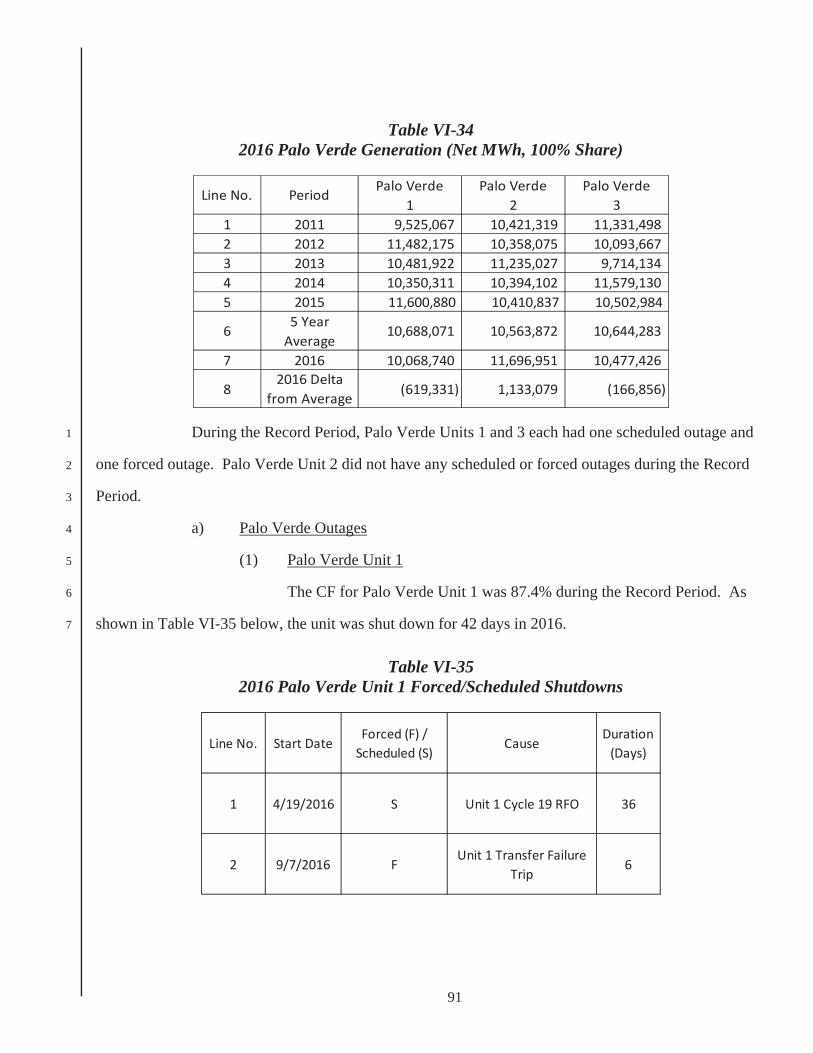
91
Table VI-34 2016 Palo Verde Generation (Net MWh, 100% Share)
During the Record Period, Palo Verde Units 1 and 3 each had one scheduled outage and 1
one forced outage. Palo Verde Unit 2 did not have any scheduled or forced outages during the Record 2
Period. 3
a) Palo Verde Outages 4
(1) Palo Verde Unit 1 5
The CF for Palo Verde Unit 1 was 87.4% during the Record Period. As 6
shown in Table VI-35 below, the unit was shut down for 42 days in 2016. 7
Table VI-35 2016 Palo Verde Unit 1 Forced/Scheduled Shutdowns
Line No. Period Palo Verde1
Palo Verde2
Palo Verde3
1 2011 9,525,067 10,421,319 11,331,4982 2012 11,482,175 10,358,075 10,093,6673 2013 10,481,922 11,235,027 9,714,1344 2014 10,350,311 10,394,102 11,579,1305 2015 11,600,880 10,410,837 10,502,984
65 YearAverage
10,688,071 10,563,872 10,644,283
7 2016 10,068,740 11,696,951 10,477,426
82016 Delta
from Average (619,331) 1,133,079 (166,856)
Line No. Start DateForced (F) /Scheduled (S)
CauseDuration(Days)
1 4/19/2016 S Unit 1 Cycle 19 RFO 36
2 9/7/2016 FUnit 1 Transfer Failure
Trip6

92
(a) Unit 1 Cycle 19 RFO91 1
Palo Verde Unit 1 was manually shut down for a scheduled 30-day 2
RFO on April 9, 2016. This was a typical spring outage. In addition to routine RFO activities such as 3
offloading and loading fuel, the work included scheduled preventative maintenance tasks on the 4
primary, secondary, and electrical systems. The outage also included, but was not limited to: (1) 5
control element assembly (CEA) and CEA coil stack replacements; (2) steam generators 1 & 2 and 6
letdown heat exchanger eddy current testing; (3) shutdown cooling isolation valve and heat exchanger 7
repairs; (4) pressurizer bottom head and surge line inspections; (5) low pressure turbine “B” inspection; 8
(6) main turbine valve inspections; and other equipment repairs and replacements. 9
APS completed the Palo Verde Unit 1 Cycle 19 RFO in 36 days, 10
six days longer than scheduled. The six-day outage extension was primarily attributed to: (1) Shutdown 11
Cooling Isolation Valve 651 replacement; (2) Equipment Issues with Polar Crane and Refueling Machine; 12
(3) Reactor Coolant Solid particulate levels; and (4) damage to fuel assembly P1318Y. Upon completion of 13
the planned and emergent refueling and maintenance activities, APS synchronized the Unit to the grid 14
on May 14, 2016. APS then took the turbine off-line to conduct main turbine overspeed testing, and re-15
synchronized the Unit to the grid the same day. 16
(b) Unit 1 Transfer Failure Trip92 17
On September 7, 2016, a fire protection sprinkler head broke and 18
sprayed approximately 300 gallons of water onto a load center. The Control Room received a hard 19
ground indication on the load center control power bus. Operators observed that a pressurizer spray 20
valve was stuck partially open, lowering reactor coolant system pressure. After operators unsuccessfully 21
attempted to close the valve in accordance with the applicable procedure, they manually tripped the 22
plant at 9:32 p.m. due to decreasing pressurizer pressure. Troubleshooting efforts determined that the 23
pressurizer spray valve failed open. The direct cause of this unit trip was a failed booster in the valve 24
91 The NERC Cause Code for the Unit 1 Cycle 19 RFO is 2070. 92 The NERC Cause Code for the Unit 1 Transfer Failure Trip outage is 3649.

93
positioner path. At 9:15 a.m. on September 13, 2016, after the booster was replaced and tested, the unit 1
was re-synchronized to the grid. 2
(2) Palo Verde Unit 2 3
The capacity factor for Palo Verde Unit 2 was 101.3%93 during the Record 4
Period.94 The unit was not shut down during the Record Period. 5
(3) Palo Verde Unit 3 6
The capacity factor for Palo Verde Unit 3 was 91.4% during the Record 7
Period. As shown in Table VI-36 below, the unit was shut down for 31 days in 2015.95 8
93 The capacity factor is calculated using the nameplate rating. Some units, however, routinely generate slightly
more energy than the nameplate rating. When a unit’s generation during a period exceeds the nameplate rating, it results in a capacity factor greater than 100%.
94 Palo Verde Unit 2 ranked first in the United States for electrical generation (MWh) from January 1, 2016 through September 30, 2016. See the U.S. Department of Energy, Energy Information Administration (EIA) U.S. Nuclear Generation and Generating Capacity, Capacity and Generation by State and Reactor Report “2016 P,” available at https://www.eia.gov/nuclear/generation/ [as of March 24, 2017].
95 Palo Verde Unit 3 ranked third in the United States for electrical generation (MWh) from January 1, 2016 through September 30, 2016. Id.

94
Table VI-36 2016 Palo Verde Unit 3 Forced/Scheduled Shutdowns
(a) Unit 3 Main Turbine Trip96 1
At 2:34 p.m. on September 19, 2016, the Palo Verde Unit 3 main 2
turbine tripped with the unit operating at 100% power. A reactor power cutback occurred as designed, 3
and investigations into the cause of the main turbine trip began. The investigation identified that all four 4
undervoltage trip relays (two on each redundant train) on the Control Element Drive Mechanism Control 5
System (CEDMCS) actuated simultaneously at 2:34:19 p.m., and cleared approximately one second 6
later. During walkdowns of the related components, Palo Verde operations and engineering personnel 7
observed expected voltage and current control for the then-unloaded state of the equipment. No unusual 8
conditions were noted during initial non-intrusive trouble-shooting, which included voltage checks on 9
the two associated motor-generators (MGs) and detailed visual and thermographic inspections of the 10
MG control cabinet internal components. Palo Verde, therefore, developed a trouble-shooting plan and 11
fault tree, which identified the most likely fault sources as the exciter diode bridges, excitation supplies, 12
and voltage regulators. 13
To implement the trouble-shooting plan, Palo Verde shut down 14
both MGs and replaced the high likelihood components on each train. No visual indications of problems 15
96 The NERC Cause Code for the Unit 3 Main Turbine Trip outage is 2152.
Line No. Start DateForced (F) /Scheduled (S)
CauseDuration(Days)
1 9/19/2016 F Unit 3 Main Turbine Trip 3
2 10/8/2016 S Unit 3 Cycle 19 RFO 28

95
were apparent on the components that were replaced. The Palo Verde electronic restoration team (ERT) 1
then performed detailed analyses of each component. During these analyses, the ERT identified failed 2
solder joints on one of the voltage regulators. These failed solder joints were determined to have caused 3
the spurious voltage fluctuation that resulted in the main turbine trip. Upon identification of the root 4
cause of the main turbine trip, the unit was re-synchronized to the grid at 3:02 a.m. on September 23, 5
2016. 6
(b) Unit 3 Cycle 19 RFO97 7
Palo Verde Unit 3 was manually shut down for a scheduled 30-day 8
RFO on October 8, 2016. This was a typical fall outage. Besides routine RFO activities such as 9
offloading and loading fuel, the work included scheduled preventative maintenance tasks on the 10
primary, secondary, and electrical systems. The outage also included, but was not limited to: (1) reactor 11
coolant pump “1B” motor, primary seal, and thrust bearing replacement; (2) shutdown cooling “B” heat 12
exchanger eddy current testing; (3) pressurizers “E” and “F” main spray valve refurbishments; (4) low 13
pressure turbine “A” inspection; (5) main turbine valve actuators inspections and overhauls; (6) 14
circulating water pump “A” replacement; (7) cooling tower center column modifications and mechanical 15
seal replacement; and other equipment repairs and replacements. 16
APS completed the Palo Verde Unit 3 Cycle 19 RFO in its 17
scheduled duration of 28 days and 17 hours, the shortest RFO duration for any Palo Verde unit. Upon 18
completion of the planned refueling and maintenance activities, APS synchronized the Unit to the grid 19
on November 5, 2016. APS then took the turbine off-line to conduct main turbine overspeed testing, 20
and re-synchronized the Unit to the grid the same day. 21
97 The NERC Cause Code for the Unit 3 Cycle 19 RFO is 2070.

96
E. Nuclear Fuel Expense 1
1. Overview 2
Nuclear fuel expenses incurred during the Record Period are dictated by unit operations 3
and previous purchases of nuclear fuel materials and services. The nuclear fuel materials and services 4
purchased during the Record Period are described in Section F of this chapter. The generation and fuel 5
expense data related to Palo Verde are summarized in and discussed in Section D.2 of this chapter. 6
SCE’s share of nuclear fuel utilized at Palo Verde produced a net electrical generation of 5,094 7
gigawatt-hours (GWh) at an overall fuel expense of $49.0 million, equivalent to $9.61/MWh. 8
Table VI-37 Nuclear Fuel Energy Production and Expense98
2. Generation Related Nuclear Fuel Expense 9
a) Palo Verde Generation Related Expenses 10
Palo Verde Units 1, 2, and 3 nuclear fuel expenses for the Record Period were related to 11
both generation and non-generation expenses. Two Palo Verde units experienced refueling outages 12
during the Record Period. Palo Verde Unit 2 was in Cycle 20 through the entire Record Period. 13
Palo Verde Unit 1 was in Cycle 19 until April 9, 2016, when it began its 19th refueling, 14
returning to service May 14, 2016, and operating thereafter in Cycle 20 through the end of the Record 15
Period. Palo Verde Unit 3 was in Cycle 19 until October 8, 2016 when it began its 19th refueling, 16
returning to service November 5, 2016 and operating thereafter in Cycle 20 through the end of the 17
Record Period. 18
The generation-related fuel expense related to SCE’s 15.8% ownership interest in Palo 19
Verde was $49.0 million. This included $0.0 million for the permanent disposal of used nuclear fuel 20
paid to the DOE as mandated by the 1982 Act. The 1982 Act set a one mil/KWh fee, adjusted for 21
98 Does not include monthly non-generation-related expenses.
Line No. Station GWh $Millions $/MWh1 Palo Verde 5,094 49 9.61

97
system transmission losses, to be collected from utilities. On May 9, 2014, DOE notified APS that as of 1
May 15, 2014, the Spent Nuclear Fuel Disposal Fee would be 0.0 mil per kilowatt hour (0 M/kWh) of 2
electricity generated and sold. The 0.0 M/kWh DOE fees were included for the Record Period. This 3
also included a one-time correction of the costs associated with Unit 1 Cycle 16. The cost of the 4
uranium and conversion components of the fuel expensed as part of the Unit 1 Cycle 16 batch transfer 5
from inventory to in-reactor for amortization were not included in the original transfer. An additional 6
$8.1 million was included in the 2016 Palo Verde nuclear fuel expense for this Record Period. 7
3. Non-Generation-Related Expenses 8
During a reactor refueling, depleted fuel assemblies are removed from a reactor core and 9
replaced with new fuel assemblies. Since the depleted assemblies are highly radioactive, they must be 10
stored in a manner that isolates them from the environment. The DOE retains the ultimate responsibility 11
for the permanent disposal of high-level radioactive waste and used nuclear fuel under the authority of 12
the 1982 Act. Until DOE implements a program for the disposal of used fuel, utilities must provide 13
interim used fuel storage. After the DOE licenses and constructs facilities for the storage and permanent 14
disposal of used fuel, the used fuel being stored on an interim basis will be transferred to the DOE for 15
disposition. Interim storage is being provided for Palo Verde Units 1, 2, and 3 in their respective used 16
fuel pools and at the Palo Verde ISFSI located on-site. 17
SCE’s share of non-generation-related expenses during the Record Period for Palo Verde 18
totaled ($0.1) million for a dry cask storage system to store used fuel assemblies at the Palo Verde ISFSI 19
located on-site. This included a credit from funds from the DOE spent fuel litigation damages award. 20
F. Nuclear Fuel Purchases 21
Nuclear fuel management consists of a sequence of activities involving the procurement and 22
scheduling of materials and services required to manufacture nuclear fuel assemblies suitable for a 23
nuclear power plant and the disposal of used fuel assemblies after their discharge from the reactor. 24
These activities described below encompass: (a) mining and milling of natural uranium concentrates 25
(U3O8), (b) conversion to uranium hexafluoride (UF6), (c) enrichment, (d) design and fabrication of fuel 26
assemblies, and (e) interim storage and permanent disposal of used nuclear fuel discussed in Section D.3 27

98
of this chapter. Scheduling materials and services required to manufacture finished fuel assemblies 1
when needed is a critical aspect of managing SCE’s nuclear fuel supply. Table VI-38 presents typical 2
scheduling lead times established by contract terms and SCE’s practices for reload batches.99 3
Table VI-38 Typical Reload Nuclear Fuel Procurement Schedule – Months
The scheduling begins by establishing the scheduled shipment date for the last fuel assembly and 4
then determining the lead-time required for each stage. The discussion below begins with the earliest 5
process (the purchase of natural uranium concentrates), and works forward. 6
1. Natural Uranium Concentrates U3O8 7
To begin the overall manufacturing process, Palo Verde’s general practice is to have the 8
U3O8 required for a reload batch in inventory or under contract to be delivered to a conversion facility 9
during the six-month period before conversion to UF6. This ensures that the U3O8 will be at the 10
converter in time to meet converter contractual requirements. The minimum decision-making period for 11
uranium procurement is about one year prior to its delivery for conversion where uranium is not already 12
99 Nuclear fuel assemblies loaded together into the core of a nuclear generating unit at the beginning of an
operating cycle and later removed together at the end of their operating life are referred to as a batch. At the conclusion of each operating cycle, one or more batches of fuel are discharged and the fuel assemblies in the remaining batches are relocated within the reactor core. A batch typically remains in the reactor for at least two cycles. A fuel cycle begins with a unit’s return to operation following a refueling and maintenance outage.

99
under contract. With long-term uranium supply contracts, the actual planning and procurement process 1
may have taken place many years prior to the scheduling of deliveries under the contract. Requirements 2
planning and procurement activity, including contract negotiation, must precede delivery. 3
2. Conversion 4
The conversion process converts impure U3O8 into high purity uranium hexafluoride 5
(UF6 ) suitable for the uranium enrichment process. U3O8 can be delivered to the converter two days to 6
two months prior to UF6 delivery, depending on contract provisions.100 Conversion of U3O8 to UF6 is 7
available in the United States only from the ConverDyn plant near Metropolis, Illinois. Outside the 8
United States, conversion service is available from two suppliers: Cameco in Canada, and Comurhex 9
(Areva) in France. Material may be purchased as UF6 (purchasing both the U3O8 and conversion 10
services as one) from many sources, such as conversion suppliers, brokers, and others. 11
3. Enrichment 12
Uranium as found in nature consists principally of two isotopes, U-235 and U-238. The 13
fission of the U-235 isotope is the primary heat source in the nuclear reactor. Natural uranium contains 14
only 0.711% of U-235 by weight; however, most nuclear power plants are designed to use nuclear fuel 15
containing uranium having approximately 3-5% U-235. The enrichment process is therefore necessary 16
to increase the concentration of the U-235 isotope to 3-5% as required by the fuel design. Natural 17
uranium feed UF6 is typically delivered to the enrichment facility two days to four months prior to 18
enriched UF6 delivery to the fabrication facility. Services to enrich UF6 from the natural state to the 19
required design enrichment is available in the United States from Louisiana Energy Services (LES), and 20
in Europe from Urenco and Areva. The enrichment process is measured in separative work units 21
(SWU). Enrichment services may be purchased with the UF6 as enriched uranium product (EUP). 22
100 U3O8 must be provided at the converter at least two months prior to UF6 delivery to the enrichment facility if
the U3O8 requires weighing, sampling, and analysis. A two-day lead-time results if a book transfer is made at the conversion facility. A book transfer may occur if weighing, sampling and analysis of the supplier U3O8 have been previously performed and only a material title change from the supplier’s account to SCE’s account at the conversion facility is required.

100
4. Design and Fabrication 1
Fuel fabrication is the last step in the manufacturing process. The enriched UF6 is 2
delivered to the fabricator who converts it to enriched uranium dioxide (UO2) pellets, provides fuel rod 3
blanks and other necessary hardware, assembles the rods containing UO2 pellets into fuel assemblies, 4
and delivers the finished fuel assemblies to the plant site. Enriched UF6 can be delivered to the 5
fabricator on the date the last fuel assembly is delivered to the plant site, or up to five months earlier, 6
depending on contract provisions. 7
Nuclear fuel must meet the operating requirements of each operating cycle. The fuel 8
fabricator or the utility is responsible for the reactor core design of new fuel batches to be loaded into 9
the reactor core at the start of each operating cycle. APS provides the reactor core design for Palo 10
Verde. Reactor core design establishes the number of fuel assemblies for the new batches, the U3O8, 11
conversion and enrichment required, and the configuration of the reactor core with both the old and new 12
fuel batches. Fuel fabrication services for Palo Verde are available in the United States from 13
Westinghouse and Areva. 14
G. Palo Verde Nuclear Fuel Purchases 15
1. Uranium Purchases 16
During the Record Period, SCE purchased 126,621 pounds of U3O8 for SCE’s share of 17
Palo Verde requirements under contracts with MTM Trading, Areva, Itochu and Cameco, dated August 18
18, 2010; August 20, 2010; February 8, 2007; and December 10, 2010; respectively. These contracts 19
were awarded after competitive bidding with deliveries beginning in 2009. Due to advantageous market 20
conditions, an additional 79,000 pounds of U3O8 for SCE’s share was purchased on the spot market. 21
2. Conversion to and/or Purchase of UF6 22
During the Record Period, SCE purchased 39,500 KgU of conversion services for SCE’s 23
share of Palo Verde requirements under contracts with ConverDyn dated December 7, 2007. SCE also 24
purchased 92,525 KgU as UF6 (U3O8 and conversion services together) for SCE’s share of Palo Verde 25
requirements under a contract with Cameco dated August 18, 2008 and Areva dated August 20, 2010. 26
These contracts were awarded after competitive bidding with deliveries beginning in 2009. In addition, 27

101
due to favorable market conditions, “one-time” purchases were made through broker/traders. An 1
additional 31,600 KgU as UF6 was purchased on the spot market. 2
3. Enrichment and EUP 3
During the Record Period, SCE purchased 82,901 SWU for SCE’s share of Palo Verde 4
under an enrichment uranium supply contract with Urenco, and LES, dated March 24, 2010; and April 5
17, 2007; respectively. The contracts were awarded after competitive bidding with deliveries beginning 6
in 2011. Additional “one-time” purchases of 6320 SWU were made through a broker/trader. 7

102
VII. 1
CONTRACT ADMINISTRATION AND COSTS 2
A. Introduction 3
The Commission has provided guidance on what it expects from the utility when reviewing 4
energy contract administration, and on the scope and nature of such reviews. As used in this chapter, the 5
term “contract administration” means activities implementing the exercise of contract rights and 6
performing contract obligations subsequent to contract execution by SCE. The administration and 7
management of these contracts is explained throughout this chapter, which is separated into sections 8
based upon the following resource categories: (1) Conventional and Natural Gas Products; (2) Public 9
Utility Regulatory Policies Act of 1978 (PURPA) and Combined Heat and Power (CHP); (3) 10
Renewables Portfolio Standard (RPS); and (4) Behind-The-Meter (BTM) Contracts. Prior to 11
highlighting contract administration and management activities, context of the different resource 12
categories is provided below. 13
1. Conventional and Natural Gas Products 14
SCE defines conventional energy contracts as contracts with, or related to, non-CHP 15
fossil-fired, thermal resources including tolling agreements or Power Purchase Agreements (PPAs), 16
physical or financial structured commodity transactions (e.g. commodity transactions other than trades), 17
contracts for fuel or electricity transportation, storage (ES) contracts, resource adequacy (RA) contracts, 18
demand response and contracts that do not fit exclusively into the PURPA, CHP, RPS or BTM buckets. 19
Conventional contracts were entered into either prior to the passage of Assembly Bill (AB) 57,101 after 20
the passage of AB 57102 under the procurement authority granted to SCE through its then-applicable 21
Commission-approved procurement plan, through various SCE requests for offers (RFOs), or through 22
bilateral transactions outside of the Commission-approved procurement plan for which SCE seeks 23 101 Inter-utility contracts that SCE entered into with other utilities prior to re-entering the procurement role on
behalf of bundled service customers on January 1, 2003 are often referred to as legacy agreements. 102 All new transactions are reviewed in SCE’s quarterly compliance report (QCR) advice letter filings or through
a separate advice letter or application to the Commission for pre-approval.

103
separate Commission upfront approval. In addition, SCE has Master Agreements under which power, 1
natural gas, resource adequacy capacity, transmission, emissions and financial hedging transactions 2
(most short-term),103 are executed under SCE’s Commission-approved procurement plan. 3
2. PURPA and CHP 4
SCE also administers PPAs entered into under the Commission’s implementation of 5
PURPA.104 The generating facilities that are subject to these PPAs are referred to as qualifying facilities 6
(QFs) within the meaning of PURPA, and consist of either small power producers that are fueled by 7
renewable resources, or cogeneration facilities as defined in PURPA. Most PPAs are “standard offer” 8
contracts approved by the Commission, including: Standard Offer 1 (SO1); Standard Offer 2 (SO2); 9
Standard Offer 3 (SO3); and Interim Standard Offer 4 (ISO4 or SO4) contracts. In addition, SCE has 10
entered into “nonstandard” or negotiated (NEG) contracts with QFs, usually based on a standard offer, 11
which have been approved by the Commission. 12
Since November 2011, SCE administers PPAs entered into under the CHP Program 13
Settlement Agreement (CHP Settlement or QF Settlement), adopted by the Commission in Decision (D.) 14
10-12-035. The CHP Settlement developed a State CHP Program with the intent of transitioning from 15
the prior PURPA program to a market-based, state-administered program for CHP projects above 20 16
MW. This program is governed by a set of provisions referred to as the CHP Settlement Term Sheet. 17
One of the conditions precedent to the implementation of the CHP Settlement was that the Federal 18
Energy Regulatory Commission (FERC) terminate the California Investor Owned Utilities’ (IOUs) 19
PURPA must-take obligation under §210(m), as modified by the Energy Policy Act of 2005,105 for QFs 20
103 SCE considers short-term transactions to be those with delivery terms up to and including one quarter in
duration and up to one quarter forward. 104 Public Law No. 95-617 (Nov. 9, 1978), 92 Stat. 3117, available at
https://www.gpo.gov/fdsys/pkg/STATUTE-92/pdf/STATUTE-92-Pg3117.pdf. 105 Public Law No. 109-58 (Aug. 8, 2005), 119 Stat. 594, available at https://www.gpo.gov/fdsys/pkg/PLAW-
109publ58/pdf/PLAW-109publ58.pdf.

104
above 20 MW. On June 16, 2011, FERC granted the California IOUs §210(m) application to terminate 1
the PURPA must-take obligation for QFs above 20 MW.106 2
The CHP Settlement provided a path for CHP resources above 20 MW to obtain PPAs in 3
the absence of the IOU’s PURPA must-take obligation, and also established a PURPA QF Standard 4
Offer Contract (QF SOC) for QFs 20 MW or less. The CHP Settlement created market-based 5
agreements for CHP projects. One agreement is a Standard PPA signed under the CHP Settlement’s 6
RFO process (CHP RFO PPA). A second, less common procurement process for CHP is bilateral 7
negotiations, which result in PPAs based on, but not identical to, the CHP RFO PPA (CHP Bilateral 8
PPA). These CHP RFO and CHP Bilateral contracts are not PURPA contracts but rather a result of a 9
collaborative effort between the IOUs and the CHP parties through the CHP Settlement. Additionally, 10
qualifying CHP projects of 20 MW or less are eligible to execute a tariff contract, at any time, pursuant 11
to Assembly Bill (AB) 1613107. Similar to the QF SOC, the AB 1613 program and its associated 12
contracts are administered per the requirements of PURPA, which remains in effect in California for 13
QFs of 20 MW or less.108 14
3. RPS 15
SCE executes and administers PPAs to implement California’s RPS, which became 16
effective January 1, 2003.109 Initial RPS legislation (SB 1078 and SB 107) required certain load-serving 17
entities (LSEs), including the IOUs, to increase procurement from eligible renewable energy resources 18
(ERRs), as defined in the legislation, by at least 1% of annual sales per year, so that 20% of retail sales 19
106 135 FERC ¶ 61,234. 107 Assembly Bill 1613 (Blakeslee 2007) and amended by Assembly Bill 2791 (Blakeslee 2008) directed the
California Energy Commission, the CPUC, and the Air Resources Board (ARB) to implement the Waste Heat and Carbon Emissions Reduction Act. The Act is designed to encourage the development of new combined heat and power (CHP) systems in California with a generating capacity of not more than 20 megawatts. See also D. 09-12-042 (as modified by D. 10-04-055, D. 10-12-055 and D. 11-04-033) and Res. E-4424 for approved contract form and program specifics.
108 Adopted in D.09-12-042. 109 See Public Utilities Code §399.11, et. seq.

105
are served from ERRs by 2010.110 In 2011, the Legislature expanded the RPS to 33% by 2020 when it 1
passed Senate BillX1-2.111 In September 2015, SB 350 was passed which expanded the RPS 2
requirement to 50% by 2030. 3
During the Record Period, SCE executed a variety of RPS contracts, including PPAs 4
originated from the Renewable Auction Mechanism (RAM) program, the Biofuel Renewable Auction 5
Mechanism (BioRAM), the Renewable Market Adjusting Tariff (ReMAT) program, the Bioenergy 6
Market Adjusting Tariff (BioMAT), and the 2015 RPS solicitation. 7
4. Behind-The-Meter Contracts 8
In addition to generation contracts, SCE executes and administers BTM contracts, which 9
are contracts for resources located on the customer’s side of the meter, with the intention of reducing 10
load. BTM contracts are entered into under the procurement authority granted to SCE through its 11
Commission approved procurement plan including the 2012 Long Term Procurement plan (LTPP) 12
proceeding (Tracks 1 and 4). 13
BTM activities are behind-the-meter projects managed by SCE’s Customer Program & 14
Services (CP&S) group and are discussed separately from the Conventional, PURPA/CHP, or RPS 15
sections of this chapter. 16
B. Safety 17
1. Non-BTM Contract Administration Safety Practices 18
SCE is strongly committed to safety in all aspects of its business. Sellers are responsible 19
for the safe construction and operation of their generating facilities and compliance with all applicable 20
safety regulations. SCE has taken several steps to address those issues over which it has the most 21
visibility and control – the delivery of electricity products to SCE in a reliable, safe, and operationally 22
sound manner. 23 110 See Public Utilities Code § 399.15, et. seq. 111 Senate BillX1-2, available at http://www.leginfo.ca.gov/pub/11-12/bill/sen/sb_0001-
0050/sbx1_2_bill_20110412 chaptered.pdf. Additionally, this bill eliminated the 1% per year requirement in the previous RPS legislation.

106
Consistent with SCE’s focus on safety, SCE includes a provision in many of its contracts 1
providing that, prior to commencement of any construction activities on the project site, the seller must 2
provide to SCE a report from an independent engineer certifying that the seller has a written plan for the 3
safe construction and operation of the Generating Facility, in accordance with Prudent Electrical 4
Practices. This language is also actively negotiated, where appropriate, into several Amendments 5
executed during the Record Period. 6
All of SCE’s PPAs also provide that the seller must operate the generating facility in 7
accordance with Prudent Electrical Practices. Further, these provisions specifically require that all 8
sellers take reasonable steps to ensure that: 9
a) Equipment, materials, resources, and supplies, including spare parts inventories, are 10
available to meet the Generating Facility’s needs; 11
b) Sufficient operating personnel are available at all times and are adequately experienced 12
and trained and licensed as necessary to operate the Generating Facility properly and 13
efficiently, and are capable of responding to reasonably foreseeable emergency 14
conditions at the Generating Facility and emergencies whether caused by events on or off 15
the Site; 16
c) Preventive, routine, and non-routine maintenance and repairs are performed on a basis 17
that ensures reliable, long term and safe operation of the Generating Facility, and are 18
performed by knowledgeable, trained, and experienced personnel utilizing proper 19
equipment and tools; 20
d) Appropriate monitoring and testing are performed to ensure equipment is functioning as 21
designed; 22
e) Equipment is not operated in a reckless manner, in violation of manufacturer’s guidelines 23
or in a manner unsafe to workers, the general public, or the Transmission Provider’s 24
electric system or contrary to environmental laws, permits or regulations or without 25
regard to defined limitations such as, flood conditions, safety inspection requirements, 26
operating voltage, current, volt ampere reactive (VAR) loading, frequency, rotational 27
speed, polarity, synchronization, and control system limits; and 28
f) Equipment and components are designed and manufactured to meet or exceed the 29
standard of durability that is generally used for electric energy generating facilities 30
operating in the Western United States and will function properly over the full range of 31
ambient temperature and weather conditions reasonably expected to occur at the Site and 32
under both normal and emergency conditions. 33

107
SCE energy contract managers and members from SCE’s Contract Compliance and 1
Technical Services (CC&TS) group monitor the development of counterparty energy projects, from 2
contract execution through the term of the PPA. Typically, a contract requires the counterparty to 3
provide written progress reports on their project’s development status to SCE on a monthly or quarterly 4
basis, until Commercial Operation is achieved. As part of these progress reports, generators must 5
provide the status of construction activities, including Occupational Health and Safety Administration 6
(OSHA) recordables and work stoppage information. The assigned contract managers and compliance 7
team members review the written progress reports, conduct conference calls with counterparty 8
personnel, and conduct site visits to ensure that SCE is consistently up-to-date regarding the status of 9
each project, along with any associated issues which impact the project in any way. Prior to a project 10
achieving Commercial Operation, SCE consistently reviews and tracks development activities for each 11
project, including site control, permitting, financing, construction, and safety. 12
During the onboarding process of a project to commercial operation, technical specialists 13
from SCE’s CC&TS group conduct site visits to verify that the facility has been built to the 14
specifications referenced in the contract. Prior to the site visit, the technical specialist contacts the 15
counterparty to discuss any safety hazards unique to the facility such as dangerous wildlife, abnormal 16
noise issues, dangerous access roads, etc. SCE technical specialists then review a technology-specific 17
hazard assessment developed by the technical specialists and safety professionals from within SCE. 18
This review reminds the technical specialist of the different hazards associated with each of the 19
generation technologies that SCE contracts with, so safety is fresh in their mind before the site visit. 20
Upon arriving at the site, SCE technical specialists and any other SCE personnel meet 21
with the site representative(s) and conduct a Safety Tailboard. In this tailboard, participants discuss the 22
planned activities and all safety considerations by using a checklist developed by SCE. The checklist 23
includes items such as: personal protective equipment, communication protocols, emergency response, 24
location of safety/first aid equipment, location of nearest emergency room, etc. The site contact will 25
also perform various safety trainings or reminders depending on whether the site is still under 26
construction or if control of the project has transferred to an O&M provider. In all cases, by conducting 27

108
the Safety Tailboard prior to starting our inspections, SCE and facility personnel keep safety top of mind 1
at all site visits. 2
For procurement contracts with third-party generators, local, state and federal agencies 3
that have review and approval authority over the generation facilities are charged with enforcing safety, 4
environmental and other regulations for the Project, including decommissioning. Safety is also 5
addressed as part of a generator’s interconnection process, which requires testing for safety and 6
reliability of the interconnected generation. SCE declares that a facility has commenced deliveries 7
under the contract only after certain criteria has been met, including that the interconnecting utility and 8
the CAISO have concluded such testing and given permission to commence Commercial Operation. 9
2. BTM Contract Developing Project Monitoring and Safety 10
SCE is strongly committed to safety in all aspects of its business. Consistent with SCE’s 11
focus on safety, SCE includes a requirement in its BTM contracts that Sellers must safely construct and 12
operate their projects and comply with all applicable safety regulations and standards. The contracts 13
require that the Seller provide SCE a report from an independent engineer certifying that the Seller has a 14
written plan for the safe construction and operation of the project prior to commencement of any 15
construction activities on the project site. 16
For the BTM projects that are required to interconnect to SCE’s grid, safety is addressed 17
as part of a generator’s interconnection process, which requires testing for safety and reliability of the 18
interconnection generation. Sellers may commence deliveries under the contract only after certain 19
criteria have been met, including confirmation of the completion of safety testing and issuance of 20
Permission to Operate letter from SCE’s interconnection department. Additionally, local, state and 21
federal agencies that have review and approval authority over the projects are charged with enforcing 22
safety, environmental and other regulations. 23
C. Authorization for Recovery of Contract Expenses 24
The California Public Utilities Code, Commission decisions, and approved advice letters provide 25
for recovery of the costs associated with SCE’s procurement contracts for the duration of those 26
agreements. Pursuant to D.02-10-062, SCE filed Advice Letter 1665-E to implement the ERRA and 27
109
allow SCE to debit and recover its net purchased power expenses,112 including energy contract costs, to 1
the ERRA for cost recovery. In addition D.02-12-074 authorized cost recovery for the reasonable costs 2
associated with administering and managing SCE’s energy contracts.113 3
In D.06-07-029, as modified by D.11-05-005, the Commission adopted a Cost Allocation 4
Mechanism (CAM) to allocate the benefits and costs of new generation to all benefiting customers in an 5
IOU’s service territory. Specifically, the Commission allowed the IOUs to recover “net capacity costs” 6
for certain contracts from all bundled, Direct Access (DA) and Community Choice Aggregation (CCA) 7
customers through the CAM. 8
In D.07-09-044, the Commission authorized each IOU to establish a balancing account to record 9
costs and benefits associated with new generation resources. SCE established the New System 10
Generation Balancing Account (NSGBA)114 to track and recover the net costs of the new generation 11
resources from all benefiting customers, including bundled service, DA, and CCA customers, while 12
continuing to record all other costs associated with the energy contracts in the ERRA balancing account. 13
Since only the net capacity costs of these resources are recovered through the CAM (i.e., NSGBA) there 14
are instances where a contract has a portion of its costs recovered through the CAM and a portion of its 15
costs recovered through ERRA. As such, during the Record Period, the following conventional projects 16
listed below in Table VII-39, have costs recovered through both CAM and ERRA: 17
112 Purchased power expenses include costs associated with renewable contracts, inter-utility contracts, bilateral
contracts, ancillary services, uplift charges, and residual net short and net long procurement activities. 113 See D.02-12-074 and Pub. Util. Code Section 454.5(d)(2). 114 The NSGBA is discussed in Chapter XI of this ERRA Application. This Chapter VII discusses cost recovery
for procurement activities through ERRA.

110
Table VII-39 Conventional Projects Costs Recovered Through CAM and ERRA
January 2, 2016 Through December 31, 2016
1. The Standard of Review for Cost Recovery 1
In a series of decisions, the Commission explained the standards it would apply to review 2
the utilities’ administration of contracts in the utility supply portfolio.115 In this ERRA proceeding, SCE 3
provides evidence that its contracts were administered in accordance with the terms of the contracts and 4
that any contract disputes that arose were, or are in the process of being, reasonably resolved.116 In this 5
chapter, SCE will demonstrate that during the Record Period it administered all contracts for which it 6
has responsibility in a manner consistent with these standards and that its contract administration 7
activities should therefore be found reasonable. The Commission’s review of purchase and sale 8
transactions, including the type of product purchased or sold, together with the bidding or other 9
115 See D.02-10-062, D.02-12-069, D.02-12-074, D.03-06-067, D.03-06-074, D.03-06-076, D.03-12-003, and
D.05-01-054. 116 Pub. Util. Code Section 454.5(d)(2).
Project CAM Authorization Contract Type
1 Barre Peaker A. 07-12-029/D.09-03-031 UOG1
2 Center Peaker A. 07-12-029/D.09-03-031 UOG3 Grapeland Peaker A. 07-12-029/D.09-03-031 UOG4 Mira Loma Peaker A. 07-12-029/D.09-03-031 UOG5 McGrath Peaker A. 12-12-028/D.14-06-043 UOG6 Long Beach Generation, LLC A. 16-11-007/D.07-01-041 PPA7 Blythe Energy, LLC A. 07-02-026/D.08-05-028 PPA8 Delano Energy Center, LLC A. 08-04-011/D.08-09-041 PPA9 Walnut Creek Energy, LLC A. 08-04-011/D.08-09-041 PPA
10 CPV Sentinel, LLC A. 08-04-011/D.08-04-011/D.08-09-041 PPA11 El Segundo Energy Center, LLC A. 08-04-011/D.08-09-041 PPA12 AltaGas Pomona Energy Storage, Inc. AL 3455/Res. E-4804 PPA
1 Utility owned generation (UOG) has no power purchase contract, but all bundled customers benefit through offered products and services provided to the CAISO marketplace.

111
transaction procedure followed, and the contracts’ terms and prices, is conducted in SCE’s quarterly 1
compliance report (QCR) advice letter filings117 or through separate advice letters or applications. 2
D. Summary of Contract Administration and Management Processes 3
SCE’s goal is to administer its contracts through a balanced and fair process to maximize 4
benefits to customers at the lowest achievable cost. Certain contract transactions provide not only 5
commodity and price benefits, but also non-price benefits such as dispatchability or favorable terms and 6
conditions. 7
The contract administration process consists of several activities, including: (1) exercising 8
contract options in a prudent and economic manner; (2) verifying that the counterparty is complying 9
with the contract terms, including credit support and collateral requirements; (3) verifying that billing 10
and payments are accurate and consistent with the terms of the contract; (4) reviewing interruptions of 11
service and force majeure events; (5) renegotiating contract provisions as necessary due to changed 12
circumstances or conditions; (6) resolving disputes; (7) purchasing natural gas fuel at certain times and 13
under certain types of contracts; and (8) assigning, amending, renewing, or terminating contracts. 14
After execution, contracts are assigned to a SCE contract manager who carries out the 15
management and administration of that contract and all activities related to it. While the contract 16
manager is responsible for ensuring comprehensive oversight and takes the lead in communicating with 17
the counterparty, he or she will seek assistance from other SCE groups with specialized functions. 18
These groups include Energy Portfolio Planning and Analysis, Trading and Energy Operations, 19
Settlements, Regulatory Affairs, Law, Credit Risk and Collateral Management, and others as needed. 20
When SCE determines that a counterparty does not comply with the terms or conditions of an 21
agreement, or that differences exist between SCE and a counterparty over interpretation of the contract 22
terms or conditions, SCE initiates discussions to resolve the non-compliance or the difference in 23
interpretation and seeks to recover lost value, if any. When differences with a counterparty cannot be 24
117 D.05-01-054, pp. 7-10.

112
resolved by an amendment or otherwise, SCE or the counterparty initiates the appropriate dispute 1
resolution process as described in the enabling agreement118 or power purchase agreement (typically 2
mediation or arbitration). 3
The administration and management of these contracts is explained below, and is separated by 4
the following contract types: (1) conventional and natural gas products, (2) PURPA and CHP, (3) RPS, 5
and (4) BTM contracts. 6
1. Conventional and Natural Gas 7
Conventional contracts are typically executed through Request for Offers (RFOs) or 8
through bilateral negotiation procurement processes. Furthermore these contracts are typically done 9
under industry-standard master agreements with modifications agreed upon through negotiations. These 10
form agreements include the Western Systems Power Pool (WSPP), the Edison Electric Institute (EEI), 11
the North American Energy Standards Board (NAESB), the International Swaps and Derivatives 12
Association (ISDA), the Transmission Resale Enabling Agreement (TREA), and FERC-approved 13
transmission tariff agreements. Some of these agreements offer an “annex to the agreement” 14
effectuating the right to contract for, or trade another product or function under the same agreement. 15
ISDA agreements offer a gas or power annex which enable the trading of both physical and financial 16
transactions under a single agreement. Similarly, EEI offers a gas annex to allow for gas and power 17
trades under the same master EEI agreement. A description of these are included below: 18
The WSPP, EEI, and power annex to the ISDA agreements are used for physical 19
electricity transactions including tolling agreements; 20
The NAESB, gas annex to the EEI, and gas annex to the ISDA agreements are used for 21
physical natural gas transactions; 22
118 Sometimes referred to as a “master” or “umbrella” agreement.

113
The ISDA agreements are used for financial electricity and natural gas transactions; and 1
The TREA is used for transmission transactions. 2
Each of these agreements specifies terms and conditions related to performance, events of 3
default, payments, confidentiality requirements, dispute resolution, and other general contractual 4
provisions. SCE may use the agreements in their standard form or agree to special provisions or 5
amended forms of the agreements. 6
These agreements and any transactions done under them, including PPAs, are submitted 7
for Commission review in SCE’s quarterly compliance report (QCR) via advice letter filing or in 8
separate advice letters or applications. Once the agreements are in place and other required measures 9
are taken by the parties (i.e., providing collateral, development security, etc.), SCE’s risk control group 10
adds the counterparty to SCE’s “OK-to-trade” list. SCE’s traders may then execute transactions in 11
compliance with the requirements of SCE’s Financial Risk Management (FRM) Committee and SCE’s 12
Commission-approved AB 57 bundled procurement plan (BPP or LTPP). Individual transactions 13
underlying each enabling agreement and any amendments are reported in SCE’s QCR.119 14
SCE’s Energy Contracts Management group manages the negotiation and administration 15
of all enabling agreements required for the purchase and sale of natural gas products. Below is a 16
description of the administrative activities related to gas contracts during the Record Period. 17
a) Physical Gas Contracts 18
Transactions for physical gas take place under a North American Energy 19
Standards Board (NAESB) agreement, a gas annex to the ISDA agreement, or a gas annex to the EEI 20
agreement. During the Record Period, SCE was enabled to transact with many counterparties to 21
facilitate the purchase and sale of physical natural gas. A list of agreements active during the Record 22
Period is included in Appendix VII-B. 23
119 Advice letter filings for Q1, Q2, Q3, and Q4 of 2016 were submitted as Advice Letters 3400-E, 3443-E,
3495-E, and 3548-E respectively.

114
b) Financial Gas Contracts 1
SCE’s financial transactions during the Record Period were either executed via a 2
broker and then cleared through an exchange or executed through bilateral transactions with one of the 3
counterparties under an active ISDA enabling agreement with SCE. During the Record Period, SCE 4
was enabled to transact with brokers, clearing firms and trading platforms, and has ISDA enabling 5
agreements with major market participants for bilateral financial gas and/or power transactions. A list of 6
these agreements is included in Appendix VII-B. 7
c) Contract Administration 8
During the Record Period, SCE administered bilateral transactions, contracts and 9
enabling agreements related to electric and natural gas purchases and sales, transmission and emissions 10
offsets. SCE administered these contracts prudently, and according to their terms and conditions.120 11
d) Summary of Contract Activity 12
The conventional contracts administered by SCE during the Record Period 13
include tolling confirmations; RA confirmations; transmission contracts; gas transportation contracts; 14
gas storage contracts; energy storage contracts; and Power Purchase Agreements. The list of 15
transactions active and/or in SCE’s energy contracts portfolio during the Record Period are sorted by 16
types and listed in Confidential Appendix VII-A. All transactions in Confidential Appendix VII-A were 17
either approved through the QCR in conformance with the guidelines in SCE’s AB 57 BPP or through 18
separate advice letter or application filings with the CPUC. 19
e) Conventional Contract Delivery 20
Table VII-40 shows the conventional project that came on-line or started 21
delivering to SCE during the Record Period, totaling 20 MW. 22
120 Confidential Appendix VII-H includes a summary of bilateral power payments during the Record Period,
which includes transmission, RA, and toll activity payments.

115
Table VII-40 Conventional Projects that Began Operations January 1, 2016 Through December 31, 2016
f) Contract Development 1
All new contracts executed during the Record Period were filed through the QCR 2
in conformance with the guidelines in SCE’s AB 57 BPP or through the advice letter or application 3
process as noted. These are included here as information only related to contract activity during the 4
Record Period. Natural gas transportation contract auto-renewals are indicated as such and SCE is 5
seeking approval for those through this filing. 6
Project Date Capacity (MW)
1 AltaGas Pomona Energy Storage, Inc. 12/31/2016 20.0

116
Table VII-41 New Conventional and Natural Gas Contracts January 1, 2016 Through December 31, 2016
Contract Counterparty Type of Agreement Date Executed CPUC Resolution or Decision/SCE
Advice Letter/Application
1 Amerex Brokers LLC Brokerage Enabling Agreement. Replaces the existing Amerex agreement. 1/15/2016 Q1 QCR: AL-3400E
2 Southern California Gas Company
Natural Gas Transportation Agreement auto renewal for SCE’s Moutainview facility. 2/1/2016 Requires approval
3 Southern California Gas Company
Natural Gas Transportation Agreement auto renewal for SCE’s Barre Peaker facility. 2/1/2016 Requires approval
4 Southern California Gas Company
Natural Gas Transportation Agreement auto renewal for SCE’s Center Peaker facility. 2/1/2016 Requires approval
5 Southern California Gas Company
Natural Gas Transportation Agreement auto renewal for SCE’s Grapeland Peaker facility. 2/1/2016 Requires approval
6 Southern California Gas Company
Natural Gas Transportation Agreement auto renewal for SCE’s Mira Loma Peaker facility. 2/1/2016 Requires approval
7 Southern California Gas Company
Natural Gas Transportation Agreement auto renewal for SCE’s UC Santa Barbara fuel cell facility. 3/1/2016 Requires approval
8 CRC Marketing, Inc. NAESB Coverpage/Base Contract 3/9/2016 Q1 QCR: AL-3400E
9 NRG Power Marketing, LLC EEI Gas Annex 5/6/2016 Q2 QCR: AL-3443E
10 SCB & Associates, LLC
Broker Enabling Agreement for Low Carbon Fuel Standards (LCFS) transactions. 5/12/2016 Q2 QCR: AL-3443E
11 Advanced Microgrid Solutions, Inc. Demand Response Auction Mechanism 7/6/2016 AL 3442-E - Approved on 7/27/2016
12 Advanced Microgrid Solutions, Inc. Demand Response Auction Mechanism 7/6/2016 AL 3442-E - Approved on 7/27/2016
13 Autogrid Systems, Inc. Demand Response Auction Mechanism 7/6/2016 AL 3442-E - Approved on 7/27/201614 Chai Inc. Demand Response Auction Mechanism 7/6/2016 AL 3442-E - Approved on 7/27/201615 Earth Networks, Inc. Demand Response Auction Mechanism 7/6/2016 AL 3442-E - Approved on 7/27/201616 EnerNOC, Inc. Demand Response Auction Mechanism 7/6/2016 AL 3442-E - Approved on 7/27/201617 OhmConnect, Inc. Demand Response Auction Mechanism 7/6/2016 AL 3442-E - Approved on 7/27/201618 OhmConnect, Inc. Demand Response Auction Mechanism 7/6/2016 AL 3442-E - Approved on 7/27/201619 Stem DRAM LLC Demand Response Auction Mechanism 7/6/2016 AL 3442-E - Approved on 7/27/2016
20 PPA Grand Johanna LLC ACES (Aliso Canyon Energy Storage) RFO 8/5/2016 Res. E-4804 on 9/15/2016
21 AltaGas Pomona Energy Storage, Inc. ACES (Aliso Canyon Energy Storage) RFO 8/5/2016 Res. E-4804 on 9/15/2016
22 AES Alamitos, L.L.C. EEI 8/10/2016 Q3-16 QCR: AL-3495E
23 AES Huntington Beach, L.L.C. EEI 8/10/2016 Q3-16 QCR: AL-3495E
24 AES Redondo Beach, L.L.C. EEI 8/10/2016 Q3-16 QCR: AL-3495E
25 AES Alamitos, L.L.C. Resource Adequacy 8/10/2016 AL-3488E (filed 10/10/2016, pending approval)
26 AES Huntington Beach, L.L.C. Resource Adequacy 8/10/2016 AL-3488E (filed 10/10/2016, pending
approval)
27 AES Redondo Beach, L.L.C. Resource Adequacy 8/10/2016 AL-3488E (filed 10/10/2016, pending
approval)
28 Western Grid Development LLC ACES (Aliso Canyon Energy Storage) RFO 8/11/2016 Res. E-4804 on 9/15/2016
29Hoover (WAPA and Bureau of Reclamation)
Hoover Dam aka Boulder Canyon Project. 8/25/2016 D. 16-11-009 on 11/10/2016
30 Orange County Energy Storage 1 LLC
New agreement from PRP 2 RFO for RA with Energy Put Option 9/8/2016 A.16-11-002 - Filed on 11/4/2016

117
1
g) Contract Amendment Administration 2
The following contract amendments to Conventional and Natural Gas Contracts 3
were executed during the Record Period and submitted for approval as identified in Table VII-42. 4
31 Orange County Energy Storage 2 LLC
New agreement from PRP 2 RFO for RA with Energy Put Option 9/8/2016 A.16-11-002 - Filed on 11/4/2016
32 Orange County Energy Storage 3 LLC
New agreement from PRP 2 RFO for RA with Energy Put Option 9/8/2016 A.16-11-002 - Filed on 11/4/2016
33 Hecate Energy Johanna Facility LLC
New agreement from PRP 2 RFO for RA with Energy Put Option 9/8/2016 A.16-11-002 - Filed on 11/4/2016
34 Hecate Energy Johanna Facility LLC
New agreement from PRP 2 RFO for RA with Energy Put Option 9/8/2016 A.16-11-002 - Filed on 11/4/2016
35 Valencia Energy Storage, LLC
New agreement from PRP 2 RFO for RA with Energy Put Option 9/8/2016 A.16-11-002 - Filed on 11/4/2016
36 Bonneville Power Administration Transmission Loss Provider Agreement 9/26/2016 Q3-16 QCR: AL-3495E
37 Southern California Gas Company
CSU San Bernardino Fuel Cell - new 2 year term. This agreement was only in effect for 1 month, after which it was converted to a month-to-month agreement in accordance with Decision 16-07-008.
10/1/2016 Q4-16 QCR: AL-3548E
38 Southern California Gas Company
Mountainview - prior 3 year term converted to month to month term in accordance with Decision 16-07-008. 11/1/2016 Q4-16 QCR: AL-3548E
39 Southern California Gas Company
Barre Peaker - prior 3 year term converted to month to month term in accordance with Decision 16-07-008. 11/1/2016 Q4-16 QCR: AL-3548E
40 Southern California Gas Company
Center Peaker - prior 3 year term converted to month to month term in accordance with Decision 16-07-008. 11/1/2016 Q4-16 QCR: AL-3548E
41 Southern California Gas Company
Grapeland Peaker - prior 3 year term converted to month to month term in accordance with Decision 16-07-008.
11/1/2016 Q4-16 QCR: AL-3548E
42 Southern California Gas Company
McGrath Peaker - prior 3 year term converted to month to month term in accordance with Decision 16-07-008. 11/1/2016 Q4-16 QCR: AL-3548E
43 Southern California Gas Company
Mira Loma Peaker - prior 3 year term converted to month to month term in accordance with Decision 16-07-008.
11/1/2016 Q4-16 QCR: AL-3548E
44 Southern California Gas Company
CSU San Bernardino Fuel Cell - prior 2 year term converted to month to month term in accordance with Decision 16-07-008.
11/1/2016 Q4-16 QCR: AL-3548E
45 Southern California Gas Company
UC Santa Barbara Fuel Cell - prior 2 year term converted to month to month term in accordance with Decision 16-07-008.
11/1/2016 Q4-16 QCR: AL-3548E
46 Southern California Gas Company
AES Alamitos - prior 3 year term converted to month to month term in accordance with Decision 16-07-008. 11/1/2016 Q4-16 QCR: AL-3548E
47 Southern California Gas Company
AES Huntington Beach - prior 3 year term converted to month to month term in accordance with Decision 16-07-008.
11/1/2016 Q4-16 QCR: AL-3548E
48 Southern California Gas Company
AES Redondo Beach - prior 3 year term converted to month to month term in accordance with Decision 16-07-008
11/1/2016 Q4-16 QCR: AL-3548E
49 Banyan Commodity Group LLC Brokerage Enabling Agreement for LCFS transactions. 11/21/2016 Q4-16 QCR: AL-3548E

118
Table VII-42 Conventional and Gas Amendments and Letter Agreements
January 1, 2016 Through December 31, 2016
(1) GenOn Energy Management, LLC (Ellwood 2016-2018) 1
GenOn Energy Management, LLC (Ellwood) is an RA Confirm for 54 2
MW located in the Big Creek – Ventura area in CA, originally executed as part of SCE’s 2015 RA 3
solicitation. The confirm was executed on December 17, 2015. SCE and GenOn Energy Management, 4
LLC executed Amendment No. 1 on March 8, 2016 Both 5
parties benefit from this amendment as it 6
. 7
(2) GenOn Energy Management, LLC (Mandalay 2016-2020) 8
GenOn Energy Management, LLC (Mandalay Unit 3) is an RA Confirm 9
for 130 MW located in the Big Creek – Ventura area in CA, originally executed as part of SCE’s 2015 10
Contract Counterparty Amendment No. and Description Date
ExecutedCPUC Resolution or Decision/SCE
Advice Letter
1GenOn Energy Management, LLC (Ellwood 2016-2018)
3/8/2016 QCR AL-3443E
2GenOn Energy Management, LLC (Mandalay 2016-2020)
3/8/2016 QCR AL-3443E
3Western Area Power Administration (Desert SW Region)
Amendment No. 1 to update contact information and add a contract term limit.
4/20/2016 QCR AL-3443E
4Freepoint Commodities, LLC
6/20/2016 QCR AL-3443E
5 Powerex Corp
6/30/2016 QCR AL-3443E
6Evolution Markets Futures, LLC
8/15/2016 QCR AL-3495E
7 BGC Financial, L.P.
10/4/2016 QCR AL-3548E

119
RA solicitation. The confirm was executed on December 17, 2015. SCE and GenOn Energy 1
Management, LLC executed Amendment No. 1 on March 8, 2016 2
Both parties benefit from this amendment as it 3
4
(3) Western Power Administration 5
The Western Area Power Administration (WAPA) Non-Firm Point-to-6
Point Transmission Service Agreement is a non-negotiated FERC tariff enabling agreement with an 7
effective date of April 7, 2010. The agreement did not have a termination date at execution. In April 8
2013, WAPA submitted proposed revisions to their Open Access Transmission Service Tariff (OATT) 9
to the FERC, and added a term limit to comply with Federal contractual practices. On July 10, 2015, 10
FERC issued a Letter Order accepting WAPA’s tariff revisions. SCE and WAPA executed Amendment 11
No. 1 on April 20, 2016, to update contact information and modify the agreement to conform WAPA’s 12
filed and accepted tariff revisions. The new termination date will be April 30, 2026. SCE’s customers 13
benefit from this amendment because SCE will continue to have access to WAPA’s transmission lines, 14
thereby giving SCE operational flexibility. 15
(4) Freepoint Commodities, LLC 16
Freepoint Commodities, LLC and SCE entered into an ISDA Master 17
Agreement on August 20, 2012. SCE and Freepoint Commodities, LLC executed 18
to the ISDA Master Agreement on June 20, 2016 to 19
20
21
22
23
(5) Powerex Corp. 24
SCE and Powerex Corp. entered into an EEI Master Agreement on June 25
24, 2004. SCE and Powerex Corp. executed Amendment No. 3 to the EEI Master Agreement on June 26
30, 2016 27

120
1
. Both parties benefit from this amendment through 2
3
. 4
(6) Evolution Markets Futures, LLC 5
Evolution Markets Futures, LLC (Evolution) is a Commodities Broker 6
Located in New York, NY, originally contracted by SCE to broker energy products. The Broker Service 7
Agreement (BSA) was executed on July 16, 2013. SCE and Evolution executed Amendment No. 1 on 8
August 15, 2016 to 9
10
Both parties benefit from this Amendment 11
. 12
(7) BGC Financial, L.P. 13
BGC Financial, L.P. is a commodities broker located in New York, NY, 14
originally contracted by SCE to broker energy products. The Broker Enabling Agreement was executed 15
on December 1, 2005. SCE and BGC Financial, L.P. executed Amendment No. 1 on October 4, 2016 16
17
18
Both parties benefit by 19
20
SCE’s customers benefit by 21
. 22
h) LCR RFO Contract Amendments 23
The conventional contracts listed in Table VII-43 were executed as part of the 24
LCR RFO solicitation on November 4, 2014. Per the agreements, 25
26
27

121
1
2
SCE filed Application 14-11-012 with the CPUC in November 2014. SCE and 3
the contractual counterparties listed below executed separate amendments to 4
5
. SCE’s customers benefit from these amendments as they 6
7
8
9
Table VII-43 LCR RFO Contract Amendments
January 1, 2016 Through December 31, 2016
1NRG ENERGY
CENTER OXNARD LLC
RA Purchase Agreement 262.00
2 NRG CALIFORNIA SOUTH LP PPA 54.00
3 NRG CALIFORNIA SOUTH LP
RA with energy storage option
0.50
4AES HUNTINGTON BEACH ENERGY,
LLC
RA with tolling option 644.00
5 AES ALAMITOS ENERGY, LLC
RA with tolling option 640.00
6 AES ES ALAMITOS, LLC
RA with energy storage option
100.00
7STANTON ENERGY
RELIABILITY CENTER
RA Purchase Agreement 98.00
Moo
rpar
k
11/26/2014
LA B
asin
11/21/2014
Contractual Counterparty
Contract type
Con
trac
t Cap
acity
, M
W
Loca
l Are
a
CPUC Application Filing Date

122
i) Contract Assignment Administration 1
Conventional contracts may only be assigned with the written consent of the 2
parties, which may not be unreasonably withheld. There are many reasons contract counterparties seek 3
to assign their contracts. For example, the counterparty might want to sell or transfer the project to a 4
new entity, assign the contract to a lender as security for a loan, or effectuate a change of control of the 5
project.121 SCE is seeking approval of the consents in Table VII-44. 6
Table VII-44 Conventional and Gas Contract Consents
January 1, 2016 Through December 31, 2016
(1) Stem DRAM LLC 7
Stem DRAM LLC is a 350 kW Demand Response capacity product, 8
located in SCE’s service territory, originally executed as a part of SCE’s DRAM No. 2 Pilot RFO. The 9
Resource Purchase Agreement (RPA) was executed on July 6, 2016. SCE and Stem DRAM LLC 10
executed a Consent to Assignment on September 15, 2016 11
12
13
14
121 SCE provides the assignment documents in its reply to the Master Data Request.
Contract Counterparty Amendment No. and Description Date Executed
1 Stem DRAM LLC Consent to Assignment 9/15/2016
2 Sempra Generation, LLC Consent to Assignment 11/29/2016

123
(2) Sempra Generation, LLC 1
Sempra Generation, LLC and SCE entered into an ISDA Master 2
Agreement on October 13, 2010. SCE and Sempra Generation, LLC executed a Consent to Assignment 3
on November 29, 2016 4
5
SCE’s customers 6
7
j) Affiliate Transactions and Contract Information 8
There were no affiliate conventional contracts during the Record Period. 9
k) Dispute Resolution and Litigation 10
Details on conventional project dispute resolution and litigation activities during 11
the Record Period are provided below. 12
(1) Blythe Energy, Inc. 13
Blythe Energy, Inc. is a 490 MW combined cycle gas fired generating 14
facility located in Blythe, CA. Blythe Energy, Inc. was originally signed as a part of SCE’s 2006 New 15
Gen RFO and was executed on February 15, 2007 and subsequently amended and restated on April 30, 16
2010. 17
18
19
20
21
22
23
24
25

124
(2) NRG/GenOn Energy Management, LLC (RA Confirm – Ormond Beach 1
Unit 1 and 2 and Etiwanda Unit 4) 2
GenOn Energy Management, LLC, Ormond Beach Unit 1 and Unit 2 and 3
Etiwanda Unit 4 are two RA Confirms for 360 MW and 290 MW, respectively, located in Oxnard, CA 4
and Rancho Cucamonga, CA, respectively, originally signed as part of SCE’s RA solicitation on 5
October 9, 2015. 6
7
8
9
10
11
12
13
14
15
l) Contract Termination 16
Table VII-45 below identifies the conventional contract terminations that 17
occurred during the Record Period. 18

125
Table VII-45 Conventional Contract Terminations
January 1, 2016 Through December 31, 2016
m) Interutility Contracts 1
SCE is a party to three122 major interutility contracts, as shown in Table VII-46, 2
under which it is expected to purchase and/or exchange capacity and associated energy. These 3
interutility contracts were executed prior to industry restructuring and contain complex terms and 4
conditions that were designed to satisfy the unique needs of SCE and each of the counterparties. 5
122 Excluded from this total are SCE’s so-called “Fringe Service” agreements, which provide for small amounts
of energy exchanges among neighboring utilities. These include two contracts with the Department of Defense for the Air Force that SCE presented to the Commission in Advice Letters 2686-E and 1777-E and contracts associated with retail tariffs.
ID Project Contract Type Termination Date Notes
1 10003 Stem, Inc. DRAM 12/31/2016 Contract expired2 10005 Chai Inc. DRAM 12/31/2016 Contract expired3 10006 Electric Motor Werks Inc. DRAM 12/31/2016 Contract expired4 10007 EnergyConnect, Inc. DRAM 12/31/2016 Contract expired5 10008 Energy Hub, Inc. DRAM 9/30/2016 Contract expired6 10009 EnerNOC, Inc. DRAM 10/31/2016 Contract expired
7 10010 Green Charge Networks Energy Services DRAM 10/3/2016
Early Termination due to nonperformance. SCE collected payment of $4,096.
8 10013 IPKeys Power Partners, LLC DRAM 12/31/2016 Contract expired9 10035 OhmConnect, Inc. (#01) DRAM 12/31/2016 Contract expired10 10036 OhmConnect, Inc. (#02) DRAM 12/31/2016 Contract expired11 10037 OhmConnect, Inc. (#03) DRAM 12/31/2016 Contract expired12 10038 OhmConnect, Inc. (#04) DRAM 12/31/2016 Contract expired13 10039 OhmConnect, Inc. (#05) DRAM 12/31/2016 Contract expired14 10040 OhmConnect, Inc. (#06) DRAM 12/31/2016 Contract expired15 10041 OhmConnect, Inc. (#07) DRAM 12/31/2016 Contract expired16 10042 OhmConnect, Inc. (#08) DRAM 12/31/2016 Contract expired17 10043 OhmConnect, Inc. (#09) DRAM 12/31/2016 Contract expired18 10044 OhmConnect, Inc. (#12) DRAM 12/31/2016 Contract expired

126
Table VII-46 Non-Coincident Contract Capacity Quantities and
Expiration Dates for SCE’s Major Interutility Contract
(1) WAPA Agreement 1
The current contract with Western Area Power Administration (WAPA) 2
expires on September 30, 2017. WAPA, also known as The Boulder Canyon Project or Hoover Dam, 3
and SCE have executed a new 50-year agreement that was approved by the Commission in D.16-08-4
017. 5
(2) MWD Agreement 6
The current contract with Metropolitan Water District of Southern 7
California (MWD) expires on September 30, 2017. The MWD contract will not be renewed. 8
(3) City of Pasadena Corporation Grant Deed 9
On June 20, 1933, SCE and the City of Pasadena (Pasadena) entered into 10
the Corporation Grant Deed that transferred ownership of a hydroelectric powerhouse and 11
accompanying parcels of land in Azusa Canyon to Pasadena. In accordance with the exchange 12
provisions of the Corporation Grant Deed, Pasadena delivers to SCE the entire electrical output of the 13
Azusa Powerhouse (nameplate rated at 3 MW). Pasadena then has twelve months from the time of 14
delivery to SCE to request that SCE return a like amount of energy. SCE charges Pasadena for 15
transmission service on the returned energy. If Pasadena does not request the like amount of energy, or 16
any portion thereof, to be returned within this twelve-month period, Pasadena forfeits any subsequent 17

127
right to the non-returned energy, and the energy is purchased by SCE at a rate of $2.50/MWh. There 1
was no contractual changes or modifications associated with this contract during the Record Period. 2
2. PURPA AND CHP 3
This section provides information on PURPA and CHP contract management, including 4
contract development, amendments, assignments, uncontrollable force claim administration, forced 5
outage claim administration, dispute resolution, and contract terminations. SCE pursues these activities 6
and programs in accordance with its contract administration principles and practices, and Commission 7
guidelines. The following four fundamental principles have evolved to guide SCE’s administration of 8
its PURPA and CHP contracts: 9
SCE’s actions must be consistent with Commission directives. 10
PURPA and CHP contract provisions that benefit or protect SCE’s customers must be 11
enforced pursuant to a reasonable interpretation of contract language. 12
Contracts with affiliate and non-affiliate PURPA or CHP counterparties are to be 13
administered in a consistent manner. 14
Where appropriate, SCE’s administration of PURPA and CHP contracts should be consistent 15
with utility and/or industry practice. 16
a) Contract Administration 17
This section discusses SCE’s administration of SO1, SO2, SO3, ISO4, NEGs, QF 18
SOC, and AB 1613 Agreements; these PPAs are referred to in this section as “PURPA contracts,” and 19
the projects that generate power for sale to SCE under such contracts are referred to as “PURPA 20
projects.” This section also discusses the administration of CHP RFO and CHP Bilateral PPAs; these 21
PPAs are “CHP contracts,” and as explained earlier are no longer PURPA contracts, and the projects 22
that generate power for sale to SCE under such contracts are referred to as “CHP projects.” As 23

128
explained below, the Commission has authorized SCE to recover the costs associated with PURPA and 1
CHP contracts, subject to its review of SCE’s administration of the contracts.123 2
In D.97-11-074, the Commission held that “costs associated with QF and inter-3
utility contracts should undergo reasonableness reviews” and that “[a]nnual reviews will include a 4
review of contract administration and litigation costs.”124 In addressing the reasonableness of PURPA 5
contract administration, the Commission found that utilities must administer their contracts in a prudent 6
manner, ensure compliance with the terms and conditions of the contracts, and purchase and sell power 7
in a manner that minimizes customer costs. Utilities are to exercise good utility practice in 8
administering contracts. Utilities are expected to engage in those practices, methods, and acts that, in 9
exercising reasonable judgment in light of the facts known when the decision was made, could have 10
been expected to accomplish the desired result at a reasonable cost consistent with good business 11
practices, reliability, safety, and expedition. The prudence standard is intended to include a range of 12
acceptable practices, methods, or acts.125 13
In D.02-10-062, the Commission established the ERRA to track utility-retained 14
generation, procurement activities, and purchased power expenses. In the Term Sheet of the QF 15
Settlement adopted by D.10-12-035, the IOUs are directed to “recover the cost of all payments made 16
pursuant to PPAs and PPA Amendments executed under [the] CHP Program in their respective Energy 17
Resources Recovery Accounts”.126 Per D.10-12-035, the Commission adopted terms to allocate 18
“relevant costs, as appropriate,” for purposes of cost recovery through the CAM.127 Similar to 19
123 PURPA: Public Utilities Code §367(2); D.95-12-063 at p. 130. CHP: D.10-12-035, approving Section 13.2
of Term Sheet. 124 D.97-11-074, pp. 125, 127-128. 125 See, e.g., D.90-09-088, pp. 14-16. 126 CHP Program Settlement Agreement Term Sheet, October 8, 2010, Section 13.2.1 at p. 56, available at
https://www.pge.com/includes/docs/pdfs/b2b/energysupply/qualifyingfacilities/settlement/final_term_sheet.pdf.
127 Id. at pp. 55-56, Sections 13.1.1 & 13.1.2.2.

129
conventional, Table VII-47 includes PURPA and CHP projects with contract costs recovered through 1
both CAM and ERRA. 2
Table VII-47 PURPA and CHP Contract Costs Recovered Through CAM and ERRA
In this Section, SCE sets forth its recorded PURPA and CHP contract-related 3
expenses and describes its PURPA and CHP contract administration activities, demonstrating that it 4
reasonably administered these contracts during the Record Period.128 5
b) Summary of Contract Activity 6
During the Record Period, SCE purchased 6.23 billion kWh129 from 116 active 7
PURPA contracts and recorded PURPA contract-related costs of $428 million. There were 28 PURPA 8
128 Two summary documents accompany this chapter as appendices. Appendix VII-I lists each active PURPA
and CHP project and the Commission decision that found the applicable PURPA or CHP contract reasonable and eligible for rate recovery, subject to the contract administration review described above. Appendix VII-J sets forth payment and production figures for each active PURPA or CHP project from which SCE purchased power during the Record Period.
129 Purchases in billion kWh from PURPA projects by month were as follows:
ID Project CAM Authorization Contract Type
2155 Chevron USA (Train D) D. 14-7-019 CHP QF2814 Berry Petroleum Company E-4553 CHP RFO2815 Sycamore Cogeneration Company (Baseload) E-4555 CHP QF2816 Sycamore Cogeneration Company (Toll/ RA) E-4555 CHP UPF2818 GFP Ethanol, LLC (Pixley Cogen Partners, LLC) D. 09-12-042 AB16132819 Berry Petroleum Company E-4681 CHP RFO2824 Elk Hills E-4682 CHP UPF2826 U.S. Borax Inc. E-4681 CHP RFO2829 Watson Cogeneration Company E-4714 CHP Bilateral2845 New-Indy Ontario E-4681 CHP RFO2847 Houweling Nurseries Oxnard, Inc. D. 09-12-042 AB16132855 New-Indy Oxnard E-4681 CHP RFO
11034 Calpine Energy Services LP- Gilroy E-4569 CHP QF11034 Calpine Energy Services LP- Los Medanos E-4569 CHP QF
2016 Billions of kwh Jan 16 Feb 16 Mar 16 Apr 16 May 16 Jun 16 Jul 16 Aug 16 Sep 16 Oct 16 Nov 16 Dec 16 Total

130
projects on-line that sold no power to SCE during the Record Period. Also during the Record Period, 1
SCE purchased 5.64 billion kWh130 from 8 active CHP contracts, and recorded CHP contract-related 2
costs of $146.07 million. 3
There was 3,064 MW of net on-line capacity available for sale to SCE from 4
PURPA and CHP projects during the Record Period (i.e., generating capacity net of station use and 5
other committed on-site loads). This net on-line capacity includes six technologies: (1) biomass; (2) 6
cogeneration or combined heat and power; (3) geothermal; (4) small hydro; (5) solar; and (6) wind.131 7
Approximately 53% of SCE’s net on-line capacity from PURPA, CHP RFO or CHP Bilateral PPAs is 8
from renewable technologies132 (1,623 net MW), while the remaining 47% is from cogeneration or other 9
QFs ineligible to be classified as renewable projects (1,441 net MW).133 During the Record Period, 256 10
MW of net on-line capacity from CHP projects achieved commercial operation. While most CHP and 11
PURPA projects are within SCE’s 50,000 square mile service area, SCE also has PURPA and CHP 12
contracts with projects in the service areas of PG&E, and the Imperial Irrigation District (IID). 13
The PURPA and CHP contracts administered by SCE during the Record Period 14
include: 3 AB 1613 contracts; 15 SO1 contracts; 6 SO2 contracts; 13 SO3 contracts; 62 ISO4 contracts; 15
20 NEG (negotiated) contracts; 10 CHP RFO contracts; 2 CHP Bilateral PPAs; and 5 QF SOC contracts. 16
130 Purchases in billion kWh from CHP projects by month were as follows:
131 SCE uses a numbering convention to identify contracts by technology. The 1000 series refers to biomass, the
2000 series refers to cogeneration, the 3000 series refers to geothermal, the 4000 series refers to small hydro, the 5000 series refers to solar, and the 6000 series refers to wind. In previous years, these were identified as “RAP ID”.
132 Renewable technologies include: small hydro projects less than 30 MW, biomass, geothermal, wind, and solar. Though classified as Qualifying Facilities, output from these RPS-eligible projects contribute to RPS goals.
133 Note that much of this capacity is due to projects that are currently delivering under Legacy PURPA contracts; however, many of these projects have signed and will begin deliveries under CHP RFO PPAs in upcoming Record Periods.
2016 Billions of kwh Jan 16 Feb 16 Mar 16 Apr 16 May 16 Jun 16 Jul 16 Aug 16 Sep 16 Oct 16 Nov 16 Dec 16 Total

131
c) PURPA and CHP Projects That Achieved Commercial Operation or Started 1
Delivering to SCE Under a New Contract 2
Table VII-48 shows the CHP and PURPA projects that came on-line or started 3
delivering to SCE under a new contract during the Record Period, totaling 256 MW. 4
Table VII-48 PURPA and CHP Contracts that Achieved Commercial Operation
January 1, 2016 Through December 31, 2016
d) Contract Development 5
During the Record Period, SCE entered into the PURPA and CHP contracts 6
identified in Table VII-49. 7
Table VII-49 PURPA and CHP New Contracts Executed
January 1, 2016 Through December 31, 2016
e) Contract Amendment Administration 8
Table VII-50 summarizes the PURPA and CHP amendments SCE entered into 9
during the Record Period for which we are seeking approval through this ERRA filing. 10
Project PPA Type Commercial On-line Date Capacity (MW )
1 New-Indy Ontario, LLC (f/k/a 2045) CHP RFO 1/1/2016 37.02 Elk Hills Power, LLC CHP RFO 1/1/2016 200.03 New-Indy Oxnard, LLC (f/k/a 2055) CHP RFO 4/1/2016 14.04 GFP Ethanol, LLC (Pixley Cogen Partners, LLC) AB1613 7/1/2016 5.0
Total MW 256.0
Project Contract Type Contract Capacity (MW)
Date Executed
CPUC Resolution or Decision/SCE Advice Letter
1 Smoke Tree Wind, LLC QF SOC 10.0 6/23/2016 D.10-12-035
2 O.L.S. Energy - Chino EEI MasterTolling Confirm 26.0 8/3/2016 AL 3585-E
3 Native American Energy Resources, LLC CHP PPA 201.0 – 213.0 8/22/2016 N/A, project terminated
4 Techni-Cast Corporation AB1613 1.0 12/19/2016 Res. E-4424

132
Table VII-50 PURPA and CHP Contract Amendments and Letter Agreements
January 1, 2016 Through December 31, 2016
ID Project Amendment or Agreement and Description Date Executed
1 2010 Loma Linda UniversityAmendment No.1 to modify the Interconnection Facilities Agreement (IFA) to reflect the relocation of the 66 kV facility.
4/4/2016
2 2050 AltaGas Pomona Energy Inc.Letter Agreement to extend contract term on a day-to-day basis while Amendment No. 5 was being finalized.
1/15/2016
3 2050 AltaGas Pomona Energy, Inc. Amendment No. 5 to extend the contract term and reduce contract price. 1/26/2016
4 2824 Elk Hills Power, LLC
1/14/2016
5 3001 Heber Geothermal Company LLC Amendment No. 5 to extend the contract term and resolve potential dispute. 1/28/2016
6 4025 Desert Water Agency
Letter Agreement to extend the contract term on a day-to-day basis while Amendment No. 1 was being finalized. The contract price is reduced during the extension period.
4/1/2016
7 4025 Desert Water Agency Amendment No. 1 to extend the termination date and reduce the contract price during the extension period.
4/10/2016
8 4152 Calleguas MWD (Springville Hydro) Amendment No. 1 to extend the contract term. 3/18/2016
9 4152 Calleguas MWD (Springville Hydro) Amendment No. 2 to extend the contract term. 4/4/2016
10 6031 EUI Management PH, Inc. Amendment No. 8 to extend the contract term 1/25/201611 6043 AES Tehachapi Wind, LLC (85-A) Amendment No. 7 to extend the contract term 1/13/201612 6043 AES Tehachapi Wind, LLC (85-A) Amendment No. 8 to extend the contract term 4/14/2016
13 6044 AES Tehachapi Wind, LLC (85-B) Amendment No. 7 to extend the contract term and reduce contract price 1/13/2016
14 6044 AES Tehachapi Wind, LLC 85-B Amendment No. 8 to extend the contract term 4/14/2016
15 6053 Difwind Farms Limited V Amendment No. 3 to extend the contract term and reduce contract price 11/8/2016
16 6087 Section 16-29 Trust (Altech III) Amendment No. 6 to extend the contract term. 1/8/201617 6087 Section 16-29 Trust (Altech III) Amendment No. 7 to extend the contract term. 3/2/201618 6088 Difwind Partners Trust Amendment No. 5 to extend the contract term. 1/12/201619 6088 Difwind Partners Trust Amendment No. 6 to extend the contract term. 3/2/201620 6094 Section 22 Trust (San Jacinto) Amendment No. 3 to extend the contract term. 1/8/201621 6094 Section 22 Trust (San Jacinto) Amendment No. 4 to extend the contract term. 1/21/201622 6096 Westwind Trust Amendment No. 4 to extend the contract term. 6/23/201623 6096 Westwind Trust Amendment No. 5 to extend the contract term. 12/19/201624 6112 Painted Hills Wind Developers Amendment No. 6 to extend the contract term. 1/5/2016
25 6213 The Bank of New York Mellon Trust Company, N.A. Letter Agreement to extend contract term. 12/21/2016
26 6234 Oak Creek Energy Trust Amendment No. 3 to extend the contract term. 12/28/2016
27 6462 Energy Development & Construction Corp. Amendment No. 2 to extend the contract term. 6/15/2016
28 6462 Energy Development & Construction Corp. Amendment No. 3 to extend the contract term. 12/19/2016

133
(1) Loma Linda University (ID 2010) 1
Loma Linda University is a 13.4 MW cogeneration project located in 2
Loma Linda, CA, executed as a Standard Offer 1 contract on December 4, 1989. SCE and Loma Linda 3
University executed Amendment No. 1 to its Interconnection Facilities Agreement (IFA) on April 4, 4
2016 to reflect the most recent relocation of the 66kV facility. The parties benefit from this amendment 5
through having correct information on the generating facility’s design for future reference. SCE’s 6
customers are indifferent to changes to Loma Linda’s interconnection. 7
(2) AltaGas Pomona Energy, Inc. (ID 2050) 8
AltaGas Pomona Energy, Inc. is a 40 MW combined heat and power 9
project located in Pomona, CA, executed as part of a bilateral negotiation on November 8, 1984. SCE 10
and AltaGas Pomona Energy, Inc. executed a Letter Agreement on January 15, 2016 to temporarily 11
extend the termination date of the PPA until the parties agree upon terms and conditions to formally 12
extend the termination date while AltaGas Pomona Energy, Inc. works toward becoming an independent 13
CAISO market participant. SCE’s customers benefit from this amendment because it lowers the energy 14
price to 85% of SRAC. In addition, SCE will not procure any capacity from AltaGas Pomona Energy, 15
Inc. 16
(3) AltaGas Pomona Energy, Inc. (ID 2050) 17
SCE and AltaGas Pomona Energy, Inc. executed Amendment No. 5 on 18
January 26, 2016 to extend the termination date of the contract beyond January 2, 2016 to the earlier of 19
(i) CAISO commercial operation date, with thirty days’ notice, or (ii) June 30, 2016, allowing AltaGas 20
Pomona Energy, Inc. time to become a CAISO independent market participant. Additionally, the 21
amendment clarifies that if a Generator Interconnection Agreement is executed and becomes effective, it 22
replaces the Interconnection Facilities Agreement (IFA) as the operative interconnection agreement. 23
SCE’s customers benefit from this amendment because it (i) lowers the energy price to 85% of SRAC, 24
(ii) indemnifies SCE against any CAISO sanctions or penalties, unless as a result of SCE’s negligence, 25
and (iii) does not allow for the procurement of capacity from the resource, for which SCE has no current 26
need. 27

134
(4) Elk Hills Power, LLC (ID 2824) 1
Elk Hills Power, LLC is a 200 MW cogeneration project located in 2
Tupman, CA, originally executed as a part of SCE’s CHP 2 solicitation. The PPA was executed on 3
April 23, 2014. SCE and Elk Hills Power, LLC executed Amendment No. 1 on January 14, 2016 4
5
6
Both parties benefit from this amendment as it 7
. 8
(5) Heber Geothermal Company LLC (ID 3001) 9
Heber Geothermal Company is a 52 MW geothermal facility located in 10
Heber, CA, originally executed as a negotiated contract. The PPA was executed on August 26, 1983. 11
SCE and Heber Geothermal Company executed Amendment No. 5 on January 28, 2016 to extend the 12
contract term by one day from, December 14, 2015 to December 15, 2015 to resolve a potential dispute 13
regarding the term end date and the energy scheduled for flow day December 15, 2015 by paying Hebert 14
Geothermal Company the market price (day-ahead CAISO LMP). SCE’s customers benefit from this 15
amendment by receiving renewable energy credits and paying a reduced capacity price of $0.00/kW-yr 16
for December 15, 2015. 17
(6) Desert Water Agency (ID 4025) 18
Desert Water Agency is a 1 MW in-conduit hydro facility located at 19
Whitewater River in Riverside County, CA, originally executed as a Standard Offer 4 contract on 20
September 28, 1984. SCE and Desert Water Agency executed a Letter Agreement on April 1, 2016, to 21
extend the termination date and reduce the capacity price during the extension period. As a QF project 22
under 20 MW, Desert Water Agency is entitled to a QF SOC of up to seven years in term. The 23
amendment utilizes the pricing from the QF SOC, while extending the expiration of the original PPA. 24
Both parties benefit from the reduced contract administration costs that resulted from allowing Desert 25
Water Agency to continue producing until their replacement PPA achieved commercial operation 26
without having to execute a new PPA in the interim. 27

135
(7) Desert Water Agency (ID 4025) 1
Desert Water Agency is a 1 MW in-conduit hydro facility located at 2
Whitewater River in Riverside County, CA, originally executed as a Standard Offer 4 contract on 3
September 28, 1984. SCE and Desert Water Agency executed Amendment No. 1 on April 10, 2016, to 4
extend the termination date and reduce the capacity price during the extension period. As a QF project 5
under 20 MW, Desert Water Agency is entitled to a QF SOC of up to seven years in term. The 6
amendment utilizes the pricing from the QF SOC, while extending the expiration of the original PPA. 7
Both parties benefit from the reduced contract administration costs that resulted from allowing Desert 8
Water Agency to continue producing until their replacement PPA achieved commercial operation 9
without having to execute a new PPA in the interim. 10
(8) Calleguas Municipal Water District - Springville Hydroelectric Generating 11
Facility (ID 4152) 12
Calleguas Municipal Water District (Springville) is a 1 MW hydro project 13
located in Camarillo, CA, executed as a Standard Offer 1 contract on April 7, 1993. SCE and Calleguas 14
Municipal Water District executed Amendment No. 1 on March 18, 2016 to extend the termination date 15
of the PPA to April 1, 2016, due to a delay in meeting the conditions precedent in Calleguas Municipal 16
Water District’s new PPA. As a QF project under 20 MW, Calleguas Municipal Water District is 17
entitled to a QF SOC of up to seven years in term. The amendment utilizes the pricing from the QF 18
SOC, while extending the expiration of the original PPA. Both parties benefit from the administrative 19
ease of amending the current PPA rather than originating a new form of PPA for the short period of 20
transition time between off-takers. 21
(9) Calleguas Municipal Water District - Springville Hydroelectric Generating 22
Facility (ID 4152) 23
Calleguas Municipal Water District (Springville) is a 1 MW hydro project 24
located in Camarillo, CA, executed as a Standard Offer 1 contract on April 7, 1993. SCE and Calleguas 25
Municipal Water District executed Amendment No. 2 on April 4, 2016 to extend the termination date to 26
April 8, 2016, due to a further delay in meeting the conditions precedent in Calleguas Municipal Water 27

136
District’s new PPA. As a QF project under 20 MW, Callegus Municipal Water District is entitled to a 1
QF SOC of up to seven years in term. The amendment utilizes the pricing from the QF SOC, while 2
extending the expiration of the original PPA. Both parties benefit from the administrative ease of 3
amending the current PPA rather than originating a new form of PPA for the short period of transition 4
time between off-takers. 5
(10) EUI Management PH, Inc. (ID 6031) 6
EUI Management PH, Inc. is a 24 MW wind project located in Riverside, 7
CA, executed as a Standard Offer 4 contract on March 28, 1984. SCE and EUI Management PH, Inc. 8
executed Amendment No. 8 on January 25, 2016, to extend the termination date of the PPA from 9
December 31, 2015 to March 31, 2016 and reduce the capacity price while EUI Management PH, Inc. 10
prepared the facility for its transition into two new PURPA contracts sized at 16 and 8 MW. The 11
amendment utilizes pricing from the QF SOC, while extending the expiration of the original PPA. Both 12
parties benefit from the administrative ease of amending the current PPA rather than originating a new 13
form of PPA for the short period of transition time between off-takers. 14
(11) AES Tehachapi Wind, LLC (85-A) (ID 6043) 15
AES Tehachapi Wind is a 14.89 MW wind project located in Lancaster, 16
CA, executed as a Standard Offer 4 contract on June 22, 1984. SCE and AES Tehachapi Wind executed 17
Amendment No. 7 on January 13, 2016 to extend the contract term to provide additional time to finalize 18
their Small Generation Interconnection Agreement (SGIA). As a QF project under 20 MW, AES 19
Tehachapi Wind is entitled to a QF SOC of up to seven years in term. The amendment utilizes the 20
pricing from the QF SOC, while extending the expiration of the original PPA. Both parties benefit from 21
the administrative ease of amending the current PPA rather than originating a new form of PPA for the 22
short period of transition time between off-takers. 23
(12) AES Tehachapi Wind, LLC (85-A) (ID 6043) 24
AES Tehachapi Wind is a 14.89 MW wind project located in Lancaster, 25
CA, executed as a Standard Offer 4 contract on June 22, 1984. SCE and AES Wind Tehachapi executed 26
Amendment No. 8 on April 14, 2016 to further extend the contract term to provide additional time to 27
137
finalize their Small Generation Interconnection Agreement (SGIA). As a QF project under 20 MW, 1
AES Tehachapi Wind is entitled to a QF SOC of up to seven years in term. The amendment utilizes the 2
pricing from the QF SOC, while extending the expiration of the original PPA. Both parties benefit from 3
the administrative ease of amending the current PPA rather than originating a new form of PPA for the 4
short period of transition time between off-takers. 5
(13) AES Tehachapi Wind LLC (85-B) (ID 6044) 6
AES Tehachapi Wind is a 21.24 MW wind project located in Lancaster, 7
CA, originally executed as a Standard Offer 4 contract on June 22, 1984. SCE and AES Tehachapi 8
Wind executed Amendment No. 7 on January 13, 2016 to extend the contract term to provide additional 9
time to allow AES Tehachapi Wind time to obtain a Large Generation Interconnection Agreement 10
(LGIA). SCE’s customers benefit from this amendment because the energy price is reduced to 85% of 11
SRAC and the capacity price is reduced to $0.00/kW-yr during the extension. 12
(14) AES Tehachapi Wind LLC (85-B) (ID 6044) 13
SCE and AES Tehachapi Wind executed Amendment No. 8 on April 14, 14
2016 to further extend the contract term date to provide additional time to allow AES Tehachapi Wind 15
time to obtain a Large Generation Interconnection Agreement (LGIA). SCE’s customers benefit from 16
this amendment by maintaining the energy and capacity price reduction set forth in Amendment No. 7. 17
(15) Difwind Farms Limited V (ID 6053) 18
Difwind Farms Limited V is a 7.9 MW wind project located in Riverside 19
County, CA, executed as a Standard Offer 4 contract on July 6, 1984. SCE and Difwind Farms Limited 20
V executed Amendment No. 3 on November 8, 2016, to extend the termination date, reduce the energy 21
price to 80% of SRAC and reduce the capacity price to $0.00/kW-yr while Difwind Farms Limited V 22
prepared to be a merchant wind facility. SCE’s customers benefit from this amendment because of the 23
savings associated with the reduced energy and capacity pricing. 24
(16) Section 16-29 Power Purchase Contract Trust (Altech III) (ID 6087) 25
Section 16-29 Power Purchase Contract Trust is a 34 MW wind project 26
located in Palm Springs, CA, executed as a Standard Offer 4 contract on April 16, 1985. SCE and 27

138
Section 16-29 Power Contract Trust executed Amendment No. 6 on January 8, 2016 to extend the 1
contract term to provide additional time to obtain their Generation Interconnection Agreement (GIA). 2
Both parties benefit from the administrative ease of amending the current PPA rather than originating a 3
new form of PPA for the short period of transition time between off-takers. SCE’s customers benefit 4
from this amendment because of the energy price reduction to 85% of SRAC and the capacity price is 5
reduced to $0.00/kW-yr during the extended time period. 6
(17) Section 16-29 Power Purchase Contract Trust (Altech III) (ID 6087) 7
SCE and Section 16-29 Power Contract Trust executed Amendment No. 7 8
on March 2, 2016 to extend the contract term to provide additional time to obtain their Generation 9
Interconnection Agreement (GIA). Both parties benefit from the administrative ease of amending the 10
current PPA rather than originating a new form of PPA for the short period of transition time between 11
off-takers. SCE’s customers benefit from this amendment because of the reduction of the energy price 12
to 75% of SRAC and the capacity price is $0.00/kW-yr during the extended time period. 13
(18) Difwind Partners Trust (ID 6088) 14
Difwind Partners Trust is a 14 MW wind project located in Palm Springs, 15
CA, originally executed as a Standard Offer 4 contract on April 16, 1985. SCE and Difwind Partners 16
Trust executed Amendment No. 5 on January 12, 2016 to extend the contract term end date to February 17
22, 2016 to provide additional time to obtain their Generation Interconnection Agreement (GIA). As a 18
QF project under 20 MW, Difwind Partners Trust is entitled to a QF SOC PPA of up to seven years in 19
term. The amendment utilizes the pricing from the QF SOC, while extending the expiration of the 20
original PPA. Both parties benefit from the administrative ease of amending the current PPA rather than 21
originating a new form of PPA for the short period of transition time between off-takers. 22
(19) Difwind Partners Trust (ID 6088) 23
SCE and Difwind Partners Trust executed Amendment No. 6 on March 2, 24
2016 to extend the Contract Term end date to March 10, 2016 to provide additional time to obtain their 25
Generation Interconnection Agreement (GIA). As a QF project under 20 MW, Difwind Partners Trust is 26
entitled to a QF SOC PPA of up to seven years in term. The amendment utilizes the pricing from the QF 27

139
SOC, while extending the expiration of the original PPA. Both parties benefit from the administrative 1
ease of amending the current PPA rather than originating a new form of PPA for the short period of 2
transition time between off-takers. 3
(20) Section 22 Power Contract Trust (San Jacinto) (ID 6094) 4
Section 22 Power Contract Trust is a 17 MW wind project located in San 5
Gorgonio Pass, Riverside, CA executed as a Standard Offer 4 contract on April 16, 1985. SCE and 6
Section 22 Power Contract Trust executed Amendment No. 3 on January 8, 2016 to extend the contract 7
term to provide additional time to obtain their Generation Interconnection Agreement (GIA). As a QF 8
project under 20 MW, Section 22 Power Contract Trust is entitled to a QF SOC of up to seven years in 9
term. The amendment utilizes the pricing from the QF SOC, while extending the expiration of the 10
original PPA. Both parties benefit from the administrative ease of amending the current PPA rather than 11
originating a new form of PPA for the short period of transition time between off-takers. 12
(21) Section 22 Power Contract Trust (San Jacinto) (ID 6094) 13
SCE and Section 22 Power Contract Trust executed Amendment No. 4 on 14
January 21, 2016 to extend the contract term to provide additional time to obtain their Generation 15
Interconnection Agreement (GIA). As a QF project under 20 MW, Section 22 Power Contract Trust is 16
entitled to a QF SOC of up to seven years in term. The amendment utilizes the pricing from the QF 17
SOC, while extending the expiration of the original PPA. Both parties benefit from the administrative 18
ease of amending the current PPA rather than originating a new form of PPA for the short period of 19
transition time between off-takers. 20
(22) Westwind Trust (ID 6096) 21
Westwind Trust is a 12.77 MW project located in Riverside County, CA, 22
originally executed as a Standard Offer 4 contract on April 17, 1985. SCE and Westwind Trust 23
executed Amendment No. 4 on June 23, 2016 to extend the termination date to coincide with the 24
transition to a new QF SOC contract for Smoke Tree Wind, LLC (ID 6496). The termination extension 25
states that the termination date shall not go beyond December 31, 2016. SCE’s customers benefit from 26

140
this amendment because of the price reduction to 50% of SRAC for energy and the reduction of the 1
capacity payment from $51.05/kW-yr to $0.00/kW-yr. 2
(23) Westwind Trust (ID 6096) 3
SCE and Westwind Trust executed Amendment No. 5 on December 19, 4
2016 to extend the term again to April 30, 2017 allowing the project additional time to execute a Small 5
Generation Interconnection Agreement (SGIA). SCE’s customers benefit from this amendment by 6
maintaining the price reductions established in Amendment No. 4. 7
(24) Painted Hills Wind Developers (ID 6112) 8
Painted Hills Wind Developers is a 19.045 MW wind project located in 9
Riverside, County CA, executed as a Standard Offer 4 contract executed on April 16, 1985. SCE and 10
Painted Hills Wind Developers executed Amendment No. 6 on January 5, 2016 to extend the 11
termination date from November 30, 2015 to March 31, 2016, while Painted Hills Wind Developers 12
prepared the facility for transition. As a QF project under 20 MW, Painted Hills Wind Developers is 13
entitled to a QF SOC of up to seven years in term. The amendment utilizes the pricing from the QF 14
SOC, while extending the expiration of the original PPA. Both parties benefit from the administrative 15
ease of amending the current PPA rather than originating a new form of PPA for the short period of 16
transition time between off-takers. 17
(25) The Bank of New York Mellon Trust Company, N.A. (ID 6213) 18
The Bank of New York Mellon Trust Company, N.A. is a 5.93 MW wind 19
project located near Palm Springs, CA, executed a Standard Offer 4 contract on September 10, 1986. 20
SCE and The Bank of New York Mellon Trust Company, N.A. executed a Letter Agreement on 21
December 21, 2016 to extend the contract termination date day-for-day, from December 22, 2016, until 22
an amendment to the PPA is executed; provided, the day-for-day extension did not exceed January 6, 23
2017. This extension allowed time for the Generating Facility to finalize a new Generator 24
Interconnection Agreement (“GIA”). As a QF project under 20 MW, The Bank of New York Mellon 25
Trust Company is entitled to a QF SOC of up to seven years in term. The amendment utilizes the 26
pricing from the QF SOC, while extending the expiration of the original PPA. Both parties benefit from 27

141
the administrative ease of amending the current PPA rather than originating a new form of PPA for the 1
short period of transition time between off-takers. 2
(26) Oak Creek Energy Trust (ID 6234) 3
Oak Creek Energy Trust is a 21.59 MW project located in Kern County, 4
CA, executed a Standard Offer 4 contract on August 25, 1989. SCE and Oak Creek Energy Trust 5
executed Amendment No. 3 on December 28, 2016 to extend the PPA term to January 31, 2017. The 6
amendment is to allow the project additional time to finalize a new Small Generator Interconnection 7
Agreement (SGIA). SCE’s customers benefit from this amendment because of the reduction of the 8
energy price to 50% of SRAC and the capacity price is reduced to $0.00/kW-yr. 9
(27) Energy Development & Construction Corp. (ID 6462) 10
Energy Development & Construction Corp. (EDCC) is an 11.7 MW wind 11
project located in North Palm Springs, CA, executed as a QF SOC on June 25, 2015. SCE and EDCC 12
executed Amendment No. 2 on June 15, 2016 to extend the delivery term under the EDCC PPA by an 13
additional 6 months while EDCC searched for an off-taker for its renewable power. Since EDCC is a 14
QF under 20 MW in size, it is entitled to repeated QF SOC contracts. Both parties benefit from the 15
administrative ease of amending the current PPA rather than originating a new form of PPA for the short 16
period of transition time between off-takers. 17
(28) Energy Development & Construction Corp. (ID 6462) 18
Energy Development & Construction Corp. (EDCC) is an 11.7 MW wind 19
project located in North Palm Springs, CA, executed as a QF SOC on June 25, 2015. SCE and EDCC 20
executed Amendment No. 3 on December 19, 2016 to extend the delivery term under the EDCC PPA by 21
an additional 6 months while EDCC searches for an off-taker for its renewable power. Since EDCC is a 22
QF under 20 MW in size, it is entitled to repeated QF SOC contracts. Both parties benefit from the 23
administrative ease of amending the current PPA rather than originating a new form of PPA for the short 24
period of transition time between off-takers. 25

142
f) Contract Assignment Administration 1
PURPA and CHP contracts typically may be assigned to other parties based upon 2
the written consent of the parties, which may not be unreasonably withheld. Counterparties may request 3
SCE’s consent to assignment of their contracts for many reasons, including, among others, the project’s 4
sale or transfer to a new entity or the contract’s assignment to a lender as security for a loan. Certain 5
assignments may require SCE to consent to the appointment of a project manager. Table VII-51 lists the 6
PURPA contract assignments to which SCE consented during the Record Period. 7
Table VII-51 CHP and PURPA Contract Consents and Consents to Assignments
January 1, 2016 Through December 31, 2016
(1) E.F. Oxnard Inc. (ID 2205) 8
E.F. Oxnard Inc. is a 48.5 MW cogeneration project located in Ventura 9
County, CA, executed as a negotiated Standard Offer contract on December 13, 1985. SCE and E.F. 10
Oxnard executed a Consent to Collateral Assignment on April 13, 2016 to allow the project to seek 11
additional financing. SCE’s customers are indifferent as to the execution of this consent. 12
(2) Exxon Mobil Oil Corporation (ID 2215) 13
Exxon Mobil Oil Corporation is a 41.9 MW cogeneration project located 14
in Torrance, CA, executed as a negotiated agreement on December 2, 1987. SCE and Exxon Mobil 15
ID Project Type of Assignment or Consents Date Signed
1 2205 E.F. Oxnard Incorporated Consent to Collateral Assignment 4/13/2016
2 2215 Exxon Mobil Oil Corporation Consent to Assignment 6/28/2016
3 6043 AES Tehachapi Wind, LLC (85-A) Consent to Assignment 3/24/2016
4 6105 Terra-Gen 251 Wind, LLC (Monolith X) Consent to Assignment 3/24/2016
5 6106 Terra-Gen 251 Wind, LLC (Monolith XI) Consent to Assignment 3/24/2016

143
executed a Consent to Assignment on June 28, 2016 due to a sale of the project to PBF Holding 1
Company, LLC. SCE’s customers are indifferent as to the execution of this consent. 2
(3) AES Tehachapi Wind, LLC (85-A) (ID 6043) 3
AES Tehachapi Wind is a 14.89 MW wind project located in Lancaster, 4
CA, executed as a Standard Offer 4 contract on June 22, 1984. SCE, AES Tehachapi Wind, and Terra-5
Gen 251 Wind, LLC executed a Consent to Assignment on March 24, 2016 to assign all of Terra Gen 6
251 Wind, LLC’s rights, duties, and obligations under the PPA to AES Tehachapi Wind, LLC, making 7
AES Tehachapi Wind, LLC the sole owner of the project. SCE’s customers are indifferent as to the 8
execution of this consent. 9
(4) Terra-Gen 251 Wind, LLC (Monolith X) (ID 6105) 10
Terra-Gen 251 Wind, LLC (Monolith X) is a 5 MW wind project located 11
in Kern County, CA, executed as a Standard Offer 4 contract on April 16, 1985. SCE and Monolith X 12
executed a Consent to Assignment on March 24, 2016 to assign a minority ownership held by AES to 13
Terra-Gen, thereby granting Terra-Gen full ownership of the Monolith X project. SCE’s customers are 14
indifferent as to the execution of this consent. 15
(5) Terra-Gen 251 Wind, LLC (Monolith XI) (ID 6106) 16
Terra-Gen 251 Wind, LLC (Monolith XI) is a 5 MW wind project located 17
in Kern County, CA executed as a Standard Offer 4 contract on April 16, 1985. SCE and Monolith XI 18
executed a Consent to Assignment on March 24, 2016 to assign a minority ownership held by AES to 19
Terra-Gen, thereby granting Terra-Gen full ownership of the Monolith XI project. SCE’s customers are 20
indifferent as to the execution of this consent. 21
g) Affiliate Transactions and Contract Information 22
SCE had no affiliate PURPA or CHP contracts during the record period. 23
h) Uncontrollable Force Administration 24
SCE’s SO2, ISO4 contracts, many of its NEG contracts, and CHP contracts 25
include provisions that may excuse a PURPA or CHP project from performing certain contractual 26
obligations to the extent the project can demonstrate that the occurrence of an uncontrollable force 27
144
prevented the project from performing such obligations. An uncontrollable force is any circumstance 1
beyond a project’s reasonable control as defined in the agreements, and is often known as a force 2
majeure. 3
Whenever a PURPA or CHP contract holder claims that an uncontrollable force 4
caused it to fail to meet its contractual obligations, SCE undertakes the following activities: 5
Determines whether the claim was submitted within the contractually-required period, 6
which is typically two weeks. 7
Requires that the counterparty submit sufficient evidence to substantiate the claim that an 8
uncontrollable force event occurred. This may include meteorological or weather reports 9
to support a claim of weather damage, construction and equipment specifications, 10
manufacturer maintenance manuals and bulletins, the project’s operations and 11
maintenance/repair logs, copies of insurance claims, damage assessments, failure reports, 12
or other relevant materials. 13
Evaluates whether the suspension of performance was of no greater scope and of no 14
longer duration than was required by the uncontrollable force, and that the contract holder 15
used its best efforts to remedy its inability to perform. 16
If SCE grants the claim, and if the contract does not provide otherwise, the firm 17
capacity PURPA or CHP contract counterparty will continue to receive firm capacity payments for up to 18
90 days from the occurrence, despite its inability to deliver power to SCE. Such payments are typically 19
based upon the project’s historical performance during the affected time period. In addition, during the 20
period of an approved uncontrollable force event, delivery requirements under the contract are excused. 21
Table VII-52 shows the status of the uncontrollable force claims tendered to SCE 22
or pending during the Record Year. 23
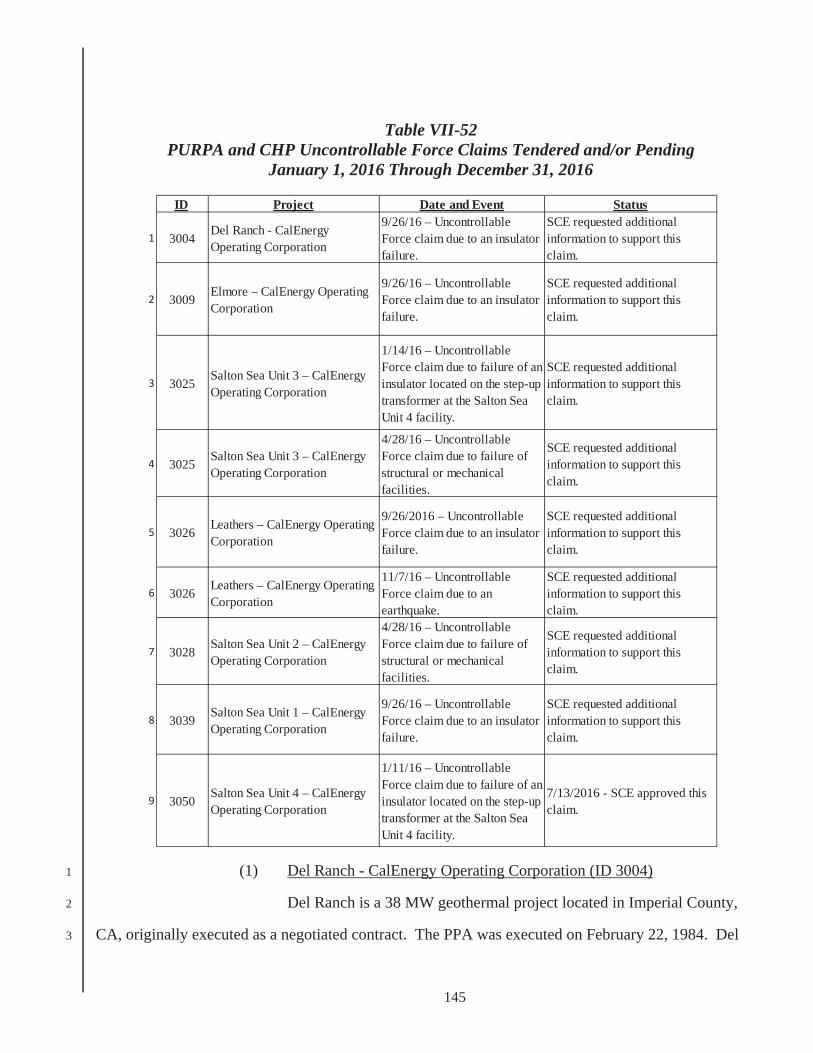
145
Table VII-52 PURPA and CHP Uncontrollable Force Claims Tendered and/or Pending
January 1, 2016 Through December 31, 2016
(1) Del Ranch - CalEnergy Operating Corporation (ID 3004) 1
Del Ranch is a 38 MW geothermal project located in Imperial County, 2
CA, originally executed as a negotiated contract. The PPA was executed on February 22, 1984. Del 3
ID Project Date and Event Status
1 3004 Del Ranch - CalEnergy Operating Corporation
9/26/16 – Uncontrollable Force claim due to an insulator failure.
SCE requested additional information to support this claim.
2 3009 Elmore – CalEnergy Operating Corporation
9/26/16 – Uncontrollable Force claim due to an insulator failure.
SCE requested additional information to support this claim.
3 3025 Salton Sea Unit 3 – CalEnergy Operating Corporation
1/14/16 – Uncontrollable Force claim due to failure of an insulator located on the step-up transformer at the Salton Sea Unit 4 facility.
SCE requested additional information to support this claim.
4 3025 Salton Sea Unit 3 – CalEnergy Operating Corporation
4/28/16 – Uncontrollable Force claim due to failure of structural or mechanical facilities.
SCE requested additional information to support this claim.
5 3026 Leathers – CalEnergy Operating Corporation
9/26/2016 – Uncontrollable Force claim due to an insulator failure.
SCE requested additional information to support this claim.
6 3026 Leathers – CalEnergy Operating Corporation
11/7/16 – Uncontrollable Force claim due to an earthquake.
SCE requested additional information to support this claim.
7 3028 Salton Sea Unit 2 – CalEnergy Operating Corporation
4/28/16 – Uncontrollable Force claim due to failure of structural or mechanical facilities.
SCE requested additional information to support this claim.
8 3039 Salton Sea Unit 1 – CalEnergy Operating Corporation
9/26/16 – Uncontrollable Force claim due to an insulator failure.
SCE requested additional information to support this claim.
9 3050 Salton Sea Unit 4 – CalEnergy Operating Corporation
1/11/16 – Uncontrollable Force claim due to failure of an insulator located on the step-up transformer at the Salton Sea Unit 4 facility.
7/13/2016 - SCE approved this claim.

146
Ranch provided a Notice of Event of Uncontrollable Force to SCE on September 26, 2016 that on 1
September 20, 2016 it experienced issues on the MW-1 transmission line that delivers output from Del 2
Ranch through Imperial Irrigation District’s (IID) system to SCE. These issues forced the facility to 3
cease operations on that day. Seller claims an insulator failure due to weather conditions in the area was 4
deemed to have caused the failure. The facility returned to service on September 21, 2016. SCE has 5
requested supporting documentation to assess the validity of this claim. 6
(2) Elmore – CalEnergy Operating Corporation (ID 3009) 7
Elmore is a 38 MW geothermal project located in Imperial County, CA, 8
originally executed as a Standard Offer 4 contract on June 15, 1984. Elmore provided a Notice of Event 9
of Uncontrollable Force to SCE on September 26, 2016 that on September 20, 2016 it experienced 10
issues on the MW-1 transmission line that delivers output from Elmore through IID’s system to SCE. 11
These issues forced the facility to cease operations on that day. Seller claims an insulator failure due to 12
weather conditions in the area was deemed to have caused the failure. The facility returned to service on 13
September 22, 2016. SCE has requested supporting documentation to assess the validity of this claim. 14
(3) Salton Sea Unit 3 – CalEnergy Operating Corporation (ID 3025) 15
Salton Sea Unit 3 is 49.8 MW geothermal project located in Imperial 16
County, CA, originally executed as a Standard Offer 4 contract on April 16, 1985. Salton Sea Unit 3 17
provided a Notice of Event of Uncontrollable Force to SCE on January 14, 2016 that on January 5, 2016 18
it incurred a reduction in the amount of energy and capacity available from the facility due to a failure of 19
an insulator located on the step-up transformer at the Salton Sea Unit 4 facility, causing that transformer 20
to fail. Seller claims that when Unit 4 is non-operational, the replacement steam utilized to minimize 21
impact on Unit’s 3 output contains higher concentrations of non-condensable gas which, in turn, creates 22
a partial vacuum in the Unit 1-3 steam delivery system. This ultimately decreases the amount of steam 23
that normally would flow to Unit 3’s turbines, thereby reducing the output of the facility. SCE has 24
requested supporting documentation to assess the validity of this claim. 25

147
(4) Salton Sea Unit 3 – CalEnergy Operating Corporation (ID 3025) 1
Salton Sea Unit 3 is 49.8 MW geothermal project located in Imperial 2
County, CA, originally executed as a Standard Offer 4 contract on April 16, 1985. Salton Sea Unit 3 3
provided a Notice of Event of Uncontrollable Force to SCE on April 28, 2016 that on February 16, 2016 4
the project was taken out of service to perform annual scheduled maintenance and, in conjunction 5
therewith, brine flow from supporting geothermal wells was curtailed. 6
As the facility was brought back into service in late March, Seller also re-7
started operation of its supporting geothermal wells beginning on March 29, 2016, one of which is 8
Vonderahe-3. Seller claims that despite following the established practices and procedures, at the end of 9
the normal ramp-up period, the well continued to produce brine at substantially reduced levels. After 10
repeated attempts to attain normal brine production, Seller provided this timely claim of Uncontrollable 11
Force. Seller believes the cause is most likely due to a failure of the structural or mechanical facilities 12
associated with the well and not due to lowered geothermal resource productivity. SCE has requested 13
supporting documentation to assess the validity of this claim. 14
(5) Leathers – CalEnergy Operating Corporation (ID 3026) 15
Leathers is a 38 MW geothermal project located in Imperial County, CA, 16
executed as a Standard Offer 4 contract on April 16, 1984. Leathers provided a Notice of Event of 17
Uncontrollable Force to SCE on September 26, 2016 that on September 20, 2016 it experienced issues 18
on the MW-1 transmission line that delivers output from Leathers through IID’s system to SCE. These 19
issues forced the facility to cease operations on that day. Seller claims an insulator failure due to 20
weather conditions in the area was deemed to have caused the failure. The facility returned to service on 21
September 22, 2016. SCE has requested supporting documentation to assess the validity of this claim. 22
(6) Leathers – CalEnergy Operating Corporation (ID 3026) 23
Leathers is a 38 MW geothermal project located in Imperial County, CA, 24
originally executed as part of SCE’s Standard Offer 4 program. The PPA was executed on April 16, 25
1984. Leathers provided a Notice of Event of Uncontrollable Force to SCE on November 7, 2016 that 26
on October 31, 2016 it experienced a series of earthquakes that jolted the Leathers 92kV main 27

148
transformer, which caused the pressure relief device on the transformer to activate, opening the line 1
breaker as a protective measure. These issues forced the facility offline from October 31, 2016 at 02:43 2
through November 1, 2016 at 02:00. SCE has requested supporting documentation to assess the validity 3
of this claim. 4
(7) Salton Sea Unit 2 – CalEnergy Operating Corporation (ID 3028) 5
Salton Sea Unit 2 is 25 MW geothermal project located in Imperial 6
County, CA, executed as a Standard Offer 4 contract on April 16, 1985. Salton Sea Unit 2 provided a 7
Notice of Event of Uncontrollable Force to SCE on April 28, 2016 that the project was taken out of 8
service to perform annual scheduled maintenance and, in conjunction therewith, brine flow from 9
supporting geothermal wells was curtailed. As the facility was brought back into service in late March, 10
Seller also re-started operation of its supporting geothermal wells beginning on March 29, 2016, one of 11
which is Vonderahe-3. Seller claims that despite following the established practices and procedures, at 12
the end of the normal ramp-up period, the well continued to produce brine at substantially reduced 13
levels. After repeated attempts to attain normal brine production, Seller provided his timely claim of 14
Uncontrollable Force. Seller believes the cause is most likely due to a failure of the structural or 15
mechanical facilities associated with the well and not due to lowered geothermal resource productivity. 16
SCE has requested supporting documentation to assess the validity of this claim. 17
(8) Salton Sea Unit 1 – CalEnergy Operating Corporation (ID 3039) 18
Salton Sea Unit 1 is a 10 MW geothermal project located in Imperial 19
County, CA, executed as a negotiated contract on May 8, 1987. Salton Sea Unit 1 provided a Notice of 20
Event of Uncontrollable Force to SCE on September 26, 2016 that on September 20, 2016 it experienced 21
issues on the 34.5 kV transmission line that delivers output from Unit 1 through IID’s system to SCE. 22
Seller claims these issues forced the facility to cease operations on three separate occasions. Seller also 23
claims an insulator failure due to weather conditions in the area was deemed to have caused the failure. 24
The facility returned to service on September 21, 2016. SCE has requested supporting documentation to 25
assess the validity of this claim. 26

149
(9) Salton Sea Unit 4 – CalEnergy Operating Corporation (ID 3050) 1
Salton Sea Unit 4 is a 36 MW geothermal project located in Imperial 2
County, CA, executed as a negotiated contract on November 29, 1994. Salton Sea Unit 4 provided a 3
Notice of Event of Uncontrollable Force to SCE on January 11, 2016 that on January 5, 2016 it incurred 4
a failure resulting in its inability to deliver energy or available capacity. Seller claims the failure was 5
due to the failure of an insulator located on the facility’s main switchyard. The project returned to 6
service on February 12, 2016, thereby enabling it to resume deliveries to SCE. SCE has approved this 7
claim. 8
i) Forced Outage Claim Administration 9
A forced outage claim is approved when a project operating pursuant to a PURPA 10
or CHP contract is otherwise capable of generating electricity, but is forced to shut down either because 11
SCE is unable to receive the generation due to abnormal system conditions or because of a failure in the 12
project’s operations. An approved forced outage claim generally has the same effect upon the project as 13
an approved uncontrollable force claim; namely, the project’s performance requirements are excused 14
during the period of the forced outage. The forced outage may also be contractually obligated and 15
defined in the contract. 16
There is no deadline specified in the PURPA or CHP contracts by which the 17
counterparty must notify SCE that a forced outage has occurred. However, SCE considers the 18
promptness with which the claim is submitted, among other factors, in determining whether to grant the 19
claim. In assessing the claim, SCE verifies that an outage occurred, whether the outage resulted from an 20
event that constitutes a forced outage under the contract, and the magnitude and duration of the outage. 21
If appropriate, SCE analyzes meter data, substation logs, and system operations reports in reviewing the 22
claim. During the Record Period there were no forced outage claims to report. 23
j) Dispute Resolution and Litigation 24
Details on PURPA and CHP Project dispute resolutions and litigation activities 25
during the Record Period are provided below. 26

150
(1) Ormesa LLC (ID 3104) 1
Ormesa LLC (Ormesa) is a 53 MW geothermal project located in Imperial 2
County, California, executed as a Standard Offer 4 contract on July 18, 1984. On June 28, 2016, 3
Ormesa invoked the Contract’s dispute resolution provision relating to its 2016 Capacity Demonstration 4
test, which occurred on June 3, 2016 and resulted in liquidated damages of $695,400 (“CapDemo 5
LD”). Specifically, Ormesa sought to schedule an additional Capacity Demonstration, contending that a 6
well failure occurring more than three weeks prior to the Capacity Demonstration constituted an 7
abnormal and unforeseeable operating condition. SCE disagreed, contending that Ormesa had ample 8
time to reschedule the Capacity Demonstration as permitted under the Contract. 9
On October 17, 2016, Ormesa raised a new dispute stating that the 2016 10
Capacity Demonstration should be based on the derated Contract Capacity of 36,500 kW, rather than 11
46,500 kW; contending that since it failed its Peak Performance Requirements while on probation, 12
resulting in it being derated effective July 1, 2016, it should only be required to demonstrate a Contract 13
Capacity equal to the derated value. The deration of the Contract Capacity to 36,500 kW resulted in an 14
amount that Ormesa owed to SCE of $918,338.96 (“Capacity Refund Payment”). Ormesa agreed to the 15
amount of Capacity Refund. In a December 22, 2016 letter, SCE rejected Ormesa’s new dispute that the 16
liquidated damages assessed for the 2016 Capacity Demonstration is not appropriate during a year in 17
which Ormesa is also derated. SCE explained to Ormesa that since the 2016 Capacity Demonstration 18
occurred prior to the deration of the Contract Capacity, the CapDemo liquidated damages were 19
calculated correctly based on a Contract Capacity of 46,500 kW. Going forward, future Capacity 20
Demonstrations will be based on the derated Contract Capacity. 21
SCE collected both the $695,400 liquidated damages payment for failure 22
of the 2016 Capacity Demonstration and the $918,338.96 Capacity Refund Payment for the deration of 23
the Contract Capacity from monthly contract payments due to Ormesa. Ormesa has the right to seek 24
legal remedies regarding this dispute. On March 2, 2017, Ormesa filed a complaint against SCE 25
regarding the CapDemo liquidated damages at the United States District Court, Central District of 26
California. On March 14, 2017, Ormesa withdrew its lawsuit against SCE without prejudice. 27

151
1
(2) Coso Energy Developers (BLM) (ID 3030) 2
Coso Energy Developers (BLM) is a 67.5 MW geothermal project located 3
in Inyo County, CA executed as a Standard Offer 4 contract on February 1, 1985. On September 21, 4
2016 BLM failed its annual Capacity Demonstration. The project tested at 63.95 MW instead of the 5
required 67.5 MW. SCE derated the contract capacity of the project and issued an invoice for a refund 6
payment from BLM in the amount of $179,303, which was netted out of BLM’s monthly payment. 7
BLM demanded a retest and performed it unilaterally, but SCE denied the retest and did not recognize 8
the retest as valid. There has been no further communication regarding this dispute and SCE considers 9
the matter closed. 10
k) Contract Terminations 11
Table VII-53 below identifies the terminations that occurred during the Record 12
Period. 13

152
Table VII-53 PURPA and CHP Contract Terminations
January 1, 2016 Through December 31, 2016
ID Project Capacity (MW) Contract Type
Termination Date Notes
1 1026 Commerce Refuse To Energy Authority 12.00 NEG 12/31/2016 Contract expired.
2 1077 L.A. County Sanitation District-Spadra 8.00 NEG 12/14/2016 Early termination. SCE collected a
capacity refund of $1,222,720.
3 1090 L.A. Co. Sanitation Dist. 46.50 NEG 12/31/2016 Contract expired. SCE collected a capacity refund $526,250.
4 2005 Chevron U.S.A. Inc. 1.50 NEG 5/31/2016 Seller exercised right to terminate.
5 2050 AltaGas Pomona Energy Inc. 40.00 NEG 5/31/2016 Contract expired.
6 2055 New-Indy Oxnard, LLC 25.00 SO4 3/31/2016 Contract expired. Re-signed under new CHP RFO contract ID 2855.
7 2077 Rio Bravo Jasmin 41.00 SO4 1/20/2016Termination Agreement was approved by the CPUC via Advice Letter 3234-E.
8 2344Arcadia Unified School District - Arcadia High School
0.07 SO3 3/16/2016 Mutual termination; the project was never built.
9 2828 Native American Energy Resources, LLC 201.01 - 213.49 CHP RFO 9/2/2016 The project failed to post the
required Development Security.
10 2831 Coalinga Cogeneration Company, LLC 39.50 CHP RFO 7/30/2016
Contract was terminated by Seller due to lack of CPUC approval in the allotted timeframe.
11 3006 Vulcan/Bn Geothermal Power Co 34.00 SO4 2/9/2016 Contract expired.
12 4025 Desert Water Agency 1.00 SO4 5/31/2016 Contract expired. Re-signed under new ReMAT contract ID 4225.
13 4036 Three Valleys MWD (Miramar) 0.52 SO4 7/15/2016
Contract expired, will generate under Net Energy Metering program.
14 4052Calleguas Municipal Water District (Santa Rosa)
0.25 SO4 6/30/2016 Contract expired. Re-signed under new ReMAT contract ID 4352.
15 4152 Calleguas MWD (Springville Hydro) 1.00 SO1 4/7/2016 Contract expired. Re-signed under
new ReMAT ID 4252.
16 5843 Summer Solar North, LLC 6.50 QF SOC 6/29/2016Contract expired. Project became part of existing RSC20 contract ID 5476.
17 6031 EUI Management PH Inc. 24.00 SO4 3/31/2016 Contract expired.
18 6037 Tehachapi Power Purchase Contract Trust 56.00 SO4 12/15/2016 Contract expired.
19 6043 AES Tehachapi Wind, LLC 85-A 14.89 SO4 4/30/2016
Contract extension terminated early due to completion of replacement interconnection agreement.
20 6044 AES Tehachapi Wind, LLC 85-B 21.24 SO4 4/30/2016
Contract extension terminated early due to completion of replacement interconnection agreement.

153
1
3. RPS 2
Commission Resolutions approving RPS contracts typically provide for the recovery of 3
all payments made pursuant to those contracts, subject to the Commission’s review of the 4
reasonableness of SCE’s contract administration. In D.02-10-062, the Commission established the 5
ERRA to track utility retained generation, procurement activities, and purchased power expenses. These 6
expenses include power purchased pursuant to the RPS contracts discussed in this chapter. 7
a) Contract Administration 8
This section provides information on all activities related to the management of 9
RPS contracts, including contract development, amendments, assignments, contract capacity 10
verifications, measurement of energy deliveries, terminations, active monitoring of contracts to ensure 11
the project output qualifies under requirements of the RPS, and activities related to management of 12
projects in the Western Renewable Energy Generation Information System (WREGIS).134 13
b) Summary of Contract Activity 14
During the Record Period, SCE purchased 15.92 billion kWh135 from 311 RPS 15
contracts, and recorded RPS payments of $1.558 billion. 16 134 Throughout this section, any undefined capitalized terms have the meaning set forth in the relevant RPS
project contract. 135 Purchases in billion kWh from RPS contracts by month were as follows:
21 6052 Yavi Energy (East Winds Project) 4.17 SO4 2/29/2016 Contract expired. Re-signed under
new ReMAT contract ID 6452.
22 6087 Section 16-29 Trust (Altech III) 34.00 SO4 3/10/2016 Contract expired.
23 6088 Difwind Partners 14.00 SO4 3/10/2016 Contract expired.
24 6089 CTV Power Purchase Contract Trust 14.00 SO4 4/21/2016 Contract expired.
25 6091 Cameron Ridge LLC (IV) 12.76 SO4 1/14/2016 Contract expired. Re-signed under new RAM20 contract ID 6391.
26 6094 Section 22 Trust (San Jacinto) 17.00 SO4 1/29/2016 Contract expired.
27 6111 Wind Stream Operations LLC (Northwind) 6.45 SO4 1/23/2016 Contract expired.
28 6112 Painted Hills Wind Developers 19.05 SO4 3/31/2016 Contract expired.
29 6496 Smoke Tree Wind, LLC 10.14 QF SOC 10/21/2016 Termination due to abandonment.
2016 Billions of kwh Jan 16 Feb 16 Mar 16 Apr 16 May 16 Jun 16 Jul 16 Aug 16 Sep 16 Oct 16 Nov 16 Dec 16 Total

154
Below, SCE sets forth its recorded RPS contract-related expenses, describes its 1
RPS contract development and administration activities during the Record Period, and demonstrates that 2
such activities were reasonable.136 SCE executes power purchase agreements (referred to as RPS 3
contracts or PPAs) with renewable generators through competitive solicitations, bilateral negotiations, 4
standard contracts, and feed-in tariffs. 5
Pursuant to Assembly Bill 1969 and Senate Bill 380, SCE administers a feed-in 6
tariff for eligible renewables 3 MW and less. In July 2013, the Renewable Market Adjusting Tariff 7
(ReMAT) replaced the California Renewable Energy Small Tariff (CREST) and the Water Agency 8
Tariff for Eligible Renewables (WATER) for eligible renewables 1.5 MW and less. 9
Pursuant to Executive Order S-06-06,137 SCE also voluntarily developed a 10
standard biomass program for eligible projects of 20 MW and less. This program was then expanded to 11
all renewable generators through Renewable Standard Contracts (RSC) for generators 5 MW and less 12
(RSC5) and 20 MW and less (RSC20). Any eligible renewable generator could access these RSCs 13
online and execute the agreement with SCE. 14
During the 2010 Record Period, in response to the market, SCE changed the 15
structure of this program and modeled it after SCE’s all-source RFOs with reverse auction pricing 16
instead of a fixed price at the Market Price Referent (MPR). In D.10-12-048, issued on December 17, 17
2010, the Commission adopted a new procurement process called the Renewable Auction Mechanism 18
(RAM) to procure renewable energy from projects 20 MW or less that are RPS-eligible, replacing SCE’s 19
RSC program. D.10-12-048 ordered SCE, PG&E, and SDG&E to implement the RAM, and procure 20
136 Two summary documents accompany this chapter as Appendices VII-K and VII-L. Appendix VII-K lists
each RPS project and the corresponding Commission application for approval or resolution that found the RPS contract reasonable as to formation. Appendix VII-L sets forth payment and production figures for each RPS project from which SCE purchased power during the Record Period.
137 Signed April 25, 2006, the executive order established a 20% biomass target within the 20% state RPS target.
155
1,000 MW allocated across the utilities over a two-year period through competitive auctions using 1
standard non-negotiable contracts.138 2
SCE administers the Solar Photovoltaic Program (SPVP). Under SPVP RFOs, 3
SCE conducted solicitations for an overall target of 125 MW of non-utility-owned solar photovoltaic 4
installations over a five-year period, made up of primarily rooftop projects in the 1 to 2 MW range, 5
although larger systems and ground-mount systems were also eligible to participate.139 6
SCE also administers the Preferred Resources Pilot (PRP) program, which is a 7
multi-year study designed to determine whether clean energy resources, including Energy Efficiency, 8
Demand Response, Renewable Distributed Generation, and Energy Storage, can be acquired and 9
deployed to offset the increasing customer demand for electricity in central Orange County. The 10
growing gap between supply and demand for electricity in the PRP area is due in part to the closure of 11
the San Onofre Nuclear Generating Station and the impending retirement of nearby ocean-cooled power 12
plants, which may affect grid reliability. Based on the pilot’s results, the need for new gas-powered 13
power plants in the region may be deferred or eliminated. 14
Projects that are in development or generate power for sale under RPS contracts 15
are discussed in this chapter and are referred to as “RPS projects.”140 There are many renewable 16
138 The Commission further clarified details of the RAM program in Resolution E-4414, issued August 22, 2011,
Resolution E-4489, issued April 19, 2012 and Resolution E-4546, issued November 8, 2012. 139 On February 11, 2011, SCE filed a Petition for Modification (PFM) of the SPVP, requesting that the
Commission increase the competitive solicitation portion of the SPVP from 250 MW to 375 MW, with 125 MW administered under the original SPVP-RFO parameters set forth in D.09-06-049 and Resolution E-4299 and 250 MW administered under revised parameters. The SPVP goals are rated in MW DC. On January 16, 2012, the Commission issued a Decision partially granting SCE’s PFM. The Decision modifies the SPVP to no more than 125 MW each of IPP procurement and utility development, with the amount of ground-mounted facilities increased to 20% (25 MW). The 250 MW cut from the original capacity cap were moved to the RAM program (as 200 MW AC). On July 27, 2012, SCE filed a second PFM of the SPVP, requesting that the Commission reduce the 125 MW target for the utility development portion of the SPVP to no more than 91 MW and move the remaining 34 MW to SCE’s RAM allocation (as 31 MW AC). On June 3, 2013, the Commission granted SCE’s second PFM.
140 SCE uses a contract numbering convention to identify contracts by technology, where the 1000 series refers to biomass, the 3000 series refers to geothermal, the 4000 series refers to small hydro, the 5000 series to solar, and the 6000 series to wind. Formerly, these were identified as “RAP ID.”

156
projects selling electric power to SCE which have maintained status as QFs and are delivering 1
renewable energy to SCE under a PURPA contract. They are covered in the earlier PURPA and CHP 2
section. 3
c) RPS Contracts that Achieved Commercial Operation 4
Table VII-54 shows the RPS projects that came on-line or started delivering to 5
SCE under a new contract during the Record Period. 6

157
Table VII-54 RPS Contracts that Achieved Commercial Operation
January 1, 2016 Through December 31, 2016
ID Project Commercial On-line Date Capacity (MW)1 1238 Republic Services of Sonoma County Energy Producers, Inc. 9/3/2016 5.002 4213 TKO Power, LLC (South Bear Creek) 5/4/2016 2.833 4225 Desert Water Agency (Whitewater) (f/k/a 4025) 7/8/2016 1.004 4252 Calleguas MWD (Springville Hydro) (f/k/a 4152) 4/8/2016 1.005 4316 Walnut Valley Water District (f/k/a 4016) 8/4/2016 0.136 4352 Calleguas MWD (Santa Rosa Hydro) (f/k/a 4052) 7/1/2016 0.257 5218 Desert Stateline LLC 8/30/2016 300.008 5284 Silver State Solar Power South, LLC 9/1/2016 250.009 5463 Central Antelope Dry Ranch C, LLC 5/6/2016 20.0010 5468 North Lancaster Ranch, LLC 12/31/2016 20.0011 5476 American Solar Greenworks, LLC 7/8/2016 6.5012 5485 Nicolis, LLC (Weldon Solar) 9/15/2016 20.0013 5490 Tropico, LLC (Great Lakes) 9/14/2016 14.0014 5494 McCoy Solar, LLC 11/30/2016 250.0015 5512 Little Rock Pham Solar, LLC 12/29/2015* 3.0016 5629 FTS Master Tenant 2, LLC (SEPV18, SEPV Little Rock) 1/14/2016 2.0017 5774 NRG Solar Oasis LLC 1/19/2016 20.0018 5778 SEPV Mojave West, LLC 6/15/2016 20.0019 5791 DG Solar Lessee II, LLC (SunE-Rochester) 5/22/2016 1.0020 5795 DG Solar Lessee II, LLC - E Philadelphia Ontario 3/1/2016 1.0021 5822 Longboat Solar, LLC 12/16/2016 20.0022 5827 Rio Bravo Solar I, LLC 12/21/2016 20.0023 5828 Rio Bravo Solar II, LLC 12/29/2016 20.0024 5834 RE Garland A, LLC 9/26/2016 20.0025 5835 CED Ducor Solar 1, LLC 12/27/2016 20.0026 5836 CED Ducor Solar 2, LLC 12/27/2016 20.0027 5837 CED Ducor Solar 4, LLC 12/27/2016 20.0028 5838 CED Ducor Solar 3, LLC 12/27/2016 15.0029 5874 Golden Springs Building F, LLC 12/23/2016 1.3530 5875 Golden Springs Development Company, LLC (Building G) 12/23/2016 1.2031 5876 Golden Springs Development Company, LLC (Building L) 12/23/2016 1.0032 5877 Freeway Springs, LLC 10/21/2016 2.0033 5878 Golden Solar, LLC (Dulles) 9/23/2016 2.0034 5880 Mesquite Solar 2, LLC 12/14/2016 100.8235 5885 Blythe Solar II, LLC 10/28/2016 131.2036 5888 RE Garland, LLC 11/1/2016 186.9737 6323 Alta Wind X, LLC 1/1/2016 138.0038 6324 Alta Wind XI, LLC 1/1/2016 90.0039 6391 Cameron Ridge II, LLC (f/k/a 6091) 1/15/2016 11.9040 6397 Windland Refresh 2, LLC (f/k/a 6097) 12/7/2015* 7.8141 6452 Yavi Energy, LLC (Eastwind) 3/1/2016 3.00
* Projects were not included in previous ERRA application.
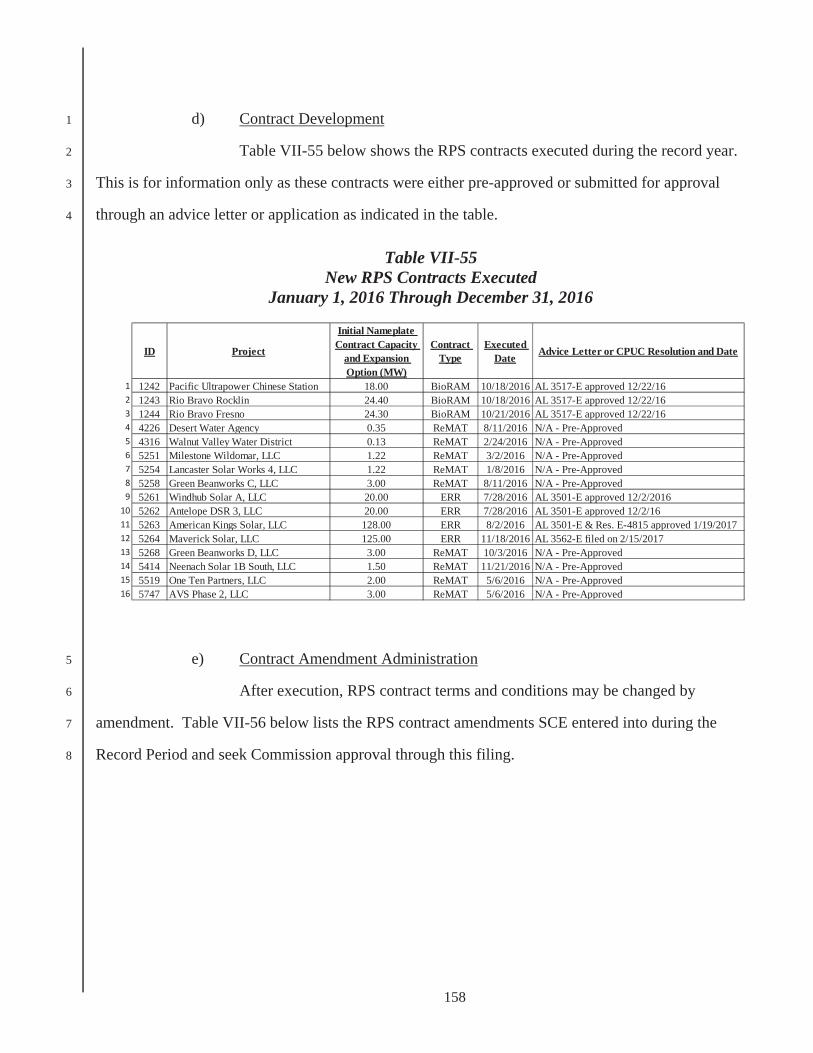
158
d) Contract Development 1
Table VII-55 below shows the RPS contracts executed during the record year. 2
This is for information only as these contracts were either pre-approved or submitted for approval 3
through an advice letter or application as indicated in the table. 4
Table VII-55 New RPS Contracts Executed
January 1, 2016 Through December 31, 2016
e) Contract Amendment Administration 5
After execution, RPS contract terms and conditions may be changed by 6
amendment. Table VII-56 below lists the RPS contract amendments SCE entered into during the 7
Record Period and seek Commission approval through this filing. 8
ID Project
Initial Nameplate Contract Capacity
and Expansion Option (MW)
Contract Type
Executed Date Advice Letter or CPUC Resolution and Date
1 1242 Pacific Ultrapower Chinese Station 18.00 BioRAM 10/18/2016 AL 3517-E approved 12/22/162 1243 Rio Bravo Rocklin 24.40 BioRAM 10/18/2016 AL 3517-E approved 12/22/163 1244 Rio Bravo Fresno 24.30 BioRAM 10/21/2016 AL 3517-E approved 12/22/164 4226 Desert Water Agency 0.35 ReMAT 8/11/2016 N/A - Pre-Approved5 4316 Walnut Valley Water District 0.13 ReMAT 2/24/2016 N/A - Pre-Approved6 5251 Milestone Wildomar, LLC 1.22 ReMAT 3/2/2016 N/A - Pre-Approved7 5254 Lancaster Solar Works 4, LLC 1.22 ReMAT 1/8/2016 N/A - Pre-Approved8 5258 Green Beanworks C, LLC 3.00 ReMAT 8/11/2016 N/A - Pre-Approved9 5261 Windhub Solar A, LLC 20.00 ERR 7/28/2016 AL 3501-E approved 12/2/2016 10 5262 Antelope DSR 3, LLC 20.00 ERR 7/28/2016 AL 3501-E approved 12/2/1611 5263 American Kings Solar, LLC 128.00 ERR 8/2/2016 AL 3501-E & Res. E-4815 approved 1/19/2017 12 5264 Maverick Solar, LLC 125.00 ERR 11/18/2016 AL 3562-E filed on 2/15/201713 5268 Green Beanworks D, LLC 3.00 ReMAT 10/3/2016 N/A - Pre-Approved14 5414 Neenach Solar 1B South, LLC 1.50 ReMAT 11/21/2016 N/A - Pre-Approved15 5519 One Ten Partners, LLC 2.00 ReMAT 5/6/2016 N/A - Pre-Approved16 5747 AVS Phase 2, LLC 3.00 ReMAT 5/6/2016 N/A - Pre-Approved

159
Table VII-56 RPS Contracts Amendments and Letter Agreements
January 1, 2016 Through December 31, 2016
ID Project Amendment Number and Description Date Executed
1 1210 MM Tajiguas Energy LLC Amendment No. 2 to provide a new definition for Generation Meter Multipliers (GMMs). 10/14/2016
2 3103 Coso Geothermal Power Holdings, LLC
.7/1/2016
3 3117 Geysers Power Company, LLC
7/26/2016
4 4213 TKO Power, LLC (South Bear Creek)
3/8/2016
5 5297 Regulus Solar, LLC
8/9/2016
6 5463 Central Antelope Dry Ranch C, LLC
3/30/2016
7 5468 North Lancaster Ranch LLC 9/21/2016
8 5494 McCoy Solar, LLC
12/16/2016
9 5625 Soccer Center, Mound Solar Partnership XI, LLC
Amendment No. 1 to reduce the DC rating and update the description of the generating facility. 10/24/2016
10 5629 FTS Master Tenant 2, LLCAmendment No. 1 to reduce the DC rating and modify the equipment description, site coordinates, and single line diagram.
2/19/2016
11 5630 RE Adams East, LLC 6/13/2016
12 5650 DG Solar Lessee, LLC (Hesperia) 5/25/2016
13 5650 DG Solar Lessee, LLC (Hesperia) 6/3/2016
14 5755 Catalina Solar 2, LLC 6/6/2016
15 5758 Adelanto Solar, LLC 3/24/2016

160
1
16 5778 SEPV Mojave West, LLC 5/6/2016
17 5788 AVS Lancaster, Mound Solar Partnership XI, LLC 10/24/2016
18 5791 SunE Solar XVI Lessor, LLC (SunE - Rochester) 8/19/2016
19 5801 Adelanto Solar II, LLC 3/24/2016
20 5814 North Rosamond Solar, LLC 2/29/2016
21 5817 Luz Solar Partners III, LLC 6/20/2016
22 5818 Luz Solar Partners IV 6/20/2016
23 5819 Luz Solar Partners V 6/20/2016
24 5822 Longboat Solar, LLC 1/19/2016
25 5826 Portal Ridge Solar B, LLC 7/12/2016
26 5827 Rio Bravo Solar I, LLC 5/31/2016
27 5828 Rio Bravo Solar II, LLC 5/31/2016
28 5829 Wildwood Solar II, LLC 5/31/2016
29 5834 RE Garland A, LLC 5/3/2016
30 5834 RE Garland A, LLC 7/28/2016
31 5834 RE Garland A, LLC 9/9/2016
32 5880 Mesquite Solar 2, LLC 10/7/2016
33 5882 Sun Streams, LLC 2/29/2016
34 5882 Sun Streams, LLC 5/3/2016
35 5883 Willow Springs Solar, LLC 2/29/2016
36 5884 Sunshine Valley Solar, LLC 2/29/2016

161
1
37 5885 Blythe Solar II, LLC 11/22/2016
38 5886 Valentine Solar, LLC 3/14/2016
39 5888 RE Garland, LLC 1/15/2016
40 5888 RE Garland, LLC 5/24/2016
41 5888 RE Garland, LLC 7/28/2016
42 5888 RE Garland, LLC 9/9/2016
43 5889 Blythe Solar III, LLC 11/22/2016
44 6304 Mountain View Power Partners IV, LLC 12/9/2016
45 6321 Alta Wind VIII, LLC Amendment No. 2 to remove “Sellers Debt to Equity Ratio” as a defined term. 10/20/2016
46 6330 North Hurlburt Wind, LLC 3/6/2017
47 6331 South Hurlburt Wind, LLC 3/6/2017
48 6332 Horseshoe Bend Wind, LLC
3/6/2017
49 6333 Mountain View Power Partners, LLC Amendment No. 2 to allow for portfolio financing. 12/9/2016
50 6355 Coram Energy, LLC 1/5/2016
51 6355 Coram Energy, LLC
11/16/2016
52 6368 Broadview Energy KW, LLC
6/28/2016
53 6379 Broadview Energy JN, LLC
6/28/2016
54 6380 Voyager Wind I, LLC
12/22/2016
55 6452 Yavi Energy, LLC (Eastwind)
Letter Agreement allowing SCE to process ACH payments and provide emailed statements. 4/8/2016
56 8012 TGP Energy Management, LLC
10/24/2016

162
(1) MM Tajiguas Energy LLC (ID 1210) 1
MM Tajiguas Energy LLC is a 2.84 MW landfill gas-fueled generation 2
facility in Goleta, CA, originally executed as part of a bilateral negotiation. The PPA was executed on 3
November 15, 2006. SCE and MM Tajiguas Energy LLC executed Amendment No. 2 on October 14, 4
2016, to provide for a new definition of Generation Meter Multipliers (GMMs) as a fixed number value. 5
Originally, the PPA defined GMMs by reference to information published by the CAISO and CAISO no 6
longer publishes this information. Both parties benefit from the clarity and accuracy of the PPA terms. 7
(2) Coso Geothermal Power Holdings, LLC (ID 3103) 8
Coso Geothermal Power Holdings, LLC (Coso Clean Power) is a 136 MW 9
geothermal facility located in Inyo County, CA, originally executed as part SCE’s 2005 RPS 10
solicitation. The PPA was executed on November 15, 2006. SCE and Coso Clean Power executed 11
Amendment No. 6 on July 1, 2016, 12
, in exchange for settling a dispute (for additional information see RPS Contract Disputes in 13
this Chapter VII). 14
15
16
17
18
19
20
21
22
(3) Geysers Power Company, LLC (ID 3117) 23
The Geysers Power Company, LLC is a portfolio comprised of 225 MW 24
of geothermal projects located in Lake and Sonoma Counties, CA, it was originally executed as a part of 25
SCE’s 2013 RPS solicitation. The PPA was executed on July 29, 2014. SCE and Geysers Power 26
Company, LLC executed a Letter Agreement on July 26, 2016, 27

163
, 1
SCE’s customers benefit from this amendment because it 2
3
(4) TKO Power, LLC (South Bear Creek) (ID 4213) 4
TKO Power, LLC (South Bear Creek) is a 2.834 MW small hydroelectric 5
project located in Shasta County, CA, originally executed as part of SCE’s 2014 RPS solicitation. The 6
PPA was executed on July 15, 2015. SCE and TKO Power, LLC (South Bear Creek) executed 7
Amendment No. 1 on March 8, 2016, 8
9
10
Both parties benefit from this Amendment 11
12
13
(5) Regulus Solar, LLC (ID 5297) 14
Regulus Solar, LLC is a 60 MW solar photovoltaic project located in Kern 15
County, CA, originally executed as part of SCE’s 2009 RPS solicitation on December 21, 2010. SCE 16
and Regulus Solar, LLC executed Amendment No. 5 on August 9, 2016, 17
18
Both parties 19
benefit 20
21
(6) Central Antelope Dry Ranch C, LLC (ID 5463) 22
Central Antelope Dry Ranch C (CADRC) is a 20 MW solar photovoltaic 23
project located in Lancaster, CA, executed as part of SCE’s RSC solicitation on November 15, 2010 and 24
was amended and restated on July 3, 2012. SCE and CADRC executed Amendment No. 3 on March 30, 25
2016, 26
27

164
1
SCE’s customers benefit from this amendment because it includes: 2
3
4
5
6
7
. Both parties benefit from 8
9
(7) North Lancaster Ranch (ID 5468) 10
North Lancaster Ranch is a 20 MW solar photovoltaic project located in 11
Lancaster, CA, executed as part of SCE’s RSC solicitation on November 15, 2010 and was amended and 12
restated on July 3, 2012. SCE and North Lancaster Ranch executed Amendment No. 3 on September 13
21, 2016, 14
. 15
16
17
18
19
20
21
22
Both parties benefit 23
24
(8) McCoy Solar (ID 5494) 25
McCoy Solar is a 250 MW solar photovoltaic project located in Blythe, 26
CA, originally executed as part of a bilateral negotiation on September 29, 2011. SCE and McCoy Solar 27

165
executed Amendment No. 1 on December 16, 2016, to among other things, 1
2
3
4
5
6
7
8
9
(9) Soccer Center, Mound Solar Partnership XI, LLC (ID 5625) 10
Soccer Center, Mound Solar Partnership XI, LLC is a 3 MW fixed tilt 11
photovoltaic solar facility located in Lancaster, CA, executed as part of SCE’s Renewable Market 12
Adjusting Tariff (ReMAT) program on November 4, 2014. SCE and Soccer Center, Mound Solar 13
Partnership XI, LLC executed Amendment No. 1 on October 24, 2016, to reduce the DC rating and 14
update the description of the Generating Facility to reflect the as-built status. Both parties benefit from 15
the clarity and accuracy of the PPA terms. SCE’s customers benefit from the savings associated with 16
the slight reduction in the DC rating by 103.2 kW and its associated reduction in overall output. 17
(10) FTS Master Tenant 2, LLC (SEPV18 Little Rock project) (ID 5629) 18
FTS Master Tenant 2, LLC is a 2 MW solar photovoltaic project located in 19
Palmdale, CA, originally executed as part of SCE’s ReMAT 6 solicitation. The PPA was executed on 20
November 3, 2014. SCE and FTS Master Tenant 2, LLC executed Amendment No. 1 on February 19, 21
2016, to update the description of the Generating Facility, to reduce the DC rating, update equipment 22
descriptions, update the site map coordinates, and update the single line diagram. SCE’s customers 23
benefit from the savings associated with the slight reduction in the DC rating (35.76 kW) and its 24
associated reduction in overall output, and both parties benefit from the clarity and accuracy of the PPA 25
terms. 26

166
(11) RE Adams East, LLC (ID 5630) 1
RE Adams East, LLC is a 19 MW solar photovoltaic project located in 2
Tranquillity, CA, originally executed as a part of SCE’s RAM 2 solicitation. The PPA was executed on 3
August 30, 2012. SCE and RE Adams East, LLC executed a Letter Agreement on June 13, 2016, 4
5
SCE’s customers benefit from this Letter 6
Agreement 7
8
9
(12) DG Solar Lessee, LLC (ID 5650) 10
DG Solar Lessee, LLC is a 1.5 MW solar photovoltaic rooftop project 11
located in Hesperia, CA, originally executed as a part of SCE’s SPVP 2 solicitation. The PPA was 12
executed on September 28, 2012. SCE and DG Solar Lessee, LLC executed a Letter Agreement on May 13
25, 2016, 14
. Both parties benefit from this letter agreement 15
16
. 17
(13) DG Solar Lessee, LLC (ID 5650) 18
DG Solar Lessee, LLC is a 1.5 MW solar photovoltaic rooftop project 19
located in Hesperia, CA, originally executed as a part of SCE’s SPVP 2 solicitation. The PPA was 20
executed on September 28, 2012. SCE and DG Solar Lessee, LLC executed Amendment No. 2 on June 21
3, 2016, . SCE’s customers benefit from this 22
amendment 23
24
(14) Catalina Solar 2, LLC (ID 5755) 25
Catalina Solar 2, LLC is a 17.986 MW solar photovoltaic project located 26
in Rosamond, CA, originally executed as a part of SCE’s RAM 3 solicitation. The PPA was executed 27
167
on March 22, 2013. SCE and Catalina Solar 2, LLC executed a Letter Agreement on June 6, 2016, 1
2
. SCE’s customers benefit from this letter 3
agreement 4
5
6
(15) Adelanto Solar (ID 5758) 7
Adelanto Solar is a 20 MW solar photovoltaic located in Adelanto, CA, 8
originally executed as part of SCE’s RAM 3 solicitation. The PPA was executed on March 22, 2013. 9
SCE and Adelanto Solar executed Amendment No. 4 on March 24, 2016, 10
11
SCE’s customers benefit from this Amendment 12
13
. 14
(16) SEPV Mojave West, LLC (ID 5778) 15
SEPV Mojave West, LLC is a 20 MW solar photovoltaic project located 16
in Blythe, CA, originally executed as part of SCE’s RAM 4 solicitation. The PPA was executed on 17
September 30, 2013. SCE and SEPV Mojave West, LLC executed Amendment No. 2 on May 6, 2016, 18
19
20
21
. Both parties benefit from the 22
23
. 24
(17) AVS Lancaster, Mound Solar Partnership XI, LLC (ID 5788) 25
AVS Lancaster is a 4.41 MW, solar photovoltaic project located in 26
Lancaster, CA, originally executed as part of SCE’s SPVP 3 solicitation. The PPA was executed on 27

168
February 3, 2014. SCE and AVS Lancaster, Mound Solar Partnership XI, LLC executed Amendment 1
No. 1 on October 24, 2016, 2
. SCE’s customers benefit from the 3
4
5
(18) SunE Solar (ID 5791) 6
The SunE Solar XVI Lessor, LLC project is a 1 MW rooftop solar 7
photovoltaic project located in Rancho Cucamonga, CA, originally executed as part of SCE’s SPVP 3 8
solicitation. The PPA was executed on February 3, 2014. SCE and SunE Solar XVI Lessor, LLC 9
executed Amendment No. 2 on August 19, 2016, , 10
11
SCE’s customers benefit from this Letter Agreement through 12
13
14
(19) Adelanto Solar II (ID 5801) 15
Adelanto Solar II is a 7 MW solar photovoltaic project located in 16
Adelanto, CA, originally executed as part of the SPVP 3 solicitation. The PPA was executed on 17
February 3, 2014. SCE and Adelanto Solar II executed Amendment No. 2 on March 24, 2016, 18
19
. SCE’s customers benefit from this letter agreement 20
through 21
22
(20) North Rosamond Solar, LLC (ID 5814) 23
North Rosamond Solar, LLC is a 160 MW solar photovoltaic project 24
located in Kern County, CA, originally executed as a part of SCE’s 2014 RPS solicitation. The PPA 25
was executed on October 9, 2015. SCE and North Rosamond Solar, LLC executed Amendment No. 1 26
on February 29, 2016, 27

169
1
. SCE’s customers benefit from this 2
amendment because it and both parties 3
benefit by 4
5
(21) Luz Solar Partners III, LLC (ID 5817) 6
Luz Solar Partners III, LLC is a 30 MW solar thermal project located in 7
Boron, CA, originally executed as part of SCE’s 2014 RPS solicitation. The PPA was executed on July 8
30, 2015. SCE and Luz Solar Partners III, LLC executed Amendment No. 1 on June 20, 2016, 9
10
. SCE’s customers benefit from this amendment because it 11
and both parties benefit by 12
13
(22) Luz Solar Partners IV, LLC (ID 5818) 14
Luz Solar Partners IV, LLC is a 30 MW solar thermal project located in 15
Boron, CA, originally executed as part of SCE’s 2014 RPS solicitation. The PPA was executed on July 16
30, 2015. SCE and Luz Solar Partners IV, LLC executed Amendment No. 1 on June 20, 2016, 17
18
. SCE’s customers benefit from this amendment 19
20
21
22
(23) Luz Solar Partners V, LLC (ID 5819) 23
Luz Solar Partners V, LLC is a 30 MW solar thermal project located in 24
Boron, CA, originally executed as part of SCE’s 2014 RPS solicitation. The PPA was executed on July 25
30, 2015. SCE and Luz Solar Partners V, LLC executed Amendment No. 1 on June 20, 2016, 26
27
170
SCE’s customers benefit from this amendment because it 1
2
3
(24) Longboat Solar, LLC (ID 5822) 4
Longboat Solar, LLC is a 20 MW solar photovoltaic project located in 5
Barstow, CA, originally executed as part of SCE’s RAM 5 solicitation. The PPA was executed on 6
October 22, 2014. SCE and Longboat Solar, LLC executed Amendment No. 1 on January 19, 2016, 7
8
9
. SCE’s customers benefit from the 10
11
and both parties benefit from the 12
. 13
(25) Portal Ridge Solar B, LLC (ID 5826) 14
Portal Ridge Solar B, LLC is a 20 MW solar photovoltaic project located 15
in Los Angeles County, CA, originally executed as a part of SCE’s RAM 5 solicitation. The PPA was 16
executed on October 22, 2014. SCE and Portal Ridge Solar B, LLC executed Amendment No. 1 on July 17
12, 2016, . SCE’s customers 18
benefit 19
20
21
(26) Rio Bravo Solar I, LLC (ID 5827) 22
Rio Bravo Solar I, LLC is a 20 MW solar photovoltaic project located in 23
McKittrick, CA, originally executed as part of SCE’s RAM 5 solicitation. The PPA was executed on 24
October 22, 2014. SCE and Rio Bravo Solar I, LLC executed Amendment No. 1 on May 31, 2016, 25
. SCE’s customers 26

171
benefit from the 1
and both parties benefit from the 2
(27) Rio Bravo Solar II, LLC (ID 5828) 3
Rio Bravo Solar II, LLC is a 20 MW solar photovoltaic project located in 4
McKittrick, CA, originally executed as part of SCE’s RAM 5 solicitation. The PPA was executed on 5
October 22, 2014. SCE and Rio Bravo Solar II, LLC executed Amendment No. 1 on May 31, 2016, 6
SCE’s customers 7
benefit from the 8
and both parties benefit from the 9
(28) Wildwood Solar II, LLC (ID 5829) 10
Wildwood Solar II, LLC is a 15 MW solar photovoltaic project located in 11
Wasco, CA, originally executed as part of SCE’s RAM 5 solicitation. The PPA was executed on 12
October 22, 2014. SCE and Wildwood Solar II, LLC executed Amendment No. 1 on May 31, 2016, 13
14
SCE’s customers benefit from the 15
and both parties benefit from the 16
. 17
(29) RE Garland A, LLC (ID 5834) 18
RE Garland A, LLC is a 20 MW solar photovoltaic project located in 19
Rosamond, CA, originally executed as a part of SCE’s RAM 5 solicitation. The PPA was executed on 20
October 22, 2014. SCE and RE Garland A, LLC executed a Letter Agreement on May 3, 2016, 21
Also, to 22
modify the forecasted 23
COD from December 1, 2016 to August 15, 2016. SCE’s customers are indifferent to the 24
25
172
(30) RE Garland A, LLC (ID 5834) 1
RE Garland A, LLC is a 20 MW solar photovoltaic project located in 2
Rosamond, CA, originally executed as a part of SCE’s RAM 5 solicitation. The PPA was executed on 3
October 22, 2014. SCE and RE Garland A, LLC executed a Letter Agreement on July 28, 2016, 4
Also, to 5
modify the 6
forecasted COD from August 15, 2016 to September 15, 2016. SCE’s customers are indifferent to the 7
changes in dates. 8
(31) RE Garland A (ID 5834) 9
RE Garland A is a 20 MW solar photovoltaic project located in 10
Rosamond, CA, originally executed as a part of SCE’s RAM 5 solicitation. The PPA was executed on 11
October 22, 2014. SCE and Southern Power Company executed a Letter Agreement dated September 9, 12
2016, 13
14
15
. SCE’s customers benefit from this letter agreement 16
because it . 17
(32) Mesquite Solar 2, LLC (ID 5880) 18
Mesquite Solar 2, LLC is a 100.8 MW solar photovoltaic project located 19
in Tonopah, AZ, originally executed as a part of SCE’s 2014 RPS solicitation. The PPA was executed 20
on June 25, 2015. SCE and Mesquite Solar 2, LLC executed Amendment No. 1 on October 7, 2016, 21
22
23
. Both parties benefit from the 24
25
. 26

173
(33) Sun Streams, LLC (ID 5882) 1
Sun Streams, LLC is a 160 MW solar photovoltaic project located in 2
Maricopa County, Arizona, originally executed as a part of SCE’s 2014 RPS solicitation. The PPA was 3
executed on October 9, 2015. SCE and Sun Streams, LLC, LLC executed Amendment No. 1 on 4
February 29, 2016, 5
6
. Seller benefits from the 7
8
. 9
Both parties benefit from 10
11
(34) Sun Streams, LLC (ID 5882) 12
Sun Streams, LLC is a 160 MW solar photovoltaic project located in 13
Maricopa County, Arizona, originally executed as part of SCE’s 2014 RPS solicitation. The PPA was 14
executed on October 9, 2015. SCE and Sun Streams, LLC executed Amendment No. 2 on May 3, 2016, 15
. Both parties benefit from 16
this amendment from the 17
(35) Willow Springs, LLC (ID 5883) 18
Willow Springs, LLC is a 108 MW solar photovoltaic project located in 19
Nye County, CA, originally executed as a part of SCE’s 2014 RPS solicitation. The PPA was executed 20
on October 9, 2015. SCE and Willow Springs, LLC executed Amendment No. 1 on February 29, 2016, 21
22
Seller benefits from 23
the 24
and SCE’s customers benefit because it . 25
Both parties benefit by 26
. 27

174
(36) Sunshine Valley Solar, LLC (ID 5884) 1
Sunshine Valley Solar, LLC is a 104 MW solar photovoltaic project 2
located in Kern County, CA, originally executed as a part of SCE’s 2014 RPS solicitation. The PPA 3
was executed on October 9, 2015. SCE and Sunshine Valley Solar, LLC executed Amendment No. 1 on 4
February 29, 2016, 5
6
Seller benefits from the 7
and SCE’s customers 8
benefit because it Both parties benefit by 9
10
11
(37) Blythe Solar II, LLC (ID 5885) 12
Blythe Solar II, LLC is a 131.2 MW solar photovoltaic project located in 13
Blythe, CA, originally executed as part of SCE’s 2014 RPS solicitation. The PPA was executed on July 14
15, 2015. SCE and Blythe Solar II, LLC executed Amendment No. 1 on November 22, 2016, 15
16
. SCE’s customers benefit from this amendment because it 17
. Both parties benefit by 18
19
(38) Valentine Solar, LLC (ID 5886) 20
Valentine Solar, LLC is a 111.2 MW solar photovoltaic project located in 21
Kern County, CA. Valentine Solar, LLC, was originally executed as part of SCE’s 2014 RPS 22
solicitation. The PPA was executed on October 16, 2015. SCE and Valentine Solar, LLC executed 23
Amendment No. 2 on March 14, 2016, 24
. Both parties benefit from this amendment because 25
26

175
(39) RE Garland LLC (ID 5888) 1
RE Garland LLC is a 186 MW solar photovoltaic project located in 2
Rosamond, CA, originally executed as a part of SCE’s 2014 RPS solicitation. The PPA was executed 3
on July 16, 2015. SCE and RE Garland LLC executed Amendment No. 1 on January 15, 2016, 4
5
6
Both parties benefit from the 7
8
. 9
(40) RE Garland, LLC (ID 5888) 10
RE Garland LLC is a 186 MW solar photovoltaic project located in 11
Rosamond, CA, originally executed as a part of SCE’s 2014 RPS solicitation. The PPA was executed 12
on July 16, 2015. SCE and RE Garland LLC executed a Letter Agreement on May 24, 2016 13
Also, to modify 14
the forecasted COD from 15
April 1, 2017 to November 1, 2016. SCE’s customers are indifferent to the 16
17
(41) RE Garland LLC (ID 5888) 18
RE Garland LLC is a 186 MW solar photovoltaic project located in 19
Rosamond, CA, originally executed as a part of SCE’s 2014 RPS solicitation. The PPA was executed 20
on July 16, 2015. SCE and RE Garland LLC executed a Letter Agreement on July 28, 2016, 21
22
SCE’s 23
customers are indifferent to the 24
25

176
(42) RE Garland, LLC (ID 5888) 1
RE Garland LLC is a 186 MW solar photovoltaic project located in 2
Rosamond, CA, originally executed as a part of SCE’s 2014 RPS solicitation. The PPA was executed 3
on July 16, 2015. SCE and RE Garland LLC executed a Letter Agreement on September 9, 2016, 4
5
6
7
SCE’s customers benefit from this letter agreement because it 8
9
(43) Blythe Solar III, LLC (ID 5889) 10
Blythe Solar III, LLC is a 136.8 MW solar photovoltaic project located in 11
Blythe, CA, originally executed as part of SCE’s 2014 RPS solicitation. The PPA was executed on July 12
15, 2015. SCE and Blythe Solar III, LLC executed Amendment No. 1 on November 22, 2016, 13
. SCE’s customers 14
benefit from this amendment because it Both 15
parties benefit by 16
17
(44) Mountain View Power Partners IV (ID 6304) 18
Mountain View Power Partners IV is a 49 MW wind project located in 19
Palm Springs, CA, originally executed as part of a bilateral negotiation. The PPA was executed on 20
August 20, 2010. SCE and Mountain View Power Partners IV executed Amendment No. 2 on 21
December 9, 2016, to allow Mountain View Power Partners IV to enter into portfolio financing. Per the 22
PPA, financing consents cannot be unreasonably withheld. SCE’s customers are indifferent as to the 23
execution of this amendment. 24
(45) Alta Wind VIII (ID 6321) 25
Alta Wind VIII, LLC is a 150 MW wind project located in Mojave, CA, 26
originally executed as part of a bilateral negotiation. The PPA was executed on April 10, 2010. SCE 27

177
and Alta Wind VIII, LLC executed Amendment No. 2 on October 20, 2016, to remove the defined term 1
“Sellers Debt to Equity Ratio” from the PPA since this term is no longer applicable. SCE’s customers 2
are indifferent as to the execution of this amendment. 3
(46) Caithness Shepherds Flat (IDs 6330, 6331, 6332) 4
North Hurlburt Wind, LLC (ID 6330); South Hurlburt Wind, LLC (ID 5
6331); and Horseshoe Bend Wind, LLC (ID 6332) collectively referred to as the Caithness Shepherds 6
Flat Project (CSF), is a 845 MW wind portfolio located in Arlington, OR, originally signed as part of 7
SCE’s 2007 RPS solicitation. The PPAs for these projects were executed on August 14, 2008. SCE and 8
CSF were engaged in lengthy negotiations throughout 2016 and came to agreement by year-end. 9
Amendment No. 2 for each facility was executed on March 6, 2017, 10
11
For additional information regarding the dispute see RPS Contract Disputes in this 12
Chapter VII. 13
(47) Mountain View Power Partners LLC (ID 6333) 14
Mountain View Power Partners LLC is a 66.6 MW wind project located in 15
Palm Springs, CA, originally executed as a part of a bilateral negotiation. The PPA was executed on 16
November 3, 2008. SCE and Mountain View Power Partners LLC executed Amendment No. 2 on 17
December 9, 2016, to allow Mountain View Power Partners LLC to enter into portfolio financing. 18
SCE’s customers are indifferent as to the execution of this amendment. 19
(48) Coram Energy, LLC (ID 6355) 20
Coram Energy, LLC is a 3 MW wind project located in Tehachapi CA, 21
originally executed as part of SCE’s RAM 5 solicitation. The PPA was executed on October 22, 2014. 22
SCE and Coram Energy, LLC executed a Letter Agreement on January 5, 2016, 23
24
. 25
SCE’s customers benefit from this letter agreement because it 26
27

178
(49) Coram Energy (ID 6355) 1
Coram Energy, LLC is a 3 MW wind project located in Tehachapi CA, 2
executed as part of SCE’s RAM 5 solicitation. The PPA was executed on October 22, 2014. SCE and 3
Coram Energy, LLC executed Amendment No. 1 on November 16, 2016, 4
5
6
Both parties benefit from 7
8
. SCE’s customers benefit from this amendment because 9
. 10
(50) Broadview Energy KW, LLC (ID 6368) 11
Broadview Energy KW, LLC is a 142.6 MW wind project located in New 12
Mexico and Texas, originally executed as part of SCE’s 2014 RPS solicitation. The PPA was executed 13
on August 7, 2015. SCE and Broadview Energy KW, LLC executed Amendment No. 1 on June 28, 14
2016, 15
16
17
18
19
20
21
. Both parties benefit from the 22
23
24
. Both parties also benefit from the 25
SCE’s customers benefit from the 26
27
179
(51) Broadview Energy JN, LLC (ID 6379) 1
Broadview Energy JN, LLC is a 181.7 MW wind project located in New 2
Mexico and Texas originally executed as part of SCE’s 2014 RPS solicitation. The PPA was executed 3
on August 7, 2015. SCE and Broadview Energy JN, LLC executed Amendment No. 1 on June 28, 2016, 4
5
6
7
8
9
10
11
Both parties benefit from the 12
13
. 14
SCE’s customers benefit from the 15
16
(52) Voyager Wind I, LLC (ID 6380) 17
Voyager Wind I, LLC is a 132 MW wind project located in Mojave, CA, 18
originally executed as a result of a bilateral negotiation. The PPA was executed on November 19, 2015. 19
SCE and Voyager Wind I, LLC executed Amendment No. 1 on December 22, 2016, 20
21
22
23
24
25
26
27

180
1
. 2
(53) Yavi Energy, LLC (ID 6452) 3
Eastwind Project is a 3 MW wind project located in Palm Springs, CA, 4
originally executed as part of SCE’s ReMAT 10 solicitation. The PPA was executed on July 22, 2015. 5
SCE and Yavi Energy, LLC executed a Letter Agreement on April 8, 2016, to allow SCE to issue 6
payment statements by email and to allow payments by ACH in addition to by wire. Both parties 7
benefit from this letter agreement because of the improved efficiency through the possible automation of 8
sending statements by email. Additionally, both parties benefit by reduced expenses associated with the 9
use of ACH in place of wire transfers. 10
(54) TGP Energy Management, LLC Energy and REC Sale (ID 8012) 11
The TGP Energy Management, LLC Confirm is a 404 GWh Inter-SC 12
Trade Energy and REC sale derived from a portfolio of 14 resources, originally executed as a result of a 13
bilateral negotiation. The WSPP Agreement Confirm (REC Sale Agreement) was executed on 14
November 19, 2015. SCE and TGP Energy Management executed a Letter Agreement on October 24, 15
2016, 16
17
SCE’s customers benefit from this letter agreement because the 18
19
f) Contract Assignment Administration 20
RPS contracts may only be assigned with the written consent of the parties, which 21
may not be unreasonably withheld. There are many reasons RPS contract counterparties seek to assign 22
their contracts. The counterparty might want to sell or transfer the project to a new entity, assign the 23
contract to a lender as security for a loan, or a change of control of the project.141 Table VII-57 lists the 24
contract assignments to which SCE consented during the Record Period. 25 141 SCE provides the assignment documents in its reply to the Master Data Request.

181
Table VII-57 RPS Contracts Assignments
January 1, 2016 Through December 31, 2016
(1) RE Tranquillity 8 Azul, LLC (ID 5246) 1
RE Tranquillity 8 Azul, LLC is a 20 MW solar photovoltaic project 2
located in Tranquillity, CA, originally executed as part of SCE’s RAM 6 solicitation. The PPA was 3
ID Project Type of Assignment Consent Signed1 5246 RE Tranquillity 8 Azul, LLC Consent to Assignment 9/20/20162 5463 Central Antelope Dry Ranch C, LLC Consent to Assignment of Membership Interest 4/18/20163 5463 Central Antelope Dry Ranch C, LLC Consent to Collateral Assignment 4/18/20164 5468 North Lancaster Ranch, LLC Consent to Collateral Assignment 10/12/20165 5468 North Lancaster Ranch, LLC Consent to Assignment of Membership Interest 12/2/20166 5625 Soccer Center, Mound Solar Partnership XI, LLC Consent to Assignment 10/24/20167 5630 RE Adams East, LLC Consent to Assignment & Change of Control 12/13/20168 5652 California PV Energy, LLC (Champagne) Consent & Agreement 11/7/20169 5653 California PV Energy, LLC (Jurupa) Consent & Agreement 11/7/201610 5744 Milliken Landfill Solar, LLC Consent to Assignment 8/12/201611 5744 Milliken Landfill Solar, LLC Consent and Agreement 8/12/201612 5755 Catalina Solar 2, LLC Consent to Assignment & Change of Control 12/13/201613 5756 Citizen Solar B, LLC Consent to Assignment & Change of Control 8/31/201614 5778 SEPV Mojave West, LLC Consent to Purchase of Membership Interest 4/22/201615 5778 SEPV Mojave West, LLC Consent to Assignment & Change of Control 8/31/201616 5781 Adera Solar, LLC Consent to Assignment & Change of Control 8/31/201617 5788 AVS Lancaster, LLC Consent to Assignment 10/24/201618 5804 Copper Mountain Solar 4, LLC Consent to Assignment of Membership Interest 7/20/201619 5805 Mount Signal Solar II, LLC Consent to Assignment of Membership Interest 7/25/201620 5805 Mount Signal Solar II, LLC Consent to Collateral Assignment 10/24/201621 5805 Mount Signal Solar II, LLC Consent to Collateral Assignment 12/22/201622 5808 Mount Signal Solar V, LLC Consent to Collateral Assignment 10/24/201623 5808 Mount Signal Solar V, LLC Consent to Collateral Assignment 12/22/201624 5822 Longboat Solar, LLC Consent to Assignment of Membership Interests 1/19/201625 5823 Algonquin SKIC 10 Solar, LLC Consent to Assignment of Membership Interest 11/29/201626 5826 Portal Ridge Solar B, LLC Consent to Assignment of Membership Interest 4/22/201627 5826 Portal Ridge Solar B, LLC Consent to Assignment of Membership Interest 4/22/201628 5826 Portal Ridge Solar B, LLC Consent to Collateral Assignment 4/29/201629 5827 Rio Bravo Solar I, LLC Consent to Assignment of Membership Interest 11/16/201630 5827 Rio Bravo Solar I, LLC Consent to Collateral Assignment 6/6/201631 5828 Rio Bravo Solar II, LLC Consent to Assignment of Membership Interest 11/16/201632 5828 Rio Bravo Solar II, LLC Consent to Collateral Assignment 6/9/201633 5829 Wildwood Solar II, LLC Consent to Collateral Assignment 6/17/201634 5829 Wildwood Solar II, LLC Consent to Assignment of Membership Interest 11/16/201635 5835 CED Ducor Solar 1, LLC (f/k/a SR Solis Vestal Almond, LLC) Consent to Collateral Assignment 5/27/201636 5836 CED Ducor Solar 2, LLC (f/k/a SR Solis Vestal Herder, LLC) Consent to Collateral Assignment 5/27/201637 5837 CED Ducor Solar 4, LLC (f/k/a SR Solis Vestal Fireman, LLC) Consent to Collateral Assignment 5/27/201638 5838 CED Ducor Solar 3, LLC (f/k/a SR Solis Crown, LLC) Consent to Collateral Assignment 5/27/201639 5880 Mesquite Solar 2, LLC Consent to Assignment of Membership Interest 7/20/201640 5885 Blythe Solar II, LLC Consent to Collateral Assignment 11/30/201641 6304 Mountain View Power Partners IV, LLC Consent to Collateral Assignment Agreement 12/9/201642 6333 Mountain View Power Partners, LLC Consent to Collateral Assignment Agreement 12/9/201643 6368 Broadview Energy KW, LLC Consent to Collateral Assignment Agreement 6/30/201644 6379 Broadview Energy JN, LLC Consent to Collateral Assignment Agreement 6/30/201645 6380 Voyager Wind I, LLC Consent to Collateral Assignment Agreement 12/22/2016

182
executed on December 18, 2015. SCE and RE Tranquillity 8 Azul, LLC executed a Consent to 1
Assignment on September 20, 2016 2
SCE’s customers are 3
indifferent as to the execution of this consent. 4
(2) Central Antelope Dry Ranch C, LLC (ID 5463) 5
Central Antelope Dry Ranch C, LLC (CADRC) is a 20 MW solar 6
photovoltaic project located in Lancaster, CA, originally executed as part of SCE’s RSC solicitation. 7
The PPA was executed on November 15, 2010 and amended and restated on July 3, 2012. 8
9
10
11
SCE’s customers are indifferent as to the execution of this Consent. 12
(3) Central Antelope Dry Ranch C, LLC (ID 5463) 13
Central Antelope Dry Ranch C, LLC (CADRC) is a 20 MW solar 14
photovoltaic project located in Lancaster, CA, originally executed as part of SCE’s RSC solicitation on 15
November 15, 2010 and amended and restated on July 3, 2012. 16
17
SCE’s customers are indifferent as to the execution of this 18
Consent. 19
(4) North Lancaster Ranch, LLC (ID 5468) 20
North Lancaster Ranch, LLC (NLR) is a 20 MW solar photovoltaic project 21
located in Lancaster, CA, originally executed as part of SCE’s RSC solicitation. The PPA was executed 22
on November 15, 2010 and was amended and restated on July 3, 2012. 23
24
SCE’s customers are indifferent as to the execution of this 25
consent. 26

183
(5) North Lancaster Ranch, LLC (ID 5468) 1
North Lancaster Ranch, LLC (NLR) is a 20 MW solar photovoltaic project 2
located in Lancaster, CA, originally executed as part of SCE’s RSC solicitation. The PPA was executed 3
on November 15, 2010 and was amended and restated on July 3, 2012. 4
5
6
SCE’s customers are indifferent as to the execution of this consent. 7
(6) Soccer Center, Mound Solar Partnership XI, LLC (ID 5625) 8
Soccer Center is a 3 MW solar photovoltaic project located in Lancaster, 9
CA, originally executed as part of SCE’s ReMAT 6 solicitation. The PPA was executed on November 10
4, 2014. 11
12
SCE’s customers are indifferent as to the 13
execution of this consent. 14
(7) RE Adams East, LLC (ID 5630) 15
RE Adams East, LLC is a 19 MW solar photovoltaic project located in 16
Tranquillity, CA, originally executed as part of SCE’s RAM 2 solicitation. The PPA was executed on 17
August 30, 2012. 18
19
20
21
SCE’s customers are indifferent as to the execution of this 22
consent. 23
(8) California PV Energy, LLC (Champagne) (ID 5652) 24
California PV Energy, LLC (Champagne) is a 1 MW solar photovoltaic 25
project located in Ontario, CA, originally executed as part of SCE’s SPVP 2 solicitation. The PPA was 26
executed on September 28, 2012. 27

184
SCE’s 1
customers are indifferent as to the execution of this consent. 2
(9) California PV Energy, LLC (Jurupa) (ID 5653) 3
California PV Energy, LLC (Jurupa) is a 1.5 MW solar photovoltaic 4
project located in Ontario, CA, originally executed as part of SCE’s SPVP 2 solicitation. The PPA was 5
executed on September 28, 2012. 6
. SCE’s 7
customers are indifferent as to the execution of this consent. 8
(10) Milliken Landfill Solar, LLC (ID 5744) 9
Milliken Landfill Solar, LLC is a 3 MW solar photovoltaic project located 10
in San Bernardino County, CA, originally executed as a part of SCE’s ReMAT 4 solicitation. The PPA 11
was executed on June 23, 2014. 12
13
SCE’s customers are indifferent as to the execution of this 14
consent. 15
(11) Milliken Landfill Solar, LLC (ID 5744) 16
Milliken Landfill Solar, LLC is a 3 MW solar photovoltaic project located 17
in San Bernardino County, CA, originally executed as a part of SCE’s ReMAT 4 solicitation. The PPA 18
was executed on June 23, 2014. 19
20
SCE’s customers are indifferent as to the execution of this consent. 21
(12) Catalina Solar 2, LLC (ID 5755) 22
Catalina Solar 2, LLC is an 18 MW solar photovoltaic project located in 23
Rosamond, CA, originally executed as a part of SCE’s RAM3 solicitation. The PPA was executed on 24
March 22, 2013. 25
26
27

185
1
. SCE’s customers are indifferent as to the execution of this 2
consent. 3
(13) Citizen Solar B LLC (ID 5756) 4
Citizen Solar B LLC is a 5 MW solar photovoltaic project located in 5
Mendota, CA, originally executed as part of SCE’s RAM 3 solicitation. The PPA was executed on 6
March 25, 2013. 7
8
SCE’s 9
customers are indifferent as to the execution of this consent. 10
(14) SEPV Mojave West, LLC (ID 5778) 11
SEPV Mojave West, LLC is a 20 MW solar photovoltaic project located 12
in Blythe, CA, originally executed as part of SCE’s RAM 4 solicitation. The PPA was executed on 13
September 30, 2013. 14
15
SCE’s customers are indifferent as 16
to the execution of this consent. 17
(15) SEPV Mojave West, LLC (ID 5778) 18
SEPV Mojave West, LLC is a 20 MW solar photovoltaic project located 19
in Blythe, CA, originally executed as part of SCE’s RAM 4 solicitation. The PPA was executed on 20
September 30, 2013. 21
22
23
SCE’s customers are indifferent as to the execution of this consent. 24
(16) Adera Solar, LLC (ID 5781) 25
Adera Solar, LLC is a 20 MW solar photovoltaic project located in 26
Chowchilla, CA, originally executed as part of SCE’s RAM 3 solicitation. The PPA was executed on 27

186
September 30, 2013. 1
2
SCE’s 3
customers are indifferent as to the execution of this consent. 4
(17) AVS Lancaster, LLC (ID 5788) 5
AVS Lancaster is a 4 MW solar photovoltaic project located in Lancaster, 6
CA, originally executed as part of SCE’s SPVP 3 solicitation. The PPA was executed on February 3, 7
2014. 8
9
SCE customers are indifferent as to the execution of this 10
consent. 11
(18) Copper Mountain Solar 4, LLC (ID 5804) 12
Copper Mountain Solar 4, LLC is a 94 MW solar photovoltaic project 13
located in Boulder City, NV, originally executed as part of SCE’s 2013 RPS solicitation. The PPA was 14
executed on July 31, 2014. 15
16
17
SCE’s customers are indifferent as to the execution of this 18
consent. 19
(19) Mount Signal Solar II, LLC (ID 5805) 20
Mount Signal Solar II (MSS2) is a 153 MW solar photovoltaic project 21
located in Imperial County, CA, originally executed as part of SCE’s 2013 RPS solicitation. The PPA 22
was executed on July 31, 2014. 23
24
. SCE’s customers are indifferent as to the execution of this consent. 25

187
(20) Mount Signal Solar II, LLC (ID 5805) 1
Mount Signal Solar II (MSS2) is a 153 MW solar photovoltaic project 2
located in Imperial County, CA, originally executed as part of SCE’s 2013 RPS solicitation on July 31, 3
2014. 4
. SCE’s customers are indifferent as to the execution of this 5
consent. 6
(21) Mount Signal Solar II, LLC (ID 5805) 7
Mount Signal Solar II (MSS2) is a 153 MW solar photovoltaic project 8
located in Imperial County, CA, originally executed as part of SCE’s 2013 RPS solicitation. The PPA 9
was executed on July 31, 2014. 10
11
. SCE’s customers are indifferent as to the execution of this consent. 12
(22) Mount Signal Solar V, LLC (ID 5808) 13
Mount Signal Solar V (MSS5) is a 252 MW solar photovoltaic project 14
located in Imperial County, CA, originally executed as part of SCE’s 2013 RPS solicitation. The PPA 15
was executed on July 31, 2014. 16
. SCE’s customers are indifferent as to 17
the execution of this consent. 18
(23) Mount Signal Solar V, LLC (ID 5808) 19
Mount Signal Solar V (MSS5) is a 252 MW solar photovoltaic project 20
located in Imperial County, CA, originally executed as part of SCE’s 2013 RPS solicitation. The PPA 21
was executed on July 31, 2014. 22
23
SCE’s customers are indifferent as to the execution of this consent. 24
(24) Longboat Solar, LLC (ID 5822) 25
Longboat Solar, LLC is a 20 MW solar photovoltaic project located in 26
Barstow, CA, originally executed as part of SCE’s RAM5 solicitation. The PPA was executed on 27

188
October 22, 2014. 1
2
. SCE’s customers are indifferent as to the 3
execution of this consent. 4
(25) Algonquin SKIC 10 Solar, LLC (ID 5823) 5
Algonquin SKIC 10 Solar, LLC is a 10 MW solar photovoltaic project 6
located in Taft, CA, originally executed as part of SCE’s RAM 5 solicitation. The PPA was executed on 7
October 22, 2014. 8
9
10
SCE customers are 11
indifferent as to the execution of this consent. 12
(26) Portal Ridge Solar B, LLC (ID 5826) 13
Portal Ridge Solar B, LLC is a 20 MW solar photovoltaic project located 14
in Lancaster, CA, originally executed as part of SCE’s RAM 5 solicitation. The PPA was executed on 15
October 22, 2014. 16
17
18
SCE’s customers are indifferent as to the execution of this consent. 19
(27) Portal Ridge Solar B, LLC (ID 5826) 20
Portal Ridge Solar B, LLC is a 20 MW solar photovoltaic project located 21
in Lancaster, CA, originally executed as part of SCE’s RAM 5 solicitation. The PPA was executed on 22
October 22, 2014. 23
24
25
SCE’s customers are indifferent as to the execution of this consent. 26

189
(28) Portal Ridge Solar B, LLC (ID 5826) 1
Portal Ridge Solar B, LLC is a 20 MW solar photovoltaic project located 2
in Lancaster, CA, originally executed as part of SCE’s RAM 5 solicitation. The PPA was executed on 3
October 22, 2014. 4
. 5
SCE’s customers are indifferent as to the execution of this consent. 6
(29) Rio Bravo Solar I, LLC (ID 5827) 7
Rio Bravo Solar I, LLC is a 20 MW solar photovoltaic project located in 8
McKittrick, CA, originally executed as part of SCE’s RAM 5 solicitation. The PPA was executed on 9
October 22, 2014. 10
11
12
. SCE’s customers are indifferent as to the execution of this 13
consent. 14
(30) Rio Bravo Solar I, LLC (ID 5827) 15
Rio Bravo Solar I, LLC is a 20 MW solar photovoltaic project located in 16
McKittrick, CA, originally executed as part of SCE’s RAM 5 solicitation. The PPA was executed on 17
October 22, 2014. 18
SCE’s customers are 19
indifferent as to the execution of this consent. 20
(31) Rio Bravo Solar II, LLC (ID 5828) 21
Rio Bravo Solar II, LLC is a 20 MW solar photovoltaic project located in 22
McKittrick, CA, originally executed as part of SCE’s RAM 5 solicitation. The PPA was executed on 23
October 22, 2014. 24
, 25
26

190
SCE’s customers are indifferent as to the execution of this 1
consent. 2
(32) Rio Bravo Solar II, LLC (ID #5828) 3
Rio Bravo II Solar, LLC is a 20 MW solar photovoltaic project located in 4
McKittrick, CA, originally executed as part of SCE’s RAM 5 solicitation. The PPA was executed on 5
October 22, 2014. 6
. SCE’s customers are 7
indifferent as to the execution of this consent. 8
(33) Wildwood Solar II, LLC (ID 5829) 9
Wildwood Solar II, LLC is a 15 MW solar photovoltaic project located in 10
Wasco, CA, originally signed as part of SCE’s RAM 5 solicitation. The PPA was executed on October 11
22, 2014. 12
. SCE’s customers are indifferent as 13
to the execution of this consent. 14
(34) Wildwood Solar II, LLC (ID 5829) 15
Wildwood Solar II, LLC is a 15 MW solar photovoltaic project located in 16
Wasco, CA, originally executed as part of SCE’s RAM 5 solicitation. The PPA was executed on 17
October 22, 2014. 18
, 19
20
. SCE’s customers are indifferent as to the execution of this 21
consent. 22
(35) CED Ducor Solar 1 LLC (f/k/a SR Solis Vestal Almond LLC) (ID 5835) 23
CED Ducor Solar 1, LLC is a 20 MW solar photovoltaic project located in 24
Tulare County, CA, originally executed as part of SCE’s RAM 5 solicitation. The PPA was executed on 25
October 21, 2014. 26
27

191
. SCE’s customers are indifferent as to the execution of this 1
consent. 2
(36) CED Ducor Solar 2 LLC (f/k/a SR Solis Vestal Herder LLC) (ID 5836) 3
CED Ducor Solar 2 LLC is a 20 MW solar photovoltaic project located in 4
Tulare County, CA, originally executed as part of SCE’s RAM 5 solicitation. The PPA was executed on 5
October 21, 2014. 6
7
SCE’s customers are indifferent as to the execution of this 8
consent. 9
(37) CED Ducor Solar 4 LLC (f/k/a SR Solis Vestal Fireman) (ID 5837) 10
CED Ducor Solar 4 LLC is a 20 MW solar photovoltaic project located in 11
Tulare County, CA, originally executed as part of SCE’s RAM 5 solicitation. The PPA was executed on 12
October 21, 2014. 13
14
SCE’s customers are indifferent as to the execution of this 15
consent. 16
(38) CED Ducor Solar 3 LLC (f/k/a SR Solis Crown) (ID 5838) 17
CED Ducor Solar 3 LLC is a 15 MW solar photovoltaic project located in 18
Tulare County, CA, originally executed as part of SCE’s RAM 5 solicitation. The PPA was executed on 19
October 21, 2014. 20
21
. SCE’s customers are indifferent as to the execution of this 22
consent. 23
(39) Mesquite Solar 2, LLC (ID 5880) 24
Mesquite Solar 2, LLC is a 100 MW solar photovoltaic project located in 25
Tonopah, AZ, originally executed as part of SCE’s 2014 RPS solicitation. The PPA was executed on 26
June 25, 2015. 27

192
1
. 2
SCE’s customers are indifferent as to the execution of this consent. 3
(40) Blythe Solar II LLC (ID 5885) 4
Blythe Solar II, LLC is a 131 MW solar photovoltaic project located in 5
Blythe, CA, originally executed as part of SCE’s 2014 RPS solicitation. The PPA was executed on July 6
15, 2015. 7
8
SCE’s customers are indifferent as to the execution of this consent. 9
(41) Mountain View Power Partners IV LLC (ID 6304) 10
Mountain View Power Partners IV, LLC is a 49 MW wind project located 11
in Palm Springs, CA, originally executed as a result of a bilateral negotiation. The PPA was executed 12
on March 8, 2005 and amended and restated on August 20, 2010. 13
14
15
SCE’s customers are indifferent as to the execution of this consent. 16
(42) Mountain View Power Partners LLC (ID 6333) 17
Mountain View Power Partners LLC is a 67 MW wind project located in 18
Palm Springs, CA, originally executed as part of a bilateral negotiation. The PPA was executed on 19
November 18, 2008. 20
21
SCE’s customers are indifferent as to the 22
execution of this consent. 23
(43) Broadview Energy KW, LLC (ID 6368) 24
Broadview Energy KW, LLC is a 143 MW wind project located in Curry 25
County, New Mexico, originally executed as part of SCE’s 2014 RPS solicitation. The PPA was 26
executed on August 7, 2015. 27

193
1
2
3
4
5
6
7
8
. SCE’s customers are indifferent as to the 9
execution of this consent. 10
(44) Broadview Energy JN, LLC (ID 6379) 11
Broadview Energy JN, LLC is a 182 MW wind project located in Curry 12
County, New Mexico and Deaf Smith County, Texas, originally executed as part of SCE’s 2014 RPS 13
solicitation. The PPA was executed on August 7, 2015. 14
, 15
16
17
18
19
20
21
22
SCE’s customers are indifferent as to the 23
execution of this consent. 24
(45) Voyager Wind I, LLC (ID 6380) 25
Voyager Wind I, LLC is a 132 MW wind project located in Mojave, CA, 26
originally executed as a result of bilateral negotiation. The PPA was executed on November 19, 2015. 27

194
1
2
SCE’s 3
customers benefit from this consent as it allows the project to move forward towards completion. 4
g) Affiliate Transactions and Contract Information 5
There were no affiliate RPS contracts during the Record Period. 6
h) Uncontrollable Force Administration 7
SCE’s RPS contracts include provisions that may excuse a RPS project from 8
performing certain contractual obligations to the extent the project can demonstrate that the occurrence 9
of an uncontrollable force, or a circumstance beyond its reasonable control as defined in the agreements 10
(otherwise known as a Force Majeure), prevented the project from performing such obligations. 11
Whenever an RPS contract holder claims that an uncontrollable force caused it to 12
fail to meet its contractual obligations, SCE undertakes the following activities: 13
Determines whether the claim was submitted within the contractually-required period, 14
which is typically two weeks. 15
Requires that the counterparty submit sufficient evidence to substantiate the claim that an 16
uncontrollable force event occurred. This may include meteorological or weather reports 17
to support a claim of weather damage, construction and equipment specifications, 18
manufacturer maintenance manuals and bulletins, the project’s operations and 19
maintenance/repair logs, copies of insurance claims, damage assessments, failure reports, 20
and other relevant materials. 21
Evaluates whether the suspension of performance was of no greater scope and of no 22
longer duration than was required by the uncontrollable force, and that the RPS contract 23
holder used its best efforts to remedy its inability to perform. 24
If SCE grants the claim, and if the contract does not provide otherwise, the RPS 25
contract counterparty receives lost output credit (kWh) for the period of the event, up to 365 days, 26
despite a failure to deliver power to SCE. Lost output credit is applied to the annual production amounts 27

195
found in the contract to offset any replacement energy damages to compensate SCE customers for 1
nonperformance of the contract. 2
Table VII-58 RPS Uncontrollable Force Claims Tendered and/or Pending
January 1, 2016 Through December 31, 2016
(1) Geysers Power Company, LLC (ID 3107) 3
Geysers Power Company, LLC is a 225 MW portfolio of geothermal 4
generating facilities located in Lake and Sonoma Counties, CA, originally signed as a part of SCE’s 5
2006 RPS solicitation. The PPA was executed on April 12, 2007. Geysers Power Company, LLC 6
provided notice to SCE on September 24, 2015 of a Force Majeure event due to the Valley Fire’s impact 7
upon the generating facilities. Five of the fourteen generating facilities were damaged due to the fires, 8
two PG&E transmission lines were taken out of service, and most of the generating facilities were 9
evacuated. On September 28, 2015, SCE responded to Geysers Power Company, LLC’s request for 10
relief due to the Force Majeure and accepted the claim. On July 20, 2016, Geysers Power Company, 11
LLC informed SCE that it would be able to resume full performance and cease the Force Majeure claim 12
ID Project Date and Event Status
1 3107 Geysers Power Company, LLC
9/12/2015 - Force Majeure due to Valley Fire in Lake County, which destroyed structures at various facilities owned by Geysers Power Company, LLC.
7/20/2016 - Force Majeure claim accepted and performance resumed to normal.
2 3107 Geysers Power Company, LLC
9/25/2016 - Force Majeure due to Sawmill Fire in Sonoma County, which caused evacuations at several facilities owned by Geysers Power Company, LLC and resulted in energy delivery reductions.
10/5/2016 - Force Majeure claim accepted and performance resumed to normal.
3 5208 Solar Partners I, LLC 6/10/2016 – Force Majeure claim due to a generator stator failure. 6/14/2016 – Force Majeure claim was denied.
4 5208 Solar Partners I, LLC 9/10/2016 – Force Majeure claim due to California wildfires. 9/23/2016 – Force Majeure claim was denied.
5 5412 Solar Star XIX 2/9/16 – Force Majeure claim due to equipment failure. 6/23/2016 – Force Majeure claim was denied.
6 5412 Solar Star XIX 5/29/16 – Force Majeure claim due to equipment failure. 10/24/2016 – Force Majeure claim was denied.
7 5485 Nicolis, LLC .
8 5490 Tropico, LLC
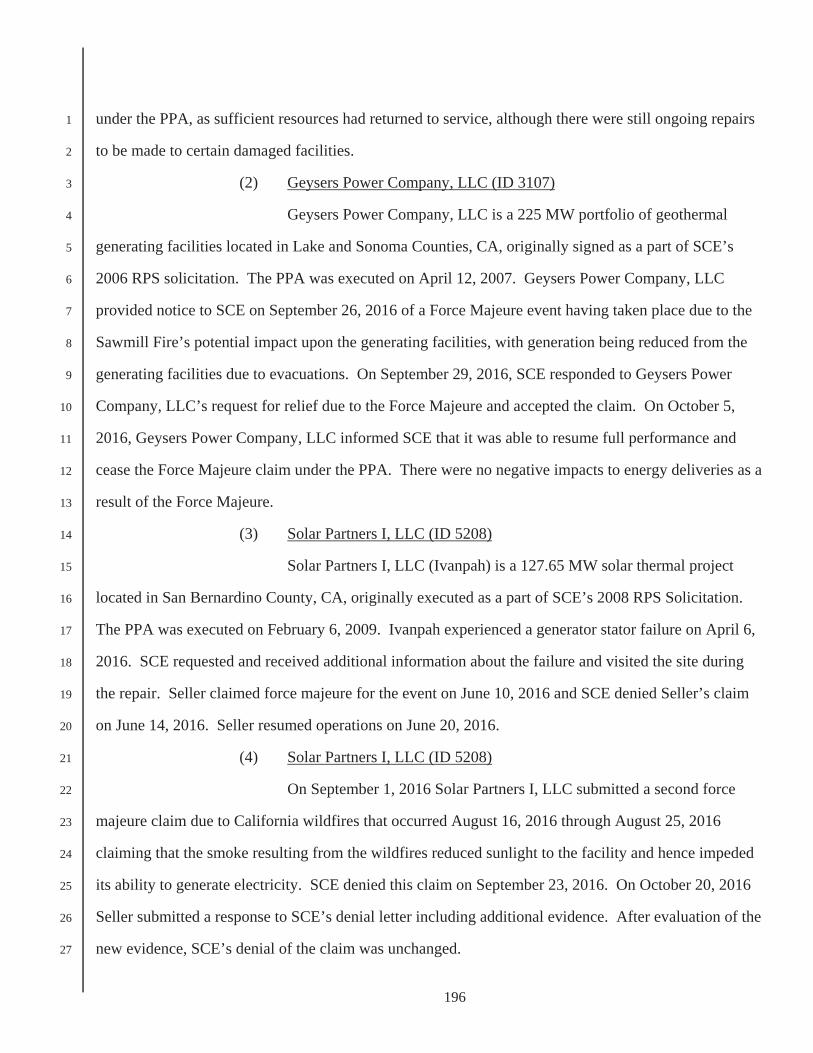
196
under the PPA, as sufficient resources had returned to service, although there were still ongoing repairs 1
to be made to certain damaged facilities. 2
(2) Geysers Power Company, LLC (ID 3107) 3
Geysers Power Company, LLC is a 225 MW portfolio of geothermal 4
generating facilities located in Lake and Sonoma Counties, CA, originally signed as a part of SCE’s 5
2006 RPS solicitation. The PPA was executed on April 12, 2007. Geysers Power Company, LLC 6
provided notice to SCE on September 26, 2016 of a Force Majeure event having taken place due to the 7
Sawmill Fire’s potential impact upon the generating facilities, with generation being reduced from the 8
generating facilities due to evacuations. On September 29, 2016, SCE responded to Geysers Power 9
Company, LLC’s request for relief due to the Force Majeure and accepted the claim. On October 5, 10
2016, Geysers Power Company, LLC informed SCE that it was able to resume full performance and 11
cease the Force Majeure claim under the PPA. There were no negative impacts to energy deliveries as a 12
result of the Force Majeure. 13
(3) Solar Partners I, LLC (ID 5208) 14
Solar Partners I, LLC (Ivanpah) is a 127.65 MW solar thermal project 15
located in San Bernardino County, CA, originally executed as a part of SCE’s 2008 RPS Solicitation. 16
The PPA was executed on February 6, 2009. Ivanpah experienced a generator stator failure on April 6, 17
2016. SCE requested and received additional information about the failure and visited the site during 18
the repair. Seller claimed force majeure for the event on June 10, 2016 and SCE denied Seller’s claim 19
on June 14, 2016. Seller resumed operations on June 20, 2016. 20
(4) Solar Partners I, LLC (ID 5208) 21
On September 1, 2016 Solar Partners I, LLC submitted a second force 22
majeure claim due to California wildfires that occurred August 16, 2016 through August 25, 2016 23
claiming that the smoke resulting from the wildfires reduced sunlight to the facility and hence impeded 24
its ability to generate electricity. SCE denied this claim on September 23, 2016. On October 20, 2016 25
Seller submitted a response to SCE’s denial letter including additional evidence. After evaluation of the 26
new evidence, SCE’s denial of the claim was unchanged. 27
197
(5) Solar Star XIX (ID 5412) 1
Solar Star XIX is a 310 MW solar photovoltaic project located in 2
Rosamond, CA, originally executed as part of a bilateral negotiation. The PPA was executed on 3
December 30, 2010. Seller submitted a Force Majeure claim due to a main bushing failure that occurred 4
on February 9, 2016, which caused major damage to the project’s No. 1 transformer. SCE requested 5
additional information and received documentation regarding the event. Based on SCE’s review, the 6
claim was denied on June 23, 2016 after determining the facts did not meet the requirements to 7
constitute a Force Majeure under the PPA. Although Seller reserved its rights, it has not disputed SCE’s 8
denial of the Force Majeure claim. 9
(6) Solar Star XIX (ID 5412) 10
Solar Star XIX is a 310 MW solar photovoltaic project located in 11
Rosamond, CA, originally executed as part of a bilateral negotiation. The PPA was executed on 12
December 30, 2010. Seller submitted a second Force Majeure claim due to similar bushing failure that 13
occurred on May 29, 2016, that caused major damage to the No. 2 transformer on the project. SCE 14
again performed its due diligence in reviewing the facts surrounding the event and again determined that 15
the event did not meet the requirements of a Force Majeure under the PPA. Force Majeure claim #2 was 16
denied on October 24, 2016. Although Seller reserved its rights, it has not disputed SCE’s denial of the 17
Force Majeure claim. 18
(7) Nicolis, LLC (ID 5485) 19
Nicolis, LLC is a 20 MW, single axis tracking solar photovoltaic facility 20
located in Tulare, CA, originally signed as part of SCE’s 2010 RSC solicitation. The PPA was executed 21
on November 15, 2010. On March 10, 2016 Nicolis submitted a Force Majeure claim, 22
23
24
25
26
. 27

198
(8) Tropico, LLC (ID 5490) 1
Tropico, LLC is a 14 MW, single axis tracking solar photovoltaic facility 2
located in Tulare, CA, originally signed as part of SCE’s 2010 RSC solicitation. The PPA was executed 3
on November 15, 2010. On March 10, 2016 Tropico submitted a Force Majeure claim, 4
5
6
7
8
9
i) Energy Delivery Performance Administration 10
Some of SCE’s RPS contracts include provisions that require a Seller to meet 11
certain energy delivery obligations. During the negotiations of the RPS contracts, SCE and the seller set 12
expected annual net energy production targets for the specific projects. These annual production targets 13
function as the basis for determining whether, in a term year, the projects meet their energy delivery 14
obligations. The energy delivery obligation calculation may be performed on either an annual or multi-15
year basis depending on contract terms. Regardless of the timing of the calculation, the result is either a 16
comparison of the actual annual energy deliveries or the average annual energy delivery over multiple 17
years to determine if the energy delivery obligation has been met. 18
SCE examines the production of each project and determines if the project has 19
met the energy delivery requirement. Depending on the contract, the seller may request credit for lost 20
production if the loss is attributed to Lost Output (output the facility otherwise would have produced if 21
not curtailed) as defined in the PPA. If a project does not meet its energy delivery requirements after 22
supplementing their production kWh with confirmed Lost Output, the project may be subject to 23
liquidated damages known as an Energy Replacement Damage Amount. 24
During the Record Period, calculations regarding annual production were 25
performed on 32 contracts. Of those, 27 contracts were found to have either met or exceeded their 26

199
annual net energy production target. Five contracts did not meet their required target. Those failures are 1
described below. 2
(1) Ventura Regional Sanitation District (ID 1221) 3
Ventura Regional Sanitation District (Ventura), a 1.6 MW biogas facility, 4
had a 2015/2016 annual production target of 8.67 GWh and delivered 0.99 GWh, leaving a shortfall of 5
7,672 MWh. The Energy Replacement Damage Amount was calculated to be $153,904, which will be 6
netted from Ventura’s payments. 7
(2) Coso Clean Power (ID 3103) 8
Coso Clean Power (Coso), a 68 MW geothermal facility had a 2014/2015 9
annual delivery obligation of 1,930 GWh and delivered approximately 1,866.58 GWh, leaving a 10
shortfall of approximately 50.08 GWh (after applying 13.33 GWh of Lost Output credit). As a result, 11
the Energy Replacement Damage Amount was calculated to be $1,001,740. On April 8, 2016 Coso 12
disputed SCE’s claim to the Energy Replacement Damage Amount, and requested Early Dispute 13
Resolution before an Arbitrator. The dispute was later settled (for additional information see RPS 14
Contract Disputes in this Chapter VII). 15
(3) ORNI 18, LLC (ID 3108) 16
ORNI 18, LLC (ORNI 18), a 33.2 MW geothermal facility, had a 17
2015/2016 annual delivery obligation of approximately 119.775 GWh and delivered approximately 18
93.214 GWh, leaving a shortfall of approximately 26.561 GWh. As a result, the Energy Replacement 19
Damage Amount was calculated to be $531,222, which ORNI 18 paid. 20
(4) Alta Wind IV, LLC (ID 6317) 21
Alta Wind IV, LLC, a 102 MW wind facility, had a 2013/2015 annual 22
production target of 335.86 GWh and delivered 293.17 GWh, leaving a shortfall of 42.70 GWh. The 23
Energy Replacement Damage Amount was calculated to be $848,751, and SCE has invoiced Seller for 24
this amount and received payment in full. 25
Alta Wind IV also failed to meet its Seller's Annual Energy Delivery 26
Obligation for Calculation Period 4 (10/01/2014 to 09/30/2016). The Shortfall Payment was calculated 27

200
to be $370,155.18. However, because the Seller's Annual Shortfall Payment paid the Previous Facility 1
Term Year (10/01/14 to 09/30/2015) was $631,810.51 and is greater than the Seller's Annual Energy 2
Delivery Obligation Shortfall Payment calculated for the current Calculation Period, the Seller's Annual 3
Shortfall Payment for Calculation Period 4 (10/01/2014 to 09/30/2016) is $0. 4
(5) Alta Wind V, LLC (ID 6318) 5
Alta Wind V, LLC, a 168 MW wind facility, had a 2013/2015 annual 6
production target of 545.30 GWh and delivered 472.86 GWh, leaving a shortfall of 72.44 GWh. The 7
Energy Replacement Damage Amount was calculated to be $1,437,687 and SCE has invoiced Seller for 8
this amount and received payment in full. 9
Alta Wind V also failed to meet its Seller's Annual Energy Delivery 10
Obligation for Calculation Period 4 (11/01/2014 to 10/31/2016). The Shortfall Payment was calculated 11
to be $628,922.19. However, because the Seller's Annual Shortfall Payment paid the Previous Facility 12
Term Year (11/01/14 to 10/31/2015) was $1,159,309.49 and is greater than the Seller's Annual Energy 13
Delivery Obligation Shortfall Payment calculated for the current Calculation Period, the Seller's Annual 14
Shortfall Payment for Calculation Period 4 (11/01/2014 to 10/31/2016) is $0. 15
j) Dispute Resolution and Litigation 16
Details on RPS Project dispute resolutions and litigation activities during the 17
Record Period are provided below. 18
(1) Satsuma Solar, LLC (ID 5300) 19
SCE and Satsuma Solar, LLC (f/k/a FRV Mojave Solar 4, L.P.) (Satsuma 20
Solar) executed a 20 MW solar photovoltaic PPA on December 21, 2010 as part of the 2009 RPS 21
solicitation. The project is located near Mojave, CA. On February 19, 2013, SCE received the “Reissue 22
of the Queue Cluster 1 & 2 Phase II Final Report” dated February 5, 2013. The report contains the 23
estimated cost and schedule for the interconnection facilities, distribution upgrades, and reliability 24
network upgrades required to interconnect Satsuma to SCE’s transmission and distribution system. The 25
interconnection study revealed that the expected cost for network upgrades, which would need to be 26

201
borne by SCE’s customers, was expected to be $14,312,000. The PPA between Satsuma and SCE 1
provides SCE with a termination right if the network upgrade costs exceed $10 million. 2
SCE terminated the PPA effective March 27, 2013 and returned the 3
Development Security of $600,000 to Satsuma on April 17, 2013. Satsuma exercised its dispute rights 4
under the PPA on April 4, 2013, declaring that the termination of the PPA was invalid. 5
SCE and Satsuma attended two mediation sessions in 2013, which did not 6
result in resolution of the dispute. Satsuma is able to pursue further dispute resolution through 7
arbitration. There has been no further activity regarding this dispute in 2016. The statute of limitations 8
will cause the case to expire on March 28, 2017, if there is no further action. 9
(2) Sand Canyon of Tehachapi LLC (ID 6341) 10
The Sand Canyon of Tehachapi LLC PPA was terminated by SCE on 11
November 11, 2011 due to network upgrade costs substantially exceeding the cap specified in the PPA. 12
After the termination, GLJ LLC (a lender and previous owner) for the Sand Canyon PPA, asserted its 13
rights, based on a Consent to Collateral Assignment Agreement signed by SCE, Sand Canyon, GLJ, and 14
Sand Canyon’s controlling entity, Helo Energy, to take control of the then-terminated PPA. Pursuant to 15
the terms of the Consent to Collateral Assignment Agreement and the PPA, SCE returned the 16
Development Security of $600,000 associated with the PPA to GLJ. 17
On March 28, 2012, Helo Energy and Saugatuck Energy, another claimant 18
to the Development Security, disregarded the alternative dispute resolution (ADR) provisions of the 19
PPA and filed suit against SCE and several other parties in California Superior Court. The lawsuit 20
claimed that SCE wrongfully terminated the PPA and incorrectly returned the Development Security to 21
GLJ. The lawsuit also made numerous unrelated allegations against defendants other than SCE, related 22
to the prior sale of the Sand Canyon PPA and assets. SCE moved to compel ADR of plaintiffs’ contract 23
claims under the PPA. The trial court denied the motion and SCE appealed the decision. The Court of 24
Appeal reversed the trial court, ruling that the plaintiffs’ claims against SCE must be arbitrated. On 25
remand, the trial court stayed plaintiffs’ claims against SCE until the plaintiffs resolve their unrelated 26
claims against the other defendants. That trial was held in California District Court on April 12, 2016. 27

202
SCE participated and monitored the case. One of the issues in that litigation, however, is whether 1
plaintiffs or the other defendants have standing to sue SCE under the PPA. If the plaintiffs prevail, they 2
may initiate arbitration against SCE for breach of contract and failure to return the Development 3
Security. SCE prepared for deposition in summer of 2016, but it has been deferred and has yet to be 4
rescheduled. 5
(3) Western Water and Power Production Limited (ID 1223) 6
The Western Water and Power Production Limited (WWPP) PPA was 7
terminated on August 29, 2011 due to lack of timely CPUC approval. On September 2, 2011, WWPP 8
sent SCE a notice of dispute claiming SCE’s termination was invalid, claiming promises had been made 9
by SCE to amend the PPA and stating that SCE (among others) had violated the Commerce Clause of 10
the United States Constitution. 11
On March 7, 2012 the parties met at mediation. The mediation produced 12
no progress toward a settlement of the dispute. On May 21, 2012, WWPP filed a complaint against SCE 13
at the CPUC (Case 12-05-021). The case was dismissed and the proceeding was closed on January 10, 14
2013 (D.13- 01-002). On March 19, 2014 WWPP provided notice to SCE demanding arbitration to 15
resolve the matter. The parties agreed to an arbitrator, took depositions, exchanged discovery, and each 16
filed a motion for summary judgment. On June 21, 2016, the arbitrator issued an order denying 17
WWPP’s motion for summary judgment and granting SCE’s motion. The arbitrator issued a Final 18
Judgment in favor of SCE on August 16, 2016, finding that WWPP may not recover any of its requested 19
relief from SCE. 20
(4) Coso Clean Power (ID 3103) 21
Coso Clean Power (Coso) is a 68 MW geothermal project located in Inyo 22
County, CA, originally executed as part of SCE’s 2005 RPS solicitation. The PPA was executed on 23
November 15, 2006. 24
Coso notified SCE by letter on April 8, 2016 that it disputed SCE’s 25
calculation of the Energy Replacement Damage Amount of $1,001,740 for the calculation period from 26
January 1, 2014 through December 31, 2015 and provided Notice requesting Early Dispute Resolution 27

203
before an Arbitrator. The parties worked in good faith to settle the dispute, and on August 5, 2016 1
reached an agreement effectuated by the execution of a Settlement Agreement and Amendment No. 6 to 2
the PPA. 3
4
5
6
7
8
(5) Caithness Shepherds Flat (IDs 6330, 6331, 6332) 9
North Hurlburt Wind, LLC (ID 6330); South Hurlburt Wind, LLC (ID 10
6331); and Horseshoe Bend Wind, LLC (ID 6332) collectively referred to as the Caithness Shepherds 11
Flat Project (CSF), is a 845 MW wind project located in Arlington, OR, originally signed as part of 12
SCE’s 2007 RPS solicitation. The PPAs for these projects were executed on August 14, 2008. 13
On November 25, 2014 CSF submitted a letter restating its 14
15
16
17
18
19
As part of the 20
Settlement Agreement executed on March 6, 2017 21
22
in accordance to the amended terms of Amendment No. 2. 23
Amendment No. 2 was executed on March 6, 2017 to modify numerous 24
terms to the original PPAs. As a result of this amendment, SCE will 25
26
27
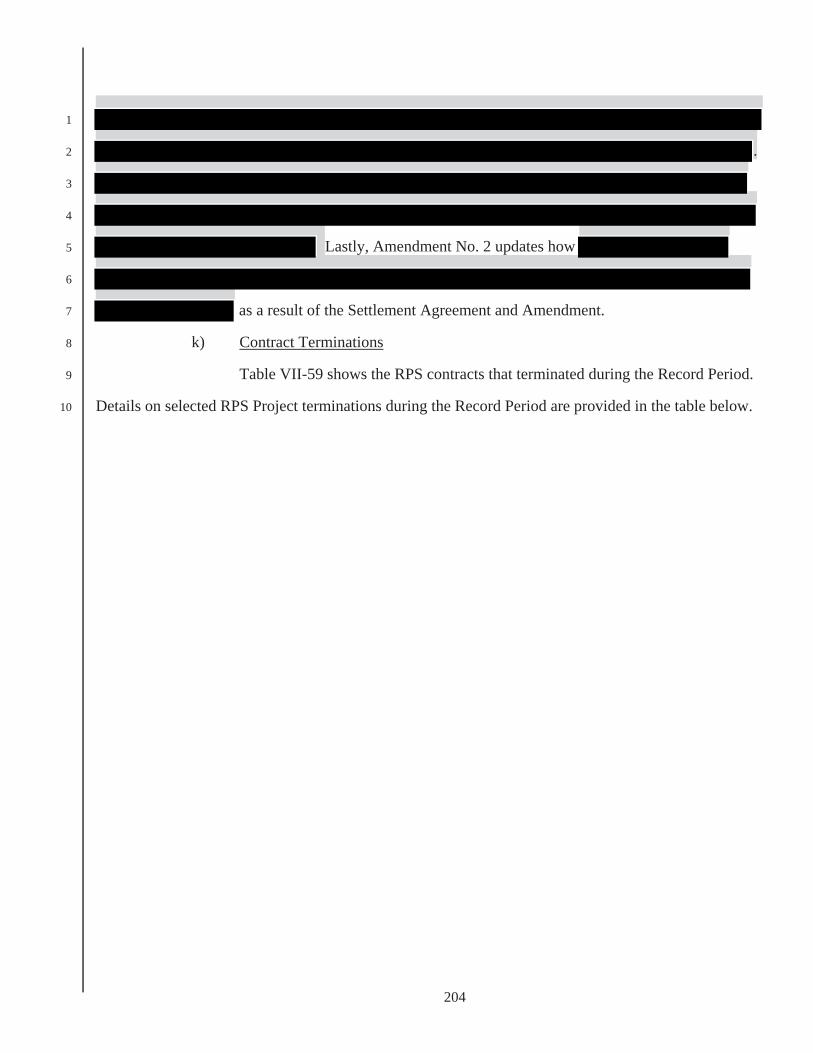
204
1
. 2
3
4
Lastly, Amendment No. 2 updates how 5
6
as a result of the Settlement Agreement and Amendment. 7
k) Contract Terminations 8
Table VII-59 shows the RPS contracts that terminated during the Record Period. 9
Details on selected RPS Project terminations during the Record Period are provided in the table below. 10

205
Table VII-59 RPS Contract Terminations
January 1, 2016 Through December 31, 2016
ID Project Contract Capacity (MW)
Contract Type
Termination Date Note
1 1193WM Energy Solutions Inc. El Sobrante
3.19 RSC5 11/9/2016
Seller could no longer meet contract requirements and elected to terminate. A $5,000 termination fee was transferred to ERRA.
2 1195WM Energy Solutions Inc. Simi Valley
2.15 RSC5 11/9/2016
Seller could no longer meet contract requirements and elected to terminate. A $5,000 termination fee was transferred to ERRA.
3 5234 Little Bear Solar 1, LLC 20.00 RAM20 2/29/2016
Network upgrade costs exceeded the cost cap in the PPA. Development security was returned to the Seller.
4 5235 Little Bear Solar 2, LLC 20.00 RAM20 2/29/2016
Network upgrade costs exceeded the cost cap in the PPA. Development security was returned to the Seller.
5 5254 Lancaster Solar Works 4, LLC 1.22 Re-MAT 2/24/2016 Failure to post collateral.
6 5514 Neenach Solar 1B South, LLC 1.50 Re-MAT 4/14/2016
Contract terminated because Seller could not attain permits. Development security was returned to Seller.
7 5746SunEdison Origination 3, LLC
1.50 Re-MAT 1/25/2016Project was abandoned. Development security in the amount of $30,000 was retained and transferred to ERRA.
8 5772 Maricopa East Solar PV, LLC 18.00 RAM20 2/25/2016
Seller abandoned due to inability to finance 10 year PPA. Development security in the amount of $1,080,000 was retained and transferred to ERRA.
9 5789SunE DB21, LLC - Mira Loma
0.50 PVSC 6/3/2016
Contract terminated for failure to achieve COD. Development security in the amount of $13,402 was retained and transferred to ERRA.
10 5790SunE DB22, LLC - Dupont Ontario
0.50 PVSC 6/3/2016
Contract terminated for failure to achieve COD. Development security in the amount of $13,140 was retained and transferred to ERRA.

206
1
11 5794SunE Solar XVIII Project 1, LLC - Redlands
1.50 PVSC 6/3/2016
Contract terminated for failure to achieve COD. Development security in the amount of $36,660.70 was retained and transferred to ERRA.
12 5831 San Jacinto Solar 14.5, LLC 14.50 RAM20 3/10/2016
Contract terminated because Seller could not attain permits. Development security was returned to Seller.
13 5832 San Jacinto Solar 5.5, LLC 5.50 RAM20 3/10/2016
Contract terminated because Seller could not attain permits. Development security was returned to Seller.
14 5844 SunEdison -Victorville 5.00 PV10 12/19/2016
Contract terminated for failure to achieve COD. Development security in the amount of $150,000 was retained and transferred to ERRA.
15 5845 SunE- Elm Fontana 1.50 PVSC 12/20/2016
Contract terminated for failure to achieve COD. Development security in the amount of $35,532 was retained and transferred to ERRA.
16 5846 SunE- Cherry Fontana 0.80 PVSC 12/20/2016
Contract terminated for failure to achieve COD. Development security in the amount of $21,294 was retained and transferred to ERRA.
17 5847 SunE- Fontana 0.90 PVSC 12/20/2016
Contract terminated for failure to achieve COD. Development security in the amount of $23,133 was retained and transferred to ERRA.
18 5848
SunEdison Utility Solutions, LLC (SunE-Jurupa Ontario)
1.20 PVSC 4/11/2016Project was abandoned. Development security in the amount of $27,601 was retained and transferred to ERRA.
19 5855
SunEdison Utility Solutions, LLC (SunE-Santa Ana)
1.40 PVSC 4/11/2016Project was abandoned. Development security in the amount of $32,594 was retained and transferred to ERRA.
20 5856
SunEdison Utility Solutions, LLC (SunE-Cucamonga Ontario West)
1.88 PVSC 4/11/2016Project was abandoned. Development security in the amount of $47,990 was retained and transferred to ERRA.

207
1
21 5859 Boomer Solar 2 LLC 1.00 PVSC 12/20/2016
Contract terminated for failure to achieve COD. Development security in the amount of $25,969 was retained and transferred to ERRA.
22 5860 Boomer Solar 6 LLC 0.88 PVSC 12/20/2016
Contract terminated for failure to achieve COD. Development security in the amount of $21,517 was retained and transferred to ERRA.
23 5861 Boomer Solar 7 LLC 1.20 PVSC 12/20/2016
Contract terminated for failure to achieve COD. Development security in the amount of $29,497 was retained and transferred to ERRA.
24 5865 Boomer Solar 12 LLC 0.70 PVSC 12/20/2016
Contract terminated for failure to achieve COD. Development security in the amount of $16,957.50 was retained and transferred to ERRA.
25 5867 Boomer Solar 15 LLC 0.90 PVSC 12/20/2016
Contract terminated for failure to achieve COD. Development security in the amount of $22,515 was retained and transferred to ERRA.
26 5869 Boomer Solar 17 LLC 0.88 PVSC 12/20/2016
Contract terminated for failure to achieve COD. Development security in the amount of $21,375 was retained and transferred to ERRA.
27 5870 Boomer Solar 18 LLC 1.76 PVSC 12/20/2016
Contract terminated for failure to achieve COD. Development security in the amount of $43,320 was retained and transferred to ERRA.
28 5871 Boomer Solar 22 LLC 0.56 PVSC 12/20/2016
Contract terminated for failure to achieve COD. Development security in the amount of $14,250 was retained and transferred to ERRA.
29 5872 SunE- Quarry Corona 1.75 PVSC 12/20/2016
Contract terminated for failure to achieve COD. Development security in the amount of $43,712.40 was retained and transferred to ERRA.
30 5873
SunEdison Utility Solutions, LLC (SunE-Mission Pomona)
3.50 PVSC 4/11/2016Project was abandoned. Development security in the amount of $90,016 was retained and transferred to ERRA.
31 6396 Smoke Tree Wind, LLC 16.00 RAM20 5/23/2016
Contract terminated for failure to achieve COD. Development Security in the amount of $960,000 was retained and transferred to ERRA. Smoke Tree entered into a QF SOC (new ID 6496).
32 8012TGP Energy Management, LLC
89.00 - 90.00 WSPP 12/14/2016Sale Contract: SCE completed delivery obligation of 404 GWh on 12/14/2016.

208
l) Other Contract Administration Activities 1
Below is a list of other contract administration activities. 2
(1) Berry Petroleum (IDs 2814 & 2819) 3
Berry Petroleum Company executed two CHP RFO PPAs through SCE’s 4
CHP solicitation. One became effective on July 2, 2012 with a contract capacity of 39.2 MW located in 5
Newhall, CA (ID 2814). The other became effective on April 23, 2014 with a contract capacity of 38 6
MW located in Taft, CA (ID 2819). Berry Petroleum Company is wholly-owned subsidiary of Linn 7
Energy, LLC. Linn Energy and Berry Petroleum declared bankruptcy on May 12, 2016. The filing of 8
bankruptcy by either party is an event of default under both PPAs. Additionally, the PPAs have 9
provisions that expressly state they are forward contracts, as defined by the Bankruptcy Code, by their 10
terms. Per the Bankruptcy Code, forward contracts are exempt from automatic stay protections afforded 11
to other assets of a Bankruptcy Estate. SCE retained outside counsel and filed a motion, on July 22, 12
2016, in United States Bankruptcy Court to authorize termination of both PPAs as forward contracts. 13
On August 16, 2016, the Bankruptcy Court denied SCE’s motion. SCE filed an appeal on September 6, 14
2016 to the Bankruptcy Court’s decision and the appeal process is ongoing. 15
(2) La Paloma (ID 11117) 16
La Paloma Generating Company LLC executed an EEI Master Agreement 17
with SCE, under which, there are three RA Only confirmations, for a total capacity of ~300MW (two 18
confirmations for 2017 & 2018 and one confirm for August 2017). La Paloma declared Chapter 11 19
bankruptcy on December 6, 2016 in the District of Delaware. Although the EEI agreement specifies that 20
bankruptcy constitutes an event of default under the agreement, SCE consulted with outside counsel and 21
decided against pursuing termination at the bankruptcy court. 22
(3) Little Rock - Pham Solar (ID 5512) 23
Little Rock – Pham Solar, LLC (LRPS) executed a ReMAT 2 solicitation 24
PPA on February 21, 2014 for a 3 MW solar photovoltaic project located in Palmdale, CA. West Hills 25
Construction (current owner) and WGL Energy/Sol Systems (alleged new owner) are in a dispute over 26
who controls the special purpose entity LRPS and who should be paid for renewable energy deliveries 27

209
under the PPA. SCE, as the Buyer under the PPA, was brought into the dispute whereby WGL 1
Energy/Sol Systems sent a letter to SCE on June 29, 2016 claiming to be the rightful owner of LRPS and 2
demanding that SCE make all payments under the PPA to it as the new owner of LRPS. However, SCE 3
had not received information from West Hills, that it sold LRPS to a new owner. West Hills filed suit 4
against Sol Systems/WGL for, among other things, breach of their construction and sales contract. 5
WGL filed a cross-complaint against West Hills. SCE filed an interpleader requesting the creation of an 6
escrow account, which was granted by the court, to deposit monthly payments pending the resolution of 7
the litigation. All SCE invoices relating to LRPS will be presented to the escrow agent until the dispute 8
is settled. A settlement was reached on March 1, 2017 and future payments shall be made to WGL. 9
(4) Supplier Diversity 10
Contract management supports SCE’s compliance and participation with 11
GO 156, which requires utilities to submit annual detailed and verifiable plans for increasing women, 12
minority and disabled veteran business enterprises' (WMDVBE) procurement in all categories. SCE’s 13
contract management group actively reaches out to contract counterparties to encourage and foster new 14
procurement opportunities for women, minority, disabled veteran, lesbian, gay, bisexual and transgender 15
business enterprises (WMDVLGBTBE). Many of our PPAs require that counterparties report to SCE 16
their procurement activities with businesses certified as WMDVLGBTEs. Twice per year, contract 17
management sends a survey to its contract counterparts requesting this information, and in many cases, 18
spends time discussing the survey data collected from the counterparty. This information is analyzed 19
and compiled for publication in SCE’s Supplier Diversity Annual Report. Contract management also 20
participates in quarterly meetings with Commission staff and the other IOUs, and supports various 21
supplier diversity outreach activities and events throughout the year. 22
(5) Contract Management & Settlement System 23
SCE uses several systems to manage information related to the contracts it 24
administers. The Wholesale Energy System (WES) has been used for many years to manage principal 25
contract provisions and payment activities in PURPA/CHP and RPS contracts. In 2016, Contract 26
Management supported development and implementation of a new system to manage its principal 27

210
contract provisions using an OpenLink product called Endur. This product allows better integration 1
between SCE’s contract management, contract settlements and accounting systems which will improve 2
operational efficiency. The Endur product go-live was August 1, 2016 and it became the system of 3
record at that time. The WES system is no longer supported and will eventually be retired. 4
(6) Portfolio Optimization 5
In an effort to improve operational excellence, several initiatives were 6
undertaken in 2016 that focused on process improvement and obtaining value for customers. To 7
optimize value in SCE’s portfolio of contracts, contract managers proactively reached out to 8
counterparties to consider amendments that would result in savings for both parties. Potential topics 9
included performance assurance reductions to more closely reflect current market value of renewables, 10
deferral of on-line dates to push out COD for viable projects where it made sense, changes to 11
curtailment language, and other areas of focus. In exchange, counterparties provided a benefit to SCE 12
customers in the form of a price reduction or upfront payment. Total customer savings related to these 13
efforts are in the tens of millions of dollars. Those amendments are reflected in Conventional, 14
PURPA/CHP, and RPS Amendment sections of this Chapter VII. 15
Another initiative, called Vision 2020 was launched to review current 16
processes and systems and make improvements. Projects addressed included site visit prioritization; 17
REC retirement strategy; centralized training; pro forma change process; data request process work 18
flow; computerized systems optimization; and improved communication and processes with internal 19
partners. These types of projects/initiatives are on-going and will continue to achieve improvements and 20
overall savings. 21
4. BTM Contracts Executed 22
The BTM contracts addressed in this section are for resources procured to meet Local 23
Reliability Requirements pursuant to the 2012 LTPP proceeding Tracks 1 and 4, to support the Preferred 24
Resources Pilot, and to meet reliability needs resulting from the limited operations of the Aliso Canyon 25
gas storage field. 26

211
a) Contract Administration 1
This section provides information on all activities related to the management of 2
BTM contracts, including contract development, amendments, assignments, contract capacity 3
demonstrations, measurement of energy deliveries, terminations, and other contract administration 4
activities. 5
b) Summary of Contract Activity 6
During the Record Period, SCE managed 83 BTM contracts. Below, SCE sets 7
forth its recorded contract-related expenses, describes its BTM contract development and administration 8
activities during the Record Period, and demonstrates that such activities were reasonable. BTM 9
contracts include the product categories of Energy Efficiency, Demand Response, Renewable 10
Distributed Generation, and Energy Storage. 11
c) Contract Development 12
During the Record Period, SCE entered into sixteen new BTM contracts. 13
Thirteen contracts were signed from SCE’s 2015 Preferred Resources Pilot (PRP) solicitation; eight 14
Demand Response plus Energy Storage contracts (Contract ID’s PRP-2016-DRES-001 through 008) 15
totaling 55 MW, and five Distributed Generation plus Energy Storage contracts (Contract ID’s PRP-16
2016-DGES-001 through 005) totaling 10 MW. An additional three Demand Response contracts 17
(Contract ID’s ACDR-01-01; ACDR-02-01; ACDR-04-01) for 12 MW were signed in support of the 18
Aliso Canyon Gas and Electric Reliability Winter Action Plan. Table VII-60 below shows the contract 19
identification number (Contract ID), project name, contract capacity, type of contract, the execution date 20
of these contracts, and the approval status. SCE is seeking approval of the thirteen PRP contracts 21
through the CPUC application process. The three contracts signed to meet Aliso Canyon reliability 22
needs were approved through the Quarterly Compliance Report (QCR) in conformance with the 23
guidelines set forth in SCE’s Assembly Bill 57 Bundled Procurement Plan. 24

212
Table VII-60 New BTM Contracts
January 1, 2016 Through December 31, 2016
d) Contract Amendment Administration 1
After contract execution, BTM contract terms and conditions may be changed by 2
amendments. SCE entered into 258 BTM contract amendments during the Record Period, shown in 3
Table VII-61 below and summarized. BTM amendments are comprised of 27 Renewable Distributed 4
Generation, 132 Energy Efficiency, three Demand Response, and 96 Energy Storage contract 5
amendments. 6
Contract ID Seller Capacity (MW) Contract Type Date ExecutedCPUC Resolution or Decision/SCE Advice
Letter/Application
PRP-2016-DRES-001 Cedar Technologies 1, LLC 5 Preferred Resources Pilot 9/8/2016 Application submitted on 11/4/2016
PRP-2016-DRES-002 Cedar Technologies 2, LLC 5 Preferred Resources Pilot 9/8/2016 Application submitted on 11/4/2016
PRP-2016-DRES-003 Cedar Technologies 3, LLC 10 Preferred Resources Pilot 9/8/2016 Application submitted on 11/4/2016
PRP-2016-DRES-004 Cedar Technologies 4, LLC 10 Preferred Resources Pilot 9/8/2016 Application submitted on 11/4/2016
PRP-2016-DRES-005 Cedar Technologies 5, LLC 10 Preferred Resources Pilot 9/8/2016 Application submitted on 11/4/2016
PRP-2016-DRES-006 Swell Energy Fund 5 Preferred Resources Pilot 9/8/2016 Application submitted on 11/4/2016
PRP-2016-DRES-008 Orange County Distributed Energy Storage I, LLC
8.5 Preferred Resources Pilot 9/8/2016 Application submitted on 11/4/2016
PRP-2016-DRES-007 Orange County Distributed Energy Storage II, LLC
1.5 Preferred Resources Pilot 9/8/2016 Application submitted on 11/4/2016
PRP-2016-DGES-001 NRG Distributed Generation PR LLC 2 Preferred Resources Pilot 9/8/2016 Application submitted on 11/4/2016
PRP-2016-DGES-002 NRG Distributed Generation PR LLC 2 Preferred Resources Pilot 9/8/2016 Application submitted on 11/4/2016
PRP-2016-DGES-003 NRG Distributed Generation PR LLC 2 Preferred Resources Pilot 9/8/2016 Application submitted on 11/4/2016
PRP-2016-DGES-004 NRG Distributed Generation PR LLC 2 Preferred Resources Pilot 9/8/2016 Application submitted on 11/4/2016
PRP-2016-DGES-005 NRG Distributed Generation PR LLC 2 Preferred Resources Pilot 9/8/2016 Application submitted on 11/4/2016
ACDR-01-01 NRG Curtailment Solutions, Inc. 9 Aliso Canyon Demand Response
7/13/2016 2016Q3 QCR: AL 3495-E
ACDR-02-01 Ohm Connect, Inc. 2 Aliso Canyon Demand Response
6/30/2016 2016Q2 QCR: AL 3443-E
ACDR-04-01 Zen Within, Inc. 1 Aliso Canyon Demand Response
7/1/2016 2016Q3 QCR: AL 3495-E

213
Table VII-61 SCE LCR BTM Contract Amendments
January 1, 2016 Through December 31, 2016
Contractual Counterparty Offer ID Amendment No. and Description Executed Date
1 Solar Star California XXXIV, LLC 490001 3/9/2016
2 Solar Star California XXXIV, LLC 490001 3/18/2016
3 Solar Star California XXXIV, LLC 490001 4/6/2016
4 Solar Star California XXXIV, LLC 490001 7/18/2016
5 Solar Star California XXXIV, LLC 490001 10/14/2016
6 Solar Star California XXXV, LLC 490002 3/18/2016
7 Solar Star California XXXV, LLC 490002 4/6/2016
8 Solar Star California XXXV, LLC 490002 7/18/2016
9 Solar Star California XXXV, LLC 490002 10/14/2016
10 Solar Star California XXXVI, LLC 490003 3/18/2016
11 Solar Star California XXXVI, LLC 490003 4/6/2016
12 Solar Star California XXXVI, LLC 490003 7/18/2016
13 Solar Star California XXXVI, LLC 490003 10/14/2016
14 Solar Star California XXXVII, LLC 490004 3/18/2016
15 Solar Star California XXXVII, LLC 490004 4/6/2016
Renewable Distributed Generation (Solar)

214
16 Solar Star California XXXVII, LLC 490004 7/18/2016
17 Solar Star California XXXVII, LLC 490004 10/14/2016
18 Solar Star California XXXVII, LLC 490004 11/21/2016
19 Solar Star California XXXIX, LLC 490005 3/9/2016
20 Solar Star California XXXIX, LLC 490005 3/18/2016
21 Solar Star California XXXIX, LLC 490005 4/6/2016
22 Solar Star California XXXIX, LLC 490005 7/18/2016
23 Solar Star California XXXIX, LLC 490005 10/14/2016
24 Solar Star California XXXVIII, LLC 490006 3/18/2016
25 Solar Star California XXXVIII, LLC 490006 4/6/2016
26 Solar Star California XXXVIII, LLC 490006 7/18/2016
27 Solar Star California XXXVIII, LLC 490006 10/14/2016
Contract Counterparty Offer ID Amendment No. and Description Date Executed
28 NRG Energy Efficiency-P LLC 447153 2/3/2016
29 NRG Energy Efficiency-P LLC 447150 2/3/2016
30 NRG Energy Efficiency-P LLC 447151 2/3/2016
31 NRG Energy Efficiency-P LLC 447152 2/3/2016
Energy Efficiency

215
32 NRG Energy Efficiency-P LLC 447153 4/6/2016
33 NRG Energy Efficiency-P LLC 447150 4/6/2016
34 NRG Energy Efficiency-P LLC 447151 4/6/2016
35 NRG Energy Efficiency-P LLC 447152 4/6/2016
36 NRG Energy Efficiency-P LLC 447153 7/18/2016
37 NRG Energy Efficiency-P LLC 447150 7/18/2016
38 NRG Energy Efficiency-P LLC 447151 7/18/2016
39 NRG Energy Efficiency-P LLC 447152 7/18/2016
40 NRG Energy Efficiency-P LLC 447150 10/22/2016
41 NRG Energy Efficiency-P LLC 447151 10/22/2016
42 NRG Energy Efficiency-P LLC 447152 10/22/2016
43 NRG Energy Efficiency-P LLC 447153 10/22/2016
44 NRG Energy Efficiency-P LLC 447153 11/15/2016
45 NRG Energy Efficiency-P LLC 447150 11/15/2016

216
46 NRG Energy Efficiency-P LLC 447151 11/15/2016
47 NRG Energy Efficiency-P LLC 447152 11/15/2016
48 NRG Energy Efficiency L-LLC 447103 2/3/2016
49 NRG Energy Efficiency L-LLC 447102 2/3/2016
50 NRG Energy Efficiency L-LLC 447101 2/3/2016
51 NRG Energy Efficiency L-LLC 447100 2/3/2016
52 NRG Energy Efficiency L-LLC 447103 4/6/2016
53 NRG Energy Efficiency L-LLC 447102 4/6/2016
54 NRG Energy Efficiency L-LLC 447101 4/6/2016
55 NRG Energy Efficiency L-LLC 447100 4/6/2016
56 NRG Energy Efficiency L-LLC 447103 7/18/2016
57 NRG Energy Efficiency L-LLC 447102 7/18/2016
58 NRG Energy Efficiency L-LLC 447101 7/18/2016
59 NRG Energy Efficiency L-LLC 447100 7/18/2016
60 NRG Energy Efficiency L-LLC 447102 10/22/2016

217
61 NRG Energy Efficiency L-LLC 447103 10/22/2016
62 NRG Energy Efficiency L-LLC 447101 10/22/2016
63 NRG Energy Efficiency L-LLC 447100 10/22/2016
64 Onsite Energy Corporation 408001 2/3/2016
65 Onsite Energy Corporation 408002 2/3/2016
66 Onsite Energy Corporation 408003 2/3/2016
67 Onsite Energy Corporation 408004 2/3/2016
68 Onsite Energy Corporation 408005 2/3/2016
69 Onsite Energy Corporation 408006 2/3/2016
70 Onsite Energy Corporation 408007 2/3/2016
71 Onsite Energy Corporation 408008 2/3/2016
72 Onsite Energy Corporation 408009 2/3/2016
73 Onsite Energy Corporation 408010 2/3/2016
74 Onsite Energy Corporation 408011 2/3/2016
75 Onsite Energy Corporation 408012 2/3/2016
76 Onsite Energy Corporation 408013 2/3/2016
77 Onsite Energy Corporation 408014 2/3/2016
78 Onsite Energy Corporation 408015 2/3/2016
79 Onsite Energy Corporation 408016 2/3/2016
80 Onsite Energy Corporation 408017 2/3/2016
81 Onsite Energy Corporation 408001 4/6/2016
82 Onsite Energy Corporation 408002 4/6/2016

218
83 Onsite Energy Corporation 408003 4/6/2016
84 Onsite Energy Corporation 408004 4/6/2016
85 Onsite Energy Corporation 408005 4/6/2016
86 Onsite Energy Corporation 408006 4/6/2016
87 Onsite Energy Corporation 408007 4/6/2016
88 Onsite Energy Corporation 408008 4/6/2016
89 Onsite Energy Corporation 408009 4/6/2016
90 Onsite Energy Corporation 408010 4/6/2016
91 Onsite Energy Corporation 408011 4/6/2016
92 Onsite Energy Corporation 408012 4/6/2016

219
93 Onsite Energy Corporation 408013 4/6/2016
94 Onsite Energy Corporation 408014 4/6/2016
95 Onsite Energy Corporation 408015 4/6/2016
96 Onsite Energy Corporation 408016 4/6/2016
97 Onsite Energy Corporation 408017 4/6/2016
98 Onsite Energy Corporation 408001 7/18/2016
99 Onsite Energy Corporation 408002 7/18/2016
100 Onsite Energy Corporation 408003 7/18/2016
101 Onsite Energy Corporation 408004 7/18/2016
102 Onsite Energy Corporation 408005 7/18/2016
103 Onsite Energy Corporation 408006 7/18/2016
104 Onsite Energy Corporation 408007 7/18/2016
105 Onsite Energy Corporation 408008 7/18/2016
106 Onsite Energy Corporation 408009 7/18/2016
107 Onsite Energy Corporation 408010 7/18/2016
108 Onsite Energy Corporation 408011 7/18/2016
109 Onsite Energy Corporation 408012 7/18/2016
110 Onsite Energy Corporation 408013 7/18/2016
111 Onsite Energy Corporation 408014 7/18/2016

220
112 Onsite Energy Corporation 408015 7/18/2016
113 Onsite Energy Corporation 408016 7/18/2016
114 Onsite Energy Corporation 408017 7/18/2016
115 Onsite Energy Corporation 408001 10/19/2016
116 Onsite Energy Corporation 408002 10/19/2016
117 Onsite Energy Corporation 408003 10/19/2016
118 Onsite Energy Corporation 408004 10/19/2016
119 Onsite Energy Corporation 408005 10/19/2016
120 Onsite Energy Corporation 408006 10/19/2016
121 Onsite Energy Corporation 408007 10/19/2016
122 Onsite Energy Corporation 408008 10/19/2016
123 Onsite Energy Corporation 408009 10/19/2016
124 Onsite Energy Corporation 408010 10/19/2016
125 Onsite Energy Corporation 408011 10/19/2016
126 Onsite Energy Corporation 408012 10/19/2016
127 Onsite Energy Corporation 408013 10/19/2016
128 Onsite Energy Corporation 408014 10/19/2016
129 Onsite Energy Corporation 408015 10/19/2016
130 Onsite Energy Corporation 408016 10/19/2016

221
131 Onsite Energy Corporation 408017 10/19/2016
132 Sterling Analytics, LLC 429001 2/3/2016
133 Sterling Analytics, LLC 429003 2/3/2016
134 Sterling Analytics, LLC 429002 2/3/2016
135 Sterling Analytics, LLC 429004 2/3/2016
136 Sterling Analytics, LLC 429005 2/3/2016
137 Sterling Analytics, LLC 429006 2/3/2016
138 Sterling Analytics, LLC 429007 2/3/2016
139 Sterling Analytics, LLC 429001 4/6/2016
140 Sterling Analytics, LLC 429003 4/6/2016
141 Sterling Analytics, LLC 429002 4/6/2016
142 Sterling Analytics, LLC 429004 4/6/2016
143 Sterling Analytics, LLC 429005 4/6/2016
144 Sterling Analytics, LLC 429006 4/6/2016
145 Sterling Analytics, LLC 429007 4/6/2016
222
146 Sterling Analytics, LLC 429001 7/18/2016
147 Sterling Analytics, LLC 429003 7/18/2016
148 Sterling Analytics, LLC 429002 7/18/2016
149 Sterling Analytics, LLC 429004 7/18/2016
150 Sterling Analytics, LLC 429005 7/18/2016
151 Sterling Analytics, LLC 429006 7/18/2016
152 Sterling Analytics, LLC 429007 7/18/2016
153 Sterling Analytics, LLC 429001 8/22/2016
154 Sterling Analytics, LLC 429003 8/22/2016
155 Sterling Analytics, LLC 429002 8/22/2016
156 Sterling Analytics, LLC 429004 8/22/2016
157 Sterling Analytics, LLC 429005 8/22/2016
158 Sterling Analytics, LLC 429006 8/22/2016
159 Sterling Analytics, LLC 429007 8/22/2016

223
Contract Counterparty Offer ID Amendment No. and Description Date Executed
160 NRG Curtailment Solutions 447250
1/8/2016
161 NRG Curtailment Solutions 447250
5/5/2016
162 NRG Curtailment Solutions 447250 8/16/2016
Contract Counterparty Offer ID Amendment No. and Description Date Executed
163 Hybrid-Electric Building Technologies Irvine 1, LLC
467009 1/26/2016
164 Hybrid-Electric Building Technologies Irvine 2, LLC
467010 1/26/2016
165 Hybrid-Electric Building Technologies West LA 1, LLC
467022 1/26/2016
166 Hybrid-Electric Building Technologies West LA 2, LLC
467025 1/26/2016
167 Hybrid-Electric Building Technologies Irvine 1, LLC
467009 3/23/2016
168 Hybrid-Electric Building Technologies Irvine 2, LLC
467010 3/23/2016
169 Hybrid-Electric Building Technologies West LA 1, LLC
467022 3/23/2016
170 Hybrid-Electric Building Technologies West LA 2, LLC
467025 3/23/2016
171Hybrid-Electric Building Technologies Irvine 1, LLC 467009 8/15/2016
172Hybrid-Electric Building Technologies Irvine 2, LLC 467010 8/15/2016
173Hybrid-Electric Building Technologies West LA 1, LLC 467022 8/15/2016
174Hybrid-Electric Building Technologies West LA 2, LLC 467025 8/15/2016
175 Stem Energy Southern California, LLC402039 &
402040 2/17/2016
176 Stem Energy Southern California, LLC402039 &
402040 3/23/2016
177 Stem Energy Southern California, LLC402039 &
402040 8/15/2016
178 Stem Energy Southern California, LLC 402040 11/17/2016
179 NRG, SPV #1 LLC 431166 2/3/2016
Demand Response
Energy Storage

224
180 NRG, SPV #1 LLC 431163 2/3/2016
181 NRG, SPV #1 LLC 431160 2/3/2016
182 NRG, SPV #1 LLC 431157 2/3/2016
183 NRG, SPV #1 LLC 431154 2/3/2016
184 NRG, SPV #1 LLC 431151 2/3/2016
185 NRG, SPV #1 LLC 431148 2/3/2016
186 NRG, SPV #1 LLC 431145 2/3/2016
187 NRG, SPV #1 LLC 431070 2/3/2016
188 NRG, SPV #1 LLC 431067 2/3/2016
189 NRG, SPV #1 LLC 431064 2/3/2016
190 NRG, SPV #1 LLC 431061 2/3/2016
191 NRG, SPV #1 LLC 431058 2/3/2016
192 NRG, SPV #1 LLC 431055 2/3/2016
193 NRG, SPV #1 LLC 431052 2/3/2016

225
194 NRG, SPV #1 LLC 431049 2/3/2016
195 NRG, SPV #1 LLC 431166 4/6/2016
196 NRG, SPV #1 LLC 431163 4/6/2016
197 NRG, SPV #1 LLC 431160 4/6/2016
198 NRG, SPV #1 LLC 431157 4/6/2016
199 NRG, SPV #1 LLC 431154 4/6/2016
200 NRG, SPV #1 LLC 431151 4/6/2016
201 NRG, SPV #1 LLC 431148 4/6/2016
202 NRG, SPV #1 LLC 431145 4/6/2016
203 NRG, SPV #1 LLC 431070 4/6/2016

226
204 NRG, SPV #1 LLC 431067 4/6/2016
205 NRG, SPV #1 LLC 431064 4/6/2016
206 NRG, SPV #1 LLC 431061 4/6/2016
207 NRG, SPV #1 LLC 431058 4/6/2016
208 NRG, SPV #1 LLC 431055 4/6/2016
209 NRG, SPV #1 LLC 431052 4/6/2016
210 NRG, SPV #1 LLC 431049 4/6/2016
211 NRG, SPV #1 LLC 431166 7/18/2016
212 NRG, SPV #1 LLC 431163 7/18/2016
213 NRG, SPV #1 LLC 431160 7/18/2016
214 NRG, SPV #1 LLC 431157 7/18/2016
215 NRG, SPV #1 LLC 431154 7/18/2016
216 NRG, SPV #1 LLC 431151 7/18/2016
217 NRG, SPV #1 LLC 431148 7/18/2016
218 NRG, SPV #1 LLC 431145 7/18/2016

227
219 NRG, SPV #1 LLC 431070 7/18/2016
220 NRG, SPV #1 LLC 431067 7/18/2016
221 NRG, SPV #1 LLC 431064 7/18/2016
222 NRG, SPV #1 LLC 431061 7/18/2016
223 NRG, SPV #1 LLC 431058 7/18/2016
224 NRG, SPV #1 LLC 431055 7/18/2016
225 NRG, SPV #1 LLC 431052 7/18/2016
226 NRG, SPV #1 LLC 431049 7/18/2016
227 NRG, SPV #1 LLC 431166 10/22/2016
228 NRG, SPV #1 LLC 431163 10/22/2016
229 NRG, SPV #1 LLC 431160 10/22/2016
230 NRG, SPV #1 LLC 431157 10/22/2016
231 NRG, SPV #1 LLC 431154 10/22/2016
232 NRG, SPV #1 LLC 431151 10/22/2016
233 NRG, SPV #1 LLC 431148 10/22/2016
234 NRG, SPV #1 LLC 431145 10/22/2016

228
235 NRG, SPV #1 LLC 431070 10/22/2016
236 NRG, SPV #1 LLC 431067 10/22/2016
237 NRG, SPV #1 LLC 431064 10/22/2016
238 NRG, SPV #1 LLC 431061 10/22/2016
239 NRG, SPV #1 LLC 431058 10/22/2016
240 NRG, SPV #1 LLC 431055 10/22/2016
241 NRG, SPV #1 LLC 431052 10/22/2016
242 NRG, SPV #1 LLC 431049 10/22/2016
243 NRG, SPV #1 LLC 431166 11/15/2016
244 NRG, SPV #1 LLC 431163 11/15/2016
245 NRG, SPV #1 LLC 431160 11/15/2016

229
246 NRG, SPV #1 LLC 431157 11/15/2016
247 NRG, SPV #1 LLC 431154 11/15/2016
248 NRG, SPV #1 LLC 431151 11/15/2016
249 NRG, SPV #1 LLC 431148 11/15/2016
250 NRG, SPV #1 LLC 431145 11/15/2016
251 NRG, SPV #1 LLC 431070 11/15/2016
252 NRG, SPV #1 LLC 431067 11/15/2016
253 NRG, SPV #1 LLC 431064 11/15/2016
254 NRG, SPV #1 LLC 431061 11/15/2016
255 NRG, SPV #1 LLC 431058 11/15/2016
256 NRG, SPV #1 LLC 431055 11/15/2016

230
(1) (Lines 1-2) Solar Star California XXXIV, LLC (Offer 490001 - Solar LCR 1
Energy Savings Agreements) 2
Solar Star California XXXIV, LLC Local Capacity Resource (LCR) 3
Energy Savings agreement is a one (1) MW solar PV project located in the Goleta section of the 4
Moorpark substation area. 5
6
7
8
. 9
10
11
12
(2) (Line 3) Solar Star California XXXIV, LLC (Offer 490001 - Solar LCR 13
Energy Savings Agreements) 14
Solar Star California XXXIV, LLC LCR Energy Savings agreement is a 15
one (1) MW solar PV project located in the Goleta section of the Moorpark substation area. 16
17
18
19
20
21
22
257 NRG, SPV #1 LLC 431052 11/15/2016
258 NRG, SPV #1 LLC 431049 11/15/2016
231
1
2
3
4
(3) (Line 4) Solar Star California XXXIV, LLC (Offer 490001 - Solar LCR 5
Energy Savings Agreements) 6
Solar Star California XXXIV, LLC LCR Energy Savings agreement is a 7
one (1) MW solar PV project located in the Goleta section of the Moorpark substation area. Solar Star 8
California XXXIV, LLC was originally signed as part of SCE’s Local Capacity Requirements (LCR) 9
solicitation executed on November 3, 2014. 10
11
12
13
14
15
16
17
18
19
20
21
22
23
(4) (Line 5) Solar Star California XXXIV, LLC (Offer 490001 - Solar LCR 24
Energy Savings Agreements) 25
Solar Star California XXXIV, LLC LCR Energy Savings agreement is a 26
one (1) MW solar PV project located in the Goleta section of the Moorpark substation area. Solar Star 27

232
California XXXIV, LLC was originally signed as part of SCE’s Local Capacity Requirements (LCR) 1
solicitation executed on November 3, 2014. 2
3
4
5
6
7
8
9
10
11
(5) (Item 6) Solar Star California XXXV, LLC (Offer 490002 - Solar LCR 12
Energy Savings Agreements) 13
Solar Star California XXXV, LLC LCR Energy Savings agreement is a 14
twelve (12) MW solar PV project located in the Johanna/Santiago section of the West LA Basin 15
substation area. Solar Star California XXXV, LLC was originally signed as part of SCE’s Local 16
Capacity Requirements (LCR) solicitation executed on November 3, 2014. 17
18
19
20
21
22
. 23
(6) (Item 7) Solar Star California XXXV, LLC (Offer 490002 - Solar LCR 24
Energy Savings Agreements) 25
Solar Star California XXXV, LLC LCR Energy Savings agreement is a 26
twelve (12) MW solar PV project located in the Johanna/Santiago section of the West LA Basin 27

233
substation area. Solar Star California XXXV, LLC was originally signed as part of SCE’s Local 1
Capacity Requirements (LCR) solicitation executed on November 3, 2014. 2
3
4
5
6
7
8
9
10
11
12
13
(7) (Item 8) Solar Star California XXXV, LLC (Offer 490002 - Solar LCR 14
Energy Savings Agreements) 15
Solar Star California XXXV, LLC LCR Energy Savings agreement is a 16
twelve (12) MW solar PV project located in the Johanna/Santiago section of the West LA Basin 17
substation area. Solar Star California XXXV, LLC was originally signed as part of SCE’s Local 18
Capacity Requirements (LCR) solicitation executed on November 3, 2014. 19
20
21
22
23
24
25
26
27
234
1
2
3
4
5
(8) (Item 9) Solar Star California XXXV, LLC (Offer 490002 - Solar LCR 6
Energy Savings Agreements) 7
Solar Star California XXXV, LLC LCR Energy Savings agreement is a 8
twelve (12) MW solar PV project located in the Johanna/Santiago section of the West LA Basin 9
substation area. Solar Star California XXXV, LLC was originally signed as part of SCE’s Local 10
Capacity Requirements (LCR) solicitation executed on November 3, 2014. 11
12
13
14
15
16
17
18
19
20
. 21
(9) (Items 10) Solar Star California XXXVI, LLC (Offer 490003 - Solar LCR 22
Energy Savings Agreements) 23
Solar Star California XXXVI, LLC LCR Energy Savings agreement is a 24
thirteen (13) MW solar PV project located in the West LA Basin substation area. Solar Star California 25
XXXVI, LLC was originally signed as part of SCE’s Local Capacity Requirements (LCR) solicitation 26
executed on November 3, 2014. 27

235
1
2
3
4
5
. 6
(10) (Items 11) Solar Star California XXXVI, LLC (Offer 490003 - Solar LCR 7
Energy Savings Agreements) 8
Solar Star California XXXVI, LLC LCR Energy Savings agreement is a 9
thirteen (13) MW solar PV project located in the West LA Basin substation area. Solar Star California 10
XXXVI, LLC was originally signed as part of SCE’s Local Capacity Requirements (LCR) solicitation 11
executed on November 3, 2014. 12
13
14
15
16
17
18
19
20
21
. 22
(11) (Item 12) Solar Star California XXXVI, LLC (Offer 490003 - Solar LCR 23
Energy Savings Agreements) 24
Solar Star California XXXVI, LLC LCR Energy Savings agreement is a 25
thirteen (13) MW solar PV project located in the West LA Basin substation area. Solar Star California 26
XXXVI, LLC was originally signed as part of SCE’s Local Capacity Requirements (LCR) solicitation 27

236
executed on November 3, 2014. 1
2
3
4
5
6
7
8
9
10
11
12
13
14
(12) (Item 13) Solar Star California XXXVI, LLC (Offer 490003 - Solar LCR 15
Energy Savings Agreements) 16
Solar Star California XXXVI, LLC LCR Energy Savings agreement is a 17
thirteen (13) MW solar PV project located in the West LA Basin substation area. Solar Star California 18
XXXVI, LLC was originally signed as part of SCE’s Local Capacity Requirements (LCR) solicitation 19
executed on November 3, 2014. 20
21
22
23
24
25
26
27

237
1
. 2
(13) (Item 14) Solar Star California XXXVII, LLC (Offer 490004 - Solar LCR 3
Energy Savings Agreements) 4
Solar Star California XXXVII, LLC LCR Energy Savings agreement is a 5
five (5) MW solar PV project located in the West LA Basin substation area. Solar Star California 6
XXXVII, LLC was originally signed as part of SCE’s Local Capacity Requirements (LCR) solicitation 7
executed on November 3, 2014. 8
9
10
11
12
13
14
(14) (Item 15) Solar Star California XXXVII, LLC (Offer 490004 - Solar LCR 15
Energy Savings Agreements) 16
Solar Star California XXXVII, LLC LCR Energy Savings agreement is a 17
five (5) MW solar PV project located in the West LA Basin substation area. Solar Star California 18
XXXVII, LLC was originally signed as part of SCE’s Local Capacity Requirements (LCR) solicitation 19
executed on November 3, 2014. 20
21
22
23
24
25
26
27

238
1
2
. 3
(15) (Item 16) Solar Star California XXXVII, LLC (Offer 490004 - Solar LCR 4
Energy Savings Agreements) 5
Solar Star California XXXVII, LLC LCR Energy Savings agreement is a 6
five (5) MW solar PV project located in the West LA Basin substation area. Solar Star California 7
XXXVII, LLC was originally signed as part of SCE’s Local Capacity Requirements (LCR) solicitation 8
executed on November 3, 2014. 9
10
11
12
13
14
(16) (Item 17) Solar Star California XXXVII, LLC (Offer 490004 - Solar LCR 15
Energy Savings Agreements) 16
Solar Star California XXXVII, LLC LCR Energy Savings agreement is a 17
five (5) MW solar PV project located in the West LA Basin substation area. Solar Star California 18
XXXVII, LLC was originally signed as part of SCE’s Local Capacity Requirements (LCR) solicitation 19
executed on November 3, 2014. 20
21
. 22
23
24

239
(17) (Item 18) Solar Star California XXXVII, LLC (Offer 490004 - Solar LCR 1
Energy Savings Agreements) 2
Solar Star California XXXVII, LLC LCR Energy Savings agreement is a 3
five (5) MW solar PV project located in the West LA Basin substation area. Solar Star California 4
XXXVII, LLC was originally signed as part of SCE’s Local Capacity Requirements (LCR) solicitation 5
executed on November 3, 2014. 6
7
8
9
10
11
12
13
14
(18) (Items 19-20) Solar Star California XXXIX, LLC (Offer 490005 - Solar 15
LCR Energy Savings Agreements) 16
Solar Star California XXXIX, LLC LCR Energy Savings agreement is a 17
five (5) MW solar PV project located in the Moorpark substation area. Solar Star California XXXIX, 18
LLC was originally signed as part of SCE’s Local Capacity Requirements (LCR) solicitation executed 19
on November 3, 2014. 20
21
22
23
24
25
26

240
(19) (Item 21) Solar Star California XXXIX, LLC (Offer 490005 - Solar LCR 1
Energy Savings Agreements) 2
Solar Star California XXXIX, LLC LCR Energy Savings agreement is a 3
five (5) MW solar PV project located in the Moorpark substation area. Solar Star California XXXIX, 4
LLC was originally signed as part of SCE’s Local Capacity Requirements (LCR) solicitation executed 5
on November 3, 2014. 6
7
8
. 9
10
11
12
13
. 14
(20) (Item 22) Solar Star California XXXIX, LLC (Offer 490005 - Solar LCR 15
Energy Savings Agreements) 16
Solar Star California XXXIX, LLC LCR Energy Savings agreement is a 17
five (5) MW solar PV project located in the Moorpark substation area. Solar Star California XXXIX, 18
LLC was originally signed as part of SCE’s Local Capacity Requirements (LCR) solicitation executed 19
on November 3, 2014. 20
21
22
23
24
25

241
(21) (Item 23) Solar Star California XXXIX, LLC (Offer 490005 - Solar LCR 1
Energy Savings Agreements) 2
Solar Star California XXXIX, LLC LCR Energy Savings agreement is a 3
five (5) MW solar PV project located in the Moorpark substation area. Solar Star California XXXIX, 4
LLC was originally signed as part of SCE’s Local Capacity Requirements (LCR) solicitation executed 5
on November 3, 2014. 6
7
. 8
9
. 10
(22) (Item 24) Solar Star California XXXVIII, LLC (Offer 490006 - Solar LCR 11
Energy Savings Agreements) 12
Solar Star California XXXVIII, LLC LCR Energy Savings agreement is a 13
fourteen (14) MW solar PV project located in the West LA Basin substation area. Solar Star California 14
XXXVIII, LLC was originally signed as part of SCE’s Local Capacity Requirements (LCR) solicitation 15
executed on November 3, 2014. 16
17
18
19
20
21
. 22
(23) (Item 25) Solar Star California XXXVIII, LLC (Offer 490006 - Solar LCR 23
Energy Savings Agreements) 24
Solar Star California XXXVIII, LLC LCR Energy Savings agreement is a 25
fourteen (14) MW solar PV project located in the West LA Basin substation area. Solar Star California 26
XXXVIII, LLC was originally signed as part of SCE’s Local Capacity Requirements (LCR) solicitation 27

242
executed on November 3, 2014. 1
2
3
4
5
. 6
7
8
9
10
11
(24) (Item 26) Solar Star California XXXVIII, LLC (Offer 490006 - Solar LCR 12
Energy Savings Agreements) 13
Solar Star California XXXVIII, LLC LCR Energy Savings agreement is a 14
fourteen (14) MW solar PV project located in the West LA Basin substation area. Solar Star California 15
XXXVIII, LLC was originally signed as part of SCE’s Local Capacity Requirements (LCR) solicitation 16
executed on November 3, 2014. 17
18
19
20
21
22
23
24
25
26
27

243
1
2
3
(25) (Item 27) Solar Star California XXXVIII, LLC (Offer 490006 - Solar LCR 4
Energy Savings Agreements) 5
Solar Star California XXXVIII, LLC LCR Energy Savings agreement is a 6
fourteen (14) MW solar PV project located in the West LA Basin substation area. Solar Star California 7
XXXVIII, LLC was originally signed as part of SCE’s Local Capacity Requirements (LCR) solicitation 8
executed on November 3, 2014. 9
10
11
12
13
14
15
16
17
18
. 19
(26) (Items 28-47) NRG Energy Efficiency-P, LLC (Offers 447153, 447150, 20
447151, and 447152 – Energy Efficiency Savings Agreements) 21
NRG Energy Efficiency-P, LLC LCR Energy Savings Agreements are 22
72.5 MW of Energy Efficiency projects located in the West LA Basin and Johanna/Santiago substation 23
areas. NRG Energy Efficiency-P LLC was originally signed as part of SCE’s LCR Solicitation executed 24
on November 4, 2014. 25
26
27

244
1
2
3
4
5
6
7
8
9
(27) (Items 48-63) NRG Energy Efficiency-L, LLC (Offers 447103, 447102, 10
447101, and 447100 Energy Efficiency Savings Agreements) 11
NRG Energy Efficiency-L, LLC LCR Energy Savings Agreements are 30 12
MW of Energy Efficiency projects located in the West LA Basin and Johanna/Santiago substation areas. 13
NRG Energy Efficiency-L LLC was originally signed as part of SCE’s LCR Solicitation executed on 14
November 4, 2014. 15
16
17
18
19
20
21
22
23
24
25

245
(28) (Items 64-131) Onsite Energy Corporation (Offers 408001, 408002, 1
408003, 408004, 408005, 408006, 408007, 408008, 408009, 408010, 2
408011, 408012, 408013, 408014, 408015, 408016 and 408017 Energy 3
Efficiency Savings Agreements) 4
Onsite Energy Corporation Energy Efficiency Savings Agreements are 17 5
MW of Energy Efficiency projects located in the West LA Basin and Moorpark substation areas. Onsite 6
Energy Corporation was originally signed as part of SCE’s LCR Solicitation executed on November 4, 7
2014. 8
9
10
11
12
13
14
15
16
17
18
19
20
. 21
(29) (Items 133-159) Sterling Analytics, LLC (Offers 429001, 429003, 429002, 22
429004, 429006, and 429007 Energy Efficiency Savings Agreements) 23
Sterling Analytics, LLC Energy Efficiency Savings Agreements are 16.7 24
MW of Energy Efficiency projects located in the West LA Basin and substation area. Sterling 25
Analytics, LLC was originally signed as part of SCE’s LCR Solicitation executed on November 4, 2014. 26
27

246
1
2
3
4
5
6
7
8
9
10
(30) (Item 160) NRG Curtailment Solutions (Offer 447250) 11
The NRG Curtailment Solutions Agreement is a Demand Response (DR) 12
Agreement in the West LA Basin area originally executed on November 4, 2014. This agreement was 13
originally signed as part of SCE’s Local Capacity Requirements solicitation. 14
15
16
17
18
(31) (Item 161) NRG Curtailment Solutions (Offer 447250) 19
The NRG Curtailment Solutions Agreement is a Demand Response (DR) 20
Agreement in the West LA Basin area originally executed on November 4, 2014. This agreement were 21
originally signed as part of SCE’s Local Capacity Requirements solicitation. 22
23
24
25
26

247
(32) (Item 162) NRG Curtailment Solutions (Offer 447250) 1
The NRG Curtailment Solutions Agreement is a Demand Response (DR) 2
Agreement in the West LA Basin area originally executed on November 4, 2014. This agreement were 3
originally signed as part of SCE’s Local Capacity Requirements solicitation. 4
5
6
7
(33) (Item 163-166) Hybrid-Electric Building Technologies Irvine 1, Irvine 2, 8
West LA 1 and West LA 2 LLC (Offer 467009, 467010, 467022, 467025) 9
The Hybrid-Electric Building Technologies Irvine 1, Irvine 2, West LA 1 10
& West LA 2 LLC agreements are Demand Response Energy Storage (DRES) in the West LA Basin 11
area which were originally executed on November 4, 2014. These agreements were originally signed as 12
part of SCE’s Local Capacity Requirements solicitation. 13
14
15
16
(34) (Items 167-170) Hybrid-Electric Building Technologies Irvine 1, Irvine 2, 17
West LA 1 and West LA 2 LLC (Offer 467009, 467010, 467022, 467025) 18
The Hybrid-Electric Building Technologies Irvine 1, Irvine 2, West LA 1 19
& West LA 2 LLC agreements are Demand Response Energy Storage (DRES) in the West LA Basin 20
area which were originally executed on November 4, 2014. These agreements were originally signed as 21
part of SCE’s Local Capacity Requirements solicitation. 22
23
24
25

248
(35) (Items 171-174) Hybrid-Electric Building Technologies Irvine 1, Irvine 2, 1
West LA 1 and West LA 2 LLC (Offer 467009, 467010, 467022, 467025) 2
The Hybrid-Electric Building Technologies Irvine 1, Irvine 2, West LA 1 3
& West LA 2 LLC agreements are Demand Response Energy Storage (DRES) in the West LA Basin 4
area which were originally executed on November 4, 2014. These agreements were originally signed as 5
part of SCE’s Local Capacity Requirements solicitation. 6
7
8
9
10
. 11
(36) (Item 175) Stem Energy Southern California LLC (Offer 402039, 402040) 12
The Stem Energy Southern California LLC agreements are Demand 13
Response Energy Storage (DRES) in the West LA Basin area which were originally executed on 14
November 4, 2014. These agreements were originally signed as part of SCE’s Local Capacity 15
Requirements solicitation. 16
17
18
19
. 20
(37) (Item 176) Stem Energy Southern California LLC (Offer 402039, 402040) 21
The Stem Energy Southern California LLC agreements are Demand 22
Response Energy Storage (DRES) in the West LA Basin area which were originally executed on 23
November 4, 2014. These agreements were originally signed as part of SCE’s Local Capacity 24
Requirements solicitation. 25
26

249
1
2
(38) (Item 177) Stem Energy Southern California LLC (Offer 402039, 402040) 3
The Stem Energy Southern California LLC agreements are Demand 4
Response Energy Storage (DRES) in the West LA Basin area which were originally executed on 5
November 4, 2014. These agreements were originally signed as part of SCE’s Local Capacity 6
Requirements solicitation. 7
8
9
. 10
(39) (Item 178) Stem Energy Southern California LLC (Offer 402040) 11
The Stem Energy Southern California offer 402040 was amended & 12
restated to assist with Aliso Canyon mitigation efforts. The amended and restated contract accelerated 13
up to 3MW from their existing 78MW LCR West Los Angeles Basin Demand Response Energy Storage 14
was executed on November 17, 2017. The original contract that was executed on November 4, 2014 and 15
the delivery period start in January 2018. 16
17
18
19
20
21
22
(40) (Items 179-258) NRG, SPV #1 LLC (Offers 431166, 431163, 431160, 23
431157, 431154, 431151, 431148, 431145, 431070, 431067, 431064, 24
431061, 431058, 431055, 431052, and 431049) 25
The NRG, SPV1 LLC PLS Agreements are 16.7 MW of projects 25.6 26
MW of Peak Load Shift Agreements (PLS) projects located in the Johanna/Santiago area. NRG, SPV1, 27

250
LLC was originally signed as part of SCE’s LCR Solicitation executed on November 4, 2014. 1
2
3
4
5
6
7
8
9
10
11
12
. 13
e) Contract Assignment Administration 14
BTM contracts may only be assigned with the written consent of the parties, 15
which may not be unreasonably withheld. There are many reasons why BTM contract counterparties 16
seek to assign their contracts. For example, the counterparty might want to sell or transfer the project to 17
a new entity, assign the contract to a lender as security for a loan, or a change of control of the project. 18
Table VII-62 lists the seven contract assignments to which SCE consented during the Record Period. 19
SCE entered into four Assignment of Membership Interests for existing EE contracts; two Consent to 20
Collateral Assignment for existing DG contracts; and one Assignment and Assumption Agreement for 21
an existing DR contract. 22

251
Table VII-62 SCE BTM Contract Consents and Consents to Assignments
f) Contract Terminations 1
During the Record Period, nine demand response contracts were terminated for a 2
total of 82 MW. Six of the contracts terminated were the NRG Distributed Generation PR LLC 3
(contract ID 447200, 447201, 447202, 447203, 447204, 447205) LCR contracts. These contracts were 4
terminated as a result of CPUC Decision 15-11-041 for LCR West Los Angeles Basin contracts, which 5
denied the approval these contracts. The Aliso Canyon demand response contracts with NRG 6
Curtailment Solutions (ACDR-01-01), OhmConnect Inc. (ACDR 02-01) and Zen Within Inc. (ACDR 7
04-01) were terminated due to the contracts reaching the completion of their terms. These agreements 8
are shown in Table VII-63 below. 9
Offer ID Project Type of Assignment or Consents Date Signed1 490004 Solar Star California XXXVII, LLC Consent to Collateral Assignment 12/22/20162 490005 Solar Star California XXXIX, LLC Consent to Collateral Assignment 12/22/20163 447150 NRG Energy Efficiency-P LLC Assignment of Membership Interests 12/28/20164 447151 NRG Energy Efficiency-P LLC Assignment of Membership Interests 12/28/20165 447152 NRG Energy Efficiency-P LLC Assignment of Membership Interests 12/28/20166 447153 NRG Energy Efficiency-P LLC Assignment of Membership Interests 12/28/2016
7 447250 NRG Curtailment Solutions
4/27/2016

252
Table VII-63 BTM Contracts that Terminated
January 1, 2016 Through December 31, 2016
g) Contracts that Achieved Commercial Operation 1
During the Record Period, four demand response contracts achieved commercial 2
operation. The Aliso Canyon demand response contract with OhmConnect Inc. (ACDR 02-01) started 3
delivery on August 1, 2016. The contracts with NRG Curtailment Solution (ACDR-01-01) and Zen 4
Within Inc. (ACDR 04-01) started delivery on September 1, 2016. Additionally, an Aliso Canyon 5
Accelerated Bridge contract with Stem Energy Southern California LLC (amended & restated offer 6
402040) started delivery December 1, 2016. These agreements are shown in Table VII-64. 7

253
Table VII-64 BTM Contracts that Achieved Commercial Operation
January 1, 2016 Through December 31, 2016
h) Other Contract Activities 1
(1) Letter of Agreements 2
SCE entered into Letter of Agreements conditionally waiving CPUC 3
approval for two distributed generation renewable contracts. The Letter of Agreements accelerated 4
deliveries of 5.21 MWac of solar capacity in order to assist with the Aliso Canyon reliability needs. 5
Solar Star California XXXVII, LLC LCR Energy Savings agreement is a 6
five 5 MW solar PV project located in the West LA Basin substation area. Solar Star California 7
XXXVII, LLC was originally signed as part of SCE’s Local Capacity Requirements (LCR) solicitation 8
executed on November 3, 2014. SCE and Solar Star California XXXVII, LLC executed a Letter of 9
Agreement on May 18, 2016 conditionally waiving CPUC Approval to accelerate deliveries of 3.042 10
MWac of solar capacity to assist in potential power supply issues due to Aliso Canyon Gas Storage 11
partial shutdown at $0 cost for the acceleration. SCE’s customers benefit from this letter agreement as it 12
helps minimize the potential of experiencing blackout/brownouts due to reliability issues associated with 13
Aliso Canyon. 14
Solar Star California XXXIX, LLC LCR Energy Savings agreement is a 15
five 5 MW solar PV project located in the Moorpark substation area. Solar Star California XXXIX, 16
LLC was originally signed as part of SCE’s Local Capacity Requirements (LCR) solicitation executed 17
on November 3, 2014. SCE and Solar Star California XXXIX, LLC executed a Letter of Agreement on 18
June 21, 2016 conditionally waiving CPUC Approval to accelerate deliveries of 2.168 MWac of solar 19
capacity to assist in potential power supply issues due to Aliso Canyon Gas Storage partial shutdown at 20

254
$0 cost for the acceleration. SCE’s customers benefit from this letter agreement as it helps minimize the 1
potential of experiencing blackout/brownouts due to reliability issues associated with Aliso Canyon. 2
E. Contract Collateral 3
1. Conventional 4
a) Development Security and Performance Assurance 5
Conventional contracts are obligated to provide various forms of collateral. These 6
forms include different types of performance assurance. Some include mark-to-market calculations and 7
others are simply a fixed amount. Appendix VII-N lists the collateral held for these contracts on 8
December 31, 2016. 9
2. PURPA and CHP 10
SCE has a variety of cash and non-cash deposits that are collected from non-investment 11
grade energy suppliers in the procurement process to assure performance. There are three types of 12
collateral held by SCE for PURPA and CHP contracts: Development Security, Performance Assurance, 13
and ITCC (sometimes referred to as CIAC, explained in Section 5 below). SCE has assigned its Credit 14
Risk & Collateral Management group to handle the administration and tracking of this collateral. The 15
contract managers within SCE’s Energy Contracts group still serve as the primary contact for collateral 16
issues; however, Credit Risk & Collateral Management handles SCE’s routine transactions with the 17
counterparties. Appendix VII-N lists the collateral held for these contracts on December 31, 2016. 18
3. RPS 19
There are two types of Collateral that were posted in the Record Period from RPS 20
contracts: Development Security and Performance Assurance. Each type is discussed in detail below. 21
a) Development Security 22
SCE contract managers work closely with RPS project developers to assist them 23
in meeting project milestones so they can achieve commercial operation and contribute to the State’s 24
renewable energy goals. As SCE has reported in other contexts, these projects can face a number of 25
challenges, including permitting delays and difficulty securing financing. As part of its contract 26
administration activities, SCE diligently monitors the progress of RPS projects and provides on-going 27

255
support to move these projects forward for the benefit of its customers. However, in order to mitigate 1
the risk of a project’s failure to reach commercial operation, SCE requires counterparties to post 2
development security to maintain the incentive for the counterparty to complete the project and to defray 3
some of the costs of replacing failed projects. 4
The administration and tracking of this collateral has been assigned to SCE’s 5
Credit, Risk and Collateral Management Group. One significant milestone to be met by RPS projects is 6
the posting of a required development security to ensure that the contracted project will be developed. 7
Development security is typically posted in the form of cash or letter of credit. 8
b) Performance Assurance 9
On or before a project’s Commercial Operation Date (COD), RPS contracts 10
require posting of “performance assurance,” which is collateral for performance during the term of the 11
PPA. This is distinct from “development security” described in the previous section, which provides 12
collateral for development of the project prior to commercial operation. The collateral amount may be 13
posted in the form of cash, letter(s) of credit, or a guaranty from a creditworthy entity acceptable to 14
SCE. Some counterparties provide performance assurance in multiple letters of credit. 15
Appendix VII-N lists the collateral held for these contracts on December 31, 16
2016, related to RPS project development security and performance assurance. 17
4. BTM Contracts 18
The administration and tracking of BTM contract collateral is between two groups at 19
SCE. Officially, administration of collateral activity is assigned to SCE’s Credit Risk and Collateral 20
Management Group. SCE’s Credit Risk and Collateral Management Group directly handles the routine 21
collateral posting transactions with the counterparty, and informs the contract managers of any Delivery 22
Date Security amount posted and due. In order to provide continuity for counterparties external to the 23
company, contract managers within Customer Programs & Services (CP&S) serve as the primary 24
contact for collateral issues. Delivery Date security and Performance Assurance is typically posted in 25
the form of cash or letter of credit. Appendix VII-N lists the significant activities that took place during 26
the Record Period related to CP&S project development security. 27
256
5. Contribution in Aid of Construction (CIAC) Tax 1
Legacy QF agreements managed by SCE’s Energy Contracts Management group require 2
that the counterparty either: (1) construct and transfer ownership of the interconnection facilities to the 3
utility; or (2) pay the utility for building the project intertie. In 1986, the Internal Revenue Code was 4
amended by the Tax Reform Act of 1986 to provide that these transfers of property and/or payments of 5
money may be determined by the Internal Revenue Service (IRS) to be taxable income to SCE as CIAC. 6
In 1988, the IRS clarified that such transfers only become taxable under the circumstances described in 7
the IRS’s regulations. 8
Counterparties to Legacy QF Agreements are ultimately responsible for CIAC tax, also 9
referred to as the income tax component of contributions (ITCC) imposed on the utility as a result of the 10
project’s interconnection arrangements. Pursuant to D.94-06-038, such parties can avoid the 11
requirement of making a cash deposit to securitize this obligation by providing either: (1) a certification 12
of adequate tangible net worth; or (2) a letter of credit. To comply with D.94-06-038, these parties must 13
execute an indemnity agreement that provides for the posting of a letter of credit or incorporates the 14
annual certification requirements. SCE monitors compliance with these indemnity agreements and for 15
the Record Period no additional security was received, however, SCE returned security in the amount of 16
$637,697 to contract ID 4039 Kaweah River Power Authority. The return was associated with a 17
determination of ownership of a transmission line interconnecting the facility. The security was 18
collected and held based on belief that the transmission line was a part of the interconnection. In 2016, 19
FERC made a determination that the line was SCE’s and thus, the collateral associated with the line was 20
returned. 21
F. Contract Compliance 22
1. Conventional 23
a) Insurance Verification 24
Specific conventional projects are required to obtain and maintain comprehensive 25
general liability insurance during the terms of their power purchase contracts. SCE uses a third-party 26
insurance management solutions company, Insurance Tracking Services, Inc. (ITS) to monitor 27

257
counterparty compliance with these requirements. During the Record Period, nine conventional projects 1
and 11 energy storage projects were actively monitored by ITS. ITS, in conjunction with SCE, ensures 2
that these projects have: 3
4 Obtained required insurance upon execution. 5
Maintained insurance policies and insurance carriers that meet the contract’s 6
requirements. 7
Maintained adequate insurance coverage throughout the terms of their contracts. 8
2. PURPA and CHP 9
Compliance programs have been developed to ensure that PURPA and CHP projects 10
adhere to the terms of their contracts, and to integrate those projects effectively with the electric system 11
grid. This section discusses the following contract compliance programs: (a) capacity performance; (b) 12
metering energy deliveries; (c) prescribed dispatch; (d) protection equipment testing; (e) efficiency 13
monitoring; (f) scheduled maintenance; (g) wind operations; (h) insurance verification; and (i) 14
forecasting and scheduling accuracy. 15
a) Capacity Performance Programs and Verification 16
SCE’s capacity performance monitoring programs and activities assist in ensuring 17
that SCE’s customers receive the firm capacity for which SCE has contracted. There are two major 18
programs: the annual contract capacity demonstration (CapDemo) program, and the summer capacity 19
performance (CapPerformance) program. 20
(1) CapDemo Program 21
The CapDemo program applies to those PURPA and CHP contracts that 22
provide payment for firm capacity and contain a capacity testing clause. These facilities are required to 23
achieve and reliably sustain 100% of their firm contract capacity for each metering interval (typically 15 24
minutes) during a specified period of testing (typically six hours during an on-peak period), or as 25
otherwise specified either in the contract or other agreements between SCE and the counterparty. This 26
258
performance test simulates the condition described in most contracts requiring the project to make best 1
efforts to provide full contract output when a system emergency is declared. Most firm capacity 2
contracts contain a firm capacity reduction clause that provides a remedy if the generator is unable to 3
provide the required capacity during the test. Typically, the remedy is a reduction of firm capacity to the 4
level demonstrated during the test.142 5
The steps involved in implementing the CapDemo program include 6
scheduling mutually-agreeable test dates, visits by SCE personnel to the facility to ensure that the test 7
protocols are properly followed, analysis of the regular revenue meter data for pass or fail status, 8
communicating the results to the project, and administering the appropriate remedy for those projects 9
that fail. Demonstrations are generally performed during the summer season on-peak hours for the 10
months of June through September. Longer test periods specified in a few of the contracts also include 11
hours from the mid-peak and off-peak periods. 12
During the Record Period, SCE witnessed 28 demonstrations and sent 13
notices of pass/fail status to all of the facilities. Of the 28 projects that demonstrated capacity, 23 passed 14
their initial demonstration. One project failed, was granted a retest, and passed the retest. Four 15
additional facilities failed the demonstration(s). The circumstances regarding the four failures and one 16
fail/retest are as follows (in ID order): 17
(a) L.A. Co. Sanitation District Spadra (ID 1077) 18
L.A. Co. Sanitation District Spadra, a landfill gas fueled steam 19
turbine generator equipped project located on the closed Spadra landfill has been generally referred as 20
“Energy Recovery from Gas” or ERG. The Spadra ERG or SERG facility agreed to perform a capacity 21
demonstration although the project operation ceased on October 1, 2015. The project was unable to 22
provide any generation and failed the capacity demonstration. A capacity refund of $1,222,720.18 has 23
142 SCE has historically experienced disputes with projects operating pursuant to PURPA contracts regarding the
appropriate capacity reduction in the event of a CapDemo test failure.

259
been collected. The firm contract capacity was reduced to 0 kW going forward from the date of the 1
capacity demonstration. 2
(b) L.A. Co. Sanitation District (ID 1090) 3
L.A. Co. Sanitation District, another landfill gas fueled steam 4
turbine generator equipped project located on the closed Puente Hills landfill failed its last 5
demonstration. This project (one of three) on the landfill was known as P.E.R.G. for Puente Energy 6
Recovery from Gas. P.E.R.G. failed to provide firm contract capacity of 46,500 kW for the entire six 7
hour demonstration period. The lowest project output was 38,052 kW. Failure to pass the 8
demonstration resulted in recovery of the prior firm capacity payment amounts in excess of the 9
demonstrated value. A capacity refund of $526,250.76 was obtained by way of a payment offset. The 10
firm contract capacity was reduced to 38,052 kW going forward from the date of the capacity 11
demonstration. 12
(c) Coso Energy Developers (BLM) (ID 3030) 13
The BLM-East and BLM-West complexes at the Coso known 14
geothermal resource area, a multiple flash technology geothermal facility, failed to deliver the specified 15
level of firm contract capacity of 67,500 kW during the entire six hour demonstration period. The 16
lowest project output was 63,952 kW. Failure to pass the demonstration resulted in recovery of the prior 17
firm capacity payment amounts in excess of the demonstrated value. The value of the capacity recovery 18
was $179,303 and was obtained by a payment offset. The firm contract capacity was reduced to 63,592 19
kW going forward from the date of the capacity demonstration. 20
(d) Ormesa Geothermal 1 (ID 3104) 21
The Ormesa Geothermal complex at the East Mesa known 22
geothermal resource area, a multiple unit binary technology geothermal facility, failed to provide the 23
specified level of demonstration capacity of 46,500 kW for the entire six-hour demonstration period. 24
The negotiated demonstration protocol for this contract utilized metering installed for demonstrations. 25
The metering recorded data over five-minute metering intervals. Per the demonstration protocol, failure 26
to deliver the demonstration capacity over any metering interval was subject to a payment of liquidated 27

260
damages of $50 per kW. The lowest recorded output was 32,592 kW. Ormesa was invoiced and paid 1
$695,400. 2
(e) Luz Solar Partners Ltd. VI (ID 5020) 3
Luz Solar Partners Ltd. VI, commonly called S.E.G.S. VI had an 4
abnormal and unforeseen failure just prior to the regularly scheduled capacity demonstration. The 5
demonstration was rescheduled and SEGS VI passed with an output of 30,960 kW which exceeds the 6
requirement of 30,000 kW. 7
(2) CapPerformance Program 8
Most PURPA and CHP contracts with firm capacity provisions require 9
that the project achieve a minimum performance factor (as more specifically defined in the applicable 10
contract) of 80% of its firm contract capacity for the on-peak periods during the peak months of June, 11
July, August, and September.143 If the project fails to meet this minimum requirement for any month, it 12
is placed on probation beginning the month following the failure. Probation generally continues through 13
September of the following year. Therefore, depending on which summer month the project first fails, 14
the probation period can last between 12 and 15 months, subject to SCE’s discretion to shorten the 15
period based on obtaining the best customer outcome for each case. If a project fails to meet the 16
minimum performance factor requirement during any month of its probationary period, its contract 17
capacity may be reduced and/or it can lose its eligibility for winter bonus payments pursuant to the terms 18
of the contract. A project can return to normal status at the end of probation if it satisfies the peak 19
performance requirement during all months of the probationary period. 20
During the Record Period, 29 PURPA contracts were subject to the 21
summer capacity performance provisions for the months of June through September. Of those contracts, 22
143 Many firm capacity PURPA and CHP contracts also contain provisions enabling projects to earn bonus
payments for exceeding minimum contract performance requirements during both the summer and winter months. See “Performance Bonus” discussion in E.1 of this chapter.

261
8 of the projects failed their performance obligation in at least one summer month during the on-peak 1
delivery period. The status of each of these projects is shown in shown in Table VII-65 below. 2
Table VII-65 CapPerformance Failures
January 1, 2016 Through December 31, 2016
b) Metering Energy Deliveries 3
SCE uses meter and schedule data to calculate payments owed to PURPA and 4
CHP projects that existed prior to the CAISO. Since these legacy contracts had no provision for CAISO 5
metering, they were permitted to use their existing metering in place of CAISO metering for CAISO 6
settlements until their contracts expire or are replaced. SCE uses its own metering along with a variety 7
of quality control measures to create Settlement Quality Meter Data that is transmitted to the CAISO on 8
a monthly basis for settlements purposes. Once the legacy contract is replaced the seller is required to 9
ID Project Event Status
1077 L.A. Sanitation Dist. Spadra
Failed June, July, August, and September 2016
Project placed on probation effective July 1, 2016. On October 6, 2016 SCE reduced the project’s firm capacity to zero due to continued failure to meet performance obligations. Project terminated December 14, 2016 after SCE’s receipt of a $1,222,720 capacity refund payment.
2180 Co of Los Angeles - Pitchess Honor Ranch Failed July 2016 Project placed on probation effective August 1, 2016 for a
period not to exceed 15 months.
3021 Second Imperial Geothermal Co.
Failed July, August, September 2016
Project placed on probation effective October 1, 2016 for a period not to exceed 15 months.
3025 Salton Sea Power Generation Co #3
Failed June, July, August, September 2016
Project placed on probation effective July 1, 2016 for a period not to exceed 15 months.
3028 Salton Sea Power Generation Co #2 Failed June, July 2016 Project placed on probation effective July 1, 2016 for a period
not to exceed 15 months.
3039 Salton Sea Power Generation Co #1 Failed September 2016 Project placed on probation effective October 1, 2016 for a
period not to exceed 15 months.
3104 Ormesa Geothermal I Failed June, July, August 2016
Project failed June 2016 and derated to a lower capacity effective July 1, 2016. Subsequently failed July and August 2016, and placed on probation effective September 1, 2016 for a period not to exceed 15 months. Contract terminates November 29, 2017.
6213The Bank of New York Mellon Trust Company, N.A.
Failed August, September 2016
Project failed August 2016 and was placed on probation
effective September 1, 2016. Project then failed to meet its firm capacity obligation for September 2016 and as a result was derated to a lower firm capacity amount. SCE collected a $6,647.63 capacity refund.

262
comply with all CAISO tariffs including the installation and use of CAISO approved metering. SCE 1
generally maintains its own backup meter in addition to the CAISO metering. The SCE meter also 2
provides the data for retail billing when the project is not generating and instead is consuming energy 3
from the grid. 4
(1) PURPA and CHP Projects Within SCE’s Territory 5
SCE uses three types of “interval” metering for PURPA projects located in 6
its service area: (1) real time energy metering (RTEM); (2) interval meters; and (3) CAISO meters. 7
Each of these is described below. There remains one extremely small project, Tehachapi Cummings 8
Water District, which uses a non-interval meter that provides only monthly totals which are manually 9
read from the display on the meter face by a meter reader. This Project is inactive and the generating 10
equipment has been removed. Voluntary termination is being offered to this project but no response has 11
been received. 12
For the purposes of CAISO settlements, SCE provides settlement ready 13
meter data to the CAISO for legacy PURPA and CHP generators in its service territory that are not 14
required to have CAISO meters. Readings from all these RTEM and interval meters are accumulated 15
into hourly totals and aggregated according to the CAISO delivery point. Each delivery point, whether 16
it has a single dedicated generator or an aggregation of multiple generators is reported to the CAISO 17
under a single global resource ID. Applicable loss factors are applied and the resulting data are 18
compiled into a Meter Data Exchange Format file by SCE’s MV-90 meter reading system and reported 19
to the CAISO for settlement by uploading into their Operational Meter Analysis and Reporting (OMAR) 20
system. Generators that have CAISO meters installed, have their meter data captured by the CAISO 21
directly through a dedicated network called the Energy Communication Network (ECN) for settlements. 22
SCE uses either these same meters read by its MV-90 meter reading system or its own revenue meters 23
read through the retail billing system known as Customer Data Acquisition System (CDAS), to obtain 24
the data needed to process payments. The meter data are transferred from the meter data systems 25
mentioned above, to Endur (the program that replaced WES in 2016), which is used to generate payment 26
statements for these projects. 27

263
(a) The RTEM Process 1
SCE uses the RTEM process to measure most production pursuant 2
to PURPA and CHP contracts. Some installations have multiple meters. These RTEM meters generally 3
measure energy sold to SCE, energy supplied to the facility by SCE, and reactive power (VARs) 4
supplied by SCE. The RTEM meters store data internally, and the data are transmitted to a central 5
computer every 15 minutes.144 Depending on the best pathway available at the site, the data 6
transmission occurs through the SCE-owned radio packet network called NETCOM, through a cell 7
phone system, or through the domestic telephone system. If the communication system fails, the meters 8
retain the data internally until the communication pathway is restored. The meters can also be read 9
manually using a handheld device or laptop computer. The data are transferred from the field to the 10
central computer and then to Endur, which is used to generate payment statements for these projects and 11
to the MV-90 system for CAISO settlements. 12
(b) Interval Meters 13
Simpler meters are used on very small projects that are in areas 14
still covered by manual meter readers. These simple meters are all-electronic interval meters that 15
contain an internal recorder. Each month, an SCE meter reader visits the facility to collect the meter 16
data, using a laptop computer with an optical link that connects to the meter. The data is then 17
transferred to a central computer via SCE’s internal network, and then to Endur to generate monthly 18
payment statements and the MV-90 system for CAISO settlements. 19
(c) CAISO Meters 20
CAISO meters are required on all projects that have been created 21
after the formation of the CAISO with a few exceptions for very small units. CAISO meters are 22
installed and maintained by the facility owner. Maintenance is only permitted to be performed by a 23
party who has been certified by the CAISO. These parties are known as Meter Service Agents (MSA). 24
144 The central computer also supports SCE’s billing, generation grid operations, and energy accounting systems.

264
Some installations have multiple CAISO meters either as components of the total generation or as 1
backup meters. CAISO meters are four-quadrant interval meters that measure forward and reverse watts 2
as well as forward and reverse VARs. CAISO meters are programmed with applicable loss factors. The 3
meters are capable of communicating with a remote system for data collection. This communication 4
generally occurs through a secure internet-like network known as the Energy Communication Network 5
or ECN. In a few cases the domestic phone system is used where the ECN is not readily accessible. 6
The CAISO reads these meters remotely for settlements. SCE also reads these meters remotely using an 7
MV-90 meter reading system. As provided in the contracts, the data are used in various ways, including 8
CAISO settlements. 9
(2) Out-of-Service Territory PURPA Projects 10
SCE has PURPA projects metered outside of SCE’s service territory 11
(OST). Most of the OST projects are located within IID’s service area. Energy is delivered by the local 12
utility on behalf of the generators to SCE over that utility’s interties with SCE.145 SCE receives the 13
quantity of energy represented by, and pays these PURPA projects based upon, hour-by-hour energy 14
delivery schedules from the delivering utility. The energy deliveries are compensated for line losses by 15
the transmitting utility according to agreements with the generators. The schedules are established one 16
day ahead and are adjusted in real time between SCE, the delivering utility, and the CAISO. The final 17
schedule for each hour is retained in SCE’s GenManager System. 18
The projects in IID’s service territory are covered by a single aggregated schedule 19
in GenManager. Because each project must be paid separately, IID creates a spreadsheet of hourly 20
meter and schedule data and e-mails the final schedule data at the end of each month to SCE’s 21
Settlements and Operations Services department. The metered values are collected by revenue meters 22
owned by IID. The data are then transferred to Endur and verified against the GenManager data. For 23
145 The special administration procedures discussed in this section are not applicable to the Sycamore (RAP ID
2815/2816), and Terra-Gen Dixie Valley (RAP ID 3011) projects, which are located outside of SCE’s normal service territory, but do not utilize an interconnecting utility because they are directly connected to SCE’s system and therefore are directly metered by SCE. These projects are not discussed in this section.

265
more discussion on SCE’s payment administration of its OST PURPA contracts, see Section G.2.d of 1
this chapter. 2
c) Prescribed Dispatch 3
During the Record Period, there were two PURPA projects that contained 4
provisions permitting SCE to exercise a prescribed curtailment option. These provisions allow SCE to 5
prescribe periods when the project must either limit energy deliveries or receive a lower price for energy 6
not curtailed, so as to render SCE’s customers economically indifferent. By exercising this right when 7
SCE expects to experience low market prices or transmission curtailment, higher cost PURPA contract 8
energy is curtailed, allowing for lower cost market purchases and therefore reduced costs to SCE’s 9
customers. The following activity occurred during the Record Period: 10
(1) Wheelabrator Norwalk (ID 2064) 11
This project has an annual contractual prescribed dispatch requirement and 12
was curtailed for 1,000 hours as specified in the contract. 13
(2) E.F. Oxnard (ID 2205) 14
E.F. Oxnard has the option to participate in prescribed curtailment as 15
specified in their contract. They did not select the option to participate in prescribed curtailment for this 16
period. 17
d) Protection Equipment Testing Program 18
The protection equipment testing program (Protection Program) provides for the 19
uniform implementation of the standards and requirements contained in SCE’s Rule 21 tariff, as 20
applicable to PURPA projects interconnected within SCE’s service territory. The Protection Program is 21
intended to assure that any protection equipment owned by a party operating a facility pursuant to a 22
PURPA contract that directly interfaces with SCE’s transmission or distribution system is regularly 23
tested in accordance with contractual requirements. Most PURPA contracts require that protection 24
equipment be tested at regular intervals of one, two, or four years depending on connection voltage. 25
Non-compliance with applicable protection equipment standards may subject SCE 26
and its customers to greater risk that generation equipment will not disconnect as required if it 27

266
malfunctions. This could cause damage to the project’s equipment and introduce unwanted and possibly 1
harmful voltage fluctuations into SCE’s system, or could cause a portion of the SCE system to shut 2
down, interrupting service to customers. There are also some conditions that could cause harmonics and 3
other power quality problems. 4
Compliance with this program is established by the project’s submission to SCE 5
of a report that indicates a licensed electrician inspected the protective relays. SCE may deny a forced 6
outage claim for a project that does not provide the required reports because SCE will not have had 7
proof that equipment was properly maintained as required by the Rule 21 tariff. 8
e) QF Efficiency Monitoring Program 9
In D.91-05-007, the Commission authorized the utilities to monitor the operations 10
of cogenerators, as well as small power producers that use supplemental fossil fuel, to ensure that they 11
are in compliance with FERC operating and efficiency standards. The program implementing this 12
decision is known as the QF Efficiency Monitoring (QFEM) program. 13
Originally, state regulations permitted suspension of contract payments and 14
disconnection of PURPA projects from parallel operation for failure to comply with FERC standards. 15
Subsequent litigation and Commission decisions have modified the QFEM program, based on a 16
determination that federal law preempted the state’s regulations. Currently, only FERC can determine if 17
a project is compliant and prescribe corrective actions in the event of noncompliance. However, 18
PURPA projects are still required to submit operating data to utilities annually to demonstrate 19
compliance with FERC standards. When it is cost effective, SCE will take measures necessary to file 20
complaints at FERC with respect to projects operating pursuant to a PURPA contract that fail to come 21
into compliance after notice. PURPA projects found to be out of compliance by FERC may lose their 22
QF status and be ordered to refund overpayments to the utility. 23
During the Record Period, SCE determined that all PURPA projects that 24
submitted complete operating, efficiency, and fuel use data for calendar year 2015 met FERC standards 25
for that year. SCE continues to follow-up with two PURPA small power producer and eight PURPA 26

267
cogeneration projects that have not submitted data for various reasons as described in the table. These 1
projects are identified in Table VII-66 below. 2
Table VII-66 Projects That Failed to Submit Operation
and Efficiency Data for Calendar Year 2015
f) Scheduled Maintenance 3
The scheduled maintenance program provides for uniform implementation and 4
verification of the scheduled maintenance procedures in each firm capacity PURPA or CHP contract. 5
Under all standard offer contracts, and some nonstandard contracts, PURPA and CHP projects are 6
responsible for providing advance notice to SCE of reductions in capacity availability due to scheduled 7
maintenance. PURPA and CHP projects that give proper notice of their scheduled maintenance outages 8
receive an “allowable maintenance hours” credit to be used in calculating their monthly firm capacity 9
payment. Projects that reduce or cease generation without proper notice do not receive scheduled outage 10
credit and, as a result, may be unable to earn their full capacity payment. PURPA and CHP projects are 11
required to make all reasonable efforts to schedule maintenance during SCE’s off-peak winter months 12
(October – May). 13
1 1007 Royal Farms 0.08 Project not currently operating.2 1087 Royal Farms #2 0.10 Project not currently operating.3 2060 BP Amoco 8.00 Project not currently operating.
4 2072 Procter & Gamble Paper Prod. Oxnard II 45.00 Data promised by end of year; not
received. Follow-up request submitted.
5 2155 Chevron USA 170.70 Data promised by end of year; not received. Follow-up request submitted.
6 2178 Claremont Club 0.18 Data promised by end of year; not received. Follow-up request submitted.
7 2344 Arcadia U.S.D. - Arcadia High School 0.07 Terminated.
8 2413 St. Johns Hospital and Health Center 1.08 Project not currently operating.
9 2441 Metal Surfaces, Inc. 0.35 Project not currently operating.10 2480 Chevron, USA, Inc. #1 1.50 Terminated.
ID Project Name Size (MW) Notes

268
During the Record Period, 26 PURPA projects made a total of 155 requests to 1
schedule maintenance; five CHP projects submitted 21 such requests. SCE approved 105 of those 2
requests for PURPA projects and 19 for CHP projects, after first verifying the hours taken were in 3
conformance with the schedule, contractual provisions, and maintenance procedures. The aggregate 4
maintenance credit totaled 18,304 hours. 5
g) Wind Operating Programs 6
Wind generation from SCE’s PURPA projects is primarily concentrated in two 7
geographical areas: the Tehachapi Wind Resource Area near Mojave and the San Gorgonio Wind 8
Resource Area near Palm Springs. During the Record Period, SCE administered PURPA contracts with 9
61 unique wind generation projects with a total on-line capacity of approximately 3,534 MW. During 10
the year, two of the legacy PURPA contracts were replaced with contracts qualifying under the RPS 11
program as one RAM20, and one ReMAT project. SCE purchased wind energy from 25 projects 12
procured through solicitations required by the RPS program including the two mentioned above, totaling 13
approximately 2,839 MW of capacity during the Record Period. 14
Wind generation presents unique challenges due to its unpredictability, power 15
factor demands, distributed nature, time of delivery, and rapid ramp rates, among others. SCE performs 16
a number of special administrative activities unique to wind generation to assure contract performance 17
including: turbine inventory, real time wind monitoring, and wind generation curtailments. The latter 18
two of these activities have been transitioned to the Transmission Operations Organization. The annual 19
turbine inventories have been eliminated due to the ability to monitor production using meter data and 20
the time intensive nature of the inventory activity. The completion of the Tehachapi Renewable 21
Transmission Project (TRTP) has also eliminated the need to curtail wind generation due to voltage 22
instability and line overloads which was one of the justifications for monitoring the wind inventory 23
closely. These activities apply to wind generation whether it was procured under the PURPA or RPS 24
programs, and are explained in the following sections, which provide an account of related events that 25
occurred during the Record Period. 26

269
(1) Turbine Inventory 1
This activity consists of identifying the type, size, and quantity of installed 2
wind turbine generators at teach project. Real-time Wind Monitoring System (now performed by the 3
Grid Control Organization). 4
Generation from wind turbines is inherently inconsistent as the energy in 5
the wind varies constantly. Due to these rapid variations the grid experiences stresses in voltage and 6
loading. Because of these factors; SCE’s system operators, and planning personnel must have access to 7
timely data regarding wind conditions and wind generation. 8
Meters installed at QF Wind generators communicate 15-minute averages 9
using the NETCOM radio packet network and CAISO meters provide 5 or 10 minute data. Monitors at 10
a number of key nodes in the electrical system were installed that provide data to the operating centers 11
every four seconds where the revenue meter data was not sufficiently timely. 12
(2) Real-time Wind Monitoring System 13
Generation from wind turbines is inherently inconsistent as the energy in 14
the wind varies constantly. It can vary greatly over short time periods. Induction generators used in 15
some wind turbines can create voltage instability. Because of these factors, SCE’s system operators, 16
transmission operators, and SCE personnel must have access to timely data regarding wind conditions 17
and wind generation. Real-time data is essential for making control decisions concerning the switching 18
of capacitors, transformer taps, and the system configuration required to maintain acceptable voltage 19
levels in light of changing generation output. Meters installed at QF generators communicate 15-minute 20
averages using the NETCOM radio packet network. Because of the particular problems posed by the 21
reactive loads and rapid variations inherent in wind generation, the relatively long data interval of 15 22
minutes was not completely satisfactory for grid operations. To provide sufficient near-real-time 23
information, a number of key nodes in the electrical system were identified and instrumented with 24
devices (not revenue meters) that provide data to the operating centers every four seconds. 25
The 15-minute metering data is sent twice daily to an SCE contractor, who 26
prepares a wind and generation forecast. The data provides a method for regularly updating a forecast to 27

270
improve forecast accuracy. The wind speed and directional data is collected on a vendor’s website for 1
the PURPA contracts and by the Generation Operation Center’s data system for RPS and merchant 2
projects, and is available also in near real time. 3
(3) Wind Curtailments 4
During the Record Period, wind curtailments were required to maintain 5
and upgrade the electrical system. The Grid Operations organization administers the planning and 6
notification of the generators for these curtailments. 7
(4) Maintenance and Upgrades of the Electrical System 8
The electrical systems in both the Tehachapi and San Gorgonio areas are 9
being upgraded and maintained due to the age of the system, system limitations, and technology 10
improvements. Maintenance activities include replacing equipment, inspecting the system, and 11
performing equipment testing and calibration. Upgrades performed on the system include building new 12
transmission lines, increasing transmission conductor size, installing new equipment, and reconfiguring 13
the system. To implement these system upgrades and to maintain the system, various transmission line 14
and substation outages were required. Due to these outages, curtailments of the wind projects in these 15
areas were necessary. The generation suppliers affected by curtailments are notified using an automated 16
curtailment notification e-mail system called the Outage Notification System (ONS). ONS serves two 17
main purposes: to notify wind park operators via email of upcoming outages that will cause curtailments 18
and, if necessary, prorates the curtailments among the impacted wind projects. Late in 2013 the 19
responsibility for notifying the suppliers using ONS was transferred from SCE’s Contract Compliance 20
and Technical Services (CC&TS) group to Grid Operations (part of the Transmission and Distribution 21
Department). CC&TS transferred the maintenance and upgrade of the ONS system to Grid Operations 22
including program modifications, software upgrades, and maintaining contact and grid configuration 23
information. CC&TS also continues to manage many of the communications between SCE and the 24
projects regarding questions or concerns about curtailments as they relate to contract terms. CC&TS 25
continues to participate in meetings with the renewable projects in their respective regions, hosted by 26
Grid Operations, regarding system maintenance, capital improvement projects, and curtailment amounts. 27

271
(5) SCE Transmission System Expansion 1
Tehachapi Renewable Transmission Project (TRTP) consists of a series of 2
new and updated electric transmission lines and substations that will deliver electricity from existing and 3
new wind and solar projects in the Tehachapi/Mojave area to the CAISO grid, and increase the 4
capability of the grid to distribute approximately 4,500 MW of new renewable power to SCE’s 5
customers. The project was completed with the undergrounding of the 500 kV line through Chino Hills 6
in December 2016. 7
h) Insurance Verification 8
PURPA and CHP projects are required to obtain and maintain comprehensive 9
general liability insurance during the terms of their power purchase contracts. SCE uses a third-party 10
insurance management solutions company, Insurance Tracking Services, Inc. (ITS) to monitor these 11
requirements. During the Record Period, 109 PURPA projects and ten CHP projects were actively 12
monitored by ITS. ITS, in conjunction with SCE, ensures that these projects have: 13 Obtained required insurance upon execution. 14
Maintained insurance policies and insurance carriers that meet the contract’s 15
requirements. 16
Maintained adequate insurance coverage throughout the terms of their contracts. 17
i) Forecasting and Scheduling Accuracy 18
Certain CHP contracts have provisions for evaluating the accuracy of project’s 19
energy and/or capacity forecast and assessing financial penalties associated with excessive forecast 20
errors. Two compliance programs related to forecasting and scheduling accuracy were in effect during 21
the Record Period: Mean Absolute Error (MAE) and Scheduling and Delivery Deviation (SDD) 22
Adjustments. 23
In the MAE program, a monthly mean absolute error between a project’s day-24
ahead forecast and actual production is quantified and compared to a threshold. Exceeding the error 25
threshold can result in a forecasting penalty, and multiple non-compliances can trigger a temporary de-26

272
rating of the project’s firm contract capacity. During the Record Period, of the six CHP projects subject 1
to the MAE program, two projects failed to meet the MAE requirement in at least one month, resulting 2
in a total penalty charge of $7,500. 3
The purpose of SDD Energy Adjustments is to mitigate, for SCE and the project, 4
any financial impacts due to excessive deviation of metered energy deliveries from the project’s 5
schedule. SDD Adjustments are based on differences between real-time energy prices and contract 6
energy prices. Additionally, an administrative charge, based on CAISO’s grid management charge for 7
uninstructed deviations, is assessed and charged to the project for any scheduling deviation outside of 8
the performance tolerance band. During the Record Period, ten CHP projects incurred administrative 9
charges totaling $91,524.23 for generating outside of the SDD performance tolerance band. 10
3. RPS 11
Compliance programs have been developed to ensure that RPS projects adhere to the 12
terms of their contracts, and to integrate these projects effectively with the electric system grid. This 13
section will discuss the RPS compliance. In addition, this section includes a summary of REC 14
retirement activities. 15
a) Renewable Capacity Verification 16
SCE’s capacity verification activities for renewable projects are designed to 17
ensure that SCE’s customers can reasonably expect to receive appropriate quantities of energy in full 18
compliance with the associated contracts. Renewable capacity verifications are generally a one-time 19
event performed either prior to the contract becoming commercial or around the contractual Firm 20
Operation Date.146 The activity generally consists of a site visit to verify the equipment listed in the 21
contract has been installed, to collect and verify the meter unique identification number(s), and, in some 22
cases, to collect meter data for a chosen interval. The verification is intended to determine the 23
146 See Table VII-54, “RPS Contracts that Achieved Commercial Operation” for a list of contracts that may have
been eligible for a verification test. Note that due to different testing schedules established in each PPA, not all contracts in this table were tested during the Record Period.

273
maximum capacity capability of the project. From the demonstrated capacity the energy delivery 1
performance requirements are derived. 2
During the Record Period, there were 26 renewable projects that underwent 3
capacity verifications. All of these projects passed the verification process with a site inspection for 4
determination of the installed equipment. The breakdown of these projects by their respective 5
solicitations is: ReMAT (3), ERR (5), SPVP (7), RAM (7), and RSC (4). Table VII-67 lists the units 6
tested and the results as of the end of the Record Period. 7
Table VII-67 Renewable Capacity Verifications
January 1, 2016 Through December 31, 2016
ID Project Date of Capacity Test
1 5218 Desert Stateline 8/17/2016 300.00 (b)2 5284 Silver State South 8/18/2016 260.00 (b)3 5463 Central Antelope Dry Ranch "C" 5/12/2016 20.00 (b)4 5469 Sierra Solar Greenworks, LLC 3/1/2016 20.005 5485 Tulare Solar I (Nicolis) 10/12/2016 20.006 5490 Tulare Solar II (Tropico) 10/12/2016 14.007 5494 McCoy Solar 11/3/2016 270.40 (b)8 5512 Little Rock - Pham Solar, LLC 1/20/2016 3.00 (b)9 5625 US Topco Energy, Inc. - Soccer Center 2/17/2016 3.0010 5756 Citizen B Solar, LLC 2/25/2016 5.0011 5778 SEPV Mojave West, LLC 8/4/2016 20.0012 5781 Adera Solar, LLC 2/24/2016 20.0013 5791 DG Solar Lessee II, LLC (SunE-Rochester) 7/25/2016 2.00 (a)(b)
14 5795 DG Solar Lessee II, LLC (SunE-E.Philadelphia) 3/1/2016 1.20 (a)(b)
15 5823 Algonquin SKIC 10 6/22/2016 10.0016 5834 R.E. Garland "A" LLC 10/12/2016 20.0017 5874 Borrego Solar - Building F 7/20/2016 1.75 (a)(b)18 5875 Borrego Solar - Building G 8/30/2016 1.65 (a)(b)19 5876 Borrego Solar - Building L 7/21/2016 1.17 (a)(b)20 5877 Freeway Springs LLC 4/15/2016 2.82 (a)(b)21 5878 Golden Solar, LLC (Dulles) 4/8/2016 2.36 (a)(b)22 5885 Blythe Solar II LLC 11/4/2016 131.5023 5888 R.E. Garland LLC 11/9/2016 185.1324 6355 Coram Energy, LLC 2/8/2016 3.0025 6397 Windland Refresh 2, LLC 2/17/2016 7.8126 6452 Yavi Energy, LLC (f/k/a Eastwind) 1/26/2016 3.00
Capacity (MW)
(a) The Solar PV and SPVP-IPP project capacity are reported in kW DC to the nearest Watt. (b) Multiple site visits required to verifiy corrective actions.

274
b) Metering Energy Deliveries 1
SCE uses a combination of meter and schedule data to calculate payments for 2
RPS projects that delivered energy during the Record Period. Generally, RPS generators are required to 3
obtain CAISO-approved metering for their facilities. SCE will also install a settlement quality meter. 4
CAISO meters are four-quadrant interval meters that measure forward and reverse 5
watts and VARs. CAISO meters are capable of communicating with a remote system through a 6
dedicated secure network known as the Energy Communication Network (ECN) for data collection. 7
The CAISO reads these meters remotely through the ECN for settlements. SCE also reads these meters 8
remotely, to check the data and to use the data in other ways as provided in the contracts. 9
SCE maintains its own meters at most of the RPS projects. These meters are used 10
for retail billing, verification, backup, RPS reporting through WREGIS, and in some cases, monthly 11
payments. The SCE meters are either real time energy meters (RTEMs) or standard interval meters. 12
For a more detailed description of the process surrounding the meters and data 13
collection see the Metering Energy Deliveries section for the PURPA and CHP generators above. 14
c) Active Monitoring 15
D.10-06-004 requires SCE to (a) devise a method to actively monitor each seller’s 16
compliance with Standard Term and Condition 6147 (STC 6) and related contract terms, (b) administer 17
the active monitoring, and (c) make an affirmative showing in each ERRA proceeding of its method for 18
active monitoring and the results of that monitoring. This will demonstrate SCE’s reasonable contract 19
administration of all contract terms, inclusive of obligations prior to and after the project’s commercial 20
operation, as appropriate.148 21
147 STC 6 requires that the seller warrant throughout the term of the PPA that (i) the project qualifies and is
certified as an ERR and (ii) the output qualifies under requirements of the California RPS. The only exception is upon a change in law, wherein seller is contractually obligated to use commercially reasonable efforts to comply with the change in law (paraphrased for simplicity, for actual STC 6 verbiage, see D.08-04-009, Appendix A, p. 6).
148 D.10-06-004, p. 21, OP No. 2.

275
SCE’s method to actively monitor each seller’s compliance with STC 6 consists 1
of: (1) requesting the seller to provide a copy of the project’s CEC pre-certification prior to initial 2
project delivery or within 365 days after the effective date of the contract, whichever is applicable 3
according to the contract, and requiring the project to attain full certification from the CEC shortly after 4
the project begins commercial delivery; (2) monitoring changes in law or regulations that may affect 5
RPS eligibility; (3) monthly monitoring of the CEC website to verify that facilities are RPS-certified via 6
each facility’s unique RPS ID (cross-checked to the CEC certification); and (4) verifying the RPS ID 7
during WREGIS registration and routine maintenance. Additionally, SCE performs site visits, capacity 8
demonstrations, and capacity verifications during the construction and commercial operation of each of 9
the phases of the project to ensure that the project is in compliance with the contract. 10
RPS projects with contracts executed during the Record Period are in varying 11
stages of providing a copy of the individual project’s CEC pre-certification. 12
Currently, SCE’s entire portfolio of RPS-eligible contracts consists of proven 13
applications of landfill gas, biomass, digester gas, geothermal, small hydro, conduit hydro, solar thermal, 14
solar PV, and wind technologies as generating facilities. 15
SCE’s contract compliance includes regular monitoring of the CEC website to 16
verify that facilities are RPS-certified. This review is imbedded in the process for WREGIS registration 17
and maintenance. One project was found during the Record Period to have issues with their CEC 18
Certifications. Capacity verifications are discussed in detail in a prior section of this chapter. In 19
addition to the 26 capacity verifications, site visits were conducted at 39 operational projects. Also, 20
visits were conducted at project sites during various phases of those projects’ construction. See Table 21
VII-68 below. As a result of those visits, no inquiries from observations at those sites were necessary, 22
and all visits revealed that the projects were complying with the contract terms including STC 6. 23
Table VII-68 below is a summary of SCE’s Active Monitoring activities during 24
the Record Period. 25

276
Table VII-68 RPS Active Monitoring
January 1, 2016 Through December 31, 2016
ID Project Site Visit During Record Period
Capacity Verification (a)
1 3106 Terra-Gen Dixie Valley, LLC X2 3115 Coso Clean Power, LLC X3 5207 NRG Solar Blythe X4 5208 Solar Partners I (Ivanpah Unit 2) X5 5217 Desert Sunlight 250 LLC X6 5218 Desert Stateline X X7 5284 Silver State South X X8 5291 Regulus Solar LLC X9 5298 Adobe Solar, LLC X10 5463 Central Antelope Dry Ranch "C" X X11 5469 Sierra Solar Greenworks, LLC X X12 5485 Tulare Solar I (Nicolis) X X13 5490 Tulare Solar II (Tropico) X X14 5494 McCoy Solar X X15 5512 Little Rock - Pham Solar, LLC X X16 5560 Toro Power 1, LLC X17 5561 Toro Power 2, LLC X18 5625 US Topco Energy, Inc. - Soccer Center X X19 5692 Mitchell Solar, LLC X20 5693 Rudy Solar, LLC X21 5694 Madelyn Solar, LLC X22 5756 Citizen B Solar, LLC X X23 5774 NRG Solar Oasis, LLC X24 5778 SEPV Mojave West, LLC X X25 5781 Adera Solar, LLC X X26 5791 DG Solar Lessee II, LLC (SunE-Rochester) X X27 5795 DG Solar Lessee II, LLC (SunE-E.Philadelphia) X X28 5823 Algonquin SKIC 10 X X29 5834 R.E. Garland "A" LLC X X30 5874 Borrego Solar - Building F X X31 5875 Borrego Solar - Building G X X32 5876 Borrego Solar - Building L X X33 5877 Freeway Springs LLC X X34 5878 Golden Solar, LLC (Dulles) X X35 5885 Blythe Solar II LLC X X36 5888 R.E. Garland LLC X X37 6355 Coram Energy, LLC X X38 6397 Windland Refresh 2, LLC X X39 6452 Yavi Energy, LLC (f/k/a Eastwind) X X
Notes:(a) Not all projects require capacity verifications because they are either not yet constructed or operating, or they have already been verified in a prior Record Period.

277
d) Western Renewable Energy Generation Information System (WREGIS) 1
Pursuant to Senate Bill 1078 and Public Utilities Code §399.25, an electronic 2
accounting and tracking system was developed to verify retail sellers’ compliance with the RPS. This 3
system, WREGIS, became operational in June 2007. SCE participates in WREGIS pursuant to Public 4
Utilities Code §399.25 and is subject to the compliance requirements of the CEC and the Commission. 5
During the Record Period, SCE was account holder for 338 facilities registered in 6
the WREGIS system. Those facilities were comprised of a total of 407 individually-registered 7
generating units representing all eligible renewable PURPA and utility-owned projects, and most RPS 8
contracts. All other RPS projects register their facilities as their own account holder and then transfer 9
their RPS credits to SCE for compliance purposes. 10
SCE’s costs associated with registering and tracking renewable energy deliveries 11
in WREGIS include account fees, volumetric fees, and service fees for renewable power. SCE paid 12
$115,815.13 in WREGIS fees during the Record Period. 13
e) RPS Insurance Verification 14
RPS projects are required to obtain and maintain comprehensive general liability 15
insurance during the terms of their power purchase contracts. SCE uses a third-party insurance 16
management solutions company, Insurance Tracking Services, Inc. (ITS) to monitor these requirements. 17
During the Record Period, 299 RPS projects were actively monitored by ITS. ITS, in conjunction with 18
SCE, ensures that these projects have: 19 Obtained the required insurance upon contract execution. 20
Maintained insurance policies and insurance carriers that meet the contract’s 21
requirements. 22
Maintained adequate insurance coverage throughout the terms of their contracts. 23
f) Wind Operating Programs 24
Please refer to the Wind Operating Programs section under Contract Compliance 25
for PURPA/CHP for details regarding both RPS and PURPA wind operating programs. 26
278
g) Renewable Energy Credit (REC) Retirement 1
During the Record Period, SCE retired 11.6 million RECs corresponding to 2
generation from vintage years 2013, 2014, and 2015. 3
RECs tracked in WREGIS must be retired before they can be counted toward 4
meeting RPS targets. The RPS Eligibility Guidebook requires that WREGIS certificates, or RECs, be 5
retired within 36 months from the initial month and year (vintage month and year) of generation of the 6
associated electricity to be eligible for the RPS program. RECs may be retired across compliance 7
periods as long as the retirement is within 36 months of the vintage month and year. 8
To ensure that the proper number of RECs are retired, SCE must compare, for 9
every month and by project, the number of WREGIS certificates that are eligible for retirement with the 10
amount of RPS eligible generation that was actually procured. Any discrepancy must be investigated, 11
explained, and reconciled. Discrepancies usually arise from initial meter data errors that have resulted 12
in prior period adjustments in WREGIS. These are adjustments in which 1) additional WREGIS 13
certificates are created in a subsequent month (but labeled with the original vintage month) to account 14
for a deficiency in the original vintage month when the additional certificates should have been created, 15
or 2) creation of certificates is withheld in a subsequent vintage month to account for a surplus of 16
certificates created in a prior vintage month. When a discrepancy is found, SCE must submit a prior 17
period adjustment to the WREGIS website, and verify in the subsequent month that the proper number 18
of certificates was created or withheld, as applicable, in WREGIS. For withheld certificates, SCE must 19
manually track outside WREGIS the correct vintage month and year of the adjustment to ensure the 20
adjusted RECs are retired within the 36-month window, since the vintage information of the adjusted 21
RECs recorded in WREGIS does not reflect the true vintage month and year. When retiring WREGIS 22
certificates, SCE must also identify RECs whose RPS eligibility has not been established and work with 23
the generating project to resolve outstanding issues before retirement. If resolution is not possible 24
before the reporting deadline, SCE excludes the RECs in question from retirement for the compliance 25
period. 26

279
The actual retirement of RECs takes place on the WREGIS website. Several 1
factors related to the WREGIS website make REC retirement a cumbersome, manual process. RECs are 2
retired in batches, which are groups of RECs consisting of all the generation from a generating unit 3
during a given month. During the Record Period, SCE’s portfolio includes more than 400 registered 4
generating units, which equates to more than 4800 batches of RECs to be retired. Since REC retirement 5
is final, every batch selected must be double checked to ensure correct association with the generator 6
and vintage month. In addition, each selected batch is checked for the correct number of total 7
RECs. This is especially difficult for batches with prior period adjustments, as multiple batches may 8
need to be added to form one complete month, or a batch may need to be split to different months. After 9
the REC batches are selected, the correct retirement subaccount, retirement type, state, RPS Compliance 10
Period, and retirement reason must be specified to complete the process. The WREGIS website allows a 11
maximum of 300 batches to be selected per retirement action, but typically only around 100 batches are 12
selected per retirement action. This is done to reduce the chance of batch selection error, and also to 13
allow adequate time to double check selection quantity, before the website times out. Therefore, the 14
process must be repeated about 50 times if all REC batches from the Record Period were to be retired. 15
In summary, the REC retirement process is highly complex and involves a 16
substantial amount of manual effort and rigorous processes to avoid errors and ensure accuracy. It is 17
SCE’s practice to hold all RECs from a compliance period in the active subaccount, and retire those 18
RECs in late spring/early summer following the end of the compliance period. There are three 19
exceptions: (1) RECs from out of state resources are retired in May following the generating year, for 20
the purpose of GHG offset; (2) RECs from beginning months of the compliance period are retired a few 21
months earlier because they would be up against the 36 month window; and (3) RECs from the previous 22
compliance period, which were not retired due to outstanding quantity or eligibility issues, are retired as 23
issues are resolved. During the Record Period, 3 million of the 11.6 million RECs retired by SCE fall 24
into the three exceptions described above. The other 8.6 million RECs are retired slightly ahead of 25
schedule, compared to SCE’s usual practice, to reduce the mass REC retirement workload expected in 26
the first half of 2017 following the end of the compliance period. 27

280
During the Record Period, there were 14 full and partial batches of RECs that 1
expired (went beyond the 36 month window), which totaled to 111 RECs. These RECs were 2
intentionally allowed to expire because they were erroneously created due to meter data error, or they 3
were RPS ineligible. The payments made for those RPS ineligible RECs were deducted from future 4
payments. 5
G. Contract Payment Process 6
SCE applies a set of four policies to ensure that all PURPA, CHP, RPS, tolling, RA, transmission 7
and gas contracts are paid accurately and on time. All payment documentation is placed in the identified 8
network drives and updates to contract terms are placed into their respective settlement systems, (i.e., 9
Entegrate, Power Costs Inc. (PCI), WES/ENDUR, and/or the appropriate trading/transactional 10
databases). These policies are: (1) Pay projects according to the terms and conditions of their contracts, 11
as interpreted by relevant Commission decisions, orders, pertinent industry practices, and internal SCE 12
controls, including those controls necessary to comply with the Sarbanes-Oxley legislation; (2) Make 13
payments in a timely manner according to the terms and conditions of the contracts; (3) Subject to timely 14
notification of errors in conformity with contractual terms, correct calculation errors for a time period up 15
to that permitted under the contract and applicable statute of limitations; (4) Promptly investigate the facts 16
relating to payment variances and coordinate with Energy Contracts as applicable. If adjustments are 17
warranted, carry them out in a timely manner. 18
Depending upon the type of PPA/product (EEI, WSPP, ISDA, NAESB, ERR), there are 19
numerous contracts that require the parties to exchange invoices each month. In the instances where 20
counterparty invoicing is required and SCE disputes the correctness of the invoice or a portion thereof, 21
SCE will pay only the undisputed portion of the invoice and communicate, in writing (via e-mail), the 22
basis for the variance. Payment of the disputed portion of the invoice shall not be required until the 23
parties resolve the invoice variance. 24
The sections below discuss the procedures, guidelines, and processes regarding the monitoring, 25
validation, and calculation of Conventional, RPS, PURPA and CHP contract settlements. 26

281
1. Conventional 1
The sections below discuss the administrative procedures, guidelines, and processes 2
regarding the monitoring, validation, and calculation of Resource Adequacy (RA), gas, transmission, 3
tolling, and power contract settlement provisions. 4
a) RA 5
SCE compensates contracted generators using the unit availability quantity (in 6
MW) filed in the CAISO/CPUC Supply-Plan Template, which occurs at T-45 days prior to the showing 7
month. These RA availability quantities are used for calculation of a monthly RA capacity payment. 8
Each payment is based on contractual parameters as specified in the contract terms and conditions. 9
Adjustments or reductions to payments are made based on events of unavailability. Any non-10
availability charges or availability credits are captured in the CAISO Resource Adequacy Availability 11
Incentive Mechanism (RAAIM) process and are passed-through on the monthly invoice to the 12
applicable counterparty. 13
b) Gas Transactions 14
SCE purchases physical and financial gas from market suppliers to deliver gas to 15
generating facilities either under contract with or owned by SCE. These transactions are completed 16
using various agreements including the NAESB, gas annex to the EEI or gas annex to the ISDA. 17
Payment provisions are covered under the NAESB and/or gas annex to a master agreement. Payment is 18
based on a volume (MMBtu) and price (either fixed or identified by reference to a published index) per 19
each individual transaction. Payments are typically made on the twenty-fifth day (25th) of the month 20
following the month of delivery. 21
c) Transmission 22
SCE purchases transmission from market suppliers. These transactions are 23
covered under the TREA or tariff and are paid based on the contractual obligations under the contract. 24
Payment is based on volume (MW) multiplied by price (either fixed or identified by reference to a 25
published index). Payments are typically made within twenty (20) days of receipt of invoice. 26

282
d) Power Purchase Tolling Agreements 1
Generators that have a tolling agreement with SCE are compensated using a 2
combination of energy and capacity payment types varying from monthly capacity, reduced monthly 3
capacity, variable O&M, and start-up charges. Each payment is based on contractual parameters. The 4
generator is also paid a heat-rate adjustment payment, which calculates the difference between actual 5
gas usage and contractual heat rates, as defined in the agreement. Adjustments or reductions to 6
payments are made based on events of unavailability. SCE settles after-the-fact on a calendar-month 7
basis, with payments for the prior month being settled on either the twentieth (20th) day of each month 8
or ten (10) days after receipt of invoice, whichever is greater. 9
e) Power Transactions 10
In addition to power purchase tolling agreements, SCE purchases power from 11
market suppliers. 12
SCE power transactions under the EEI, WSPP, or power annex to the ISDA are 13
paid based on the contractual obligations under the contract. Payment is based on volume (kWh) 14
multiplied by the identified index and is typically made on the tenth day (10th) of each month following 15
the month of delivery. 16
2. PURPA and CHP 17
The sections below discuss the administrative procedures, guidelines, and processes 18
regarding the monitoring, validation, and calculation for PURPA and CHP contract settlement 19
provisions. 20
a) Energy Rates for PURPA and CHP Contracts 21
Monthly energy rates are calculated based on the following components: contract 22
specific TOD heat rates, gas index, gas transportation rate, contract specific annual Variable O&M 23
Charges, and Hourly Location Adjustment Factors (LA), as described below. 24
On August 1, 2009, the Commission implemented Resolution E-4246, which 25
finalized a new market index formula (MIF) that changed how SRAC energy pricing is calculated and 26

283
established new as-available capacity rates. Resolution E-4246 affects all PURPA contracts, both 1
renewable and cogeneration that are paid SRAC pricing for energy and as-available capacity. 2
The new SRAC, effective January 1, 2012, includes an adder called the Hourly 3
Location Adjustment Factor (LA).149 The LA was implemented to replace the GMM (Generation Meter 4
Multiplier); after CAISO’s MRTU “go-live” in April 2009, CAISO discontinued publishing the GMMs 5
because it had converted to a nodal market. The market utilizes locational marginal pricing (LMP) at 6
various pricing nodes (pnodes) throughout the CAISO. The LA is equal to LMP(QF) minus 7
LMP(Trading Hub), where LMP(QF) equals the hourly day-ahead LMP at the point of interconnection 8
with the CAISO grid associated with the QF generating facility, and LMP(Trading Hub) is the hourly 9
LMP of the trading hub where the generating facility is located (e.g., SP15). The LA calculation applies 10
to various PURPA and CHP agreements as follows: 11
Legacy Amendments 12
o Option A: Subject to LA 13
o Option B: Non-renewable projects are subject to LA, renewable projects 14
are not 15
Transition PPA: Subject to LA 16
CHP RFO PPA: Subject to LA 17
QF SOC: Subject to LA 18
AB 1613 Agreements: Not subject to LA 19
As included in SCE’s 2013 (for the 2012 Record Period) ERRA filing, 20
Chapter IX, pages 7-13, SCE executed numerous Legacy Amendments per the QF Settlement. These 21
Pro Forma Legacy amendments were offered to all QFs that had existing contracts (Legacy PPAs or 22
Legacy Agreements) with SCE as of the Settlement Effective Date; these projects are often referred to as 23
Legacy QFs. The Legacy Amendments provided five options, called A, B, C1, C2, and C3 (as of 24
149 D.10-12-035.

284
12/31/2015, the QF Legacy Amendments Energy Pricing Options for C1, C2 and C3 expired). The 1
details of these options are explained further in Table VII-69 below. 2
Table VII-69 QF Legacy Amendment Energy Pricing Options
b) Capacity for PURPA and CHP Contracts 3
PURPA and CHP Contracts receive a Capacity Payment based on production. 4
There are three types of Capacity Payments eligible to PURPA and CHP projects. Those include Firm, 5
As-Available, and Excess As-Available. The pricing for these products is generally based on forecasts at 6
the time of execution or SRAC. 7
c) Performance Bonus – Capacity 8
Many firm capacity PURPA contracts contain provisions that enable the projects 9
to earn capacity bonus payments to encourage on-peak production during summer months. Projects are 10
eligible to receive winter bonus payments if they meet specified summer on-peak contract performance 11
requirements. SCE ensures that only the firm capacity PURPA contracts that have met monthly and 12
seasonal contractual requirements receive a bonus payment. 13
Legacy Amendment Option A B
Eligible Contracts Legacy Legacy2012 = 8,225 2012 = 8,600 IER2013 = 8,125 2013 = 8,500 IER2014 = 8,125 2014 = 8,500 IER
2015 = 2011 & 2012 Actual Heat Rate2016+ = Market
Location Adjustment Factor YES NO
Incremental Energy Heat Rate (IER)
2015+ = Market
GHG Risk Buyer 100% 2013 - 2015 Seller

285
d) Out of Service Territory Projects 1
A number of SCE’s PURPA and CHP projects are located outside of SCE’s 2
service territory (e.g., the IID and PG&E service territories), where energy is typically delivered by the 3
local utility to SCE over that utility’s interties. SCE receives the quantity of energy represented by, and 4
pays the PURPA projects based upon hour-by-hour energy delivery schedules from the delivering 5
utility.150 6
e) Line Loss Factor 7
During the Record Period, PURPA and CHP projects that received Commission-8
approved short run avoided cost (SRAC) prices for their energy deliveries (and did not execute a Legacy 9
Amendment providing for a line loss factor of 1.00) continued to have the line loss factor methodology 10
specified in D.01-01-007 applied to their energy payment calculations. The line loss factors for a 11
particular PURPA or CHP contract include the project’s distribution loss factor (DLF) and transmission 12
loss factor (TLF), and, in some cases, the transformer loss factor (unrelated to D.01-01-007). Since the 13
April 1, 2009 “go live” of MRTU, the CAISO discontinued posting generation meter multipliers 14
(GMM)/tie meter multipliers (TMM) that are a component of the TLF calculation. Starting in May 15
2009, SCE replicated the April through December 2008 GMM/TMM data to use in the calculations for 16
the same monthly settlement periods in 2009 and going forward. 17
f) Time of Delivery (TOD) Periods 18
During the Record Period SCE managed active PURPA/CHP contracts which 19
were paid using Time of Delivery Allocation Factors (TOD Factors) in the payment calculations. The 20
TOD Factors for the delivery period are multiplied by the product of metered energy for that delivery 21
period and the energy price. 22
150 Other projects that are out-of-state are either dynamically scheduled to the CAISO or are directly connected to
SCE’s transmission/distribution system via generator intertie. Those projects, from a payment standpoint, are considered within SCE’s territory.
286
3. RPS 1
The sections below discuss the administrative procedures, guidelines, and processes 2
regarding the monitoring, validation, and calculation for RPS contract settlement provisions. 3
a) Out of Service Territory Projects 4
Some of SCE’s RPS projects are located outside of SCE’s service territory (e.g., 5
the IID, PG&E, and out of state territories), where energy is typically delivered by the local utility to 6
SCE over that utility’s interties. SCE receives the quantity of energy represented by, and pays the RPS 7
projects based upon, hour-by-hour energy delivery schedules from the delivering utility, or metered 8
amounts per the contract settlement provisions. 9
b) Energy Payment Calculations 10
Many RPS contracts are paid for the energy delivered by the generator based on 11
time of delivery and the contracted energy price. 12
(1) Time of Delivery (TOD) Periods 13
During the Record Period SCE managed active RPS contracts which were 14
paid using Time of Delivery Allocation Factors (TOD Factors) in the energy payment calculations. The 15
TOD Factors for the delivery period are multiplied by the product of metered energy for that delivery 16
period and the energy price. 17
4. Other Impacts to Payments 18
a) CAISO Charges 19
Certain contracts provide for CAISO charges, and in some cases CAISO 20
revenues, to be the seller’s responsibility. Some of those contracts include specific payment provisions 21
during the start-up period through commercial operation, regarding schedule deviations, and in cases of 22
a seller-initiated test. As the Schedule Coordinator for most of SCE’s contract portfolio, CAISO charges 23
and revenues are allocated and available to SCE. Upon receipt of the charges and/or revenues, SCE 24
credits or debits the next payment to the generator depending on the activities that took place during the 25
delivery month. 26

287
b) Scheduled Delivery Deviation Adjustments (SDD) 1
Certain contracts provide for SCE to calculate SDD adjustments in cases where 2
SCE is the Scheduling Coordinator. For PURPA/CHP the hourly SDD Adjustments are based on the 3
difference between real-time LMP prices and contract energy prices. Certain tolling contracts use SDD 4
as an uninstructed energy deviation charge. Additionally, a charge based on CAISO’s grid management 5
for uninstructed deviations is assessed and charged to the project for any scheduling deviation outside of 6
the performance tolerance band identified within each contract. For additional information see Section 7
F of this Chapter. 8
c) Scheduling Coordinator Fees 9
The QF SOC, CHP RFO, and the AB1613 contracts provide for SCE to apply a 10
monthly Scheduling Coordinator (SC) Fee for SCE’s SC services if the generator elects to use SCE as 11
their SC. The monthly fee is based on the generator’s net contract capacity and the respective fee 12
amount provided in the contract. The fee is a constant value that appears on each of the generator’s 13
monthly payment statements. 14
d) Mean Absolute Error (MAE) 15
The QF SOC, CHP RFO contracts contain provisions for SCE to calculate the 16
MAE based on a comparison of the generator’s metered output and their day-ahead forecast, quantified 17
and compared to a threshold. If the MAE is greater than 15%, or if the average forecast error for all 18
hours of the month is greater than three MW, then an “MAE Failure” will be deemed to have occurred. 19
In the event of an MAE Failure, the generator will be assessed a penalty. If the failure continues for 20
several months, the generator may be derated. For additional information see Section F of this Chapter. 21
e) Energy Delivery Performance Administration 22
Certain RPS contracts include provisions that require the sellers to meet certain 23
minimum energy delivery obligations. The energy delivery obligation calculation may be performed on 24
either an annual or multi-year basis depending on contract terms. A comparison of the actual annual 25
energy deliveries or the average annual energy delivery over multiple years, to the contracted minimum 26
amount determines if the energy delivery obligation has been met. Performance requirements for the 27

288
delivery obligation differ by resource type. If in any term year a failure to meet the minimum delivery 1
obligation occurs, then Seller is subject to a penalty using the amount of shortfall multiplied by a 2
contractual rate. For additional information see Section D of this Chapter. 3