energy revolution report
DESCRIPTION
Greenpeace 2008TRANSCRIPT

© G
RE
EN
PE
AC
E/X
UA
N C
AN
XIO
NG
report global energy scenario
energy[r]evolutionA SUSTAINABLE GLOBAL ENERGY OUTLOOK
EUROPEAN RENEWABLE ENERGY COUNCIL
© G
P/S
TE
VE
MO
RG
AN©
LA
NG
RO
CK
/ZE
NIT
/GP

2
image A LOCAL TIBETAN WOMAN WHO HAS FIVE CHILDREN AND RUNS A BUSY GUEST HOUSE IN THE VILLAGE OF ZHANG ZONG USES SOLAR PANELS TO SUPPLY ENERGY FOR HER BUSINESS.cover image A MAINTENANCE ENGINEER INSPECTS A WIND TURBINE AT THE NAN WIND FARM IN NAN’AO. GUANGDONG PROVINCE HAS ONE OF THE BEST WIND RESOURCES INCHINA AND IS ALREADY HOME TO SEVERAL INDUSTRIAL SCALE WIND FARMS.
partners
Greenpeace International,European Renewable Energy Council (EREC)
date October 2008
isbn 9789073361898
project manager & lead authorSven Teske, Greenpeace International
EREC Oliver Schäfer, Arthouros Zervos,
Greenpeace InternationalSven Teske, Jan Béranek, Stephanie Tunmore
contact [email protected],[email protected]
editor Crispin Aubrey
research & co-authors DLR,Institute of Technical Thermodynamics,Department of Systems Analysis andTechnology Assessment, Stuttgart,Germany: Dr. Wolfram Krewitt, Dr.Sonja Simon, Dr. Thomas Pregger.DLR, Institute of Vehicle Concepts,Stuttgart, Germany: Dr. StephanSchmid Ecofys BV, Utrecht, TheNetherlands: Wina Graus, Eliane Blomen.

3
© G
RE
EN
PE
AC
E/J
OH
N N
OV
IS
regional partners: OECD NorthAmerica Sunna Institute: JanetSawin, Freyr Sverrisson; GP USA:Chris Miller, John Coequyt, Kert Davis.Latin America Universidad de Chile,Luis Vargas; GP Brazil: MarceloFurtado, Ricardo J. Fujii. OECDEurope/EU27 EREC: Oliver Schäfer,Arthouros Zervos
Transition Economies ValdimirTchouprov Africa & Middle EastReference Project: “Trans-MediterraneanInterconnection for ConcentratingSolar Power” 2006, Dr. Franz Trieb;GP Mediterranean: Nili Grossmann.India Rangan Banerjee, Bangalore,India; GP India: Srinivas Kumar, VinutaGopal, Soumyabrata Rahut.
Other Dev. Asia ISEP-Institute Tokyo:Mika Ohbayashi, Hironao MatsubaraTetsunari Iida; GP South East Asia:Jaspar Inventor, Tara Buakamsri. China Prof. Zhang Xilian, UniversityTsinghua, Beijing; GP China: AilunYang, Liu Shuang.
OECD Pacific ISEP-Institute Tokyo,Japan: Mika Ohbayashi; DialogInstitute, Wellington, New Zealand:Murray Ellis; GP Australia Pacific:Julien Vincent.
printing www.primaveraquint.nl
design & layout Jens Christiansen,Tania Dunster, www.onehemisphere.se
for further information about the global, regional and national scenarios please visit the energy [r]evolution website: www.energyblueprint.info/Published by Greenpeace International and EREC. Printed on 100% post consumer recycled chlorine-free paper.
“will we look into the eyes of our children and confessthat we had the opportunity,but lacked the courage?that we had the technology,but lacked the vision?”

4
image CHECKING THE SOLAR PANELS ON TOP OF THE GREENPEACE POSITIVE ENERGY TRUCK IN BRAZIL.
contents
foreword 4
introduction 6
executive summary 9
climate protection 15
implementing the energy [r]evolution indeveloping countries 19
nuclear threats 23
the energy [r]evolution 28
scenarios for a futureenergy supply 37
key results of the globalenergy [r]evolutionscenario 53
Of all the sectors of amodern economic system,the one that appears to begetting the maximumattention currently is theenergy sector. While therecent increase in oil pricescertainly requires sometemporary measures to tideover the problem ofincreasing costs of oilconsumption particularlyfor oil importing countries,there are several reasonswhy the focus must nowshift towards longer termsolutions. First and
foremost, of course, are the growing uncertaintiesrelated to oil imports bothin respect of quantities andprices, but there are severalother factors that require atotally new approach toplanning energy supply andconsumption in the future.Perhaps, the most crucialof these considerations isthe threat of global climatechange which has beencaused overwhelmingly inrecent decades by humanactions that have resultedin the build up ofgreenhouse gases (GHGs) in the Earth’s atmosphere.
foreword
1
2
3
4
5
6

© G
RE
EN
PE
AC
E/F
LA
VIO
CA
NN
AL
ON
GA
5
futu[r]e investment 100
energy resources & security of supply 109
energy technologies 132
energy efficiency – more with less 143
transport 160
cars of the future 174
policy recommendations 183
glossary & appendix 188
Impacts of climate change are diverse and serious, and unless theemissions of GHGs are effectively mitigated these would threaten tobecome far more serious over time. There is now, therefore, a renewedinterest in renewable sources of energy, because by creating and usinglow carbon substitutes to fossil fuels, we may be able to reduce emissionsof GHGs significantly while at the same time ensuring economic growthand development and the enhancement of human welfare across theworld. As it happens, there are major disparities in the levels ofconsumption of energy across the world, with some countries using largequantities per capita and others being deprived of any sources of modernenergy forms. Solutions in the future would, therefore, also have to cometo grips with the reality of lack of access to modern forms of energy forhundreds of millions of people. For instance, there are 1.6 billion peoplein the world who have no access to electricity. Households, in which thesepeople reside, therefore, lack a single electric bulb for lighting purposes,and whatever substitutes they use provide inadequate lighting andenvironmental pollution, since these include inefficient lighting devicesusing various types of oil or the burning of candles.
Future policies can be guided by the consideration of differentscenarios that can be linked to specific developments. This publicationadvocates the need for something in the nature of an energyrevolution. This is a view that is now shared by several people acrossthe world, and it is also expected that energy plans would be based ona clear assessment of specific scenarios related to clearly identifiedpolicy initiatives and technological developments. This edition ofEnergy [R]evolution Scenarios provides a detailed analysis of theenergy efficiency potential and choices in the transport sector. Thematerial presented in this publication provides a useful basis forconsidering specific policies and developments that would be of valuenot only to the world but for different countries as they attempt tomeet the global challenge confronting them. The work carried out inthe following pages is comprehensive and rigorous, and even thosewho may not agree with the analysis presented would, perhaps, benefitfrom a deep study of the underlying assumptions that are linked withspecific energy scenarios for the future.
Dr. R. K. PachauriDIRECTOR-GENERAL, THE ENERGY AND RESOURCES
INSTITUTE (TERI) AND CHAIRMAN, INTERGOVERNMENTAL
PANEL ON CLIMATE CHANGE (IPCC)
OCTOBER 2008
7
8
10
11
12
13
14
9

6
GLOBAL ENERGY [R]EVOLUTIONA SUSTAINABLE GLOBAL ENERGY OUTLOOK
Energy supply has become a subject of major universal concern.High and volatile oil and gas prices, threats to a secure and stablesupply and not least climate change have all pushed it high up theinternational agenda. In order to avoid dangerous climate change,global CO2 emissions must peak no later than 2015 and rapidlydecrease after that. The technology to do this is available. Therenewables industry is ready for take off and opinion polls showthat the majority of people support this move. There are no realtechnical obstacles in the way of an Energy [R]evolution, all that ismissing is political support. But we have no time to waste. Toachieve an emissions peak by 2015 and a net reduction afterwards,we need to start rebuilding the energy sector now.
An overwhelming consensus of scientific opinion now agrees thatclimate change is happening, is caused in large part by humanactivities (such as burning fossil fuels), and if left unchecked willhave disastrous consequences. Furthermore, there is solid scientificevidence that we should act now. This is reflected in the conclusions,published in 2007, of the Intergovernmental Panel on ClimateChange (IPCC), a UN institution of more than 1,000 scientistsproviding advice to policy makers.
The effects of climate change have in fact already begun. In 2008,the melting of the Arctic ice sheet almost matched the record seton September 16, 2007. The fact that this has now happened twoyears in a row reinforces the strong decreasing trend in the amountof summertime ice observed over the past 30 years.
introduction
“NOW IS THE TIME TO COMMIT TO A TRULY SECURE AND SUSTAINABLE ENERGY FUTURE – A FUTURE BUILT ON CLEAN TECHNOLOGIES,
ECONOMIC DEVELOPMENT AND THE CREATION OF MILLIONS OF NEW JOBS.”
© G
RE
EN
PE
AC
E/M
AR
KE
L R
ED
ON
DO
image WORKERS EXAMINE PARABOLIC TROUGH COLLECTORS IN THE PS10 CONCENTRATING SOLAR TOWER PLANT IN SEVILLA, SPAIN. EACH PARABOLIC TROUGH HAS A LENGTH OF150 METERS AND CONCENTRATES SOLAR RADIATION INTO A HEAT-ABSORBING PIPE INSIDE WHICH A HEAT-BEARING FLUID FLOWS. THE HEATED FLUID IS THEN USED TO HEATSTEAM IN A STANDARD TURBINE GENERATOR.

7
In response to this threat, the Kyoto Protocol has committed itssignatories to reduce their greenhouse gas emissions by 5.2% fromtheir 1990 levels by 2008-2012. The Kyoto signatories arecurrently negotiating the second phase of the agreement, coveringthe period from 2013-2017. Time is quickly running out. Signatorycountries agreed a negotiating ‘mandate’, known as the Bali ActionPlan, which they must complete with a final agreement on thesecond Kyoto commitment period by the end of 2009. By choosingrenewable energy and energy efficiency, developing countries canvirtually stabilise their CO2 emissions, whilst at the same timeincreasing energy consumption through economic growth. OECDcountries, on the other hand, will have to reduce their emissions byup to 80%. The Energy [R]evolution concept provides a practicalblueprint on how to put this into practice.
Renewable energy, combined with the smart use of energy, candeliver at least half of the world’s energy needs by 2050. Thisreport, ‘Energy [R]evolution: A Sustainable World Energy Outlook’,shows that it is economically beneficial to cut global CO2 emissionsby over 50% within the next 42 years. It also concludes that amassive uptake of renewable energy sources is technically andeconomically possible. Wind power alone could produce about 40times more power than it does today, and total global renewableenergy generation could quadruple by then.
renewed energy [r]evolution
This is the second edition of the Energy [R]evolution. Since wepublished the first edition in January 2007, we have experienced anoverwhelming wave of support from governments, the renewablesindustry and non-governmental organisations. Since than we havebroken down the global regional scenarios into country specificplans for Canada, the USA, Brazil, the European Community, Japanand Australia, among many others.
More and more countries are seeing the environmental andeconomic benefits provided by renewable energy. The Brent crude oilprice was at $55 per barrel when we launched the first Energy[R]evolution report. Since than the price has only headed in onedirection - upwards! By mid-2008 it had reached a peak of over$140 per barrel and has subsequently stabilised at around $100.Other fuel prices have also shot up. Coal, gas and uranium havedoubled or even tripled in the same timeframe. By contrast, mostrenewable energy sources don’t need any fuel. Once installed, theydeliver energy independently from the global energy markets and atpredictable prices. Every day that another community switches torenewable energy is an independence day.
The Energy [R]evolution Scenario concludes that the restructuringof the global electricity sector requires an investment of $14.7trillion up to 2030. This compares with $11.3 trillion under theReference Scenario based on International Energy Agencyprojections. While the average annual investment required toimplement the Energy [R]evolution Scenario would need just under1% of global GDP, it would lower fuel costs by 25% - saving anannual amount in the range of $750 billion.
© G
P/N
ICK
CO
BB
ING
image ICEBERG MELTING ON GREENLAND’S COAST.
In fact, the additional costs for coal power generation alone from todayup to 2030 under the Reference Scenario could be as high as US$15.9 billion: this would cover the entire investment needed in renewableand cogeneration capacity to implement the Energy [R]evolutionScenario. These renewable sources will produce energy without anyfurther fuel costs beyond 2030, while the costs for coal and gas willcontinue to be a burden on national and global economies.
global energy scenario
The European Renewable Energy Council (EREC) and GreenpeaceInternational have produced this global energy scenario as apractical blueprint for how to urgently meet CO2 reduction targetsand secure an affordable energy supply on the basis of steadyworldwide economic development. Both of these goals are possibleat the same time. The urgent need for change in the energy sectormeans that this scenario is based only on proven and sustainabletechnologies, such as renewable energy sources and efficientdecentralised cogeneration. It therefore excludes so-called ‘CO2-freecoal power plants’, which are not in fact CO2 free and would createanother burden in trying to store the gas under the surface of theEarth with unknown consequences. For multiple safety andenvironmental reasons, nuclear energy is also excluded.
Commissioned from the Department of Systems Analysis andTechnology Assessment (Institute of Technical Thermodynamics) atthe German Aerospace Centre (DLR), the report develops a globalsustainable energy pathway up to 2050. The future potential forrenewable energy sources has been assessed with input from allsectors of the renewables industry around the world. The newEnergy [R]evolution Scenario also takes a closer look for the firsttime at the transport sector, including future technologies and howto implement energy efficiency.
The energy supply scenarios adopted in this report, which extendbeyond and enhance projections made by the International EnergyAgency, have been calculated using the MESAP/PlaNet simulationmodel. The demand side projection has been developed by theEcofys consultancy to take into account the future potential forenergy efficiency measures. This study envisages an ambitiousdevelopment pathway for the exploitation of energy efficiencypotential, focused on current best practice as well as technologiesavailable in the future. The result is that under the Energy[R]evolution Scenario, worldwide final energy demand can bereduced by 38% in 2050 compared to the Reference Scenario.
“renewable energy, combined with the smart use of energy, can deliver half of the world’senergy needs by 2050.”

8
GLOBAL ENERGY [R]EVOLUTIONA SUSTAINABLE GLOBAL ENERGY OUTLOOK
the potential for renewable energy
The good news is that the global market for renewables is booming.Decades of technical progress have seen renewable energytechnologies such as wind turbines, solar photovoltaic panels,biomass power plants, solar thermal collectors and many othersmove steadily into the mainstream. The global market for renewableenergy is growing dramatically; in 2007 its turnover was over aUS$ 70 billion, almost twice as high as the previous year. The timewindow for making the shift from fossil fuels to renewable energy,however, is still relatively short. Within the next decade many of theexisting power plants in the OECD countries will come to the end oftheir technical lifetime and will need to be replaced. But a decisiontaken to construct a coal or gas power plant today will result in theproduction of CO2 emissions and dependency on the resource and itsfuture costs lasting until 2050.
The power industry and utilities need to take more responsibilitybecause today’s investment decisions will define the energy supplyof the next generation. We strongly believe that this should be the‘solar generation’. Politicians from the industrialised world urgentlyneed to rethink their energy strategy, while the developing worldshould learn from past mistakes and build economies on the strongfoundations of a sustainable energy supply.
Renewable energy could more than double its share of the world’senergy supply - reaching up to 30% by 2030. All that is lacking isthe political will to promote its large scale deployment in allsectors at a global level, coupled with far reaching energy efficiencymeasures. By 2030 about half of global electricity could come fromrenewable energies.
The future of renewable energy development will strongly dependon political choices made by both individual governments and theinternational community. At the same time strict technicalstandards will ensure that only the most efficient fridges, heatingsystems, computers and vehicles will be on sale. Consumers have aright to buy products that don’t increase their energy bills andwon’t destroy the climate.
In this report we have also expanded the time horizon for theEnergy [R]evolution concept beyond 2050, to see when we couldphase out fossil fuels entirely. Once the pathway of this scenario hasbeen implemented, renewable energy could provide all global energyneeds by 2090. A more radical scenario – which takes the advancedprojections of the renewables industry into account – could evenphase out coal by 2050. Dangerous climate change might force usto accelerate the development of renewables faster. We believe thatthis would be possible, but to achieve it more resources must gointo research and development. Climate change and scarcity offossil fuel resources puts our world as we know it at risk; we muststart to think the unthinkable. To tap into the fast potential forrenewables and to phase out fossil fuels as soon as possible areamongst the most pressing tasks for the next generation ofengineers and scientists.
implementing the energy [r]evolution
Business as usual is not an option for future generations. TheReference Scenario based on the IEA’s ‘World Energy Outlook2007’ projection would almost double global CO2 emissions by2050 and the climate would heat up by well over 2°C. This wouldhave catastrophic consequences for the environment, the economyand human society. In addition, it is worth remembering that theformer chief economist of the World Bank, Sir Nicholas Stern,pointed out clearly in his landmark report that the countries whichinvest in energy saving technologies and renewable energies todaywill be the economic winners of tomorrow.
As Stern emphasised, inaction will be much more expensive in thelong run. We therefore call on all decision makers yet again tomake this vision a reality. The world cannot afford to stick to the‘business as usual’ energy development path: relying on fossil fuels,nuclear energy and other outdated technologies. Renewable energycan and will play a leading role in our collective energy future. Forthe sake of a sound environment, political stability and thrivingeconomies, now is the time to commit to a truly secure andsustainable energy future – a future built on clean technologies,economic development and the creation of millions of new jobs.
Arthouros ZervosEUROPEAN RENEWABLE
ENERGY COUNCIL (EREC)
OCTOBER 2008
Sven TeskeCLIMATE & ENERGY UNIT
GREENPEACE INTERNATIONAL
© G
P/M
AR
KE
L R
ED
ON
DO
image THE PS10 CONCENTRATING SOLAR TOWER PLANT IN SEVILLA, SPAIN, USES 624 LARGEMOVABLE MIRRORS CALLED HELIOSTATS. THE MIRRORS CONCENTRATE THE SUN’S RAYS TO THE TOPOF A 115 METER (377 FOOT) HIGH TOWER WHERE A SOLAR RECEIVER AND A STEAM TURBINE ARELOCATED. THE TURBINE DRIVES A GENERATOR, PRODUCING ELECTRICITY.
“by 2030 about half of globalelectricity could come fromrenewable energies.”

9
climate threats and climate solutions
Global climate change caused by the relentless build-up ofgreenhouse gases in the Earth’s atmosphere is already disruptingecosystems, resulting in about 150,000 additional deaths each year.An average global warming of 2°C threatens millions of people withan increased risk of hunger, malaria, flooding and water shortages.If rising temperatures are to be kept within acceptable limits thenwe need to significantly reduce our greenhouse gas emissions. Thismakes both environmental and economic sense. The maingreenhouse gas is carbon dioxide (CO2) produced by using fossilfuels for energy and transport.
climate change and security of supply
Spurred by recent large increases in the price of oil, the issue ofsecurity of supply is now at the top of the energy policy agenda.One reason for these price increases is the fact that supplies of allfossil fuels – oil, gas and coal – are becoming scarcer and moreexpensive to produce. The days of ‘cheap oil and gas’ are coming toan end. Uranium, the fuel for nuclear power, is also a finiteresource. By contrast, the reserves of renewable energy that aretechnically accessible globally are large enough to provide about sixtimes more power than the world currently consumes - forever.
Renewable energy technologies vary widely in their technical andeconomic maturity, but there are a range of sources which offerincreasingly attractive options. These include wind, biomass,photovoltaic, solar thermal, geothermal, ocean and hydroelectricpower. Their common feature is that they produce little or nogreenhouse gases, and rely on virtually inexhaustible naturalsources for their ‘fuel’. Some of these technologies are alreadycompetitive. Their economics will further improve as they developtechnically, as the price of fossil fuels continues to rise and as theirsaving of carbon dioxide emissions is given a monetary value.
executive summary
“NOW IS THE TIME TO COMMIT TO A TRULY SECURE AND SUSTAINABLE ENERGY FUTURE – A FUTURE BUILT ON CLEAN TECHNOLOGIES,
ECONOMIC DEVELOPMENT AND THE CREATION OF MILLIONS OF NEW JOBS.”
© P
AU
L L
AN
GR
OC
K/Z
EN
IT/G
RE
EN
PE
AC
E
image CONSTRUCTION OF THE OFFSHORE WINDFARM AT MIDDELGRUNDEN NEAR COPENHAGEN, DENMARK.

10
GLOBAL ENERGY [R]EVOLUTIONA SUSTAINABLE GLOBAL ENERGY OUTLOOK
At the same time there is enormous potential for reducing ourconsumption of energy, while providing the same level of energyservices. This study details a series of energy efficiency measureswhich together can substantially reduce demand in industry, homes,business and services.
Although nuclear power produces little carbon dioxide, there aremultiple threats to people and the environment from its operations.These include the risks and environmental damage from uraniummining, processing and transport, the risk of nuclear weaponsproliferation, the unsolved problem of nuclear waste and thepotential hazard of a serious accident. The nuclear option istherefore discounted in this analysis. The solution to our futureenergy needs lies instead in greater use of renewable energy sourcesfor both heat and power.
the energy [r]evolution
The climate change imperative demands nothing short of an energyrevolution. At the core of this revolution will be a change in theway that energy is produced, distributed and consumed.
the five key principles behind this shift will be to:
• Implement renewable solutions, especially through decentralisedenergy systems
• Respect the natural limits of the environment
• Phase out dirty, unsustainable energy sources
• Create greater equity in the use of resources
• Decouple economic growth from the consumption of fossil fuels
Decentralised energy systems, where power and heat are producedclose to the point of final use, avoid the current waste of energyduring conversion and distribution. They will be central to the Energy[R]evolution, as will the need to provide electricity to the two billionpeople around the world to whom access is presently denied.
Two scenarios up to the year 2050 are outlined in this report. TheReference Scenario is based on the Reference Scenario publishedby the International Energy Agency in World Energy Outlook 2007,extrapolated forward from 2030. Compared to the 2004 IEAprojections, World Energy Outlook 2007 (WEO 2007) assumes aslightly higher average annual growth rate of world Gross DomesticProduct (GDP) of 3.6%, instead of 3.2%, over the period 2005-2030. At the same time, WEO 2007 expects final energyconsumption in 2030 to be 4% higher than in WEO 2004.
China and India are expected to grow faster than other regions,followed by the Developing Asia group of countries, Africa and theTransition Economies (mainly the former Soviet Union). The OECDshare of global purchasing power parity (PPP) adjusted GDP willdecrease from 55% in 2005 to 29% by 2050.
The Energy [R]evolution Scenario has a target for worldwidecarbon dioxide emissions to be reduced by 50% below 1990 levelsby 2050, with per capita emissions reduced to less than 1.3 tonnesper year. This is necessary if the increase in global temperature is to
remain below +2°C. A second objective is the global phasing out ofnuclear energy. To achieve these targets, the scenario ischaracterised by significant efforts to fully exploit the largepotential for energy efficiency. At the same time, all cost-effectiverenewable energy sources are accessed for both heat and electricitygeneration, as well as the production of sustainable bio fuels.
Today, renewable energy sources account for 13% of the world’sprimary energy demand. Biomass, which is mostly used in the heatsector, is the main renewable energy source. The share of renewableenergies for electricity generation is 18%. The contribution ofrenewables to heat supply is around 24%, to a large extentaccounted for by traditional uses such as collected firewood. About80% of the primary energy supply today still comes from fossilfuels. The Energy [R]evolution Scenario describes a developmentpathway which turns the present situation into a sustainable energysupply through the following measures:
• Exploitation of the existing large energy efficiency potentials willensure that primary energy demand increases only slightly - fromthe current 474,900 PJ/a (2005) to 480,860 PJ/a in 2050,compared to 867,700 PJ/a in the Reference Scenario. Thisdramatic reduction is a crucial prerequisite for achieving asignificant share of renewable energy sources in the overallenergy supply system, for compensating the phasing out ofnuclear energy and for reducing the consumption of fossil fuels.
• The increased use of combined heat and power generation (CHP)also improves the supply system’s energy conversion efficiency,increasingly using natural gas and biomass. In the long term, thedecreasing demand for heat and the large potential for producingheat directly from renewable energy sources limits the furtherexpansion of CHP.
• The electricity sector will be the pioneer of renewable energyutilisation. By 2050, around 77% of electricity will be producedfrom renewable energy sources (including large hydro). Acapacity of 9,100 GW will produce 28,600 TWh/a renewableelectricity in 2050.
• In the heat supply sector, the contribution of renewables willincrease to 70% by 2050. Fossil fuels will be increasinglyreplaced by more efficient modern technologies, in particularbiomass, solar collectors and geothermal.
• Before sustainable bio fuels are introduced in the transportsector, the existing large efficiency potentials have to beexploited. As biomass is mainly committed to stationaryapplications, the production of bio fuels is limited by theavailability of sustainable raw materials. Electric vehiclespowered by renewable energy sources, will play an increasinglyimportant role from 2020 onwards.
• By 2050, 56% of primary energy demand will be covered byrenewable energy sources.
To achieve an economically attractive growth of renewable energysources, a balanced and timely mobilisation of all technologies is ofgreat importance. Such mobilisation depends on technical potentials,actual costs, cost reduction potentials and technological maturity.
image IN 2005 THE WORST DROUGHT INMORE THAN 40 YEARS DAMAGED THEWORLD’S LARGEST RAIN FOREST IN THEBRAZILIAN AMAZON, WITH WILDFIRESBREAKING OUT, POLLUTED DRINKINGWATER AND THE DEATH OF MILLIONSFISH AS STREAMS DRY UP.

11
costs
The slightly higher electricity generation costs (compared toconventional fuels) under the Energy [R]evolution Scenario arecompensated for, to a large extent, by reduced demand forelectricity. Assuming average costs of 3 cents/kWh forimplementing energy efficiency measures, the additional cost forelectricity supply under the Energy [R]evolution Scenario willamount to a maximum of $10 billion/a in 2010. These additionalcosts, which represent society’s investment in an environmentallybenign, safe and economic energy supply, continue to decrease after2010. By 2050 the annual costs of electricity supply will be $2,900billion/a below those in the Reference Scenario.
It is assumed that average crude oil prices will increase from $52.5per barrel in 2005 to $100 per barrel in 2010, and continue to riseto $140 per barrel in 2050. Natural gas import prices are expectedto increase by a factor of four between 2005 and 2050, while coalprices will nearly double, reaching $360 per tonne in 2050. A CO2
‘price adder’ is applied, which rises from $10 per tonne of CO2 in2010 to $50 per tonne of in 2050.
development of CO2 emissions
While CO2 emissions worldwide will double under the ReferenceScenario up to 2050, and are thus far removed from a sustainabledevelopment path, under the Energy [R]evolution Scenario they willdecrease from 24,350 million tonnes in 2003 to 10,590 m/t in2050. Annual per capita emissions will drop from 3.8 tonnes/capitato 1.2 t/capita. In spite of the phasing out of nuclear energy and agrowing electricity demand, CO2 emissions will decrease enormouslyin the electricity sector. In the long run efficiency gains and theincreased use of renewable electric vehicles, as well as a sharpexpansion in public transport, will even reduce CO2 emissions in thetransport sector. With a share of 35% of total emissions in 2050,the power sector will reduce significantly but remain the largestsource of CO2 emissions - followed by transport and industry.
to make the energy [r]evolution real and to avoiddangerous climate change, Greenpeace and ERECdemand for the energy sector that the followingpolicies and actions are implemented:
1. Phase out all subsidies for fossil fuels and nuclear energy.
2. Internalise the external (social and environmental) costs ofenergy production through “cap and trade” emissions trading.
3. Mandate strict efficiency standards for all energy consumingappliances, buildings and vehicles.
4. Establish legally binding targets for renewable energy and combined heat and power generation.
5. Reform the electricity markets by guaranteeing priority access to the grid for renewable power generators.
6. Provide defined and stable returns for investors, for example by feed-in tariff programmes.
7. Implement better labelling and disclosure mechanisms to provide more environmental product information.
8. Increase research and development budgets for renewable energy and energy efficiency.
© A
NT
HO
NY
UP
TO
N 2
003
© G
P/A
NA
CL
AU
DIA
JA
TAH
Y
© M
AR
CU
S F
RA
NK
EN
/GP
image A WOMAN CLEANS SOLAR PANALS AT THEBAREFOOT COLLEGE IN TILONIA, RAJASTHAN, INDIA.
image NORTH HOYLE WIND FARM, UK’S FIRST WIND FARM IN THE IRISH SEA WHICHWILL SUPPLY 50,000 HOMES WITH POWER.
figure 0.1: global: development of primary energyconsumption under the two scenarios(‘EFFICIENCY’ = REDUCTION COMPARED TO THE REFERENCE SCENARIO)
•• ‘EFFICIENCY’
• OCEAN ENERGY
• GEOTHERMAL
• SOLAR
• BIOMASS
•WIND
• HYDRO
• NATURAL GAS
• CRUDE OIL
• COAL
• NUCLEAR
1,000,000
900,000
800,000
700,000
600,000
500,000
400,000
300,000
200,000
100,000
PJ/a 0REF2005
E[R] REF2010
E[R] REF2020
E[R] REF2030
E[R] REF2040
E[R] REF2050
E[R]
12
GLOBAL ENERGY [R]EVOLUTIONA SUSTAINABLE GLOBAL ENERGY OUTLOOK
long term energy [r]evolution scenarios
The Energy [R]evolution Scenario outlines a sustainable pathwayfor a new way of using and producing energy up to 2050.Greenpeace, the DLR and the renewable energy industry have nowdeveloped this scenario further towards a complete phasing out offossil fuels in the second half of this century.
A long term scenario over almost 100 years cannot be exact.Projections of economic growth rates, fossil fuel prices or theoverall energy demand are of course speculative and by no meansrepresent forecasts. A regional breakdown is also not possible assufficient technical data, such as exact wind speed data in specificlocations, is not available. The grid integration of huge percentagesof fluctuating sources such as wind and solar photovoltaics equallyneeds further scientific and technical research. But such a longterm scenario can give us an idea of by when a complete fossil fueland CO2 free energy supply at a global level is possible, and whatlong term production capacities for renewable energy sources areneeded. In this context we developed two different long termscenarios: the long term Energy [R]evolution and the advancedEnergy [R]evolution. The long term scenario follows the sameprojections until the end of this century.
By 2050, renewable energy sources will account for more than50% of the world’s primary energy demand in the Energy[R]evolution Scenario. Approximately 44% of primary energysupply in 2050 still comes from fossil fuels, mainly oil used in thetransport sector, followed by gas and coal in the power sector.
The long term Energy [R]evolution Scenario continues thedevelopment pathway up to 2100 with the following outcomes:
• demand: Energy efficiency potentials are largely exploited andprimary energy demand therefore stabilises at 2060 levels.
• power sector: The electricity sector will pioneer the fossil fuelphase-out. By 2070 over 93% of electricity will be producedfrom renewable energy sources, with the remaining gas-firedpower plants mainly used for backup power. A capacity of 23,100GW will produce 56,800 TWh of renewable electricity in 2100 –17 times more than today.
From the currently available technologies, solar photovoltaics,followed by wind power, concentrated solar power and geothermal,have the highest potentials in the power sector. The use of oceanenergy might be significantly higher, but with the current state ofdevelopment, the technical and economical potential remains unclear.
• heating and cooling: The increased use of combined heat andpower generation (CHP) in 2050 will remain at the same level upto 2070. It will then fall back slightly to its 2040 level (5,500TWh) until the end of this century, as the decreasing demand forheat and the large potential for producing heat directly fromrenewable energy sources, such as solar collectors andgeothermal, limits the further expansion of CHP.
• In the heat supply sector, the contribution of renewables willincrease to 90% by 2080. A complete fossil fuels phase-out willbe realised shortly afterwards.
• transport: Efficient use of transport systems will still be themain way of limiting fuel use. Public transport systems willcontinue to be far more energy efficient than individual vehicles.However, we assume that cars will still be needed, especially inrural areas. Between 2050 and 2085 the use of oil in cars will bephased out completely and replaced mainly by electric vehicles.The electricity will come from renewable energy sources.
• By 2080, about 90% of primary energy demand will be coveredby renewable energy sources; in 2090 the renewable share willreach 98.2%.
The advanced Energy [R]evolution Scenario takes a much moreradical approach to the climate crisis facing the world. In order topull the emergency brake on global emissions it therefore assumesmuch shorter technical lifetimes for coal-fired power plants - 20years instead of 40 years. This reduces global CO2 emissions evenfaster and takes the latest evidence of greater climate sensitivityinto account. In order to fill the resulting gap, the annual growthrates of renewable energy sources, especially solar photovoltaics,wind and concentrated solar power plants, have been increased.
Growth rates increase from 2020 onwards to 2050. These expandedgrowth rates are in line with the current projections of the wind andsolar industry (see Global Wind Energy Outlook 2008, SolarGeneration 2008). So in the advanced scenario the capacities for solarand wind power generation appear 10 to 15 years earlier thanprojected in the Energy [R]evolution Scenario. The expansion ofgeothermal co-generation has also been moved 20 years ahead of itsexpected take-off. All other results remain the same as in the Energy[R]evolution Scenario, with the only changes affecting the power sector.
The main change for the power sector in the advanced Energy[R]evolution Scenario is that all conventional coal-fired powerplants are phased out by 2050. Between 2020 and 2050 a total ofabout 1,200 GW of capacity will be replaced by solar photovolatics,on- and offshore wind and concentrated solar power plants. By2050, 86% of electricity will be produced from renewable energysources and 96% by 2070. Again the remaining fossil fuel-basedpower production is from gas. Compared to the basic Energy[R]evolution Scenario the expected capacity of renewable energywill emerge 15 years ahead of schedule, while the overall level ofrenewable power generation from 2085 onwards will be the same.

13
From the renewables industry perspective, these larger quantitiesare able to be delivered. However, the advanced scenario requiresmore research and development into the large scale grid integrationof renewable energies as well as better regional meteorological datato optimise the mix of different sources.
It is important to highlight that in the Energy [R]evolutionScenario the majority of remaining coal power plants – which willbe replaced 20 years before the end of their technical lifetime – arein China and India. This means that in practice all coal powerplants built between 2005 and 2020 will be replaced by renewableenergy sources. To support the building of capacity in developingcountries significant new public financing, especially fromindustrialised countries, will be needed. It is vital that specificfunding mechanisms are developed under the international climatenegotiations that can assist the transfer of financial support toclimate change mitigation, including technology transfer.Greenpeace International has developed one option for how such afunding mechanism could work (see Chapter 2).
almost zero CO2 emissions by 2080
While worldwide CO2 emissions will decrease under the Energy[R]evolution Scenario from 10,589 million tonnes in 2050 (51%below 1990 levels) down to 425 m/t in 2090, the advancedscenario would reduce emissions even faster. By 2050, the advancedEnergy [R]evolution version would reduce CO2 emissions by 61%below 1990 levels, and 80% below by the year 2075. Annual percapita emissions would drop below 1 t/capita in 2050 under theadvanced scenario, compared with around 2060 under the basicEnergy [R]evolution.
Further CO2 reductions between 2040 and 2080 are only possiblein the transport sector, as the major remaining emitters arecombustion engines in cars. It is not possible to replace theremaining fossil fuelled cars with electric vehicles as this woulddrive electricity demand up again. The increased demand cannot bemet by renewables in this timeframe since this would exceed growthrates and grid capacities based on today’s knowledge. The only wayto cut vehicle emissions further would be to reduce kilometresdriven by about 40% between 2040 and 2080.
© G
P/H
U W
EI
image THE HUGE SHADOW OF A 60-METRE-HIGH WIND TURBINE EXTENDSACROSS THE GOBI DESERT FLOOR ATTHE HE LAN SHAN WIND FARM IN THENINGXIA PROVINCE, CHINA.
“forward-thinking governments can actnow to maximize employment andinvestment opportunities as we move to a renewable energy future.”
figure 0.2: global: primary energy demand in energy[r]evolution scenario until 2100FOSSIL FUEL PHASED OUT BY 2095
600,000
500,000
400,000
300,000
200,000
100,000
PJ/a 0
2005
2010
2015
2020
2030
2040
2050
2060
2070
2080
2090
2100
figure 0.3: global: primary energy demand in theadvanced energy [r]evolution scenario until 2100COAL POWER PLANTS PHASED OUT BY 2050
600,000
500,000
400,000
300,000
200,000
100,000
PJ/a 0
2005
2010
2015
2020
2030
2040
2050
2060
2070
2080
2090
2100
•SOLAR
•WIND
• BIOMASS
• GEOTHERMAL
• OCEAN ENERGY
• HYDRO
• NATURAL GAS
• CRUDE OIL
• COAL
• LIGNITE
• NUCLEAR

14
GLOBAL ENERGY [R]EVOLUTIONA SUSTAINABLE GLOBAL ENERGY OUTLOOK
figure 0.4: global: electricity generation energy[r]evolution scenario until 2100COAL POWER PLANTS PHASED OUT BY 2085 (40 YEARS LIFETIME)
60,000
50,000
40,000
30,000
20,000
10,000
TWh/a 0
2005
2010
2015
2020
2030
2040
2050
2060
2070
2080
2090
2100
figure 0.5: global: electricity generation advancedenergy [r]evolution scenario until 2100COAL POWER PLANTS PHASED OUT BY 2050 (20 YEARS LIFETIME)
60,000
50,000
40,000
30,000
20,000
10,000
TWh/a 0
2005
2010
2015
2020
2030
2040
2050
2060
2070
2080
2090
2100
•SOLAR
•WIND
• BIOMASS
• GEOTHERMAL
• OCEAN ENERGY
• HYDRO
• NATURAL GAS
• CRUDE OIL
• COAL
• LIGNITE
• NUCLEAR
figure 0.6: global: CO2 emissions energy [r]evolutionscenario until 2100 80% GLOBAL CO2 REDUCTION BY 2085
30,000
25,000
20,000
15,000
10,000
5,000
Mil t/a 0
2005
2010
2015
2020
2030
2040
2050
2060
2070
2080
2090
2100
figure 0.7: global: CO2 emissions advanced energy[r]evolution scenario until 210080% GLOBAL CO2 REDUCTION BY 2075
••DISTRICT HEATING
• ELECTRICITY & STEAM GENERATION
•TRANSPORT
• OTHER SECTORS
• INDUSTRY
30,000
25,000
20,000
15,000
10,000
5,000
Mil t/a 0
2005
2010
2015
2020
2030
2040
2050
2060
2070
2080
2090
2100

15
1climate protection
GLOBAL THE KYOTO PROTOCOLINTERNATIONAL ENERGY POLICY
RENEWABLE ENERGY TARGETSDEMANDS FOR THE ENERGY SECTOR
“never before hashumanity been forcedto grapple with such an immenseenvironmental crisis.”GREENPEACE INTERNATIONALCLIMATE CAMPAIGN
1
ima
geT
HE
LO
CA
L A
LA
SK
AN
TE
LE
VIS
ION
STA
TIO
NB
RO
AD
CA
STS
A W
AR
NIN
G F
OR
HIG
H T
IDE
S A
ND
ER
OS
ION
AL
ON
G T
HE
SE
AS
IDE
DU
RIN
G A
20
06
OC
TO
BE
R S
TO
RM
WH
ICH
IM
PA
CT
S O
N T
HE
VIL
LA
GE
OF
SH
ISH
MA
RE
F. ©
GP
/RO
BE
RT
KN
OTH

16
GLOBAL ENERGY [R]EVOLUTIONA SUSTAINABLE GLOBAL ENERGY OUTLOOK
The greenhouse effect is the process by which the atmosphere trapssome of the sun’s energy, warming the Earth and moderating ourclimate. A human-driven increase in ‘greenhouse gases’ hasenhanced this effect artificially, raising global temperatures anddisrupting our climate. These greenhouse gases include carbondioxide, produced by burning fossil fuels and through deforestation,methane, released from agriculture, animals and landfill sites, andnitrous oxide, resulting from agricultural production plus a varietyof industrial chemicals.
Every day we damage our climate by using fossil fuels (oil, coal andgas) for energy and transport. As a result, climate change is alreadyimpacting on our lives, and is expected to destroy the livelihoods ofmany people in the developing world, as well as ecosystems andspecies, in the coming decades. We therefore need to significantlyreduce our greenhouse gas emissions. This makes bothenvironmental and economic sense.
According to the Intergovernmental Panel on Climate Change, theUnited Nations forum for established scientific opinion, the world’stemperature is expected to increase over the next hundred years byup to 5.8°C. This is much faster than anything experienced so far inhuman history. The goal of climate policy should be to keep theglobal mean temperature rise to less than 2°C above pre-industriallevels. At 2°C and above, damage to ecosystems and disruption tothe climate system increases dramatically. We have very little timewithin which we can change our energy system to meet thesetargets. This means that global emissions will have to peak and startto decline by the end of the next decade at the latest.
Climate change is already harming people and ecosystems. Itsreality can be seen in disintegrating polar ice, thawing permafrost,dying coral reefs, rising sea levels and fatal heat waves. It is notonly scientists that are witnessing these changes. From the Inuit inthe far north to islanders near the Equator, people are alreadystruggling with the impacts of climate change. An average globalwarming of 2°C threatens millions of people with an increased riskof hunger, malaria, flooding and water shortages. Never before hashumanity been forced to grapple with such an immenseenvironmental crisis. If we do not take urgent and immediate actionto stop global warming, the damage could become irreversible. Thiscan only happen through a rapid reduction in the emission ofgreenhouse gases into the atmosphere.
This is a summary of some likely effects if we allowcurrent trends to continue:
Likely effects of small to moderate warming
• Sea level rise due to melting glaciers and the thermal expansionof the oceans as global temperature increases. Massive releasesof greenhouse gases from melting permafrost and dying forests.
• A greater risk of more extreme weather events such asheatwaves, droughts and floods. Already, the global incidence of drought has doubled over the past 30 years.
• Severe regional impacts. In Europe, river flooding will increase,as well as coastal flooding, erosion and wetland loss. Floodingwill also severely affect low-lying areas in developing countriessuch as Bangladesh and South China.
• Natural systems, including glaciers, coral reefs, mangroves, alpineecosystems, boreal forests, tropical forests, prairie wetlands andnative grasslands will be severely threatened.
• Increased risk of species extinction and biodiversity loss.
The greatest impacts will be on poorer countries in sub-SaharanAfrica, South Asia, Southeast Asia and Andean South America aswell as small islands least able to protect themselves fromincreasing droughts, rising sea levels, the spread of disease anddecline in agricultural production.
longer term catastrophic effects Warming from emissions maytrigger the irreversible meltdown of the Greenland ice sheet, addingup to seven metres of sea level rise over several centuries. Newevidence shows that the rate of ice discharge from parts of theAntarctic mean it is also at risk of meltdown. Slowing, shifting orshutting down of the Atlantic Gulf Stream current will havedramatic effects in Europe, and disrupt the global ocean circulationsystem. Large releases of methane from melting permafrost andfrom the oceans will lead to rapid increases of the gas in theatmosphere, and consequent warming.
1
clima
te pro
tection
|E
FF
EC
TS

17
© G
P/N
ICK
CO
BB
ING
image A MELT POOL NEAR SERMALIKFJORD, EAST GREENLAND, MADE BY THEHELHEIM GLACIER WHICH HASRECEDED AND MELTED AWAY. THELINES IN THE EARTH BANK ARESCULPTED BY THE MOVEMENT OF THEGLACIER’S RETREAT.
the kyoto protocol
Recognising these threats, the signatories to the 1992 UNFramework Convention on Climate Change agreed the KyotoProtocol in 1997. The Protocol finally entered into force in early2005 and its 165 member countries meet twice annually tonegotiate further refinement and development of the agreement.Only one major industrialised nation, the United States, has notratified Kyoto.
The Kyoto Protocol commits its signatories to reduce theirgreenhouse gas emissions by 5.2% from their 1990 level by thetarget period of 2008-2012. This has in turn resulted in theadoption of a series of regional and national reduction targets. Inthe European Union, for instance, the commitment is to an overallreduction of 8%. In order to help reach this target, the EU hasalso agreed a target to increase its proportion of renewable energyfrom 6% to 12% by 2010.
At present the Kyoto countries are negotiating the second phase ofthe agreement, covering the period from 2013-2017. Greenpeace iscalling for industrialised country emissions to be reduced by 18%from 1990 levels for this second commitment period, and by 30%for the third period covering 2018-2022. Only with these cuts dowe stand a reasonable chance of meeting the 2°C target.
The Kyoto Protocol’s architecture relies fundamentally on legallybinding emissions reduction obligations. To achieve these targets,carbon is turned into a commodity which can be traded. The aim isto encourage the most economically efficient emissions reductions,in turn leveraging the necessary investment in clean technologyfrom the private sector to drive a revolution in energy supply.
Negotiators are running out of time, however. Signatory countriesagreed a negotiating ‘mandate’, known as the Bali Action Plan, inDecember 2007, but they must complete these negotiations with afinal agreement on the second Kyoto commitment period by the endof 2009 at the absolute latest. Forward-thinking nations can moveahead of the game by implementing strong domestic targets now,building the industry and skills bases that will deliver the transitionto a low-carbon society, and thereby provide a strong platform fromwhich to negotiate the second commitment period.
1
clima
te pro
tection
|K
YO
TO
PR
OT
OC
OL
“we have to fully acknowledge the significanceand urgency of climate change.”HU JINTAOPRESIDENT OF CHINA
© G
P/S
UT
TO
N-H
IBB
ER
T
© G
P/T
ER
ES
A O
SO
RIO
© C
LIV
E S
HIR
LE
Y/G
P
© G
P/B
ELT
RA
© G
P/V
INA
I D
ITH
AJO
HN
images 1. THE AFTERMATH OF HURRICANE STAN IN MEXICO. ACCORDING TO THEMEXICAN GOVERNMENT FIGURES THERE ARE MORE THAN 1 MILLION, 100 THOUSANDPEOPLE WHO HAVE BEEN DIRECTLY AFFECTED BY THE FLOODS WITH AN UNKNOWNNUMBER WHO HAVE DISAPPEARED. IN CHIAPAS ALONE, 650 MM RAIN FELL IN A SHORTPERIOD OF TIME CAUSING EXTENSIVE DAMAGE TO ROADS AND HOUSES. 2. CHILDRENLIVING NEXT TO THE SEA PLAY IN SEA WATER THAT HAS SURGED INTO THEIR VILLAGECAUSED BY THE ‘KING TIDES’, BUOTA VILLAGE, TARAWA ISLAND, KIRIBATI, PACIFICOCEAN. GREENPEACE AND SCIENTISTS ARE CONCERNED THAT LOW LYING ISLANDS FACEPERMANENT INUNDATION FROM RISING SEAS DUE TO CLIMATE CHANGE. 3. PREECHABUATHO, 49, IS A RESIDENT OF A VILLAGE IN LAEM TALUMPUK CAPE. HIS FAMILY, HOUSEAND VILLAGE ARE BEING THREATENED BY SEA LEVEL RISE DUE TO CLIMATE CHANGE.LAEM TALUMPUK IS IN PAK PANANG DISTRICT IN THE SOUTHERN PROVINCE OF NAKHONSI THAMMARAT, ON THE EASTERN SHORE OF THE GULF OF THAILAND. CLIMATE CHANGE-INDUCED WIND PATTERNS HAVE INTENSIFIED THE SPEED OF COASTAL EROSION IN BOTHTHE GULF OF THAILAND AND THE ANDAMAN SEA. ON AVERAGE, 5 METRES OF COASTALLANDS IN THE REGION ARE LOST EACH YEAR. 4. THE DARK CLOUDS OF AN ADVANCINGTORNADO, NEAR FORT DODGE, IOWA, USA. 5. WOMEN FARMERS FROM LILONGWE, MALAWISTAND IN THEIR DRY, BARREN FIELDS CARRYING ON THEIR HEADS AID ORGANISATIONHANDOUTS. THIS AREA, THOUGH EXTREMELY POOR HAS BEEN SELF-SUFFICIENT WITHFOOD. NOW THESE WOMEN’S CHILDREN ARE SUFFERING FROM MALNUTRITION.
1
3
2
4 5

18
GLOBAL ENERGY [R]EVOLUTIONA SUSTAINABLE GLOBAL ENERGY OUTLOOK
international energy policy
At present, renewable energy generators have to compete with oldnuclear and fossil fuel power stations which produce electricity atmarginal costs because consumers and taxpayers have already paidthe interest and depreciation on the original investments. Politicalaction is needed to overcome these distortions and create a levelplaying field for renewable energy technologies to compete.
At a time when governments around the world are in the process ofliberalising their electricity markets, the increasing competitivenessof renewable energy should lead to higher demand. Without politicalsupport, however, renewable energy remains at a disadvantage,marginalised by distortions in the world’s electricity markets createdby decades of massive financial, political and structural support toconventional technologies. Developing renewables will thereforerequire strong political and economic efforts, especially throughlaws that guarantee stable tariffs over a period of up to 20 years.Renewable energy will also contribute to sustainable economicgrowth, high quality jobs, technology development, globalcompetitiveness and industrial and research leadership.
renewable energy targets
In recent years, in order to reduce greenhouse emissions as well asincrease energy security, a growing number of countries haveestablished targets for renewable energy. These are either expressedin terms of installed capacity or as a percentage of energyconsumption. These targets have served as important catalysts forincreasing the share of renewable energy throughout the world.
A time period of just a few years is not long enough in theelectricity sector, however, where the investment horizon can be upto 40 years. Renewable energy targets therefore need to have short,medium and long term steps and must be legally binding in order tobe effective. They should also be supported by mechanisms such asfeed-in tariffs for renewable electricity generation. In order for theproportion of renewable energy to increase significantly, targetsmust be set in accordance with the local potential for eachtechnology (wind, solar, biomass etc) and be complemented bypolicies that develop the skills and manufacturing bases to deliverthe agreed quantity of renewable energy.
In recent years the wind and solar power industries have shownthat it is possible to maintain a growth rate of 30 to 35% in therenewables sector. In conjunction with the European PhotovoltaicIndustry Association1, the European Solar Thermal Power IndustryAssociation2 and the Global Wind Energy Council3, the EuropeanRenewable Energy Council and Greenpeace have documented thedevelopment of those industries from 1990 onwards and outlined aprognosis for growth up to 2020 and 2040.
demands for the energy sector
Greenpeace and the renewables industry have a clearagenda for the policy changes which need to be madeto encourage a shift to renewable sources. The main demands are:
1. Phase out all subsidies for fossil fuels and nuclear energy.
2. Internalise external (social and environmental) costs through“cap and trade” emissions trading.
3. Mandate strict efficiency standards for all energy consumingappliances, buildings and vehicles.
4. Establish legally binding targets for renewable energy andcombined heat and power generation.
5. Reform the electricity markets by guaranteeing priority access tothe grid for renewable power generators.
6. Provide defined and stable returns for investors, for examplethrough feed-in tariff payments.
7. Implement better labelling and disclosure mechanisms to providemore environmental product information.
8. Increase research and development budgets for renewable energyand energy efficiency
Conventional energy sources receive an estimated $250-300 billion4
in subsidies per year worldwide, resulting in heavily distorted markets.Subsidies artificially reduce the price of power, keep renewable energyout of the market place and prop up non-competitive technologiesand fuels. Eliminating direct and indirect subsidies to fossil fuels andnuclear power would help move us towards a level playing field acrossthe energy sector. Renewable energy would not need special provisionsif markets factored in the cost of climate damage from greenhousegas pollution. Subsidies to polluting technologies are perverse in thatthey are economically as well as environmentally detrimental.Removing subsidies from conventional electricity would not only savetaxpayers’ money. It would also dramatically reduce the need forrenewable energy support.
1
clima
te pro
tection
|IN
TE
RN
AT
ION
AL
PO
LIC
Y - T
AR
GE
TS
- DE
MA
ND
S
© L
AN
GR
OC
K/Z
EN
IT/G
P
image OFF SHORE WINDFARM,MIDDELGRUNDEN, COPENHAGEN,DENMARK.
references1 SOLAR GENERATION, SEPTEMBER 20072 CONCENTRATED SOLAR POWER –NOW! NOVEMBER 20053 GLOBAL WIND ENERGY OUTLOOK, OCTOBER 20084 ‘WORLD ENERGY ASSESSMENT: ENERGY AND THE CHALLENGE OF SUSTAINABILITY’,UNITED NATIONS DEVELOPMENT PROGRAMME, 2000

19
implementing the energy [r]evolution
GLOBAL BANKABLE SUPPORT SCHEMESLEARNING FROM EXPERIENCE
FIXED FEED-IN TARIFFSEMISSIONS TRADINGTHE FFET FUND
“bridging the gap.”GREENPEACE INTERNATIONALCLIMATE CAMPAIGN
2
image GEOTHERMAL POWER PLANT, NORTH ISLAND, NEW ZEALAND. © JOE GOUGH/DREAMSTIME2

20
GLOBAL ENERGY [R]EVOLUTIONA SUSTAINABLE GLOBAL ENERGY OUTLOOK
This chapter outlines a Greenpeace proposal for a feed-in tariffsystem in developing countries financed by emissions trading fromOECD countries.
The Energy [R]evolution Scenario shows that renewable electricitygeneration has huge environmental and economic benefits. However itsgeneration costs, especially in developing countries, will remain higherthan those of existing coal or gas-fired power stations for the next fiveto ten years. To bridge this gap between conventional fossil fuel-basedpower generation and renewables, a support mechanism is needed.
The Feed in Tariff Fund Emissions Trading model (FFET) is aconcept conceived by Greenpeace International5. The aim is theexpansion of renewable energy in developing countries withfinancial support from industrialised nations – a mechanism toimplement renewable energy technology transfer via future JointImplementation, Clean Development Mechanism projects orTechnology Transfer programmes under the Kyoto Protocol. Withthe Kyoto countries currently negotiating the second phase of theiragreement, covering the period from 2013-2017, the proposedFFET mechanism could be used under all the existing flexiblemechanisms, auctioning cap & trade schemes or linked totechnology transfer projects.
The thinking behind the FFET in a nutshell is to link the feed-in tariffsystem, as it has been successfully applied in countries like Germanyand Spain, with emissions trading schemes such as the ETS inEurope through already established international funding channelssuch as development aid banks or the Kyoto Protocol mechanisms.
bankable support schemes
Since the early development of renewable energies within the powersector, there has been an ongoing debate about the best and mosteffective type of support scheme. The European Commissionpublished a survey in December 2005 which provides a good overviewof the experience so far. According to this report, feed-in tariffs areby far the most efficient and successful mechanism. Globally morethan 40 countries have adopted some version of the system.
Although the organisational form of these tariffs differs fromcountry to country, there are certain clear criteria which emerge asessential for creating a successful renewable energy policy. At theheart of these is a reliable, bankable support scheme for renewableenergy projects which provides long term stability and certainty6.Bankable support schemes result in lower cost projects becausethey lower the risk for both investors and equipment suppliers. Thecost of wind-powered electricity in Germany is up to 40% cheaperthan in the United Kingdom7, for example, because the supportsystem is more secure and reliable.
For developing countries, feed-in laws would be an ideal mechanismfor the implementation of new renewable energies. The extra costs,however, which are usually covered in Europe, for example, by avery minor increase in the overall electricity price for consumers,are still seen as an obstacle. In order to enable technology transferfrom Annex 1 countries to developing countries, a mix of a feed-inlaw, international finance and emissions trading could be used toestablish a locally based renewable energy infrastructure andindustry with the assistance of OECD countries.
learning from experience
The FFET program brings together three different supportmechanisms and builds on the experience from 20 years ofrenewable energy support programmes.
experience of feed-in tariffs
• Feed-in tariffs are seen as the best way forward and very popular,especially in developing countries.
• The main argument against them is the increase in electricityprices for households and industry, as the extra costs are sharedacross all customers. This is particularly difficult for developingcountries, where many people can’t afford to spend more moneyfor electricity services.
experience of emissions trading Emissions trading (betweencountries which need to make emissions reductions and countrieswhere renewable energy projects can be more easily or cheaplyimplemented) already plays a role in achieving CO2 reductionsunder the Kyoto Protocol. The experience so far is that:
• The CO2 market is unstable, with the price per tonne varying significantly.
• The market is still a ‘virtual’ market, with only limited actual flow of money.
• Putting a price on CO2 emissions makes fossil fuelled power moreexpensive, but due to the unstable and fluctuating prices it willnot help to make renewable energy projects more economicwithin the foreseeable future.
• Most systems are not yet delivering real cuts in emissions.
experience of international financing Finance for renewable energyprojects is one of the main obstacles in developing countries. While largescale projects have fewer funding problems, small, community basedprojects, whilst having a high degree of public acceptance, face financingdifficulties. The experiences from micro credits for small hydro projectsin Bangladesh, for example, as well as wind farms in Denmark andGermany, show how strong local participation and acceptance can beachieved. The main reasons for this are the economic benefits flowing tothe local community and careful project planning based on good localknowledge and understanding. When the community identifies theproject rather than the project identifying the community, the result isgenerally faster bottom-up growth of the renewables sector.
combining existing programmes
The basic aims of the Feed-in Tariff Fund Emissions Trading scheme areto facilitate the implementation of feed-in laws for developing countries,to use existing emissions trading schemes to link CO2 prices directly withthe uptake of renewable energy, and to use the existing infrastructure,ofinternational financial institutions to secure investment for projects andlower the risk factor. The FFET concept will have three parts – fixedfeed-in tariffs, emissions trading and a funding arrangement.
2
imp
lemen
ting
the en
ergy [r]evo
lutio
n|
SU
PP
OR
T S
CH
EM
ES
- EX
PE
RIE
NC
E - C
OM
BIN
ING
EX
IST
ING
PR
OG
RA
MM
ES
references5 IMPLEMENTING THE ENERGY [R]EVOLUTION, OCTOBER 2008, SVEN TESKE, GREENPEACE INTERNATIONAL6 ‘THE SUPPORT OF ELECTRICITY FROM RENEWABLE ENERGY SOURCES’, EUROPEANCOMMISSION, 20057 SEE ABOVE REPORT, P. 27, FIGURE 4

21
1. fixed feed-in tariffs
Feed-in tariffs will provide bankable and long term stable support forthe development of a local renewable energy market in developingcountries. The tariffs should bridge the gap between conventionalpower generation costs and those of renewable energy generation.
The key parameters for feed-in tariffs under FFET are:
• Variable tariffs for different renewable energy technologies,depending on their costs and technology maturity, paid for 20 years.
• Payments based on actual generation in order to achieve properlymaintained projects with high performance ratios.
• Any additional finance required over the (20 year) period will besecured through a public fund, which could generate some capitalincome, for example via interest rates, from a soft loanprogramme to finance renewable energy projects (see below).
• Payment of the ‘additional costs’ for renewable generation will bebased on the Spanish system of the wholesale electricity priceplus a fixed premium.
A developing country which wants to apply for funding to operaterenewable energy projects under the FFET scheme will need toestablish clear regulations for the following:
• Guaranteed access to the electricity grid for renewable electricity projects.
• Establishment of a feed-in law based on successful examples.
• Transparent access to all data needed to establish the feed-intariff, including full records of generated electricity.
• Clear planning and licencing procedures.
2. emissions trading
The traded CO2 emissions will come from OECD countries on top ofany commitment under their national emission reduction targets.Every tonne of CO2 will be connected to a specific amount ofelectricity form renewable energy. A simple approach would be to usea factor of 1kg CO2 for 1 kWh of renewable electricity, which equalsthe amount of avoided CO2 emissions from an older coal power plant.A more complex method would be to use the average CO2 emissionsper kilowatt-hour in the specific country or the world’s average, whichis currently 0.6kg CO2/kWh. The Energy [R]evolution Scenario showsthat the average additional costs (under the proposed energy mix)between 2008 and 2015 are between 1 and 4 cents per kilowatt-hourso the price per tonne of CO2 would be between €10 and €40.
The key parameters for emissions trading under FFET will be:
• 1 tonne CO2 = 1,000 kWh renewable electricity (emissionsfactor: 1kg CO2/kWh)
• 1 tonne CO2 represents a 20 year ‘package’ of renewableelectricity (1,000 kWh = 20 years x annual 50 kWh renewableelectricity production)
3. the FFET fund
The FFET fund will act as a buffer between fluctuating CO2 emissionsprices and stable long term feed-in tariffs. The fund will secure thepayment of the required feed-in tariffs during the whole period (about20 years) for each project. This fund could be managed byintrernational financial institutions operating in Europe and CentralAsia or by Multilateral Development Banks. In order to provide accessto finance for small-scale businesses, a co-operation with a local bankwith a local presence in villages or cities would be desirable.
All renewable energy projects must have a clear set ofenvironmental criteria which are part of the national licensingprocedure in the country where the project will generate electricity.Those criteria will have to meet a minimum environmental standarddefined by an independent monitoring group. If there are alreadyacceptable criteria developed, for example for CDM projects, theyshould be adopted rather than reinventing the wheel. The boardmembers will come from NGOs, energy and finance experts as wellas members of the governments involved. The fund will not be ableto use the money for speculative investments. It can only providesoft loans for FFET projects.
The key parameters for the FFET fund will be:
• The fund will guarantee the payment of the total feed-in tariffsover a period of 20 years if the project is operated properly.
• The fund will receive annual income from emissions trading under FFET.
• The fund can provide soft loans to finance renewable energy projects.
• The fund will generate income from interest rates only.
• The fund will pay feed-in tariffs annually only on the basis of generated electricity.
• The operator of a FFET project is required to transmit all relevantdata about generation to a central database. This database will alsobe used to evaluate the performance of the project.
• Every FFET project must have a professional maintenancecompany to ensure high availability.
• The grid operator must do its own monitoring and sendgeneration data to the FFET fund. Data from the project andgrid operators will be compared regularly to check consistency.
2
imp
lemen
ting
the en
ergy [r]evo
lutio
n|
FIX
ED
FE
ED
-IN T
AR
IFF
S - E
MIS
SIO
NS
TR
AD
ING
- TH
E F
FE
T F
UN
D
© G
P/C
OB
BIN
G
© G
P/R
OD
RIG
O B
AL
ÈIA
image GREENPEACE INSTALLED 40 PHOTOVOLTAIC SOLAR PANELS THAT MUST SUPPLY30% TO 60% OF THE DAILY DEMAND OF ELECTRICITY IN THE GREENPEACE OFFICE INSAO PAULO. THE PANELS ARE CONNECTED TO THE NATIONAL ENERGY GRID, WHICH ISNOT ALLOWED BY LAW IN BRAZIL. ONLY ABOUT 20 SYSTEMS OF THIS TYPE EXIST INBRAZIL AS THEY REQUIRE A SPECIAL LICENSE TO FUNCTION.
image PLANT NEAR REYKJAVIK WHERE ENERGY IS PRODUCED FROM THEGEOTHERMAL ACTIVITY.

22
GLOBAL ENERGY [R]EVOLUTIONA SUSTAINABLE GLOBAL ENERGY OUTLOOK
2
imp
lemen
ting
the en
ergy [r]evo
lutio
n|
FF
ET
SC
HE
ME
FFETroles and responsibilities
developing country:
Legislation:• feed-in law• guaranteed grid access• licensing
(inter-) national finance institute(s)
Organising and Monitoring:• organize financial flow• monitoring• providing soft loans• guarantee the payment of the feed-in tariff
OECD country
Legislation:• CO2 credits under CDM• tax from Cap & Trade• auctioning CO2 Certificates
figure 2.1: ffet scheme
© G
RE
EN
PE
AC
E/X
UA
N C
AN
XIO
NG
image NAN WIND FARM IN NAN’AO. GUANGDONG PROVINCE HAS ONE OF THE BEST WIND RESOURCES IN CHINA AND IS ALREADY HOME TO SEVERAL INDUSTRIAL SCALE WIND FARMS.MASSIVE INVESTMENT IN WIND POWER WILL HELP CHINA OVERCOME ITS RELIANCE ON CLIMATE DESTROYING FOSSIL FUEL POWER AND SOLVE ITS ENERGY SUPPLY PROBLEM.

23
3nuclear power and climate protection
GLOBAL NUCLEAR PROLIFERATIONNUCLEAR WASTESAFETY RISKS
“safety and securityrisks, radioactivewaste, nuclearproliferation...”GREENPEACE INTERNATIONALCLIMATE CAMPAIGN
3
image SIGN ON A RUSTY DOOR AT CHERNOBYL ATOMIC STATION. © DMYTRO/DREAMSTIME

24
GLOBAL ENERGY [R]EVOLUTIONA SUSTAINABLE GLOBAL ENERGY OUTLOOK
Nuclear energy is a relatively small industry with big problems. Itcovers just one sixteenth of the world’s primary energy consumption,a share set to decline over the coming decades. The average age ofoperating commercial nuclear reactors is 23 years, so more powerstations are being shut down than started. In 2007, world nuclearproduction fell by 1.8 % and the number of operating reactors was439, five less than the historical peak of 2002.
In terms of new power stations, the amount of nuclear capacityadded annually between 2000 and 2007 was 2,500 MWe onaverage. This was six times less than wind power (13,300 MWe perannum between 2000 and 2007). In 2007, newly constructedrenewable energy power plants in Germany generated 13 TWh ofelectricity – as much as two large nuclear units.
Despite the rhetoric of a ‘nuclear renaissance’, the industry isstruggling with a massive increase in costs and construction delaysas well as safety and security problems linked to reactor operation,radioactive waste and nuclear proliferation.
a solution to climate protection?
The promise of nuclear energy to contribute to both climateprotection and energy supply needs to be checked against reality. Inthe most recent Energy Technology Perspectives report published bythe International Energy Agency8, for example, its Blue Mapscenario outlines a future energy mix which would halve globalcarbon emissions by the middle of this century. To reach this goalthe IEA assumes a massive expansion of nuclear power betweennow and 2050, with installed capacity increasing four-fold andelectricity generation reaching 9,857 TWh/year, compared to 2,608TWh in 2007. In order to achieve this, the report says that 32large reactors (1,000 MWe) would have to be built every yearfrom now until 2050. This would be unrealistic, expensive,hazardous and too late to make a difference.
unrealistic: Such a rapid growth is practically impossible given thetechnical limitations. This scale of development was achieved in thehistory of nuclear power for only two years at the peak of the state-driven boom of the mid-1980s. It is unlikely to be achieved again,not to mention maintained for 40 consecutive years. While 1984and 1985 saw 31 GW of newly added nuclear capacity, the decadeaverage was 17 GW annually. In the past ten years, only three largereactors have been brought on line each year, and the currentproduction capacity of the global nuclear industry cannot delivermore than an annual six units.
expensive: The IEA scenario assumes very optimistic investmentcosts of $2,100/kWe installed, in line with what the industry hasbeen recently promising. The reality indicates three times thatmuch. Recent estimates by US business analysts Moody’s (June2008) put the cost of nuclear investment as high as $7,000/kWe.Price quotes for projects under preparation in the US cover a rangefrom $5,200 to 8,000/kWe9. The latest cost estimate for the firstFrench EPR pressurised water reactor being built in Finland is$5,200/kWe, a figure likely to increase for later reactors as pricesescalate. The Wall Street Journal has reported that the cost indexfor nuclear components has risen by 173 % since 2000 – a neartripling over the past eight years10. Building 1,400 large reactors(1,000 MWe), even at the current cost of about $7,000/kWe,would require an investment of US$9.8 trillion.
hazardous: Massive expansion of nuclear energy would necessarilylead to a large increase in related hazards, such as serious reactoraccidents, growing stockpiles of deadly high level nuclear wastewhich will need to be safeguarded for thousands of years andpotential proliferation of both nuclear technologies and materialsthat can be diverted to military or terrorist use. The 1,400 largeoperating reactors in 2050 would generate an annual 35,000 tonsof spent fuel (assuming they are light water reactors, the mostcommon design for most new projects). This also means theproduction of 350,000 kilograms of plutonium each year, enough tobuild 35,000 crude nuclear weapons.
Most of the expected electricity demand growth by 2050 will occurin non-OECD countries. This means that a large proportion of thenew reactors would need to be built in those countries in order tohave a global impact on emissions. At the moment, the list ofcountries with announced nuclear ambitions is long and worrying interms of their political situation and stability, especially with theneed to guarantee against the hazards of accidents andproliferation for many decades. The World Nuclear Associationlisted the Emerging Nuclear Energy Countries in May 2008 asAlbania, Belarus, Italy, Portugal, Turkey, Norway, Poland, Estonia,Latvia, Ireland, Iran, the Gulf states, Yemen, Israel, Syria, Jordan,Egypt, Tunisia, Libya, Algeria, Morocco, Azerbaijan, Georgia,Kazakhstan, Mongolia, Bangladesh, Indonesia, Philippines, Vietnam,Thailand, Malaysia, Australia, New Zealand, Chile, Venezuela,Nigeria, Ghana and Namibia.
slow: Climate science says that we need to reach a peak of globalgreenhouse gas emissions in 2015 and reduce them by 20 % in2020. Even in developed countries with an established nuclearinfrastructure it takes at least a decade from the decision to build areactor to the delivery of its first electricity, and often much longer.Out of 35 reactors officially listed as under construction by the IEAin mid-July 2008, one third had been in this category for two decadesor more, indicating that these projects are not progressing. Thismeans that even if the world’s governments decided to implementstrong nuclear expansion now, only a few reactors would startgenerating electricity before 2020. The contribution from nuclearpower towards reducing emissions would come too late to help.
3
nu
clear p
ow
er|
A S
OL
UT
ION
?
references8 ‘ENERGY TECHNOLOGY PERSPECTIVES 2008- SCENARIOS & STRATEGIES TO 2050’, IEA9 PLATTS, 2008; ENERGY BIZ, MAY/JUNE 200810 WALL STREET JOURNAL, 29 MAY 2008
© G
P/R
EY
NA
ER
S
image IRAQ 17 JUNE 2003. GREENPEACEACTIVISTS MAKE MEASURMENTSOUTSIDE THE AL-MAJIDAT SCHOOL FORGIRLS (900 PUPILS) NEXT TO AL-TOUWAITHA NUCLEAR FACILITY. HAVINGFOUND LEVELS OF RADIOACTIVITY 3,000TIMES HIGHER THAN BACKGROUNDLEVEL THEY CORDONNED THE AREA OFF.

25
nuclear power blocks solutions
Even if the ambitious nuclear scenario is implemented, regardlessof costs and hazards, the IEA concludes that the contribution ofnuclear power to reductions in greenhouse gas emissions from theenergy sector would be only 4.6 % - less than 3 % of the globaloverall reduction required.
There are other technologies that can deliver much larger emissionreductions, and much faster. Their investment costs are lower andthey do not create global security risks. Even the IEA finds that thecombined potential of efficiency savings and renewable energy to cutemissions by 2050 is more than ten times larger than that of nuclear.
The world has limited time, finance and industrial capacity to changeour energy sector and achieve a large reduction in greenhouseemissions. Choosing the pathway by spending $10 trillion on nucleardevelopment would be a fatally wrong decision. It would not save theclimate but it would necessarily take resources away from solutionsdescribed in this report and at the same time create serious globalsecurity hazards. Therefore new nuclear reactors are a clearlydangerous obstacle to the protection of the climate.
nuclear power in the energy [r]evolution scenario
For the reasons explained above, the Energy [R]evolution Scenarioenvisages a nuclear phase-out. Existing reactors would be closed atthe end of their average operational lifetime of 35 years. Weassume that no new construction is started after 2008 and onlytwo thirds of the reactors currently under construction will befinally put into operation.
the dangers of nuclear power
Although the generation of electricity through nuclear powerproduces much less carbon dioxide than fossil fuels, there aremultiple threats to people and the environment from its operations.The main risks are:
• Nuclear Proliferation
• Nuclear Waste
• Safety Risks
These are the background to why nuclear power has been discountedas a future technology in the Energy [R]evolution Scenario.
1. nuclear proliferation
Manufacturing a nuclear bomb requires fissile material - eitheruranium-235 or plutonium-239. Most nuclear reactors use uraniumas a fuel and produce plutonium during their operation. It isimpossible to adequately protect a large reprocessing plant toprevent the diversion of plutonium to nuclear weapons. A small-scale plutonium separation plant can be built in four to six months,so any country with an ordinary reactor can produce nuclearweapons relatively quickly.
The result is that nuclear power and nuclear weapons have grownup like Siamese twins. Since international controls on nuclearproliferation began, Israel, India, Pakistan and North Korea haveall obtained nuclear weapons, demonstrating the link between civiland military nuclear power. Both the International Atomic EnergyAgency (IAEA) and the Nuclear Non-proliferation Treaty (NPT)embody an inherent contradiction - seeking to promote thedevelopment of ‘peaceful’ nuclear power whilst at the same timetrying to stop the spread of nuclear weapons
Israel, India and Pakistan all used their civil nuclear operations todevelop weapons capability, operating outside internationalsafeguards. North Korea developed a nuclear weapon even as asignatory of the NPT. A major challenge to nuclear proliferationcontrols has been the spread of uranium enrichment technology toIran, Libya and North Korea. The Director General of theInternational Atomic Energy Agency, Mohamed ElBaradei, has saidthat “should a state with a fully developed fuel-cycle capabilitydecide, for whatever reason, to break away from its non-proliferation commitments, most experts believe it could produce anuclear weapon within a matter of months11.”
The United Nations Intergovernmental Panel on Climate Changehas also warned that the security threat of trying to tackle climatechange with a global fast reactor programme (using plutoniumfuel) “would be colossal"12. Even without fast reactors, all of thereactor designs currently being promoted around the world could befuelled by MOX (mixed oxide fuel), from which plutonium can beeasily separated.
Restricting the production of fissile material to a few ‘trusted’countries will not work. It will engender resentment and create acolossal security threat. A new UN agency is needed to tackle thetwin threats of climate change and nuclear proliferation by phasingout nuclear power and promoting sustainable energy, in the processpromoting world peace rather than threatening it.
3
nu
clear p
ow
er|
NU
CL
EA
R P
RO
LIF
ER
AT
ION
references11 MOHAMED ELBARADEI, ‘TOWARDS A SAFER WORLD’, ECONOMIST, 18 OCTOBER 200312 IPCC WORKING GROUP II, ‘IMPACTS, ADAPTATIONS AND MITIGATION OF CLIMATECHANGE: SCIENTIFIC-TECHNICAL ANALYSES’, 1995
© G
P/S
HIR
LE
Y
© H
AN
SE
N/D
RE
AM
STIM
E
image NUCLEAR REACTOR IN LIANYUNGANG, CHINA.
image CHERNOBYL NUCLEAR POWERSTATION, UKRAINE.

26
GLOBAL ENERGY [R]EVOLUTIONA SUSTAINABLE GLOBAL ENERGY OUTLOOK
3
nu
clear p
ow
er|
NU
CL
EA
R W
AS
TE
- SA
FE
TY
RIS
KS
2. nuclear waste
The nuclear industry claims it can ‘dispose’ of its nuclear waste byburying it deep underground, but this will not isolate the radioactivematerial from the environment forever. A deep dump only slowsdown the release of radioactivity into the environment. The industrytries to predict how fast a dump will leak so that it can claim thatradiation doses to the public living nearby in the future will be“acceptably low”. But scientific understanding is not sufficientlyadvanced to make such predictions with any certainty.
As part of its campaign to build new nuclear stations around theworld, the industry claims that problems associated with buryingnuclear waste are to do with public acceptability rather thantechnical issues. It points to nuclear dumping proposals in Finland,Sweden or the United States to underline its argument.
The most hazardous waste is the highly radioactive waste (or spent)fuel removed from nuclear reactors, which stays radioactive forhundreds of thousands of years. In some countries the situation isexacerbated by ‘reprocessing’ this spent fuel – which involves dissolvingit in nitric acid to separate out weapons-usable plutonium. This processleaves behind a highly radioactive liquid waste. There are about270,000 tonnes of spent nuclear waste fuel in storage, much of it atreactor sites. Spent fuel is accumulating at around 12,000 tonnes peryear, with around a quarter of that going for reprocessing13. Nocountry in the world has a solution for high level waste.
The IAEA recognises that, despite its international safetyrequirements, “…radiation doses to individuals in the future canonly be estimated and that the uncertainties associated with theseestimates will increase for times farther into the future.”
The least damaging option for waste already created at the currenttime is to store it above ground, in dry storage at the site of origin,although this option also presents major challenges and threats. Theonly real solution is to stop producing the waste.
3. safety risks
Windscale (1957), Three Mile Island (1979), Chernobyl (1986)and Tokaimura (1999) are only a few of the hundreds of nuclearaccidents which have occurred to date.
A simple power failure at a Swedish nuclear plant in 2006highlighted our vulnerability to nuclear catastrophe. Emergencypower systems at the Forsmark plant failed for 20 minutes during apower cut and four of Sweden’s 10 nuclear power stations had tobe shut down. If power was not restored there could have been amajor incident within hours. A former director of the Forsmarkplant later said that "it was pure luck there wasn’t a meltdown”.The closure of the plants removed at a stroke roughly 20% ofSweden’s electricity supply.
A nuclear chain reaction must be kept under control, and harmfulradiation must, as far as possible, be contained within the reactor,with radioactive products isolated from humans and carefullymanaged. Nuclear reactions generate high temperatures, and fluidsused for cooling are often kept under pressure. Together with theintense radioactivity, these high temperatures and pressures makeoperating a reactor a difficult and complex task.
The risks from operating reactors are increasing and the likelihoodof an accident is now higher than ever. Most of the world’s reactorsare more than 20 years old and therefore more prone to agerelated failures. Many utilities are attempting to extend their lifefrom the 40 years or so they were originally designed for to around60 years, posing new risks.
De-regulation has meanwhile pushed nuclear utilities to decreasesafety-related investments and limit staff whilst increasing reactorpressure and operational temperature and the burn-up of the fuel.This accelerates ageing and decreases safety margins.
New so-called passively safe reactors have many safety systemsreplaced by ‘natural’ processes, such as gravity fed emergencycooling water and air cooling. This can make them more vulnerableto terrorist attack.
“... reactors with gravity fed emergencycooling water and air cooling can makethem more vulnerable to terrorist attacks.”
references13 REFERENCE: WASTE MANAGEMENT IN THE NUCLEAR FUEL CYCLE, WORLD NUCLEARASSOCIATION, INFORMATION AND ISSUE BRIEF, FEBRUARY 2006. HTTP://WWW.WORLD-NUCLEAR.ORG/INFO/INF04.HTM

27
© G
P/H
IGU
CH
I
image FISHERMEN IN FRONT OF THEMIHAMA NUCLEAR POWER PLANT,JAPAN AFTER AN ACCIDENT AT THEPLANT IN 1991.
5. reprocessing
Reprocessing involves the chemicalextraction of contaminated uranium andplutonium from used reactor fuel rods.There are now over 230,000 kilogramsof plutonium stockpiled around theworld from reprocessing – fivekilograms is sufficient for one nuclearbomb. Reprocessing is not the same asrecycling: the volume of waste increasesmany tens of times and millions of litresof radioactive waste are discharged intothe sea and air each day. The processalso demands the transport ofradioactive material and nuclear wasteby ship, rail, air and road around theworld. An accident or terrorist attackcould release vast quantities of nuclearmaterial into the environment. There isno way to guarantee the safety ofnuclear transport.
6. waste storage
There is not a single finalstorage facility for nuclearwaste available anywhere in theworld. Safe secure storage ofhigh level waste over thousandsof years remains unproven,leaving a deadly legacy forfuture generations. Despite thisthe nuclear industry continuesto generate more and morewaste each day.
1. uranium mining
Uranium, used in nuclearpower plants, is extractedfrom huge mines in Canada,Australia, Russia andNigeria. Mine workers canbreathe in radioactive gasfrom which they are indanger of contracting lungcancer. Uranium miningproduces huge quantities ofmining debris, includingradioactive particles whichcan contaminate surfacewater and food.
2. uraniumenrichment
Natural uranium andconcentrated ‘yellow cake’contain just 0.7% offissionable uranium 235. To usethe material in a nuclearreactor, the share must go up to3 or 5 %. This process can becarried out in 16 facilitiesaround the world. 80% of thetotal volume is rejected as‘tails’, a waste product.Enrichment generates massiveamounts of ‘depleted uranium’that ends up as long-livedradioactive waste or is used inweapons or as tank shielding.
3. fuel rod –production
Enriched material is convertedinto uranium dioxide andcompressed to pellets in fuelrod production facilities. Thesepellets fill 4m long tubes calledfuel rods. There are 29 fuel rodproduction facilities globally.The worst accident in this typeof facility happened inSeptember 1999 in Tokaimura,Japan, when two workers died.Several hundred workers andvillagers have sufferedradioactive contamination.
4. power plant operation
Uranium nuclei are split in a nuclearreactor, releasing energy which heats upwater. The compressed steam isconverted in a turbine generator intoelectricity. This process creates aradioactive ‘cocktail’ which involvesmore than 100 products. One of these isthe highly toxic and long-lastingplutonium. Radioactive material canenter the environment through accidentsat nuclear power plants. The worstaccident to date happened at Chernobylin the then Soviet Union in 1986. Anuclear reactor generates enoughplutonium every year for the productionof as many as 39 nuclear weapons.
figure 3.1: the nuclear fuel cycle
U#923
nu
clear p
ow
er|
NU
CL
EA
R F
UE
L C
YC
LE

28
4the energy [r]evolution
GLOBAL KEY PRINCIPLESA DEVELOPMENT PATHWAYA DECENTRALISED ENERGY FUTURE
OPTIMISED INTEGRATION OF RENEWABLE ENERGY
FUTURE POWER GRIDSRURAL ELECTRIFICATION
“half the solution toclimate change is thesmart use of power.”GREENPEACE INTERNATIONALCLIMATE CAMPAIGN
4
DECOUPLE GROWTH FROM FOSSIL FUEL USE. ©
G. POR
OPA
T/D
RE
AM
ST
IME

29
The climate change imperative demands nothing short of an energyrevolution. The expert consensus is that this fundamental changemust begin very soon and be well underway within the next tenyears in order to avert the worst impacts. What we need is acomplete transformation in the way we produce, consume anddistribute energy and at the same time maintain economic growth.Nothing short of such a revolution will enable us to limit globalwarming to less than a rise in temperature of 2°C, above which theimpacts become devastating.
Current electricity generation relies mainly on burning fossil fuels,with their associated CO2 emissions, in very large power stationswhich waste much of their primary input energy. More energy islost as the power is moved around the electricity grid network andconverted from high transmission voltage down to a supply suitablefor domestic or commercial consumers. The system is innatelyvulnerable to disruption: localised technical, weather-related or evendeliberately caused faults can quickly cascade, resulting inwidespread blackouts. Whichever technology is used to generateelectricity within this old fashioned configuration, it will inevitablybe subject to some, or all, of these problems. At the core of theEnergy [R]evolution there therefore needs to be a change in theway that energy is both produced and distributed.
key principles
the energy [r]evolution can be achieved by adhering to five key principles:
1.respect natural limits – phase out fossil fuels by the end ofthis century We must learn to respect natural limits. There is onlyso much carbon that the atmosphere can absorb. Each year weemit over 25 billion tonnes of carbon equivalent; we are literallyfilling up the sky. Geological resources of coal could provideseveral hundred years of fuel, but we cannot burn them and keepwithin safe limits. Oil and coal development must be ended.
The Energy [R]evolution Scenario has a target to reduce energyrelated CO2 emissions to a maximum of 10 Gt (Giga tonnes) by2050 and phase out fossil fuels by 2085.
2.equity and fairness As long as there are natural limits thereneeds to be a fair distribution of benefits and costs withinsocieties, between nations and between present and futuregenerations. At one extreme, a third of the world’s population hasno access to electricity, whilst the most industrialised countriesconsume much more than their fair share.
The effects of climate change on the poorest communities areexacerbated by massive global energy inequality. If we are toaddress climate change, one of the principles must be equity andfairness, so that the benefits of energy services – such as light,heat, power and transport – are available for all: north andsouth, rich and poor. Only in this way can we create true energysecurity, as well as the conditions for genuine human wellbeing.
The Energy [R]evolution Scenario has a target to achieve energyequity as soon as technically possible. By 2050 the average percapita emission should be between 1 and 2 tonnes of CO2.
3.implement clean, renewable solutions and decentraliseenergy systems There is no energy shortage. All we need to do isuse existing technologies to harness energy effectively andefficiently. Renewable energy and energy efficiency measures areready, viable and increasingly competitive. Wind, solar and otherrenewable energy technologies have experienced double digitmarket growth for the past decade.
Just as climate change is real, so is the renewable energy sector.Sustainable decentralised energy systems produce less carbonemissions, are cheaper and involve less dependence on importedfuel. They create more jobs and empower local communities.Decentralised systems are more secure and more efficient. This iswhat the Energy [R]evolution must aim to create.
To stop the Earth’s climate spinning out of control, most of the world’sfossil fuel reserves – coal, oil and gas – must remain in the ground. Ourgoal is for humans to live within the natural limits of our small planet.
4.decouple growth from fossil fuel use Starting in the developedcountries, economic growth must fully decouple from fossil fuels.It is a fallacy to suggest that economic growth must bepredicated on their increased combustion.
We need to use the energy we produce much more efficiently, and weneed to make the transition to renewable energy – away from fossilfuels – quickly in order to enable clean and sustainable growth.
5.phase out dirty, unsustainable energy We need to phase out coaland nuclear power. We cannot continue to build coal plants at a timewhen emissions pose a real and present danger to both ecosystemsand people. And we cannot continue to fuel the myriad nuclear threatsby pretending nuclear power can in any way help to combat climatechange. There is no role for nuclear power in the Energy [R]evolution.
from principles to practice
In 2005, renewable energy sources accounted for 13% of theworld’s primary energy demand. Biomass, which is mostly used forheating, is the main renewable energy source. The share ofrenewable energy in electricity generation was 18%. Thecontribution of renewables to primary energy demand for heatsupply was around 24%. About 80% of primary energy supplytoday still comes from fossil fuels, and 6% from nuclear power14.
The time is right to make substantial structural changes in theenergy and power sector within the next decade. Many power plantsin industrialised countries, such as the USA, Japan and theEuropean Union, are nearing retirement; more than half of alloperating power plants are over 20 years old. At the same timedeveloping countries, such as China, India and Brazil, are looking tosatisfy the growing energy demand created by expanding economies.
4
the en
ergy [r]evo
lutio
n|
KE
Y P
RIN
CIP
LE
S - F
RO
M P
RIN
CIP
LE
S T
O P
RA
CT
ISE
“THE STONE AGE DID NOT END FOR LACK OF STONE, AND THE OIL
AGE WILL END LONG BEFORE THE WORLD RUNS OUT OF OIL.”
Sheikh Zaki Yamani, former Saudi Arabian oil minister
references14 ‘ENERGY BALANCE OF NON-OECD COUNTRIES’ AND ‘ENERGY BALANCE OF OECDCOUNTRIES’, IEA, 2007
© O
WE
/GP
image ICE AND WATER IN THE NORTH POLE.GREENPEACE EXPLORERS, LONNIE DUPRE AND ERICLARSEN MAKE HISTORY AS THEY BECOME THE FIRST-EVER TO COMPLETE A TREK TO THE NORTH POLE INSUMMER. THE DUO UNDERTAKE THE EXPEDITION TOBRING ATTENTION TO THE PLIGHT OF THE POLAR BEARWHICH SCIENTISTS CLAIM COULD BE EXTINCT AS EARLYAS 2050 DUE TO THE EFFECTS OF GLOBAL WARMING.

30
GLOBAL ENERGY [R]EVOLUTIONA SUSTAINABLE GLOBAL ENERGY OUTLOOK
Within the next ten years, the power sector will decide how this newdemand will be met, either by fossil and nuclear fuels or by theefficient use of renewable energy. The Energy [R]evolution Scenariois based on a new political framework in favour of renewableenergy and cogeneration combined with energy efficiency.
To make this happen both renewable energy and cogeneration – ona large scale and through decentralised, smaller units – have togrow faster than overall global energy demand. Both approachesmust replace old generating technologies and deliver the additionalenergy required in the developing world.
As it is not possible to switch directly from the current large scale fossiland nuclear fuel based energy system to a full renewable energy supply,a transition phase is required to build up the necessary infrastructure.Whilst remaining firmly committed to the promotion of renewablesources of energy, we appreciate that gas, used in appropriately scaledcogeneration plant, is valuable as a transition fuel, and able to drivecost-effective decentralisation of the energy infrastructure. With warmersummers, tri-generation, which incorporates heat-fired absorptionchillers to deliver cooling capacity in addition to heat and power, willbecome a particularly valuable means to achieve emissions reductions.
a development pathway
The Energy [R]evolution envisages a development pathway whichturns the present energy supply structure into a sustainable system.There are two main stages to this.
step 1: energy efficiency The Energy [R]evolution is aimed at theambitious exploitation of the potential for energy efficiency. Itfocuses on current best practice and technologies which willbecome available in the future, assuming continuous innovation. Theenergy savings are fairly equally distributed over the three sectors –industry, transport and domestic/business. Intelligent use, notabstinence, is the basic philosophy for future energy conservation.
The most important energy saving options are improved heatinsulation and building design, super efficient electrical machines anddrives, replacement of old style electrical heating systems byrenewable heat production (such as solar collectors) and a reductionin energy consumption by vehicles used for goods and passengertraffic. Industrialised countries, which currently use energy in the mostinefficient way, can reduce their consumption drastically without theloss of either housing comfort or information and entertainmentelectronics. The Energy [R]evolution Scenario uses energy saved inOECD countries as a compensation for the increasing powerrequirements in developing countries. The ultimate goal is stabilisationof global energy consumption within the next two decades. At thesame time the aim is to create “energy equity” – shifting the currentone-sided waste of energy in the industrialised countries towards afairer worldwide distribution of efficiently used supply.
A dramatic reduction in primary energy demand compared to theIEA’s “Reference Scenario” (see Chapter 6) – but with the sameGDP and population development - is a crucial prerequisite forachieving a significant share of renewable energy sources in theoverall energy supply system, compensating for the phasing out ofnuclear energy and reducing the consumption of fossil fuels.
step 2: structural changes
decentralised energy and large scale renewables In order toachieve higher fuel efficiencies and reduce distribution losses, theEnergy [R]evolution Scenario makes extensive use of DecentralisedEnergy (DE).This is energy generated at or near the point of use.
DE is connected to a local distribution network system, supplyinghomes and offices, rather than the high voltage transmissionsystem. The proximity of electricity generating plant to consumersallows any waste heat from combustion processes to be piped tobuildings nearby, a system known as cogeneration or combined heatand power. This means that nearly all the input energy is put to use,not just a fraction as with traditional centralised fossil fuel plant.
DE also includes stand-alone systems entirely separate from thepublic networks, for example heat pumps, solar thermal panels orbiomass heating. These can all be commercialised at a domesticlevel to provide sustainable low emission heating. Although DEtechnologies can be considered ‘disruptive’ because they do not fitthe existing electricity market and system, with appropriate changesthey have the potential for exponential growth, promising ‘creativedestruction’ of the existing energy sector.
A huge proportion of global energy in 2050 will be produced bydecentralised energy sources, although large scale renewable energysupply will still be needed in order to achieve a fast transition to arenewables dominated system. Large offshore wind farms andconcentrating solar power (CSP) plants in the sunbelt regions ofthe world will therefore have an important role to play.
cogeneration The increased use of combined heat and powergeneration (CHP) will improve the supply system’s energyconversion efficiency, whether using natural gas or biomass. In thelonger term, decreasing demand for heat and the large potential forproducing heat directly from renewable energy sources will limit thefurther expansion of CHP.
renewable electricity The electricity sector will be the pioneer ofrenewable energy utilisation. All renewable electricity technologieshave been experiencing steady growth over the past 20 to 30 yearsof up to 35% annually and are expected to consolidate at a highlevel between 2030 and 2050. By 2050, the majority of electricitywill be produced from renewable energy sources. Expected growthof electricity use in transport will further promote the effective useof renewable power generation technologies.
renewable heating In the heat supply sector, the contribution ofrenewables will increase significantly. Growth rates are expected tobe similar to those of the renewable electricity sector. Fossil fuelswill be increasingly replaced by more efficient modern technologies,in particular biomass, solar collectors and geothermal. By 2050,renewable energy technologies will satisfy the major part of heatingand cooling demand.
4
the en
ergy [r]evo
lutio
n|
DE
VE
LO
PM
EN
T P
AT
HW
AY

31
transport Before new technologies such as hybrid or electric carsor new fuels such as bio fuels can play a substantial role in thetransport sector, the existing large efficiency potentials have to beexploited. In this study, biomass is primarily committed tostationary applications; the use of bio fuels for transport is limitedby the availability of sustainably grown biomass15. Electric vehicleswill therefore play an even more important role in improving energyefficiency in transport and substituting for fossil fuels.
Overall, to achieve an economically attractive growth in renewableenergy sources, a balanced and timely mobilisation of alltechnologies is essential. Such a mobilisation depends on theresource availability, cost reduction potential and technologicalmaturity. Besides technology driven solutions, lifestyle changes -like simply driving less and using more public transport – have ahuge potential to reduce greenhouse gas emissions.
4
the en
ergy [r]evo
lutio
n|
DE
VE
LO
PM
EN
T P
AT
HW
AY
1. PHOTOVOLTAIC, SOLAR FASCADE WILL BE A DECORATIVEELEMENT ON OFFICE AND APARTMENT BUILDINGS.PHOTOVOLTAIC SYSTEMS WILL BECOME MORE COMPETITIVEAND IMPROVED DESIGN WILL ENABLE ARCHITECTS TO USETHEM MORE WIDELY.
2. RENOVATION CAN CUT ENERGY CONSUMPTION OF OLD BUILDINGSBY AS MUCH AS 80% - WITH IMPROVED HEAT INSULATION,INSULATED WINDOWS AND MODERN VENTILATION SYSTEMS.
3. SOLAR THERMAL COLLECTORS PRODUCE HOT WATER FOR BOTHTHEIR OWN AND NEIGHBOURING BUILDINGS.
4. EFFICIENT THERMAL POWER (CHP) STATIONS WILL COME IN AVARIETY OF SIZES - FITTING THE CELLAR OF A DETACHEDHOUSE OR SUPPLYING WHOLE BUILDING COMPLEXES ORAPARTMENT BLOCKS WITH POWER AND WARMTH WITHOUTLOSSES IN TRANSMISSION.
5. CLEAN ELECTRICITY FOR THE CITIES WILL ALSO COME FROMFARTHER AFIELD. OFFSHORE WIND PARKS AND SOLAR POWERSTATIONS IN DESERTS HAVE ENORMOUS POTENTIAL.
city
figure 4.1: a decentralised energy futureEXISTING TECHNOLOGIES, APPLIED IN A DECENTRALISED WAY AND COMBINED WITH EFFICIENCY MEASURES AND ZERO EMISSION DEVELOPMENTS, CAN
DELIVER LOW CARBON COMMUNITIES AS ILLUSTRATED HERE. POWER IS GENERATED USING EFFICIENT COGENERATION TECHNOLOGIES PRODUCING BOTH HEAT
(AND SOMETIMES COOLING) PLUS ELECTRICITY, DISTRIBUTED VIA LOCAL NETWORKS. THIS SUPPLEMENTS THE ENERGY PRODUCED FROM BUILDING INTEGRATED
GENERATION. ENERGY SOLUTIONS COME FROM LOCAL OPPORTUNITIES AT BOTH A SMALL AND COMMUNITY SCALE. THE TOWN SHOWN HERE MAKES USE OF –
AMONG OTHERS – WIND, BIOMASS AND HYDRO RESOURCES. NATURAL GAS, WHERE NEEDED, CAN BE DEPLOYED IN A HIGHLY EFFICIENT MANNER.
© D
RE
AM
STIM
E
references15 SEE CHAPTER 13
© L
AN
GR
OCK
/ZE
NIT
/GP
image A COW INFRONT OF ABIOREACTOR IN THE BIOENERGYVILLAGE OF JUEHNDE. IT IS THE FIRSTCOMMUNITY IN GERMANY THATPRODUCES ALL OF ITS ENERGY NEEDEDFOR HEATING AND ELECTRICITY, WITHCO2 NEUTRAL BIOMASS.

32
GLOBAL ENERGY [R]EVOLUTIONA SUSTAINABLE GLOBAL ENERGY OUTLOOK
optimised integration of renewable energy
Modification of the energy system will be necessary toaccommodate the significantly higher shares of renewable energyexpected under the Energy [R]evolution Scenario. This is not unlikewhat happened in the 1970s and 1980s, when most of thecentralised power plants now operating were constructed in OECDcountries. New high voltage power lines were built, night storageheaters marketed and large electric-powered hot water boilersinstalled in order to sell the electricity produced by nuclear andcoal-fired plants at night.
Several OECD countries have demonstrated that it is possible tosmoothly integrate a large proportion of decentralised energy,including variable sources such as wind. A good example isDenmark, which has the highest percentage of combined heat andpower generation and wind power in Europe. With strong politicalsupport, 50% of electricity and 80% of district heat is nowsupplied by cogeneration plants. The contribution of wind power hasreached more than 18% of Danish electricity demand. At certaintimes, electricity generation from cogeneration and wind turbineseven exceeds demand. The load compensation required for gridstability in Denmark is managed both through regulating thecapacity of the few large power stations and through import andexport to neighbouring countries. A three tier tariff system enablesbalancing of power generation from the decentralised power plantswith electricity consumption on a daily basis.
It is important to optimise the energy system as a whole throughintelligent management by both producers and consumers, by anappropriate mix of power stations and through new systems forstoring electricity.
appropriate power station mix: The power supply in OECDcountries is mostly generated by coal and – in some cases – nuclearpower stations, which are difficult to regulate. Modern gas powerstations, by contrast, are not only highly efficient but easier andfaster to regulate and thus better able to compensate forfluctuating loads. Coal and nuclear power stations have lower fueland operating costs but comparably high investment costs. Theymust therefore run round-the-clock as ‘base load’ in order to earnback their investment. Gas power stations have lower investmentcosts and are profitable even at low output, making them bettersuited to balancing out the variations in supply from renewableenergy sources.
load management: The level and timing of demand for electricitycan be managed by providing consumers with financial incentives toreduce or shut off their supply at periods of peak consumption.Control technology can be used to manage the arrangement. Thissystem is already used for some large industrial customers. ANorwegian power supplier even involves private household customersby sending them a text message with a signal to shut down. Eachhousehold can decide in advance whether or not they want toparticipate. In Germany, experiments are being conducted with timeflexible tariffs so that washing machines operate at night andrefrigerators turn off temporarily during periods of high demand.
This type of load management has been simplified by advances incommunications technology. In Italy, for example, 30 millioninnovative electricity counters have been installed to allow remotemeter reading and control of consumer and service information.Many household electrical products or systems, such asrefrigerators, dishwashers, washing machines, storage heaters, waterpumps and air conditioning, can be managed either by temporaryshut-off or by rescheduling their time of operation, thus freeing upelectricity load for other uses.
4
the en
ergy [r]evo
lutio
n|
OP
TIM
ISE
D IN
TE
GR
AT
ION
OF
RE
NE
WA
BL
E E
NE
RG
Y
© D
RE
AM
STIM
E
figure 4.2: centralised energy infrastructures waste more than two thirds of their energy
© D
RE
AM
STIM
E
100 units >>ENERGY WITHIN FOSSIL FUEL
61.5 units LOST THROUGH INEFFICIENT
GENERATION AND HEAT WASTAGE
3.5 units LOST THROUGH TRANSMISSION
AND DISTRIBUTION
13 units WASTED THROUGH
INEFFICIENT END USE
38.5 units >>OF ENERGY FED TO NATIONAL GRID
35 units >>OF ENERGY SUPPLIED
22 unitsOF ENERGY
ACTUALLY UTILISED

33
generation management: Renewable electricity generationsystems can also be involved in load optimisation. Wind farms, forexample, can be temporarily switched off when too much power isavailable on the network.
energy storage: Another method of balancing out electricity supplyand demand is through intermediate storage. This storage can bedecentralised, for example by the use of batteries, or centralised. Sofar, pumped storage hydropower stations have been the mainmethod of storing large amounts of electric power. In a pumpedstorage system, energy from power generation is stored in a lakeand then allowed to flow back when required, driving turbines andgenerating electricity. 280 such pumped storage plants existworldwide. They already provide an important contribution tosecurity of supply, but their operation could be better adjusted tothe requirements of a future renewable energy system.
In the long term, other storage solutions are beginning to emerge.One promising solution besides the use of hydrogen is the use ofcompressed air. In these systems, electricity is used to compress airinto deep salt domes 600 metres underground and at pressures ofup to 70 bar. At peak times, when electricity demand is high, the airis allowed to flow back out of the cavern and drive a turbine.Although this system, known as CAES (Compressed Air EnergyStorage) currently still requires fossil fuel auxiliary power, a so-called “adiabatic” plant is being developed which does not. Toachieve this, the heat from the compressed air is intermediatelystored in a giant heat store. Such a power station can achieve astorage efficiency of 70%.
The forecasting of renewable electricity generation is alsocontinually improving. Regulating supply is particularly expensivewhen it has to be found at short notice. However, predictiontechniques for wind power generation have become considerablymore accurate in recent years and are still being improved. Thedemand for balancing supply will therefore decrease in the future.
the “virtual power station” 16
The rapid development of information technologies is helping topave the way for a decentralised energy supply based oncogeneration plants, renewable energy systems and conventionalpower stations. Manufacturers of small cogeneration plants alreadyoffer internet interfaces which enable remote control of the system.It is now possible for individual householders to control theirelectricity and heat usage so that expensive electricity drawn fromthe grid can be minimised – and the electricity demand profile issmoothed. This is part of the trend towards the ‘smart house’ whereits mini cogeneration plant becomes an energy management centre.We can go one step further than this with a ‘virtual power station’.Virtual does not mean that the power station does not produce realelectricity. It refers to the fact that there is no large, spatiallylocated power station with turbines and generators. The hub of thevirtual power station is a control unit which processes data frommany decentralised power stations, compares them with predictionsof power demand, generation and weather conditions, retrieves theavailable power market prices and then intelligently optimises theoverall power station activity. Some public utilities already use suchsystems, integrating cogeneration plants, wind farms, photovoltaicsystems and other power plants. The virtual power station can alsolink consumers into the management process.
4
the en
ergy [r]evo
lutio
n|
TH
E “
VIR
TU
AL
PO
WE
R S
TA
TIO
N”
“it is important to optimise the energysystem as a whole through intelligentmanagement by both producers and consumers...”
references16 ‘RENEWABLE ENERGIES - INNOVATIONS FOR THE FUTURE’, GERMAN MINISTRY FORTHE ENVIRONMENT, NATURE CONSERVATION AND NUCLEAR SAFETY (BMU), 2006
A©
GP
/SIM
AN
JUN
TAK
image GREENPEACE DONATES A SOLAR POWERSYSTEM TO A COASTAL VILLAGE IN ACEH, INDONESIA,ONE OF THE WORST HIT AREAS BY THE TSUNAMI INDECEMBER 2004. IN COOPERATION WITH UPLINK, ALOCAL DEVELOPMENT NGO, GREENPEACE OFFERED ITSEXPERTISE ON ENERGY EFFICIENCY AND RENEWABLEENERGY AND INSTALLED RENEWABLE ENERGYGENERATORS FOR ONE OF THE BADLY HIT VILLAGES BY THE TSUNAMI.

34
GLOBAL ENERGY [R]EVOLUTIONA SUSTAINABLE GLOBAL ENERGY OUTLOOK
future power grids
The power grid network must also change in order to realisedecentralised structures with a high share of renewable energy.Today’s grids are designed to transport power from a fewcentralised power stations out to the passive consumers. A futuresystem must enable an active integration of consumers anddecentralised power generators and thus realise real time two-waypower and information flows. Large power stations will feedelectricity into the high voltage grid but small decentralised systemssuch as solar, cogeneration and wind plants will deliver their powerinto the low or medium voltage grid. In order to transportelectricity from renewable generation such as offshore wind farmsin remote areas (see box), a limited number of new high voltagetransmission lines will need to be constructed. These power lines willalso be available for cross-border power trade. Within the Energy[R]evolution Scenario, the share of variable renewable energysources is expected to reach about 10% of total electricitygeneration by 2020 and about 35% by 2050.
A new Greenpeace report shows how a regionally integratedapproach to the large-scale development of offshore wind in theNorth Sea could deliver reliable clean energy for millions of homes.The ‘North Sea Electricity Grid [R]evolution’ report (September2008) calls for the creation of an offshore network to enable thesmooth flow of electricity generated from renewable energy sourcesinto the power systems of seven different countries - the UnitedKingdom, France, Germany, Belgium, The Netherlands, Denmarkand Norway – at the same time enabling significant emissionssavings. The cost of developing the grid is expected to be between€15 and 20 billion. This investment would not only allow the broadintegration of renewable energy but also unlock unprecedentedpower trading opportunities and cost efficiency. In a recentexample, a new 600 kilometre-long power line between Norway andthe Netherlands cost €600 million to build, but is alreadygenerating a daily cross-border trade valued at €800,000.
The grid would enable the efficient integration of renewable energyinto the power system across the whole North Sea region. Byaggregating power generation from wind farms spread across thewhole area, periods of very low or very high power flows would bereduced to a negligible amount. A dip in wind power generation inone area would be ‘balanced’ by higher production in another area,even hundreds of kilometres away. Over a year, an installed offshorewind power capacity of 68.4 GW in the North Sea would be able togenerate an estimated 247 TWh of electricity.
An offshore grid in the North Sea would also allow, for example, theimport of electricity from hydro power generation in Norway to theBritish and UCTE (Central European) network. This could replacethermal baseload plants and increase flexibility within a portfolio. Inaddition, increased liquidity and trading facilities on the Europeanpower markets will allow for a more efficient portfolio management.The value of such an offshore therefore lies in its contribution toincreased security of supply, its function in aggregating the dispatchof power from offshore wind farms and its role as a facilitator forpower exchange and trade between regions and power systems.
4
the en
ergy [r]evo
lutio
n|
FU
TU
RE
PO
WE
R G
RID
S
case 1: a north sea electricity grid
“a future system must enable an activeintegration of consumers anddecentralised power generators...”

35
4
the
energ
y[r]evo
lutio
n|FUTUREPOWERGRIDS
UNITED KINGDOM
BELGIUM
NETHERLANDS
GERMANY
NORWAY
DENMARK
FRANCE
north sea
0 50 10025KILOMETERS
figure 4.3: offshore grid topology proposal and offshore wind power installed capacity scenario
[MW] [TWh]BELGIUM 3,850 13.1DENMARK 1,580 5.6FRANCE 1,000 3.4GERMANY 26,420 97.5UNITED KINGDOM 22,240 80.8NETHERLANDS 12,040 41.7NORWAY 1,290 4.9TOTAL 68,420 247
INSTALLED ANDPLANNED CAPACITY[MW]
GRID: PROPOSED ORDISCUSSED IN THEPUBLIC DOMAIN
GRID: IN OPERATION ORPLANNING
PRINCIPLE HVDCSUBSTATIONS
WIND FARMS:INSTALLED PLANNEDCAPACITY < 1000 MW
WIND FARMS:INSTALLED PLANNEDCAPACITY > 1000 MW
LEGEND
Wind energy is booming in theEU. In 2007 alone, no less than8550MW of wind turbines wereinstalled in the EU, which is40% of all newly-installedcapacity. By 2020–2030, offshorewind energy in the North Seacould grow to 68,000MW andsupply 13 per cent of all currentelectricity production of sevenNorth Sea countries. In order tointegrate the electricity from theoffshore wind farms, an offshoregrid will be required. Greenpeacedemands that the governmentsof these seven countries and theEuropean Commission cooperateto make this happen.
www.greenpeace.be
* MAP IS INDICATIVE. NO ENVIRONMENTAL IMPACT ASSESSMENT OF LOCATIONS AND SITING OF WINDFARMS AND CABLES HAS BEEN DONE.
©LANGROCK/ZENIT/GP
©LANGROCK/ZENIT/GP
image OFFSHORE WINDFARM,MIDDELGRUNDEN, COPENHAGEN,DENMARK.
image CONSTRUCTION OFWIND TURBINES.

© G
P/M
AR
KE
L R
ED
ON
DO
image THE PS10 CONCENTRATING SOLAR TOWER PLANT USES 624 LARGE MOVABLE MIRRORS CALLED HELIOSTATS. THE MIRRORS CONCENTRATE THE SUN’S RAYS TO THE TOP OF A 115METER (377 FOOT) HIGH TOWER WHERE A SOLAR RECEIVER AND A STEAM TURBINE ARE LOCATED. THE TURBINE DRIVES A GENERATOR, PRODUCING ELECTRICITY, SEVILLA, SPAIN.
36
GLOBAL ENERGY [R]EVOLUTIONA SUSTAINABLE GLOBAL ENERGY OUTLOOK
Improving health and reducing death rates will not happen withoutenergy for the refrigeration needed for clinics, hospitals and vaccinationcampaigns. The world’s greatest child killer, acute respiratory infection,will not be tackled without dealing with smoke from cooking fires in thehome. Children will not study at night without light in their homes. Cleanwater will not be pumped or treated without energy.
The UN Commission on Sustainable Development argues that “toimplement the goal accepted by the international community ofhalving the proportion of people living on less than US $1 per dayby 2015, access to affordable energy services is a prerequisite”.
the role of sustainable, clean renewable energy
To achieve the dramatic emissions cuts needed to avoid climatechange – in the order of 80% in OECD countries by 2050 – willrequire a massive uptake of renewable energy. The targets forrenewable energy must be greatly expanded in industrialisedcountries both to substitute for fossil fuel and nuclear generationand to create the necessary economies of scale necessary for globalexpansion. Within the Energy [R]evolution Scenario we assume thatmodern renewable energy sources, such as solar collectors, solarcookers and modern forms of bio energy, will replace inefficient,traditional biomass use.
4
the en
ergy [r]evo
lutio
n|
RU
RA
L E
LE
CT
RIF
ICA
TIO
N - R
OL
E
rural electrification17
Energy is central to reducing poverty, providing major benefits inthe areas of health, literacy and equity. More than a quarter of theworld’s population has no access to modern energy services. In sub-Saharan Africa, 80% of people have no electricity supply. Forcooking and heating, they depend almost exclusively on burningbiomass – wood, charcoal and dung.
Poor people spend up to a third of their income on energy, mostlyto cook food. Women in particular devote a considerable amount oftime to collecting, processing and using traditional fuel for cooking.In India, two to seven hours each day can be devoted to thecollection of cooking fuel. This is time that could be spent on childcare, education or income generation. The World HealthOrganisation estimates that 2.5 million women and young childrenin developing countries die prematurely each year from breathingthe fumes from indoor biomass stoves.
The Millennium Development Goal of halving global poverty by 2015 willnot be reached without adequate energy to increase production, incomeand education, create jobs and reduce the daily grind involved in having tojust survive. Halving hunger will not come about without energy for moreproductive growing, harvesting, processing and marketing of food.
scenario principles in a nutshell
• Smart consumption, generation and distribution
• Energy production moves closer to the consumer
• Maximum use of locally available, environmentally friendly fuels
references17 ‘SUSTAINABLE ENERGY FOR POVERTY REDUCTION: AN ACTION PLAN’, ITPOWER/GREENPEACE INTERNATIONAL, 2002

37
5scenarios for a future energy supply
GLOBAL ENERGY EFFICIENCY STUDYTHE FUTURE FOR CARSTHE GLOBAL POTENTIAL FORSUSTAINABLE BIO ENERGYMAIN SCENARIO ASSUMPTIONS
WORLD REGIONSECONOMIC GROWTHFOSSIL FUEL & BIOMASS PRICEPROJECTIONS
COST OF CO2 EMISSIONSPOWER PLANT INVESTMENT COSTS
“towards a sustainable globalenergy supply system.”GREENPEACE INTERNATIONALCLIMATE CAMPAIGN
5
image WIND TURBINE IN SAMUT SAKHON, THAILAND. ©
GP/VINAI DITHAJOHN

38
GLOBAL ENERGY [R]EVOLUTIONA SUSTAINABLE GLOBAL ENERGY OUTLOOK
Moving from principles to action on energy supply and climatechange mitigation requires a long-term perspective. Energyinfrastructure takes time to build up; new energy technologies taketime to develop. Policy shifts often also need many years to have aneffect. Any analysis that seeks to tackle energy and environmentalissues therefore needs to look ahead at least half a century.
Scenarios are important in describing possible development paths,to give decision-makers an overview of future perspectives and toindicate how far they can shape the future energy system. Twodifferent scenarios are used here to characterise the wide range ofpossible paths for the future energy supply system: a ReferenceScenario, reflecting a continuation of current trends and policies,and the Energy [R]evolution Scenario, which is designed to achievea set of dedicated environmental policy targets.
The reference scenario is based on the Reference Scenariopublished by the International Energy Agency in World EnergyOutlook 2007 (WEO 2007)18. This only takes existing internationalenergy and environmental policies into account. The assumptionsinclude, for example, continuing progress in electricity and gasmarket reforms, the liberalisation of cross-border energy trade andrecent policies designed to combat environmental pollution. TheReference Scenario does not include additional policies to reducegreenhouse gas emissions. As the IEA’s scenario only covers a timehorizon up to 2030, it has been extended by extrapolating its keymacroeconomic indicators. This provides a baseline for comparisonwith the Energy [R]evolution Scenario.
The energy [r]evolution scenario has a key target for thereduction of worldwide carbon dioxide emissions down to a level ofaround 10 Gigatonnes per year by 2050 in order for the increase inglobal temperature to remain under +2°C. A second objective is theglobal phasing out of nuclear energy. To achieve these targets, thescenario is characterised by significant efforts to fully exploit thelarge potential for energy efficiency. At the same time, all cost-effective renewable energy sources are used for heat and electricitygeneration as well as the production of bio fuels. The generalframework parameters for population and GDP growth remainunchanged from the Reference Scenario.
These scenarios by no means claim to predict the future; theysimply describe two potential development paths out of the broadrange of possible ‘futures’. The Energy [R]evolution Scenario isdesigned to indicate the efforts and actions required to achieve itsambitious objectives and to illustrate the options we have at handto change our energy supply system into one that is sustainable.
scenario background The scenarios in this report were jointlycommissioned by Greenpeace and the European Renewable EnergyCouncil from the Institute of Technical Thermodynamics, part of theGerman Aerospace Center (DLR). The supply scenarios werecalculated using the MESAP/PlaNet simulation model used for theprevious Energy [R]evolution study19. Energy demand projectionswere developed by Ecofys Netherlands, based on an analysis of thefuture potential for energy efficiency measures. The biomasspotential, using Greenpeace sustainability criteria, has beendeveloped especially for this scenario by the German BiomassResearch Centre. The future development pathway for cartechnologies is based on a special report produced in 2008 by theInstitute of Vehicle Concepts, DLR for Greenpeace International.
energy efficiency study
The aim of the Ecofys study was to develop a low energy demandscenario for the period 2005 to 2050 for the IEA regions asdefined in the World Energy Outlook report series. Calculationswere made for each decade from 2010 onwards. Energy demandwas split up into electricity and fuels. The sectors which were takeninto account were industry, transport and other consumers,including households and services.
Under the low energy demand scenario, worldwide final energydemand is reduced by 38% in 2050 in comparison to the ReferenceScenario, resulting in a final energy demand of 350 EJ(ExaJoules). The energy savings are fairly equally distributed overthe three sectors of industry, transport and other uses. The mostimportant energy saving options are efficient passenger and freighttransport and improved heat insulation and building design. Chapter11 provides more details about this study.
5
scena
rios fo
r a fu
ture en
ergy su
pp
ly|
BA
CK
GR
OU
ND
“moving from principles to action..”
references18 INTERNATIONAL ENERGY AGENCY, ‘WORLD ENERGY OUTLOOK 2007’, 2007 19 ‘ENERGY [R]EVOLUTION: A SUSTAINABLE WORLD ENERGY OUTLOOK’, GREENPEACEINTERNATIONAL, 2007

39
By 2050, 60% of the final energy used in transport will still comefrom fossil sources, mainly gasoline and diesel. Renewableelectricity will cover 25%, bio fuels 13% and hydrogen 2%. Totalenergy consumption in 2050 will be similar to the consumption in2005, however, in spite of enormous increases in fuel use in someregions of the world.
The peak in global CO2 emissions from transport occurs between2010 and 2015. From 2010 onwards, new legislation in the US andEurope will contribute to breaking the upwards trend in emissions.From 2020, the effect of introducing grid-connected electric cars canbe clearly seen. Chapter 13 provides more details about this report.
the global potential for sustainable bio energy
As part of the Energy [R]evolution Scenario, Greenpeacecommissioned the German Biomass Research Centre (the formerInstitute for Energy and Environment) to look at the worldwidepotential for energy crops up to 2050. A summary of this reportcan be found in Chapter 8.
5
scena
rios fo
r a fu
ture en
ergy su
pp
ly|
FU
TU
RE
OF
CA
RS
- GL
OB
AL
PO
TE
NT
IAL
the future for cars
The Institute of Vehicle Concepts in Stuttgart, Germany hasdeveloped a global scenario for cars covering ten world regions. Theaim was to produce a demanding but feasible scenario to lowerglobal car CO2 emissions within the context of the overall objectivesof this report. The approach takes into account a vast range oftechnical measures to reduce the energy consumption of vehicles,but also considers the dramatic increase in vehicle ownership andannual mileage taking place in developing countries. The majorparameters are vehicle technology, alternative fuels, changes insales of different vehicle sizes (segment split) and changes invehicle kilometres travelled (modal split).
The scenario assumes that a large share of renewable electricitywill be available in the future. A combination of ambitious effortstowards higher efficiency in vehicle technologies, a major switch togrid-connected electric vehicles and incentives for vehicle users tosave carbon dioxide lead to the conclusion that it is possible toreduce CO2 emissions from ‘well-to-wheel’ in 2050 by roughly25%20 compared to 1990 and 40% compared to 2005.
references20 THERE IS NO RELIABLE NUMBER AVAILABLE FOR GLOBAL LDV EMISSIONS IN 1990,SO A ROUGH ESTIMATE HAS BEEN MADE.
© D
RE
AM
STIM
E
image THE TECHNOLOGY FOR SOLARPANELS WAS ORIGINAL INSPIRED BY NATURE.
© G
P/S
IMA
NJU
NTA
K
image GREENPEACE DONATES A SOLAR POWER SYSTEM TO A COASTAL VILLAGE IN ACEH, INDONESIA, ONE OF THE WORST HIT AREAS BY THE TSUNAMI IN DECEMBER 2004.

40
GLOBAL ENERGY [R]EVOLUTIONA SUSTAINABLE GLOBAL ENERGY OUTLOOK
main scenario assumptions
Development of a global energy scenario requires the use of a multi-region model in order to reflect the significant structural differencesbetween energy supply systems. The International Energy Agencybreakdown of world regions, as used in the ongoing series of WorldEnergy Outlook reports, has been chosen because the IEA alsoprovides the most comprehensive global energy statistics21.
The previous Energy [R]evolution Scenario used three regions to coverAsia: East Asia, South Asia and China. In line with WEO 2007, this newedition maintains the three region approach, but assesses China andIndia separately and aggregates the remaining Non-OECD countries inAsia under ‘Developing Asia’. The loss of comparability with the previousstudy is outweighed by the ability to compare the new results withcurrent IEA reports and still provides a reasonable analysis of Asia interms of population and economic development. The definitions of theworld regions are shown in Figure 5.1.
5
scena
rios fo
r a fu
ture en
ergy su
pp
ly|
MA
IN S
CE
NA
RIO
AS
SU
MP
TIO
NS
- WO
RL
D R
EG
ION
S
figure 5.1: definition of world regionsWEO 2007
oecd northamerica
Canada, Mexico, United States
latin america
Antigua and Barbuda,Argentina, Bahamas,Barbados, Belize,Bermuda, Bolivia,Brazil, Chile, Colombia,Costa Rica, Cuba,Dominica, DominicanRepublic, Ecuador, El Salvador, FrenchGuiana, Grenada,Guadeloupe,Guatemala, Guyana,Haiti, Honduras,Jamaica, Martinique,Netherlands Antilles,Nicaragua, Panama,Paraguay, Peru, St.Kitts-Nevis-Anguila,Saint Lucia, St. Vincentand Grenadines,Suriname, Trinidad andTobago, Uruguay,Venezuela
africa
Algeria, Angola, Benin,Botswana, BurkinaFaso, Burundi,Cameroon, Cape Verde,Central AfricanRepublic, Chad,Comoros, Congo,Democratic Republic of Congo, Cote d’Ivoire,Djibouti, Egypt,Equatorial Guinea,Eritrea, Ethiopia,Gabon, Gambia, Ghana,Guinea, Guinea-Bissau,Kenya, Lesotho, Liberia,Libya, Madagascar,Malawi, Mali,Mauritania, Mauritius,Morocco, Mozambique,Namibia, Niger, Nigeria,Reunion, Rwanda, SaoTome and Principe,Senegal, Seychelles,Sierra Leone, Somalia,South Africa, Sudan,Swaziland, UnitedRepublic of Tanzania,Togo, Tunisia, Uganda,Zambia, Zimbabwe
middle east
Bahrain, Iran, Iraq,Israel, Jordan, Kuwait,Lebanon, Oman, Qatar, Saudi Arabia,Syria, United ArabEmirates, Yemen
india
India
transitioneconomies
Albania, Armenia,Azerbaijan, Belarus,Bosnia-Herzegovina,Bulgaria, Croatia,Estonia, Serbia andMontenegro, the formerRepublic of Macedonia,Georgia, Kazakhstan,Kyrgyzstan, Latvia,Lithuania, Moldova,Romania, Russia,Slovenia, Tajikistan,Turkmenistan, Ukraine,Uzbekistan, Cyprus* ,Malta*
oecd pacific
Australia, Japan, Korea(South), New Zealand
china
People’s Republic of China including Hong Kong
developing asia
Afghanistan,Bangladesh, Bhutan,Brunei, Cambodia,Chinese Taipei, Fiji,French Polynesia,Indonesia, Kiribati,Democratic People’sRepublic of Korea,Laos, Macao, Malaysia,Maldives, Mongolia,Myanmar, Nepal, NewCaledonia, Pakistan,Papua New Guinea,Philippines, Samoa,Singapore, SolomonIslands, Sri Lanka,Thailand, Vietnam,Vanuatu
oecd europe
Austria, Belgium, Czech Republic,Denmark, Finland,France, Germany,Greece, Hungary,Iceland, Ireland, Italy,Luxembourg,Netherlands, Norway,Poland, Portugal,Slovak Republic, Spain,Sweden, Switzerland,Turkey, United Kingdom
* CYPRUS AND MALTA ARE ALLOCATED TO THE TRANSITION ECONOMIES FOR STATISTICAL REASONS

41
1. population development
One important underlying factor in energy scenario building isfuture population development. Population growth affects the sizeand composition of energy demand, directly and through its impacton economic growth and development. World Energy Outlook 2007uses the United Nations Development Programme (UNDP)projections for population development. For this study the mostrecent population projections from UNDP up to 2050 are applied22.
Table 5.1 summarises this study’s assumptions on world populationdevelopment. The world’s population is expected to grow by 0.77 % onaverage over the period 2005 to 2050, from 6.5 billion people in 2005 tomore than 9.1 billion in 2050. Population growth will slow over theprojection period, from 1.2% during 2005-2010 to 0.4% during 2040-2050. However, the updated projections show an increase in population ofalmost 300 million compared to the previous edition. This will furtherincrease the demand for energy. The population of the developing regionswill continue to grow most rapidly. The Transition Economies will face acontinuous decline, followed after a short while by the OECD Pacificcountries. OECD Europe and OECD North America are expected tomaintain their population, with a peak in around 2020/2030 and a slightdecline afterwards. The share of the population living in today’s Non-OECD countries will increase from the current 82% to 86% in 2050.China’s contribution to world population will drop from 20% today to15% in 2050. Africa will remain the region with the highest growth rate,leading to a share of 21% of world population in 2050.
Satisfying the energy needs of a growing population in the developingregions of the world in an environmentally friendly manner is a keychallenge for achieving a global sustainable energy supply.
2. economic growth
Economic growth is a key driver for energy demand. Since 1971, each1% increase in global Gross Domestic Product (GDP) has beenaccompanied by a 0.6% increase in primary energy consumption. Thedecoupling of energy demand and GDP growth is therefore a prerequisitefor reducing demand in the future. Most global energy/economic/environmental models constructed in the past have relied on marketexchange rates to place countries in a common currency for estimationand calibration. This approach has been the subject of considerablediscussion in recent years, and the alternative of purchasing power parity(PPP) exchange rates has been proposed. Purchasing power paritiescompare the costs in different currencies of a fixed basket of traded andnon-traded goods and services and yield a widely-based measure of thestandard of living. This is important in analysing the main drivers ofenergy demand or for comparing energy intensities among countries.
Although PPP assessments are still relatively imprecise compared tostatistics based on national income and product trade and nationalprice indexes, they are considered to provide a better basis for globalscenario development.23 Thus all data on economic development inWEO 2007 refers to purchasing power adjusted GDP. However, asWEO 2007 only covers the time period up to 2030, the projectionsfor 2030-2050 are based on our own estimates.
Prospects for GDP growth have increased considerably compared tothe previous study, whilst underlying growth trends continue much thesame. GDP growth in all regions is expected to slow gradually over thecoming decades. World GDP is assumed to grow on average by 3.6%per year over the period 2005-2030, compared to 3.3% from 1971 to2002, and on average by 3.3 % per year over the entire modellingperiod. China and India are expected to grow faster than otherregions, followed by the Developing Asia countries, Africa and theTransition Economies. The Chinese economy will slow as it becomesmore mature, but will nonetheless become the largest in the world inPPP terms early in the 2020s. GDP in OECD Europe and OECDPacific is assumed to grow by around 2% per year over the projectionperiod, while economic growth in OECD North America is expected tobe slightly higher. The OECD share of global PPP-adjusted GDP willdecrease from 55% in 2005 to 29% in 2050.
5
scena
rios fo
r a fu
ture en
ergy su
pp
ly|
MA
IN S
CE
NA
RIO
AS
SU
MP
TIO
NS
table 5.1: GDP development projections(AVERAGE ANNUAL GROWTH RATES)
source (2005-2030, IEA 2007; 2030-2050, OWN ASSUMPTIONS)
2005 -2010
4.6%
2.6%
2.7%
2.5%
5.6%
8.0%
9.2%
5.1%
4.3%
5.0%
5.1%
2010 -2020
3.6%
2.1%
2.4%
1.8%
3.6%
6.2%
5.7%
3.8%
3.2%
3.9%
4.2%
2020 -2030
3.2%
1.7%
2.2%
1.5%
2.7%
5.7%
4.7%
3.1%
2.8%
3.5%
3.2%
2030 -2040
3.0%
1.3%
2.0%
1.3%
2.5%
5.4%
4.2%
2.7%
2.6%
3.2%
2.9%
2040 -2050
2.9%
1.1%
1.8%
1.2%
2.4%
5.0%
3.6%
2.4%
2.4%
3.0%
2.6%
2005 -2050
3.3%
1.7%
2.2%
1.6%
3.1%
5.8%
5.0%
3.2%
2.9%
3.6%
3.4%
REGION
World
OECD Europe
OECD North America
OECD Pacific
Transition Economies
India
China
Developing Asia
Latin America
Africa
Middle East
figure 5.2: relative GDPppp growth by world regions
2005 2010 2015 2020 2030 2040 2050
•WORLD
• OECD EUROPE
• OECD NORTH AMERICA
• OECD PACIFIC
•TRANSITION ECONOMIES
• CHINA
• INDIA
• DEVELOPING ASIA
• LATIN AMERICA
• AFRICA
•MIDDLE EAST
1,3001,2001,1001,000
900800700600500400300200
% 100
references21 ‘ENERGY BALANCE OF NON-OECD COUNTRIES’ AND ‘ENERGY BALANCE OF OECDCOUNTRIES’, IEA, 200722 ‘WORLD POPULATION PROSPECTS: THE 2006 REVISION’, UNITED NATIONS,POPULATION DIVISION, DEPARTMENT OF ECONOMIC AND SOCIAL AFFAIRS (UNDP), 200723 NORDHAUS, W, ‘ALTERNATIVE MEASURES OF OUTPUT IN GLOBAL ECONOMIC-ENVIRONMENTAL MODELS: PURCHASING POWER PARITY OR MARKET EXCHANGERATES?’, REPORT PREPARED FOR IPCC EXPERT MEETING ON EMISSION SCENARIOS, US-EPA WASHINGTON DC, JANUARY 12-14, 2005
© G
P/F
LA
VIO
CA
NN
AL
ON
GA
image GROUP OF YOUNG PEOPLETOUCHING SOLAR PANELS IN BRAZIL.

GLOBAL ENERGY [R]EVOLUTIONA SUSTAINABLE GLOBAL ENERGY OUTLOOK
3. fossil fuel and biomass price projections
The recent dramatic increase in global oil prices has resulted in muchhigher forward price projections for fossil fuels. Under the 2004 ‘highoil and gas price’ scenario from the European Commission, forexample, an oil price of just $34 per barrel was assumed in 2030.More recent projections of oil prices in 2030 range from the IEA’s$200662/bbl ($200560/bbl) (WEO 2007) up to $2006119/bbl($2005115/bbl) in the ‘high price’ scenario of the US EnergyInformation Administration’s Annual Energy Outlook 2008.
Since the last Energy [R]evolution study was published, however,the price of oil has moved over $100/bbl for the first time (at theend of 2007), and in July 2008 reached a record high of more than$140/bbl. Although oil prices fell back to $100/bbl in September2008, the above projections might still be considered tooconservative. Considering the growing global demand for oil and gaswe have assumed a price development path for fossil fuels in whichthe price of oil reaches $120/bbl by 2030 and $140/bbl in 2050.
As the supply of natural gas is limited by the availability of pipelineinfrastructure, there is no world market price for natural gas. Inmost regions of the world the gas price is directly tied to the priceof oil. Gas prices are assumed to increase to $20-25/GJ by 2050.
4. cost of CO2 emissions
Assuming that a CO2 emissions trading system is established in all worldregions in the long term, the cost of CO2 allowances needs to be includedin the calculation of electricity generation costs. Projections of emissionscosts are even more uncertain than energy prices, and available studiesspan a broad range of future CO2 cost estimates. As in the previousEnergy [R]evolution study we assume CO2 costs of $10/tCO2 in 2010,rising to $50/tCO2 in 2050. Additional CO2 costs are applied in KyotoProtocol Non-Annex B (developing) countries only after 2020.
5
scena
rios fo
r a fu
ture en
ergy su
pp
ly|
MA
IN S
CE
NA
RIO
AS
SU
MP
TIO
NS
table 5.3: assumptions on CO2 emissions cost development($/tCO2)
2010
10
2020
20
20
2030
30
30
2040
40
40
2050
50
50
COUNTRIES
Kyoto Annex B countries
Non-Annex B countries
• OECD EUROPE
• OECD NORTH AMERICA
• OECD PACIFIC
•TRANSITION ECONOMIES
• INDIA
• CHINA
•DEVELOPING ASIA
• LATIN AMERICA
• AFRICA
•MIDDLE EAST
figure 5.3: development of world GDPppp by regions
2050
2005
table 5.2: assumptions on fuel price development
2005
52.5
2000
4.593.345.61
2000
37.8
2005
7.53
2.5
2006
60.1
2005
5.75.85.6
2005
2007
71.2
2006
7.387.477.17
2006
60.9
2010
57.271.776.6100
7.526.757.48
11.510.011.5
54.3142.7
7.93.32.8
2015
55.5
105
7.526.787.49
12.711.412.6
55.1167.2
8.53.53.2
2020
57.999.1110
14.713.314.7
194.4
9.43.83.5
2030
60.168.3
115.0120
8.067.498.01
18.417.218.3
59.3251.4
10.34.34.0
2040
130
21.920.621.9
311.2
10.64.74.6
2050
63
140
8.187.678.18
24.623.024.6
59.3359.1
10.85.24.9
Crude oil import prices in $2005 per barrel IEA WEO 2007 ETP 2008US EIA 2008 ‘Reference’US EIA 2008 ‘High Price’Energy [R]evolution 2008
Gas import prices in $2005 per GJ IEA WEO 2007/ ETP 2008
US importsEuropean importsJapan imports
Energy [R]evolution 2008US importsEuropean importsAsia imports
Hard coal import prices in $2005 per tonneIEA WEO 2007/ ETP 2008Energy [R]evolution 2008
Biomass (solid) prices in $2005 per GJEnergy [R]evolution 2008
OECD EuropeOECD Pacific, NAOther regions
42

43
5. power plant investment costs
fossil fuel technologies and carbon capture and storage (CCS)While the fossil fuel power technologies in use today for coal, gas,lignite and oil are established and at an advanced stage of marketdevelopment, further cost reduction potentials are assumed. Thepotential for cost reductions is limited, however, and will beachieved mainly through an increase in efficiency, bringing downinvestment costs24.
There is much speculation about the potential for carbon captureand storage (CCS) technology to mitigate the effect of fossil fuelconsumption on climate change, even though the technology is stillunder development.
CCS is a means of trapping CO2 from fossil fuels, either before orafter they are burned, and ‘storing’ (effectively disposing of) it inthe sea or beneath the surface of the Earth. There are currentlythree different methods of capturing CO2: ‘pre-combustion’, ‘post-combustion’ and ‘oxyfuel combustion’. However, development is at avery early stage and CCS will not be implemented - in the best case- before 2020 and will probably not become commercially viable asa possible effective mitigation option until 2030.
Cost estimates for CCS vary considerably, depending on factorssuch as power station configuration, technology, fuel costs, size ofproject and location. One thing is certain, however, CCS isexpensive. It requires significant funds to construct the powerstations and the necessary infrastructure to transport and storecarbon. The IPCC assesses costs at $15-75 per ton of capturedCO2
25, while a recent US Department of Energy report foundinstalling carbon capture systems to most modern plants resulted ina near doubling of costs26. These costs are estimated to increase theprice of electricity in a range from 21-91%27.
Pipeline networks will also need to be constructed to move CO2 tostorage sites. This is likely to require a considerable outlay ofcapital28. Costs will vary depending on a number of factors,including pipeline length, diameter and manufacture fromcorrosion-resistant steel, as well as the volume of CO2 to betransported. Pipelines built near population centres or on difficultterrain, such as marshy or rocky ground, are more expensive29.
The IPCC estimates a cost range for pipelines of $1-8/ton of CO2
transported. A United States Congressional Research Servicesreport calculated capital costs for an 11 mile pipeline in theMidwestern region of the US at approximately $6 million. The samereport estimates that a dedicated interstate pipeline network inNorth Carolina would cost upwards of $5 billion due to the limitedgeological sequestration potential in that part of the country30.Storage and subsequent monitoring and verification costs areestimated by the IPCC to range from $0.5-8/tCO2 injected and$0.1-0.3/tCO2 injected, respectively. The overall cost of CCS couldtherefore serve as a major barrier to its deployment31.
For the above reasons, CCS power plants are not included in ourfinancial analysis.
Table 5.4 summarises our assumptions on the technical andeconomic parameters of future fossil-fuelled power planttechnologies. In spite of growing raw material prices, we assumethat further technical innovation will result in a moderate reductionof future investment costs as well as improved power plantefficiencies. These improvements are, however, outweighed by theexpected increase in fossil fuel prices, resulting in a significant risein electricity generation costs.
5
scena
rios fo
r a fu
ture en
ergy su
pp
ly|
MA
IN S
CE
NA
RIO
AS
SU
MP
TIO
NS
POWER PLANT
Efficiency (%)
Investment costs ($/kW)
Electricity generation costs including CO2 emission costs ($cents/kWh)
CO2 emissions a)(g/kWh)
Efficiency (%)
Investment costs ($/kW)
Electricity generation costs including CO2 emission costs ($cents/kWh)
CO2 emissions a)(g/kWh)
Efficiency (%)
Investment costs ($/kW)
Electricity generation costs including CO2 emission costs ($cents/kWh)
CO2 emissions a)(g/kWh)
2030
50
1,160
12.5
670
44.5
1,350
8.4
898
62
610
15.3
325
2040
52
1,130
14.2
644
45
1,320
9.3
888
63
580
17.4
320
2050
53
1,100
15.7
632
45
1,290
10.3
888
64
550
18.9
315
POWER PLANT
Coal-fired condensing power plant
Lignite-fired condensing power plant
Natural gas combined cycle
table 5.4: development of efficiency and investment costs for selected power plant technologies
2020
48
1,190
10.8
697
44
1,380
7.5
908
61
645
12.7
330
2010
46
1,230
9.0
728
43
1,440
6.5
929
59
675
10.5
342
2005
45
1,320
6.6
744
41
1,570
5.9
975
57
690
7.5
354
source DLR, 2008 a) CO2 EMISSIONS REFER TO POWER STATION OUTPUTS ONLY;LIFE-CYCLE EMISSIONS ARE NOT CONSIDERED.
references24 ‘GREENPEACE INTERNATIONAL BRIEFING: CARBON CAPTURE AND STORAGE’,GOERNE, 200725 ABANADES, J C ET AL., 2005, PG 1026 NATIONAL ENERGY TECHNOLOGY LABORATORIES, 200727 RUBIN ET AL., 2005A, PG 4028 RAGDEN, P ET AL., 2006, PG 1829 HEDDLE, G ET AL., 2003, PG 1730 PARFOMAK, P & FOLGER, P, 2008, PG 5 AND 1231 RUBIN ET AL., 2005B, PG 4444
© P
N_P
HOT
O/D
RE
AM
STIM
E
image TRANSPORT POLLUTION.

44
GLOBAL ENERGY [R]EVOLUTIONA SUSTAINABLE GLOBAL ENERGY OUTLOOK
EMISSIONS
LEGEND
REFERENCE SCENARIO
ENERGY [R]EVOLUTION SCENARIO
REF
E[R]
0 1000 KM
EMISSIONS TOTALMILLION TONNES [mio t] | % OF 1990 EMISSIONS
EMISSIONS PER PERSON TONNES [t]
H HIGHEST | M MIDDLE | L LOWEST
CO2
300-200 200-100 100-50
50-0 % OF 1990 EMISSIONSIN THE 2050 ENERGY[R]EVOLUTIONSCENARIO
CO2
mio t %
OECD NORTH AMERICA
2005
2050
6,433H
9,135
111
158
2005
2050
14.74H
15.82H
mio t %
6,433
1,058M
111
18
14.74
1.83
t t
REF E[R]
CO2
mio t %
LATIN AMERICA
2005
2050
827
2,350
125
354
2005
2050
1.84
3.72
mio t %
827
369L
125
56
1.84
0.58
t t
REF E[R]
CO2
map 5.1: CO2 emissions reference scenario and the energy [r]evolution scenarioWORLDWIDE SCENARIO
5
scena
rios fo
r a fu
ture en
ergy su
pp
ly|
CO
2E
MIS
SIO
NS

45
mio t %
AFRICA
2005
2050
780L
2,064L
109
287
2005
2050
0.85L
1.03L
mio t %
780
895
109
125
0.85
0.45L
t t
REF E[R]
CO2
mio t %
INDIA
2005
2050
1,074
5,776
187
1,005
2005
2050
0.98
3.62
mio t %
1,074
1,662
187
289
0.98
1.04
t t
REF E[R]
CO2
mio t %
DEVELOPING ASIA
2005
2050
1,303
3,265
268
673
2005
2050
1.34
2.17
mio t %
1,303
1,148
268
236
1.34
0.76
t t
REF E[R]
CO2
mio t %
OECD PACIFIC
2005
2050
1,895
2,127
123
138
2005
2050
9.47
11.94
mio t %
1,895
433
123
28
9.47
2.43H
t t
REF E[R]
CO2
mio t %
GLOBAL
2005
2050
24,351
47,773
114
223
2005
2050
3.7
5.2
mio t %
24,351
10,589
114
49
3.7
1.2
t t
REF E[R]
CO2
mio t %
TRANSITION ECONOMIES
2005
2050
2,375M
3,003
53
67
2005
2050
6.96
10.22
mio t %
2,375
539
53
12
6.96
1.83
t t
REF E[R]
CO2
mio t %
CHINA
2005
2050
4,429
12,572H
198
561
2005
2050
3.35
8.86
mio t %
4,429
3,209H
198
143
3.35
2.26
t t
REF E[R]
CO2
mio t %
OECD EUROPE
2005
2050
4,062
4,553M
99
111
2005
2050
7.57
8.08M
mio t %
4,062
884
99
22
7.57
1.57M
t t
REF E[R]
CO2
DESIGN WWW.ONEHEMISPHERE.SE CONCEPT SVEN TESKE/GREENPEACE INTERNATIONAL.
mio t %
MIDDLE EAST
2005
2050
1,173
2,929
162
403
2005
2050
6.23M
8.44
mio t %
1,173
393
162
54
6.23
1.13
t t
REF E[R]
CO2
5
scena
rios fo
r a fu
ture en
ergy su
pp
ly|
CO
2E
MIS
SIO
NS

46
GLOBAL ENERGY [R]EVOLUTIONA SUSTAINABLE GLOBAL ENERGY OUTLOOK
map 5.2: results reference scenario and the energy [r]evolution scenarioWORLDWIDE SCENARIO
SCENARIO
LEGEND
REFERENCE SCENARIO
ENERGY [R]EVOLUTION SCENARIO
REF
E[R]
0 1000 KM
SHARE OF RENEWABLES %
SHARE OF FOSSIL FUELS %
SHARE OF NUCLEAR ENERGY %
H HIGHEST | M MIDDLE | L LOWESTPE PRIMARY ENERGY PRODUCTION/DEMAND IN PETA JOULE [PJ]
EL ELECTRICITY PRODUCTION/GENERATION IN TERAWATT HOURS [TWh]
RESULTS> -50 > -40 > -30
> -20 > -10 > 0
> +10 > +20 > +30
> +40 > +50 % CHANGE OF ENERGYCONSUMPTION IN ENERGY[R]EVOLUTION SCENARIO 2050COMPARED TO CURRENTCONSUMPTION 2005
PE PJ EL TWh
OECD NORTH AMERICA
2005
2050
115,888H
164,342
5,118
9,378
2005
2050
6
9
15
17
PE PJ EL TWh
115,888H
77,697
5,118
6,756
15
93
6
66
% %
2005
2050
85
84
85
31
67M
72M
67M
7
18
11
% %
2005
2050
9
7
NUCLEAR POWERPHASED OUT BY 2040
% %
REF E[R]
PE PJ EL TWh
LATIN AMERICA
2005
2050
21,143L
52,268
906
3,258
2005
2050
29
23
71H
47H
PE PJ EL TWh
21,143L
32,484
906
2,615
71H
95
29
71H
% %
2005
2050
70L
76
70L
26L
27L
52L
27L
5
2
2
% %
2005
2050
1
1
NUCLEAR POWERPHASED OUT BY 2030
% %
REF E[R]
5
scena
rios fo
r a fu
ture en
ergy su
pp
ly|
RE
SU
LTS

47
PE PJ EL TWh
AFRICA
2005
2050
25,243
53,286
564L
2,339L
2005
2050
49H
38H
17
22
PE PJ EL TWh
25,243
38,347
564L
2,076L
17
73
49H
56M
% %
2005
2050
50
62L
50
42M
81
78
81
27
2
1
% %
2005
2050
0L
0L
NUCLEAR POWERPHASED OUT BY 2025
% %
REF E[R]
PE PJ EL TWh
INDIA
2005
2050
22,344
89,090M
699
6,012
2005
2050
31
12
15
10
PE PJ EL TWh
22,344
52,120
699
4,435
15
60L
31
48
% %
2005
2050
68
85
68
52
82
87
82
40
3
3
% %
2005
2050
1
3
NUCLEAR POWERPHASED OUT BY 2045
% %
REF E[R]
PE PJ EL TWh
DEVELOPING ASIA
2005
2050
31,095
67,414
901
3,283
2005
2050
26
22
16
21
PE PJ EL TWh
31,095
43,838
901
2,356
16
67
26
49
% %
2005
2050
72
77
72
51
79
76
79
33
5M
3
% %
2005
2050
1
1
NUCLEAR POWERPHASED OUT BY 2045
% %
REF E[R]
PE PJ EL TWh
OECD PACIFIC
2005
2050
37,035
47,024L
1,780M
2,744
2005
2050
3
8
9
12
PE PJ EL TWh
37,035
24,952L
1,780M
2,111
9
78M
3
55
% %
2005
2050
83
75
83
45
66
61
66
22M
25H
27H
% %
2005
2050
13H
17H
NUCLEAR POWERPHASED OUT BY 2045
% %
REF E[R]
PE PJ EL TWh
GLOBAL
2005
2050
474,905
867,705
18,226
50,606
2005
2050
13
13
18
19
PE PJ EL TWh
474,905
480,861
18,226
37,116
18
77
1,297
5,611
% %
2005
2050
81
83
81
44
67
74
67
23
15
7
% %
2005
2050
6
4
NUCLEAR POWERPHASED OUT BY 2045
% %
REF E[R]
PE PJ EL TWh
TRANSITION ECONOMIES
2005
2050
46,254M
63,933
1,598
2,934
2005
2050
4
9
20M
21M
PE PJ EL TWh
46,254M
35,764
1,598
2,083
20M
81
4
62
% %
2005
2050
89
83
89
38
63
63
63
19
17
16
% %
2005
2050
7M
8
NUCLEAR POWERPHASED OUT BY 2045
% %
REF E[R]
PE PJ EL TWh
CHINA
2005
2050
73,007
185,017H
2,539
12,607H
2005
2050
15M
8
16
15
PE PJ EL TWh
73,007
99,152H
2,539
9,261H
16
63
15M
47L
% %
2005
2050
84
89
84
53H
82
81
82
37H
2
4
% %
2005
2050
1
3
NUCLEAR POWERPHASED OUT BY 2045
% %
REF E[R]
DESIGN WWW.ONEHEMISPHERE.SE CONCEPT SVEN TESKE/GREENPEACE INTERNATIONAL.
PE PJ EL TWh
OECD EUROPE
2005
2050
81,482
90,284
3,481
5,618M
2005
2050
8
15M
19
30
PE PJ EL TWh
81,482
48,918M
3,481
3,252M
19
86
8
60
% %
2005
2050
79M
79M
79M
43
53
62
53
14
28
8M
% %
2005
2050
13
5M
NUCLEAR POWERPHASED OUT BY 2030
% %
REF E[R]
PE PJ EL TWh
MIDDLE EAST
2005
2050
21,416
54,982
640
2,432
2005
2050
1L
2L
3L
4L
PE PJ EL TWh
21,416
27,590
640
2,171L
3L
96H
1L
62
% %
2005
2050
99H
98H
99H
37
97H
95H
97H
4
0L
0L
% %
2005
2050
0L
0L
NO NUCLEARENERGYDEVELOPMENT
% %
REF E[R]
5
scena
rios fo
r a fu
ture en
ergy su
pp
ly|
RE
SU
LTS

48
GLOBAL ENERGY [R]EVOLUTIONA SUSTAINABLE GLOBAL ENERGY OUTLOOK
6. cost projections for renewable energy technologies
The range of renewable energy technologies available today displaymarked differences in terms of their technical maturity, costs anddevelopment potential. Whereas hydro power has been widely usedfor decades, other technologies, such as the gasification of biomass,have yet to find their way to market maturity. Some renewablesources by their very nature, including wind and solar power, providea variable supply, requiring a revised coordination with the gridnetwork. But although in many cases these are ‘distributed’technologies - their output being generated and used locally to theconsumer - the future will also see large-scale applications in theform of offshore wind parks, photovoltaic power plants orconcentrating solar power stations.
By using the individual advantages of the different technologies, andlinking them with each other, a wide spectrum of available optionscan be developed to market maturity and integrated step by stepinto the existing supply structures. This will eventually provide acomplementary portfolio of environmentally friendly technologiesfor heat and power supply and the provision of transport fuels.
Many of the renewable technologies employed today are at arelatively early stage of market development. As a result, the costsof electricity, heat and fuel production are generally higher thanthose of competing conventional systems - a reminder that theexternal (environmental and social) costs of conventional powerproduction are not included in the market prices. It is expected,however, that compared with conventional technologies large costreductions can be achieved through technical advances,manufacturing improvements and large-scale production. Especiallywhen developing long-term scenarios spanning periods of severaldecades, the dynamic trend of cost developments over time plays acrucial role in identifying economically sensible expansion strategies.
To identify long-term cost developments, learning curves have beenapplied which reflect the correlation between cumulative productionvolumes of a particular technology and a reduction in its costs. Formany technologies, the learning factor (or progress ratio) falls in therange between 0.75 for less mature systems to 0.95 and higher forwell-established technologies. A learning factor of 0.9 means thatcosts are expected to fall by 10% every time the cumulative outputfrom the technology doubles. Empirical data shows, for example,that the learning factor for PV solar modules has been fairlyconstant at 0.8 over 30 years whilst that for wind energy variesfrom 0.75 in the UK to 0.94 in the more advanced German market.
Assumptions on future costs for renewable electricity technologiesin the Energy [R]evolution Scenario are derived from a review oflearning curve studies, for example by Lena Neij and others32, fromthe analysis of recent technology foresight and road mappingstudies, including the European Commission funded NEEDS (NewEnergy Externalities Developments for Sustainability)33 project orthe IEA Energy Technology Perspectives 2008, and a discussionwith experts from the renewable energy industry.
5
scena
rios fo
r a fu
ture en
ergy su
pp
ly|
MA
IN S
CE
NA
RIO
AS
SU
MP
TIO
NS
“large cost reductions can be achievedthrough technical advances, manufacturingimprovements and large-scale production.”
references32 NEIJ, L, ‘COST DEVELOPMENT OF FUTURE TECHNOLOGIES FOR POWER GENERATION -A STUDY BASED ON EXPERIENCE CURVES AND COMPLEMENTARY BOTTOM-UPASSESSMENTS’, ENERGY POLICY 36 (2008), 2200-221133 WWW.NEEDS-PROJECT.ORG

49
photovoltaics (pv)
The worldwide photovoltaics (PV) market has been growing at over35% per annum in recent years and the contribution it can make toelectricity generation is starting to become significant. Developmentwork is focused on improving existing modules and systemcomponents by increasing their energy efficiency and reducingmaterial usage. Technologies like PV thin film (using alternativesemiconductor materials) or dye sensitive solar cells are developingquickly and present a huge potential for cost reduction. The maturetechnology crystalline silicon, with a proven lifetime of 30 years, iscontinually increasing its cell and module efficiency (by 0.5%annually), whereas the cell thickness is rapidly decreasing (from230 to 180 microns over the last five years). Commercial moduleefficiency varies from 14 to 21% depending on silicon quality andfabrication process.
The learning factor for PV modules has been fairly constant overthe last 30 years, with a cost reduction of 20% each time theinstalled capacity doubles, indicating a high rate of technicallearning. Assuming a globally installed capacity of 1,600 GW bybetween 2030 and 2040, and with an electricity output of 2,600TWh, we can expect that generation costs of around 5-10cents/kWh (depending on the region) will be achieved. During thefollowing five to ten years, PV will become competitive with retailelectricity prices in many parts of the world and competitive withfossil fuel costs by 2050. The importance of photovoltaics comesfrom its decentralised/centralised character, its flexibility for use inan urban environment and huge potential for cost reduction.
concentrating solar power (csp)
Solar thermal ‘concentrating’ power stations (CSP) can only usedirect sunlight and are therefore dependent on high irradiationlocations. North Africa, for example, has a technical potentialwhich far exceeds local demand. The various solar thermaltechnologies (parabolic trough, power towers and parabolic dishconcentrators) offer good prospects for further development andcost reductions. Because of their more simple design, ‘Fresnel’collectors are considered as an option for additional cost reduction.The efficiency of central receiver systems can be increased byproducing compressed air at a temperature of up to 1,000°C, whichis then used to run a combined gas and steam turbine.
Thermal storage systems are a key component for reducing CSPelectricity generation costs. The Spanish Andasol 1 plant, forexample, is equipped with molten salt storage with a capacity of7.5 hours. A higher level of full load operation can be realised byusing a thermal storage system and a large collector field. Althoughthis leads to higher investment costs, it reduces the cost ofelectricity generation.
Depending on the level of irradiation and mode of operation, it isexpected that long term future electricity generation costs of 6-10cents/kWh can be achieved. This presupposes rapid marketintroduction in the next few years.
5
scena
rios fo
r a fu
ture en
ergy su
pp
ly|
MA
IN S
CE
NA
RIO
AS
SU
MP
TIO
NS
2030
921
1,280
13
2040
1,799
1,140
11
2050
2,911
1,080
10
2020
269
1,660
16
2010
21
3,760
38
2005
5.2
6,600
66
table 5.5: photovoltaics (pv)
Global installed capacity (GW)
Investment costs ($/kW)
Operation & maintenance costs ($/kWa)
2030
199
4,430
180
2040
468
4,360
160
2050
801
4,320
155
2020
83
5,240
210
2010
5
6,340
250
2005
0.53
7,530
300
table 5.6: concentrating solar power (csp)
Global installed capacity (GW)
Investment costs ($/kW)
Operation & maintenance costs ($/kWa)
© R
ED
ON
DO
/GP
image THE PS10 SOLAR TOWER PLANT ATSAN LUCAR LA MAYOR OUTSIDE SEVILLE,SPAIN, APRIL 29, 2008.

50
GLOBAL ENERGY [R]EVOLUTIONA SUSTAINABLE GLOBAL ENERGY OUTLOOK
wind power
Within a short period of time, the dynamic development of windpower has resulted in the establishment of a flourishing globalmarket. The world’s largest wind turbines, several of which havebeen installed in Germany, have a capacity of 6 MW. Whilefavourable policy incentives have made Europe the main driver forthe global wind market, in 2007 more than half of the annualmarket was outside Europe. This trend is likely to continue. Theboom in demand for wind power technology has nonetheless led tosupply constraints. As a consequence, the cost of new systems hasstagnated or even increased. Because of the continuous expansionof production capacities, the industry expects to resolve thebottlenecks in the supply chain over the next few years. Taking intoaccount market development projections, learning curve analysisand industry expectations, we assume that investment costs forwind turbines will reduce by 30% for onshore and 50% foroffshore installations up to 2050.
biomass
The crucial factor for the economics of biomass utilisation is thecost of the feedstock, which today ranges from a negative cost forwaste wood (based on credit for waste disposal costs avoided)through inexpensive residual materials to the more expensive energycrops. The resulting spectrum of energy generation costs iscorrespondingly broad. One of the most economic options is the useof waste wood in steam turbine combined heat and power (CHP)plants. Gasification of solid biomass, on the other hand, whichopens up a wide range of applications, is still relatively expensive.In the long term it is expected that favourable electricity productioncosts will be achieved by using wood gas both in micro CHP units(engines and fuel cells) and in gas-and-steam power plants. Greatpotential for the utilisation of solid biomass also exists for heatgeneration in both small and large heating centres linked to localheating networks. Converting crops into ethanol and ‘bio diesel’made from rapeseed methyl ester (RME) has become increasinglyimportant in recent years, for example in Brazil, the USA andEurope. Processes for obtaining synthetic fuels from biogenicsynthesis gases will also play a larger role.
A large potential for exploiting modern technologies exists in Latinand North America, Europe and the Transition Economies, either instationary appliances or the transport sector. In the long termEurope and the Transition Economies will realise 20-50% of thepotential for biomass from energy crops, whilst biomass use in allthe other regions will have to rely on forest residues, industrial woodwaste and straw. In Latin America, North America and Africa inparticular, an increasing residue potential will be available.
In other regions, such as the Middle East and all Asian regions, theadditional use of biomass is restricted, either due to a generally lowavailability or already high traditional use. For the latter, usingmodern, more efficient technologies will improve the sustainabilityof current usage and have positive side effects, such as reducingindoor pollution and the heavy workloads currently associated withtraditional biomass use.
5
scena
rios fo
r a fu
ture en
ergy su
pp
ly|
MA
IN S
CE
NA
RIO
AS
SU
MP
TIO
NS
2030
1,622
1,508
1,110
43
114
2,200
97
2040
2,220
1,887
1,090
41
333
1,990
88
2050
2,733
2,186
1,090
41
547
1,890
83
2020
893
866
1,180
45
27
2,600
114
2010
164
162
1,370
51
1,6
3,480
153
2005
59
59
1,510
58
0,3
3,760
166
table 5.7: wind power
Installed capacity (on+offshore)
Wind onshore
Global installed capacity (GW)
Investment costs ($/kW)
O&M costs ($/kWa)
Wind offshore
Global installed capacity (GW)
Investment costs ($/kW)
O&M costs ($/kWa)
2030
65
2,470
148
275
3,380
236
2040
81
2,440
147
411
3,110
218
2050
99
2,415
146
521
2,950
207
2020
56
2,530
152
177
3,860
271
2010
35
2,750
166
60
4,970
348
2005
21
3,040
183
32
5,770
404
table 5.8: biomass
Biomass (electricity only)
Global installed capacity (GW)
Investment costs ($/kW)
O&M costs ($/kWa)
Biomass (CHP)
Global installed capacity (GW)
Investment costs ($/kW)
O&M costs ($/kWa)

51
geothermal
Geothermal energy has long been used worldwide for supplyingheat, and since the beginning of the last century for electricitygeneration as well. Geothermally generated electricity waspreviously limited to sites with specific geological conditions, butfurther intensive research and development work has enabled thepotential areas to be widened. In particular the creation of largeunderground heat exchange surfaces (Enhanced GeothermalSystems - EGS) and the improvement of low temperature powerconversion, for example with the Organic Rankine Cycle, open upthe possibility of producing geothermal electricity anyywhere.Advanced heat and power cogeneration plants will also improve theeconomics of geothermal electricity.
As a large part of the costs for a geothermal power plant comefrom deep underground drilling, further development of innovativedrilling technology is expected. Assuming a global average marketgrowth for geothermal power capacity of 9% per year up to 2020,adjusting to 4% beyond 2030, the result would be a cost reductionpotential of 50% by 2050:
• for conventional geothermal power, from 7 cents/kWh to about 2 cents/kWh.
• for EGS, despite the presently high figures (about 20 cents/kWh),electricity production costs - depending on the payments for heatsupply - are expected to come down to around 5 cents/kWh in the long term.
Because of its non-fluctuating supply and a grid load operatingalmost 100% of the time, geothermal energy is considered to be akey element in a future supply structure based on renewable sources.Until now we have just used a marginal part of the geothermalheating and cooling potential. Shallow geothermal drilling makespossible the delivery of heating and cooling at any time anywhere,and can be used for thermal energy storage.
ocean energy
Ocean energy, particularly offshore wave energy, is a significantresource, and has the potential to satisfy an important percentage ofelectricity supply worldwide. Globally, the potential of ocean energyhas been estimated at around 90,000 TWh/year. The most significantadvantages are the vast availability and high predictability of theresource and a technology with very low visual impact and no CO2
emissions. Many different concepts and devices have been developed,including taking energy from the tides, waves, currents and boththermal and saline gradient resources. Many of them are in anadvanced phase of R&D, large scale prototypes have been deployedin real sea conditions and some have reached pre-marketdeployment. There are a few grid connected, fully operationalcommercial wave and tidal generating plants.
The cost of energy from initial tidal and wave energy farms has beenestimated to be in the range of 15-55 €cents/kWh, and for initialtidal stream farms in the range of 11-22 €cents/kWh. Generationcosts of 10-25 €cents/kWh are expected by 2020. Key areas fordevelopment will include concept design, optimisation of the deviceconfiguration, reduction of capital costs by exploring the use ofalternative structural materials, economies of scale and learningfrom operation. According to the latest research findings, thelearning factor is estimated to be 10-15% for offshore wave and 5-10% for tidal stream. In the medium term, ocean energy has thepotential to become one of the most competitive and cost effectiveforms of generation. In the next few years a dynamic marketpenetration is expected, following a similar curve to wind energy.
Because of the early development stage any future cost estimatesfor ocean energy systems are uncertain, and no learning curve datais available. Present cost estimates are based on analysis from theEuropean NEEDS project34.
5
scena
rios fo
r a fu
ture en
ergy su
pp
ly|
MA
IN S
CE
NA
RIO
AS
SU
MP
TIO
NS
2030
71
10,150
375
38
7,950
294
2040
120
9,490
351
82
6,930
256
2050
152
8,980
332
124
6,310
233
2020
33
11,560
428
13
9,510
351
2010
12
15,040
557
1.7
13,050
483
2005
8.7
17,440
645
0.24
17,500
647
table 5.9: geothermal
Geothermal (electricity only)
Global installed capacity (GW)
Investment costs ($/kW)
O&M costs ($/kWa)
Geothermal (CHP)
Global installed capacity (GW)
Investment costs ($/kW)
O&M costs ($/kWa)
2030
44
2,240
89
2040
98
1,870
75
2050
194
1,670
66
2020
17
2,910
117
2010
0.9
5,170
207
2005
0.27
9,040
360
table 5.10: ocean energy
Global installed capacity (GW)
Investment costs ($/kW)
Operation & maintenance costs ($/kWa)
references34 WWW.NEEDS-PROJECT.ORG
© J
OA
NN
E/D
RE
AM
STIM
E
© G
P/M
AR
TIN
BO
ND
image 100 KW PV GENERATING PLANTNEAR BELLINZONA-LOCARNO RAILWAYLINE. GORDOLA, SWITZERLAND.
image THE POWER OF THE OCEAN.

52
GLOBAL ENERGY [R]EVOLUTIONA SUSTAINABLE GLOBAL ENERGY OUTLOOK
hydro power
Hydropower is a mature technology with a significant part of itspotential already exploited. There is still, however, some potentialleft both for new schemes (especially small scale run-of-riverprojects with little or no reservoir impoundment) and forrepowering of existing sites. The significance of hydropower is alsolikely to be encouraged by the increasing need for flood control andmaintenance of water supply during dry periods. The future is insustainable hydropower which makes an effort to integrate plantswith river ecosystems while reconciling ecology with economicallyattractive power generation.
summary of renewable energy cost development
Figure 5.4 summarises the cost trends for renewable energytechnologies as derived from the respective learning curves. It shouldbe emphasised that the expected cost reduction is basically not afunction of time, but of cumulative capacity, so dynamic marketdevelopment is required. Most of the technologies will be able toreduce their specific investment costs to between 30% and 70% ofcurrent levels by 2020, and to between 20% and 60% once theyhave achieved full development (after 2040).
Reduced investment costs for renewable energy technologies leaddirectly to reduced heat and electricity generation costs, as shown inFigure 5.5. Generation costs today are around 8 to 25 €cents/kWh(10-25 $cents/kWh) for the most important technologies, with theexception of photovoltaics. In the long term, costs are expected toconverge at around 4 to 10 €cents/kWh (5-12 $cents/kWh). Theseestimates depend on site-specific conditions such as the local windregime or solar irradiation, the availability of biomass at reasonableprices or the credit granted for heat supply in the case of combinedheat and power generation.
5
scena
rios fo
r a fu
ture en
ergy su
pp
ly|
MA
IN S
CE
NA
RIO
AS
SU
MP
TIO
NS
2030
1300
3200
128
2040
1443
3320
133
2050
1565
3420
137
2020
1178
3070
123
2010
978
2880
115
2005
878
2760
110
table 5.11: hydro
Global installed capacity (GW)
Investment costs ($/kW)
Operation & maintenance costs ($/kWa)
120
100
80
60
40
20
% 0
figure 5.4: future development of investment costs (NORMALISED TO CURRENT COST LEVELS) FOR RENEWABLE
ENERGY TECHNOLOGIES
2005 2010 2020 2030 2040 2050
•PV
•WIND ONSHORE
•WIND OFFSHORE
• BIOMASS POWER PLANT
• BIOMASS CHP
• GEOTHERMAL CHP
• CONCENTRATING SOLAR THERMAL
• OCEAN ENERGY
• PV
•WIND
• BIOMASS CHP
• GEOTHERMAL CHP
• CONCENTRATING SOLAR THERMAL
40
35
30
25
20
15
10
5
ct/kWh 0
figure 5.5: expected development of electricity generationcosts from fossil fuel and renewable optionsEXAMPLE FOR OECD NORTH AMERICA
2005 2010 2020 2030 2040 2050
© M
. HO
LL
MA
N/D
RE
AM
STIM
Eimage BENMORE HYDRO DAM, NEW ZEALAND.

53
6key results of the global energy [r]evolution scenario
GLOBAL SCENARIO OECD NORTH AMERICALATIN AMERICAOECD EUROPE AFRICA
MIDDLE EASTTRANSITION ECONOMIESINDIA
DEVELOPING ASIACHINAOECD PACIFIC
“for us to develop in a sustainable way,strong measures haveto be taken to combatclimate change.”HU JINTAOPRESIDENT OF CHINA
6
imag
eS
OL
AR
PA
NE
L. ©
BE
RN
D J
UE
RG
EN
S/D
RE
AM
STIM
E

54
GLOBAL ENERGY [R]EVOLUTIONA SUSTAINABLE GLOBAL ENERGY OUTLOOK
The development of future global energy demand is determined by three key factors:
• Population development: the number of people consuming energyor using energy services.
• Economic development, for which Gross Domestic Product(GDP) is the most commonly used indicator. In general, an increase in GDP triggers an increase in energy demand.
• Energy intensity: how much energy is required to produce a unit of GDP.
Both the Reference and Energy [R]evolution Scenarios are basedon the same projections of population and economic development.The future development of energy intensity, however, differs betweenthe two, taking into account the measures to increase energyefficiency under the Energy [R]evolution Scenario.
global: projection of energy intensity
An increase in economic activity and a growing population does notnecessarily have to result in an equivalent increase in energydemand. There is still a large potential for exploiting energyefficiency measures. Under the Reference Scenario, we assume thatenergy intensity will be reduced by 1.25% on average per year,leading to a reduction in final energy demand per unit of GDP ofabout 56% between 2005 and 2050. Under the Energy[R]evolution Scenario, it is assumed that active policy and technicalsupport for energy efficiency measures will lead to an even higherreduction in energy intensity of almost 73%.
6
key resu
lts|
GL
OB
AL
- INT
EN
SIT
Y
figure 6.1: global: projection of average energy intensityunder the reference and energy [r]evolution scenarios
5
4.5
4
4.5
3
2.5
2
1.5
1
0.5
MJ/$ 0
10
9
8
7
6
5
4
3
2
1
US$ 0
10
9
8
7
6
5
4
3
2
1
US$ 0
2000 2010 2020 2030 2040 2050
figure 6.2: global: energy intensity by world regionunder the reference scenario
GJ/
GD
P 1
000
US
$
2005 2010 2015 2020 2030 2040 2050
•WORLD
• OECD NORTH AMERICA
• OECD EUROPE
• OECD PACIFIC
• CHINA
• INDIA
•TRANSITION ECONOMIES
• DEVELOPING ASIA
• LATIN AMERICA
•MIDDLE EAST
• AFRICA
figure 6.3: global: energy intensity by world regionunder the energy [r]evolution scenario
GJ/
GD
P 1
000
US
$
2005 2010 2015 2020 2030 2040 2050
GLOBAL SCENARIO OECD NORTH AMERICA LATIN AMERICAOECD EUROPE AFRICA
MIDDLE EASTTRANSITION ECONOMIESINDIA
DEVELOPING ASIACHINAOECD PACIFIC
global
•ENERGY [R]EVOLUTION SCENARIO
• REFERENCE SCENARIO

55
global: development of energy demand by sector
Combining the projections on population development, GDP growthand energy intensity results in future development pathways for theworld’s energy demand. These are shown in Figure 6.4 for both theReference and Energy [R]evolution Scenarios. Under the ReferenceScenario, total primary energy demand almost doubles from474,900 PJ/a in 2005 to 867,700 PJ/a in 2050. In the Energy[R]evolution Scenario, demand increases up to 2015 by 16% anddecreases to close to today’s level of 480,860 PJ in 2050.
The accelerated increase in energy efficiency, which is a crucialprerequisite for achieving a sufficiently large share of renewableenergy sources in our energy supply, is beneficial not only for theenvironment but also for economics. Taking into account the fullservice life, in most cases the implementation of energy efficiencymeasures saves costs compared to an additional energy supply. Themobilisation of cost-effective energy saving potential leads directlyto a reduction in costs. A dedicated energy efficiency strategy thusalso helps to compensate in part for the additional costs requiredduring the market introduction phase of renewable energy sources.
Under the Energy [R]evolution Scenario, electricity demand is expectedto increase disproportionately, with households and services the mainsource of growing consumption (see Figure 6.5). With the exploitation ofefficiency measures, however, an even higher increase can be avoided,leading to electricity demand of around 30,800 TWh/a in the year 2050.Compared to the Reference Scenario, efficiency measures avoid thegeneration of about 12,800 TWh/a. This reduction in energy demand canbe achieved in particular by introducing highly efficient electronic devicesusing the best available technology in all demand sectors. Employment ofsolar architecture in both residential and commercial buildings will helpto curb the growing demand for active air-conditioning.
Efficiency gains in the heat supply sector are even larger. Under the Energy[R]evolution Scenario, final demand for heat supply can even be reduced
(see Figure 6.6). Compared to the Reference Scenario, consumptionequivalent to 46,000 PJ/a is avoided through efficiency gains by 2050. Asa result of energy-related renovation of the existing stock of residentialbuildings, as well as the introduction of low energy standards and ‘passivehouses’ for new buildings, enjoyment of the same comfort and energyservices will be accompanied by a much lower future energy demand.
In the transport sector, it is assumed under the Energy [R]evolutionScenario that energy demand will increase by 12 % to around94,000 PJ/a in 2015 and will fall slightly afterwards down to83,300 PJ/a in 2050, saving 100,000 PJ compared to the ReferenceScenario. This reduction can be achieved by the introduction of highlyefficient vehicles, by shifting the transport of goods from road to railand by changes in mobility-related behaviour patterns.
6
key resu
lts|
GL
OB
AL
- DE
MA
ND
figure 6.4: global: projection of final energy demand by sector for the two scenarios
600,000
500,000
400,000
300,000
200,000
100,000
PJ/a 0REF2005
REF2010
REF2020
REF2030
REF2040
REF2050
600,000
500,000
400,000
300,000
200,000
100,000
PJ/a 0E[R]2005
E[R]2010
E[R]2020
E[R]2030
E[R]2040
E[R]2050
figure 6.5: global: development of electricity demand by sector (‘EFFICIENCY’ = REDUCTION COMPARED TO THE REFERENCE SCENARIO; OTHER SECTORS = SERVICES, HOUSEHOLDS)
50,000
40,000
30,000
20,000
10,000
TWh/a 02005 2010 2020 2030 2040 2050
figure 6.6: global: development of heat demand by sector(‘EFFICIENCY’ = REDUCTION COMPARED TO THE REFERENCE SCENARIO)
•• ‘EFFICIENCY’
• INDUSTRY• OTHER SECTORS
•TRANSPORT
250,000
200,000
150,000
100,000
50,000
PJ/a 02005 2010 2020 2030 2040 2050
© L
AN
GR
OC
K/Z
EN
IT/G
P
image BERLINER GEOSOL INSTALLINGTHE SOLAR ENERGY PLANT(PHOTOVOLTAIK) “LEIPZIGER LAND”OWNED BY SHELL SOLAR IN A FORMERBROWN COAL AREA NEAR LEIPZIG,SACHSEN, GERMANY.

global: electricity generation
The development of the electricity supply sector is characterised by adynamically growing renewable energy market and an increasing shareof renewable electricity. This will compensate for the phasing out ofnuclear energy and reduce the number of fossil fuel-fired power plantsrequired for grid stabilisation. By 2050, 77% of the electricityproduced worldwide will come from renewable energy sources. ‘New’ renewables – mainly wind, solar thermal energy and PV – willcontribute over 60% of electricity generation. The following strategypaves the way for a future renewable energy supply:
• The phasing out of nuclear energy and rising electricity demandwill be met initially by bringing into operation new highly efficientgas-fired combined-cycle power plants, plus an increasingcapacity of wind turbines, biomass, concentrating solar powerplants and solar photovoltaics. In the long term, wind will be themost important single source of electricity generation.
• Solar energy, hydro and biomass will make substantial contributionsto electricity generation. In particular, as non-fluctuating renewableenergy sources, hydro and solar thermal, combined with efficientheat storage, are important elements in the overall generation mix.
• The installed capacity of renewable energy technologies will growfrom the current 1,000 GW to 9,100 GW in 2050. Increasingrenewable capacity by a factor of nine within the next 42 yearsrequires political support and well-designed policy instruments,however. There will be a considerable demand for investment innew production capacity over the next 20 years. As investmentcycles in the power sector are long, decisions on restructuring theworld’s energy supply system need to be taken now.
To achieve an economically attractive growth in renewable energysources, a balanced and timely mobilisation of all technologies is ofgreat importance. This mobilisation depends on technical potentials,cost reduction and technological maturity. Figure 21 shows thecomparative evolution of the different renewable technologies overtime. Up to 2020, hydro-power and wind will remain the majorcontributors to the growing market share. After 2020, thecontinuing growth of wind will be complemented by electricity frombiomass, photovoltaic and solar thermal (CSP) energy.
56
GLOBAL ENERGY [R]EVOLUTIONA SUSTAINABLE GLOBAL ENERGY OUTLOOK
6
key resu
lts|
GL
OB
AL
- EL
EC
TR
ICIT
Y G
EN
ER
AT
ION
figure 6.7: global: development of electricity supplystructure under the two scenarios(‘EFFICIENCY’ = REDUCTION COMPARED TO THE REFERENCE SCENARIO)
60,000
50,000
40,000
30,000
20,000
10,000
TWh/a 0REF2005
E[R] REF2010
E[R] REF2020
E[R] REF2030
E[R] REF2040
E[R] REF2050
E[R]
figure 6.8: global: growth of renewable electricitygeneration under the energy [r]evolution scenarioBY INDIVIDUAL SOURCE
•• ‘EFFICIENCY’
• RES IMPORT
• OCEAN ENERGY
• SOLAR THERMAL
• PV
• GEOTHERMAL
•WIND
• HYDRO
• BIOMASS
• GAS & OIL
• COAL
• NUCLEAR
10,000
8,000
6,000
4,000
2,000
GWel 0E[R]2005
E[R]2010
E[R]2020
E[R]2030
E[R]2040
E[R]2050
table 6.1: global: projection of renewable electricitygeneration capacity under the energy [r]evolution scenarioIN GW
2020
1,178
233
893
46
269
83
17
2,719
2040
1,443
492
2,220
203
1,799
468
98
6,723
2050
1,565
619
2,911
276
2,911
801
194
9,100
Hydro
Biomass
Wind
Geothermal
PV
Solarthermal
Ocean energy
Total
2030
1,300
341
1,622
108
921
199
44
4,536
2010
978
95
164
14
21
5
1
1,276
2005
878
52
59
9
2
0.5
0.3
1,001
GLOBAL SCENARIO OECD NORTH AMERICA LATIN AMERICAOECD EUROPE AFRICA
MIDDLE EASTTRANSITION ECONOMIESINDIA
DEVELOPING ASIACHINAOECD PACIFIC
global

57
6
key resu
lts|
GL
OB
AL
- CO
ST
S - H
EA
TIN
G &
CO
OL
ING
global: future costs of electricity generation
Figure 27 shows that the introduction of renewable technologies under theEnergy [R]evolution Scenario slightly increases the costs of electricitygeneration compared to the Reference Scenario. This difference will be lessthan 0.2 cents/kWh up to 2020. Note that any increase in fossil fuel pricesbeyond the projection given in Table 6.1 will reduce the gap between thetwo scenarios. Because of the lower CO2 intensity of electricity generation,by 2020 electricity generation costs will become economically favourableunder the Energy [R]evolution Scenario, and by 2050 generation costswill be more than 5 cents/kWh below those in the Reference Scenario.
Due to growing demand, we face a significant increase in society’sexpenditure on electricity supply. Under the Reference Scenario, theunchecked growth in demand, the increase in fossil fuel prices and thecost of CO2 emissions result in total electricity supply costs rising fromtoday’s $1,750 billion per year to more than $7,300 bn in 2050. Figure28 shows that the Energy [R]evolution Scenario not only complies withglobal CO2 reduction targets but also helps to stabilise energy costs andrelieve the economic pressure on society. Increasing energy efficiencyand shifting energy supply to renewables leads to long term costs forelectricity supply that are one third lower than in the ReferenceScenario. It becomes clear that pursuing stringent environmental targetsin the energy sector also pays off in terms of economics.
global: heat and cooling supply
Development of renewables in the heat supply sector raisesdifferent issues. Today, renewables provide 24%of primary energydemand for heat supply, the main contribution coming from the useof biomass. The lack of district heating networks is a severestructural barrier to the large scale utilisation of geothermal andsolar thermal energy. Past experience shows that it is easier toimplement effective support instruments in the grid-connectedelectricity sector than in the heat market, with its multitude ofdifferent actors. Dedicated support instruments are required toensure a dynamic development.
In the Energy [R]evolution Scenario, renewables satisfy more than70% of the total global heating demand in 2050.
• Energy efficiency measures can decrease the current per capitademand for heat supply by 30% in spite of improving living standards.
• For direct heating, solar collectors, biomass/biogas as well as geothermal energy will increasingly substitute for fossil fuel-fired systems.
• A shift from coal and oil to natural gas in the remaining conventionalapplications will lead to a further reduction of CO2 emissions.
figure 6.11: global: development of heat supplystructure under the two scenarios(‘EFFICIENCY’ = REDUCTION COMPARED TO THE REFERENCE SCENARIO)
•• ‘EFFICIENCY’
• GEOTHERMAL
• SOLAR
• BIOMASS
• FOSSIL FUELS
250,000
200,000
150,000
100,000
50,000
TWh/a 0REF2005
E[R] REF2010
E[R] REF2020
E[R] REF2030
E[R] REF2040
E[R] REF2050
E[R]
figure 6.9: global: development of specific electricitygeneration costs under the two scenarios(CO2 EMISSION COSTS IMPOSED FROM 2010,
WITH AN INCREASE FROM 15 $/TCO2IN 2010 TO 50 $/TCO2
IN 2050)
18
16
14
12
10
8
6
$¢/kWh 42000 2010 2020 2030 2040 2050
figure 6.10: global: development of total electricity supply costs
•• ENERGY [R]EVOLUTION - ‘EFFICIENCY’ MEASURES
• ENERGY [R]EVOLUTION SCENARIO
• REFERENCE SCENARIO
9,000
8,000
7,000
6,000
5,000
4,000
3,000
2,000
1,000
B $/a 0REF2005
E[R] REF2010
E[R] REF2020
E[R] REF2030
E[R] REF2040
E[R] REF2050
E[R]
© L
AN
GR
OC
K/Z
EN
IT/G
P
© L
AN
GR
OC
K/Z
EN
IT/G
P
image TEST WIND MILL N90 2500, BUILD BY GERMAN COMPANY NORDEX, IN THEHARBOUR OF ROSTOCK. THIS WIND MILL PRODUCES 2,5 MEGA WATT AND AT LEAST 10FACILITIES OF THIS TYPE WILL BE ERECTED 20 KM OFF THE ISLAND DARSS IN THEBALTIC SEA.
image SOLON AG PHOTOVOLTAICS FACILITY IN ARNSTEIN OPERATING 1,500HORIZONTAL AND VERTICAL SOLAR “MOVERS”. LARGEST TRACKING SOLAR FACILITY IN THE WORLD. EACH “MOVER” CAN BE BOUGHT AS A PRIVATE INVESTMENT FROM THE S.A.G. SOLARSTROM AG, BAYERN, GERMANY.

global: transport
In the transport sector, it is assumed that under the Energy[R]evolution Scenario, due to fast growing demand for services,energy demand will further increase up to 2015. After that demandwill decrease, falling to below its current level in 2050. Comparedto the Reference Scenario, energy demand is reduced by 54%. Thisreduction can be achieved by the introduction of highly efficientvehicles, by shifting the transport of goods from road to rail and bychanges in mobility-related behaviour patterns. By implementingattractive alternatives to individual cars, the amount of cars willgrow more slowly than in the Reference Scenario. In 2050,electricity will provide 24% of the transport sector’s total energydemand, while 61% of the demand will be covered by fossil fuels.
global: primary energy consumption
Taking into account the assumptions discussed above, the resultingprimary energy consumption under the Energy [R]evolution Scenario isshown in Figure 6.13. Compared to the Reference Scenario, overallenergy demand will be reduced by almost 45% in 2050. More than halfof the remaining demand will be covered by renewable energy sources.Note that because of the ‘efficiency method’ used for the calculation ofprimary energy consumption, which postulates that the amount ofelectricity generation from hydro, wind, solar and geothermal energyequals the primary energy consumption, the share of renewables seemsto be lower than their actual importance as energy suppliers.
58
GLOBAL ENERGY [R]EVOLUTIONA SUSTAINABLE GLOBAL ENERGY OUTLOOK
6
key resu
lts|
GL
OB
AL
- TR
AN
SP
OR
T - C
ON
SU
MP
TIO
N - C
O2
EM
ISS
ION
S
figure 6.12: global: transport under the two scenarios(‘EFFICIENCY’ = REDUCTION COMPARED TO THE REFERENCE SCENARIO)
•• ‘EFFICIENCY’
• HYDROGEN
• ELECTRICITY
• BIO FUELS
• NATURAL GAS
• OIL PRODUCTS
200,000
180,000
160,000
140,000
120,000
100,000
80,000
60,000
40,000
20,000
PJ/a 0REF2005
E[R] REF2010
E[R] REF2020
E[R] REF2030
E[R] REF2040
E[R] REF2050
E[R]
figure 6.13: global: development of primary energyconsumption under the two scenarios(‘EFFICIENCY’ = REDUCTION COMPARED TO THE REFERENCE SCENARIO)
•• ‘EFFICIENCY’
• OCEAN ENERGY
• GEOTHERMAL
• SOLAR
• BIOMASS
•WIND
• HYDRO
• NATURAL GAS
• CRUDE OIL
• COAL
• NUCLEAR
1,000,000
900,000
800,000
700,000
600,000
500,000
400,000
300,000
200,000
100,000
PJ/a 0REF2005
E[R] REF2010
E[R] REF2020
E[R] REF2030
E[R] REF2040
E[R] REF2050
E[R]
development of global CO2 emissions
Whilst worldwide emissions of CO2 will almost double under theReference Scenario, under the Energy [R]evolution Scenario theywill decrease from 24,350 million tonnes in 2005 to 10,600 m/t in2050. Annual per capita emissions will drop from 3.7 tonnes to1.15 t. In spite of the phasing out of nuclear energy and increasingdemand, CO2 emissions will decrease in the electricity sector. In thelong run efficiency gains and the increased use of renewableelectricity will even reduce CO2 emissions in the transport sector.With a share of 35% of total CO2 in 2050, the power sector willfall significantly but remain the largest source of emissions,followed by transport.
figure 6.14: global: development of CO2 emissions by sector under the energy [r]evolution scenario (‘EFFICIENCY’ = REDUCTION COMPARED TO THE REFERENCE SCENARIO)
•• SAVINGS FROM ‘EFFICIENCY’ & RENEWABLES
•TRANSPORT
• OTHER SECTORS• INDUSTRY
• PUBLIC ELECTRICITY & CHP
50,00045,00040,00035,00030,00025,00020,00015,00010,000
500Mil t/a 0
E[R]2005
E[R]2010
E[R]2020
E[R]2030
E[R]2040
E[R]2050
GLOBAL SCENARIO OECD NORTH AMERICA LATIN AMERICAOECD EUROPE AFRICA
MIDDLE EASTTRANSITION ECONOMIESINDIA
DEVELOPING ASIACHINAOECD PACIFIC
global

59
6
key resu
lts|
GL
OB
AL
- CO
2E
MIS
SIO
NS
global: regional breakdown of CO2 emissions in 2050
With effective efficiency standards OECD countries can reducetheir per capita energy consumption significantly while developingcountries could slow down their massive increase in energy demand.At the same time renewable energy sources can increase thereshare in the energy mix to over 50 % globally. In some regions, therenewable energy share will be well above 80%, while economicgrowth is still maintained over the entire scenario period.
With this shift, annual per capita CO2 emissions will fall from theircurrent level of about 3.6 tonnes to 1.15 tonnes in 2050. OECDcountries will be able to reduce their CO2 emissions by about 80%.The Energy [R]evolution Scenario for the USA shows that it ispossible to reduce per capita CO2 emissions from 19 tonnes now to3 tonnes by 2050. For the EU-27 countries, per capita emissionswill fall from 8 to just under 2 tonnes per capita. Developingcountries such as the Philippines could even keep per capitaemissions at their current level of about 1 tonne of CO2 until 2050,while maintaining economic growth. A combination of efficiencystandards and renewable energy development proves to be the mostcost effective way to cut CO2 emissions and increase security ofsupply by reducing dependence on fossil fuel imports.
Under the global Energy [R]evolution Scenario, China and Indiawill emit almost half of the remaining CO2 emissions in 2050, whileall OECD countries together will have a share of about 22%.
global: CO2 emissions by source
In 2050, coal will be by far the largest source of CO2, mainly from coal-fired power stations in China and India as well as powerstations in other developing countries. Since those emissions aremainly from power stations built between 2000 and 2015, and theaverage lifetime of a coal-fired power plant is calculated at 40years, in order to achieve the projected reduction, the constructionof new coal power stations must end across most of the world by2015 and in developing countries by 2020.
The second biggest emitter is oil, mainly from the remaining oilused in the transport sector.
figure 6.15: global: CO2 emissions in 2050
8% OECD EUROPE
10% OECD NORTHAMERICA
4% OECD PACIFIC
30% CHINA
16% INDIA
32% R0W
figure 6.17: global: CO2 emissions in 205010,5 Gt -> BREAKDOWN BY SECTOR
0% DISTRICT HEATING0.0021 Gt
20% INDUSTRY2.067 Gt
13% OTHER SECTORS1.333 Gt
33% TRANSPORT3.493 Gt
34% ELECTRICITY &STEAM GENERATION
3.675 Gt
figure 6.16: global: CO2 emissions electricity & steam generation in 20504,35Gt
-> 62% COAL 2.7 Gt
-> 37% GAS 1.6 Gt
-> 1% OIL & DIESEL 0.024 Gt
regional breakdown of energy [r]evolution scenario The outcome of the Energy [R]evolution Scenario for each region of the world shows how the global pattern is adapted to regional circumstances in terms of predicted demand and the potential for developing different sources of future energy generation.
© I.
BR
ACE
GIR
DLE
/DR
EA
MST
IMEimage HIGH MARNHAM COAL-FIRED
POWER STATION ON THE RIVER TRENT INNOTTINGHAMSHIRE, UK.

60
6
key resu
lts|
OE
CD
NO
RT
H A
ME
RIC
A - D
EM
AN
D
GLOBAL ENERGY [R]EVOLUTIONA SUSTAINABLE GLOBAL ENERGY OUTLOOK
GLOBAL SCENARIO OECD NORTH AMERICALATIN AMERICAOECD EUROPE AFRICA
MIDDLE EASTTRANSITION ECONOMIESINDIA
DEVELOPING ASIACHINAOECD PACIFIC
oecd north america
oecd north america: energy demand by sector
Combining the projections on population development, GDP growthand energy intensity results in future development pathways forNorth America’s energy demand. These are shown in Figure 6.18for both the Reference and Energy [R]evolution Scenarios. Underthe Reference Scenario, total primary energy demand increases bymore than 40% from the current 115,900 PJ/a to 164,300 PJ/ain 2050. In the Energy [R]evolution Scenario, primary energydemand decreases by 33% compared to current consumption and isexpected by 2050 to reach 77,700 PJ/a.
Under the Energy [R]evolution Scenario, electricity demand is expectedto decrease in the industry sector, but to grow in the transport as well asin the residential and service sectors (see Figure 6.19). Total electricitydemand will rise to 5,730 TWh/a in the year 2050. Compared to theReference Scenario, efficiency measures avoid the generation of about2,460 TWh/a. This reduction in energy demand can be achieved inparticular by introducing highly efficient electronic devices using the bestavailable technology in all demand sectors. Employment of solar
architecture in both residential and commercial buildings will help tocurb the growing demand for active air-conditioning.
Efficiency gains in the heat supply sector are even larger. Under theEnergy [R]evolution Scenario, demand for heat supply will grow up to2030, but after that can even be reduced to below the current level (seeFigure 6.20). Compared to the Reference Scenario, consumptionequivalent to 7,850 PJ/a is avoided through efficiency gains by 2050. Asa result of energy-related renovation of the existing stock of residentialbuildings, as well as the introduction of low energy standards and ‘passivehouses’ for new buildings, enjoyment of the same comfort and energyservices will be accompanied by a much lower future energy demand.
In the transport sector, it is assumed under the Energy [R]evolutionScenario that energy demand will decrease by half to 16,720 PJ/aby 2050, saving 65% compared to the Reference Scenario. Thisreduction can be achieved by the introduction of highly efficientvehicles, by shifting the transport of goods from road to rail and bychanges in mobility-related behaviour patterns.
figure 6.18: oecd north america: projection of total final energy demand by sector for the two scenarios
120,000
100,000
80,000
60,000
40,000
20,000
PJ/a 0REF2005
REF2010
REF2020
REF2030
REF2040
REF2050
120,000
100,000
80,000
60,000
40,000
20,000
PJ/a 0E[R]2005
E[R]2010
E[R]2020
E[R]2030
E[R]2040
E[R]2050
figure 6.19: oecd north america: development of electricity demand by sector(‘EFFICIENCY’ = REDUCTION COMPARED TO THE REFERENCE SCENARIO; OTHER SECTORS = SERVICES, HOUSEHOLDS)
9,000
8,000
7,000
6,000
5,000
4,000
3,000
2,000
1,000
TWh/a 02005 2010 2020 2030 2040 2050
figure 6.20: oecd north america: development of heat demand by sector(‘EFFICIENCY’ = REDUCTION COMPARED TO THE REFERENCE SCENARIO)
•• ‘EFFICIENCY’
• INDUSTRY• OTHER SECTORS
•TRANSPORT
35,000
30,000
25,000
20,000
15,000
10,000
5,000
PJ/a 02005 2010 2020 2030 2040 2050

61
6
key resu
lts|
OE
CD
NO
RT
H A
ME
RIC
A - E
LE
CT
RIC
ITY
GE
NE
RA
TIO
N
oecd north america: electricity generation
The development of the electricity supply sector is characterised by adynamically growing renewable energy market and an increasing shareof renewable electricity. This will compensate for the phasing out ofnuclear energy and reduce the number of fossil fuel-fired power plantsrequired for grid stabilisation. By 2050, 94% of the electricityproduced in OECD North America will come from renewable energysources. ‘New’ renewables – mainly wind, solar thermal energy and PV– will contribute over 85% of electricity generation.
Figure 6.22 shows the comparative evolution of the differentrenewable technologies in OECD North America over time. Up to2020, hydro-power and wind will remain the main contributors tothe growing market share. After 2020, the continuing growth ofwind will be complemented by electricity from biomass,photovoltaics and solar thermal (CSP) energy.
figure 6.21: oecd north america: development of electricitygeneration structure under the two scenarios(‘EFFICIENCY’ = REDUCTION COMPARED TO THE REFERENCE SCENARIO)
10,000
9,000
8,000
7,000
6,000
5,000
4,000
3,000
2,000
1,000
TWh/a 0REF2005
E[R] REF2010
E[R] REF2020
E[R] REF2030
E[R] REF2040
E[R] REF2050
E[R]
figure 6.22: oecd north america: growth of renewableelectricity generation capacity under the energy [r]evolution scenario BY INDIVIDUAL SOURCE
•• ‘EFFICIENCY’
• RES IMPORT
• OCEAN ENERGY
• SOLAR THERMAL
• PV
• GEOTHERMAL
•WIND
• HYDRO
• BIOMASS
• GAS & OIL
• COAL
• NUCLEAR
2,000
1,800
1,600
1,400
1,200
1,000
800
600
400
200
GWel 0E[R]2005
E[R]2010
E[R]2020
E[R]2030
E[R]2040
E[R]2050
table 6.2: oecd north america: projection of renewableelectricity generation capacity under the energy[r]evolution scenarioIN GW
2020
217
52
284
22
77
34
5
693
2040
239
130
469
96
410
118
34
1496
2050
246
153
504
118
577
164
51
1814
Hydro
Biomass
Wind
Geothermal
PV
Solarthermal
Ocean energy
Total
2030
230
90
414
55
227
62
15
1092
2010
192
15
35
6
2
2
0.6
263
2005
187
17
9
3
0.04
0.3
0
217
© V
ISSE
R/G
P
© K
ITZ
MA
N/D
RE
AM
STIM
E
image SUN SETTING OFF THE GULF OF MEXICO.
image image CONCENTRATING SOLARPOWER (CSP) AT A SOLAR FARM INDAGGETT, CALIFORNIA, USA.

62
6
key resu
lts|
OE
CD
NO
RT
H A
ME
RIC
A - C
OS
TS
- HE
AT
ING
& C
OO
LIN
G
GLOBAL ENERGY [R]EVOLUTIONA SUSTAINABLE GLOBAL ENERGY OUTLOOK
GLOBAL SCENARIO OECD NORTH AMERICALATIN AMERICAOECD EUROPE AFRICA
MIDDLE EASTTRANSITION ECONOMIESINDIA
DEVELOPING ASIACHINAOECD PACIFIC
oecd north america
oecd north america: future costs of electricity generation
Figure 6.23 shows that the introduction of renewable technologiesunder the Energy [R]evolution Scenario slightly increases the costsof electricity generation compared to the Reference Scenario. Thisdifference will be less than 0.4 cents/kWh up to 2020. Because ofthe lower CO2 intensity of electricity generation, by 2020 electricitygeneration costs will become economically favourable under theEnergy [R]evolution Scenario, and by 2050 generation costs will bemore than 5 cents/kWh below those in the Reference Scenario.
Under the Reference Scenario, on the other hand, unchecked growth indemand, the increase in fossil fuel prices and the cost of CO2 emissionsresult in total electricity supply costs rising from today’s $420 billion peryear to more than $1,350 bn in 2050. Figure 6.24 shows that theEnergy [R]evolution Scenario not only complies with OECD NorthAmerica CO2 reduction targets but also helps to stabilise energy costs andrelieve the economic pressure on society. Increasing energy efficiency andshifting energy supply to renewables leads to long term costs forelectricity supply that are one third lower than in the Reference Scenario.
oecd north america: heat and cooling supply
Today, renewables provide 11% of North America’s primary energydemand for heat supply, the main contribution coming from the useof biomass. The lack of district heating networks is a severestructural barrier to the large scale utilisation of geothermal andsolar thermal energy. Dedicated support instruments are required toensure a dynamic development.
In the Energy [R]evolution Scenario, renewables provide 69% of NorthAmerica’s total heating demand in 2050.
• Energy efficiency measures help to reduce the currently growingdemand for heating and cooling, in spite of improving living standards.
• For direct heating, solar collectors, biomass/biogas as well asgeothermal energy are increasingly substituting for fossil fuel-fired systems.
• A shift from coal and oil to natural gas in the remaining conventionalapplications will lead to a further reduction of CO2 emissions.
figure 6.25: oecd north america: development of heat supply structure under the two scenarios(‘EFFICIENCY’ = REDUCTION COMPARED TO THE REFERENCE SCENARIO)
•• ‘EFFICIENCY’
• GEOTHERMAL
• SOLAR
• BIOMASS
• FOSSIL FUELS
35,000
30,000
25,000
20,000
15,000
10,000
5,000
PJ/a 0REF2005
E[R] REF2010
E[R] REF2020
E[R] REF2030
E[R] REF2040
E[R] REF2050
E[R]figure 6.24: oecd north america: development of total electricity supply costs
•• ENERGY [R]EVOLUTION - ‘EFFICIENCY’ MEASURES
• ENERGY [R]EVOLUTION SCENARIO
• REFERENCE SCENARIO
1,400
1,200
1,000
800
600
400
200
B $/a 0REF2005
E[R] REF2010
E[R] REF2020
E[R] REF2030
E[R] REF2040
E[R] REF2050
E[R]
figure 6.23: oecd north america: development of specificelectricity generation costs under the two scenarios(CO2 EMISSION COSTS IMPOSED FROM 2010, WITH AN INCREASE FROM 15 $/TCO2
IN 2010 TO 50 $/TCO2IN 2050)
16
14
12
10
8
6
$¢/kWh 42000 2010 2020 2030 2040 2050

63
6
key resu
lts|
OE
CD
NO
RT
H A
ME
RIC
A - T
RA
NS
PO
RT
- CO
NS
UM
PT
ION
- CO
2E
MIS
SIO
NS
oecd north america: transport
A key initiative in North America is to introduce incentives to drivesmaller cars, which today are virtually non-existant. In addition, ashift to efficient modes of transport like rail, light rail and bus isimportant, especially in the expanding large metropolitan areas.Together with the rising price of fossil fuels, these changes reduce thehuge growth in car sales projected by the Reference Scenario. In theEnergy [R]evolution Scenario, the car fleet still grows by 20% fromthe year 2000 to 2050. However the energy demand of the transportsector is reduced by 47%. Highly efficient propulsion technology,including hybrid, plug-in hybrid and battery-electric powertrains, willbring large efficiency gains. A quarter of the transport energydemand by 2050 is covered by electricity, 30% by bio fuels.
oecd north america: primary energy consumption
Taking into account the assumptions discussed above, the resultingprimary energy consumption under the Energy [R]evolutionScenario is shown in Figure 6.27. Compared to the ReferenceScenario, overall primary energy demand will be reduced by 53% in2050. Around 66% of the remaining demand in North America willbe covered by renewable energy sources.
oecd north america: development of CO2 emissions
Whilst North America’s emissions of CO2 will increase by 42%under the Reference Scenario, under the Energy [R]evolutionScenario they will decrease from 6,430 million tonnes in 2005 to1,060 m/t in 2050. Annual per capita emissions will drop from14.7 tonnes to 1.8 t. In spite of the phasing out of nuclear energyand increasing demand, CO2 emissions will decrease in theelectricity sector. In the long run efficiency gains and the increaseduse of renewable electricity in the transport sector will even reduceCO2 emissions there. With a share of 46% of total CO2, thetransport sector will be the largest source of emissions in 2050.
figure 6.26: oecd north america: transport under the two scenarios (‘EFFICIENCY’ = REDUCTION COMPARED TO THE REFERENCE SCENARIO)
•• ‘EFFICIENCY’
• HYDROGEN
• ELECTRICITY
• BIO FUELS
• NATURAL GAS
• OIL PRODUCTS
50,000
40,000
30,000
20,000
10,000
PJ/a 0REF2005
E[R] REF2010
E[R] REF2020
E[R] REF2030
E[R] REF2040
E[R] REF2050
E[R]
figure 6.27: oecd north america: development ofprimary energy consumption under the two scenarios(‘EFFICIENCY’ = REDUCTION COMPARED TO THE REFERENCE SCENARIO)
•• ‘EFFICIENCY’
• OCEAN ENERGY
• GEOTHERMAL
• SOLAR
• BIOMASS
•WIND
• HYDRO
• NATURAL GAS
• CRUDE OIL
• COAL
• NUCLEAR
200,000
180,000
160,000
140,000
120,000
100,000
80,000
60,000
40,000
20,000
PJ/a 0REF2005
E[R] REF2010
E[R] REF2020
E[R] REF2030
E[R] REF2040
E[R] REF2050
E[R]
figure 6.28: oecd north america: development of CO2
emissions by sector under the energy [r]evolutionscenario (‘EFFICIENCY’ = REDUCTION COMPARED TO THE REFERENCE SCENARIO)
•• SAVINGS FROM ‘EFFICIENCY’ & RENEWABLES
•TRANSPORT
• OTHER SECTORS• INDUSTRY
• PUBLIC ELECTRICITY & CHP
10,0009,0008,0007,0006,0005,0004,0003,0002,0001,000
Mil t/a 0E[R]2005
E[R]2010
E[R]2020
E[R]2030
E[R]2040
E[R]2050
© V
ISSE
R/G
P
© L
PM
/DR
EA
MST
IME
image CONCENTRATING SOLAR POWER(CSP) AT A SOLAR FARM IN DAGGETT,CALIFORNIA, USA.
image AN OFFSHORE DRILLING RIGDAMAGED BY HURRICANE KATRINA,GULF OF MEXICO.

64
6
key resu
lts|
LA
TIN
AM
ER
ICA
- DE
MA
ND
GLOBAL ENERGY [R]EVOLUTIONA SUSTAINABLE GLOBAL ENERGY OUTLOOK
GLOBAL SCENARIO OECD NORTH AMERICALATIN AMERICAOECD EUROPE AFRICA
MIDDLE EASTTRANSITION ECONOMIESINDIA
DEVELOPING ASIACHINAOECD PACIFIC
latin america
latin america: energy demand by sector
Combining the projections on population development, GDP growthand energy intensity results in future development pathways forLatin America’s energy demand. These are shown in Figure 6.29 forboth the Reference and Energy [R]evolution Scenarios. Under theReference Scenario, total primary energy demand more thandoubles from the current 21,140 PJ/a to 52,300 PJ/a in 2050. Inthe Energy [R]evolution Scenario, a smaller 54% increase oncurrent consumption is expected by 2050, reaching 32,500 PJ/a.
Under the Energy [R]evolution Scenario, electricity demand isexpected to increase disproportionately, with households and servicesthe main source of growing consumption. This is due to wider access toenergy services in developing countries (see Figure 6.30). With theexploitation of efficiency measures, however, an even higher increase
can be avoided, leading to electricity demand of around 2,150 TWh/ain 2050. Compared to the Reference Scenario, efficiency measuresavoid the generation of about 660 TWh/a. This reduction can beachieved in particular by introducing highly efficient electronic devices.Employment of solar architecture in both residential and commercialbuildings will help to curb the growing demand for air-conditioning.
Efficiency gains in the heat supply sector are even larger. Under theEnergy [R]evolution Scenario, final demand for heat supply caneven be reduced (see Figure 6.31). Compared to the ReferenceScenario, consumption equivalent to 2,400 PJ/a is avoided throughefficiency gains by 2050. In the transport sector, it is assumedunder the Energy [R]evolution Scenario that energy demand willincrease by a fifth to 6,100 PJ/a by 2050, saving 50% comparedto the Reference Scenario.
figure 6.29: latin america: projection of total final energy demand by sector for the two scenarios
40,000
35,000
30,000
25,000
20,000
15,000
10,000
5,000
PJ/a 0REF2005
REF2010
REF2020
REF2030
REF2040
REF2050
40,000
35,000
30,000
25,000
20,000
15,000
10,000
5,000
PJ/a 0E[R]2005
E[R]2010
E[R]2020
E[R]2030
E[R]2040
figure 6.30: latin america: development of electricity demand by sector(‘EFFICIENCY’ = REDUCTION COMPARED TO THE REFERENCE SCENARIO; OTHER SECTORS = SERVICES, HOUSEHOLDS)
3,000
2,500
2,000
1,500
1,000
500
TWh/a 02005 2010 2020 2030 2040 2050
figure 6.31: latin america: development of heat demand by sector(‘EFFICIENCY’ = REDUCTION COMPARED TO THE REFERENCE SCENARIO)
•• ‘EFFICIENCY’
• INDUSTRY• OTHER SECTORS
•TRANSPORT
14,000
12,000
10,000
8,000
6,000
4,000
2,000
PJ/a 02005 2010 2020 2030 2040 2050

65
6
key resu
lts|
LA
TIN
AM
ER
ICA
- EL
EC
TR
ICIT
Y G
EN
ER
AT
ION
latin america: electricity generation
The development of the electricity supply sector is characterised byan increasing share of renewable electricity. By 2050, 95% of theelectricity produced in Latin America will come from renewableenergy sources. ‘New’ renewables – mainly wind, solar thermalenergy and PV – will contribute more than 60% of electricitygeneration. The installed capacity of renewable energy technologieswill grow from the current 139 GW to 695 GW in 2050 - increasingrenewable capacity by a factor of five within the next 42 years.
Figure 6.33 shows the comparative evolution of the different renewabletechnologies over time. Up to 2020, hydro-power and wind will remainthe main contributors to the growing market share. After 2020, thecontinuing growth of wind will be complemented by electricity frombiomass, photovoltaics and solar thermal (CSP) energy.
table 6.3: latin america: projection of renewableelectricity generation capacity under the energy[r]evolution scenarioIN GW
2020
167
33
47
3
10
3
0.6
264
2040
174
59
179
9
79
9
3
515
2050
179
75
274
16
114
16
7
695
Hydro
Biomass
Wind
Geothermal
PV
Solarthermal
Ocean energy
Total
2030
171
45
88
5
57
5
1
372
2010
159
11
3
1
0.5
0
0
174
2005
135
4
0.2
0.4
0
0
0
139
figure 6.32: latin america: development of electricitygeneration structure under the two scenarios(‘EFFICIENCY’ = REDUCTION COMPARED TO THE REFERENCE SCENARIO)
3,500
3,000
2,500
2,000
1,500
1,000
500
TWh/a 0REF2005
E[R] REF2010
E[R] REF2020
E[R] REF2030
E[R] REF2040
E[R] REF2050
E[R]
figure 6.33: latin america: growth of renewableelectricity generation capacity under the energy[r]evolution scenarioBY INDIVIDUAL SOURCE
•• ‘EFFICIENCY’
• RES IMPORT
• OCEAN ENERGY
• SOLAR THERMAL
• PV
• GEOTHERMAL
•WIND
• HYDRO
• BIOMASS
• GAS & OIL
• COAL
• NUCLEAR
800
700
600
500
400
300
200
100
GWel 0E[R]2005
E[R]2010
E[R]2020
E[R]2030
E[R]2040
E[R]2050
© G
P/F
LA
VIO
CA
NN
AL
ON
GA
© G
P/F
LA
VIO
CA
NN
AL
ON
GA
image VOLUNTEERS CHECK THE SOLARPANELS ON TOP OF GREENPEACEPOSITIVE ENERGY TRUCK, BRAZIL.
image WIND TURBINES IN FORTALEZ,CEARÀ, BRAZIL.

66
6
key resu
lts|
LA
TIN
AM
ER
ICA
- CO
ST
S - H
EA
TIN
G &
CO
OL
ING
GLOBAL ENERGY [R]EVOLUTIONA SUSTAINABLE GLOBAL ENERGY OUTLOOK
GLOBAL SCENARIO OECD NORTH AMERICALATIN AMERICAOECD EUROPE AFRICA
MIDDLE EASTTRANSITION ECONOMIESINDIA
DEVELOPING ASIACHINAOECD PACIFIC
latin america
latin america: future costs of electricity generation
Figure 6.34 shows that the introduction of renewable technologiesunder the Energy [R]evolution Scenario significantly decreases thefuture costs of electricity generation compared to the ReferenceScenario. Because of the lower CO2 intensity of electricitygeneration, costs will become economically favourable under theEnergy [R]evolution Scenario. By 2050 generation costs will bemore than 8 cents/kWh below those in the Reference Scenario.
Under the Reference Scenario, on the other hand, unchecked growth indemand, the increase in fossil fuel prices and the cost of CO2 emissionsresult in total electricity supply costs rising from today’s $70 billion peryear to more than $551 bn in 2050. Figure 6.35 shows that the Energy[R]evolution Scenario not only complies with Latin America’s CO2
reduction targets but also helps to stabilise energy costs and relieve theeconomic pressure on society. Increasing energy efficiency and shiftingenergy supply to renewables leads to long term costs for electricitysupply that are one third lower than in the Reference Scenario.
latin america: heat and cooling supply
Today, renewables provide around 40% of primary energy demand forheat supply in Latin America, the main contribution coming from theuse of biomass. The availability of less efficient but cheap appliances isa severe structural barrier to efficiency gains. Large-scale utilisation ofgeothermal and solar thermal energy for heat supply will be largelyrestricted to the industrial sector.
In the Energy [R]evolution Scenario, renewables provide 83% of LatinAmerica’s total heating and cooling demand in 2050.
• Energy efficiency measures restrict the future primary energydemand for heat and cooling supply to a 60% increase, in spiteof improving living standards.
• In the industry sector solar collectors, biomass/biogas as well asgeothermal energy are increasingly replacing conventional fossilfuel-fired heating systems.
• A shift from coal and oil to natural gas in the remaining conventionalapplications leads to a further reduction of CO2 emissions.
figure 6.36: latin america: development of heat supplystructure under the two scenarios(‘EFFICIENCY’ = REDUCTION COMPARED TO THE REFERENCE SCENARIO)
•• ‘EFFICIENCY’
• GEOTHERMAL
• SOLAR
• BIOMASS
• FOSSIL FUELS
14,000
12,000
10,000
8,000
6,000
4,000
2,000
PJ/a 0REF2005
E[R] REF2010
E[R] REF2020
E[R] REF2030
E[R] REF2040
E[R] REF2050
E[R]figure 6.35: latin america: development of total electricity supply costs
•• ENERGY [R]EVOLUTION - ‘EFFICIENCY’ MEASURES
• ENERGY [R]EVOLUTION SCENARIO
• REFERENCE SCENARIO
600
500
400
300
200
100
B $/a 0REF2005
E[R] REF2010
E[R] REF2020
E[R] REF2030
E[R] REF2040
E[R] REF2050
E[R]
figure 6.34: latin america: development of specificelectricity generation costs under the two scenarios(CO2 EMISSION COSTS IMPOSED FROM 2020, WITH AN INCREASE FROM 20 $/TCO2
IN 2020 TO 50 $/TCO2IN 2050)
18
16
14
12
10
8
6
4
2
$¢/kWh 02000 2010 2020 2030 2040 2050

67
6
key resu
lts|
LA
TIN
AM
ER
ICA
- TR
AN
SP
OR
T - C
ON
SU
MP
TIO
N - C
O2
EM
ISS
ION
S
latin america: transport
Despite a huge growth in services, the increase in energy consumptionin the transport sector by 2050 can be limited to 19% under theEnergy [R]evolution Scenario. Current 90% dependency on fossil fuelsis transformed into a 30% contribution from bio fuels and 22% fromelectricity. The market for cars will grow by a factor of five less than inthe Reference Scenario. Measures are taken to keep the car sales splitby segment like its present breakdown, with one third represented bymedium-sized vehicles and more than half by small vehicles.Technological progress increases the share of hybrid vehicles to 65% in2050. Incentives to use more efficient transport modes reduces vehiclekilometre travelled to in average 11.000 km per annum.
latin america: primary energy consumption
Taking into account the assumptions discussed above, the resultingprimary energy consumption under the Energy [R]evolutionScenario is shown in Figure 6.38. Compared to the ReferenceScenario, overall energy demand will be reduced by about 38% in2050. Latin America’s energy demand will increase from 21,000PJ/a to 32,500 PJ/a. Around 70% of this will be covered byrenewable energy sources.
latin america: development of CO2 emissions
Whilst Latin America’s emissions of CO2 will almost triple underthe Reference Scenario, under the Energy [R]evolution Scenariothey will decrease from 830 million tonnes in 2005 to 370 m/t in2050. Annual per capita emissions will drop from 1.8 tonnes to 0.6t. In spite of the phasing out of nuclear energy and increasingdemand, CO2 emissions will decrease in the electricity sector. In thelong run efficiency gains and the increased use of renewableelectricity in vehicles will even reduce CO2 emissions in thetransport sector. With a share of 53% of total CO2 in 2050, thetransport sector will remain the largest source of emissions.
figure 6.37: latin america: transport under the two scenarios (‘EFFICIENCY’ = REDUCTION COMPARED TO THE REFERENCE SCENARIO)
•• ‘EFFICIENCY’
• HYDROGEN
• ELECTRICITY
• BIO FUELS
• NATURAL GAS
• OIL PRODUCTS
14,000
12,000
10,000
8,000
6,000
4,000
2,000
PJ/a 0REF2005
E[R] REF2010
E[R] REF2020
E[R] REF2030
E[R] REF2040
E[R] REF2050
E[R]
figure 6.38: latin america: development of primaryenergy consumption under the two scenarios(‘EFFICIENCY’ = REDUCTION COMPARED TO THE REFERENCE SCENARIO)
•• ‘EFFICIENCY’
• OCEAN ENERGY
• GEOTHERMAL
• SOLAR
• BIOMASS
•WIND
• HYDRO
• NATURAL GAS
• CRUDE OIL
• COAL
• NUCLEAR
60,000
50,000
40,000
30,000
20,000
10,000
PJ/a 0REF2005
E[R] REF2010
E[R] REF2020
E[R] REF2030
E[R] REF2040
E[R] REF2050
E[R]
figure 6.39: latin america: development of CO2 emissionsby sector under the energy [r]evolution scenario(‘EFFICIENCY’ = REDUCTION COMPARED TO THE REFERENCE SCENARIO)
•• SAVINGS FROM ‘EFFICIENCY’ & RENEWABLES
•TRANSPORT
• OTHER SECTORS• INDUSTRY
• PUBLIC ELECTRICITY & CHP
2,500
2,000
1,500
1,000
500
Mil t/a 0E[R]2005
E[R]2010
E[R]2020
E[R]2030
E[R]2040
E[R]2050
© G
P/F
LAV
IO C
AN
NA
LON
GA
© G
P/A
NA
CL
AU
DIA
JA
TAH
Yimage GROUP OF YOUNG PEOPLE FEEL THE HEAT GENERATED BY A SOLAR COOKING STOVE IN BRAZIL.
image IN 2005 THE WORST DROUGHT IN MORE THAN 40 YEARS DAMAGED THE WORLD’SLARGEST RAIN FOREST IN THE BRAZILIAN AMAZON, WITH WILDFIRES BREAKING OUT,POLLUTED DRINKING WATER AND THE DEATH OF MILLIONS FISH AS STREAMS DRY UP.

68
6
key resu
lts|
OE
CD
EU
RO
PE
- DE
MA
ND
GLOBAL ENERGY [R]EVOLUTIONA SUSTAINABLE GLOBAL ENERGY OUTLOOK
GLOBAL SCENARIO OECD NORTH AMERICALATIN AMERICAOECD EUROPE AFRICA
MIDDLE EASTTRANSITION ECONOMIESINDIA
DEVELOPING ASIACHINAOECD PACIFIC
oecd europe
oecd europe: energy demand by sector
The future development pathways for Europe’s energy demand areshown in Figure 6.40 for both the Reference and Energy [R]evolutionScenarios. Under the Reference Scenario, total primary energy demandin OECD Europe increases by more than 10% from the current81,500 PJ/a to 90,300 PJ/a in 2050. In the Energy [R]evolutionScenario, demand decreases by 40% compared to currentconsumption, reaching 48,900 PJ/a by the end of the scenario period.
Under the Energy [R]evolution Scenario, electricity demand in allthree sectors is expected to decrease after 2015 (see Figure 6.41).Because of the growing use of electric vehicles, however, electricityuse for transport increases to 3,520 TWh/a in the year 2050.Compared to the Reference Scenario, efficiency measures avoid thegeneration of about 1,460 TWh/a. This reduction in energy demandcan be achieved in particular by introducing highly efficientelectronic devices using the best available technology.
Efficiency gains in the heat supply sector are even larger. Under theEnergy [R]evolution Scenario, final demand for heat supply can even bereduced (see Figure 6.42). Compared to the Reference Scenario,consumption equivalent to 7,350 PJ/a is avoided through efficiency gainsby 2050. As a result of energy-related renovation of the existing stock ofresidential buildings, as well as the introduction of low energy standardsand new ‘passive houses’, enjoyment of the same comfort and energyservices will be accompanied by a much lower future energy demand.
In the transport sector, it is assumed under the Energy [R]evolutionScenario that energy demand will decrease by almost half to 8700PJ/a by 2050, saving 58% compared to the Reference Scenario. Thisreduction can be achieved by the introduction of highly efficientvehicles, by shifting the transport of goods from road to rail and bychanges in mobility-related behaviour patterns.
figure 6.40: oecd europe: projection of total final energy demand by sector for the two scenarios
70,000
60,000
50,000
40,000
30,000
20,000
10,000
PJ/a 0REF2005
REF2010
REF2020
REF2030
REF2040
REF2050
70,000
60,000
50,000
40,000
30,000
20,000
10,000
PJ/a 0E[R]2005
E[R]2010
E[R]2020
E[R]2030
E[R]2040
E[R]2050
figure 6.41: oecd europe: development of electricity demand by sector(‘EFFICIENCY’ = REDUCTION COMPARED TO THE REFERENCE SCENARIO; OTHER SECTORS = SERVICES, HOUSEHOLDS)
6,000
5,000
4,000
3,000
2,000
1,000
TWh/a 02005 2010 2020 2030 2040 2050
figure 6.42: oecd europe: development of heat demand by sector(‘EFFICIENCY’ = REDUCTION COMPARED TO THE REFERENCE SCENARIO)
•• ‘EFFICIENCY’
• INDUSTRY• OTHER SECTORS
•TRANSPORT
30,000
25,000
20,000
15,000
10,000
5,000
PJ/a 02005 2010 2020 2030 2040 2050

69
6
key resu
lts|
OE
CD
EU
RO
PE
- EL
EC
TR
ICIT
Y G
EN
ER
AT
ION
oecd europe: electricity generation
The development of the electricity supply sector is characterised bya dynamically growing renewable energy market. This willcompensate for the phasing out of nuclear energy and reduce thenumber of fossil fuel-fired power plants required for gridstabilisation. By 2050, 86% of the electricity produced in OECDEurope will come from renewable energy sources. ‘New’ renewables– mainly wind, solar thermal energy and PV – will contribute 67%.
The installed capacity of renewable energy technologies will growfrom the current 250 GW to 1,030 GW in 2050, increasingrenewables capacity by a factor of four. Figure 6.44 shows theevolution of the different renewable technologies. Up to 2020,hydro-power and wind will remain the main contributors to thegrowing market share. After 2020, the continuing growth of windwill be complemented by electricity from biomass, photovoltaicsand solar thermal (CSP) energy.
None of these numbers describe a maximum feasibility, but apossible balanced approach. With the right policy development, thesolar industry believes that a much further uptake could happen.This is particularly true for concentrated solar power (CSP) whichcould unfold to 30GW already by 2020 and more than 120GW in2050. The photovoltaic industry believes in a possible electricitygeneration capacity of 350GW by 2020 in Europe alone, assumingthe necessary policy changes.
table 6.4: oecd europe: projection of renewableelectricity generation capacity under the energy[r]evolution scenarioIN GW 2020
179
61
215
3
96
9
1
564
2040
182
82
309
18
287
27
10
915
2050
182
88
333
26
357
31
15
1033
Hydro
Biomass
Wind
Geothermal
PV
Solarthermal
Ocean energy
Total
2030
181
69
254
8
187
17
5
720
2010
174
37
87
1.5
10
0.7
0
312
2005
184
22
42
1
1.5
0
0
251
figure 6.43: oecd europe: development of electricitygeneration structure under the two scenarios(‘EFFICIENCY’ = REDUCTION COMPARED TO THE REFERENCE SCENARIO)
6,000
5,000
4,000
3,000
2,000
1,000
TWh/a 0REF2005
E[R] REF2010
E[R] REF2020
E[R] REF2030
E[R] REF2040
E[R] REF2050
E[R]
figure 6.44: oecd europe: growth of renewable electricity generation capacity under the energy[r]evolution scenarioBY INDIVIDUAL SOURCE
•• ‘EFFICIENCY’
• RES IMPORT
• OCEAN ENERGY
• SOLAR THERMAL
• PV
• GEOTHERMAL
•WIND
• HYDRO
• BIOMASS
• GAS & OIL
• COAL
• NUCLEAR
1,200
1,000
800
600
400
200
GWel 0E[R]2005
E[R]2010
E[R]2020
E[R]2030
E[R]2040
E[R]2050
© G
P/D
AV
ISO
N
© L
AN
GR
OC
K/Z
EN
IT/G
P
image image OFFSHORE WINDFARM,MIDDELGRUNDEN, COPENHAGEN,DENMARK.
image MAN USING METAL GRINDER ONPART OF A WIND TURBINE MAST IN THEVESTAS FACTORY, CAMBELTOWN,SCOTLAND, GREAT BRITAIN.

70
6
key resu
lts|
OE
CD
EU
RO
PE
- CO
ST
S - H
EA
TIN
G &
CO
OL
ING
GLOBAL ENERGY [R]EVOLUTIONA SUSTAINABLE GLOBAL ENERGY OUTLOOK
GLOBAL SCENARIO OECD NORTH AMERICALATIN AMERICAOECD EUROPE AFRICA
MIDDLE EASTTRANSITION ECONOMIESINDIA
DEVELOPING ASIACHINAOECD PACIFIC
oecd europe
oecd europe: future costs of electricity generation
Figure 6.45 shows that the introduction of renewable technologiesunder the Energy [R]evolution Scenario slightly increases the costs ofelectricity generation compared to the Reference Scenario. Thisdifference will be less than 0.4 cents/kWh up to 2020, however.Because of the lower CO2 intensity of electricity generation, electricitygeneration costs will become economically favourable under theEnergy [R]evolution Scenario by 2020, and by 2050 costs will bemore than 3 cents/kWh below those in the Reference Scenario.
Under the Reference Scenario, the unchecked growth in demand, theincrease in fossil fuel prices and the cost of CO2 emissions result intotal electricity supply costs rising from today’s $330 billion per yearto more than $800 bn in 2050. Figure 6.46 shows that the Energy[R]evolution Scenario not only complies with OECD Europe CO2
reduction targets but also helps to stabilise energy costs and relieve theeconomic pressure on society. Increasing energy efficiency and shiftingenergy supply to renewables leads to long term costs for electricitysupply that are one third lower than in the Reference Scenario.
oecd europe: heat and cooling supply
Renewables currently provide 11% of OECD Europe’s primaryenergy demand for heat supply, the main contribution coming fromthe use of biomass. The lack of district heating networks is a severestructural barrier to the large scale utilisation of geothermal andsolar thermal energy.
In the Energy [R]evolution Scenario, renewables provide 61% ofOECD Europe’s total heating and cooling demand in 2050.
• Energy efficiency measures can decrease the current demand forheat supply by 18%, in spite of improving living standards.
• For direct heating, solar collectors, biomass/biogas as well asgeothermal energy are increasingly substituting for fossil fuel-fired systems.
figure 6.47: oecd europe: development of heat supplystructure under the two scenarios(‘EFFICIENCY’ = REDUCTION COMPARED TO THE REFERENCE SCENARIO)
•• ‘EFFICIENCY’
• GEOTHERMAL
• SOLAR
• BIOMASS
• FOSSIL FUELS
30,000
25,000
20,000
15,000
10,000
5,000
PJ/a 0REF2005
E[R] REF2010
E[R] REF2020
E[R] REF2030
E[R] REF2040
E[R] REF2050
E[R]figure 6.46: oecd europe: development of total electricity supply costs
•• ENERGY [R]EVOLUTION - ‘EFFICIENCY’ MEASURES
• ENERGY [R]EVOLUTION SCENARIO
• REFERENCE SCENARIO
1,000
900
800
700
600
500
400
300
200
100
B $/a 0REF2005
E[R] REF2010
E[R] REF2020
E[R] REF2030
E[R] REF2040
E[R] REF2050
E[R]
figure 6.45: oecd europe: development of specificelectricity generation costs under the two scenarios(CO2 EMISSION COSTS IMPOSED FROM 2010, WITH AN INCREASE FROM 15 $/TCO2
IN 2010 TO 50 $/TCO2IN 2050)
14
13
12
11
10
9
8
7
6
$¢/kWh 52000 2010 2020 2030 2040 2050

71
6
key resu
lts|
OE
CD
EU
RO
PE
- TR
AN
SP
OR
T - C
ON
SU
MP
TIO
N - C
O2
EM
ISS
ION
S
oecd europe: transport
In the transport sector, it is assumed under the Energy [R]evolutionScenario that energy demand will decrease by almost half to 8,700PJ/a by 2050, saving 57% compared to the Reference Scenario. Thisreduction can be achieved by the introduction of highly efficient vehicles,by shifting the transport of goods from road to rail and by changes inbehaviour patterns. By implementing attractive alternatives to individualcars, the car fleet will grow more slowly than in the Reference Scenario,reaching 235 million cars in 2050. A slight shift towards smaller cars -triggered by economic incentives coupled with a significant movetowards electrified power trains and a reduction of vehicle kilometrestravelled by 0.25% per year - leads to 60% final energy savings. In2050, electricity will provide 35% of the transport sector’s total energydemand, while 21% of the demand will be covered by bio fuels.
oecd europe: primary energy consumption
Taking into account the assumptions discussed above, the resultingprimary energy consumption under the Energy [R]evolution Scenariois shown in Figure 6.49. Compared to the Reference Scenario, overallenergy demand will be reduced by 46% in 2050. Around 60% of theremaining demand will be covered by renewable energy sources.
oecd europe: development of CO2 emissions
While CO2 emissions in OECD Europe will increase by 12% underthe Reference Scenario by 2050, in the Energy [R]evolution Scenariothey will decrease from 4,060 million tonnes in 2005 to 880 m/t in2050. Annual per capita emissions will drop from 7.6 tonnes to 1.6t. In spite of the phasing out of nuclear energy and increasingdemand, CO2 emissions will decrease in the electricity sector. In thelong run efficiency gains and the increased use of renewableelectricity in vehicles will reduce emissions in the transport sector.With a share of 14% of total CO2 in 2050, the power sector willdrop below transport as the largest source of emissions.
figure 6.48: oecd europe: transport under the two scenarios (‘EFFICIENCY’ = REDUCTION COMPARED TO THE REFERENCE SCENARIO)
•• ‘EFFICIENCY’
• HYDROGEN
• ELECTRICITY
• BIO FUELS
• NATURAL GAS
• OIL PRODUCTS
25,000
20,000
15,000
10,000
5,000
PJ/a 0REF2005
E[R] REF2010
E[R] REF2020
E[R] REF2030
E[R] REF2040
E[R] REF2050
E[R]
figure 6.49: oecd europe: development of primaryenergy consumption under the two scenarios(‘EFFICIENCY’ = REDUCTION COMPARED TO THE REFERENCE SCENARIO)
•• ‘EFFICIENCY’
• RES ELECTRICITY EXPORT
• OCEAN ENERGY
• GEOTHERMAL
• SOLAR
• BIOMASS
•WIND
• HYDRO
• NATURAL GAS
• CRUDE OIL
• COAL
• NUCLEAR
100,000
90,000
80,000
70,000
60,000
50,000
40,000
30,000
20,000
10,000
PJ/a 0REF2005
E[R] REF2010
E[R] REF2020
E[R] REF2030
E[R] REF2040
E[R] REF2050
E[R]
figure 6.50: oecd europe: development of CO2 emissions by sector under the energy [r]evolution scenario (‘EFFICIENCY’ = REDUCTION COMPARED TO THE REFERENCE SCENARIO)
•• SAVINGS FROM ‘EFFICIENCY’ & RENEWABLES
•TRANSPORT
• OTHER SECTORS• INDUSTRY
• PUBLIC ELECTRICITY & CHP
5,0004,5004,0003,5003,0002,5002,0001,5001,000
500Mil t/a 0
E[R]2005
E[R]2010
E[R]2020
E[R]2030
E[R]2040
E[R]2050
© G
P/C
OB
BIN
G
© R
ED
ON
DO
/GP
image PLANT NEAR REYKJAVIK WHEREENERGY IS PRODUCED FROM THEGEOTHERMAL ACTIVITY.
image WORKERS EXAMINE PARABOLICTROUGH COLLECTORS IN THE PS10 SOLARTOWER PLANT AT SAN LUCAR LA MAYOROUTSIDE SEVILLE, SPAIN, 2008.

72
6
key resu
lts|
AF
RIC
A - D
EM
AN
D
GLOBAL ENERGY [R]EVOLUTIONA SUSTAINABLE GLOBAL ENERGY OUTLOOK
GLOBAL SCENARIO OECD NORTH AMERICALATIN AMERICAOECD EUROPE AFRICA
MIDDLE EASTTRANSITION ECONOMIESINDIA
DEVELOPING ASIACHINAOECD PACIFIC
africa
africa: energy demand by sector
Future development pathways for Africa’s energy demand are shown inFigure 6.51 for both the Reference and Energy [R]evolution Scenarios.Under the Reference Scenario, total primary energy demand more thandoubles from the current 25,200 PJ/a to 53,300 PJ/a in 2050. In theEnergy [R]evolution Scenario, a much smaller 50% increase oncurrent consumption is expected by 2050 to reach 38,300 PJ/a.
Under the Energy [R]evolution Scenario, electricity demand in Africais expected to increase disproportionately, with households andservices the main source of growing consumption (see Figure 6.52).With the exploitation of efficiency measures, however, an even higherincrease can be avoided, leading to electricity demand of around1,340 TWh/a in the year 2050. Compared to the Reference Scenario,efficiency measures avoid the generation of about 620 TWh/a.
Efficiency gains in the heat supply sector are also significant. Underthe Energy [R]evolution Scenario, final demand for heat supply caneven be reduced (see Figure 6.53). Compared to the ReferenceScenario, consumption equivalent to 550 PJ/a is avoided throughefficiency gains by 2050.
In the transport sector, it is assumed under the Energy [R]evolutionScenario that energy demand will almost double to 5,300 PJ/a by2050, still saving 46% compared to the Reference Scenario. Thisreduction can be achieved by the introduction of highly efficientvehicles, by shifting the transport of goods from road to rail and bychanges in mobility-related behaviour.
figure 6.51: africa: projection of total final energy demand by sector for the two scenarios
REF2005
REF2010
REF2020
REF2030
REF2040
REF2050
40,000
35,000
30,000
25,000
20,000
15,000
10,000
5,000
PJ/a 0E[R]2005
E[R]2010
E[R]2020
E[R]2030
E[R]2040
E[R]2050
figure 6.52: africa: development of electricity demand by sector(‘EFFICIENCY’ = REDUCTION COMPARED TO THE REFERENCE SCENARIO; OTHER SECTORS = SERVICES, HOUSEHOLDS)
2,500
2,000
1,500
1,000
500
TWh/a 02005 2010 2020 2030 2040 2050
figure 6.53: africa: development of heat demand by sector(‘EFFICIENCY’ = REDUCTION COMPARED TO THE REFERENCE SCENARIO)
•• ‘EFFICIENCY’
• INDUSTRY• OTHER SECTORS
•TRANSPORT
16,000
14,000
12,000
10,000
8,000
6,000
4,000
2,000
PJ/a 02005 2010 2020 2030 2040 2050
40,000
35,000
30,000
25,000
20,000
15,000
10,000
5,000
PJ/a 0

73
6
key resu
lts|
AF
RIC
A - E
LE
CT
RIC
ITY
GE
NE
RA
TIO
N
africa: electricity generation
The development of the electricity supply sector is characterised bya dynamically growing renewable energy market and an increasingshare of renewable electricity. By 2050, 73% of the electricityproduced in Africa will come from renewable energy sources. Amain driver for the development of solar power generationcapacities will be the export of solar electricity to OECD Europe.‘New’ renewables – mainly wind, solar thermal energy and PV –will contribute more than 60% of electricity generation.
The installed capacity of renewable energy technologies will growfrom the current 21 GW to 388 GW in 2050, increasing renewablecapacity by a factor of 18 over the next 42 years. More than 60GW CSP plants will produce electricity for export to Europe.
Figure 6.55 shows the comparative evolution of different renewabletechnologies over time. Up to 2020, hydro-power and wind will remainthe main contributors to the growing market share. After 2020, thecontinuing growth of wind will be complemented by electricity frombiomass, photovoltaics and solar thermal (CSP) energy.
table 6.5: africa: projection of renewable electricitygeneration capacity under the energy [r]evolution scenarioIN GW
2020
30
3
10
1
8
10
0.6
62
2040
39
7
31
4
105
58
3
246
2050
45
8
51
6
175
100
4
388
Hydro
Biomass
Wind
Geothermal
PV
Solarthermal
Ocean energy
Total
2030
34
5
21
3
55
14
2
134
2010
24
0.6
1.4
0.2
0.5
1
0
28
2005
21
0.1
0.4
0.1
0
0
0
21
figure 6.54: africa: development of electricitygeneration structure under the two scenarios(‘EFFICIENCY’ = REDUCTION COMPARED TO THE REFERENCE SCENARIO)
3,000
2,500
2,000
1,500
1,000
500
TWh/a 0REF2005
E[R] REF2010
E[R] REF2020
E[R] REF2030
E[R] REF2040
E[R] REF2050
E[R]
figure 6.55: africa: growth of renewable electricitygeneration capacity under the energy [r]evolution scenarioBY INDIVIDUAL SOURCE
•• ‘EFFICIENCY’
• RES IMPORT
• OCEAN ENERGY
• SOLAR THERMAL
• PV
• GEOTHERMAL
•WIND
• HYDRO
• BIOMASS
• GAS & OIL
• COAL
• NUCLEAR
450
400
350
300
250
200
150
100
50
GWel 0E[R]2005
E[R]2010
E[R]2020
E[R]2030
E[R]2040
E[R]2050
© C
LIV
E S
HIR
LE
Y/G
P
© P
. AL
LE
N/D
RE
AM
STIM
E
image GARIEP DAM, FREE STATE, SOUTH AFRICA.
image WOMEN FARMERS FROM LILONGWE, MALAWI STAND IN THEIR DRY, BARRENFIELDS CARRYING ON THEIR HEADS AID ORGANISATION HANDOUTS. THIS AREA,THOUGH EXTREMELY POOR HAS BEEN SELF-SUFFICIENT WITH FOOD. NOW THESEWOMEN’S CHILDREN ARE SUFFERING FROM MALNUTRITION.

74
6
key resu
lts|
AF
RIC
A - C
OS
TS
- HE
AT
ING
& C
OO
LIN
G
GLOBAL ENERGY [R]EVOLUTIONA SUSTAINABLE GLOBAL ENERGY OUTLOOK
GLOBAL SCENARIO OECD NORTH AMERICALATIN AMERICAOECD EUROPE AFRICA
MIDDLE EASTTRANSITION ECONOMIESINDIA
DEVELOPING ASIACHINAOECD PACIFIC
africa
africa: future costs of electricity generation
Figure 6.56 shows that the introduction of renewable technologiesunder the Energy [R]evolution Scenario significantly decreases thefuture costs of electricity generation. Because of the lower CO2
intensity, electricity generation costs will steadily become moreeconomic under the Energy [R]evolution Scenario and by 2050 willbe more than 9 cents/kWh below those in the Reference Scenario.
Under the Reference Scenario, by contrast, unchecked demandgrowth, the increase in fossil fuel prices and the cost of CO2
emissions result in total electricity supply costs rising from today’s$59 billion per year to more than $468 bn in 2050. Figure 6.57shows that the Energy [R]evolution Scenario not only complies withAfrica’s CO2 reduction targets but also helps to stabilise energycosts. Increasing energy efficiency and shifting energy supply torenewables leads to long term costs for electricity supply that areone third lower than in the Reference Scenario.
africa: heat and cooling supply
Today, renewables provide around 75% of primary energy demand forheat supply in Africa, the main contribution coming from the use ofbiomass. The availability of less efficient but cheap appliances is asevere structural barrier to efficiency gains. Large-scale utilisation ofgeothermal and solar thermal energy for heat supply is restricted to theindustrial sector. Dedicated support instruments are required to ensurea continuously dynamic development of renewables in the heat market.
In the Energy [R]evolution Scenario, renewables provide 72% ofAfrica’s total heating and cooling demand in 2050.
• Energy efficiency measures can restrict the future energy demandfor heat and cooling supply to a 50% increase, in spite ofimproving living standards.
• In the industry sector solar collectors, biomass/biogas as well asgeothermal energy are increasingly substituting for conventionalfossil-fired heating systems.
• A shift from coal and oil to natural gas in the remaining conventionalapplications leads to a further reduction of CO2 emissions.
figure 6.58: africa: development of heat supplystructure under the two scenarios(‘EFFICIENCY’ = REDUCTION COMPARED TO THE REFERENCE SCENARIO)
•• ‘EFFICIENCY’
• GEOTHERMAL
• SOLAR
• BIOMASS
• FOSSIL FUELS
16,000
14,000
12,000
10,000
8,000
6,000
4,000
2,000
PJ/a 0REF2005
E[R] REF2010
E[R] REF2020
E[R] REF2030
REF2040
E[R] REF2050
E[R]
figure 6.57: africa: development of total electricity supply costs
•• ENERGY [R]EVOLUTION - ‘EFFICIENCY’ MEASURES
• ENERGY [R]EVOLUTION SCENARIO
• REFERENCE SCENARIO
500
450
400
350
300
250
200
150
100
50
B $/a 0REF2005
E[R] REF2010
E[R] REF2020
E[R] REF2030
E[R] REF2040
E[R] REF2050
E[R]
figure 6.56: africa: development of specific electricitygeneration costs under the two scenarios(CO2 EMISSION COSTS IMPOSED FROM 2020, WITH AN INCREASE FROM 20 $/TCO2
IN 2020 TO 50 $/TCO2IN 2050)
22
20
18
16
14
12
10
8
6
$¢/kWh 42000 2010 2020 2030 2040 2050

75
6
key resu
lts|
AF
RIC
A - T
RA
NS
PO
RT
- CO
NS
UM
PT
ION
- CO
2E
MIS
SIO
NS
africa: transport
In the transport sector, it is assumed under the Energy [R]evolutionScenario that energy demand will almost double to 5,300 PJ/a by 2050,still saving 46% compared to the Reference Scenario. This reduction canbe achieved by the introduction of highly efficient vehicles, by shifting thetransport of goods from road to rail and by changes in mobility-relatedbehaviour. The African car fleet is projected to grow by a factor of 6 toroughly 100 million vehicles. Development of fuel efficiency is delayed by20 years compared to other world regions for economic reasons. By2050, Africa will still have the lowest average fuel consumption.
africa: primary energy consumption
Taking into account the assumptions discussed above, the resultingprimary energy consumption under the Energy [R]evolution Scenariois shown in Figure 6.60. Compared to the Reference Scenario,overall energy demand will be reduced by about 30% in 2050.Under the Energy [R]evolution Scenario, Africa’s energy demandwill increase from 25,200 PJ/a to 38,300 PJ/a in 2050. Around56% of this demand will be covered by renewable energy sources.
africa: development of CO2 emissions
While Africa’s emissions of CO2 will almost triple under the ReferenceScenario, under the Energy [R]evolution Scenario they will increasefrom 780 million tonnes in 2003 to 895 m/t in 2050. Annual percapita emissions will drop from 0.8 tonnes to 0.45 t. In spite ofincreasing demand, CO2 emissions will decrease in the electricitysector. In the long run efficiency gains and the increased use of biofuels and electricity will reduce CO2 emissions in the transport sector.With a share of 28% of total CO2 in 2050, the power sector will dropbelow transport as the largest source of emissions.
figure 6.59: africa: transport under the two scenarios(‘EFFICIENCY’ = REDUCTION COMPARED TO THE REFERENCE SCENARIO)
•• ‘EFFICIENCY’
• HYDROGEN
• ELECTRICITY
• BIO FUELS
• NATURAL GAS
• OIL PRODUCTS
12,000
10,000
8,000
6,000
4,000
2,000
PJ/a 0REF2005
E[R] REF2010
E[R] REF2020
E[R] REF2030
E[R] REF2040
E[R] REF2050
E[R]
figure 6.60: africa: development of primary energyconsumption under the two scenarios(‘EFFICIENCY’ = REDUCTION COMPARED TO THE REFERENCE SCENARIO)
•• ‘EFFICIENCY’
• OCEAN ENERGY
• GEOTHERMAL
• SOLAR
• BIOMASS
•WIND
• HYDRO
• NATURAL GAS
• CRUDE OIL
• COAL
• NUCLEAR
60,000
50,000
40,000
30,000
20,000
10,000
PJ/a 0REF2005
E[R] REF2010
E[R] REF2020
E[R] REF2030
E[R] REF2040
E[R] REF2050
E[R]
figure 6.61: africa: development of CO2 emissions by sector under the energy [r]evolution scenario (‘EFFICIENCY’ = REDUCTION COMPARED TO THE REFERENCE SCENARIO)
•• SAVINGS FROM ‘EFFICIENCY’ & RENEWABLES
•TRANSPORT
• OTHER SECTORS• INDUSTRY
• PUBLIC ELECTRICITY & CHP
2,500
2,000
1,500
1,000
500
Mil t/a 0E[R]2005
E[R]2010
E[R]2020
E[R]2030
E[R]2040
E[R]2050
© A
UST
IN/D
RE
AM
STIM
E
© G
P/S
HIR
LE
Y©
PG
-IM
AG
ES
/DR
EA
MST
IMEimage FLOWING WATERS OF THE
TUGELA RIVER IN NORTHERNDRAKENSBERG IN SOUTH AFRICA.
image A SMALL HYDRO ELECTRICALTERNATOR MAKES ELECTRICITY FORA SMALL AFRICAN TOWN.

76
6
key resu
lts|
MID
DL
E E
AS
T - D
EM
AN
D
GLOBAL ENERGY [R]EVOLUTIONA SUSTAINABLE GLOBAL ENERGY OUTLOOK
GLOBAL SCENARIO OECD NORTH AMERICALATIN AMERICAOECD EUROPE AFRICA
MIDDLE EASTTRANSITION ECONOMIESINDIA
DEVELOPING ASIACHINAOECD PACIFIC
middle east
middle east: energy demand by sector
The future development pathways for the Middle East’s energydemand are shown in Figure 6.62 for both the Reference andEnergy [R]evolution Scenarios. Under the Reference Scenario, totalprimary energy demand more than doubles from the current21,400 PJ/a to 54,980 PJ/a in 2050. In the Energy [R]evolutionScenario, a much smaller 28% increase on current consumption isexpected by 2050, reaching 27,600 PJ/a.
Under the Energy [R]evolution Scenario, electricity demand isexpected to increase disproportionately, with households andservices the main source of growing consumption (see Figure 6.63),leading to an electricity demand of around 1,620 TWh/a in the year2050. Compared to the Reference Scenario, efficiency measuresavoid the generation of about 390 TWh/a.
Efficiency gains in the heat supply sector are even larger. Under theEnergy [R]evolution Scenario (see Figure 6.64), consumptionequivalent to 2,650 PJ/a is avoided through efficiency gains by 2050.
In the transport sector, it is assumed under the Energy [R]evolutionScenario that energy demand will be slightly reduced compared totoday’s level, reaching 3,990 PJ/a by 2050, a saving of 49%compared to the Reference Scenario. This reduction can beachieved by the introduction of highly efficient vehicles, by shiftingthe transport of goods from road to rail and by changes in mobility-related behaviour patterns.
figure 6.62: middle east: projection of total final energy demand by sector for the two scenarios
40,000
35,000
30,000
25,000
20,000
15,000
10,000
5,000
PJ/a 0REF2005
REF2010
REF2020
REF2030
REF2040
REF2050
40,000
35,000
30,000
25,000
20,000
15,000
10,000
5,000
PJ/a 0E[R]2005
E[R]2010
E[R]2020
E[R]2030
E[R]2040
E[R]2050
figure 6.63: middle east: development of electricitydemand by sector(‘EFFICIENCY’ = REDUCTION COMPARED TO THE REFERENCE SCENARIO; OTHER SECTORS = SERVICES, HOUSEHOLDS)
2,500
2,000
1,500
1,000
500
TWh/a 02005 2010 2020 2030 2040 2050
figure 6.64: middle east: development of heat demand by sector(‘EFFICIENCY’ = REDUCTION COMPARED TO THE REFERENCE SCENARIO)
•• ‘EFFICIENCY’
• INDUSTRY• OTHER SECTORS
•TRANSPORT
14,000
12,000
10,000
8,000
6,000
4,000
2,000
PJ/a 02005 2010 2020 2030 2040 2050

77
6
key resu
lts|
MID
DL
E E
AS
T - E
LE
CT
RIC
ITY
GE
NE
RA
TIO
N
middle east: electricity generation
The development of the electricity supply sector is characterised byan increasing share of renewable electricity. By 2050, 95% of theelectricity produced in the Middle East will come from renewableenergy sources. ‘New’ renewables – mainly wind, solar thermal energyand PV – will contribute about 90% of electricity generation.
The installed capacity of renewable energy technologies will growfrom the current 10 GW to 556 GW in 2050, a very large increaseover the next 42 years requiring political support and well-designedpolicy instruments. Figure 6.66 shows the comparative evolution ofthe different technologies over the period up to 2050.
table 6.6: middle east: projection of renewableelectricity generation capacity under the energy[r]evolution scenario IN GW
2020
18
3
25
2
3
10
0
62
2040
20
6
72
8
128
100
1
335
2050
20
8
87
12
233
194
1
556
Hydro
Biomass
Wind
Geothermal
PV
Solarthermal
Ocean energy
Total
2030
20
4
61
5
31
48
0
168
2010
12
0.4
0.9
0
0.3
0.8
0
14
2005
10
0
0
0
0
0
0
10
figure 6.65: middle east: development of electricitygeneration structure under the two scenarios(‘EFFICIENCY’ = REDUCTION COMPARED TO THE REFERENCE SCENARIO)
3,000
2,500
2,000
1,500
1,000
500
TWh/a 0REF2005
E[R] REF2010
E[R] REF2020
E[R] REF2030
E[R] REF2040
E[R] REF2050
E[R]
figure 6.66: middle east: growth of renewableelectricity generation capacity under the energy[r]evolution scenarioBY INDIVIDUAL SOURCE
•• ‘EFFICIENCY’
• RES IMPORT
• OCEAN ENERGY
• SOLAR THERMAL
• PV
• GEOTHERMAL
•WIND
• HYDRO
• BIOMASS
• GAS & OIL
• COAL
• NUCLEAR
600
500
400
300
200
100
GWel 0E[R]2005
E[R]2010
E[R]2020
E[R]2030
E[R]2040
E[R]2050
© N
. AR
MO
NN
/DR
EA
MST
IME
© Y
. TA
FL
EV
/DR
EA
MST
IME
image A LARGE POWER PLANT ALONGTHE ROCKY COASTLINE IN CAESAREA,ISRAEL.
image WIND TURBINES IN THE GOLANHEIGHTS IN ISRAEL.

78
6
key resu
lts|
MID
DL
E E
AS
T - C
OS
TS
- HE
AT
ING
& C
OO
LIN
G
GLOBAL ENERGY [R]EVOLUTIONA SUSTAINABLE GLOBAL ENERGY OUTLOOK
GLOBAL SCENARIO OECD NORTH AMERICALATIN AMERICAOECD EUROPE AFRICA
MIDDLE EASTTRANSITION ECONOMIESINDIA
DEVELOPING ASIACHINAOECD PACIFIC
middle east
middle east: future costs of electricity generation
Figure 6.67 shows that the introduction of renewable technologiesunder the Energy [R]evolution Scenario will lead to a significantreduction of electricity generation costs. Under the ReferenceScenario, on the other hand, the unchecked growth in demand,increase in fossil fuel prices and the cost of CO2 emissions result intotal electricity supply costs rising from today’s $133 billion per yearto more than $870 bn in 2050. Figure 6.68 shows that the Energy[R]evolution Scenario not only meets the Middle East’s CO2 reductiontargets but also helps to stabilise energy costs. Long term costs forelectricity supply are one third lower than in the Reference Scenario.
middle east: heat and cooling supply
Renewables currently provide only 1% of primary energy demand forheat and cooling in the Middle East, the main contribution comingfrom the use of biomass and solar collectors. Dedicated supportinstruments are required to ensure a continuously dynamicdevelopment of renewables in the heat market.
In the Energy [R]evolution Scenario, renewables satisfy 83% of theMiddle East’s total heating and cooling demand in 2050.
• Energy efficiency measures can restrict the future primary energydemand for heat and cooling supply to a doubling rather thantripling, in spite of improving living standards.
• In the industry sector solar collectors, biomass/biogas as well asgeothermal energy are increasingly substituting for conventionalfossil-fired heating systems.
figure 6.69: middle east: development of heat supplystructure under the two scenarios(‘EFFICIENCY’ = REDUCTION COMPARED TO THE REFERENCE SCENARIO)
•• ‘EFFICIENCY’
• GEOTHERMAL
• SOLAR
• BIOMASS
• FOSSIL FUELS
14,000
12,000
10,000
8,000
6,000
4,000
2,000
PJ/a 0REF2005
E[R] REF2010
E[R] REF2020
E[R] REF2030
E[R] REF2040
E[R] REF2050
E[R]figure 6.68: middle east: development of total electricity supply costs
•• ENERGY [R]EVOLUTION - ‘EFFICIENCY’ MEASURES
• ENERGY [R]EVOLUTION SCENARIO
• REFERENCE SCENARIO
1,000
900
800
700
600
500
400
300
200
100
B $/a 0REF2005
E[R] REF2010
E[R] REF2020
E[R] REF2030
E[R] REF2040
E[R] REF2050
E[R]
figure 6.67: middle east: development of specificelectricity generation costs under the two scenarios(CO2 EMISSION COSTS IMPOSED FROM 2020, WITH AN INCREASE FROM 20 $/TCO2
IN 2020 TO 50 $/TCO2IN 2050)
40
35
30
25
20
15
10
5
$¢/kWh 02000 2010 2020 2030 2040 2050

79
6
key resu
lts|
MID
DL
E E
AS
T - T
RA
NS
PO
RT
- CO
NS
UM
PT
ION
- CO
2E
MIS
SIO
NS
middle east: transport
Traditionally, in a region with major oil resources, transport has beenpowered 100% by fossil fuels. Rising prices, together with otherincentives, lead to a projected share of 27% of renewable electricity inthis sector. Highly efficient electrified cars – plug-in-hybrid and batteryvehicles – contribute to a total energy saving of 16%, although the carfleet is still projected to grow by a factor of 5 by 2050. The furtherpromotion of energy efficient transport modes will help to reduceannual vehicle kilometres travelled by 0.25% p.a.
middle east: primary energy consumption
Taking into account these assumptions, the resulting primary energyconsumption under the Energy [R]evolution Scenario is shown inFigure 6.71. Compared to the Reference Scenario, overall energydemand will be reduced by more than 50% in 2050., so the MiddleEast’s demand will increase from 21,420 PJ/a to just 27,590 PJ/a.Over 62% of this will be covered by renewable energy sources.
middle east: development of CO2 emissions
While CO2 emissions in the Middle East will triple under theReference Scenario by 2050, and are thus far removed from asustainable development path, under the Energy [R]evolutionScenario they will decrease from 1,170 million tonnes in 2005 to390 m/t in 2050. Annual per capita emissions will drop from 6.2tonnes/capita to 1.1 t. In spite of an increasing electricity demand,CO2 emissions will decrease strongly in the electricity sector. In thelong run efficiency gains and the increased use of renewableelectricity in vehicles will even reduce CO2 emissions in thetransport sector.
figure 6.70: middle east: transport under the two scenarios (‘EFFICIENCY’ = REDUCTION COMPARED TO THE REFERENCE SCENARIO)
•• ‘EFFICIENCY’
• HYDROGEN
• ELECTRICITY
• BIO FUELS
• NATURAL GAS
• OIL PRODUCTS
9,000
8,000
7,000
6,000
5,000
4,000
3,000
2,000
1,000
PJ/a 0REF2005
E[R] REF2010
E[R] REF2020
E[R] REF2030
E[R] REF2040
E[R] REF2050
E[R]
figure 6.71: middle east: development of primaryenergy consumption under the two scenarios(‘EFFICIENCY’ = REDUCTION COMPARED TO THE REFERENCE SCENARIO)
•• ‘EFFICIENCY’
• OCEAN ENERGY
• GEOTHERMAL
• SOLAR
• BIOMASS
•WIND
• HYDRO
• NATURAL GAS
• CRUDE OIL
• COAL
• NUCLEAR
60,000
50,000
40,000
30,000
20,000
10,000
PJ/a 0REF2005
E[R] REF2010
E[R] REF2020
E[R] REF2030
E[R] REF2040
E[R] REF2050
E[R]
figure 6.72: middle east: development of CO2 emissions by sector under the energy [r]evolution scenario (‘EFFICIENCY’ = REDUCTION COMPARED TO THE REFERENCE SCENARIO)
•• SAVINGS FROM ‘EFFICIENCY’ & RENEWABLES
•TRANSPORT
• OTHER SECTORS• INDUSTRY
• PUBLIC ELECTRICITY & CHP
3,500
3,000
2,500
2,000
1,500
1,000
500
Mill t/a 0E[R]2005
E[R]2010
E[R]2020
E[R]2030
E[R]2040
E[R]2050
© O
. ÇA
M/D
RE
AM
STIM
E
© S
. WE
IWE
I/D
RE
AM
STIM
E
image THE BAHRAIN WORLD TRADECENTER IN MANAMA GENERATES PART OF ITS OWN ENERGY USING WIND TURBINES.
image SUBURBS OF DUBAI, UNITED ARAB EMIRATES.

80
6
key resu
lts|
TR
AN
SIT
ION
EC
ON
OM
IES
- DE
MA
ND
GLOBAL ENERGY [R]EVOLUTIONA SUSTAINABLE GLOBAL ENERGY OUTLOOK
GLOBAL SCENARIO OECD NORTH AMERICALATIN AMERICAOECD EUROPE AFRICA
MIDDLE EASTTRANSITION ECONOMIESINDIA
DEVELOPING ASIACHINAOECD PACIFIC
transition economies
transition economies: energy demand by sector
Future development pathways for energy demand in the TransitionEconomies are shown in Figure 6.73 for both the Reference andEnergy [R]evolution Scenarios. Under the Reference Scenario, totalprimary energy demand increases by 38 % from the current46,250 PJ/a to 63,930 PJ/a in 2050. In the Energy [R]evolutionScenario, demand decreases by 23% compared to currentconsumption and is expected to reach 35,760 PJ/a by 2050.
Under the Energy [R]evolution Scenario, electricity demand isexpected to increase disproportionately, with transport and thehouseholds and services sectors being the main source of growingconsumption (see Figure 6.74). With the exploitation of efficiencymeasures, however, an even higher increase can be avoided, leading
to electricity demand of around 1,550 TWh/a in 2050. Comparedto the Reference Scenario, efficiency measures avoid the generationof about 560 TWh/a.
Efficiency gains in the heat supply sector are even larger. Under theEnergy [R]evolution Scenario, final demand for heat supply caneven be reduced after 2030 (see Figure 6.75). Compared to theReference Scenario, consumption equivalent to 5,990 PJ/a isavoided through efficiency gains.
In the transport sector, it is assumed under the Energy [R]evolutionScenario that energy demand will decrease by 28% to 4,240 PJ/aby 2050, saving 57% compared to the Reference Scenario.
figure 6.73: transition economies: projection of total final energy demand by sector for the two scenarios
45,000
40,000
35,000
30,000
25,000
20,000
15,000
10,000
5,000
PJ/a 0REF2005
REF2010
REF2020
REF2030
REF2040
REF2050
45,000
40,000
35,000
30,000
25,000
20,000
15,000
10,000
5,000
PJ/a 0E[R]2005
E[R]2010
E[R]2020
E[R]2030
E[R]2040
E[R]2050
figure 6.75: transition economies: development of heat demand by sector(‘EFFICIENCY’ = REDUCTION COMPARED TO THE REFERENCE SCENARIO)
•• ‘EFFICIENCY’
• INDUSTRY• OTHER SECTORS
•TRANSPORT
25,000
20,000
15,000
10,000
5,000
PJ/a 02005 2010 2020 2030 2040 2050
figure 6.74: transition economies: development of electricity demand by sector(‘EFFICIENCY’ = REDUCTION COMPARED TO THE REFERENCE SCENARIO; OTHER SECTORS = SERVICES, HOUSEHOLDS)
2,500
2,000
1,500
1,000
500
TWh/a 02005 2010 2020 2030 2040 2050

81
6
key resu
lts|
TR
AN
SIT
ION
EC
ON
OM
IES
- EL
EC
TR
ICIT
Y G
EN
ER
AT
ION
transition economies: electricity generation
The development of the electricity supply sector is characterised bya growing renewable energy market. This will compensate for thephasing out of nuclear energy and reduce the number of fossil fuel-fired power plants required for grid stabilisation. By 2050, 81% ofthe electricity produced in the Transition Economy countries willcome from renewable energy sources. ‘New’ renewables – mainlywind, solar thermal energy and PV – will contribute 65% ofelectricity generation.
The installed capacity of renewable energy technologies will growfrom the current 93 GW to 550 GW in 2050, increasing capacityby a factor of six over the next 42 years. This will require politicalsupport and well-designed policy instruments.
Figure 6.77 shows the expansion rate of the different renewabletechnologies over time. Up to 2020, hydro-power and wind willremain the main contributors. After 2020, the continuing growth ofwind will be complemented by electricity from biomass,photovoltaics and geothermal energy.
table 6.7: transition economies: projection of renewable electricity generation capacity under the energy [r]evolution scenarioIN GW 2020
103
40
10
2
2
0
4
162
2040
109
61
169
16
100
3
7
466
2050
110
68
245
17
100
3
9
551
Hydro
Biomass
Wind
Geothermal
PV
Solarthermal
Ocean energy
Total
2030
106
49
72
8
42
2
6
285
2010
94
9
0.4
0.3
0.1
0
0
104
2005
89
3
0.1
0.1
0
0
0
93
figure 6.76: transition economies: development of electricity generation structure under the two scenarios(‘EFFICIENCY’ = REDUCTION COMPARED TO THE REFERENCE SCENARIO)
3,500
3,000
2,500
2,000
1,500
1,000
500
TWh/a 0REF2005
E[R] REF2010
E[R] REF2020
E[R] REF2030
E[R] REF2040
E[R] REF2050
E[R]
figure 6.77: transition economies: growth of renewableelectricity generation capacity under the energy[r]evolution scenario BY INDIVIDUAL SOURCE
•• ‘EFFICIENCY’
• RES IMPORT
• OCEAN ENERGY
• SOLAR THERMAL
• PV
• GEOTHERMAL
•WIND
• HYDRO
• BIOMASS
• GAS & OIL
• COAL
• NUCLEAR
600
500
400
300
200
100
GWel 0E[R]2005
E[R]2010
E[R]2020
E[R]2030
E[R]2040
E[R]2050
© G
P/V
AD
IM K
AN
TO
R
© G
P/V
AD
IM K
AN
TO
R
image LAKE BAIKAL, RUSSIA.
image SOLAR PANELS IN A NATURERESERVE IN CAUCASUSU, RUSSIA.

82
6
key resu
lts|
TR
AN
SIT
ION
EC
ON
OM
IES
- CO
ST
S - H
EA
TIN
G &
CO
OL
ING
GLOBAL ENERGY [R]EVOLUTIONA SUSTAINABLE GLOBAL ENERGY OUTLOOK
GLOBAL SCENARIO OECD NORTH AMERICALATIN AMERICAOECD EUROPE AFRICA
MIDDLE EASTTRANSITION ECONOMIESINDIA
DEVELOPING ASIACHINAOECD PACIFIC
transition economies
transition economies: future costs of electricity generation
Figure 6.78 shows that the introduction of renewable technologies underthe Energy [R]evolution Scenario slightly increases the costs of electricitygeneration compared to the Reference Scenario. This difference will beabout 0.5 cents/kWh in 2015. Because of the lower CO2 intensity ofelectricity generation, by 2020 these costs will become economicallyfavourable under the Energy [R]evolution Scenario and by 2050 will bemore than 5 cents/kWh below those in the Reference Scenario.
Due to growing demand, there will be a significant increase in society’sexpenditure on electricity supply. Under the Reference Scenario, totalelectricity supply costs will rise from today’s $190 billion per year to$520 bn in 2050. Figure 6.79 shows that the Energy [R]evolutionScenario not only complies with the Transition Economies’ CO2
reduction targets but also helps to stabilise energy costs and relievethe economic pressure on society. Long term costs for electricitysupply are one third lower than in the Reference Scenario.
transition economies: heat and cooling supply
Renewables currently provide just 3% of the Transition Economies’primary energy demand for heat supply, the main contribution comingfrom the use of biomass. The lack of available infrastructure for modernand efficient district heating networks is a barrier to the large scaleutilisation of biomass, geothermal and solar thermal energy. Dedicatedsupport instruments are required to ensure a dynamic development.
In the Energy [R]evolution Scenario, renewables provide 75% of theTransition Economies’ total heating demand in 2050.
• Energy efficiency measures can moderate the increase in heatdemand, and in spite of improving living standards after 2030lead to a decrease in demand, which in 2050 is slightly lowerthan at present.
• For direct heating, solar collectors, biomass/biogas as well asgeothermal energy are increasingly substituting for fossil fuel-fired systems.
• A shift from coal and oil to natural gas in the remaining conventionalapplications will lead to a further reduction of CO2 emissions.
figure 6.80: transition economies: development of heat supply structure under the two scenarios(‘EFFICIENCY’ = REDUCTION COMPARED TO THE REFERENCE SCENARIO)
•• ‘EFFICIENCY’
• GEOTHERMAL
• SOLAR
• BIOMASS
• FOSSIL FUELS
30,000
25,000
20,000
15,000
10,000
5,000
PJ/a 0REF2005
E[R] REF2010
E[R] REF2020
E[R] REF2030
E[R] REF2040
E[R] REF2050
E[R]
figure 6.79: transition economies: development of total electricity supply costs
•• ENERGY [R]EVOLUTION - ‘EFFICIENCY’ MEASURES
• ENERGY [R]EVOLUTION SCENARIO
• REFERENCE SCENARIO
600
500
400
300
200
100
B $/a 0REF2005
E[R] REF2010
E[R] REF2020
E[R] REF2030
E[R] REF2040
E[R] REF2050
E[R]
figure 6.78: transition economies: development of specificelectricity generation costs under the two scenarios(CO2 EMISSION COSTS IMPOSED FROM 2020, WITH AN INCREASE FROM 20 $/TCO2
IN 2020 TO 50 $/TCO2IN 2050)
16
14
12
10
8
6
4
2
$¢/kWh 02000 2010 2020 2030 2040 2050

83
6
key resu
lts|
TR
AN
SIT
ION
EC
ON
OM
IES
- TR
AN
SP
OR
T - C
ON
SU
MP
TIO
N - C
O2
EM
ISS
ION
S
transition economies: transport
Development of the transport sector is characterised by thediversification of energy sources towards bio fuels (9%) and electricity(28%) up to 2050. The time taken to reach reference target levels forefficient vehicles is delayed by ten years compared to the most otherindustrialised countries. Although the light duty vehicle stock will tripleby 2050, increasingly attractive and highly efficient suburban and longdistance rail services, as well as growing fuel prices, will lead to thevehicle kilometres travelled falling by 10% between 2010 and 2050.These measures and incentives, together with highly efficient cars, willresult in nearly 30% energy savings in the transport sector.
transition economies: primary energy consumption
Taking into account the changes outlined above, the resulting primaryenergy consumption under the Energy [R]evolution Scenario is shownin Figure 6.82. Compared to the Reference Scenario, overall energydemand will be reduced by 44% in 2050. Around 60% of theremaining demand will be covered by renewable energy sources.
transition economies: development of CO2 emissions
Whilst emissions of CO2 will increase by 11% under the ReferenceScenario, under the Energy [R]evolution Scenario they willdecrease from 2,380 million tonnes in 2005 to 540 m/t in 2050.Annual per capita emissions will drop from 7.0 tonnes to 1.8 t. Inspite of the phasing out of nuclear energy and increasing demand,CO2 emissions will decrease in the electricity sector.
figure 6.81: transition economies: transport under the two scenarios (‘EFFICIENCY’ = REDUCTION COMPARED TO THE REFERENCE SCENARIO)
•• ‘EFFICIENCY’
• HYDROGEN
• ELECTRICITY
• BIO FUELS
• NATURAL GAS
• OIL PRODUCTS
12,000
10,000
8,000
6,000
4,000
2,000
PJ/a 0REF2005
E[R] REF2010
E[R] REF2020
E[R] REF2030
E[R] REF2040
E[R] REF2050
E[R]
figure 6.82: transition economies: development ofprimary energy consumption under the two scenarios(‘EFFICIENCY’ = REDUCTION COMPARED TO THE REFERENCE SCENARIO)
•• ‘EFFICIENCY’
• OCEAN ENERGY
• GEOTHERMAL
• SOLAR
• BIOMASS
•WIND
• HYDRO
• NATURAL GAS
• CRUDE OIL
• COAL
• NUCLEAR
70,000
60,000
50,000
40,000
30,000
20,000
10,000
PJ/a 0REF2005
E[R] REF2010
E[R] REF2020
E[R] REF2030
E[R] REF2040
E[R] REF2050
E[R]
figure 6.83: transition economies: development of CO2 emissions by sector under the energy[r]evolution scenario (‘EFFICIENCY’ = REDUCTION COMPARED TO THE REFERENCE SCENARIO)
•• SAVINGS FROM ‘EFFICIENCY’ & RENEWABLES
•TRANSPORT
• OTHER SECTORS• INDUSTRY
• PUBLIC ELECTRICITY & CHP
3,500
3,000
2,500
2,000
1,500
1,000
500
Mil t/a 0E[R]2005
E[R]2010
E[R]2020
E[R]2030
E[R]2040
E[R]2050
© G
P/S
HIR
LE
Y
© G
P/M
IZU
KO
SH
I
image CHERNOBYL NUCLEAR POWERSTATION, UKRAINE.
image THE SUN OVER LAKE BAIKAL,RUSSIA.

84
6
key resu
lts|
IND
IA - D
EM
AN
D
GLOBAL ENERGY [R]EVOLUTIONA SUSTAINABLE GLOBAL ENERGY OUTLOOK
GLOBAL SCENARIO OECD NORTH AMERICALATIN AMERICAOECD EUROPE AFRICA
MIDDLE EASTTRANSITION ECONOMIESINDIA
DEVELOPING ASIACHINAOECD PACIFIC
india
india: energy demand by sector
The potential future development pathways for India’s primaryenergy demand are shown in Figure 6.84 for both the Reference andEnergy [R]evolution Scenarios. Under the Reference Scenario, totalprimary energy demand quadruples from the current 22,300 PJ/a to89,100 PJ/a in 2050. In the Energy [R]evolution Scenario, bycontrast, demand will increase by about 230 % and is expected toreach 52,000 PJ/a by 2050.
Under the Energy [R]evolution Scenario, electricity demand isexpected to increase substantially (see Figure 6.85). With theexploitation of efficiency measures, however, a higher increase can beavoided, leading to demand of around 3,500 TWh/a in 2050.Compared to the Reference Scenario, efficiency measures avoid thegeneration of about 1,410 TWh/a. This reduction can be achieved in
particular by introducing highly efficient electronic devices using thebest available technology in all demand sectors.
Efficiency gains for heat and cooling supply are also significant.Under the Energy [R]evolution Scenario, final demand for heatingand cooling can even be reduced (see Figure 6.86). Compared to theReference Scenario, consumption equivalent to 3,130 PJ/a is avoidedthrough efficiency gains by 2050.
In the transport sector it is assumed that a fast growing economywill see energy demand, even under the Energy [R]evolutionScenario, increase dramatically - from 1,550 PJ/a in 2005 to 8,700PJ/a by 2050. This still saves 50% compared to the ReferenceScenario. This reduction can be achieved by the introduction of highlyefficient vehicles, shifting freight transport from road to rail and bychanges in travel behaviour.
figure 6.84: india: projection of total final energy demand by sector for the two scenarios
60,000
50,000
40,000
30,000
20,000
10,000
PJ/a 0REF2005
REF2010
REF2020
REF2030
REF2040
REF2050
60,000
50,000
40,000
30,000
20,000
10,000
PJ/a 0E[R]2005
E[R]2010
E[R]2020
E[R]2030
E[R]2040
figure 6.85: india: development of electricity demand by sector(‘EFFICIENCY’ = REDUCTION COMPARED TO THE REFERENCE SCENARIO; OTHER SECTORS = SERVICES, HOUSEHOLDS)
6,000
5,000
4,000
3,000
2,000
1,000
TWh/a 02005 2010 2020 2030 2040 2050
figure 6.86: india: development of heat demand by sector(‘EFFICIENCY’ = REDUCTION COMPARED TO THE REFERENCE SCENARIO)
•• ‘EFFICIENCY’
• INDUSTRY• OTHER SECTORS
•TRANSPORT
20,000
18,000
16,000
14,000
12,000
10,000
8,000
6,000
4,000
2,000
PJ/a 02005 2010 2020 2030 2040 2050

85
6
key resu
lts|
IND
IA - E
LE
CT
RIC
ITY
GE
NE
RA
TIO
N
india: electricity generation
By 2050, about 60% of the electricity produced in India will comefrom renewable energy sources. ‘New’ renewables – mainly wind,solar thermal energy and PV – will contribute almost 50%. Theinstalled capacity of renewable energy technologies will grow fromthe current 38 GW to 915 GW in 2050, a substantial increase overthe next 42 years.
Figure 6.88 shows the comparative evolution of different renewabletechnologies over time. Up to 2030, hydro-power and wind willremain the main contributors. After 2020, the continuing growth ofwind will be complemented by electricity from biomass,photovoltaics and solar thermal (CSP) energy.
note GREENPEACE COMISSIONED ANOTHER SCENARIO FOR INDIA WITH HIGHER GDPDEVELOPMENT PROJECTIONS UNTIL 2030. FOR MORE INFORMATION PLEASE VISIT THEENERGY [R]EVOLUTION WEBSITE WWW.ENERGYBLUEPRINT.INFO/
table 6.8: india: projection of renewable electricitygeneration capacity under the energy [r]evolution scenarioIN GW
2020
62
8
69
2
10
3
1
155
2040
129
41
170
17
136
48
4
545
2050
156
70
212
29
343
97
7
915
Hydro
Biomass
Wind
Geothermal
PV
Solarthermal
Ocean energy
Total
2030
85
19
127
6
51
10
2
299
2010
43
0.7
11
0
0.2
0
0
55
2005
34
0.4
4
0
0
0
0
38
figure 6.87: india: development of electricity generationstructure under the two scenarios(‘EFFICIENCY’ = REDUCTION COMPARED TO THE REFERENCE SCENARIO)
6,000
5,000
4,000
3,000
2,000
1,000
TWh/a 0REF2005
E[R] REF2010
E[R] REF2020
E[R] REF2030
E[R] REF2040
E[R] REF2050
E[R]
figure 6.88: india: growth of renewable electricitygeneration capacity under the energy [r]evolution scenarioBY INDIVIDUAL SOURCE
•• ‘EFFICIENCY’
• RES IMPORT
• OCEAN ENERGY
• SOLAR THERMAL
• PV
• GEOTHERMAL
•WIND
• HYDRO
• BIOMASS
• GAS & OIL
• COAL
• NUCLEAR
1,000
900
800
700
600
500
400
300
200
100
GWel 0E[R]2005
E[R]2010
E[R]2020
E[R]2030
E[R]2040
E[R]2050
© G
P/J
OH
N N
OV
IS
© G
P/D
AN
IEL
BE
LTR
Á
image NANLINIKANT BISWAS, FARMER AGE 43. FIFTEEN YEARS AGO NANLINIKANT’SFAMILY ONCE LIVED WHERE THE SEA IS NOW. THEY WERE AFFLUENT AND OWNED 4ACRES OF LAND. BUT RISING SEAWATER INCREASED THE SALINITY OF THE SOIL UNTILTHEY COULD NO LONGER CULTIVATE IT, KANHAPUR, ORISSA, INDIA.
image A SOLAR DISH WHICH IS ON TOP OF THE SOLAR KITCHEN AT AUROVILLE,TAMILNADU, INDIA.

86
6
key resu
lts|
IND
IA - C
OS
TS
- HE
AT
ING
& C
OO
LIN
G
GLOBAL ENERGY [R]EVOLUTIONA SUSTAINABLE GLOBAL ENERGY OUTLOOK
GLOBAL SCENARIO OECD NORTH AMERICALATIN AMERICAOECD EUROPE AFRICA
MIDDLE EASTTRANSITION ECONOMIESINDIA
DEVELOPING ASIACHINAOECD PACIFIC
india
india: future costs of electricity generation
Figure 6.89 shows that the introduction of renewable technologiesunder the Energy [R]evolution Scenario significantly decreases thefuture costs of electricity generation compared to the ReferenceScenario. Because of the lower CO2 intensity, electricity generationcosts will become economically favourable under the Energy[R]evolution Scenario and by 2050 will be more than 4.5cents/kWh below those in the Reference Scenario.
Under the Reference Scenario, a massive growth in demand,increased fossil fuel prices and the cost of CO2 emissions result intotal electricity supply costs rising from today’s $64 billion per yearto more than $930 bn in 2050. Figure 6.90 shows that the Energy[R]evolution Scenario not only complies with India’s CO2 reductiontargets but also helps to stabilise energy costs. Increasing energyefficiency and shifting energy supply to renewables leads to longterm costs that are one third lower than in the Reference Scenario.
india: heat and cooling supply
Renewables presently provide 63% of primary energy demand for heatand cooling supply in India, the main contribution coming from the useof biomass. Dedicated support instruments are required to ensure acontinuously dynamic development of renewables in the heat market.
In the Energy [R]evolution Scenario, renewables will provide 71% ofIndia’s heating and cooling demand by 2050.
• Energy efficiency measures will restrict future primary energydemand for heat and cooling supply to an increase of 90% by2005, in spite of improving living standards. This compares to130% in the Reference Scenario.
• In the industry sector solar collectors, biomass/biogas andgeothermal energy are increasingly replacing conventional fossil-fired heating systems.
• A shift from coal and oil to natural gas in the remaining conventionalapplications leads to a further reduction of CO2 emissions.
figure 6.91: india: development of heat supplystructure under the two scenarios(‘EFFICIENCY’ = REDUCTION COMPARED TO THE REFERENCE SCENARIO)
•• ‘EFFICIENCY’
• GEOTHERMAL
• SOLAR
• BIOMASS
• FOSSIL FUELS
20,000
18,000
16,000
14,000
12,000
10,000
8,000
6,000
4,000
2,000
PJ/a 0REF2005
E[R] REF2010
E[R] REF2020
E[R] REF2030
E[R] REF2040
E[R] REF2050
E[R]figure 6.90: india: development of total electricity supply costs
•• ENERGY [R]EVOLUTION - ‘EFFICIENCY’ MEASURES
• ENERGY [R]EVOLUTION SCENARIO
• REFERENCE SCENARIO
1,000
900
800
700
600
500
400
300
200
100
B $/a 0REF2005
E[R] REF2010
E[R] REF2020
E[R] REF2030
E[R] REF2040
E[R] REF2050
E[R]
figure 6.89: india: development of specific electricitygeneration costs under the two scenarios(CO2 EMISSION COSTS IMPOSED FROM 2020, WITH AN INCREASE FROM 20 $/TCO2
IN 2020 TO 50 $/TCO2IN 2050)
18
16
14
12
10
8
6
$¢/kWh 42000 2010 2020 2030 2040 2050

87
6
key resu
lts|
IND
IA - T
RA
NS
PO
RT
- CO
NS
UM
PT
ION
- CO
2E
MIS
SIO
NS
india: transport
India’s car fleet is projected to grow by a factor of 16 from 2000 to2050. Presently characterised by small cars (70%), this will stay thesame up to 2050. Although India will remain a low price car market,the key to efficiency lies in electrified powertrains (hybrid, plug-in andbattery electric). Biofuels will take over 6% and electricity 22% oftotal transport energy demand. Stringent energy efficiency measureswill help limit growth of transport energy demand by 2050 to about afactor of 5.5 compared to 2005.
india: primary energy consumption
Taking into account the above assumptions, the resulting primaryenergy consumption under the Energy [R]evolution Scenario isshown in Figure 6.93. Compared to the Reference Scenario, overalldemand will be reduced by about 40% in 2050. Around half of thiswill be covered by renewable energy sources.
india: development of CO2 emissions
While CO2 emissions in India will increase under the ReferenceScenario by a factor of 5.4 up to 2050, and are thus far removedfrom a sustainable development path, under the Energy[R]evolution Scenario they will increase from the current 1,074million tonnes in 2005 to reach a peak of 1,820 m/t in 2030. Afterthat they will decrease to 1,660 m/t in 2050. Annual per capitaemissions will increase to 1.3 tonnes/capita in 2030 and fall againto 1.0 t/capita in 2050. In spite of the phasing out of nuclearenergy and increasing electricity demand, CO2 emissions willdecrease in the electricity sector.
After 2030, efficiency gains and the increased use of renewables inall sectors will soften the still increasing CO2 emissions in transport,the power sector and industry. Although its share is decreasing, thepower sector will remain the largest source of emissions in India,contributing 50% of the total in 2050, followed by transport.
figure 6.92: india: transport under the two scenarios(‘EFFICIENCY’ = REDUCTION COMPARED TO THE REFERENCE SCENARIO)
•• ‘EFFICIENCY’
• HYDROGEN
• ELECTRICITY
• BIO FUELS
• NATURAL GAS
• OIL PRODUCTS
18,000
16,000
14,000
12,000
10,000
8,000
6,000
4,000
2,000
PJ/a 0REF2005
E[R] REF2010
E[R] REF2020
E[R] REF2030
E[R] REF2040
E[R] REF2050
E[R]
figure 6.93: india: development of primary energyconsumption under the two scenarios(‘EFFICIENCY’ = REDUCTION COMPARED TO THE REFERENCE SCENARIO)
•• ‘EFFICIENCY’
• OCEAN ENERGY
• GEOTHERMAL
• SOLAR
• BIOMASS
•WIND
• HYDRO
• NATURAL GAS
• CRUDE OIL
• COAL
• NUCLEAR
100,000
90,000
80,000
70,000
60,000
50,000
40,000
30,000
20,000
10,000
PJ/a 0REF2005
E[R] REF2010
E[R] REF2020
E[R] REF2030
E[R] REF2040
E[R] REF2050
E[R]
figure 6.94: india: development of CO2 emissions by sector under the energy [r]evolution scenario (‘EFFICIENCY’ = REDUCTION COMPARED TO THE REFERENCE SCENARIO)
•• SAVINGS FROM ‘EFFICIENCY’ & RENEWABLES
•TRANSPORT
• OTHER SECTORS• INDUSTRY
• PUBLIC ELECTRICITY & CHP
7,000
6,000
5,000
4,000
3,000
2,000
1,000
Mil t/a 0E[R]2005
E[R]2010
E[R]2020
E[R]2030
E[R]2040
E[R]2050
© G
P/P
ET
ER
CA
TO
N
© M
AR
CU
S F
RA
NK
EN
/GP
image A LOCAL BENGALI WOMAN PLANTS A MANGROVE (SUNDARI) SAPLING ON SAGARISLAND IN THE ECOLOGICALLY SENSITIVE SUNDERBANS RIVER DELTA REGION, IN WESTBENGAL. THOUSANDS OF LOCAL PEOPLE WILL JOIN THE MANGROVE PLANTINGINITIATIVE LED BY PROFESSOR SUGATA HAZRA FROM JADAVAPUR UNIVERSITY, WHICHWILL HELP TO PROTECT THE COAST FROM EROSION AND WILL ALSO PROVIDENUTRIENTS FOR FISH AND CAPTURE CARBON IN THEIR EXTENSIVE ROOT SYSTEMS.
image FEMALE WORKER CLEANING A SOLAR OVEN AT A COLLEGE IN TILONIA,RAJASTHAN, INDIA.

88
6
key resu
lts|
DE
VE
LO
PIN
G A
SIA
- DE
MA
ND
GLOBAL ENERGY [R]EVOLUTIONA SUSTAINABLE GLOBAL ENERGY OUTLOOK
GLOBAL SCENARIO OECD NORTH AMERICALATIN AMERICAOECD EUROPE AFRICA
MIDDLE EASTTRANSITION ECONOMIESINDIA
DEVELOPING ASIACHINAOECD PACIFIC
developing asia
developing asia: energy demand by sector
The future development pathways for Developing Asia’s primaryenergy demand are shown in Figure 6.95 for both the Referenceand Energy [R]evolution Scenarios. Under the Reference Scenario,total primary energy demand more than doubles from the current31,100 PJ/a to 67,400 PJ/a in 2050. In the Energy [R]evolutionScenario, a much smaller 40% increase in consumption is expectedby 2050, reaching 43,800 PJ/a.
Under the Energy [R]evolution Scenario, electricity demand is expectedto increase disproportionately in Developing Asia (see Figure 6.96).With the introduction of serious efficiency measures, however, an evenhigher increase can be avoided, leading to electricity demand of around1,965 TWh/a in 2050. Compared to the Reference Scenario, efficiencymeasures avoid the generation of about 860 TWh/a.
Efficiency gains in the heat supply sector are also significant (seeFigure 6.97). Compared to the Reference Scenario, consumptionequivalent to 2,900 PJ/a is avoided through efficiency measures by2050. In the transport sector, it is assumed under the Energy[R]evolution Scenario that energy demand will rise to 8,300 PJ/aby 2050, saving 90% compared to the Reference Scenario.
figure 6.95: developing asia: projection of total final energy demand by sector for the two scenarios
50,000
40,000
30,000
20,000
10,000
PJ/a 0REF2005
REF2010
REF2020
REF2030
REF2040
REF2050
50,000
40,000
30,000
20,000
10,000
PJ/a 0E[R]2005
E[R]2010
E[R]2020
E[R]2030
E[R]2040
E[R]2050
figure 6.96: developing asia: development of electricity demand by sector(‘EFFICIENCY’ = REDUCTION COMPARED TO THE REFERENCE SCENARIO; OTHER SECTORS = SERVICES, HOUSEHOLDS)
3,500
3,000
2,500
2,000
1,500
1,000
500
TWh/a 02005 2010 2020 2030 2040 2050
figure 6.97: developing asia: development of heat demand by sector(‘EFFICIENCY’ = REDUCTION COMPARED TO THE REFERENCE SCENARIO)
•• ‘EFFICIENCY’
• INDUSTRY• OTHER SECTORS
•TRANSPORT
20,000
18,000
16,000
14,000
12,000
10,000
8,000
6,000
4,000
2,000
PJ/a 02005 2010 2020 2030 2040 2050

89
6
key resu
lts|
DE
VE
LO
PIN
G A
SIA
- EL
EC
TR
ICIT
Y G
EN
ER
AT
ION
developing asia: electricity generation
The development of the electricity supply sector is characterised byan increasing share of renewable electricity. This will compensatefor the phasing out of nuclear energy and reduce the number offossil fuel-fired power plants required. By 2050, 67% of theelectricity produced in Developing Asia will come from renewableenergy sources. ‘New’ renewables – mainly wind, solar thermalenergy and PV – will contribute 55%.
The installed capacity of renewable energy technologies will growfrom the current 51 GW to 590 GW in 2050, increasing capacityby a factor of more than ten.
Figure 6.99 shows the comparative evolution of the differenttechnologies over time. Up to 2020, hydro-power and wind willremain the main contributors. After 2020, the continuing growth ofwind will be complemented by electricity from biomass,photovoltaics and geothermal sources.
table 6.9: developing asia: projection of renewableelectricity generation capacity under the energy[r]evolution scenarioIN GW 2020
70
7
40
7
13
3
1
141
2040
81
17
171
20
139
14
3
446
2050
82
20
202
26
232
25
5
590
Hydro
Biomass
Wind
Geothermal
PV
Solarthermal
Ocean energy
Total
2030
79
11
127
13
68
5
2
305
2010
51
3
2
3.6
0.7
0
0
61
2005
46
2
0
3
0
0
0
51
figure 6.99: developing asia: growth of renewableelectricity generation capacity under the energy [r]evolution scenario BY INDIVIDUAL SOURCE
•• ‘EFFICIENCY’
• RES IMPORT
• OCEAN ENERGY
• SOLAR THERMAL
• PV
• GEOTHERMAL
•WIND
• HYDRO
• BIOMASS
• GAS & OIL
• COAL
• NUCLEAR
700
600
500
400
300
200
100
GWel 0E[R]2005
E[R]2010
E[R]2020
E[R]2030
E[R]2040
E[R]2050
figure 6.98: developing asia: development of electricitygeneration structure under the two scenarios(‘EFFICIENCY’ = REDUCTION COMPARED TO THE REFERENCE SCENARIO)
3,500
3,000
2,500
2,000
1,500
1,000
500
TWh/a 0REF2005
E[R] REF2010
E[R] REF2020
E[R] REF2030
E[R] REF2040
E[R] REF2050
E[R]
© G
P/S
ATA
PO
RN
TH
ON
GM
A
© G
P/R
IOS
image MAJESTIC VIEW OF THE WIND FARM IN ILOCOS NORTE, AROUND 500 KILOMETRESNORTH OF MANILA. THE 25 MEGAWATT WIND FARM, OWNED AND OPERATED BY DANISHFIRM NORTHWIND, IS THE FIRST OF ITS KIND IN SOUTHEAST ASIA.
image AMIDST SCORCHING HEAT, AN ELDERLY FISHERWOMAN GATHERS SHELLS INLAM TAKONG DAM, WHERE WATERS HAVE DRIED UP DUE TO PROLONGED DROUGHT.GREENPEACE LINKS RISING GLOBAL TEMPERATURES AND CLIMATE CHANGE TO THEONSET OF ONE OF THE WORST DROUGHTS TO HAVE STRUCK THAILAND,CAMBODIA,VIETNAM AND INDONESIA IN RECENT MEMORY. SEVERE WATER SHORTAGEAND DAMAGE TO AGRICULTURE HAS AFFECTED MILLIONS.

90
6
key resu
lts|
DE
VE
LO
PIN
G A
SIA
- CO
ST
S - H
EA
TIN
G &
CO
OL
ING
GLOBAL ENERGY [R]EVOLUTIONA SUSTAINABLE GLOBAL ENERGY OUTLOOK
GLOBAL SCENARIO OECD NORTH AMERICALATIN AMERICAOECD EUROPE AFRICA
MIDDLE EASTTRANSITION ECONOMIESINDIA
DEVELOPING ASIACHINAOECD PACIFIC
developing asia
developing asia: future costs of electricity generation
Figure 6.100 shows that the introduction of renewable technologiesunder the Energy [R]evolution Scenario significantly decreases thefuture costs of electricity generation compared to the ReferenceScenario. Because of lower CO2 intensity in electricity generation,costs will become economically favourable under the Energy[R]evolution Scenario. By 2050 they will be more than 5cents/kWh below those in the Reference Scenario.
Under the Reference Scenario, unchecked growth in demand, anincrease in fossil fuel prices and the cost of CO2 emissions result intotal electricity supply costs rising from today’s $98 billion per year tomore than $566 bn in 2050. Figure 6.101 shows that the Energy[R]evolution Scenario not only complies with Developing Asia’s CO2
reduction targets but also helps to stabilise energy costs. Increasingenergy efficiency and shifting supply to renewables leads to long termcosts that are almost one third lower than in the Reference Scenario.
developing asia: heat and cooling supply
The starting point for renewables in the heat supply sector is quitedifferent from the power sector. Today, renewables provide 53% ofprimary energy demand for heat and cooling supply in Developing Asia,the main contribution coming from biomass. Dedicated supportinstruments are still required to ensure a continuously dynamicdevelopment of renewables in the heat market.
In the Energy [R]evolution Scenario, renewables provide 70% ofDeveloping Asia’s heating and cooling demand in 2050.
• Energy efficiency measures can restrict the future primary energydemand for heat and cooling supply to a increase of 48%,compared to 77% in the Reference Scenario, in spite ofimproving living standards.
• In the industry sector solar collectors, biomass/biogas andgeothermal energy are increasingly replacing conventional fossilfuel-fired heating systems.
• A shift from coal and oil to natural gas in the remaining conventionalapplications leads to a further reduction of CO2 emissions.
figure 6.102: developing asia: development of heatsupply structure under the two scenarios(‘EFFICIENCY’ = REDUCTION COMPARED TO THE REFERENCE SCENARIO)
•• ‘EFFICIENCY’
• GEOTHERMAL
• SOLAR
• BIOMASS
• FOSSIL FUELS
20,000
18,000
16,000
14,000
12,000
10,000
8,000
6,000
4,000
2,000
PJ/a 0REF2005
E[R] REF2010
E[R] REF2020
E[R] REF2030
E[R] REF2040
E[R] REF2050
E[R]
figure 6.101: developing asia: development of total electricity supply costs
•• ENERGY [R]EVOLUTION - ‘EFFICIENCY’ MEASURES
• ENERGY [R]EVOLUTION SCENARIO
• REFERENCE SCENARIO
600
500
400
300
200
100
B $/a 0REF2005
E[R] REF2010
E[R] REF2020
E[R] REF2030
E[R] REF2040
E[R] REF2050
E[R]
figure 6.100: developing asia: development of specificelectricity generation costs under the two scenarios(CO2 EMISSION COSTS IMPOSED FROM 2020, WITH AN INCREASE FROM 20 $/TCO2
IN 2020 TO 50 $/TCO2IN 2050)
20
18
16
14
12
10
8
6
$¢/kWh 42000 2010 2020 2030 2040 2050

91
6
key resu
lts|
DE
VE
LO
PIN
G A
SIA
- TR
AN
SP
OR
T - C
ON
SU
MP
TIO
N - C
O2
EM
ISS
ION
S
developing asia: transport
This region’s light duty vehicle stock is projected to grow by a factor of10 from 2000 to 2050. Biofuels will reach a share of 7%, electricity9% of the energy needed in the total transport sector. Highly efficienthybrid car technologies, together with plug-in and battery electricvehicles, will lead to significant gains in energy efficiency.
developing asia: primary energy consumption
Taking into account the assumptions discussed above, the resultingprimary energy consumption under the Energy [R]evolution Scenariois shown in Figure 6.104. Compared to the Reference Scenario,overall demand will be reduced by almost 35% in 2050. Aroundhalf of the remaining demand will be covered by renewables.
developing asia: development of CO2 emissions
Whilst Developing Asia’s CO2 emissions will increase by a factor of2.5 under the Reference Scenario, in the Energy [R]evolution Scenariothey will decrease from 1,300 million tonnes in 2005 to 1,150 m/t in2050. Annual per capita emissions will drop from 1.3 tonnes to 0.8 t.In spite of the phasing out of nuclear energy and increasing demand,CO2 emissions will decrease in the electricity sector. In the long runefficiency gains and the increased use of renewable electricity invehicles will stabilise CO2 emissions in the transport sector. With ashare of 22% of total CO2 in 2050, the power sector will drop belowtransport as the largest source of emissions.
figure 6.103: developing asia: transport under the two scenarios (‘EFFICIENCY’ = REDUCTION COMPARED TO THE REFERENCE SCENARIO)
•• ‘EFFICIENCY’
• HYDROGEN
• ELECTRICITY
• BIO FUELS
• NATURAL GAS
• OIL PRODUCTS
18,000
16,000
14,000
12,000
10,000
8,000
6,000
4,000
2,000
PJ/a 0REF2005
E[R] REF2010
E[R] REF2020
E[R] REF2030
E[R] REF2040
E[R] REF2050
E[R]
figure 6.104: developing asia: development of primaryenergy consumption under the two scenarios(‘EFFICIENCY’ = REDUCTION COMPARED TO THE REFERENCE SCENARIO)
•• ‘EFFICIENCY’
• OCEAN ENERGY
• GEOTHERMAL
• SOLAR
• BIOMASS
•WIND
• HYDRO
• NATURAL GAS
• CRUDE OIL
• COAL
• NUCLEAR
80,000
70,000
60,000
50,000
40,000
30,000
20,000
10,000
PJ/a 0REF2005
E[R] REF2010
E[R] REF2020
E[R] REF2030
E[R] REF2040
E[R] REF2050
E[R]
figure 6.105: developing asia: development of CO2
emissions by sector under the energy [r]evolution scenario(‘EFFICIENCY’ = REDUCTION COMPARED TO THE REFERENCE SCENARIO)
•• SAVINGS FROM ‘EFFICIENCY’ & RENEWABLES
•TRANSPORT
• OTHER SECTORS• INDUSTRY
• PUBLIC ELECTRICITY & CHP
3,500
2,500
2,000
1,500
1,000
1,000
500
Mil t/a 0E[R]2005
E[R]2010
E[R]2020
E[R]2030
E[R]2040
E[R]2050
© G
P/S
IMA
NJU
NTA
K
© G
P/R
IOS
image GREENPEACE DONATES A SOLAR POWER SYSTEM TO A COASTAL VILLAGE INACEH, INDONESIA, ONE OF THE WORST HIT AREAS BY THE TSUNAMI IN DECEMBER2004. IN COOPERATION WITH UPLINK, A LOCAL DEVELOPMENT NGO, GREENPEACEOFFERED ITS EXPERTISE ON ENERGY EFFICIENCY AND RENEWABLE ENERGY ANDINSTALLED RENEWABLE ENERGY GENERATORS FOR ONE OF THE BADLY HIT VILLAGES BY THE TSUNAMI.
image A WOMAN GATHERS FIREWOOD ON THE SHORES CLOSE TO THE WIND FARM OFILOCOS NORTE, AROUND 500 KILOMETERS NORTH OF MANILA.

92
6
key resu
lts|
CH
INA
- DE
MA
ND
GLOBAL ENERGY [R]EVOLUTIONA SUSTAINABLE GLOBAL ENERGY OUTLOOK
GLOBAL SCENARIO OECD NORTH AMERICALATIN AMERICAOECD EUROPE AFRICA
MIDDLE EASTTRANSITION ECONOMIESINDIA
DEVELOPING ASIACHINAOECD PACIFIC
china
china: energy demand by sector
The future development pathways for China’s primary energydemand are shown in Figure 6.106 for both the Reference andEnergy [R]evolution Scenarios. Under the Reference Scenario, totalprimary energy demand will increase by a factor of 2.5 from thecurrent 73,000 PJ/a to 185,020 PJ/a in 2050. In the Energy[R]evolution Scenario, primary energy demand increases up to2030 by 60% and decreases to a level of 99,150 PJ/a in 2050.
Under the Energy [R]evolution Scenario, electricity demand isexpected to increase disproportionately (see Figure 6.107). Withthe exploitation of efficiency measures, however, an even higherincrease can be avoided, leading to demand of around 7,500 TWh/ain 2050. Compared to the Reference Scenario, efficiency measuresavoid the generation of about 3,160 TWh/a.
Efficiency gains in the heat supply sector are large as well. Underthe Energy [R]evolution Scenario, final demand for heat supply caneven be reduced (see Figure 6.108). Compared to the ReferenceScenario, consumption equivalent to 10,300 PJ/a is avoidedthrough efficiency gains by 2050.
In the transport sector, it is assumed under the Energy [R]evolutionScenario that energy demand will increase considerably, from 5,100PJ/a in 2005 to 17,300 PJ/a by 2050. However this still saves50% compared to the Reference Scenario.
figure 6.106: china: projection of total final energy demand by sector for the two scenarios
140,000
120,000
100,000
80,000
60,000
40,000
20,000
PJ/a 0REF2005
REF2010
REF2020
REF2030
REF2040
REF2050
140,000
120,000
100,000
80,000
60,000
40,000
20,000
PJ/a 0E[R]2005
E[R]2010
E[R]2020
E[R]2030
E[R]2040
E[R]2050
figure 6.107: china: development of electricity demand by sector(‘EFFICIENCY’ = REDUCTION COMPARED TO THE REFERENCE SCENARIO; OTHER SECTORS = SERVICES, HOUSEHOLDS)
12,000
10,000
8,000
6,000
4,000
2,000
TWh/a 02005 2010 2020 2030 2040 2050
figure 6.108: china: development of heat demand by sector(‘EFFICIENCY’ = REDUCTION COMPARED TO THE REFERENCE SCENARIO)
•• ‘EFFICIENCY’
• INDUSTRY• OTHER SECTORS
•TRANSPORT
45,000
40,000
35,000
30,000
25,000
20,000
15,000
10,000
5,000
PJ/a 02005 2010 2020 2030 2040 2050

93
6
key resu
lts|
CH
INA
- EL
EC
TR
ICIT
Y G
EN
ER
AT
ION
china: electricity generation
A dynamically growing renewable energy market will compensatefor the phasing out of nuclear energy and reduce the number offossil fuel-fired power plants required for grid stabilisation. By2050, 63% of the electricity produced in China will come fromrenewable energy sources. ‘New’ renewables – mainly wind, solarthermal energy and PV – will contribute 46% of electricitygeneration. The following strategy paves the way for a futurerenewable energy supply:
Rising electricity demand will be met initially by bringing intooperation new highly efficient gas-fired combined-cycle powerplants, plus an increasing capacity of wind turbines and biomass. Inthe long term, wind will be the most important single source ofelectricity generation. Solar energy, hydro-power and biomass willalso make substantial contributions.
The installed capacity of renewable energy technologies will growfrom the current 119 GW to 1,950 GW in 2050, an enormousincrease resulting in a considerable demand for investment over thenext 20 years. Figure 6.110 shows the comparative evolution of thedifferent renewable technologies over time. Up to 2020, hydro-power and wind will remain the main contributors. After 2020, thecontinuing growth of wind will be complemented by electricity frombiomass, photovoltaics and solar thermal energy.
table 6.10: china: projection of renewable electricitygeneration capacity under the energy [r]evolution scenarioIN GW
2020
254
17
151
1
16
9
1
450
2040
385
68
506
8
300
83
21
1370
2050
457
96
574
20
579
150
74
1950
Hydro
Biomass
Wind
Geothermal
PV
Solarthermal
Ocean energy
Total
2030
313
36
380
3
136
33
7
909
2010
166
3
17
0.2
0,4
0
0
186
2005
117
0.6
1
0
0,1
0
0
119
figure 6.109: china: development of electricitygeneration structure under the two scenarios(‘EFFICIENCY’ = REDUCTION COMPARED TO THE REFERENCE SCENARIO)
14,000
12,000
10,000
8,000
6,000
4,000
2,000
TWh/a 0REF2005
E[R] REF2010
E[R] REF2020
E[R] REF2030
E[R] REF2040
E[R] REF2050
E[R]
figure 6.110: china: growth of renewable electricitygeneration capacity under the energy [r]evolution scenarioBY INDIVIDUAL SOURCE
•• ‘EFFICIENCY’
• RES IMPORT
• OCEAN ENERGY
• SOLAR THERMAL
• PV
• GEOTHERMAL
•WIND
• HYDRO
• BIOMASS
• GAS & OIL
• COAL
• NUCLEAR
2,500
2,000
1,500
1,000
500
GWel 0E[R]2005
E[R]2010
E[R]2020
E[R]2030
E[R]2040
E[R]2050
© G
P/J
OH
N N
OV
IS
© G
P/X
UA
N C
AN
XIO
NG
image A MAINTENANCE ENGINEER INSPECTS A WIND TURBINE AT THE NAN WINDFARM IN NAN’AO. GUANGDONG PROVINCE HAS ONE OF THE BEST WIND RESOURCES INCHINA AND IS ALREADY HOME TO SEVERAL INDUSTRIAL SCALE WIND FARMS. MASSIVEINVESTMENT IN WIND POWER WILL HELP CHINA OVERCOME ITS RELIANCE ONCLIMATE DESTROYING FOSSIL FUEL POWER AND SOLVE ITS ENERGY SUPPLY PROBLEM.
image image A LOCAL TIBETAN WOMAN WHO HAS FIVE CHILDREN AND RUNS A BUSYGUEST HOUSE IN THE VILLAGE OF ZHANG ZONG USES SOLAR PANELS TO SUPPLYENERGY FOR HER BUSINESS.

94
6
key resu
lts|
CH
INA
- CO
ST
S - H
EA
TIN
G &
CO
OL
ING
GLOBAL ENERGY [R]EVOLUTIONA SUSTAINABLE GLOBAL ENERGY OUTLOOK
GLOBAL SCENARIO OECD NORTH AMERICALATIN AMERICAOECD EUROPE AFRICA
MIDDLE EASTTRANSITION ECONOMIESINDIA
DEVELOPING ASIACHINAOECD PACIFIC
china
china: future costs of electricity generation
Figure 6.111 shows that the introduction of renewable technologiesunder the Energy [R]evolution Scenario slightly increases the costsof electricity generation compared to the Reference Scenario. Thedifference will be less than 1 cents/kWh up to 2020. Because of thelower CO2 intensity, by 2020 electricity generation costs in Chinawill become economically favourable under the Energy [R]evolutionScenario, and by 2050 will be more than 5 cents/kWh below thosein the Reference Scenario.
Under the Reference Scenario, the unchecked growth in demand, theincrease in fossil fuel prices and the cost of CO2 emissions result in totalelectricity supply costs rising from today’s $ 205 billion per year to morethan $ 1,940 bn in 2050. Figure 6.112 shows that the Energy[R]evolution Scenario not only complies with China’s CO2 reductiontargets but also helps to stabilise energy costs. Increasing energy efficiencyand shifting energy supply to renewables leads to long term costs forelectricity supply that are one third lower than in the Reference Scenario.
china: heat and cooling supply
Today, renewables provide 28% of primary energy demand for heatand cooling supply in China, the main contribution coming from theuse of biomass.
In the Energy [R]evolution Scenario, renewables provide 65% ofChina’s total heating and cooling demand by 2050.
• Energy efficiency measures will restrict the future primary energydemand for heat and cooling supply to an increase of 21%,compared to 61% in the Reference Scenario, in spite ofimproving living standards.
• In the industry sector solar collectors, biomass/biogas as well asgeothermal energy are increasingly substituting for conventionalfossil-fired heating systems.
• A shift from coal and oil to natural gas in the remaining conventionalapplications leads to a further reduction of CO2 emissions.
figure 6.113: china: development of heat supplystructure under the two scenarios(‘EFFICIENCY’ = REDUCTION COMPARED TO THE REFERENCE SCENARIO)
•• ‘EFFICIENCY’
• GEOTHERMAL
• SOLAR
• BIOMASS
• FOSSIL FUELS
45,000
40,000
35,000
30,000
25,000
20,000
15,000
10,000
5,000
PJ/a 0REF2005
E[R] REF2010
E[R] REF2020
E[R] REF2030
E[R] REF2040
E[R] REF2050
E[R]figure 6.112: china: development of total electricity supply costs
•• ENERGY [R]EVOLUTION - ‘EFFICIENCY’ MEASURES
• ENERGY [R]EVOLUTION SCENARIO
• REFERENCE SCENARIO
2,000
1,800
1,600
1,400
1,200
1,000
800
600
400
200
B $/a 0REF2005
E[R] REF2010
E[R] REF2020
E[R] REF2030
E[R] REF2040
E[R] REF2050
E[R]
figure 6.111: china: development of specific electricitygeneration costs under the two scenarios(CO2 EMISSION COSTS IMPOSED FROM 2020, WITH AN INCREASE FROM 20 $/TCO2
IN 2020 TO 50 $/TCO2IN 2050)
16
14
12
10
8
6
$¢/kWh 42000 2010 2020 2030 2040 2050

95
6
key resu
lts|
CH
INA
- TR
AN
SP
OR
T - C
ON
SU
MP
TIO
N - C
O2
EM
ISS
ION
S
china: transport
In 2050, the light duty vehicle stock in China will be 20 times largerthan today. Today, more medium to large sized cars are driven in China,with an unusually high annual mileage. With growing individual mobility,an increasing share of small efficient cars is projected, with vehiclekilometres driven converging with industrialised country averages. Moreefficient propulsion technologies, including hybrid-electric powertrainsand lightweight construction, will help limit the increase in totaltransport energy demand to a factor of 3.4, reaching 17,300 PJ/a in2050. As China already has a large fleet of electric vehicles, this willgrow to the point where almost 25% of total transport energy iscovered by electricity. Bio fuels will contribute about 7%.
china: primary energy consumption
Taking into account the above assumptions, the resulting primaryenergy consumption under the Energy [R]evolution Scenario isshown in Figure 6.115. Compared to the Reference Scenario,overall energy demand will be reduced by almost 47 in 2050.Around 47% of the remaining demand will be covered byrenewable energy sources.
china: development of CO2 emissions
Whilst China’s emissions of CO2 will almost triple under theReference Scenario, under the Energy [R]evolution Scenario they willdecrease from 4,400 million tonnes in 2005 to 3,200 m/t in 2050.Annual per capita emissions will drop from 3.4 tonnes to 2.3 t. Inspite of increasing demand, CO2 emissions will decrease in theelectricity sector. In the long run efficiency gains and the increaseduse of renewable electricity in vehicles will even reduce CO2 emissionsin the transport sector. With a share of 50% of total CO2 in 2050,the power sector will remain the largest source of emissions.
figure 6.114: china: transport under the two scenarios(‘EFFICIENCY’ = REDUCTION COMPARED TO THE REFERENCE SCENARIO)
•• ‘EFFICIENCY’
• HYDROGEN
• ELECTRICITY
• BIO FUELS
• NATURAL GAS
• OIL PRODUCTS
40,000
35,000
30,000
25,000
20,000
15,000
10,000
5,000
PJ/a 0REF2005
E[R] REF2010
E[R] REF2020
E[R] REF2030
E[R] REF2040
E[R] REF2050
E[R]
figure 6.115: china: development of primary energyconsumption under the two scenarios(‘EFFICIENCY’ = REDUCTION COMPARED TO THE REFERENCE SCENARIO)
•• ‘EFFICIENCY’
• OCEAN ENERGY
• GEOTHERMAL
• SOLAR
• BIOMASS
•WIND
• HYDRO
• NATURAL GAS
• CRUDE OIL
• COAL
• NUCLEAR
200,000
180,000
160,000
140,000
120,000
100,000
80,000
60,000
40,000
20,000
PJ/a 0REF2005
E[R] REF2010
E[R] REF2020
E[R] REF2030
E[R] REF2040
E[R] REF2050
E[R]
figure 6.116: china: development of CO2 emissions by sector under the energy [r]evolution scenario (‘EFFICIENCY’ = REDUCTION COMPARED TO THE REFERENCE SCENARIO)
•• SAVINGS FROM ‘EFFICIENCY’ & RENEWABLES
•TRANSPORT
• OTHER SECTORS• INDUSTRY
• PUBLIC ELECTRICITY & CHP
14,000
12,000
10,000
8,000
6,000
4,000
2,000
Mil t/a 0E[R]2005
E[R]2010
E[R]2020
E[R]2030
E[R]2040
E[R]2050
© G
P/H
U W
EI
© N
. BE
HR
ING
-CH
ISH
OL
M/G
Pimage A WORKER ENTERS A TURBINE TOWER FOR MAINTENANCE AT DABANCHENGWIND FARM. CHINA’S BEST WIND RESOURCES ARE MADE POSSIBLE BY THE NATURALBREACH IN TIANSHAN (TIAN MOUNTAIN).
image WOMEN WEAR MASKS AS THEY RIDE BIKES TO WORK IN THE POLLUTED TOWNOF LINFEN. LINFEN, A CITY OF ABOUT 4.3 MILLION, IS ONE OF THE MOST POLLUTEDCITIES IN THE WORLD. CHINA’S INCREASINGLY POLLUTED ENVIRONMENT IS LARGELYA RESULT OF THE COUNTRY’S RAPID DEVELOPMENT AND CONSEQUENTLY A LARGEINCREASE IN PRIMARY ENERGY CONSUMPTION, WHICH IS ALMOST ENTIRELYPRODUCED BY BURNING COAL.

96
6
key resu
lts|
OE
CD
PA
CIF
IC - D
EM
AN
D
GLOBAL ENERGY [R]EVOLUTIONA SUSTAINABLE GLOBAL ENERGY OUTLOOK
GLOBAL SCENARIO OECD NORTH AMERICALATIN AMERICAOECD EUROPE AFRICA
MIDDLE EASTTRANSITION ECONOMIESINDIA
DEVELOPING ASIACHINAOECD PACIFIC
oecd pacific
oecd pacific: energy demand by sector
The future development pathways for the OECD Pacific’s primaryenergy demand are shown in Figure 6.117 for both the Reference andEnergy [R]evolution Scenarios. Under the Reference Scenario, totalprimary energy demand increases by 27% - from the current 37,040PJ/a to 47,020 PJ/a in 2050. In the Energy [R]evolution Scenario,by contrast, primary energy demand decreases by 33% compared tocurrent consumption and is expected by 2050 to reach 24,950 PJ/a.
Under the Energy [R]evolution Scenario, electricity demand in theindustry as well as the residential and services sectors is expected tofall slightly below the current level of demand (see Figure 6.118).The growing use of electric vehicles however leads to an increase inelectricity demand, reaching 1,920 TWh/a in 2050. Overall demandis still 560 TWh/a lower than in the Reference Scenario.
Efficiency gains in the heat supply sector are even larger. Under theEnergy [R]evolution Scenario, final demand for heat supply caneven be reduced (see Figure 6.119). Compared to the ReferenceScenario, consumption equivalent to 2,860 PJ/a is avoided throughefficiency gains by 2050.
In the transport sector, it is assumed under the Energy [R]evolutionScenario that energy demand will decrease by 40% to 4,000 PJ/aby 2050, saving about 50% compared to the Reference Scenario.
figure 6.117: oecd pacific: projection of total final energy demand by sector for the two scenarios
40,000
35,000
30,000
25,000
20,000
15,000
10,000
5,000
PJ/a 0REF2005
REF2010
REF2020
REF2030
REF2040
REF2050
40,000
35,000
30,000
25,000
20,000
15,000
10,000
5,000
PJ/a 0E[R]2005
E[R]2010
E[R]2020
E[R]2030
E[R]2040
E[R]2050
figure 6.118: oecd pacific: development of electricity demand by sector(‘EFFICIENCY’ = REDUCTION COMPARED TO THE REFERENCE SCENARIO; OTHER SECTORS = SERVICES, HOUSEHOLDS)
3,000
2,500
2,000
1,500
1,000
500
TWh/a 02005 2010 2020 2030 2040 2050
figure 6.119: oecd pacific: development of heat demand by sector(‘EFFICIENCY’ = REDUCTION COMPARED TO THE REFERENCE SCENARIO)
•• ‘EFFICIENCY’
• INDUSTRY• OTHER SECTORS
•TRANSPORT
12,000
10,000
8,000
6,000
4,000
2,000
PJ/a 02005 2010 2020 2030 2040 2050

97
6
key resu
lts|
OE
CD
PA
CIF
IC - E
LE
CT
RIC
ITY
GE
NE
RA
TIO
N
oecd pacific: electricity generation
A dynamically growing renewable energy market will compensatefor the phasing out of nuclear energy and reduce the number offossil fuel-fired power plants required for grid stabilisation. By2050, 78% of the electricity produced in the OECD Pacific willcome from renewable energy sources. ‘New’ renewables – mainlywind, solar thermal energy and PV – will contribute 68%.
The installed capacity of renewable energy technologies will growfrom the current 62 GW to more than 600 GW in 2050, anincrease by a factor of ten.
To achieve an economically attractive growth in renewable energysources, a balanced and timely mobilisation of all technologies is ofgreat importance. Figure 6.121 shows the comparative evolution ofthe different renewables over time. Up to 2020, hydro-power andwind will remain the main contributors. After 2020, the continuinggrowth of wind will be complemented by electricity from biomass,photovoltaic and solar thermal energy.
table 6.11: oecd pacific: projection of renewableelectricity generation capacity under the energy[r]evolution scenarioIN GW 2020
76
8
35
2
35
3
1
166
2040
86
22
116
5
116
6
11
389
2050
89
33
201
7
201
7
21
609
Hydro
Biomass
Wind
Geothermal
PV
Solarthermal
Ocean energy
Total
2030
81
13
68
3
68
3
4
252
2010
64
5
5
1
5
0
0
80
2005
55
3
2
1
0.02
0
0
62
figure 6.120: oecd pacific: development of electricitygeneration structure under the two scenarios(‘EFFICIENCY’ = REDUCTION COMPARED TO THE REFERENCE SCENARIO)
3,000
2,500
2,000
1,500
1,000
500
TWh/a 0REF2005
E[R] REF2010
E[R] REF2020
E[R] REF2030
E[R] REF2040
E[R] REF2050
E[R]
figure 6.121: oecd pacific: growth of renewableelectricity generation capacity under the energy[r]evolution scenarioBY INDIVIDUAL SOURCE
•• ‘EFFICIENCY’
• RES IMPORT
• OCEAN ENERGY
• SOLAR THERMAL
• PV
• GEOTHERMAL
•WIND
• HYDRO
• BIOMASS
• GAS & OIL
• COAL
• NUCLEAR
700
600
500
400
300
200
100
GWel 0E[R]2005
E[R]2010
E[R]2020
E[R]2030
E[R]2040
E[R]2050
© B
. GO
OD
E/D
RE
AM
STIM
E
© J
. GO
UG
H/D
RE
AM
STIM
E
image GEOTHERMAL POWER STATION,NORTH ISLAND, NEW ZEALAND.
image WIND FARM LOOKING OVER THE OCEAN AT CAPE JERVIS, SOUTH AUSTRALIA.

98
6
key resu
lts|
OE
CD
PA
CIF
IC - C
OS
TS
- HE
AT
ING
& C
OO
LIN
G
GLOBAL ENERGY [R]EVOLUTIONA SUSTAINABLE GLOBAL ENERGY OUTLOOK
GLOBAL SCENARIO OECD NORTH AMERICALATIN AMERICAOECD EUROPE AFRICA
MIDDLE EASTTRANSITION ECONOMIESINDIA
DEVELOPING ASIACHINAOECD PACIFIC
oecd pacific
oecd pacific: future costs of electricity generation
Figure 6.122 shows that the introduction of renewable technologiesunder the Energy [R]evolution Scenario slightly increases the costsof electricity generation in the OECD Pacific compared to theReference Scenario. The difference will be less than 1.5 cents/kWhup to 2030. Because of the lower CO2 intensity, by 2020 electricitygeneration costs will become economically favourable under theEnergy [R]evolution Scenario, and by 2050 they will be more than4 cents/kWh below those in the Reference Scenario.
Under the Reference Scenario, by contrast, unchecked growth indemand, an increase in fossil fuel prices and the cost of CO2
emissions result in total electricity supply costs rising from today’s$160 billion per year to more than $400 bn in 2050. Figure 6.123shows that the Energy [R]evolution Scenario not only complies withthe OECD Pacific’s CO2 reduction targets but also helps to stabiliseenergy costs. Increasing energy efficiency and shifting energy supplyto renewables leads to long term costs for electricity supply thatare one third lower than in the Reference Scenario.
oecd pacific: heat and cooling supply
Renewables currently provide 5% of OECD Pacific’s primaryenergy demand for heat supply, the main contribution coming frombiomass. Dedicated support instruments are required to ensure afuture dynamic development.
In the Energy [R]evolution Scenario, renewables provide 73% ofOECD Pacific’s total heating and cooling demand by 2050.
• Energy efficiency measures can decrease the current demand forheat supply by 10%, in spite of improving living standards.
• For direct heating, solar collectors, biomass/biogas as well asgeothermal energy are increasingly substituting for fossil fuel-fired systems.
• A shift from coal and oil to natural gas in the remaining conventionalapplications will lead to a further reduction of CO2 emissions.
figure 6.124: oecd pacific: development of heat supplystructure under the two scenarios(‘EFFICIENCY’ = REDUCTION COMPARED TO THE REFERENCE SCENARIO)
•• ‘EFFICIENCY’
• GEOTHERMAL
• SOLAR
• BIOMASS
• FOSSIL FUELS
12,000
10,000
8,000
6,000
4,000
2,000
PJ/a 0REF2005
E[R] REF2010
E[R] REF2020
E[R] REF2030
E[R] REF2040
E[R] REF2050
E[R]figure 6.123: oecd pacific: development of total electricity supply costs
•• ENERGY [R]EVOLUTION - ‘EFFICIENCY’ MEASURES
• ENERGY [R]EVOLUTION SCENARIO
• REFERENCE SCENARIO
450
400
350
300
250
200
150
100
50
B $/a 0REF2005
E[R] REF2010
E[R] REF2020
E[R] REF2030
E[R] REF2040
E[R] REF2050
E[R]
figure 6.122: oecd pacific: development of specificelectricity generation costs under the two scenarios(CO2 EMISSION COSTS IMPOSED FROM 2010, WITH AN INCREASE FROM 15 $/TCO2
IN 2010 TO 50 $/TCO2IN 2050)
18
16
14
12
10
8
6
$¢/kWh 42000 2010 2020 2030 2040 2050

99
6
key resu
lts|
OE
CD
PA
CIF
IC - T
RA
NS
PO
RT
- CO
NS
UM
PT
ION
- CO
2E
MIS
SIO
NS
oecd pacific: transport
The low duty vehicles (LDV) market in OECD Pacific is driven byJapan, with a unique share of small cars and a fuel consumptionaverage of 6.45 litres/100 km in the new car fleet. Other countries in theregion typically drive larger cars, and incentives to encourage smallercars will be crucial. The LDV stock is projected to grow by a factor of1.4 to 119 million vehicles. While 94% of all LDVs use petrol today,electrified vehicles will play a key role, especially in Japan’s well suitedsmall cars, in reducing energy demand. By 2050, 35% of total transportenergy is covered by electricity and 25% by bio fuels.
oecd pacific: primary energy consumption
Taking into account the above assumptions, the resulting primaryenergy consumption under the Energy [R]evolution Scenario isshown in Figure 6.126. Compared to the Reference Scenario, overallenergy demand will be reduced by 47% in 2050. Around 55% ofthe remaining demand will be covered by renewable energy sources.
oecd pacific: development of CO2 emissions
Whilst the OECD Pacific’s emissions of CO2 will increase by 20%under the Reference Scenario, under the Energy [R]evolutionScenario they will decrease from 1,900 million tonnes in 2005 to430 m/t in 2050. Annual per capita emissions will fall from 9.5tonnes to 2.4 t. In the long run efficiency gains and the increased useof renewable electricity in vehicles will even reduce CO2 emissions inthe transport sector. With a share of 45% of total CO2 in 2050, thepower sector will remain the largest source of emissions.
figure 6.125: oecd pacific: transport under the two scenarios(‘EFFICIENCY’ = REDUCTION COMPARED TO THE REFERENCE SCENARIO)
•• ‘EFFICIENCY’
• HYDROGEN
• ELECTRICITY
• BIO FUELS
• NATURAL GAS
• OIL PRODUCTS
10,000
9,000
8,000
7,000
6,000
5,000
4,000
3,000
2,000
1,000
PJ/a 0REF2005
E[R] REF2010
E[R] REF2020
E[R] REF2030
E[R] REF2040
E[R] REF2050
E[R]
figure 6.126: oecd pacific: development of primaryenergy consumption under the two scenarios(‘EFFICIENCY’ = REDUCTION COMPARED TO THE REFERENCE SCENARIO)
•• ‘EFFICIENCY’
• OCEAN ENERGY
• GEOTHERMAL
• SOLAR
• BIOMASS
•WIND
• HYDRO
• NATURAL GAS
• CRUDE OIL
• COAL
• NUCLEAR
50,000
45,000
40,000
35,000
30,000
25,000
20,000
15,000
10,000
5,000
PJ/a 0REF2005
E[R] REF2010
E[R] REF2020
E[R] REF2030
E[R] REF2040
E[R] REF2050
E[R]
figure 6.127: oecd pacific: development of CO2 emissions by sector under the energy [r]evolution scenario (‘EFFICIENCY’ = REDUCTION COMPARED TO THE REFERENCE SCENARIO)
•• SAVINGS FROM ‘EFFICIENCY’ & RENEWABLES
•TRANSPORT
• OTHER SECTORS• INDUSTRY
• PUBLIC ELECTRICITY & CHP
2,500
2,000
1,500
1,000
500
Mil t/a 0E[R]2005
E[R]2010
E[R]2020
E[R]2030
E[R]2040
E[R]2050
© G
P/S
OL
NE
SS
© G
P/N
AO
MI
TO
YO
DA
image SOLAR PANELS ON CONISTONSTATION, NORTH WEST OF ALICESPRINGS, NORTHERN TERRITORY.
image THE “CITIZENS’ WINDMILL” INAOMORI, NORTHERN JAPAN. PUBLICGROUPS, SUCH AS CO-OPERATIVES, AREBUILDING AND RUNNING LARGE-SCALEWIND TURBINES IN SEVERAL CITIESAND TOWNS ACROSS JAPAN.

100
futu[r]e investment & development
GLOBAL INVESTMENT IN NEW POWER PLANTSRENEWABLE POWER GENERATIONINVESTMENT
FOSSIL FUEL POWER GENERATION INVESTMENT
“I often ask myself why thiswhole question needs to be sodifficult, why governmentshave to be dragged kickingand screaming even when the cost is miniscule.”LYN ALLISON LEADER OF THE AUSTRALIAN DEMOCRATS, SENATOR 2004-2008
image PRODUCIN
G WIN
D ROTORS FOR OFFSHORE WIN
D ENERGY IN RIN
GKOBING, D
ENMARK.
© PAUL LANGROCK/ZENIT/GP77

101
global market overviewsource FOR PAGE 101+102: RENEWABLE 2007 - GLOBAL STATUS REPORT, REN 21, ERIC MARTINOT
The global market for renewable energy has been expanding inrecent years at a record rate, an indication of its potential to realisethe future targets outlined in the Energy [R]evolution Scenario.
• Renewable electricity generation capacity reached anestimated 240 Gigawatts (GW) worldwide in 2007, an increaseof 50 % over 2004. Renewables represent 5 % of global powercapacity and 3.4 % of global power generation. These figuresexclude large hydropower, which alone accounted for 15 % ofglobal power generation.
• Renewable energy (excluding large hydropower) generated asmuch electric power worldwide in 2006 as one-quarter of theworld’s nuclear power plants.
• The largest component of renewable generation capacity is windpower, which grew by 28 % worldwide in 2007 to reach 95 GW.The annual capacity growth rate is even higher: 40 % more in2007 than the year before.
• The fastest growing energy technology in the world is grid-connected solar photovoltaics (PV), with a 50 % annualincrease in cumulative installed capacity in both 2006 and 2007to reach 7.7 GW. This translates into 1.5 million homes withrooftop solar PV feeding into the grid.
• Rooftop solar heat collectors provide hot water to nearly 50million households worldwide, and space heating to a growingnumber of homes. Existing solar hot water/heating capacityincreased by 19 % in 2006 to reach 105 Gigawatts thermal(GWth) globally.
• The use of biomass and geothermal energy for both power andheating has been increasing in a number of countries, including fordistrict heating networks. More than 2 million ground source heatpumps are now used in 30 countries to heat (and cool) buildings.
• Renewable energy, in particular small hydropower, biomass andsolar PV, is providing electricity, heat, motive power and waterpumping for tens of millions of people in the rural areas ofdeveloping countries, serving agriculture, small industry, homesand schools. 25 million households cook and light their homeswith biogas and 2.5 million households use solar lighting systems.
• Developing countries account for more than 40 % of existingrenewable power capacity, more than 70 % of solar hot watercapacity and 45 % of bio fuels production.
In terms of investment, an estimated $71 billion was invested innew renewable power and heating capacity worldwide in 2007(excluding large hydropower). Of this, 47 % was for wind powerand 30 % for solar PV. Investment in large hydropower, the mostestablished renewable energy source, added a further $15–20billion. The total amount invested in new renewable energy capacity,manufacturing plants and research and development during 2007 isestimated to have reached a record $100 billion.
Investment flows have also became more diversified and mainstream,with funding flowing from a wide range of sources, including majorcommercial and investment banks, venture capital and private equityinvestors, multilateral and bilateral development organisations as wellas smaller local financiers. The renewable energy industry has seenmany new companies launched, huge increases in company valuationsand numerous initial public offerings. The 140 highest-valued publiclytraded renewable energy companies now have a combined marketcapitalisation of over $100 billion.
Major industrial growth is occurring in a number of emergingrenewable technologies, including thin-film solar PV, concentratingsolar thermal power generation and advanced or second generationbio fuels. Worldwide employment in renewable energymanufacturing, operation and maintenance exceeded 2.4 millionjobs in 2006, including some 1.1 million in bio fuels production.
The main reason for this industrial expansion is that nationaltargets for renewable energy have been adopted in at least 66countries worldwide, including all 27 European Union memberstates, 29 US states and nine Canadian provinces. Most targets arefor a percentage of electricity production or primary energy to beachieved by a specific future year. There is now an EU-wide target,for example, for 20 % of energy to come from renewables by 2020and a Chinese target of 15 %. Targets for bio fuel use in transportenergy also now exist in several countries, including an EU-widetarget for 10 % by 2020.
Specific policies to promote renewables have also mushroomed inrecent years. At least 60 countries - 37 developed and transitioncountries and 23 developing countries - have adopted some type ofpolicy to promote renewable power generation. The most common isthe feed-in law, through which a set premium price is paid for eachunit of renewable power generation. By 2007, at least 37 countriesand nine states or provinces had adopted feed-in policies, more thanhalf of which have been enacted since 2002. At least 44 states,provinces and countries have enacted renewable portfolio standards(RPS), which place an obligation on energy companies to source arising percentage of their power from renewable sources. Otherforms of support for renewable power generation include capitalinvestment subsidies or rebates, tax incentives and credits, sales taxand value-added tax exemptions, net metering, public investment orfinancing and public competitive bidding.
Beneath a national and state level, municipalities around the worldare also setting targets for future shares of renewable energy,typically in the range of 10–20 %. Some cities have establishedcarbon dioxide reduction targets, others are enacting policies topromote solar hot water and solar PV or introducing urban planningrules which incorporate renewable energy. Market facilitationorganisations are supporting the growth of renewable energymarkets and policies through networking, market research, training,project facilitation, consulting, financing, policy advice and othertechnical assistance. There are now hundreds of such organisationsaround the world, including industry associations, non-governmentalorganisations, multilateral and bilateral development agencies,international partnerships and government agencies.
7
futu
[r]e investm
ent
|G
LO
BA
L M
AR
KE
T O
VE
RV
IEW
© P
AU
L L
AN
GR
OC
K/Z
EN
IT/G
Pimage TEST WINDMILL N90 2500, BUILTBY THE GERMAN COMPANY NORDEX, INTHE HARBOUR OF ROSTOCK. THISWINDMILL PRODUCES 2,5 MEGA WATTAND IS TESTED UNDER OFFSHORECONDITIONS. TWO TECHNICIANS WORKINGINSIDE THE TURBINE.

102
GLOBAL ENERGY [R]EVOLUTIONA SUSTAINABLE GLOBAL ENERGY OUTLOOK
growth rates of the renewable energy industry
Figure 7.2 shows that many renewable energy technologies grew atrates of 15–30 % annually during the five year period 2002–2006,including wind power, solar hot water, geothermal heating and off-grid solar PV. Grid-connected solar PV eclipsed all of these, with a60 % annual average growth rate for the period. Bio fuels also grewrapidly during the period, at a 40 % annual average for biodieseland 15 % for ethanol. Other technologies are growing more slowly,at 3–5 %, including large hydropower, biomass power and heat, andgeothermal power, although in some countries these technologies aregrowing much more rapidly than the global average.
These expansion rates compare with the global growth rates for fossilfuels of 2–4 % in recent years (higher in some developing countries)35.
7
futu
[r]e investm
ent
|G
RO
WT
H R
AT
ES
table 7.1: selected indicators2006
$55
207
970
74
5.1
2.5
105
39
6
2007
$71 billion
240 GW
1,010 GW
95 GW
7.8 GW
3.8 GW
128 GWth
46 bill. litrs
8 bill. litrs
66
46
44
53
Investment in new renewable capacity (ANNUAL)
Renewables power capacity (EXISTING, EXCL. LARGE HYDRO)
Renewables power capacity (EXISTING, INCL. LARGE HYDRO)
Wind power capacity (EXISTING)
Grid-connected solar PV capacity (EXISTING)
Solar PV production (ANNUAL)
Solar hot water capacity (EXISTING)
Ethanol production (ANNUAL)
Biodiesel production (ANNUAL)
Countries with policy targets
States/provinces/countries with feed-in policies
States/provinces/countries with RPS policies
States/provinces/countries with bio fuels mandates
2005
$40
182
930
59
3.5
1.8
88
33
3.9
52
41
38
38
figure 7.2: average annual growth rates of renewableenergy capacity, 2002-2006
figure 7.1: annual investment in renewable energycapacity, 1995-2007 EXCLUDES LARGE HYDROPOWER
80
60
40
20
B $ 01995 1997 1999 2001 2003 2005 2007
(est.)
•GEOTHERMAL
• SOLAR
•WIND
solar pv, grid connected
biodiesel (annual production)
wind power
geothermal heating
solar pv, off grid
solar hot water/heating
ethanol (annual production)
small hydropower
large hydro power
biomass power
geothermal power
biomass heating
0
%
10 20 30 40 50 60 70
source REN21
source REN21 source REN21
references35 ‘RENEWABLE ENERGY STATUS REPORT 2007’, REN 21, WWW.REN21.NET

future growth rates
In order to get a better understanding of what differenttechnologies can deliver, however, it is necessary to examine moreclosely how future production capacities can be achieved from thecurrent baseline. The wind industry, for example, has a currentannual production capacity of about 25,000 MW. If this outputwere not expanded, total capacity would reach 650 GW by the year2050. This includes the need for “repowering” of older windturbines after 20 years. But according to this scenario the share ofwind electricity in global production by 2050 would need to growfrom today’s 1% to 4.5% under the Reference Scenario and 6.5%under the Energy [R]evolution pathway.
A relatively modest expansion from today’s 25 GW productioncapacity, however, to about 80 GW by 2020 and 100 GW in 2040would lead to a total installed capacity of 1,800 GW in 2050,providing between 12% and 18% of world electricity demand.
The tables below provide an overview of current generation levels,the capacities required under the Energy [R]evolution Scenario andindustry projections of a more advanced market growth. The goodnews is that the scenario does not even come close to the limit ofthe renewable industries’ own projections. However, the scenarioassumes that at the same time strong energy efficiency measuresare taken in order to save resources and develop a more costoptimised energy supply.
103
7
futu
[r]e investm
ent
|F
UT
UR
E G
RO
WT
H R
AT
ES
table 7.2: required production capacities for renewable energy technologies in different scenarios
2010
GW/a
2
4
4
0.5
1
1
25
30
36
1
1
0.2
0
28
36
41
2020
GW/a
5
40
45
0.5
12
15
25
82
142
1
5
0.2
2
32
141
202
2030
GW/a
5
65
165
0.5
17
32
25
85
165
1
6
0.2
3
31
176
362
2040
GW/a
5
100
165
0.5
27
65
25
100
165
1
10
0.3
5
31
242
395
2050
GW/a
5
125
165
0.5
33
105
25
100
165
1
10
0.3
10
31
278
435
TOTAL INSTALLED CAPACITY IN 2050
GW
153
2,911
3,835
17
801
2,100
593
2,733
3,500
36
276
9
194
808
6,916
9,435
ELECTRICITY SHAREUNDER E[R] DEMANDPROJECTION IN 2050
%
0
10
13
0
12
32
4
18
23
1
4
0
2
5
46
68
INCLUDES PRODUCTION CAPACITY FOR REPOWERING
NEW RENEWABLE ELECTRICITYGENERATION TECHNOLOGIES
Solar PhotovoltaicsPRODUCTION CAPACITY IN 2007 (APPROX. 5-7 GW)
Reference
Energy [R]evolution
Advanced
Concentrated Solar PowerPRODUCTION CAPACITY IN 2007 (APPROX. 2-3 GW)
Reference
Energy [R]evolution
Advanced
WindPRODUCTION CAPACITY IN 2007 (APPROX. 25 GW)
Reference
Energy [R]evolution
Advanced
GeothermalPRODUCTION CAPACITY IN 2007 (APPROX. 1-2 GW)
Reference
Energy [R]evolution
Advanced - not available
OceanPRODUCTION CAPACITY IN 2007 (APPROX. >1 GW)
Reference
Energy [R]evolution
Advanced - not available
TotalPRODUCTION CAPACITIESPRODUCTION CAPACITY IN 2007 (APPROX.)
Reference
Energy [R]evolution
Advanced
© G
P/H
OTL
I S
IMA
NJU
NTA
K
© G
P/H
U W
EI
image GREENPEACE DONATES A SOLAR POWER SYSTEM TO A COASTAL VILLAGE INACEH, INDONESIA, ONE OF THE WORST HIT AREAS BY THE TSUNAMI IN DECEMBER 2004.
image A LOCAL WOMAN WORKS WITH TRADITIONAL AGRICULTURE PRACTICES JUSTBELOW 21ST CENTURY ENERGY TECHNOLOGY. THE JILIN TONGYU TONGFA WIND POWERPROJECT, WITH A TOTAL OF 118 WIND TURBINES, IS A GRID CONNECTED RENEWABLEENERGY PROJECT.

104
GLOBAL ENERGY [R]EVOLUTIONA SUSTAINABLE GLOBAL ENERGY OUTLOOK
7
futu
[r]e investm
ent
|F
UE
L C
OS
TS
map 7.2: fuel costs in the reference and the energy [r]evolution scenarioWORLDWIDE SCENARIO
SCENARIO
LEGEND
REFERENCE SCENARIO
ALTERNATIVE SCENARIO
DIFFERENCE BETWEEN SCENARIOS
REF
E[R]
DIF
0 1000 KM
COST OF COAL BILLION $
COST OF GAS BILLION $
COST OF OIL BILLION $
FUEL COSTS> 0 > 5 > 10
> 15 > 20 > 25
> 30 > 35 > 40
> 45 > 50 % FUEL COST SAVING IN THE E[R]SCENARIO COMPARED TO THEREFERENCE SCENARIO 2005-2030.GLOBAL FUEL SAVING IS 23.25%
1,231
2,603
2,159
5,994
E[R]
43
703
1,889
2,636
DIF
OECD NORTH AMERICA
2005-2010
2011-2020
2021-2030
2005-2030
1,275
3,307
4,048
8,629
REF
TOTAL ALL
FUELS
409
1,320
1,692
3,421
-20
-244
-226
-490
2005-2010
2011-2020
2021-2030
2005-2030
389
1,076
1,466
2,931
135
177
74
386
11
115
170
295
2005-2010
2011-2020
2021-2030
2005-2030
146
292
244
681
1,775
4,100
3,925
9,801
34
574
1,833
2,441
2005-2010
2011-2020
2021-2030
2005-2030
1,809
4,674
5,758
12,242
22
30
19
71
E[R]
3
46
112
162
DIF
OECD LATIN AMERICA
2005-2010
2011-2020
2021-2030
2005-2030
25
76
231
233
REF
TOTAL ALL
FUELS
81
225
234
540
8
170
514
692
2005-2010
2011-2020
2021-2030
2005-2030
89
395
749
1,233
56
81
16
152
-2
25
72
95
2005-2010
2011-2020
2021-2030
2005-2030
54
106
87
247
158
336
269
763
10
241
698
949
2005-2010
2011-2020
2021-2030
2005-2030
168
577
967
1,712

105
7
futu
[r]e investm
ent
|K
YO
TO
PR
OT
OC
OL
DESIGN WWW.ONEHEMISPHERE.SE CONCEPT SVEN TESKE/GREENPEACE INTERNATIONAL.
2,817
9,097
9,242
21,156
E[R]
17
1,272
5,666
6,956
DIF
CHINA
2005-2010
2011-2020
2021-2030
2005-2030
2,834
10,370
14,908
28,112
REF
TOTAL ALL
FUELS
28
204
495
726
0
-59
-147
-206
2005-2010
2011-2020
2021-2030
2005-2030
27
145
348
520
44
81
57
182
2
13
29
43
2005-2010
2011-2020
2021-2030
2005-2030
46
93
86
225
2,889
9,382
9,793
22,064
19
1,226
5,548
6,793
2005-2010
2011-2020
2021-2030
2005-2030
2,907
10,608
15,342
28,857
320
508
300
1,128
E[R]
68
425
610
1,104
DIF
TRANSITION ECONOMIES
2005-2010
2011-2020
2021-2030
2005-2030
389
933
910
2,232
REF
TOTAL ALL
FUELS
535
1,347
1,487
3,369
-26
-77
191
89
2005-2010
2011-2020
2021-2030
2005-2030
510
1,270
1,687
3,458
55
81
22
158
-4
4
47
47
2005-2010
2011-2020
2021-2030
2005-2030
52
84
69
205
911
1,936
1,808
4,655
39
352
848
1,239
2005-2010
2011-2020
2021-2030
2005-2030
950
2,288
2,657
5,894
31
56
42
128
E[R]
2
48
106
156
DIF
MIDDLE EAST
2005-2010
2011-2020
2021-2030
2005-2030
33
103
148
284
REF
TOTAL ALL
FUELS
230
665
821
1,716
-7
106
601
700
2005-2010
2011-2020
2021-2030
2005-2030
223
771
1,422
2,416
215
461
327
1,002
13
140
388
542
2005-2010
2011-2020
2021-2030
2005-2030
227
601
715
1,544
475
1,182
1,89
2,846
8
294
1,095
1,397
2005-2010
2011-2020
2021-2030
2005-2030
483
1,476
2,285
4,244
582
1,155
579
2,316
E[R]
46
408
1,343
1,797
DIF
OECD EUROPE
2005-2010
2011-2020
2021-2030
2005-2030
628
1,563
1,922
4,113
REF
TOTAL ALL
FUELS
311
981
1,266
2,558
-4
-54
227
168
2005-2010
2011-2020
2021-2030
2005-2030
307
928
1,493
2,726
119
124
56
298
5
69
68
141
2005-2010
2011-2020
2021-2030
2005-2030
124
192
124
440
1,011
2,260
1,901
5,172
47
422
1,637
2,107
2005-2010
2011-2020
2021-2030
2005-2030
1,058
2,682
3,539
7,279
6,698
18,001
17,254
41,953
E[R]
192
3,576
12,477
16,244
DIF
WORLD
2005-2010
2011-2020
2021-2030
2005-2030
6,890
21,577
29,731
58,198
REF
TOTAL ALL
FUELS
2,047
6,283
8,396
16,727
-59
-147
1,291
1,085
2005-2010
2011-2020
2021-2030
2005-2030
1,989
6,136
9,686
17,811
855
1,465
862
3,181
27
438
949
1,415
2005-2010
2011-2020
2021-2030
2005-2030
883
1,902
1,811
14,596
9,600
25,749
26,511
61,861
161
3,866
14,716
18,744
2005-2010
2011-2020
2021-2030
2005-2030
9,761
29,616
41,228
80,605
455
1,202
1,203
2,859
E[R]
11
227
421
659
DIF
OECD PACIFIC
2005-2010
2011-2020
2021-2030
2005-2030
466
1,428
1,624
3,517
REF
TOTAL ALL
FUELS
163
603
946
1,712
-9
-99
-187
-296
2005-2010
2011-2020
2021-2030
2005-2030
154
504
759
1,417
108
198
113
419
2
28
53
89
2005-2010
2011-2020
2021-2030
2005-2030
110
226
166
502
725
2,003
2,262
4,990
4
156
287
446
2005-2010
2011-2020
2021-2030
2005-2030
729
2,158
2,549
5,437
289
732
718
1,738
E[R]
1
137
590
727
DIF
DEVELOPING ASIA
2005-2010
2011-2020
2021-2030
2005-2030
289
868
1,308
2,466
REF
TOTAL ALL
FUELS
175
524
667
1,367
0
56
189
245
2005-2010
2011-2020
2021-2030
2005-2030
175
581
856
1,612
61
150
133
344
0
23
58
81
2005-2010
2011-2020
2021-2030
2005-2030
61
173
191
425
526
1,406
1,518
3,450
1
216
837
1,053
2005-2010
2011-2020
2021-2030
2005-2030
526
1,622
2,355
4,503
706
1,987
2,240
4,933
E[R]
0
315
1,699
2,014
DIF
INDIA
2005-2010
2011-2020
2021-2030
2005-2030
705
2,302
3,938
6,947
REF
TOTAL ALL
FUELS
33
157
440
630
0
-5
-119
-124
2005-2010
2011-2020
2021-2030
2005-2030
33
152
321
506
26
40
12
78
0
19
43
62
2005-2010
2011-2020
2021-2030
2005-2030
26
59
56
140
764
2,184
2,693
5,641
0
330
1,622
1,952
2005-2010
2011-2020
2021-2030
2005-2030
764
2,514
4,315
7,593
247
632
753
1,632
E[R]
0
-6
40
34
DIF
AFRICA
2005-2010
2011-2020
2021-2030
2005-2030
247
626
793
1,666
REF
TOTAL ALL
FUELS
82
258
347
687
0
59
247
307
2005-2010
2011-2020
2021-2030
2005-2030
82
317
594
993
37
72
52
161
0
4
22
26
2005-2010
2011-2020
2021-2030
2005-2030
37
75
74
186
366
962
1,252
2,479
0
57
309
366
2005-2010
2011-2020
2021-2030
2005-2030
366
1,018
1,461
2,845

106
GLOBAL ENERGY [R]EVOLUTIONA SUSTAINABLE GLOBAL ENERGY OUTLOOK
investment in new power plants
The overall global level of investment required in new power plantsup to 2030 will be in the region of $ 11 to 14 trillion. The maindriver for investment in new generation capacity in OECD countrieswill be the ageing power plant fleet. Utilities will make theirtechnology choices within the next five to ten years based on nationalenergy policies, in particular market liberalisation, renewable energyand CO2 reduction targets. Within Europe, the EU emissions tradingscheme may have a major impact on whether the majority ofinvestment goes into fossil fuel power plants or renewable energy andco-generation. In developing countries, international financialinstitutions will play a major role in future technology choices.
The investment volume required to realise the Energy [R]evolutionScenario is $ 14.7 trillion, approximately 30% higher than in theReference Scenario, which will require $ 11.3 trillion. Whilst thelevels of investment in renewable energy and fossil fuels are almostequal under the Reference Scenario, with about $ 4.5 trillion eachup to 2030, the Energy [R]evolution Scenario shifts about 80% ofinvestment towards renewable energy. The fossil fuel share of powersector investment is focused mainly on combined heat and powerand efficient gas-fired power plants.
The average annual investment in the power sector under the Energy[R]evolution Scenario between 2005 and 2030 is approximately $ 590 billion. This is equal to the current amount of subsidies forfossil fuels globally in less than two years. Most investment in newpower generation will take place in China, followed by NorthAmerica and Europe. South Asia, including India, and East Asia,including Indonesia, Thailand and the Philippines, will also be ‘hotspots’ of new power generation investment.
7
futu
[r]e investm
ent
|P
OW
ER
PL
AN
TS
figure 7.3: investment shares - reference versus energy [r]evolution
reference scenario 2005 - 2030
7% NUCLEAR POWER
40% FOSSIL
11% COGENERATION
42% RENEWABLES
total 11.3 trillion $
energy [r]evolution scenario 2005 - 2030
18% FOSSIL
20% COGENERATION
62% RENEWABLES
total 14.7 trillion $
figure 7.4: change in cumulative power plantinvestment in the energy [r]evolution scenario
5,000,000
4,000,000
3,000,000
2,000,000
1,000,000
Million $0
-1,000,000
-2,000,000
-3,000,000 2005-2010 2011-2020 2021-2030 2004-2030
•FOSSIL
•NUCLEAR
•RENEWABLES

107
renewable power generation investment
Under the Reference Scenario the investment expected in renewableelectricity generation will be $ 4.7 trillion. This compares with $ 8.9 trillion in the Energy [R]evolution Scenario. The regionaldistribution in the two scenarios, however, is almost the same.
How investment is divided between the different renewable powergeneration technologies depends on their level of technicaldevelopment. Technologies like wind power, which in some regionswith good wind resources is already cost competitive withconventional fuels, will take a larger investment volume and abigger market share. The market volume by technology and regionalso depends on the local resources and policy framework.
For solar photovoltaics, the main market will remain for someyears in Europe and the US, but will soon expand across China andIndia. Because solar PV is a highly modular and decentralisedtechnology which can be used almost everywhere, its market willeventually be spread across the entire world.
Concentrated solar power systems, on the other hand, can only beoperated within the world’s sunbelt regions. The main investment inthis technology will therefore take place in North Africa, theMiddle East, parts of the USA and Mexico, as well as south-westChina, India, Australia and southern Europe.
The main development of the wind industry will take place in Europe,North America and China. Offshore wind technology will take alarger share from roughly 2015 onwards. The main offshore winddevelopment will take place in North Europe and North America.
The market for geothermal power plants will be mainly in NorthAmerica and East Asia. The USA, Indonesia and the Philippines,and some countries of central and southern Africa, have the highestpotential over the next 20 years. After 2030, geothermal generationwill expand to other parts of the world, including Europe and India.
Bio energy power plants will be distributed across the whole worldas there is potential almost everywhere for biomass and/or biogas(cogeneration) power plants.
7
futu
[r]e investm
ent
|P
OW
ER
GE
NE
RA
TIO
N
•FOSSIL
•RENEWABLES
figure 7.5: cumulative power plant investments by region 2004-2030 in the energy [r]evolution scenario
Transition Economies
South Asia
OECD Pacific
OECD North America
OECD Europe
Middle East
Latin America
East Asia
China
Africa
0 200,000 400,000 600,000 800,000 1,000,000 1,200,000 1,400,000 1,600,000 Million $
© G
P/V
INA
I D
ITH
AJO
HN
image WORKERS BUILD A WIND TURBINEIN A FACTORY IN PATHUM THANI,THAILAND. THE IMPACTS OF SEA-LEVELRISE DUE TO CLIMATE CHANGE AREPREDICTED TO HIT HARD ON COASTALCOUNTRIES IN ASIA, AND CLEANRENEWABLE ENERGY IS A SOLUTION.

108
GLOBAL ENERGY [R]EVOLUTIONA SUSTAINABLE GLOBAL ENERGY OUTLOOK
fossil fuel power generation investment
Under the Reference Scenario, the main market expansion for newfossil fuel power plants will be in China, followed by North America,which will have a volume equal to India and Europe combined. Inthe Energy [R]evolution Scenario the overall investment in fossil fuelpower stations up to 2030 will be $ 2,600 billion, significantly lowerthan the Reference Scenario’s $ 4,500 billion.
China will be by far the largest investor in coal power plants in bothscenarios. While in the Reference Scenario the growth trend of thecurrent decade (2000–2010) will continue towards 2030, theEnergy [R]evolution Scenario assumes that in the second and thirddecades (2011-2030) growth slows down significantly. In theReference Scenario the massive expansion of coal firing is due toactivity in China, followed by the USA, India, East Asia and Europe.
The total cost for fossil fuel investment in the Reference Scenario between2005 and 2030 amounts to $ 80.6 trillion, compared to $ 61.8 trillion inthe Energy [R]evolution Scenario. This means that fuel costs in the Energy[R]evolution Scenario are already about 25% lower by 2030 and will be
50% lower by 2050. Although the investment in gas-fired power stationsand cogeneration plants is about the same in both scenarios, the financecommitted to oil and coal for electricity generation in the Energy[R]evolution Scenario is almost 30% below the Reference version.
fuel cost savings with renewables
Because renewable energy has no fuel costs, the total fuel cost savingsin the Energy [R]evolution Scenario reach a total of $18.7 trillion, or $ 750 billion per year. A comparison between the extra fuel costsassociated with the Reference Scenario and the extra investment costsof the Energy [R]evolution version shows that the average annualadditional fuel costs are about five times higher than the additionalinvestment requirements of the alternative scenario. In fact, theadditional costs for coal fuel from today until the year 2030 are ashigh as $ 15.9 trillion: this would cover the entire investment inrenewable and cogeneration capacity required to implement the Energy[R]evolution Scenario. These renewable energy sources will produceelectricity without any further fuel costs beyond 2030, while the costsfor coal and gas will continue to be a burden on national economies.
7
futu
[r]e investm
ent
|F
OS
SIL
FU
EL
S - S
AV
ING
S W
ITH
RE
NE
WA
BL
ES
table 7.3: fuel and investment costs in the reference and the energy [r]evolution scenario
INVESTMENT COST
REFERENCE SCENARIO
Total NuclearTotal FossilTotal RenewablesTotal CogenerationTotalE[R] SCENARIO
Total FossilTotal RenewablesTotal CogenerationTotalDIFFERENCE E[R] VERSUS REF
Total Fossil & NuclearTotal CogenerationTotal RenewablesTotalFUEL COSTS
REFERENCE SCENARIO
Total Fuel Oil Total GasTotalCoalTotal LigniteTotal Fossil FuelsE[R] SCENARIO
Total Fuel Oil Total GasTotal CoalTotal LigniteTotal Fossil FuelsSAVINGS REF VERSUS E[R]
Fuel Oil GasCoalLigniteTotal Fossil Fuel Savings
DOLLAR
billion $ 2005 billion $ 2005billion $ 2005billion $ 2005billion $ 2005
billion $ 2005billion $ 2005billion $ 2005billion $ 2005
billion $ 2005billion $ 2005billion $ 2005billion $ 2005
billion $/abillion $/abillion $/abillion $/abillion $/a
billion $/abillion $/abillion $/abillion $/abillion $/a
billion $/abillion $/abillion $/abillion $/abillion $/a
2005-2010
2251,1901,193
2712,849
1,3141,299
3602,973
-10189
136124
8831,9896,742
1489,761
8552,0476,557
1419,600
27-59185
7161
2011-2020
3101,6591,837
5234,322
9953,4751,2005,670
-967678
1,6371,348
1,9026,136
21,296281
29,616
1,4646,283
17,820181
25,749
438-147
3,476100
3,866
2021-2030
2861,6931,702
4644,144
5364,2161,3656,117
-1,443902
2,5141,973
1,8119,686
29,420311
41,228
8628,396
17,17975
26,511
9491,291
12,241236
14,716
2005-2030
8214,5354,7021,257
11,315
2,8458,9892,926
14,761
-2,5111,6694,2873,445
4,59517,81157,458
74080,605
3,18116,72741,556
39761,861
1,4151,085
15,901343
18,744
2005-2030 AVERAGE PER YEAR
33181188
50453
114360117590
-10067
171138
184712
2,29830
3,224
127669
1,66216
2,474
5743
63614
750

109
8energy resources & security of supply
GLOBAL NUCLEARTHE GLOBAL POTENTIAL FOR SUSTAINABLE BIOMASS
“the issue of securityof supply is now at the top of the energypolicy agenda.”GREENPEACE INTERNATIONALCLIMATE CAMPAIGN
8AR
OU
ND
80%
OF
GLOBAL
ENERGY DEMAND IS MET BY FINITEFOSSI
LFU
EL
S. ©
R. K
AS
PR
ZA
K/D
RE
AM
STIM
E

110
GLOBAL ENERGY [R]EVOLUTIONA SUSTAINABLE GLOBAL ENERGY OUTLOOK
The issue of security of supply is now at the top of the energy policyagenda. Concern is focused both on price security and the securityof physical supply. At present around 80% of global energy demandis met by fossil fuels. The unrelenting increase in energy demand ismatched by the finite nature of these sources. The regionaldistribution of oil and gas resources, on the other hand, does notmatch the distribution of demand. Some countries have to relyalmost entirely on fossil fuel imports. The maps on the followingpages provide an overview of the availability of different fuels andtheir regional distribution. Information in this chapter is basedpartly on the report ‘Plugging the Gap’36.
oil
Oil is the lifeblood of the modern global economy, as the effects ofthe supply disruptions of the 1970s made clear. It is the numberone source of energy, providing 36% of the world’s needs and thefuel employed almost exclusively for essential uses such astransportation. However, a passionate debate has developed over theability of supply to meet increasing consumption, a debate obscuredby poor information and stirred by recent soaring prices.
the reserves chaos
Public data about oil and gas reserves is strikingly inconsistent, andpotentially unreliable for legal, commercial, historical andsometimes political reasons. The most widely available and quotedfigures, those from the industry journals Oil & Gas Journal andWorld Oil, have limited value as they report the reserve figuresprovided by companies and governments without analysis orverification. Moreover, as there is no agreed definition of reserves orstandard reporting practice, these figures usually stand for differentphysical and conceptual magnitudes. Confusing terminology(‘proved’, ‘probable’, ‘possible’, ‘recoverable’, ‘reasonable certainty’)only adds to the problem.
Historically, private oil companies have consistently underestimatedtheir reserves to comply with conservative stock exchange rules andthrough natural commercial caution. Whenever a discovery wasmade, only a portion of the geologist’s estimate of recoverableresources was reported; subsequent revisions would then increasethe reserves from that same oil field over time. National oilcompanies, mostly represented by OPEC (Organisation ofPetroleum Exporting Countries), are not subject to any sort ofaccountability, so their reporting practices are even less clear. Inthe late 1980s, OPEC countries blatantly overstated their reserveswhile competing for production quotas, which were allocated as aproportion of the reserves. Although some revision was needed afterthe companies were nationalised, between 1985 and 1990, OPECcountries increased their joint reserves by 82%. Not only werethese dubious revisions never corrected, but many of these countrieshave reported untouched reserves for years, even if no sizeablediscoveries were made and production continued at the same pace.Additionally, the Former Soviet Union’s oil and gas reserves havebeen overestimated by about 30% because the original assessmentswere later misinterpreted.
Whilst private companies are now becoming more realistic about theextent of their resources, the OPEC countries hold by far themajority of the reported reserves, and information on their resourcesis as unsatisfactory as ever. In brief, these information sourcesshould be treated with considerable caution. To fairly estimate theworld’s oil resources a regional assessment of the mean backdated(i.e. ‘technical’) discoveries would need to be performed.
8
energ
y resou
rces & secu
rity of su
pp
ly|
OIL
- RE
SE
RV
ES
CH
AO
S
references36 ‘PLUGGING THE GAP - A SURVEY OF WORLD FUEL RESOURCES AND THEIR IMPACT ONTHE DEVELOPMENT OF WIND ENERGY’, GLOBAL WIND ENERGY COUNCIL/RENEWABLEENERGY SYSTEMS, 2006

111
8
energ
y resou
rces & secu
rity of su
pp
ly|
GA
S - C
OA
L
gas
Natural gas has been the fastest growing fossil energy source in thelast two decades, boosted by its increasing share in the electricitygeneration mix. Gas is generally regarded as an abundant resourceand public concerns about depletion are limited to oil, even thoughfew in-depth studies address the subject. Gas resources are moreconcentrated, and a few massive fields make up most of thereserves: the largest gas field in the world holds 15% of the‘Ultimate Recoverable Resources’ (URR), compared to 6% for oil.Unfortunately, information about gas resources suffers from thesame bad practices as oil data because gas mostly comes from thesame geological formations, and the same stakeholders are involved.
Most reserves are initially understated and then gradually revisedupwards, giving an optimistic impression of growth. By contrast,Russia’s reserves, the largest in the world, are considered to havebeen overestimated by about 30%. Owing to geological similarities,gas follows the same depletion dynamic as oil, and thus the samediscovery and production cycles. In fact, existing data for gas is ofworse quality than for oil, with ambiguities arising over the amountproduced partly because flared and vented gas is not alwaysaccounted for. As opposed to published reserves, the technical oneshave been almost constant since 1980 because discoveries haveroughly matched production.
coal
Coal was the world’s largest source of primary energy until it wasovertaken by oil in the 1960s. Today, coal supplies almost onequarter of the world’s energy. Despite being the most abundant offossil fuels, coal’s development is currently threatened byenvironmental concerns; hence its future will unfold in the contextof both energy security and global warming.
Coal is abundant and more equally distributed throughout the worldthan oil and gas. Global recoverable reserves are the largest of allfossil fuels, and most countries have at least some. Moreover, existingand prospective big energy consumers like the US, China and Indiaare self-sufficient in coal and will be for the foreseeable future. Coalhas been exploited on a large scale for two centuries, so both theproduct and the available resources are well known; no substantialnew deposits are expected to be discovered. Extrapolating thedemand forecast forward, the world will consume 20% of its currentreserves by 2030 and 40% by 2050. Hence, if current trends aremaintained, coal would still last several hundred years.
table 8.1: overview of fossil fuel reserves and resourcesRESERVES, RESOURCES AND ADDITIONAL OCCURRENCES OF FOSSIL ENERGY CARRIERS ACCORDING TO DIFFERENT AUTHORS. C CONVENTIONAL (PETROLEUM
WITH A CERTAIN DENSITY, FREE NATURAL GAS, PETROLEUM GAS, NC NON-CONVENTIONAL) HEAVY FUEL OIL, VERY HEAVY OILS, TAR SANDS AND OIL SHALE,
GAS IN COAL SEAMS, AQUIFER GAS, NATURAL GAS IN TIGHT FORMATIONS, GAS HYDRATES). THE PRESENCE OF ADDITIONAL OCCURRENCES IS ASSUMED
BASED ON GEOLOGICAL CONDITIONS, BUT THEIR POTENTIAL FOR ECONOMIC RECOVERY IS CURRENTLY VERY UNCERTAIN. IN COMPARISON: IN 1998, THE
GLOBAL PRIMARY ENERGY DEMAND WAS 402EJ (UNDP ET AL., 2000).
source SEE TABLE a) INCLUDING GAS HYDRATES
5,400
8,000
11,700
10,800
796,000
5,900
6,600
7,500
15,500
61,000
42,000
100,000
121,000
212,200
1,204,200
5,900
8,000
11,700
10,800
799,700
6,300
8,100
6,100
13,900
79,500
25,400
117,000
125,600
213,200
1,218,000
5,500
9,400
11,100
23,800
930,000
6,000
5,100
6,100
15,200
45,000
20,700
179,000
281,900
1,256,000
5,300
100
7,800
111,900
6,700
5,900
3,300
25,200
16,300
179,000
361,500
ENERGY CARRIER
Gas reserves
resources
additional occurrences
Oil reserves
resources
additional occurrences
Coal reserves
resources
additional occurrences
Total resource (reserves + resources)
Total occurrence
BROWN, 2002EJ
5,600
9,400
5,800
10,200
23,600
26,000
180,600
IEA, 2002cEJ
6,200
11,100
5,700
13,400
22,500
165,000
223,900
IPCC, 2001aEJ
c
nc
c
nc
c
nc
c
nc
NAKICENOVICET AL., 2000
EJ
c
nc
c
nc
c
nc
c
nc
UNDP ET AL.,2000 EJ
c
nc
c
nc
c
nc
c
nc
BGR, 1998EJ
c
nc
c
nca)
c
nc
c
nc
© G
P/L
AN
GE
R
© N
. BE
HR
ING
-CH
ISH
OL
M/G
Pimage PLATFORM/OIL RIG DUNLIN IN THE NORTH SEA SHOWING OIL POLLUTION.
image ON A LINFEN STREET, TWO MEN LOAD UP A CART WITH COAL THAT WILL BEUSED FOR COOKING. LINFEN, A CITY OF ABOUT 4.3 MILLION, IS ONE OF THE MOSTPOLLUTED CITIES IN THE WORLD. CHINA’S INCREASINGLY POLLUTED ENVIRONMENTIS LARGELY A RESULT OF THE COUNTRY’S RAPID DEVELOPMENT AND CONSEQUENTLYA LARGE INCREASE IN PRIMARY ENERGY CONSUMPTION, WHICH IS ALMOST ENTIRELYPRODUCED BY BURNING COAL.

112
GLOBAL ENERGY [R]EVOLUTIONA SUSTAINABLE GLOBAL ENERGY OUTLOOK
8
energ
y resou
rces & secu
rity of su
pp
ly|
NU
CL
EA
R
nuclear
Uranium, the fuel used in nuclear power plants, is a finite resourcewhose economically available reserves are limited. Its distribution isalmost as concentrated as oil and does not match regionalconsumption. Five countries - Canada, Australia, Kazakhstan,Russia and Niger - control three quarters of the world’s supply. Asa significant user of uranium, however, Russia’s reserves will beexhausted within ten years.
Secondary sources, such as old deposits, currently make up nearlyhalf of worldwide uranium reserves. However, those will soon beused up. Mining capacities will have to be nearly doubled in thenext few years to meet current needs.
A joint report by the OECD Nuclear Energy Agency37 and theInternational Atomic Energy Agency estimates that all existingnuclear power plants will have used up their nuclear fuel, employingcurrent technology, within less than 70 years. Given the range ofscenarios for the worldwide development of nuclear power, it islikely that uranium supplies will be exhausted sometime between2026 and 2070. This forecast includes the use of mixed oxide fuel(MOX), a mixture of uranium and plutonium.
table 8.2: assumptions on fossil fuel use in the energy [r]evolution scenario
2010
175.865
28.736
168.321
27.503
2005
161.739
26.428
161.751
26.430
2020
201.402
32.909
147.531
24.106
2030
224.854
36.741
126.088
20.603
2040
250.093
40.865
102.912
16.816
2050
278.527
45.511
83.927
13.714
Oil
Reference [PJ]
Reference [million barrels]
Alternative [PJ]
Alternative [million barrels]
2010
111.600
2936,8
115.011
3026,6
2005
99.741
2624,8
99.746
2624,9
2020
135.291
3560,3
128.402
3379,0
2030
157.044
4132,7
122.884
3233,8
2040
170.244
4480,1
100.682
2649,5
2050
180.559
4751,5
74.596
1963,1
Gas
Reference [PJ]
Reference [billion cubic metres = 10E9m3]
Alternative [PJ]
Alternative [billion cubic metres = 10E9m3]
2010
146.577
7.742
139.439
7.299
2005
121.639
6.640
121.621
6.639
2020
179.684
9.182
133.336
6.367
2030
209.482
10.554
106.493
4.784
2040
232.422
11.659
77.675
3.392
2050
257.535
12.839
51.438
2.234
Coal
Reference [PJ]
Reference [million tonnes]
Alternative [PJ]
Alternative [million tonnes]
references37 ‘URANIUM 2003: RESOURCES, PRODUCTION AND DEMAND’

113
8
energ
y resou
rces & secu
rity of su
pp
ly|
NU
CL
EA
R
© Z
AR
UB
IN/D
RE
AM
STIM
E
image OLD NUCLEAR PLANT. CRIMEA, UKRAINE.
© R
OB
ER
T K
NOT
H/G
P
© G
P/T
IM G
EO
RG
ES
ON
© G
P/C
HR
IST
IAN
AS
LU
ND
© G
P/J
IM H
OD
SO
N
© N
. BE
HR
ING
-CH
ISH
OL
M/G
P
images 1. SCIENTIST FROM THE LOS ALAMOS NUCLEAR LABORATORY, NEW MEXICO,(USA). WEAPONS-GRADE PLUTONIUM IS TRANSPORTED FROM LOS ALAMOS (USA) TOCADARACHE (FRANCE) VIA SEVERAL DESTINATIONS FOR TRANSFORMATION INTOPLUTONIUM FUEL OR MOX (URANIUM-PLUTONIUM OXIDE) THEN DESTINED FORSHIPMENT BACK TO USA FOR TESTS IN REACTOR. 2. DSUNUSOVA GULSUM (43) ISSUFFERING FROM A BRAIN TUMOUR. SHE LIVES IN THE NUCLEAR BOMB TESTING AREAIN THE EAST KAZAKH REGION OF KAZAKHSTAN. 3. DOCTOR PEI HONGCHUAN EXAMINESZHAI LISHENG, A YOUNG BOY WHO IS SUFFERING FROM A RESPIRATORY ILLNESS DUETO THE HEAVY POLLUTION IN LINFEN. LINFEN, A CITY OF ABOUT 4.3 MILLION, IS ONEOF THE MOST POLLUTED CITIES IN THE WORLD. CHINA’S INCREASINGLY POLLUTEDENVIRONMENT IS LARGELY A RESULT OF THE COUNTRY’S RAPID DEVELOPMENT ANDCONSEQUENTLY A LARGE INCREASE IN PRIMARY ENERGY CONSUMPTION, WHICH ISALMOST ENTIRELY PRODUCED BY BURNING COAL. 4. GREENPEACE SURVEY OF GULFWAR OIL POLLUTION IN KUWAIT. AERIAL VIEW OF OIL IN THE SEA. 5. AERIAL VIEW OFTHE CHEVRON EMPIRE, SITUATED IN PLAQUEMINES PARISH NEAR THE MOUTH OF THEMISSISSIPPI RIVER, AN AREA DEVASTATED BY HURRICANE KATRINA. AROUND 991,000GALLONS OF OIL WERE RELEASED. AROUND 4,000 GALLONS WERE RECOVERED AND AFURTHER 3,600 GALLONS WERE CONTAINED DURING THE HURRICANE. 19 DAYS AFTERHURRICANE KATRINA HIT THE DEVASTATION IS EVIDENT, WITH VILLAGES AND TOWNSSTILL FLOODED WITH CONTAMINATED WATER FROM THE OIL INDUSTRIES. LOCALRESIDENTS AND OFFICIALS BLAME A RUPTURED SHELL PIPELINE FOR SPREADINGOIL THROUGH MARSHES AND COMMUNITIES DOWN RIVER FROM NEW ORLEANS.
1
3
2
4 5

114
GLOBAL ENERGY [R]EVOLUTIONA SUSTAINABLE GLOBAL ENERGY OUTLOOK
8
energ
y resou
rces & secu
rity of su
pp
ly|
OIL
NON RENEWABLE RESOURCE
LEGEND
REFERENCE SCENARIO
ENERGY [R]EVOLUTION SCENARIO
REF
E[R]
0 1000 KM
RESERVES TOTAL THOUSAND MILLION BARRELS [TMB] | SHARE IN % OF GLOBAL TOTAL [END OF 2007]
CONSUMPTION PER REGION MILLION BARRELS [MB] | PETA JOULE [PJ]
CONSUMPTION PER PERSON LITERS [L]
H HIGHEST | M MIDDLE | L LOWEST
OIL
TMB %
OECD NORTH AMERICA
2007 69.3 5.6%
2005
2050
7,891H
10,554H
48,290H
64,590H
TMB %
69.3 5.6%
48,290H
11,531
7,891H
1,884
PJ PJMB MB
2005
2050
2,875H
2,906H
2,875H
519
L L
REF E[R]
TMB %
LATIN AMERICA
2007 111.2 9.0%
2005
2050
1,554
3,102
9,511
18,985
TMB %
111.2 9.0%
9,511
4,229
1,554
691
PJ PJMB MB
2005
2050
550
780
550
174
L L
REF E[R]
>60 50-60 40-50
30-40 20-30 10-20
5-10 0-5 % RESOURCESGLOBALLY
1988
1989
1990
1991
1992
1993
1994
1995
1996
1997
1998
1999
2000
2001
2002
2003
2004
2005
2006
2007
2010
2020
2030
2040
2050
140
130
120
110
100
90
80
70
60
50
40
30
20
10
0
US
$ D
OL
LA
RS
PE
R B
AR
RE
L
YEARS 1988 - 2007 PAST YEARS 2007 - 2050 FUTURE
COST
crude oil prices 1988 - 2007 and futurepredictions comparing theREF and E[R] scenarios1 barrel = 159 litresSOURCES REF: INTERNATIONALENERGY AGENCY/E[R]: DEVELOPMENTSAPPLIED IN THE GES-PROJECT
E[R]
REF
map 8.1: oil reference scenario and the energy [r]evolution scenarioWORLDWIDE SCENARIO

115
8
energ
y resou
rces & secu
rity of su
pp
ly|
OIL
TMB %
AFRICA
2007 117.5M 9.5%
2005
2050
893
2,238
5,465
13,697
TMB %
117.5M 9.5%
5,465
6,923
893
1,131
PJ PJMB MB
2005
2050
154
178L
154
90L
L L
REF E[R]
TMB %
INDIA
2007 5.5 0.5%
2005
2050
861L
4,220
5,272L
25,824
TMB %
5.5 0.5%
5,272
9,738
861
1,591
PJ PJMB MB
2005
2050
121L
405
121L
153
L L
REF E[R]
TMB %
DEVELOPING ASIA
2007 14.8 1.2%
2005
2050
1,871
4,073
11,450
24,928
TMB %
14.8 1.2%
11,450
11,297
1,871
1,846
PJ PJMB MB
2005
2050
305
431
305
195
L L
REF E[R]
TMB %
OECD PACIFIC
2007 5.1L 0.4%
2005
2050
2,689M
2,568
16,454M
15,718
TMB %
5.1L 0.4%
16,454
4,647
2,689
759
PJ PJMB MB
2005
2050
2,136
2,293
2,136
678H
L L
REF E[R]
TMB %
GLOBAL
2007 1,199 100%
2005
2050
26,428
45,511
161,739
278,527
TMB %
1,199 100%
161,739
83,927
26,428
13,714
PJ PJMB MB
2005
2050
646
789
646
238
L L
REF E[R]
TMB %
TRANSITION ECONOMIES
2007 87.6 10.1%L
2005
2050
1,503
2,063L
9,199
12,628L
TMB %
87.6 10.1%L
9,199
2,939L
1,503
480L
PJ PJMB MB
2005
2050
700M
1,117
700M
260
L L
REF E[R]
TMB %
CHINA
2007 15.5 1.3%
2005
2050
2,267
8,237
13,872
50,409
TMB %
15.5 1.3%
13,872
17,950H
2,267
2,933H
PJ PJMB MB
2005
2050
273
923
273
329M
L L
REF E[R]
TMB %
MIDDLE EAST
2007 755.3H 61.0%H
2005
2050
1,931
3,859
11,815
23,614
TMB %
755.3H 61.0%H
11,815
5,312
1,931
868
PJ PJMB MB
2005
2050
1,632
1,769
1,632
398
L L
REF E[R]
2005
2010
2020
2030
2040
2050
25
20
15
10
5
0
BIL
LIO
N T
ON
NE
S
YEARS 2005 - 2050
CO2 EMISSIONSFROM OIL
comparison between the REF and E[R]scenarios 2005 - 2050
billion tonnesSOURCE GPI/EREC
E[R]
REF
1970
1971
1972
1973
1974
1975
1976
1977
1978
1979
1980
1981
1982
1983
1984
1985
1986
1987
1988
1989
1990
1991
1992
1993
1994
1995
1996
1997
1998
1999
2000
2001
2002
2003
2004
2005
2010
2020
2030
2040
2050
YEARS 1970 - 2005 PAST YEARS 2005 - 2050 FUTURE
RESERVES AND CONSUMPTION
oil reserves versus global demand, production and consumption. global consumption comparisonbetween the REF and E[R] scenarios.
million barrels. 1 barrel = 159 litres
1,199BILLIONBARRELSPROVEN2007
SOURCE BP 2008
50,000
40,000
30,000
20,000
10,000
0
MIL
LIO
N B
AR
RE
LS
E[R]
REF
1,652BILLIONBARRELSUSED SINCE2005
983BILLIONBARRELSUSED SINCE2005
TMB %
OECD EUROPE
2007 16.9 1.4%M
2005
2050
4,969
4,597M
30,411
28,134M
TMB %
16.9 1.4%M
30,411
9,361M
4,969
1,530M
PJ PJMB MB
2005
2050
1,473
1,298M
1,473
432
L L
REF E[R]
REF global consumption
E[R] global consumption
DESIGN WWW.ONEHEMISPHERE.SE CONCEPT SVEN TESKE/GREENPEACE INTERNATIONAL.

116
GLOBAL ENERGY [R]EVOLUTIONA SUSTAINABLE GLOBAL ENERGY OUTLOOK
8
energ
y resou
rces & secu
rity of su
pp
ly|
GA
S
map 8.2: gas reference scenario and the energy [r]evolution scenarioWORLDWIDE SCENARIO
NON RENEWABLE RESOURCE
LEGEND
REFERENCE SCENARIO
ENERGY [R]EVOLUTION SCENARIO
REF
E[R]
0 1000 KM
RESERVES TOTAL TRILLION CUBIC METRES [tn m3] | SHARE IN % OF GLOBAL TOTAL [END OF 2007]
CONSUMPTION PER REGION BILLION CUBIC METRES [bn m3] | PETA JOULE [PJ]
CONSUMPTION PER PERSON CUBIC METRES [m3]
H HIGHEST | M MIDDLE | L LOWEST
GAS>50 40-50 30-40
20-30 10-20 5-10
0-5 % RESOURCESGLOBALLY
1988
1989
1990
1991
1992
1993
1994
1995
1996
1997
1998
1999
2000
2001
2002
2003
2004
2005
2006
2007
2010
2020
2030
2040
2050
242322212019181716151413121110
9876543210
US
$ D
OL
LA
RS
PE
R M
ILL
ION
Btu
YEARS 1984 - 2007 PAST YEARS 2007 - 2050 FUTURE
COST
gas prices of LNG/natural gas 1984 - 2007and future predictionscomparing the REF and E[R] scenarios.SOURCE JAPAN CIF/EUROPEANUNION CIF/IEA 2007 - US IMPORTS/IEA 2005 - EUROPEAN IMPORTS
LNG
NATURAL GAS
tn m3 %
OECD NORTH AMERICA
2007 8.0 4.4%
2005
2050
691H
878H
26,259H
33,354H
tn m3 %
8.0 4.4%
26,259H
13,911H
691H
366H
PJ PJbn m3 bn m3
2005
2050
1,584
1,520
1,584
634
m3 m3
REF E[R]
tn m3 %
LATIN AMERICA
2007 7.7 4.3%
2005
2050
112
420M
4,246
15,955M
tn m3 %
7.7 4.3%
4,246
3,986
112
105
PJ PJbn m3 bn m3
2005
2050
249
664
249
166
m3 m3
REF E[R]
E[R]
REF

117
8
energ
y resou
rces & secu
rity of su
pp
ly|
GA
S
2005
2010
2020
2030
2040
2050
25
20
15
10
5
0
BIL
LIO
N T
ON
NE
S
YEARS 2005 - 2050
CO2 EMISSIONSFROM GAS
comparison between the REF and E[R]scenarios 2005 - 2050
billion tonnesSOURCE GPI/EREC
E[R]
1970
1971
1972
1973
1974
1975
1976
1977
1978
1979
1980
1981
1982
1983
1984
1985
1986
1987
1988
1989
1990
1991
1992
1993
1994
1995
1996
1997
1998
1999
2000
2001
2002
2003
2004
2005
2010
2020
2030
2040
2050
YEARS 1970 - 2005 PAST YEARS 2005 - 2050 FUTURE
RESERVES AND CONSUMPTION
gas reserves versus global demand, production and consumption. global consumption comparisonbetween the REF and E[R] scenarios.
billion cubic metres
REF global consumption
E[R] global consumption
181TRILLIONCUBIC METRESPROVEN 2007
SOURCE 1970-2008 BP, 2007-2050 GPI/EREC
5,000
4,000
3,000
2,000
1,000
0
BIL
LIO
N m
3
E[R]
178TRILLIONCUBICMETRESUSED SINCE2005
134TRILLIONCUBICMETRESUSED SINCE2005
REF
tn m3 %
AFRICA
2007 14.6M 8.0%M
2005
2050
80
268
3,024
10,184
tn m3 %
14.6M 8.0%M
3,024
5,384
80
142
PJ PJbn m3 bn m3
2005
2050
86
134
86
71L
m3 m3
REF E[R]
tn m3 %
INDIA
2007 1.1L 0.6%L
2005
2050
32L
124L
1,208L
4,693L
tn m3 %
1.1L 0.6%L
1,208L
7,116M
32L
187M
PJ PJbn m3 bn m3
2005
2050
28L
74L
28L
113
m3 m3
REF E[R]
tn m3 %
DEVELOPING ASIA
2007 8.6 4.8%
2005
2050
159
341
6,047
12,956
tn m3 %
8.6 4.8%
6,047
8,109
159
213
PJ PJbn m3 bn m3
2005
2050
163
227
163
142
m3 m3
REF E[R]
tn m3 %
OECD PACIFIC
2007 2.9 1.6%
2005
2050
133
224
5,070
8,521
tn m3 %
2.9 1.6%
5,070
3,177L
133
84L
PJ PJbn m3 bn m3
2005
2050
667M
1,259
667M
469
m3 m3
REF E[R]
tn m3 %
GLOBAL
2007 181 100%
2005
2050
2,625
4,752
99,741
180,559
tn m3 %
181 100%
99,741
180,559
2,625
1,963
PJ PJbn m3 bn m3
2005
2050
404
518
404
214
m3 m3
REF E[R]
tn m3 %
TRANSITION ECONOMIES
2007 53.3 29.4%
2005
2050
611
766
23,234
29,089
tn m3 %
53.3 29.4%
23,234
8,790
611
231
PJ PJbn m3 bn m3
2005
2050
1,791H
2,605H
1,791H
787H
m3 m3
REF E[R]
tn m3 %
CHINA
2007 1.9 1.0%
2005
2050
47
277
1,805
10,519
tn m3 %
1.9 1.0%
1,805
8,886
47
234
PJ PJbn m3 bn m3
2005
2050
36
195
36
165
m3 m3
REF E[R]
tn m3 %
MIDDLE EAST
2007 73.2H 40.4%H
2005
2050
239M
719
9,075M
27,323
tn m3 %
73.2H 40.4%H
9,075
4,742
239
125
PJ PJbn m3 bn m3
2005
2050
1,270
2,073
1,270
360M
m3 m3
REF E[R]
tn m3 %
OECD EUROPE
2007 9.8 5.4%
2005
2050
520
736
19,773
27,965
tn m3 %
9.8 5.4%
19,773
10,494
520
276
PJ PJbn m3 bn m3
2005
2050
970
1,307M
970
490
m3 m3
REF E[R]
DESIGN WWW.ONEHEMISPHERE.SE CONCEPT SVEN TESKE/GREENPEACE INTERNATIONAL.
REF

118
GLOBAL ENERGY [R]EVOLUTIONA SUSTAINABLE GLOBAL ENERGY OUTLOOK
8
energ
y resou
rces & secu
rity of su
pp
ly|
CO
AL
map 8.3: coal reference scenario and the energy [r]evolution scenarioWORLDWIDE SCENARIO
NON RENEWABLE RESOURCE
LEGEND
REFERENCE SCENARIO
ENERGY [R]EVOLUTION SCENARIO
REF
E[R]
0 1000 KM
RESERVES TOTAL MILLION TONNES [mn t] | SHARE IN % OF GLOBAL TOTAL [END OF 2007]
CONSUMPTION PER REGION MILLION TONNES [mn t] | PETA JOULE [PJ]
CONSUMPTION PER PERSON TONNES [t]
H HIGHEST | M MIDDLE | L LOWEST
COAL>60 50-60 40-50
30-40 20-30 10-20
5-10 0-5 % RESOURCESGLOBALLY
1988
1989
1990
1991
1992
1993
1994
1995
1996
1997
1998
1999
2000
2001
2002
2003
2004
2005
2006
2007
2010
2020
2030
2040
2050
400
300
200
100
90
80
70
60
50
40
30
20
10
0
US
$ D
OL
LA
RS
PE
R T
ON
NE
YEARS 2007 - 2050 FUTURE
COST
coal prices 1988 - 2007and future predictions forthe E[R] scenario.US $ per tonne
SOURCE MCCLOSKEY COALINFORMATION SERVICE - EUROPE.PLATTS - US.
NW EUROPE
US CENTRAL APPALACHIAN
JAPAN STEAM COAL
E[R]
mn t %
OECD NORTH AMERICA
2007 250,510 29.6%H
2005
2050
1,823
2,616
24,342
39,621
mn t %
250,510 29.6%H
24,342
1,175
1,823
51
PJ PJmn t mn t
2005
2050
2.4
3.0H
2.4
0.1M
t t
REF E[R]
mn t %
LATIN AMERICA
2007 16,276 1.9%
2005
2050
48
247
972
4,926
mn t %
16,276 1.9%
972
355
48
15
PJ PJmn t mn t
2005
2050
0.1
0.3
0.1
0.0L
t t
REF E[R]
YEARS 1988 - 2007 PAST
REF

119
8
energ
y resou
rces & secu
rity of su
pp
ly|
CO
AL
2005
2010
2020
2030
2040
2050
25
20
15
10
5
0
BIL
LIO
N T
ON
NE
S
YEARS 2005 - 2050
CO2 EMISSIONSFROM COAL
comparison between the REF and E[R]scenarios 2005 - 2050
billion tonnesSOURCE GPI/EREC
REF
E[R]
1970
1971
1972
1973
1974
1975
1976
1977
1978
1979
1980
1981
1982
1983
1984
1985
1986
1987
1988
1989
1990
1991
1992
1993
1994
1995
1996
1997
1998
1999
2000
2001
2002
2003
2004
2005
2010
2020
2030
2040
2050
YEARS 1970 - 2005 PAST YEARS 2005 - 2050 FUTURE
RESERVES AND CONSUMPTION
coal reserves versus global demand, production and consumption. global consumption comparisonbetween the REF and E[R] scearios.
million tonnes
REF global consumption
E[R] global consumption
846BILLIONTONNESPROVEN2007
SOURCE 1970-2050 GPI/EREC, 1970-2008 BP.
13,000
12,000
11,000
10,000
9,000
8,000
7,000
6,000
5,000
4,000
3,000
2,000
1,000
0
MIL
LIO
N T
ON
NE
S
E[R]
396BILLIONTONNESUSED SINCE2005
213BILLIONTONNESUSED SINCE2005
REF
mn t %
AFRICA
2007 49,605 5.9%
2005
2050
182
400
4,198
9,207
mn t %
49,605 5.9%
4,198
3,749
182
163
PJ PJmn t mn t
2005
2050
0.2
0.2
0.2
0.1
t t
REF E[R]
mn t %
INDIA
2007 56,498 6.7%M
2005
2050
393
2,076
8,671
45,550
mn t %
56,498 6.7%M
8,671
10,478
393
455M
PJ PJmn t mn t
2005
2050
0.3
1.2
0.3
0.3
t t
REF E[R]
mn t %
DEVELOPING ASIA
2007 7,814 0.9%
2005
2050
237
655M
4,986
13,777
mn t %
7,814 0.9%
4,986
3,043
237
132
PJ PJmn t mn t
2005
2050
0.2
0.4
0.2
0.1
t t
REF E[R]
mn t %
OECD PACIFIC
2007 77,661 9%
2005
2050
517
568
9,307
10,902
mn t %
77,661 9%
9,307
3,402
517
148
PJ PJmn t mn t
2005
2050
2.0
2.7
2.0
0.8H
t t
REF E[R]
mn t %
GLOBAL
2007 846,496 100%
2005
2050
6,640
12,839
121,639
257,535
mn t %
846,496 100%
121,639
51,438
6,640
2,234
PJ PJmn t mn t
2005
2050
0.8
1.2
0.8
0.2H
t t
REF E[R]
mn t %
TRANSITION ECONOMIES
2007 222,183 26%
2005
2050
562
816
8,809
11,320
mn t %
222,183 26%
8,809
1,896
562
82
PJ PJmn t mn t
2005
2050
1.1
1.7M
1.1
0.3
t t
REF E[R]
mn t %
CHINA
2007 114,500 13.5%
2005
2050
1,995
4,498H
45,951
103,595
mn t %
114,500 13.5%
45,951
26,160
1,995
1,136H
PJ PJmn t mn t
2005
2050
1.5
3.2
1.5
0.8
t t
REF E[R]
mn t %
MIDDLE EAST
2007 1,386 0.2%L
2005
2050
16
132L
371
3,037
mn t %
1,386 0.2%L
371
34
16
1L
PJ PJmn t mn t
2005
2050
0.1
0.4L
0.1
0.0
t t
REF E[R]
mn t %
OECD EUROPE
2007 50,063 5.9%
2005
2050
865
831
14,031
15,598
mn t %
50,063 5.9%
14,031
1,145
865
50
PJ PJmn t mn t
2005
2050
1.1
1.2
1.1
0.1
t t
REF E[R]
DESIGN WWW.ONEHEMISPHERE.SE CONCEPT SVEN TESKE/GREENPEACE INTERNATIONAL.

120
GLOBAL ENERGY [R]EVOLUTIONA SUSTAINABLE GLOBAL ENERGY OUTLOOK
8
energ
y resou
rces & secu
rity of su
pp
ly|
NU
CL
EA
R
map 8.4: nuclear reference scenario and the energy [r]evolution scenarioWORLDWIDE SCENARIO
NON RENEWABLE RESOURCE
LEGEND
REFERENCE SCENARIO
ENERGY [R]EVOLUTION SCENARIO
REF
E[R]
0 1000 KM
RESERVES TOTAL TONNES | SHARE IN % OF GLOBAL TOTAL [END OF 2007]
GENERATION PER REGION TERAWATT HOURS [TWh]
CONSUMPTION PER REGION PETA JOULE [PJ]
CONSUMPTION PER PERSON KILOWATT HOURS [kWh]
H HIGHEST | M MIDDLE | L LOWEST
NUCLEAR>30 20-30 10-20
5-10 0-5 % RESOURCESGLOBALLY
1987
1988
1989
1990
1991
1992
1993
1994
1995
110
100
90
80
70
60
50
40
30
20
10
0
US
$ D
OL
LA
RS
PE
R T
ON
NE
t %
OECD NORTH AMERICA
2007 680,109 21.5%
2005
2050
914
1,098H
t %
680,109 21.5%
NUCLEAR POWERPHASED OUT BY 2040
TWh TWh
2005
2050
9,968
11,980H
9,968
0
PJ PJ
2005
2050
2,094
1,901
2,094
0
kWh kWh
REF E[R]
t %
LATIN AMERICA
2007 95,045 3%
2005
2050
17
30
t %
95,045 3%
PHASED OUT BY 2030
TWh TWh
2005
2050
183
327
183
0
PJ PJ
2005
2050
37
47
37
0
kWh kWh
REF E[R]

121
8
energ
y resou
rces & secu
rity of su
pp
ly|
NU
CL
EA
R
1995
1996
1997
1998
1999
2000
2001
2002
2003
2004
2005
2006
2007
2008
2010
2020
2030
2040
2050
35
30
25
20
15
10
5
0
NO
. OF
RE
AC
TOR
S
AGE OF REACTORS IN YEARS
REACTORS
age and number of reactors worldwide
SOURCES WISE
0 1 2 3 4 5 6 7 8 9 10 11 12 13 14 15 16 17 18 19 20 21 22 23 24 25 26 27 28 29 30 31 32 33 34 35 36 37 38 39 40
4000
3500
3000
2500
2000
1500
1000
500
0
YEARS 2005 - 2050
PRODUCTION
nuclear generationversus installed capacity.comparison between theREF and E[R] scenrios.TWh and GW
SOURCES GREENPEACE INTERNATIONAL
2005
2010
2020
2030
2040
2050
500
400
300
200
100
0
TW
h
GW
REF global generation (TWh)
REF global capacity (GW)
E[R] global generation (TWh)
E[R] global capacity (GW)
GW
TWh
GW
TWh
REFE[R]
t %
AFRICA
2007 470,312M 14.8%M
2005
2050
11
15
t %
470,312M 14.8%M
NUCLEAR POWERPHASED OUT BY 2025
TWh TWh
2005
2050
123
164
123
0
PJ PJ
2005
2050
12
8L
12
0
kWh kWh
REF E[R]
t %
INDIA
2007 40,980 1.3%
2005
2050
17
219
t %
40,980 1.3%
NUCLEAR POWERPHASED OUT BY 2045
TWh TWh
2005
2050
189
2,386
189
0
PJ PJ
2005
2050
15
132
15
0
kWh kWh
REF E[R]
t %
DEVELOPING ASIA
2007 5,630 0.2%
2005
2050
42
76
t %
5,630 0.2%
NUCLEAR POWERPHASED OUT BY 2045
TWh TWh
2005
2050
463
829
463
0
PJ PJ
2005
2050
44
51
44
0
kWh kWh
REF E[R]
t %
0ECD PACIFIC
2007 741,600 23.4%
2005
2050
452
734
t %
741,600 23.4%
NUCLEAR POWERPHASED OUT BY 2045
TWh TWh
2005
2050
4,927
8,007
4,033
0
PJ PJ
2005
2050
2,256H
4,122H
2,256H
0
kWh kWh
REF E[R]
t %
GLOBAL
2007 3,169,238 100%
2005
2050
2,768
3,517
t %
3,169,238 100%
NUCLEAR POWERPHASED OUT BY 2045
TWh TWh
2005
2050
30,201
38,372
30,201
0
PJ PJ
2005
2050
426
384
426
0
kWh kWh
REF E[R]
t %
TRANSITION ECONOMIES
2007 1,043,687H 32.9%H
2005
2050
281M
475
t %
1,043,687H 32.9%H
NUCLEAR POWERPHASED OUT BY 2045
TWh TWh
2005
2050
3,070M
5,183
3,070M
0
PJ PJ
2005
2050
824M
1,617
824M
0
kWh kWh
REF E[R]
t %
CHINA
2007 35,060 1.1%
2005
2050
53
433
t %
35,060 1.1%
NUCLEAR POWERPHASED OUT BY 2045
TWh TWh
2005
2050
579
4,728
579
0
PJ PJ
2005
2050
40
305
40
0
kWh kWh
REF E[R]
t %
MIDDLE EAST
2007 370L 0%L
2005
2050
0L
7L
t %
370L 0%L
NO NUCLEARENERGYDEVELOPMENT
TWh TWh
2005
2050
0L
76L
0L
0
PJ PJ
2005
2050
0L
20
0L
0
kWh kWh
REF E[R]
t %
OECD EUROPE
2007 56,445 1.8%
2005
2050
981H
430M
t %
56,445 1.8%
PHASED OUT BY 2030
TWh TWh
2005
2050
10,699H
4,692M
10,699H
0
PJ PJ
2005
2050
1,828
763M
1,828
0
kWh kWh
REF E[R]
COST
yellow cake prices 1987 - 2008 and futurepredictions comparing theREF and E[R] scenariostonnesSOURCES REF: INTERNATIONAL ENERGY AGENCY/E[R]: DEVELOPMENTSAPPLIED IN THE GES-PROJECT
YEARS 1970 - 2008 PAST YEARS 2008 - 2050 FUTURE
DESIGN WWW.ONEHEMISPHERE.SE CONCEPT SVEN TESKE/GREENPEACE INTERNATIONAL.

122
GLOBAL ENERGY [R]EVOLUTIONA SUSTAINABLE GLOBAL ENERGY OUTLOOK
renewable energy
Nature offers a variety of freely available options for producingenergy. Their exploitation is mainly a question of how to convertsunlight, wind, biomass or water into electricity, heat or power asefficiently, sustainably and cost-effectively as possible.
On average, the energy in the sunshine that reaches the Earth isabout one kilowatt per square metre worldwide. According to theResearch Association for Solar Power, power is gushing fromrenewable energy sources at a rate of 2,850 times more energy thanis needed in the world. In one day, the sunlight which reaches theEarth produces enough energy to satisfy the world’s current powerrequirements for eight years. Even though only a percentage of thatpotential is technically accessible, this is still enough to provide justunder six times more power than the world currently requires.
definition of types of energy resource potential38
theoretical potential The theoretical potential identifies thephysical upper limit of the energy available from a certain source.For solar energy, for example, this would be the total solarradiation falling on a particular surface.
conversion potential This is derived from the annual efficiency ofthe respective conversion technology. It is therefore not a strictlydefined value, since the efficiency of a particular technologydepends on technological progress.
technical potential This takes into account additional restrictionsregarding the area that is realistically available for energygeneration. Technological, structural and ecological restrictions, aswell as legislative requirements, are accounted for.
economic potential The proportion of the technical potential thatcan be utilised economically. For biomass, for example, thosequantities are included that can be exploited economically incompetition with other products and land uses.
sustainable potential This limits the potential of an energy sourcebased on evaluation of ecological and socio-economic factors.
8
energ
y resou
rces & secu
rity of su
pp
ly|
RE
NE
WA
BL
E E
NE
RG
Y
figure 8.1: energy resources of the world table 8.3: technically accessible todayTHE AMOUNT OF ENERGY THAT CAN BE ACCESSED WITH CURRENT TECHNOLOGIES
SUPPLIES A TOTAL OF 5.9 TIMES THE GLOBAL DEMAND FOR ENERGY
ENERGYRESOURCES OF THE WORLD
POTENTIAL OF RENEWABLEENERGY SOURCES ALL RENEWABLEENERGY SOURCES PROVIDE 3078TIMES THE CURRENT GLOBALENERGY NEEDS
SOLAR ENERGY2850 TIMES
BIOMASS20 TIMES
GEOTHERMAL ENERGY 5 TIMES
WAVE-TIDALENERGY 2 TIMES
HYDROPOWER1 TIMES
WIND ENERGY200 TIMES
source DR. JOACHIM NITSCH
source WBGU
Sun 3.8 times
Geothermal heat 1 time
Wind 0.5 times
Biomass 0.4 times
Hydrodynamic power 0.15 times
Ocean power 0.05 times
references38 WBGU (GERMAN ADVISORY COUNCIL ON GLOBAL CHANGE)’

123
renewable energy potential by region and technology
Based on the report ‘Renewable Energy Potentials’ from REN 21, aglobal policy network39, we can provide a more detailed overview ofrenewable energy prospects by world region and technology. Thetable below focuses on large economies, which consume 80 % ofthe world’s primary energy and produce a similar share of theworld’s greenhouse gas emissions.
Solar photovoltaic (PV) technology can be harnessed almosteverywhere, and its technical potential is estimated at over 1,500EJ/year, closely followed by concentrating solar thermal power(CSP). These two cannot simply be added together, however,because they would require much of the same land resources. Theonshore wind potential is equally vast, with almost 400 EJ/yearavailable beyond the order of magnitude of future electricityconsumption. The estimate for offshore wind potential (22 EJ/year)is cautious, as only wind intensive areas on ocean shelf areas, witha relatively shallow water depth, and outside shipping lines and
protected areas, are included. The various ocean or marine energypotentials also reach a similar magnitude, most of it from oceanwaves. Cautious estimates reach a figure of around 50 EJ/year. Theestimates for hydro and geothermal resources are well established,each having a technical potential of around 50 EJ/year. Thosefigures should be seen in the context of a current global energydemand of around 500 EJ.
In terms of heating and cooling, apart from using biomass, there isthe option of using direct geothermal energy. The potential isextremely large and could cover 20 times the current world energydemand for heat. The potential for solar heating, including passivesolar building design, is virtually limitless. However, heat is costly totransport and one should only consider geothermal heat and solarwater heating potentials which are sufficiently close to the point ofconsumption. Passive solar technology, which contributesenormously to the provision of heating services, is not considered asa (renewable energy) supply source in this analysis but as anefficiency factor to be taken into account in the demand forecasts.
8
energ
y resou
rces & secu
rity of su
pp
ly|
RE
NE
WA
BL
E E
NE
RG
Y
source REN21
table 8.4: technical renewable energy potential by regionEXCL. BIO ENERGY
OECD North America
Latin America
OECD Europe
Non OCED Europe & Transition Economies
Africa & Middle East
East & South Asia
Oceania
World
SOLARCSP
21
59
1
25
679
22
187
992
SOLAR PV
72
131
13
120
863
254
239
1,693
HYDROPOWER
4
13
2
5
9
14
1
47
WIND ON-
SHORE
156
40
16
67
33
10
57
379
WINDOFF-
SHORE
2
5
5
4
1
3
3
22
OCEANPOWER
68
32
20
27
19
103
51
321
GEO-THERMAL ELECTRIC
ELECTRICITY [EJ/YEAR]
5
11
2
6
5
12
4
45
GEO-THERMAL
DIRECTUSES
626
836
203
667
1,217
1,080
328
4,955
SOLAR WATER
HEATING
HEATING [EJ/YEAR]
23
12
23
6
12
45
2
123
TOTAL
976
1,139
284
926
2,838
1,543
872
8,578
references39 ‘RENEWABLE ENERGY POTENTIALS: OPPORTUNITIES FOR THE RAPID DEPLOYMENTOF RENEWABLE ENERGY IN LARGE ENERGY ECONOMIES’, REN 21, 2007
© L
AN
GR
OC
K/Z
EN
IT/G
P
© L
AN
GR
OC
K/Z
EN
IT/G
P
image SOLON AG PHOTOVOLTAICS FACILITY IN ARNSTEIN OPERATING 1,500HORIZONTAL AND VERTICAL SOLAR “MOVERS”. LARGEST TRACKING SOLAR FACILITY IN THE WORLD. EACH “MOVER” CAN BE BOUGHT AS A PRIVATE INVESTMENT FROM THE S.A.G. SOLARSTROM AG, BAYERN, GERMANY.
image WIND ENERGY PARK NEAR DAHME. WIND TURBINE IN THE SNOW OPERATED BY VESTAS.

124
GLOBAL ENERGY [R]EVOLUTIONA SUSTAINABLE GLOBAL ENERGY OUTLOOK
the global potential for sustainable biomass
As part of background research for the Energy [R]evolutionScenario, Greenpeace commissioned the German Biomass ResearchCentre, the former Institute for Energy and Environment, toinvestigate the worldwide potential for energy crops in differentscenarios up to 2050. In addition, information has been compiledfrom scientific studies of the worldwide potential and from dataderived from state of the art remote sensing techniques such assatellite images. A summary of the report’s findings is given below;references can be found in the full report.
assessment of biomass potential studies
Various studies have looked historically at the potential for bioenergy and come up with widely differing results. Comparisonbetween them is difficult because they use different definitions ofthe various biomass resource fractions. This problem is particularlysignificant in relation to forest derived biomass. Most research hasfocused almost exclusively on energy crops, as their development isconsidered to be more significant for satisfying the demand for bioenergy. The result is that the potential for using forest residues(wood left over after harvesting) is often underestimated.
Data from 18 studies has been examined, with a concentration onthose studies which report the potential for biomass residues.Among these there were ten comprehensive assessments with moreor less detailed documentation of the methodology. The majorityfocus on the long-term potential for 2050 and 2100. Littleinformation is available for 2020 and 2030. Most of the studieswere published within the last ten years. Figure 8.2 shows thevariations in potential by biomass type from the different studies.
Looking at the contribution of individual resources to the totalbiomass potential, the majority of studies agree that the mostpromising resource is energy crops from dedicated plantations. Onlysix give a regional breakdown, however, and only a few quantify alltypes of residues separately. Quantifying the potential of minorfractions, such as animal residues and organic wastes, is difficult asthe data is relatively poor.
8
energ
y resou
rces & secu
rity of su
pp
ly|
BIO
MA
SS
figure 8.2: ranges of potentials for different resource categories
energy crops
residues
energy crops
annual forest growth
animal residues
forest residues
crop residues
energy crops
animal residues
forest residues
crop residues
energy crops
residues
energy crops
annual forest growth
no y
ear
2020
-30
2050
2100
0 200 400 600 800 1,000 1,200 1,400
figure 8.3: bio energy potential analysis from different authors(‘EFFICIENCY’ = REDUCTION COMPARED TO THE REFERENCE SCENARIO)
1,400
1,200
1,000
800
600
400
200
EJ/yr0Hall et al,
1993Kaltschmitt
and Hartmann,2001
2020-30No year 2050
Dessus et al1993
Bauen et al,2004
Smeets et al,2007a (low,own calc.)
Smeets et al,2007a (high,
own calc.)
Fischer &Schrattenhozer,2001(low, own
calc.)
Fischer &Schrattenhozer,
2001(high,own calc.)
• OECD NORTH AMERICA
• OECD EUROPE
• OECD PACIFIC
• CIS AND NON OECD EUROPE
• CARIBBEAN AND LATIN AMERICA
• ASIA
• AFRICA
source GERMAN BIOMASS RESEARCH CENTRE (DBFZ)
source GERMAN BIOMASS RESEARCH CENTRE (DBFZ)

125
potential of energy crops
Apart from the utilisation of biomass from residues, the cultivationof energy crops in agricultural production systems is of greatestsignificance. The technical potential for growing energy crops hasbeen calculated on the assumption that demand for food takespriority. As a first step the demand for arable and grassland forfood production has been calculated for each of 133 countries indifferent scenarios. These scenarios are:
• Business as usual (BAU) scenario: Present agricultural activitycontinues for the foreseeable future
• Basic scenario: No forest clearing; reduced use of fallow areasfor agriculture
• Sub-scenario 1: Basic scenario plus expanded ecologicalprotection areas and reduced crop yields
• Sub-scenario 2: Basic scenario plus food consumption reduced in industrialised countries
• Sub-scenario 3: Combination of sub-scenarios 1 and 2
In a next step the surpluses of agricultural areas were classifiedeither as arable land or grassland. On grassland, hay and grasssilage are produced, on arable land fodder silage and ShortRotation Coppice (such as fast-growing willow or poplar) arecultivated. Silage of green fodder and grass are assumed to be usedfor biogas production, wood from SRC and hay from grasslands forthe production of heat, electricity and synthetic fuels. Countryspecific yield variations were taken into consideration.
The result is that the global biomass potential from energy crops in2050 falls within a range from 6 EJ in Sub-scenario 1 up to 97 EJin the BAU scenario.
The best example of a country which would see a very different futureunder these scenarios in 2050 is Brazil. Under the BAU scenario largeagricultural areas would be released by deforestation, whereas in theBasic and Sub 1 scenarios this would be forbidden, and no agriculturalareas would be available for energy crops. By contrast a high potentialwould be available under Sub-scenario 2 as a consequence of reducedmeat consumption. Because of their high populations and relativelysmall agricultural areas, no surplus land is available for energy cropproduction in Central America, Asia and Africa. The EU, NorthAmerica and Australia, however, have relatively stable potentials.
The results of this exercise show that the availability of biomassresources is not only driven by the effect on global food supply but theconservation of natural forests and other biospheres. So the assessmentof future biomass potential is only the starting point of a discussionabout the integration of bioenergy into a renewable energy system.
The total global biomass potential (energy crops and residues)therefore ranges in 2020 from 66 EJ (Sub-scenario 1) up to 110EJ (Sub-scenario 2) and in 2050 from 94 EJ (Sub-scenario 1) to184 EJ (BAU scenario). These numbers are conservative andinclude a level of uncertainty, especially for 2050. The reasons forthis uncertainty are the potential effects of climate change, possiblechanges in the worldwide political and economic situation, a higheryield as a result of changed agricultural techniques and/or fasterdevelopment in plant breeding.
8
energ
y resou
rces & secu
rity of su
pp
ly|
BIO
MA
SS
2010 2015 2020 2050
figure 8.4: world wide energy crop potentials in different scenarios
•BIOGAS
• SRC
• HAY
100,000
90,000
80,000
70,000
60,000
50,000
40,000
30,000
20,000
10,000
PJ 0
BA
U s
cena
rio
Bas
ic s
cena
rio
Sub
sce
nari
o 1
Sub
sce
nari
o 2
Sub
sce
nari
o 3
BA
U s
cena
rio
Bas
ic s
cena
rio
Sub
sce
nari
o 1
Sub
sce
nari
o 2
Sub
sce
nari
o 3
BA
U s
cena
rio
Bas
ic s
cena
rio
Sub
sce
nari
o 1
Sub
sce
nari
o 2
Sub
sce
nari
o 3
BA
U s
cena
rio
Bas
ic s
cena
rio
Sub
sce
nari
o 1
Sub
sce
nari
o 2
Sub
sce
nari
o 3
source GERMAN BIOMASS RESEARCH CENTRE (DBFZ)
© G
P/R
OD
RIG
O B
AL
ÉIA
image THE BIOENERGY VILLAGE OF JUEHNDE WHICH WAS THE FIRST COMMUNITY INGERMANY TO PRODUCE ALL ITS ENERGY NEEDED FOR HEATING AND ELECTRICITY,WITH CO2 NEUTRAL BIOMASS.
image A NEWLY DEFORESTED AREA WHICH HAS BEEN CLEARED FOR AGRICULTURALEXPANSION IN THE AMAZON, BRAZIL.
© L
AN
GR
OC
K/Z
EN
IT/G
P

126
GLOBAL ENERGY [R]EVOLUTIONA SUSTAINABLE GLOBAL ENERGY OUTLOOK
8
energ
y resou
rces & secu
rity of su
pp
ly|
SO
LA
R
RENEWABLE RESOURCE
LEGEND
REF
E[R]
0 1000 KM
NEEDED SOLAR AREA TOSUPPORT ENTIRE REGION
47,627 KM2
NEEDED SOLAR AREA TOSUPPORT ENTIRE REGION
10,980 KM2
2005
2010
2020
2030
2040
2050
10,000
9,000
8,000
6,000
5,000
4,000
3,000
2,000
1,000
800
600
400
200
0
TW
h/a
YEARS 2005 - 2050
PRODUCTIONcomparison between the REF and E[R]scenarios 2005 - 2050[electricity]
TWh/a
SOURCE GPI/EREC
0.02%0.02%
0.08%
0.16%
2.54%
0.33%0.49%
8.66%
0.57%
17.23%
0.61%
25.88%
2005
2010
2020
2030
2040
2050
0.70
0.65
0.60
0.55
0.50
0.45
0.40
0.35
0.30
0.25
0.20
0.15
0.10
0.05
0
US
D C
EN
TS
/kW
h
YEARS 2005 - 2050
COSTcomparison between renewable and nonrenewable energies2005 - 2050
cents/kWh
SOURCE EPIA
pv
concentrating solar power plants (CSP)
coal
gas power plant
SOLAR
2000-2200
1800-2000
1600-1800
2600-2800
2400-2600
2200-2400
1400-1600
1200-1400
1000-1200
800-1000
600-800
400-600
200-400
0-200
RADIATION IN kW/hPER SQUARE METERSOURCE DLR
% PJ
OECD NORTH AMERICA
2005
2050
0.05M
0.65M
58H
1,075
2005
2050
37
517
% PJ
17.03M 13,230
6,364
kWh kWh
REF E[R]
% PJ
LATIN AMERICA
2005
2050
0.01
0.10
2
50
2005
2050
1
22
% PJ
9.39L 3,050L
1,340
kWh kWh
REF E[R]
E[R] pv/concentrating solar power p
REF pv/concentrating solar power
% total solar share
map 8.5: solar reference scenario and the energy [r]evolution scenarioWORLDWIDE SCENARIO
REFERENCE SCENARIO
ENERGY [R]EVOLUTION SCENARIO
PRODUCTION PER REGION % OF GLOBAL SHARE | PETA JOULE [PJ]
PRODUCTION PER PERSON KILOWATT HOUR [kWh]
H HIGHEST | M MIDDLE | L LOWEST

127
8
energ
y resou
rces & secu
rity of su
pp
ly|
SO
LA
R
NEEDED SOLAR AREA TOSUPPORT ENTIRE REGION
24,280 KM2
NEEDED SOLAR AREA TOSUPPORT ENTIRE REGION
44,929 KM2
NEEDED SOLAR AREA TOSUPPORT ENTIRE REGION
18,097 KM2
NEEDED SOLAR AREA TOSUPPORT ENTIRE REGION
11,526 KM2
NEEDED SOLAR AREA TOSUPPORT ENTIRE REGION
12,404 KM2
NEEDED SOLAR AREA TOSUPPORT ENTIRE REGION
49,328 KM2
NEEDED SOLAR AREA TOSUPPORT ENTIRE REGION
28,260 KM2
SOLAR AREA NEEDED TO SUPPORT E[R] 2050 SCENARIO
275,189 KM2
NEEDED SOLAR AREA TOSUPPORT ENTIRE REGION
27,756 KM2
2005
2010
2020
2030
2040
2050
275,000
250,000
225,000
200,000
175,000
150,000
125,000
100,000
75,000
50,000
25,000
0
PJ
YEARS 2005 - 2050
PRODUCTIONcomparison between the REF and E[R]scenarios 2005 - 2050[primary energy]
PJ
SOURCE GPI/EREC
13%13%
14%
13%
21%
13%13%
31%
13%
43%
13%
56%
E[R] solar
E[R] renewables
REF solar
REF renewables
% total solar share
2005
2010
2020
2030
2040
2050
44,000
40,000
36,000
32,000
28,000
24,000
20,000
16,000
12,000
8,000
4,000
0
PJ
YEARS 2005 - 2050
PRODUCTIONcomparison between the REF and E[R]scenarios 2005 - 2050[heat supply]
PJ
SOURCE GPI/EREC
0.12%0.12%
0.64%
0.23%
4.22%
0.66%1.07%
10.61%
1.47%
18.03%
1.77%
25.89%
2005
2010
2020
2030
2040
2050
3,750
3,500
3,250
3,000
2,750
2,500
2,250
2,000
1,750
1,500
1,250
1,000
750
500
250
0
GW
YEARS 2005 - 2050
CAPACITYcomparison between the REF and E[R]scenarios 2005 - 2050[electricity]
GW
SOURCE GPI/EREC
REF
E[R]
% PJ
AFRICA
2005
2050
0.01
0.21
2
110
2005
2050
1
15L
% PJ
17.59 6,744
938
kWh kWh
REF E[R]
% PJ
INDIA
2005
2050
0.00L
0.15
0L
137
2005
2050
0
23
% PJ
14.79 7,710M
1,292
kWh kWh
REF E[R]
% PJ
ASIA
2005
2050
0.00L
0.20
0L
138
2005
2050
0L
25
% PJ
11.47 5,027
929L
kWh kWh
REF E[R]
% PJ
OECD PACIFIC
2005
2050
0.07
1.09
28M
512M
2005
2050
38
798H
% PJ
12.83 3,202
4,994
kWh kWh
REF E[R]
% PJ
GLOBAL
2005
2050
0.04
0.55
176
4,775
2005
2050
8
145
% PJ
15.98 76,441
2,316
kWh kWh
REF E[R]
% PJ
TRANSITION ECONOMIES
2005
2050
0.00L
0.03L
2
18L
2005
2050
1
17
% PJ
9.63 3,446
3,257
kWh kWh
REF E[R]
% PJ
CHINA
2005
2050
0.00L
0.71
0L
1,307H
2005
2050
0
256M
% PJ
13.82 13,702H
2,684
kWh kWh
REF E[R]
% PJ
MIDDLE EAST
2005
2050
0.16H
0.27
33
149
2005
2050
49H
120
% PJ
45H 12,480
9,996H
kWh kWh
REF E[R]
% PJ
OECD EUROPE
2005
2050
0.06M
1.42H
50
1,279
2005
2050
26M
631
% PJ
16 7,850
3,872M
kWh kWh
REF E[R]
plants (CSP)
plants (CSP)
E[R] solar collector plants (CSP)
REF solar collector plants (CSP)
% total solar share
DESIGN WWW.ONEHEMISPHERE.SE CONCEPT SVEN TESKE/GREENPEACE INTERNATIONAL.
0.04%0.04%
0.20%0.08%
1.66%
0.23% 0.36%
5.01%0.47%
9.96%
0.55%
15.98%

128
GLOBAL ENERGY [R]EVOLUTIONA SUSTAINABLE GLOBAL ENERGY OUTLOOK
8
energ
y resou
rces & secu
rity of su
pp
ly|
WIN
D
map 8.6: wind reference scenario and the energy [r]evolution scenarioWORLDWIDE SCENARIO
RENEWABLE RESOURCE
LEGEND
REF
E[R]
0 1000 KM
WIND
NEEDED WIND AREA TOSUPPORT ENTIRE REGION
100,899 KM2
NEEDED WIND AREA TOSUPPORT ENTIRE REGION
54,753 KM2
% PJ
OECD NORTH AMERICA
2005
2050
0.06M
0.91
70
1,494
2005
2050
44
719
% PJ
7.11 5,522H
2,656
kWh kWh
REF E[R]
% PJ
LATIN AMERICA
2005
2050
0.01
0.28
1
147
2005
2050
1
64
% PJ
7.98 2,592
1,138
kWh kWh
REF E[R]
REFERENCE SCENARIO
ENERGY [R]EVOLUTION SCENARIO
>11 10-11 9-10
8-9 7-8 6-7
5-6 4-5 3-4
1-2 0-1 AVERAGE WIND SPEED INMETRES PER SECONDSOURCE DLR
PRODUCTION PER REGION % OF GLOBAL SHARE | PETA JOULE [PJ]
PRODUCTION PER PERSON KILOWATT HOUR [kWh]
H HIGHEST | M MIDDLE | L LOWEST
2005
2010
2020
2030
2040
2050
0.12
0.11
0.10
0.09
0.08
0.07
0.06
0.05
0.04
0.03
0.02
0.01
0 US
D C
EN
TS
/kW
h
YEARS 2005 - 2050
COSTcomparison between renewable and nonrenewable energies2005 - 2050
cents/kWh
SOURCE GWEC
wind
coal
gas power plant
2005
2010
2020
7,500
7,000
6,500
6,000
5,500
5,000
4,500
4,000
3,500
3,000
2,500
2,000
1,500
1,000
500
0
TW
h/a
0.57%0.57%
8.76
3.0
1.68%
1.26%

129
8
energ
y resou
rces & secu
rity of su
pp
ly|
WIN
D
NEEDED WIND AREA TOSUPPORT ENTIRE REGION
10,114 KM2
NEEDED WIND AREA TOSUPPORT ENTIRE REGION
17,490 KM2
NEEDED WIND AREA TOSUPPORT ENTIRE REGION
40,304 KM2
NEEDED WIND AREA TOSUPPORT ENTIRE REGION
50,217 KM2
NEEDED WIND AREA TOSUPPORT ENTIRE REGION
48,966 KM2
NEEDED WIND AREA TOSUPPORT ENTIRE REGION
114,829 KM2
NEEDED WIND AREA TOSUPPORT ENTIRE REGION
66,667 KM2
WIND AREA NEEDED TO SUPPORT E[R] 2050 SCENARIO
546,688 KM2
NEEDED WIND AREA TOSUPPORT ENTIRE REGION
42,449 KM2
% PJ
AFRICA
2005
2050
0.01
0.21
3
111
2005
2050
1
15L
% PJ
1.25L 479L
67L
kWh kWh
REF E[R]
% PJ
INDIA
2005
2050
0.10
0.42
22M
373
2005
2050
5
63
% PJ
3.59 1,872
314
kWh kWh
REF E[R]
% PJ
ASIA
2005
2050
0.00L
0.48
0L
327
2005
2050
0L
60
% PJ
4.35 1,908
352
kWh kWh
REF E[R]
% PJ
OECD PACIFIC
2005
2050
0.03
0.64M
12
299
2005
2050
17M
466
% PJ
11.7H 2,920M
4,554H
kWh kWh
REF E[R]
% PJ
GLOBAL
2005
2050
0.08
0.72
372
6,251
2005
2050
16
189
% PJ
5.82 27,857
844
kWh kWh
REF E[R]
% PJ
TRANSITION ECONOMIES
2005
2050
0.00L
0.36
1
228
2005
2050
0
215M
% PJ
7.15 2,556
2,416
kWh kWh
REF E[R]
% PJ
CHINA
2005
2050
0.01
0.48
8
882M
2005
2050
2
173
% PJ
5.48M 5,436
1,064
kWh kWh
REF E[R]
% PJ
MIDDLE EAST
2005
2050
0.00L
0.13
0L
69L
2005
2050
0L
56
% PJ
3.0 828
663
kWh kWh
REF E[R]
% PJ
OECD EUROPE
2005
2050
0.31H
2.57H
255H
2,322H
2005
2050
132H
1,145H
% PJ
7.65 3,744
1,846M
kWh kWh
REF E[R]
2005
2010
2020
2030
2040
2050
275,000
250,000
225,000
200,000
175,000
150,000
125,000
100,000
75,000
50,000
25,000
0
PJ
YEARS 2005 - 2050
PRODUCTIONcomparison between the REF and E[R]scenarios 2005 - 2050[primary energy]
PJ
SOURCE GPI/GWEC
E[R] wind
E[R] renewables
REF wind
REF renewables
2030
2040
2050
YEARS 2005 - 2050
PRODUCTIONcomparison between the REF and E[R]scenarios 2005 - 2050[electricity]
TWh
SOURCE GWEC
6%
8 %
3.56%
15.10%
3.62%
19.05%
3.43%
20.85% E[R] wind
REF wind
2005
2010
2020
2030
2040
2050
3,000
2,800
2,600
2,400
2,200
2,000
1,800
1,600
1,400
1,200
1,000
800
600
400
200
0
GW
YEARS 2005 - 2050
CAPACITYcomparison between the REF and E[R]scenarios 2005 - 2050[electricity]
GW
SOURCE GPI/GWEC
DESIGN WWW.ONEHEMISPHERE.SE CONCEPT SVEN TESKE/GREENPEACE INTERNATIONAL.
E[R] wind
REF wind
% REF total wind share
0.4%0.8%
0.25%0.19%
1.50%
0.51% 0.63%
3.01%
0.70%
4.50%
0.72%
5.82%
13%13%
14%
13%
21%
13%13%
31%
13%
43%
13%
56%

130
GLOBAL ENERGY [R]EVOLUTIONA SUSTAINABLE GLOBAL ENERGY OUTLOOK
8
energ
y resou
rces & secu
rity of su
pp
ly|
GE
OT
HE
RM
AL
map 8.7: geothermal reference scenario and the energy [r]evolution scenarioWORLDWIDE SCENARIO
RENEWABLE RESOURCE
LEGEND
REF
E[R]
0 1000 KM
GEOTHERMAL100 90
80 70 60
50 40 30
20 10 SURFACE HEAT FLOW IN mW/m2
SOURCE ARTEMIEVA AND MOONEY, 2001
WHITE = NO DATA
2005
2010
2020
2030
2040
2050
0.26
0.24
0.22
0.20
0.18
0.16
0.14
0.12
0.10
0.08
0.06
0.04
0.02
0
US
D C
EN
TS
/kW
h
YEARS 2005 - 2050
COSTcomparison between renewable and nonrenewable energies2005 - 2050
cents/kWh
SOURCE EREC
geothermal, CHP
coal
gas power plant
2005
2010
2020
2030
2040
2050
1,800
1,700
1,600
1.500
1,400
1,300
1,200
1,100
1,000
900
800
700
600
500
400
300
200
100
0
TW
h/a
YEARS 2005 - 2050
PRODUCTIONcomparison between the REF and E[R]scenarios 2005 - 2050[electricity]
TWh/a
SOURCE GPI/EREC
0.32%0.32%
0.34%
0.42%
1.15%
0.43%0.47%
2.33%
0.49%
3.80%
0.49%
4.59%
% PJ
OECD NORTH AMERICA
2005
2050
0.54
1.03M
625H
1,695H
2005
2050
398H
815
% PJ
16.15H 12,547H
6,036H
kWh kWh
REF E[R]
% PJ
LATIN AMERICA
2005
2050
0.42M
1.29
89
675
2005
2050
55M
297
% PJ
9.96M 3,237
1,422
kWh kWh
REF E[R]
E[R] geothermal
REF geothermal
% total geothermal sha
REFERENCE SCENARIO
ENERGY [R]EVOLUTION SCENARIO
PRODUCTION PER REGION % OF GLOBAL SHARE | PETA JOULE [PJ]
PRODUCTION PER PERSON KILOWATT HOUR [kWh]
H HIGHEST | M MIDDLE | L LOWEST

131
8
energ
y resou
rces & secu
rity of su
pp
ly|
GE
OT
HE
RM
AL
2005
2010
2020
2030
2040
2050
280
260
240
220
200
180
160
140
120
100
80
60
40
20
0
GW
YEARS 2005 - 2050
CAPACITYcomparison between the REF and E[R]scenarios 2005 - 2050[electricity]
GW
SOURCE GPI/EREC
E[R]
REF
2005
2010
2020
2030
2040
2050
26,000
24,000
22,000
20,000
18,000
16,000
14,000
12,000
10,000
8,000
6,000
4,000
2,000
0
PJ
YEARS 2005 - 2050
PRODUCTIONcomparison between the REF and E[R]scenarios 2005 - 2050[heat supply]
PJ
SOURCE GPI/EREC
E[R] geothermal
REF geothermal
% total geothermal share
0.69%
0.17%
2.84%
0.60%1.00%
5.88%
1.31%
10.36%
1.71%
15.41%
0.13%0.13%
2005
2010
2020
2030
2040
2050
275,000
250,000
225,000
200,000
175,000
150,000
125,000
100,000
75,000
50,000
25,000
0
PJ
YEARS 2005 - 2050
PRODUCTIONcomparison between the REF and E[R]scenarios 2005 - 2050[primary energy]
PJ
SOURCE GPI/EREC
0.40%0.40%
0.56%0.37%
1.86%
0.72%
4.04%
0.79%
7.33%
0.87%
10.48%
E[R] geothermal
E[R] renewables
REF geothermal
REF renewables
% total geothermal share
% PJ
AFRICA
2005
2050
0.13
0.62
32
333
2005
2050
10
46
% PJ
2.43L 930L
129L
kWh kWh
REF E[R]
% PJ
INDIA
2005
2050
0.00L
0.15L
0L
138L
2005
2050
0L
23L
% PJ
10.69 5,870M
933
kWh kWh
REF E[R]
% PJ
ASIA
2005
2050
1.91H
2.32H
594
1,567
2005
2050
169
290
% PJ
12.29 5,390
996
kWh kWh
REF E[R]
% PJ
OECD PACIFIC
2005
2050
0.54
1.58
200M
743M
2005
2050
277
1,159H
% PJ
7.72 1,927
3,005
kWh kWh
REF E[R]
% PJ
GLOBAL
2005
2050
0.40
0.87
1,921
7,540
2005
2050
82
228
% PJ
10.48 50,131
1,519
kWh kWh
REF E[R]
% PJ
TRANSITION ECONOMIES
2005
2050
0.05
1.35
21
863
2005
2050
17
816
% PJ
15.8 5,649
5,341
kWh kWh
REF E[R]
% PJ
CHINA
2005
2050
0.00L
0.19
0L
345
2005
2050
0L
68
% PJ
6.71 6,652
1,303
kWh kWh
REF E[R]
% PJ
MIDDLE EAST
2005
2050
0.00L
0.26
0L
145
2005
2050
0L
116
% PJ
10.72 2,958
2,369M
kWh kWh
REF E[R]
% PJ
OECD EUROPE
2005
2050
0.44
1.15
360
1,036
2005
2050
186
511M
% PJ
10.77 5,271M
2,600
kWh kWh
REF E[R]
re
DESIGN WWW.ONEHEMISPHERE.SE CONCEPT SVEN TESKE/GREENPEACE INTERNATIONAL.
0.57%
13%13%
14%
13%
21%
13%13%
31%
13%
43%
13%
56%

132
9energy technologies
GLOBAL FOSSIL FUEL TECHNOLOGIESNUCLEAR TECHNOLOGIESRENEWABLE ENERGY TECHNOLOGIES
9
ima
geB
IOG
AS
FA
CIL
ITY
“S
CH
RA
DE
N B
IOG
AS
” IN
GR
OE
DE
N N
EA
R D
RE
SD
EN
, GE
RM
AN
Y.
© L
AN
GR
OC
K/Z
EN
IT/G
P
“the technology is here, all we need is political will.”CHRISSUPORTER, AUSTRALIA

133
This chapter describes the range of technologies available now andin the future to satisfy the world’s energy demand. The Energy[R]evolution Scenario is focused on the potential for energy savingsand renewable sources, primarily in the electricity and heatgenerating sectors. Although fuel use in transport is accounted forin the scenarios of future energy supply, no detailed description isgiven here of fuel sources, such as bio fuels for vehicles, which offeran alternative to the currently predominant oil.
fossil fuel technologies
The most commonly used fossil fuels for power generation aroundthe world are coal and gas. Oil is still used where other fuels arenot readily available, for example islands or remote sites, or wherethere is an indigenous resource. Together, coal and gas currentlyaccount for over half of global electricity supply.
coal combustion technologies In a conventional coal-fired powerstation, pulverised or powdered coal is blown into a combustionchamber where it is burnt at high temperature. The hot gases andheat produced converts water flowing through pipes lining the boilerinto steam. This drives a steam turbine and generates electricity.Over 90% of global coal-fired capacity uses this system. Coalpower stations can vary in capacity from a few hundred megawattsup to several thousand.
A number of technologies have been introduced to improve theenvironmental performance of conventional coal combustion. Theseinclude coal cleaning (to reduce the ash content) and various ‘bolt-on’ or ‘end-of-pipe’ technologies to reduce emissions of particulates,sulphur dioxide and nitrogen oxide, the main pollutants resultingfrom coal firing apart from carbon dioxide. Flue gasdesulphurisation (FGD), for example, most commonly involves‘scrubbing’ the flue gases using an alkaline sorbent slurry, which ispredominantly lime or limestone based.
More fundamental changes have been made to the way coal isburned to both improve its efficiency and further reduce emissionsof pollutants. These include:
• Integrated Gasification Combined Cycle: Coal is not burntdirectly but reacted with oxygen and steam to form a syntheticgas composed mainly of hydrogen and carbon monoxide. This iscleaned and then burned in a gas turbine to generate electricityand produce steam to drive a steam turbine. IGCC improves theefficiency of coal combustion from 38-40% up to 50%.
• Supercritical and Ultrasupercritical: These power plantsoperate at higher temperatures than conventional combustion,again increasing efficiency towards 50%.
• Fluidised Bed Combustion: Coal is burned in a reactorcomprised of a bed through which gas is fed to keep the fuel in a turbulent state. This improves combustion, heat transfer and therecovery of waste products. By elevating pressures within a bed, a high-pressure gas stream can be used to drive a gas turbine,generating electricity. Emissions of both sulphur dioxide andnitrogen oxide can be reduced substantially.
• Pressurised Pulverised Coal Combustion: Mainly beingdeveloped in Germany, this is based on the combustion of a finelyground cloud of coal particles creating high pressure, hightemperature steam for power generation. The hot flue gases are usedto generate electricity in a similar way to the combined cycle system.
Other potential future technologies involve the increased use of coalgasification. Underground Coal Gasification, for example, involvesconverting deep underground unworked coal into a combustible gaswhich can be used for industrial heating, power generation or themanufacture of hydrogen, synthetic natural gas or other chemicals.The gas can be processed to remove CO2 before it is passed on toend users. Demonstration projects are underway in Australia,Europe, China and Japan.
gas combustion technologies Natural gas can be used forelectricity generation through the use of either gas turbines orsteam turbines. For the equivalent amount of heat, gas producesabout 45% less carbon dioxide during its combustion than coal.
Gas turbine plants use the heat from gases to directly operate theturbine. Natural gas fuelled turbines can start rapidly, and aretherefore often used to supply energy during periods of peakdemand, although at higher cost than baseload plants.
Particularly high efficiencies can be achieved through combininggas turbines with a steam turbine in combined cycle mode. In acombined cycle gas turbine (CCGT) plant, a gas turbinegenerator produces electricity and the exhaust gases from theturbine are then used to make steam to generate additionalelectricity. The efficiency of modern CCGT power stations can bemore than 50%. Most new gas power plants built since the 1990shave been of this type.
At least until the recent increase in global gas prices, CCGT powerstations have been the cheapest option for electricity generation inmany countries. Capital costs have been substantially lower thanfor coal and nuclear plants and construction time shorter.
9
energ
y techn
olo
gies
|F
OS
SIL
FU
EL
© A
RN
OL
D/V
ISU
M/G
P
image BROWN COAL SURFACE MININGIN HAMBACH, GERMANY. GIANT COALEXCAVATOR AND SPOIL PILE.

134
GLOBAL ENERGY [R]EVOLUTIONA SUSTAINABLE GLOBAL ENERGY OUTLOOK
carbon reduction technologies Whenever coal or gas is burned,carbon dioxide (CO2) is produced. Depending on the type of powerplant, a large quantity of the gas will dissipate into the atmosphereand contribute to climate change. A hard coal power plantdischarges roughly 720 grammes of carbon dioxide per kilowatthour, a modern gas-fired plant about 370g CO2/kWh. To ensure thatno CO2 emerges from the power plant chimney, the gas must first beremoved, and then stored somewhere. Both carbon capture andstorage (CCS) have limitations. Even after employing proposedcapture technologies, a residual amount of carbon dioxide - between60 and 150g CO2/kWh - will continue to be emitted.
carbon dioxide storage CO2 captured at the point of incinerationhas to be stored somewhere. Current thinking is that it can betrapped in the oceans or under the Earth’s surface at a depth ofover 3,000 feet. As with nuclear waste, however, the question iswhether this will just displace the problem elsewhere.
Ocean storage could result in greatly accelerated acidification oflarge sea areas and would be detrimental to a great manyorganisms, if not entire ecosystems, in the vicinity of injection sites.CO2 disposed of in this way is likely to get back into the atmospherein a relatively short time. The oceans are both productive resourcesand a common natural endowment for this and future generations.Given the diversity of other options available for dealing with CO2
emissions, direct disposal to the ocean, sea floor, lakes and otheropen reservoir structures must be ruled out.
Among the options available for underground storage, empty oil andgas fields are riddled with holes drilled during their exploration andproduction phases. These holes have to be sealed over. Normallyspecial cement is used, but carbon dioxide is relatively reactive withwater and attacks metals or cement, so that even sealed drillingholes present a safety hazard. To many experts the question is not ifbut when leakages will occur.
Because of the lack of experience with CO2 storage, its safety isoften compared to the storage of natural gas. This technology hasbeen tried and tested for decades and is considered by industry to below risk. Greenpeace does not share this assessment. A number ofserious leaks from gas storage installations have occurred aroundthe world, sometimes requiring evacuation of nearby residents.
Sudden leakage of CO2 can be fatal. Carbon dioxide is not itselfpoisonous, and is contained (approx. 0.04 per cent) in the air webreathe. But as concentrations increase it displaces the vital oxygenin the air. Air with concentrations of 7 to 8% CO2 by volume causesdeath by suffocation after 30 to 60 minutes.
There are also health hazards when large amounts of CO2 areexplosively released. Although the gas normally disperses quicklyafter leaking, it can accumulate in depressions in the landscape orclosed buildings, since carbon dioxide is heavier than air. It isequally dangerous when it escapes more slowly and without beingnoticed in residential areas, for example in cellars below houses.
The dangers from such leaks are known from natural volcanic CO2
degassing. Gas escaping at the Lake Nyos crater lake in Cameroon,Africa in 1986 killed over 1,700 people. At least ten people havedied in the Lazio region of Italy in the last 20 years as a result ofCO2 being released.
carbon storage and climate change targets Can carbon storagecontribute to climate change reduction targets? In order to avoiddangerous climate change, we need to reduce CO2 globally by 50%in 2050. Power plants that store CO2 are still being developed,however, and could only become reality in 15 years at the earliest.This means they will not make any substantial contribution towardsprotecting the climate until the year 2020 at the earliest. They arethus irrelevant to the goals of the Kyoto Protocol.
Nor is CO2 storage of any great help in attaining the goal of an80% reduction by 2050 in OECD countries. If it does becomeavailable in 2020, most of the world’s new power plants will havejust finished being modernised. All that could then be done would befor existing power plants to be retrofitted and CO2 captured fromthe waste gas flow. As retrofitting existing power plants is highlyexpensive, a high carbon price would be needed.
Employing CO2 capture will also increase the price of electricity fromfossil fuels. Although the costs of storage depend on many factors,including the technology used for separation, transport and thestorage installation, experts from the UN Intergovernmental Panel onClimate Change calculate the additional costs at between 3.5 and 5.0€cents/kWh of power. Since modern wind turbines in good windlocations are already cost competitive with new build coal-firedpower plants today, the costs will probably be at the top end. Thismeans the technology would more than double the cost of electricity.
The conclusion reached in the Energy [R]evolution Scenario is thatrenewable energy sources are already available, in many casescheaper, and without the negative environmental impacts that areassociated with fossil fuel exploitation, transport and processing. Itis renewable energy together with energy efficiency and energyconservation – and not carbon capture and storage – that has toincrease worldwide so that the primary cause of climate change –the burning of fossil fuels like coal, oil and gas – is stopped.
Greenpeace opposes any CCS efforts which lead to:
• The undermining or threats to undermine existing global andregional regulations governing the disposal of wastes at sea (inthe water column, at or beneath the seabed).
• Continued or increasing finance to the fossil fuel sector at theexpense of renewable energy and energy efficiency.
• The stagnation of renewable energy, energy efficiency and energyconservation improvements.
• The promotion of this possible future technology as the onlymajor solution to climate change, thereby leading to new fossilfuel developments – especially lignite and black coal-fired powerplants, and an increase in emissions in the short to medium term.
9
energ
y techn
olo
gies
|F
OS
SIL
FU
EL

135
nuclear technologies
Generating electricity from nuclear power involves transferring theheat produced by a controlled nuclear fission reaction into aconventional steam turbine generator. The nuclear reaction takesplace inside a core and surrounded by a containment vessel ofvarying design and structure. Heat is removed from the core by acoolant (gas or water) and the reaction controlled by a moderatingelement or “moderator”.
Across the world over the last two decades there has been a generalslowdown in building new nuclear power stations. This has beencaused by a variety of factors: fear of a nuclear accident, followingthe events at Three Mile Island, Chernobyl and Monju, increasedscrutiny of economics and environmental factors, such as wastemanagement and radioactive discharges.
nuclear reactor designs: evolution and safety issues At thebeginning of 2005 there were 441 nuclear power reactors operatingin 31 countries around the world. Although there are dozens ofdifferent reactor designs and sizes, there are three broad categorieseither currently deployed or under development. These are:
Generation I: Prototype commercial reactors developed in the1950s and 1960s as modified or enlarged military reactors,originally either for submarine propulsion or plutonium production.
Generation II: Mainstream reactor designs in commercialoperation worldwide.
Generation III: New generation reactors now being built.
Generation III reactors include the so-called Advanced Reactors,three of which are already in operation in Japan, with more underconstruction or planned. About 20 different designs are reported tobe under development40, most of them ‘evolutionary’ designsdeveloped from Generation II reactor types with somemodifications, but without introducing drastic changes. Some ofthem represent more innovative approaches. According to the WorldNuclear Association, reactors of Generation III are characterisedby the following:
• A standardised design for each type to expedite licensing, reducecapital cost and construction time.
• A simpler and more rugged design, making them easier tooperate and less vulnerable to operational upsets.
• Higher availability and longer operating life, typically 60 years.
• Reduced possibility of core melt accidents.
• Minimal effect on the environment.
• Higher burn-up to reduce fuel use and the amount of waste.
• Burnable absorbers (‘poisons’) to extend fuel life.
To what extent these goals address issues of higher safetystandards, as opposed to improved economics, remains unclear.
Of the new reactor types, the European Pressurised Water Reactor(EPR) has been developed from the most recent Generation IIdesigns to start operation in France and Germany41. Its stated goalsare to improve safety levels - in particular, reduce the probability ofa severe accident by a factor of ten, achieve mitigation of severeaccidents by restricting their consequences to the plant itself, andreduce costs. Compared to its predecessors, however, the EPRdisplays several modifications which constitute a reduction ofsafety margins, including:
• The volume of the reactor building has been reduced bysimplifying the layout of the emergency core cooling system, and by using the results of new calculations which predict lesshydrogen development during an accident.
• The thermal output of the plant has been increased by 15%relative to existing French reactors by increasing core outlettemperature, letting the main coolant pumps run at highercapacity and modifying the steam generators.
• The EPR has fewer redundant pathways in its safety systemsthan a German Generation II reactor.
Several other modifications are hailed as substantial safetyimprovements, including a ‘core catcher’ system to control ameltdown accident. Nonetheless, in spite of the changes beingenvisaged, there is no guarantee that the safety level of the EPRactually represents a significant improvement. In particular,reduction of the expected core melt probability by a factor of ten isnot proven. Furthermore, there are serious doubts as to whether themitigation and control of a core melt accident with the core catcherconcept will actually work.
Finally, Generation IV reactors are currently being developed withthe aim of commercialisation in 20-30 years.
9
energ
y techn
olo
gies
|N
UC
LE
AR
references40 IAEA 2004; WNO 2004A41 HAINZ 2004
© G
P/C
UN
NIN
GH
AM
© J
UR
A/D
RE
AM
STIM
E
image SELLAFIELD NUCLEAR PLANT,CUMBRIA, UK.
image TEMELÍN NUCLEAR POWER PLANTIN THE CZECH REPUBLIC.

136
GLOBAL ENERGY [R]EVOLUTIONA SUSTAINABLE GLOBAL ENERGY OUTLOOK
renewable energy technologies
Renewable energy covers a range of natural sources which areconstantly renewed and therefore, unlike fossil fuels and uranium,will never be exhausted. Most of them derive from the effect of thesun and moon on the Earth’s weather patterns. They also producenone of the harmful emissions and pollution associated with‘conventional’ fuels. Although hydroelectric power has been used onan industrial scale since the middle of the last century, the seriousexploitation of other renewable sources has a more recent history.
solar power (photovoltaics pv) There is more than enough solarradiation available all over the world to satisfy a vastly increaseddemand for solar power systems. The sunlight which reaches theEarth’s surface is enough to provide 2,850 times as much energy aswe can currently use. On a global average, each square metre of landis exposed to enough sunlight to produce 1,700 kWh of power everyyear. The average irradiation in Europe is about 1,000 kWh per squaremetre, however, compared with 1,800 kWh in the Middle East.
Photovoltaic (PV) technology involves the generation of electricityfrom light. The secret to this process is the use of a semiconductormaterial which can be adapted to release electrons, the negativelycharged particles that form the basis of electricity. The mostcommon semiconductor material used in photovoltaic cells is silicon,an element most commonly found in sand. All PV cells have at leasttwo layers of such semiconductors, one positively charged and onenegatively charged. When light shines on the semiconductor, theelectric field across the junction between these two layers causeselectricity to flow. The greater the intensity of the light, the greaterthe flow of electricity. A photovoltaic system does not therefore needbright sunlight in order to operate, and can generate electricity evenon cloudy days. Solar PV is different from a solar thermal collectingsystem (see below) where the sun’s rays are used to generate heat,usually for hot water in a house, swimming pool etc.
The most important parts of a PV system are the cells which formthe basic building blocks, the modules which bring together largenumbers of cells into a unit, and, in some situations, the invertersused to convert the electricity generated into a form suitable foreveryday use. When a PV installation is described as having acapacity of 3 kWp (peak), this refers to the output of the systemunder standard testing conditions, allowing comparison betweendifferent modules. In central Europe a 3 kWp rated solar electricitysystem, with a surface area of approximately 27 square metres,would produce enough power to meet the electricity demand of anenergy conscious household.
types of PV system
• grid connected The most popular type of solar PV system forhomes and businesses in the developed world. Connection to thelocal electricity network allows any excess power produced to besold to the utility. Electricity is then imported from the networkoutside daylight hours. An inverter is used to convert the DCpower produced by the system to AC power for running normalelectrical equipment.
• grid support A system can be connected to the local electricitynetwork as well as a back-up battery. Any excess solar electricityproduced after the battery has been charged is then sold to the network. This system is ideal for use in areas of unreliablepower supply.
• off-grid Completely independent of the grid, the system isconnected to a battery via a charge controller, which stores theelectricity generated and acts as the main power supply. Aninverter can be used to provide AC power, enabling the use ofnormal appliances. Typical off-grid applications are repeaterstations for mobile phones or rural electrification. Ruralelectrification means either small solar home systems coveringbasic electricity needs or solar mini grids, which are larger solarelectricity systems providing electricity for several households.
• hybrid system A solar system can be combined with anothersource of power - a biomass generator, a wind turbine or dieselgenerator - to ensure a consistent supply of electricity. A hybridsystem can be grid connected, stand alone or grid support.
9
energ
y techn
olo
gies
|R
EN
EW
AB
LE
EN
ER
GY
figure 9.1: photovoltaics technology
1. LIGHT (PHOTONS)
2. FRONT CONTACT GRID
3. ANTI-REFLECTION COATING
4. N-TYPE SEMICONDUCTOR
5. BOARDER LAYOUT
6. P-TYPE SEMICONDUCTOR
7. BACKCONTACT
1
2
345
6
7

137
concentrating solar power (CSP) Concentrating solar power(CSP) plants, also called solar thermal power plants, produceelectricity in much the same way as conventional power stations. Thedifference is that they obtain their energy input by concentratingsolar radiation and converting it to high temperature steam or gasto drive a turbine or motor engine. Large mirrors concentratesunlight into a single line or point. The heat created there is used togenerate steam. This hot, highly pressurised steam is used to powerturbines which generate electricity. In sun-drenched regions, CSPplants can guarantee a large proportion of electricity production.
Four main elements are required: a concentrator, a receiver, someform of transfer medium or storage, and power conversion. Manydifferent types of system are possible, including combinations withother renewable and non-renewable technologies, but the threemost promising solar thermal technologies are:
• parabolic trough Trough-shaped mirror reflectors are used toconcentrate sunlight on to thermally efficient receiver tubesplaced in the trough’s focal line. A thermal transfer fluid, such assynthetic thermal oil, is circulated in these tubes. Heated toapproximately 400°C by the concentrated sun’s rays, this oil isthen pumped through a series of heat exchangers to producesuperheated steam. The steam is converted to electrical energy ina conventional steam turbine generator, which can either be partof a conventional steam cycle or integrated into a combinedsteam and gas turbine cycle.
This is the most mature technology, with 354 MWe of plantsconnected to the Southern California grid since the 1980s andmore than 2 million square metres of parabolic trough collectorsinstalled worldwide.
• central receiver or solar tower A circular array of heliostats(large individually tracking mirrors) is used to concentrate sunlighton to a central receiver mounted at the top of a tower. A heat-transfer medium absorbs the highly concentrated radiation reflectedby the heliostats and converts it into thermal energy to be used forthe subsequent generation of superheated steam for turbineoperation. To date, the heat transfer media demonstrated includewater/steam, molten salts, liquid sodium and air. If pressurised gasor air is used at very high temperatures of about 1,000°C or moreas the heat transfer medium, it can even be used to directly replacenatural gas in a gas turbine, thus making use of the excellentefficiency (60%+) of modern gas and steam combined cycles.
After an intermediate scaling up to 30 MW capacity, solar towerdevelopers now feel confident that grid-connected tower powerplants can be built up to a capacity of 200 MWe solar-only units.Use of heat storage will increase their flexibility. Although solartower plants are considered to be further from commercialisationthan parabolic trough systems, they have good longer-termprospects for high conversion efficiencies. Projects are beingdeveloped in Spain, South Africa and Australia.
• parabolic dish A dish-shaped reflector is used to concentratesunlight on to a receiver located at its focal point. Theconcentrated beam radiation is absorbed into the receiver to heata fluid or gas to approximately 750°C. This is then used togenerate electricity in a small piston, Stirling engine or a microturbine, attached to the receiver.
The potential of parabolic dishes lies primarily for decentralisedpower supply and remote, stand-alone power systems. Projectsare currently planned in the United States, Australia and Europe.
9
energ
y techn
olo
gies
|R
EN
EW
AB
LE
EN
ER
GY
PARABOLICTROUGH
REFLECTOR
ABSORBER TUBE
SOLAR FIELD PIPING
PARABOLIC DISH
CENTRAL RECEIVER
HELIOSTATS
REFLECTOR
CENTRAL RECEIVER
RECEIVER/ENGINE
figures 9.2: parabolic trough/central receiver or solar tower/parabolic dish technology©
GP
/SO
LN
ES
S
image SOLAR PROJECT IN PHITSANULOK, THAILAND. SOLAR FACILITY OF THEINTERNATIONAL INSTITUTE AND SCHOOL FOR RENEWABLE ENERGY.
image SOLAR PANELS ON CONISTON STATION, NORTH WEST OF ALICE SPRINGS,NORTHERN TERRITORY.
© C
HR
IST
IAN
KA
ISE
R/G
P

138
GLOBAL ENERGY [R]EVOLUTIONA SUSTAINABLE GLOBAL ENERGY OUTLOOK
solar thermal collectors Solar thermal collecting systems are basedon a centuries-old principle: the sun heats up water contained in a darkvessel. Solar thermal technologies on the market now are efficient andhighly reliable, providing energy for a wide range of applications - fromdomestic hot water and space heating in residential and commercialbuildings to swimming pool heating, solar-assisted cooling, industrialprocess heat and the desalination of drinking water.
solar domestic hot water and space heating Domestic hot waterproduction is the most common application. Depending on theconditions and the system’s configuration, most of a building’s hotwater requirements can be provided by solar energy. Larger systemscan additionally cover a substantial part of the energy needed forspace heating. There are two main types of technology:
• vacuum tubes The absorber inside the vacuum tube absorbsradiation from the sun and heats up the fluid inside. Additionalradiation is picked up from the reflector behind the tubes.Whatever the angle of the sun, the round shape of the vacuumtube allows it to reach the absorber. Even on a cloudy day, whenthe light is coming from many angles at once, the vacuum tubecollector can still be effective.
• flat panel This is basically a box with a glass cover which sits onthe roof like a skylight. Inside is a series of copper tubes withcopper fins attached. The entire structure is coated in a blacksubstance designed to capture the sun’s rays. These rays heat up awater and antifreeze mixture which circulates from the collectordown to the building’s boiler.
solar assisted cooling Solar chillers use thermal energy to producecooling and/or dehumidify the air in a similar way to a refrigeratoror conventional air-conditioning. This application is well-suited tosolar thermal energy, as the demand for cooling is often greatestwhen there is most sunshine. Solar cooling has been successfullydemonstrated and large-scale use can be expected in the future.
wind power Over the last 20 years, wind energy has become theworld’s fastest growing energy source. Today’s wind turbines areproduced by a sophisticated mass production industry employing atechnology that is efficient, cost effective and quick to install.Turbine sizes range from a few kW to over 5,000 kW, with thelargest turbines reaching more than 100m in height. One large windturbine can produce enough electricity for about 5,000 households.State-of-the-art wind farms today can be as small as a few turbinesand as large as several hundred MW.
The global wind resource is enormous, capable of generating moreelectricity than the world’s total power demand, and welldistributed across the five continents. Wind turbines can beoperated not just in the windiest coastal areas but in countrieswhich have no coastlines, including regions such as central EasternEurope, central North and South America, and central Asia. Thewind resource out at sea is even more productive than on land,encouraging the installation of offshore wind parks withfoundations embedded in the ocean floor. In Denmark, a wind parkbuilt in 2002 uses 80 turbines to produce enough electricity for acity with a population of 150,000.
Smaller wind turbines can produce power efficiently in areas thatotherwise have no access to electricity. This power can be useddirectly or stored in batteries. New technologies for using the wind’spower are also being developed for exposed buildings in denselypopulated cities.
wind turbine design Significant consolidation of wind turbinedesign has taken place since the 1980s. The majority of commercialturbines now operate on a horizontal axis with three evenly spacedblades. These are attached to a rotor from which power istransferred through a gearbox to a generator. The gearbox andgenerator are contained within a housing called a nacelle. Someturbine designs avoid a gearbox by using direct drive. The electricityoutput is then channelled down the tower to a transformer andeventually into the local grid network.
Wind turbines can operate from a wind speed of 3-4 metres persecond up to about 25 m/s. Limiting their power at high windspeeds is achieved either by ‘stall’ regulation – reducing the poweroutput – or ‘pitch’ control – changing the angle of the blades sothat they no longer offer any resistance to the wind. Pitch controlhas become the most common method. The blades can also turn ata constant or variable speed, with the latter enabling the turbine tofollow more closely the changing wind speed.
9
energ
y techn
olo
gies
|R
EN
EW
AB
LE
EN
ER
GY
figure 9.3: flat panel solar technology

139
The main design drivers for current wind technology are:
• high productivity at both low and high wind sites
• grid compatibility
• acoustic performance
• aerodynamic performance
• visual impact
• offshore expansion
Although the existing offshore market is only just over 1% of theworld’s land-based installed wind capacity, the latest developmentsin wind technology are primarily driven by this emerging potential.This means that the focus is on the most effective ways to makevery large turbines.
Modern wind technology is available for a range of sites - low and highwind speeds, desert and arctic climates. European wind farms operatewith high availability, are generally well integrated with the environmentand accepted by the public. In spite of repeated predictions of a levellingoff at an optimum mid-range size, and the fact that wind turbinescannot get larger indefinitely, turbine size has increased year on year -from units of 20-60 kW in California in the 1980s up to the latestmulti-MW machines with rotor diameters over 100 m. The average sizeof turbine installed around the world during 2007 was 1,492 kW, whilstthe largest machine in operation is the Enercon E126, with a rotordiameter of 126 metres and a power capacity of 6 MW.
This growth in turbine size has been matched by the expansion ofboth markets and manufacturers. Almost 100,000 wind turbinesnow operate in over 50 countries around the world. The Germanmarket is the largest, but there has also been impressive growth inSpain, Denmark, India, China and the United States.
biomass energy Biomass is a broad term used to describe materialof recent biological origin that can be used as a source of energy.This includes wood, crops, algae and other plants as well asagricultural and forest residues. Biomass can be used for a varietyof end uses: heating, electricity generation or as fuel fortransportation. The term ‘bio energy’ is used for biomass energysystems that produce heat and/or electricity and ‘bio fuels’ forliquid fuels used in transport. Biodiesel manufactured from variouscrops has become increasingly used as vehicle fuel, especially as thecost of oil has risen.
Biological power sources are renewable, easily stored, and, ifsustainably harvested, CO2 neutral. This is because the gas emittedduring their transfer into useful energy is balanced by the carbondioxide absorbed when they were growing plants.
Electricity generating biomass power plants work just like naturalgas or coal power stations, except that the fuel must be processedbefore it can be burned. These power plants are generally not aslarge as coal power stations because their fuel supply needs to growas near as possible to the plant. Heat generation from biomasspower plants can result either from utilising a Combined Heat andPower (CHP) system, piping the heat to nearby homes or industry,or through dedicated heating systems. Small heating systems usingspecially produced pellets made from waste wood, for example, canbe used to heat single family homes instead of natural gas or oil.
9
energ
y techn
olo
gies
|R
EN
EW
AB
LE
EN
ER
GY
figure 9.4: wind turbine technology figure 9.5: biomass technology
1. HEATED MIXER
2. CONTAINMENT FOR FERMENTATION
3. BIOGAS STORAGE
4. COMBUSTION ENGINE
5. GENERATOR
6. WASTE CONTAINMENT
1. ROTOR BLADE
2. BLADE ADJUSTMENT
3. NACELL
4. ROTOR SHAFT
5. WIND MEASUREMENT
6. GENERATOR
7. SYSTEM CONTROL
8. LIFT
1
2
3
4 5 6
1
2
3
4
5
67
8
© P
AU
L L
AN
GR
OC
K/Z
EN
IT/G
P
© P
. PE
TE
RS
EN
/DR
EA
MST
IMEimage THE BIOENERGY VILLAGE OF JUEHNDE, WHICH IS THE FIRST COMMUNITY IN
GERMANY THAT PRODUCES ALL ITS ENERGY NEEDED FOR HEATING AND ELECTRICITYWITH CO2 NEUTRAL BIOMASS.
image VESTAS VM 80 WIND TURBINES AT AN OFFSHORE WIND PARK IN THE WESTERNPART OF DENMARK.

140
GLOBAL ENERGY [R]EVOLUTIONA SUSTAINABLE GLOBAL ENERGY OUTLOOK
biomass technology A number of processes can be used to convertenergy from biomass. These divide into thermal systems, whichinvolve direct combustion of solids, liquids or a gas via pyrolysis orgasification, and biological systems, which involve decomposition ofsolid biomass to liquid or gaseous fuels by processes such asanaerobic digestion and fermentation.
• thermal systems Direct combustion is the most common way of convertingbiomass to energy, for heat as well as electricity. Worldwide itaccounts for over 90% of biomass generation. Technologies canbe distinguished as either fixed bed, fluidised bed or entrainedflow combustion. In fixed bed combustion, such as a gratefurnace, primary air passes through a fixed bed, in which drying,gasification and charcoal combustion takes place. Thecombustible gases produced are burned after the addition ofsecondary air, usually in a zone separated from the fuel bed. Influidised bed combustion, the primary combustion air is injectedfrom the bottom of the furnace with such high velocity that thematerial inside the furnace becomes a seething mass of particlesand bubbles. Entrained flow combustion is suitable for fuelsavailable as small particles, such as sawdust or fine shavings,which are pneumatically injected into the furnace.
Gasification Biomass fuels are increasingly being used withadvanced conversion technologies, such as gasification systems,which offer superior efficiencies compared with conventionalpower generation. Gasification is a thermochemical process inwhich biomass is heated with little or no oxygen present toproduce a low energy gas. The gas can then be used to fuel a gasturbine or combustion engine to generate electricity. Gasificationcan also decrease emission levels compared to power productionwith direct combustion and a steam cycle.
Pyrolysis is a process whereby biomass is exposed to hightemperatures in the absence of air, causing the biomass todecompose. The products of pyrolysis always include gas(‘biogas’), liquid (‘bio-oil’) and solid (‘char’), with the relativeproportions of each depending on the fuel characteristics, themethod of pyrolysis and the reaction parameters, such astemperature and pressure. Lower temperatures produce moresolid and liquid products and higher temperatures more biogas.
• biological systems These processes are suitable for very wet biomass materials suchas food or agricultural wastes, including farm animal slurry.
Anaerobic digestion means the breakdown of organic waste bybacteria in an oxygen-free environment. This produces a biogastypically made up of 65% methane and 35% carbon dioxide. Purifiedbiogas can then be used both for heating and electricity generation.
Fermentation Fermentation is the process by which growing plantswith a high sugar and starch content are broken down with thehelp of micro-organisms to produce ethanol and methanol. The endproduct is a combustible fuel that can be used in vehicles.
Biomass power station capacities typically range up to 15 MW,but larger plants are possible of up to 400 MW capacity, withpart of the fuel input potentially being fossil fuel, for examplepulverised coal. The world’s largest biomass fuelled power plant islocated at Pietarsaari in Finland. Built in 2001, this is anindustrial CHP plant producing steam (100 MWth) andelectricity (240 MWe) for the local forest industry and districtheat for the nearby town. The boiler is a circulating fluidised bedboiler designed to generate steam from bark, sawdust, woodresidues, commercial bio fuel and peat.
A 2005 study commissioned by Greenpeace Netherlandsconcluded that it was technically possible to build and operate a1,000 MWe biomass fired power plant using fluidised bedcombustion technology and fed with wood residue pellets42.
bio fuels Converting crops into ethanol and bio diesel made fromrapeseed methyl ester (RME) currently takes place mainly in Brazil,the USA and Europe. Processes for obtaining synthetic fuels from‘biogenic synthesis’ gases will also play a larger role in the future.Theoretically bio fuels can be produced from any biological carbonsource, although the most common are photosynthetic plants. Variousplants and plant-derived materials are used for bio fuel production. Globally bio fuels are most commonly used to power vehicles, but canalso be used for other purposes. The production and use of bio fuelsmust result in a net reduction in carbon emissions compared to the useof traditional fossil fuels to have a positive effect in climate changemitigation. Sustainable bio fuels can reduce the dependency onpetroleum and thereby enhance energy security.
Bio ethanol is a fuel manufactured through the fermentation ofsugars. This is done by accessing sugars directly (sugar cane or beet)or by breaking down starch in grains such as wheat, rye, barley ormaize. In the European Union bio ethanol is mainly produced fromgrains, with wheat as the dominant feedstock. In Brazil the preferredfeedstock is sugar cane, whereas in the USA it is corn (maize). Bioethanol produced from cereals has a by-product, a protein-rich animalfeed called Dried Distillers Grains with Solubles (DDGS). For everytonne of cereals used for ethanol production, on average one third willenter the animal feed stream as DDGS. Because of its high proteinlevel this is currently used as a replacement for soy cake. Bio ethanolcan either be blended into gasoline (petrol) directly or be used in theform of ETBE (Ethyl Tertiary Butyl Ether).
Bio diesel is a fuel produced from vegetable oil sourced from rapeseed,sunflower seeds or soybeans as well as used cooking oils or animal fats.Bio diesel comes in a standard form as ‘mono-alkyl ester’ and otherkinds of diesel-grade fuels of biological origin are not included. Inspecific cases, used vegetable oils can be recycled as feedstock for biodiesel production. This can reduce the loss of used oils in theenvironment and provides a new way of transforming a waste intotransport energy. Blends of bio diesel and conventional hydrocarbon-based diesel are the most common products distributed in the retailtransport fuel market.
Most countries use a labelling system to explain the proportion of biodiesel in any fuel mix. Fuel containing 20% biodiesel is labelled B20,while pure bio diesel is referred to as B100. Blends of 20 % bio dieselwith 80 % petroleum diesel (B20) can generally be used in unmodifieddiesel engines. Used in its pure form (B100) an engine may requirecertain modifications. Bio diesel can also be used as a heating fuel indomestic and commercial boilers. Older furnaces may contain rubberparts that would be affected by bio diesel’s solvent properties, but canotherwise burn it without any conversion.
9
energ
y techn
olo
gies
|R
EN
EW
AB
LE
EN
ER
GY
references42 ‘OPPORTUNITIES FOR 1,000 MWE BIOMASS-FIRED POWER PLANT IN THENETHERLANDS’, GREENPEACE NETHERLANDS, 2005

141
geothermal energy Geothermal energy is heat derived from deepunderneath the Earth’s crust. In most areas, this heat reaches thesurface in a very diffuse state. However, due to a variety ofgeological processes, some areas, including the western part of theUSA, west and central eastern Europe, Iceland, Asia and NewZealand are underlain by relatively shallow geothermal resources.These are classified as either low temperature (less than 90°C),moderate temperature (90° - 150°C) or high temperature (greaterthan 150°C). The uses to which these resources can be put dependon the temperature. The highest temperature is generally used onlyfor electric power generation. Current global geothermal generationcapacity totals approximately 8,000 MW. Uses for low andmoderate temperature resources can be divided into two categories:direct use and ground-source heat pumps.
Geothermal power plants use the Earth’s natural heat to vapourisewater or an organic medium. The steam created then powers aturbine which produces electricity. In New Zealand and Iceland thistechnique has been used extensively for decades. In Germany, whereit is necessary to drill many kilometres down to reach the necessarytemperatures, it is only in the trial stages. Geothermal heat plantsrequire lower temperatures and the heated water is used directly.
hydro power Water has been used to produce electricity for abouta century. Today, around one fifth of the world’s electricity isproduced from hydro power. Large hydroelectric power plants withconcrete dams and extensive collecting lakes often have verynegative effects on the environment, however, requiring the floodingof habitable areas. Smaller ‘run-of-the-river’ power stations, whichare turbines powered by one section of running water in a river, canproduce electricity in an environmentally friendly way.
The main requirement for hydro power is to create an artificialhead so that water, diverted through an intake channel or pipe intoa turbine, discharges back into the river downstream. Small hydropower is mainly ‘run-of-the-river’ and does not collect significantamounts of stored water, requiring the construction of large damsand reservoirs. There are two broad categories of turbines: impulseturbines (notably the Pelton) in which a jet of water impinges onthe runner designed to reverse the direction of the jet and therebyextracts momentum from the water. This turbine is suitable for highheads and ‘small’ discharges. Reaction turbines (notably Francisand Kaplan) run full of water and in effect generate hydrodynamic‘lift’ forces to propel the runner blades. These turbines are suitablefor medium to low heads, and medium to large discharges.
9
energ
y techn
olo
gies
|R
EN
EW
AB
LE
EN
ER
GY
figure 9.6: geothermal technology figure 9.7: hydro technology
1. PUMP
2. HEAT EXCHANGER
3. GAS TURBINE & GENERATOR
4. DRILLING HOLE FOR COLD WATER INJECTION
5. DRILLING HOLE FOR WARM WATER EXTRACTION
1. INLET
2. SIEVE
3. GENERATOR
4. TURBINE
5. HEAD
6. OUTLET
1 23
4 5
12
3
4
5
6
© B
. ER
ICK
SO
N/D
RE
AM
STIM
Eimage GEOTHERMAL POWER STATION,NORTH ISLAND, NEW ZEALAND.
image GEOTHERMAL ACTIVITY.
© J
. GO
UG
H/D
RE
AM
STIM
E

142
GLOBAL ENERGY [R]EVOLUTIONA SUSTAINABLE GLOBAL ENERGY OUTLOOK
ocean energy
tidal power Tidal power can be harnessed by constructing a damor barrage across an estuary or bay with a tidal range of at leastfive metres. Gates in the barrage allow the incoming tide to build upin a basin behind it. The gates then close so that when the tide flowsout the water can be channelled through turbines to generateelectricity. Tidal barrages have been built across estuaries inFrance, Canada and China but a mixture of high cost projectionscoupled with environmental objections to the effect on estuarialhabitats has limited the technology’s further expansion.
wave and tidal stream power In wave power generation, astructure interacts with the incoming waves, converting this energyto electricity through a hydraulic, mechanical or pneumatic powertake-off system. The structure is kept in position by a mooringsystem or placed directly on the seabed/seashore. Power istransmitted to the seabed by a flexible submerged electrical cableand to shore by a sub-sea cable.
Wave power converters can be made up from connected groups ofsmaller generator units of 100 – 500 kW, or several mechanical orhydraulically interconnected modules can supply a single largerturbine generator unit of 2 – 20 MW. The large waves needed tomake the technology more cost effective are mostly found at greatdistances from the shore, however, requiring costly sub-sea cables totransmit the power. The converters themselves also take up largeamounts of space. Wave power has the advantage of providing amore predictable supply than wind energy and can be located in theocean without much visual intrusion.
There is no commercially leading technology on wave powerconversion at present. Different systems are being developed at seafor prototype testing. The largest grid-connected system installed sofar is the 2.25 MW Pelamis, with linked semi-submergedcyclindrical sections, operating off the coast of Portugal. Mostdevelopment work has been carried out in the UK.
9
energ
y techn
olo
gies
|R
EN
EW
AB
LE
EN
ER
GY
© M
AX
FX
/DR
EA
MST
IME
© M
CD
ON
NE
LL
/IST
OC
K
© U
SC
HI
HE
RIN
G/D
RE
AM
STIM
E
images 1. BIOMASS CROPS. 2. OCEAN ENERGY. 3. CONCENTRATING SOLAR POWER (CSP).
1
2 3

143
10energy efficiency – more with less
GLOBAL POTENTIAL FOR ENERGY EFFICIENTIMPROVEMENTS
THE LOW ENERGY HOUSEHOLDTHE STANDARD HOUSEHOLD
“today, we are wastingtwo thirds (61%) of theelectricity we consume,mostly due to badproduct design.”GREENPEACE INTERNATIONALCLIMATE CAMPAIGN
10
IN N
OR
TH
AM
ER
ICA
AL
ON
E W
E C
OU
LD
SH
UT
DO
WN
16
DIR
TY
PO
WE
RP
LA
NT
S B
YC
HA
NG
ING
TO
CF
LS
AN
D L
ED
S. I
N E
UR
OP
E W
E C
OU
LD
SH
UT
DO
WN
11
. ©
DZ
AR
EK
/DR
EA
MST
IME

144
GLOBAL ENERGY [R]EVOLUTIONA SUSTAINABLE GLOBAL ENERGY OUTLOOK
Using energy efficiently is cheaper than producing fresh energy andoften has multiple positive effects. An efficient clothes washingmachine or dishwasher, for example uses less power and less water.Efficiency also usually provides a higher level of comfort. A well-insulated house, for instance, will feel warmer in the winter, coolerin the summer and be healthier to live in. An efficient refrigeratorwill make less noise, have no frost inside, no condensation outsideand will probably last longer. Efficient lighting will offer you morelight where you need it. Efficiency is thus really ‘more with less’.
There are very simple steps a householder can take, such as puttingadditional insulation in the roof, using super-insulating glazing orbuying a high-efficiency washing machine when the old one wearsout. All of these examples will save both money and energy. But thebiggest savings will not be found in such incremental steps. The realgains come from rethinking the whole concept - ‘the whole house’,‘the whole car’ or even ‘the whole transport system’. When you dothis, energy needs can often be cut back by four to ten times.
In order to find out the global and regional energy efficiencypotential, the Dutch institute Ecofys developed energy demandscenarios for this update of the Greenpeace Energy [R]evolutionanalysis. These scenarios cover energy demand over the period2005-2050 for ten world regions. Two low energy demand scenariosfor energy efficiency improvements have been defined. The first isbased on the best technical energy efficiency potentials and iscalled ‘Technical’. The second is based on more moderate energysavings taking into account implementation constraints in terms ofcosts and other barriers. This scenario is called ‘Revolution’. Themain results of the study are summarised below.
The starting point for the Ecofys analysis is that worldwide finalenergy demand is expected to grow by 95%, from 290 EJ in 2005to 570 EJ in 2050, if we continue with business as usual. In thelight of increasing fossil fuel prices, depleting resources and climatechange, business as usual is simply not an option.
Growth in the transport sector is projected to be the largest, withenergy demand expected to grow from 84 EJ in 2005 to 183 EJ in2050. Demand for buildings and agriculture is expected to grow theleast, from 91 EJ in 2005 to 124 EJ in 2050.
Under the energy [r]evolution scenario, however,growth in energy demand can be limited to anincrease of 28% up to 2050 in comparison to the 2005level, whilst taking into account implementationconstraints in terms of costs and other barriers.In Figure 10.2 the potential for energy efficiency improvements underthis scenario are presented. The baseline is 2005 final energy demandper region. Table 10.1 shows that total worldwide energy demand hasreduced to 376 PJ by 2050, with a breakdown by sector.
10
energ
y efficiency
|P
OT
EN
TIA
L
figure 10.1: reference scenario (business as usual) for worldwide final energy demand by sector
Fina
l ene
rgy
dem
and
(EJ)
2005 2010 2015 2020 2025 2030 2035 2040 2045 2050
•TRANSPORT FINAL ENERGY CONSUMPTION
•TRANSPORT
• BUILDINGS AND AGRICULTURE - FUELS
• INDUSTRY - FUELS (EXCLUDING FEEDSTOCKS)
• BUILDINGS AND AGRICULTURE - ELECTRICITY
• INDUSTRY - ELECTRICITY
600
500
400
300
200
100
0

145
10
energ
y efficiency
|P
OT
EN
TIA
L
table 10.1: change in energy demand by 2050 in comparison to 2005 level
[R]EVOLUTIONSCENARIO
+32%
+11%
+38%
+28%
REFERENCESCENARIO
+101%
+119%
+74%
+95%
SECTOR
Industry
Transport
Buildings and Agriculture
Total
OECD North
America
figure 10.2: potential for energy efficiency improvements per region in energy [r]evolution scenarioENERGY DEMAND FOR ALL SECTORS (NORMALISED BASED ON 2005 PJ)
• BUILDINGS
• INDUSTRY
•TRANSPORT
•TOTAL / REMAINING ENERGY DEMAND
450%
400%
350%
300%
250%
200%
150%
100%
50%
PJ 0
2005
2050
OECD Pacific
2005
2050
OECD Europe
2005
2050
TransitionEconomies
2005
2050
China
2005
2050
India
2005
2050
DevelopingAsia
2005
2050
Middle East
2005
2050
LatinAmerica
2005
2050
Africa
2005
2050
© D
RE
AM
STIM
E
© K
. ST
OZ
EK
/DR
EA
MST
IME
image STANDBY.
image WORK TEAM APPLYINGSTYROFOAM WALL INSULATION TO ANEWLY CONSTRUCTED BUILDING.

146
10
GLOBAL ENERGY [R]EVOLUTIONA SUSTAINABLE GLOBAL ENERGY OUTLOOK
figure 10.3: energy efficient households

147
Since homes account for the largest share of energy demand frombuildings, this section examines in detail the savings potential inhouseholds. Breakdowns of electricity use in the core EU-15countries and the new member states are given in Figure 10.4 andFigure 10.5. A breakdown of electricity demand in the servicessector can be found in Figure 10.6.
Based on the results from three studies43, we have assumed thefollowing breakdowns for energy use (fuel and electricity) under theReference Scenario in 2050. Insufficient information is available tomake a breakdown by world region. We assume however that thepattern for different regions will converge over the years.
10
energ
y efficient h
ou
seho
lds
|C
ON
SU
MP
TIO
N
© M
BI/
DR
EA
MST
IME
images POWER SOCKETS AND SWITCH.
© G
OO
RY
/DR
EA
MST
IME
• REFRIGERATORS & FREEZERS
•WASHING MACHINES
• DISHWASHERS
• DRIERS
• ROOM AIR-CONDITIONERS
• ELECTRIC STORAGE & WATER HEATER
• ELECTRIC OVENS
• ELECTRIC HOBS
• CONSUMER ELECTRONICS & OTHER EQUIPMENT STAND-BY
• LIGHTING
•TV ON MODE
• OFFICE EQUIPMENT
• RESIDENTIAL ELECTRIC HEATING
• CENTRAL HEATING CIRCULATION PUMPS
•MISCELLANEOUS
figure 10.4: breakdown of electricity use for residentialend-use equipment in EU-15 countries in 2004 (BERTOLDI & ATANASIU, 2006)
15%
4%
2%
2%1%
12%
4%
22%
9%
2%
5%1%
6%3%12%
•HEATING & COOLING
• LIGHTING
• REFRIGERATORS/FREEZERS
•WASHING MACHINES
• COOKING DISHWASHER
• ELECTRIC STORAGE & WATER HEATER
• CONSUMER ELECTRONICS & STAND-BY
•MISCELLANEOUS
figure 10.5: breakdown of electricity use for residentialend-use equipment in EU new member states in 2004 (BERTOLDI & ATANASIU, 2006)
22.4%20%
9.9%
10.5%
10.3%
6.7%
7%13.1%
• CONVEYORS
• COOKING
• PUMPS
• SPACE & WATER HEATING
•MISCELLANEOUS
• COOLING & VENTILATION
• COMMERCIAL REFRIGERATION
• COMMERCIAL & STREET LIGHTING
• OFFICE EQUIPMENT
figure 10.6: breakdown of electricity consumption in the EU services sector (BERTOLDI & ATANASIU, 2006)
6%
6%
4%8%
32%
20%
2%
15%7%
references43 BERTOLDI, P. AND B. ATANASIU. ‘ELECTRICITY CONSUMPTION AND EFFICIENCYTRENDS IN THE ENLARGED EUROPEAN UNION - STATUS REPORT 2006’, INSTITUTE FORENVIRONMENT AND SUSTAINABILITY, OECD/IEA (2006) AND WBCSD (2005)

the low energy household
Technologies to reduce energy demand applied in this typicalhousehold are45:
• Triple-glazed windows with low emittance coatings. Thesewindows greatly reduce heat loss to 40% compared to windowswith one layer. The low emittance coating prevents energy wavesin sunlight coming through, reducing the need for cooling.
• Insulation of roofs, walls, floors and basement. Proper insulationreduces heating and cooling demand by 50% in comparison totypical energy demand.
• Passive solar techniques make use of solar energy through thebuilding’s design - siting and window orientation. The term‘passive’ indicates that no mechanical equipment is used. Allsolar gains come through the windows.
• Balanced ventilation with heat recovery means that heated indoorair is channelled to a heat recovery unit and used to heatincoming outdoor air.
Current space heating demands in kJ per square metre per heatingdegree day for OECD dwellings are given in the table below.
148
GLOBAL ENERGY [R]EVOLUTIONA SUSTAINABLE GLOBAL ENERGY OUTLOOK
Since an estimated 80% of fuel use in buildings is for spaceheating, the energy efficiency improvement potential here isconsidered to be large. In order to determine the potential forefficiency improvement in space heating we looked at the energydemand per m2 floor area per heating degree day (HDD). Heatingdegree days indicate the number of degrees that a day’s averagetemperature is under 18°C, the temperature below which buildingsneed to be heated.
The typical current heating demand for dwellings is 70-120 kJ/m2 44.Dwellings with a low energy use consume below 32 kJ/m2/, however,more than 70% less than the current level.
10
energ
y efficient h
ou
seho
lds
|L
OW
EN
ER
GY
HO
US
EH
OL
D
table 10.2: break down of energy use in households
ELECTRICITY USE 2050
Air conditioning (8%)
Lighting (15%)
Standby (8%)
Cold appliances (15%)
Appliances (30%)
Other (e.g. electric heating) (24%)
FUEL USE 2050
Hot water (15%)
Cooking (5%)
Space heating (80%)
table 10.3: space heating demands in OECD dwellings in 2004
SPACE HEATING (KJ/M2/HDD)
113
78
52
REGION
OECD Europe
OECD North America
OECD Pacific
source OECD/IEA, 2007
references44 BERTOLDI, P. AND B. ATANASIU. ‘ELECTRICITY CONSUMPTION AND EFFICIENCYTRENDS IN THE ENLARGED EUROPEAN UNION - STATUS REPORT 2006’, INSTITUTE FORENVIRONMENT AND SUSTAINABILITY, OECD/IEA (2006) AND WBCSD (2005)45 BASED ON WBCSD (2005), IEA (2006), JOOSEN ET AL (2002)

149
space heating savings for new buildings We have assumed underthe Energy [R]evolution Scenario that from 2010 onwards, all newdwellings will be low energy buildings using 48 kJ/m2/HDD. Sincethere is no data on current average energy consumption fordwellings in non-OECD countries, we have had to make assumptionsfor these regions. The potential for fuel savings46 is considered to besmall in developing regions and about the same as the OECD in theTransition Economies. From this study we have taken the potentialfor developing regions to be equal to a 1.4% energy efficiencyimprovement per year, including replacing existing homes with moreenergy efficient housing (retrofitting). For the Transition Economieswe have assumed the average OECD savings potential. For newhomes, the savings compared to the average current dwelling aregiven in Table 10.4.
10
energ
y efficient h
ou
seho
lds
|L
OW
EN
ER
GY
HO
US
EH
OL
D
table 10.4: savings for space heating in new buildings in comparison to typical current dwellings
[R]EVOLUTION SCENARIO
58%
38%
8%
35%
REGION
OECD Europe
OECD North America
OECD Pacific
EIT
space heating savings by retrofit As well as constructing efficientnew buildings there is a large savings potential to be found inretrofitting existing buildings. Important retrofit options are moreefficient windows and insulation. According to the OECD/IEA, thefirst can save 39% of space heating energy demand while the lattercan save 32% of space heating or cooling. Energy consumption inexisting buildings in Europe could therefore decrease by more than50%47. In OECD Europe and for the other regions we assume thesame relative reductions as for new buildings, to take into accountcurrent average efficiency of dwellings in the regions. For existinghomes, the savings compared to the average current dwelling aregiven in the table below.
In order to calculate the overall potential we need to know theshare of new and existing buildings in 2050. The United NationsEconomic Commission for Europe database48 contains data on thetotal housing stock, the increase from new construction andpopulation. We have assumed that the total housing stock growsalong with the population. The number of existing dwellings alsodecreases each year due to a certain level of replacement. Onaverage this is about 1.3% of the total housing stock per year,meaning a 40% replacement over 40 years, the equivalent of anaverage house lifetime of 100 years. Figure 10.6 shows how thefuture housing stock could develop in The Netherlands.
table 10.5: savings for space heating in existingbuildings in comparison to a current average dwelling
[R]EVOLUTION SCENARIO
40%
26%
5%
24%
REGION
OECD Europe
OECD North America
OECD Pacific
EIT
© K
EL
PF
ISH
/DR
EA
MST
IME
© I
ND
YK
B/D
RE
AM
STIM
E
image A ROOM AT A NEWLY CONSTRUCTEDHOME IS SPRAYED WITH LIQUIDINSULATING FOAM BEFORE THE DRYWALLIS ADDED.
image FUTURISTIC SOLAR HEATED HOMEMADE FROM CEMENT AND PARTIALLYCOVERED IN THE EARTH.
references46 ÜRGE-VORSATZ & NOVIKOVA (2008)47 OECD/IEA,200648 UNECE, ‘HUMAN SETTLEMENT DATABASE’, 2008

150
GLOBAL ENERGY [R]EVOLUTIONA SUSTAINABLE GLOBAL ENERGY OUTLOOK
This example illustrates that new dwellings in The Netherlands (andtherefore OECD Europe) make up 7% of the total housing stock in2050 and retrofits account for 41%. Although the UNECE databasedoes not have data for countries in all regions of the world, thepercentages of new and retrofit houses in 2050 are not dependent onthe absolute number of dwellings but only on the rate of populationgrowth and the 1.3% assumption. This means that we can use thepopulation growth to make forecasts for other regions (see Table 10.6).
Total savings for space heating energy demand are calculated bymultiplying the savings potentials for new and existing houses bythe forecast share of dwellings in 2050 to get a weighed percentagereduction. For fuel use for hot water we have assumed the sameannual percentage reduction as for space heating. For cooking wehave assumed a 1.5% per year efficiency improvement.
electricity savings by application
In order to determine savings for electricity demand in buildings, we examined the energy use and potential savings for the followingdifferent elements of power consumption:
• Standby
• Lighting
• Set-top boxes
• Freezers/fridges
• Computers/servers
• Air conditioning
1. standby power consumption Standby power consumption is the"lowest power consumption which cannot be switched off(influenced) by the user and may persist for an indefinite time whenan appliance is connected to the mains electricity supply"49. In otherwords, the energy available when an appliance is connected to thepower supply is not being used. Some appliances also consumeenergy when they are not on standby and are also not being used fortheir primary function, for example when an appliance has reachedthe end of a cycle but the ‘on’ button is still engaged. Thisconsumption does not fit into the definition of standby power butcould still account for a substantial amount of energy use.
Reducing standby losses provides a major opportunity for cost-effective energy savings. Nowadays, many appliances can beremotely and/or instantly activated or have a continuous digitaldisplay, and therefore require a standby mode. Standby poweraccounts for 20–90W per home in developed nations, ranging from4 to 10% of total residential electricity use50 and 3-12% of totalresidential electricity use worldwide51. Printers use 30-40% of theirfull power requirement when idle, as do televisions and musicequipment. Set-top boxes used in conjunction with televisions tend toconsume even more energy on standby than in use. Typical standbyuse of different types of electrical devices is shown in Figure 10.8.
10
energ
y efficient h
ou
seho
lds
|L
OW
EN
ER
GY
HO
US
EH
OL
D
table 10.6: forecast share of new dwellings in the housing stock in 2050
NEW DWELLINGS
DUE TOPOPULATIONGROWTH AS
SHARE OF TOTAL IN 2050
7%
35%
1%
0%
43%
12%
48%
40%
61%
71%
NEW DWELLINGS
DUE TOREPLACEMENT
OF OLDBUILDINGS AS
SHARE OF TOTALDWELLINGS
IN 2050
41%
29%
44%
45%
25%
39%
23%
27%
17%
13%
EXISTINGBUILDINGS
52%
36%
55%
55%
32%
49%
29%
33%
22%
16%
REGION
OECD Europe
OECD North America
OECD Pacific
Transition Economies
India
China
Developing Asia
Latin America
Middle East
Africa
figure 10.7: future housing stock development in the netherlands
dwel
lings
(th
ousa
nds)
2010 2015 2020 2030 2040 2050
•TOTAL DWELLING STOCK
• ORIGINAL DWELLINGS
• 2005 DWELLINGS
8,000
7,000
6,000
5,000
4,000
3,000
2,000
1,000
0
references49 UNITED KINGDOM MARKET TRANSFORMATION PROGRAMME, ‘BNXS15: STANDBYPOWER CONSUMPTION - DOMESTIC APPLIANCES’, 200850 MEIER, A., J. LIN, J. LIU, T. LI‚ ‘STANDBY POWER USE IN CHINESE HOMES’, ENERGYAND BUILDINGS 36, PP. 1211-1216, 2004 51 MEIER, A, ‘A WORLDWIDE REVIEW OF STANDBY POWER IN HOMES’, LAWRENCEBERKELEY NATIONAL LABORATORY, UNIVERSITY OF CALIFORNIA, 2001

151
In developing nations, the amount of appliances per household isgrowing (see Figure 10.9 for China). In China, standby energy useaccounts for 50–200 kWh per year in an average urban home.
Overall, residential standby power consumption inChina requires the electrical output equivalent to atleast six 500 MW power plants.
Levels of standby power use in Chinese homes (on average 29W) are below those in developed countries but still high because Chineseappliances have a higher level of standby operation. Existingtechnologies are available to greatly reduce standby power at a low cost.
By 2050, standby use is expected to be responsible for 8% of totalelectricity demand across all regions of the world. The WorldBusiness Council for Sustainable Development has assessed that aworldwide savings potential of between 72% and 82% is feasible.This is confirmed by research in The Netherlands52 which showedthat reducing the amount of power available for standby in alldevices to just 1W would lead to a saving of approximately 77%.We have adopted these reduction percentages for the Technicalscenario (82% reduction) and the [R]evolution Scenario (72%reduction). This means an energy efficiency improvement of 4.2%per year in the Technical scenario and 3.1% per year in the[R]evolution Scenario.
10
energ
y efficient h
ou
seho
lds
|L
OW
EN
ER
GY
HO
US
EH
OL
D
figure 10.8: electricity use of standby power for different devices(HARMELINK ET AL., 2005)
3,000
2,500
2,000
1,500
1,000
500
GWh 01995 1996 1997 1998 1999 2000
•WASHING MACHINE/DRIER
• ELECTRIC TOOTH BRUSH
•TELEVISION
• ELECTRONIC SYSTEM BOILER
•MODEM
• PRINTER
• PERSONAL COMPUTER
• ALARM SYSTEM
• STANDBY VIDEO
• STANDBY AUDIO
•ELECTRONIC CONTROL WHITE GOODS
• SENSOR LAMP
• NIGHT LAMP (CHILDREN)
• ELECTRONIC CLOCK RADIO
• DECODER
• STATELLITE SYSTEM
• DOORBELL TRANSFORMER
• COFFEE MAKER CLOCK
• OVEN CLOCK
•MICROWAVE CLOCK
• CRUMB-SWEEPER
• ANSWERING MACHINE
• CORDLES TELEPHONE
figure 10.9: level of saturation in population for major appliances in china(MEIER ET AL., 2004)
satu
rati
on (
%)
1980 1985 1990 1995 2000
•CLOTHES WASHER
• COLOR TV
• REFRIGERATOR
• AC
120
100
80
60
40
20
0
© C
RE
ASE
NCE
SRO/
DR
EA
MST
IMEimage FRIDGE.
image POWER PLUGS.
© T
. TR
OJA
NOW
SKI/D
RE
AM
STIM
E
references52 HARMELINK M., K. BLOK, M. CHANG, W. GRAUS, S. JOOSEN, ‘OPTIONS TO SPEED UPENERGY SAVINGS IN THE NETHERLANDS (MOGELIJKHEDEN VOOR VERSNELLING VANENERGIEBESPARING IN NEDERLAND)’, ECOFYS, UTRECHT, 2005

152
GLOBAL ENERGY [R]EVOLUTIONA SUSTAINABLE GLOBAL ENERGY OUTLOOK
2. lighting Incandescent bulbs have been the most common lamps fora more than 100 years. These are the most inefficient type of lighting,however, since up to 95% of the electricity is converted into heat53.Incandescent lamps have a relatively short life-span (average ofapproximately 1,000 hours) but have a low initial cost and optimalcolour rendering. CFLs (Compact Fluorescent Lamps) are moreexpensive than incandescent bulbs but they use about 75% lessenergy, produce 75% less heat and last about ten times longer54. CFLsare available in different sizes and shapes, for indoors and outdoors.
The usage pattern for different lighting technologies in differentcountries is shown in Figure 10.10 (LFL = Linear Fluorescent Lamp).
Globally, people consume 3 Mega-lumen-hrs (Mlmh) of residentialelectric light per capita/year. The average North American uses 13.2Mlmh, the average Chinese 1.5 Mlmh - still 300 times the averageartificial per capita light use in England in the nineteenth century.The average Japanese uses 18.5 Mlmh and the average European orAustralian 2.7Mlmh. There is a clear relationship between GDP percapita and lighting consumption in Mlmh/cap/yr (see Figure 10.11).
It is important to realise that lighting energy savings are not just aquestion of using more efficient lamps but also involve otherapproaches. These include making smarter use of daylight, reducinglight absorption by luminaires (the fixture in which the lamp ishoused), optimising lighting levels (levels in OECD countriescommonly exceed recommended values), using automatic controls(turn off when no one is present, dim artificial light in response torising daylight) and retrofitting buildings to make better use ofdaylight. Buildings designed to optimise daylight can receive up to70% of their annual illumination needs from daylight, while a typicalbuilding will only get 20 to 25%55. In a study by Bertoldi & Atanasiu(2006), national lighting consumption and CFL penetration data ispresented for the EU-27 countries (and candidate country Croatia).We used this data as the basis for household penetration rates andlighting electricity consumption in OECD Europe. As well as standby,lighting is an important source of cost-effective savings. The IEApublication “Light’s Labour’s Lost” (2006) projects that the cost-effective savings potential from energy efficient lighting in 2030 is atleast 38% of lighting electricity consumption, even disregardingnewer and promising solid state lighting technologies such as lightemitting diodes (LEDs). In order to determine the savings potentialfor lighting, it is important to know the percentage of householdswith energy efficient lamps and the penetration level of these lamps.Based on Bertoldi & Atanasiu (2006) and Waide (2006) wecalculated the shares shown in Table 10.7.
10
energ
y efficient h
ou
seho
lds
|L
OW
EN
ER
GY
HO
US
EH
OL
D
figure 10.10: share of residential lighting taken up by different lighting technologies(WAIDE, 2006)
China
Russia
USA
Japan
Europe
0% 20% 40% 60% 80% 100%
•LFL
• CFL
• HALOGEN
• INCANDESCENT
figure 10.11: lighting consumption Mlmh/capita/yr as a function of GDP per capita(WAIDE, 2006)
Lig
htni
ng c
ons.
(M
-lm
-hrs
/Cap
ita/
year
)GDP per capita (2000 US$ thousands)
y=1.4125e0.0802x
R2=0.8588
0 10 20 30 40 50
18
16
14
12
10
8
6
4
2
0
references53 HENDEL-BLACKFORD ET AL., 200754 ENERGY STAR, ‘COMPACT FLUORESCENT LIGHT BULBS’, 200855 IEA, 2006

153
Based on the studies already cited we calculate that a maximum of 80% savings can result from the introduction of efficientresidential lighting in the Technical scenario and 70% in the[R]evolution Scenario. These savings not only include using energyefficient lamps but behavioural changes and maximising daylightuse. Since the penetration of energy efficient lamps differs perhousehold, we have assumed that the savings potential is themaximum saving multiplied by 1 minus the penetration rate. The resulting savings are given in Table 10.8.
3. Set-top boxes Set-top boxes (STBs) are used to decode satelliteor cable television programmes and are a major new source of energydemand. More than a billion are projected to be purchased worldwideover the next decade. The energy use of an average set-top box is 20-30 W, but it uses nearly the same amount of energy when switchedoff56. In the USA, STB energy use is estimated at 15 TWh/year, orabout 1.3% of residential electricity use57. With more advanced uses,for instance digital video recorders (DVRs), STB energy use isforecast to triple to 45 TWh/year by 2010 – an 18% annual growthrate and 4% of 2010 residential electricity use.
Because of their short lifetimes (on average five years) and highownership growth rates, STBs provide an opportunity for significantshort term energy savings. Cable/satellite boxes without DVRs use 100to 200 kWh of electricity per year, whilst combined with DVRs theyuse between 200 and 400 kWh per year. Media receiver boxes use lessenergy (around 35 kWh per year) but must be used in conjunctionwith existing audiovisual equipment and computers, thus addinganother 35 kWh to the annual energy use of existing home electronics.Figure 10.12 shows the annual energy use of common householdappliances. This shows that the energy use of some set-top boxesapproaches that of the major energy consuming household appliances.
Reducing the energy use of set-top boxes is complicated by theircomplex operating and communication modes. Althoughimprovements in power supply design and efficiency will be effectivein reducing energy use, the major savings will be obtained throughenergy management measures. The study by Rainer et al (2004)reports a savings potential of between 32% and 54% over five years(2005-2010). Assuming that these drastic measures have not yetbeen applied and due to lack of data on other regions, we have takenthese reduction percentages as the global potential up to 2050.
10
energ
y efficient h
ou
seho
lds
|L
OW
EN
ER
GY
HO
US
EH
OL
D
table 10.7: current penetration of energy efficient lamps
% OF ENERGY EFFICIENT LAMPS
15%
60% (average North America and Japan)
30%
5%
75%
No information, 5% assumed, as for TE
REGION
OECD Europe
OECD Pacific
OECD North America
Transition Economies (TE)
China
Developing Regions
table 10.8: energy savings from implementing energy efficient lighting
[R]EVOLUTION SCENARIO
60%
49%
42%
67%
18%
67%
REGION
OECD Europe
OECD North America
OECD Pacific
Transition Economies
China
Other Developing Regions
figure 10.12: annual energy use of common household appliances(HOROWITZ, 2007)
room air conditioners
electric range top
dishwasher
efficient refrigerator
42” plasma HD television
electric oven
HD receiver with DVR
desktop computer
microwave oven
stand alone dvr (“Tivo” box)
32” analog CRT television
cable/satellite receiver
clothes washer
coffee maker
compact stereo system
laptop computer
vcr/dvd
The average HD set top boxwith built in DVR consumesover 360 kWh per year onaverage, costing over $130 to operate over its first fouryears in use.
0 100 200 300 400 500 600
Annual Energy use (kWh per year)
© P
XL
AR
8/D
RE
AM
STIM
E
© A
GE
NC
YB
Y/D
RE
AM
STIM
E
image COMPACT FLUORESCENT LAMPLIGHT BULB.
image WASHING MACHINE.
references56 OECD/IEA, 2006; HOROWITZ, 200757 RAINER ET AL., 2004

154
GLOBAL ENERGY [R]EVOLUTIONA SUSTAINABLE GLOBAL ENERGY OUTLOOK
4. cold appliances The average household in OECD Europeconsumed 700 kWh/year of electricity for food refrigeration in 2000compared with 1,034 kWh/year in Japan, 1 216 kWh/year in OECDAustralasia and 1,294 kWh/year in OECD North America. Thesefigures illustrate differences in average household storage capacities,the ratio of frozen to fresh food use, ambient temperatures andhumidity, and food storage temperatures and control58. Europeanhouseholds typically either have a refrigerator-freezer in the kitchen(sometimes with an additional freezer or refrigerator), or they have arefrigerator and a separate freezer. Practical height and width limitsplace constraints on the available internal storage space for anappliance. Similar constraints apply in Japanese households, whereownership of a single refrigerator-freezer is the norm, but are lesspressing in OECD North America and Australia. In these countriesalmost all households have a refrigerator-freezer and many also havea separate freezer and occasionally a separate refrigerator.
Looking in detail at the situation in the European Union, we foundthat in 2003, 103 TWh of electricity was consumed by household coldappliances alone (15% of total 2004 residential end use). A coldappliance with an energy use rating of A++ uses 120 kWh per year,while a comparable appliance with energy rating B uses 300 kWh peryear and with rating C 600 kWh per year59. The average energy ratingof appliances sold in the EU-15 countries is still B. If only A++appliances were sold, energy consumption would be 60% less. Theaverage lifetime of a cold appliance is 15 years, which means that 15years from the introduction of only A++ labelled appliances, 60% lessenergy would be used in the EU-15. According to the EuropeanCommission (see Table 10.9), consumption in TWh/y could decreasefrom 103 in 2003 to 80 in 2010 with additional policies to encourageefficient appliances. This means that the energy efficiency of coldappliances could increase by about 3.5% each year.
Based on this analysis, we have assumed for the Technical scenarioan energy efficiency improvement of 3.5% per year from 2010onwards. This would lead to an efficiency improvement of 77% in2050. For the [R]evolution Scenario we have assumed a 2.5% peryear efficiency improvement, corresponding to 64% in 2050.
10
energ
y efficient h
ou
seho
lds
|L
OW
EN
ER
GY
HO
US
EH
OL
D
table 10.9: energy consumption of household appliances in the EU-15 residential sector (european commission, 2005)
APPLIANCES
Washing machines
Refrigerators and freezers
Electric ovens
Standby
Lighting
Dryers
DESWH
Air-conditioners
Dishwashers
Total
ELECTRICITY SAVINGSACHIEVED IN THE PERIOD
1992-2003 [TWH/YEAR]
10-11
12-13
-
1-2
1-5
-
-
-
0.5
24.5-31.5
CONSUMPTION IN 2003[TWH/YEAR]
26
103
17
44
85
13.8
67
5.8
16.2
377.8
CONSUMPTION IN 2010 (WITH CURRENT POLICIES)
[TWH/YEAR]
23
96
17
66
94
15
66
8.4
16.5
401.9
CONSUMPTION IN 2010AVAILABLE POTENTIAL TO
2010 (WITH ADDITIONALPOLICIES) [TWH/YEAR]
14
80
15.5
46
79
12
64
6.9
15.7
333.1
references58 IEA, 200359 EUROTOPTEN, 2008

155
5. computers and servers The average desktop computer usesabout 120 W per hour - the monitor 75 W and the centralprocessing unit 45 W - and the average laptop 30 W per hour.Current best practice monitors60 use only 18 W (15 inch screen),which is 76% less than the average. Savings for computers areespecially important in the commercial sector. According to a 2006US study, computers and monitors have the highest energyconsumption in an office after lighting. In Europe, office equipmentuse is considered to be less important (see Figure 4), but estimatesdiffer widely61. Some studies have shown that automatic and/ormanual power management of computers and monitors cansignificantly reduce their energy consumption.
A power managed computer consumes less than half the energy of acomputer without power management62, depending on how yourcomputer is used; power management can reduce the annual energyconsumption of a computer and monitor by as much as 80%63.Approximately half of all office computers are left on overnight andat weekends (75% of the time). Apart from switching off at night,using LCD (liquid crystal display) monitors requires less energy thanCRT (cathode ray tube). An average LCD screen uses 79% lessenergy than an average CRT monitor if both are power-managed64.Further savings can be made by ensuring computers enter low powermode when they are idle during the day. Another benefit ofdecreasing the power consumption of computers and monitors isthat it reduces the load for air conditioning. According to a 2002study by Roth et al, office equipment increases the air conditioningload by 0.2-0.5 kW per kW of office equipment power consumption.
The average computer with a CRT monitor in constant operation uses1,236 kWh/y (482kWh/y for the computer and 754kWh/y for themonitor). With power management this reduces to 190kWh/y(86+104). Effective power management can save 1,046kWh percomputer and CRT monitor per year, a reduction of 84%, or 505kWhper computer and LCD monitor per year. These examples illustratethat power management can have a greater effect than just moreefficient equipment. The German website EcoTopten, for example, saysthat more efficient computers save 50-70% compared with oldermodels and efficient flat-screens use 70% less energy than CRTs.
Servers are multiprocessor systems running commercial workloads65. Thetypical breakdown of peak power server use is shown in Table 10.10.
Data centres are facilities that primarily contain electronicequipment used for data processing, data storage andcommunications networking66. 80% of servers are located in thesedata centres67. Worldwide, about three million data centres and 32million servers are in operation. Approximately 25% of servers arelocated in the EU, but only 10% of data centres, meaning that onaverage each data centre hosts a relatively large number of servers(Fichter, 2007). The installed base of servers is growing rapidly dueto an increasing demand for data processing and storage. Newdigital services such as music downloads, video-on-demand, onlinebanking, electronic trading, satellite navigation and internettelephony spur this rapid growth, as well as the increasingpenetration of computers and the internet in developing countries.Since systems have become more and more complex to handleincreasingly large amounts of data, power and energy consumption(about 50% used for cooling68) have grown in parallel. The powerdensity of data centres is rising by approximately 15% each year69.Aggregate electricity use for servers doubled over the period 2000to 2005 both in the US and worldwide (see Figure 10.13). Datacentres accounted for roughly 1% of global electricity use in 2005(14 GW) (Koomey, 2007).
10
energ
y efficient h
ou
seho
lds
|L
OW
EN
ER
GY
HO
US
EH
OL
D
table 10.10: peak power breakdown by component for a typical server
PEAK POWER (WATTS)
80
36
12
50
25
10
38
251
COMPONENT
CPU
Memory
Disks
Peripheral slots
Motherboard
Fan
PSU losses
Total
source (FAN ET AL., 2007, US EPA, 2007A). PSU = POWER SUPPLY UNIT
figure 10.13: total electricity use for servers in the US and world in 2000 and 2005, including associatedcooling and auxiliary equipment(KOOMEY, 2007)
• COOLING AND AUXILIARY EQUIPMENT
• HIGH-END SERVERS
•MID-RANGE SERVERS
•VOLUME SERVERS
140
120
100
80
60
40
20
02000
U.S.
2005 2000
World
2005
Tota
l ele
ctri
city
use
(bi
llion
kW
h/ye
ar)
1.2% of 2005 U.S.electricity sales$2.7 B/year
0.8% of estimated 2005 worldelectricity sales, $7.2 B/year
© D
.SR
OG
A/D
RE
AM
STIM
E
images COMPUTERS.
© Y
. AR
CU
RS
/DR
EA
MST
IME
references60 BEST OF EUROPE, 200861 SEE BERTOLDI & ATANASIU, 2006 FOR A MORE ELABORATE ACCOUNT62 WEBBER ET AL., 200663 WEBBER ET AL., 200664 WEBBER ET AL., 200665 LEFURGY ET AL., 200366 US EPA, 2007A67 FICHTER, 200768 US EPA, 2007A69 HUMPHREYS & SCARAMELLA, 2006

156
GLOBAL ENERGY [R]EVOLUTIONA SUSTAINABLE GLOBAL ENERGY OUTLOOK
Power and energy consumption are key concerns for internet datacentres and there is a significant potential for energy efficiencyimprovements. Existing technologies and design strategies havebeen shown to reduce the energy use of a typical server by 25% ormore70. Energy management efforts in existing data centres couldreduce their energy usage by around 20%, according to the USEnvironmental Protection Agency (EPA).
The US EPA scenario for reducing server energy use includesmeasures such as enabling power management, consolidatingservers and storage, using liquid instead of air cooling, improvingthe efficiency of chillers, pumps, fans and transformers and usingcombined heat and power. This bundle of measures could reduceelectricity use by up to 56% compared to current efficiency trends(or 60% compared to historical trends), the EPA concludes,representing the maximum technical potential by 2011. Thisassumes that only 50% of current data centres can introduce thesemeasures. A significant savings potential is therefore available forservers and data centres around the world by 2050. For computersand servers we have based the savings potential on the WBCSD2005 report and other sources mentioned in this section. For theTechnical scenario this would result in 70% savings, for the[R]evolution Scenario 55% savings.
6. air conditioning Today in the USA, some 14 % of total electricalconsumption is used to air condition buildings71. Increasing use ofsmall air conditioning units (less than 12 kW output cooling power) insouthern European cities, mainly during the summer months, is alsodriving up electricity consumption. Total residential electricityconsumption for air conditioners in the EU-25 in 2005 was estimatedto be between 7 and 10 TWh per year72. However, we should notunderestimate the consumption in developing countries. Many of theseare located in warm climatic zones. With the rapid development of itseconomy and improving living standards, central air conditioning unitsare now widely used in China, for example. They currently account forabout 20% of total Chinese electricity consumption73.
There are several options for technological savings in air conditioningequipment. One is to use a different refrigerant. Tests with therefrigerant Ikon B show possible energy consumption reductions of 20-25% compared to the commonly used liquids74. However, behaviouralchanges should not be overlooked. One example of a smart alternativeto cooling a whole house was developed by the company EveningBreeze. This combined a mosquito net, bed and air conditioning so thatonly the bed had to be cooled instead of the whole bedroom.
There are also other options for cooling, such as geothermal cooling byheat pumps. This uses the same principle as geothermal heating, namelythat the temperature at a certain depth below the Earth’s surfaceremains constant year round. In the winter we can use this relativelyhigh temperature to warm our houses. Conversely, we can use therelatively cold temperature in the summer to cool our houses. There areseveral technical concepts available, but all rely on transferring the heatfrom the air in the building to the Earth. A refrigerant is used as theheat transfer medium. This concept is cost-effective75. Heat pumps havebeen gaining market share in a number of countries76.
Solar energy can also be used for cooling through the use of solarthermal energy or solar electricity to power a cooling appliance. Basictypes of solar cooling technologies include absorption cooling (uses solarthermal energy to vapourise the refrigerant); desiccant cooling (usessolar thermal energy to regenerate (dry) the desiccant); vapourcompression cooling (uses solar thermal energy to operate a Rankine-cycle heat engine); evaporative cooling; and heat pumps and airconditioners that can be powered by solar photovoltaic systems. To drivethe pumps only 0.05 kWh of electricity is needed, instead of 0.35 kWhfor regular air conditioning77, representing a savings potential of 85%.
Not only is it important to use efficient air conditioning equipment,it is equally important to reduce the need for air conditioning in thefirst place. Important ways to reduce cooling demand are to useinsulation to prevent heat from entering the building, to reduce theamount of inefficient appliances present in the house, such asincandescent lamps or old refrigerators that give off unusable heat,to use cool exterior finishes, such as ‘cool roof’ technology or light-coloured wall paint, to improve windows and use vegetation toreduce the amount of heat that comes into the house, and to useventilation instead of air conditioning units.
For air conditioning we have assumed that the savings potentialbased on the 2005 WBCSD study and other sources mentioned inthis section will amount to 70% savings under the Technicalscenario and 55% savings under the [R]evolution Scenario.
10
energ
y efficient h
ou
seho
lds
|L
OW
EN
ER
GY
HO
US
EH
OL
D
references70 US EPA, 2007A71 US DOE/EIA, 200772 BERTOLDI & ATANASIU, 200673 LU, 200774 US DOE EERE, 200875 DUFFIELD & SASS, 200476 OECD/IEA, 200677 AUSTRIAN ENERGY AGENCY, 2006

157
10
energ
y efficient h
ou
seho
lds
|L
OW
EN
ER
GY
HO
US
EH
OL
D
table 10.11: savings potential for different types of energy use in the buildings sector (REVOLUTION POTENTIAL IN BRACKETS)
OECD Europe
OECD North America
OECD Pacific
Transition Economies
China
India
Rest dev. Asia
Middle East
Latin America
Africa
HEATINGNEW
72 (58)
59 (38)
38 (8)
56 (35)
43 (38)
HEATINGRETROFIT
50 (40)
41 (26)
26 (5)
39 (24)
STANDBY
82 (72)
LIGHTING
68 (60)
48 (42)
56 (49)
76 (67)
20 (18)
76 (67)
APPLIANCES
70 (50)
COLDAPPLIANCES
77 (64)
AIRCONDITIONING
70 (55)
COMPUTER/SERVER
70 (55)
OTHER
71 (57)
67 (53)
69 (55)
73 (58)
61 (48)
73 (58)
table 10.12: savings potential for different types of energy use in the buildings sector (REVOLUTION POTENTIAL IN BRACKETS). PERCENTAGES ARE TOTAL EFFICIENCY IMPROVEMENT PER YEAR (INCLUDING 1% AUTONOMOUS IMPROVEMENT)
OECD Europe
OECD North America
OECD Pacific
Transition Economies
China
India
Rest dev. Asia
Middle East
Latin America
Africa
HEATINGNEW
3.1 (2.1)
2.2 (1.2)
1.2 (1.1)
2.2 (1.4)
1.4 (1.2)
HEATINGRETROFIT
1.7 (1.3)
1.3 (1.1)
1.2 (1.1)
1.2 (1.1)
STANDBY
4.2 (3.1)
LIGHTING
2.8 (2.3)
2.0 (1.7)
1.6 (1.4)
3.5 (2.7)
1.2 (1.1)
3.5 (2.7)
APPLIANCES
3.0 (1.7)
COLDAPPLIANCES
3.5 (2.5)
AIRCONDITIONING
3.0 (2.0)
COMPUTER/SERVER
3.0 (2.0)
OTHER
3.1 (2.1)
2.9 (2.0)
2.8 (1.9)
3.2 (2.2)
2.8 (1.9)
3.2 (2.2)
total household savings
Total savings from the previous sections are summarised here. Table10.11 shows the total savings in percentages up to 2050. Theseneed to be translated into energy efficiency improvements per yearto compare them with the Reference Scenario. Since it is not clearwhat assumptions this is based on, we have assumed an efficiencyimprovement of 1% per year. Subtracting this from the reductionpotentials in Table 10.12 shows the energy efficiency improvementsper year measured against the Reference Scenario. Electricity usein the ‘Other’ sector is assumed to decline at the same rate asresidential electricity use (lighting, appliances, cold appliances,computers/servers and air conditioning). We have assumed aminimum energy efficiency improvement of 1.2% in the Technicalscenario and 1.1% in the [R]evolution Scenario, includingautonomous improvements.
For services and agriculture we have assumed the same percentage savings potential as for the household sector.
© J
. GO
OD
YE
AR
/DR
EA
MST
IME
© L
IAN
GF
EN
G/D
RE
AM
STIM
Eimage WASHING MACHINE.
image AIR CONDITIONING UNIT ANDINSULATED WINDOWS.

158
GLOBAL ENERGY [R]EVOLUTIONA SUSTAINABLE GLOBAL ENERGY OUTLOOK
energy efficiency standards - steps towards an energy equity
the standard household
In order to enable a specific level of energy demand as a basic“right” for all people in the world, we have developed the model ofan efficient Standard Household. A fully equipped OECD household(including fridge, oven, TV, radio, music centre, computer, lights etc.)currently consumes between 1,500 and 3,400 kWh/a per person.With an average of two to four people per household the totalconsumption is therefore between 3,000 and 12,000 kWh/a. Thisdemand could be reduced to about 550 kWh/a per person just byusing the most efficient appliances available on the market today.This does not even include any significant lifestyle changes. Basedon this assumption, the ‘over-consumption’ of all households inOECD countries totals more than 2,100 billion kilowatt-hours.Comparing this figure with the current per capita consumption indeveloping countries, they would have the right to use about 1,350billion kilowatt-hours more. The ‘oversupply’ of OECD householdscould therefore fill the gap in energy supply to developing countriesone and a half times over.
By implementing a strict technical standard for allelectrical appliances, in order to achieve a level of 550kWh/a per capita consumption, it would be possibleto switch off more than 340 coal power plants in OECD countries.
10
energ
y efficient h
ou
seho
lds
|S
TA
ND
AR
D H
OU
SE
HO
LD
figure 10.14: energy equity through efficiency standards
Latin America
Africa
China
India
Developing Asia
Global per capita average
Transition Economies
Middle East
OECD Pacific
OECD Europe
North America
0 500 1,000 1,500 2,000 2,500 3,000 3,500
Fully Equipped “Best PracticeHousehold” demand - per capita:550 kWh/a
Improving efficiency inhousehold means Equity:
Undersupply of householdsin Developing countries in2005 compared to “BestPractice Household”:1,373 TWh/a
Over consumption in OECDcountries in 2005 comparedto “Best Practice Household”:2,169 TWh/a
•LIGHTING
• STAND BY
• AIR CONDITIONING
• APPLIANCES
• COLD APPLIANCES
• COMPUTERS/SERVERS
• OTHER
figure 10.15: electricity savings in households [energy [r]evolution versus reference] in 2050
14%
13%
22%
2%
8%
20%
21%
source SVEN TESKE/WINA GRAUS
source ECOFYS

159
energy efficiency standards - the potential is huge
Setting energy efficiency standards for electrical equipment couldhave a huge impact on the world’s power sector. A large number ofpower plants could be switched off if strict technical standardswere brought into force. The table below provides an overview of thetheoretical potential for using efficiency standards based on
currently available technology. The Energy [R]evolution Scenariohas not been calculated on the basis of this theoretical potential.However, this overview illustrates how many power plants producingelectricity would not be needed if all global appliances werebrought up to the highest efficiency standards overnight.
10
energ
y efficient h
ou
seho
lds
|S
TA
ND
AR
D H
OU
SE
HO
LD
table 10.13: effect on number of global operating power plants introducing strict energy efficiency standards*BASED ON CURRENTLY AVAILABLE TECHNOLOGY
OECD Europe
OECD North America
OECD Pacific
China
Latin America
Africa
Middle East
Transition Economies
India
Rest dev. Asia
World
HOUSEHOLDS
ELECTRICITYLIGHTING
16
32
5
3
5
3
5
6
2
4
80
ELECTRICITYSTAND BY
11
19
5
3
2
2
2
3
1
2
50
ELECTRICITYAIR
CONDITIONING
11
19
5
3
3
2
3
3
1
2
52
ELECTRICITYSET TOP BOXES
2
3
1
1
0
0
0
1
0
0
9
ELECTRICITYOTHER
APPLIANCES
27
47
13
7
6
4
6
7
3
6
126
ELECTRICITYCOLD
APPLIANCES
15
26
7
4
3
2
3
4
2
3
69
ELECTRICITYCOMPUTERS/
SERVERS
2
4
1
1
1
0
1
1
0
1
11
ELECTRICITYOTHER
23
42
11
6
6
4
6
7
3
5
113
table 10.14: effect on number of global operating power plants introducing strict energy efficiency standards*BASED ON CURRENTLY AVAILABLE TECHNOLOGY
OECD Europe
OECD North America
OECD Pacific
China
Latin America
Africa
Middle East
Transition Economies
India
Rest dev. Asia
World
ELECTRICITYSERVICES
COMPUTERS
8
15
5
1
2
1
1
2
0
2
3
ELECTRICITYSERVICESLIGHTING
30
62
11
3
8
3
6
9
2
7
140
ELECTRICITYSERVICES AIRCONDITIONING
18
34
10
3
4
1
3
4
1
3
81
ELECTRICITYSERVICES
COLDAPPLIANCES
6
11
3
1
1
0
1
1
0
1
27
ELECTRICITYSERVICES
OTHERAPPLIANCES
33
60
18
5
7
2
5
7
1
6
144
ELECTRICITYAGRICULTURE
7
21
1
21
3
6
10
8
14
6
98
TOTAL NUMBEROF COAL FIRED
POWER PLANTSPHASED OUT DUE
TO STRICTEFFICIENCYSTANDARDS
209
397
69
61
52
30
51
62
31
50
1,038
INDUSTRY
106
107
52
144
39
23
8
63
23
33
613
TOTAL INCLINDUSTRY
315
503
148
205
90
53
59
125
54
83
1,651
© T
. MA
RK
OWSK
I/DR
EA
MST
IMEimage DISHWASHER AND OTHER
KITCHEN APPLIANCES.
© S
. CZ
AP
NIK
DR
EA
MST
IME
* 1 POWER PLANT = 750 MWsource WINA GRAUS/ECOFYS
* 1 POWER PLANT = 750 MWsource WINA GRAUS/ECOFYS

160
11transport
GLOBAL REFERENCE SCENARIOFUTURE OF TRANSPORT IN THEENERGY [R]EVOLUTION SCENARIO
“...a mix of lifestylechanges and newtechnologies.”WINA GRAUSECOFYS, THE NETHERLANDS
11
HA
LF
TH
E S
OL
UT
ION
TO
CL
IMA
TE
CH
AN
GE
IS
TH
E S
MA
RT
US
E O
F P
OW
ER
. ©
RE
D20
00/D
RE
AM
STIM
E

161
Transport is a key element in reducing the level of greenhouse gasesproduced by energy consumption. 28% of current energy use comesfrom the transport sector – road, rail and sea. In order to assessthe present status of global transport, including its carbonfootprint, a special study was undertaken by Ecofys.
This chapter gives an overview of how the Ecofys ReferenceScenario was originated and the changes expected under the Energy[R]evolution Scenario. The following chapter looks specifically at thetechnical efficiency potential for cars. The main actions proposed inthe Energy [R]evolution Scenario are: increasing the use of publictransport, especially trains, reducing the number of kilometres driveneach year by private cars, and introducing more efficient vehicles.
the reference scenario for transport
In order to calculate possible savings in the transport sector, wefirst need to construct a detailed Reference Scenario. This needs toinclude detailed shares and energy intensity data per mode oftransport and per region up to 2050. Although this data cannot befound in the IEA WEO, input is available from the WBCSD (WorldBusiness Council for Sustainable Development) mobility database.This database was completed in 2004 after collaboration betweenthe IEA and the WBCSD’s Sustainable Mobility Project to developa global transport model. Those transport options have beenselected which can be expected to result in a substantial reductionin energy demand up to 2050.
In order to estimate the energy demand per transport sub-sector, weneed the modal shares per region up to 2050. These can becalculated by using the WBCSD final energy use per mode, addingthem together and working out the share per mode in % by regionfrom 2005-2050. In the OECD, for example, light duty vehicles(LDVs) account for 57% of total energy use, heavy trucks for 15%.
Since international shipping spreads across all regions of the world,it has been left out whilst calculating the baseline figures. The totalis therefore made up of LDVs, heavy and medium duty freight, twoto three wheel vehicles, buses, minibuses, rail, air and nationalmarine transport. Although energy use from international marinebunkers (international shipping fuel suppliers) is not included inthese calculations, it is still estimated to account for 9% ofworldwide transport final energy demand in 2005 and 7% by2050. A recent UN report concluded that carbon dioxide emissionsfrom shipping are much greater than initially thought andincreasing at an alarming rate. It is therefore very important toimprove the energy efficiency of international shipping. Possibleoptions are examined later in this chapter.
The definitions of different transport modes for this scenario78 are:
• Light-duty vehicles (LDVs) are defined as four-wheel vehiclesused primarily for personal passenger road travel. These aretypically cars, SUVs (Sports Utility Vehicles), small passengervans (up to eight seats) and personal pickup trucks. Within thisreport we will sometimes call light-duty vehicles simply ‘cars’.
• Heavy duty trucks are defined here as long haul trucks operatingalmost exclusively on diesel fuel. These trucks carry large loadswith lower energy intensity (energy use per tonne-kilometre ofhaulage) than medium duty trucks such as delivery trucks.
• Medium duty trucks include medium haul trucks and delivery vehicles.
• Buses have been divided into two size classes - full size buses andminibuses - with the latter roughly encompassing the range ofsmall buses and large passenger vans prevalent around thedeveloping world and typically used for informal transit services.
• All air travel in each region (domestic and international) istreated together.
The Figures below show the breakdown of final energy demand fortransport by mode in 2005 and 2050.
As can be seen from the above figures, the largest share of energydemand comes from cars, although it slightly decreases from 48%in 2005 to 44% in 2050. The share of air transport increases from13% to 19%. Of particular note is the high share of road transportin total transport energy demand: 82% in 2005 and 74% in 2050.The Figures below show world final energy use for the transportsector by region in 2005 and 2050.
11
tran
spo
rt|
RE
FE
RE
NC
E S
CE
NA
RIO•LDV
• HEAVY TRUCKS
• AIR
•MEDIUM TRUCKS
• BUSES
• FREIGHT RAIL
•MINIBUSES
• NATIONAL MARINE
• 2 & 3 WHEELS
• PASSENGER RAIL
figure 11.1: world final energy use per transport mode2005/2050 - reference
44%
1%1%2%2%2%2%
17%
10%
19%
2050
2%4%
9%
48%
13%
17%
2%2%2%
1%
2005
references78 FULTON & EADS (2004)
© G
P/A
. SR
ISOM
WON
GW
ATH
AN
Aimage TRAFFIC JAM IN BANGKOK,THAILAND.

162
GLOBAL ENERGY [R]EVOLUTIONA SUSTAINABLE GLOBAL ENERGY OUTLOOK
As we can see, OECD Europe has the highest final energy use,followed by OECD North America and OECD Pacific. Over time, theshares of these regions will decrease while the shares of all otherregions will increase. In 2050, OECD Europe will still be thelargest final energy user, but now followed by China. Figure 11.3and Figure 11.4 show the forecast worldwide growth of differentpassenger and freight transport modes. Light duty vehicles willremain the most important mode of passenger transport, air,
passenger rail and two wheeled transport are expected to growconsiderably, while three wheeled transport is expected to grow onlyslightly. Buses and minibus passenger transport is expected todecline a little. Heavy duty trucks will remain the most importantmode of freight transport. Freight rail, inland navigation andmedium duty trucks will also increase, but will remain ‘inferior’modes in the Reference Scenario.
11
tran
spo
rt|
RE
FE
RE
NC
E S
CE
NA
RIO
•OECD EUROPE
• OECD NORTH AMERICA
• OECD PACIFIC
• LATIN AMERICA
• DEVELOPING ASIA
•TRANSITION ECONOMIES
• CHINA
•MIDDLE EAST
• INDIA
• AFRICA
figure 11.2: world transport final energy use per region2005/2050 - reference
27%
13%
12%
4%5%
5%
10%
7%
6%
11%
2050
2005
6%
6%
7%
37%
9%
20%
3%4%
5%
3%

163
The growth per mode and region between 2005 and 2050 can be seenin Table 11.1. This shows very large growth percentages for almost allmodes in China and India. The highest forecast growth is predicted forLDV transport in China and India. We can also see that in all regionsair transport is expected to grow significantly up to 2050.
11
tran
spo
rt|
RE
FE
RE
NC
E S
CE
NA
RIO
table 11.1: percentage growth of passenger-km or tonne-km between 2005 and 2050 for different regions and transport mode THE HIGHEST GROWTH PERCENTAGES ARE INDICATED IN COLOUR.
OECD North America
OECD Europe
OECD Pacific
Transition Economies
China
Other Dev. Asia
India
Middle East
Latin America
Africa
World Average (stock-weighted)
LDV
41%
9%
16%
166%
1149%
608%
956%
313%
340%
418%
120%
2WHEELS
64%
7%
14%
96%
174%
136%
226%
165%
226%
447%
150%
3WHEELS
-9%
-9%
-9%
-9%
BUSES
0%
0%
0%
-5%
-5%
-5%
-5%
-5%
-5%
-5%
-3%
MINIBUSES
0%
0%
0%
4%
4%
4%
4%
4%
4%
4%
4%
PASSRAIL
44%
66%
81%
115%
254%
183%
222%
166%
47%
172%
165%
AIR
212%
185%
184%
618%
706%
543%
778%
313%
734%
615%
318%
MEDIUMTRUCKS
119%
87%
119%
288%
550%
400%
560%
189%
267%
351%
224%
HEAVYTRUCKS
119%
87%
119%
302%
550%
400%
560%
189%
267%
351%
190%
FREIGHTRAIL
93%
66%
68%
148%
269%
132%
281%
128%
91%
188%
156%
NAT.MARINE
109%
97%
110%
217%
310%
258%
315%
204%
238%
145%
figure 11.3: time series of growth by mode for passenger transport in passenger-km per yearSCALE IS LOGARITHMIC
Pas
seng
er -
km
per
yea
r
2000 2010 2020 2030 2040 2050
1.0E+14
1.0E+13
1.0E+12
1.0E+11
figure 11.4: time series of growth by mode for freight transport in tonne-km per yearSCALE IS LOGARITHMIC
Tonn
e -
km p
er y
ear
2000 2010 2020 2030 2040 2050
•MEDIUM FREIGHT
• HEAVY FREIGHT
• FREIGHT RAIL
• NATIONAL MARINE
1.0E+14
1.0E+13
1.0E+12
1.0E+11
• LDV
• 2 WHEELS
• 3 WHEELS
• BUSES
•MINIBUSES
• PASSENGER RAIL
• AIR
© I
TALI
AN
EST
RO/
DR
EA
MST
IME
© L
. GIL
LE
S /
DR
EA
MST
IME
image ITALIAN EUROSTAR TRAIN.
image TRUCK.

164
GLOBAL ENERGY [R]EVOLUTIONA SUSTAINABLE GLOBAL ENERGY OUTLOOK
the future of the transport sector in the energy[r]evolution scenario
The Reference Scenario shows that changes in patterns ofpassenger travel are partly a consequence of growing wealth. AsGDP per capita increases, people tend to migrate towards faster,more flexible and more expensive travel modes (from buses andtrains to cars and air). With faster modes, people also tend totravel further and do not reduce the amount of time spenttravelling79. There is also a strong correlation between GDP growthand increases in freight transport. More economic activity willmean more transport of raw materials, intermediary products andfinal consumer goods.
All the above figures and tables illustrate the importance of both amodal shift and a slowing of growth in forecast transport ifemissions reductions are to be achieved. Furthermore, it is veryimportant to make the remaining transport as clean as possible,signalling the role of energy efficiency improvements. Unlimitedgrowth in the transport sector is simply not an option. A shifttowards a sustainable energy system, which respects natural limitsand saves the world’s climate, requires a mix of lifestyle changesand new technologies. We basically need to use our cars less, flyless and use more public transport, as well as cutting down thetransport kilometres for freight transport whilst introducing morenew and highly efficient vehicles.
technical potentials We have looked at three options fordecreasing energy demand in the transport sector:
• Reduction of transport demand.
• Modal shift from high energy intensive transport modes to lowenergy intensity.
• Energy efficiency improvements.
step 1: reduction of transport demand A reduction in transport demand involves reducing passenger-km percapita and reducing freight transport demand. The amount of freighttransport is to a large extent linked to GDP development andtherefore difficult to influence. However, by improved logistics, forexample optimal load profiles for trucks, the demand can be limited.
passenger transport First we must look at reducing passengertransport demand. For this we need to examine the transportdemand per capita in the Reference Scenario, as shown in Table11.3. This shows that transport demand is highest in OECD NorthAmerica, followed by the OECD Pacific. Demand per capita islowest in Africa and India.
The potential for reducing passenger transport demand is very difficultto determine. For OECD countries we have assumed that transportdemand per capita can be reduced by 10% by 2050 in comparison tothe Reference Scenario. For the non-OECD countries we have assumedin the [R]evolution Scenario – as a matter of equity - no reduction intransport demand per capita because the current demand is alreadyquite low in comparison to the OECD. We have made an exception forthe Transition Economies, where we assume that transport demandper capita can be reduced by 5% in 2050.
The table below shows the profile of passenger transport demandper capita in 2005, development under the Reference Scenario by2050 and the reduced transport demand under the [R]evolutionScenario, broken down by region.
Policy measures for reducing passenger transportdemand could include:
• Price incentives that increase transport costs
• Incentives for working from home
• Stimulating the use of video conferencing in businesses
• Improved cycle paths in cities
11
tran
spo
rt|
[R]E
VO
LU
TIO
N S
CE
NA
RIO
table 11.2: selection of measures and indicators
REDUCTION OPTION
Reduction in volume of passengertransport in comparison to theReference Scenario
Reduction in volume of freighttransport in comparison toReference Scenario
Modal shift from trucks to rail
Modal shift from cars to public transport
Efficient passenger cars (hybrid fuel cars)
Efficient buses
Efficiency improvements in aircraft
Efficient freight vehicles
Efficiency improvements in ships
INDICATOR
Passengerkm/capita
Tonne-km/unit of GDP
MJ/tonne km
MJ/passenger km
MJ/vehicle km
MJ/passenger km
MJ/passenger km
MJ/tonne km
MJ/tonne km
MEASURE
Reduction oftransport demand
Modal shift
Energy efficiencyimprovements
table 11.3: passenger transport demand per capita (P-KM PER CAPITA)
[R]EVOLUTIONSCENARIO
2050
26,400
22,200
16,100
14,800
REFERENCE SCENARIO2050
27,800
23,400
17,000
15,600
2005
20,800
15,200
12,900
6,700
REGION
OECD North America
OECD Pacific
OECD Europe
Transition Economies
Latin America
China
Middle East
Rest dev. Asia
India
Africa
references79 OECD/IEA, 2007

165
freight transport In the Reference Scenario the largest absoluteincrease in freight transport demand is expected in the TransitionEconomies, whilst the largest percentage increase is forecast in China(383%). The potential for reducing demand for freight transport byimproved logistics is difficult to estimate. For the [R]evolutionScenario we have assumed that freight transport demand can bereduced by 5% in comparison to the Reference Scenario, althoughonly through measures in the OECD and Transition Economies.
step 2: changes in transport mode In order to decide which vehicles or transport systems are the mosteffective for each purpose, an analysis of the different technologiesis needed. To calculate the energy savings achieved by shiftingtransport mode we need to know the energy use and intensity foreach type of transport80. The following information is needed:
• Passenger transport: Energy demand per passenger kilometre,measured in MJ/p-km.
• Freight transport: Energy demand per kilometre of transportedtonne of goods, measured in MJ/ tonne-km.
development of passenger transport Passenger transport includescars, minibuses, two and three wheelers, buses, passenger rail and airtransport. Freight transport includes medium trucks, heavy trucks,national marine and freight rail. The figures below show a breakdownof passenger transport by mode in the Reference Scenario for 2005and 2050 (as % of total passenger-km). The global demand for airtransport is expected to grow from 12% in 2005 to 23% in 2050.
11
tran
spo
rt|
[R]E
VO
LU
TIO
N S
CE
NA
RIO
figure 11.5: demand for freight transport in the reference scenario (IN TONNE-KM PER CAPITA)
25,000
20,000
15,000
10,000
5,000
0
OE
CD
Nor
th A
mer
ica
OE
CD
Pac
ific
Tran
isit
ion
Eco
nom
ies
OE
CD
Eur
ope
Lat
in A
mer
ica
Chi
na
Mid
dle
Eas
t
Dev
elop
ing
Asi
a
Indi
a
Afr
ica
Frei
ght
dem
and
(t.k
m /
capi
ta)
figure 11.6: breakdown of passenger transport by mode in 2005(IN % SHARE OF PASSENGER KM)
100%
90%
80%
70%
60%
50%
40%
30%
20%
10%
0
OE
CD
Nor
th A
mer
ica
OE
CD
Eur
ope
OE
CD
Pac
ific
Tran
siti
on E
cono
mie
s
Chi
na
Dev
elop
ing
Asi
a
Indi
a
Mid
dle
Eas
t
Lat
in A
mer
ica
Afr
ica
Wor
ld A
vera
ge (
stoc
k-w
eigh
ted)
•2005
• 2050
figure 11.7: breakdown of passenger transport by mode in 2050 (IN % SHARE OF PASSENGER KM)
100%
90%
80%
70%
60%
50%
40%
30%
20%
10%
0
OE
CD
Nor
th A
mer
ica
OE
CD
Eur
ope
OE
CD
Pac
ific
Tran
siti
on E
cono
mie
s
Chi
na
Dev
elop
ing
Asi
a
Indi
a
Mid
dle
Eas
t
Lat
in A
mer
ica
Afr
ica
Wor
ld A
vera
ge (
stoc
k-w
eigh
ted)
•AIR
• PASSENGER RAIL
•MINIBUSES
• BUSES
• 3 WHEELS
• 2 WHEELS
• CARS
© A
.YA
RM
OLE
NK
O/D
RE
AM
STIM
Eimage BELGIAN COASTAL TRAMWAY.
image HIGHWAY IN ISRAEL.
© P
ICC
AY
A/D
RE
AM
STIM
E
references80 WBCSD PROVIDES ESTIMATES FOR ENERGY INTENSITIES PER MODE

166
GLOBAL ENERGY [R]EVOLUTIONA SUSTAINABLE GLOBAL ENERGY OUTLOOK
travelling by rail is the most efficient Figure 11.8 shows theworldwide average specific energy consumption by transport modeunder the Reference Scenario in 2005 and 2050. This data differsfor each region. As can be seen, the difference in specific energyconsumption for each transport mode is large. Passenger transportby rail will consume 85% less energy in 2050 than car transportand by bus nearly 70% less energy. This means that there is a largeenergy savings potential to be realised by a modal shift.
modal shift for passengers in the energy [r]evolution scenarioFrom the figures above we can conclude that in order to reducetransport energy demand by modal shift, passengers have to move fromcars and air transport to the lower intensity passenger rail and bustransport. As an indication of the action required we can take Japan asa ‘best practice country’. In 2004, Japan had a large share of p-km byrail (29%) thanks to the fact that it had established a strong urban andregional rail system81. Comparing different regions with the example ofJapan, and assuming that 40 years is enough time to build up anextensive rail network, the following modal shifts have been assumed:
This means that in the Energy [R]evolution Scenario 2.5% of cartransport shifts to rail and 2.5% to bus. In total this means a reductionin car transport of 7.5% in comparison to the Reference Scenario.
11
tran
spo
rt|
[R]E
VO
LU
TIO
N S
CE
NA
RIO
table 11.4: passenger modal shifts assumed in [r]evolution scenario
[R]EVOLUTION SCENARIO
2.5%
2.5%
2.5%
TRANSPORT
From air to rail (short distances)
From car to rail
From car to bus
figure 11.8: world average (stock-weighted) passengertransport energy intensity for 2005 and 2050.
3.0
2.5
2.0
1.5
1.0
0.5
0
Car
s
Air
3-w
heel
s
Bus
es
2-w
heel
s
Min
i-bu
ses
Pas
seng
er r
ail
MJ
/ p.k
m
•2005
• 2050
references81 OECD/IEA, 2007

167
© M
AR
INOM
AR
INI/D
RE
AM
STIM
Eimage TRAIN SIGNALS.
transporting goods by rail is the most efficient Figure 11.12shows the energy intensity for world average freight transport in2005 and 2050 under the Reference Scenario. Energy intensity forall modes of transport is expected to decrease by 2050.
modal shift for transporting goods in the energy [r]evolutionscenario From the figures above we can conclude that in order toreduce transport energy demand by modal shift, freight has to movefrom medium and heavy duty trucks to the less energy intensivefreight rail and national marine. Canada is a ‘best practice’ countryin this respect, with 29% of freight transported by trucks, 39% byrail and 32% by ships. Since the use of ships largely depends onthe geography of the country, we do not propose a modal shift fornational ships but instead a shift towards freight rail. China, OECDPacific and the Transition Economies already have a low share oftruck usage, so for these regions we will not assume a modal shift.For the other regions we have assumed the following changes:
freight transport Figures 11.9 and 11.10 show the breakdown offreight transport in percentages of total tonnes-km per year and byregion under the Reference Scenario. Both the Transition Economiesand China have a very large proportion of rail transport while theDeveloping Asia and the Middle East have a very small share. Theshare of heavy and medium trucks is very large in the Developing Asiacountries and OECD Europe. National marine transport plays animportant role in the OECD Pacific. The figures also show that thedifference between 2005 and 2050 is relatively small.
11
tran
spo
rt|
[R]E
VO
LU
TIO
N S
CE
NA
RIO
table 11.5: freight modal shift in the [r]evolutionscenario for all regions EXCEPT CHINA, THE TRANSITION ECONOMIES AND OECD PACIFIC
[R]EVOLUTION SCENARIO
+ 5%
+ 2.5%
TRANSPORT
From medium trucks to rail
From heavy trucks to rail
figure 11.9: breakdown of freight transport by mode in 2005 (IN % SHARE OF TONNE KM)
100%
90%
80%
70%
60%
50%
40%
30%
20%
10%
0
OE
CD
Nor
th A
mer
ica
OE
CD
Eur
ope
OE
CD
Pac
ific
Tran
siti
on E
cono
mie
s
Chi
na
Dev
elop
ing
Asi
a
Indi
a
Mid
dle
Eas
t
Lat
in A
mer
ica
Afr
ica
Wor
ld A
vera
ge (
stoc
k-w
eigh
ted)
•NATIONAL MARINE
• FREIGHT RAIL
• HEAVY TRUCKS
•MEDIUM TRUCKS
figure 11.10: breakdown of freight transport by mode in 2050 (IN % SHARE OF TONNE KM)
100%
90%
80%
70%
60%
50%
40%
30%
20%
10%
0
OE
CD
Nor
th A
mer
ica
OE
CD
Eur
ope
OE
CD
Pac
ific
Tran
siti
on E
cono
mie
s
Chi
na
Dev
elop
ing
Asi
a
Indi
a
Mid
dle
Eas
t
Lat
in A
mer
ica
Afr
ica
Wor
ld A
vera
ge (
stoc
k-w
eigh
ted)
figure 11.12: world average (stock-weighted) freighttransport energy intensity in 2005 and 2050
6.0
5.0
4.0
3.0
2.0
1.0
0.0
Med
ium
tru
cks
Hea
vy t
ruck
s
Nat
iona
l mar
ine
Frei
ght
rail
MJ
/ t.k
m•2005
• 2050

168
GLOBAL ENERGY [R]EVOLUTIONA SUSTAINABLE GLOBAL ENERGY OUTLOOK
marine transport Since the WBCSD did not provide estimates fortotal national marine tonnes-km per year or energy intensities perregion, we have calculated these ourselves. Data for energy intensityfor the year 2005 in OECD countries was found in OECD/IEA, 2007.For other regions we have assumed that the highest OECD estimatewould hold. The 2050 intensities were extrapolated from 2005 datausing 1% per year autonomous efficiency improvement. The amountof t-km per year could then be calculated using the ReferenceScenario energy use divided by the energy intensity in MJ/t-km.
step 3: efficiency improvements or travelling with less energyEnergy efficiency improvements are the third important way ofreducing transport energy demand. This section explains thedifferent possibilities for improving energy efficiency82 up to 2050for each type of transport:
• Air transport
• Passenger and freight trains
• Buses and mini-buses
• Trucks
• Ships for marine transport
• Motorcycles
• Cars
air transport Savings for air transport have been taken fromAkerman, 2005. He reports that a 65% reduction in fuel use istechnically feasible by 2050. This has been applied to 2005 energyintensity data in order to calculate the technical potential. Thefigure below shows the energy intensity per region in the ReferenceScenario and in the two low energy demand scenarios.
All regions have the same energy intensities in 2005 due to lack ofregionally-differentiated data. Numbers shown are a global average.The projection of future energy intensity is based on IEA data over the1990-2000 period, when intensity improved at about 0.7% per year.
11
tran
spo
rt|
[R]E
VO
LU
TIO
N S
CE
NA
RIO
© S
KY
SA
ILS
figure 11.13: energy intensities (MJ/p-km) for airtransport in the reference and [r]evolution scenarios
3.0
2.5
2.0
1.5
1.0
0.5
0.0
OE
CD
Eur
ope
OE
CD
Nor
th A
mer
ica
OE
CD
Pac
ific
Tran
siti
on E
cono
mie
s
Chi
na
Indi
a
Dev
elop
ing
Asi
a
Lat
in A
mer
ica
Afr
ica
Mid
dle
Eas
t
Wor
ld A
vera
ge (
stoc
k-w
eigh
ted)
•2005
• REFERENCE 2050
• [R]EVOLUTION 2050
•TECHNICAL 2050
Air
ene
rgy
inte
nsit
y M
J/p-
km
Introduced to commercial operation in 2007, the SkySails system allowswind power, which has no fuel costs, to contribute to the motive power oflarge freight-carrying ships, which currently use increasingly expensiveand environmentally damaging oil. Instead of a traditional sail fitted to amast, the system uses large towing kites to contribute to the ship’spropulsion. Shaped like paragliders, they are tethered to the vessel byropes and can be controlled automatically, responding to wind conditionsand the ship’s trajectory.
The kites can operate at altitudes of between 100 and 300 metres,where stronger and more stable winds prevail. By means of dynamicflight patterns, the SkySails are able to generate five times morepower per square metre of sail area than conventional sails. Dependingon the prevailing winds, the company claims that a ship’s averageannual fuel costs can be reduced by 10 to 35%. Under optimal windconditions, fuel consumption can temporarily be cut by up to 50%.
On the first voyage of the Beluga SkySails, a 133m long speciallybuilt cargo ship, the towing kite propulsion system was able totemporarily substitute for approximately 20 % of the vessel’s mainengine power, even in moderate winds. The company is now planninga kite twice the size of this 160m2 pilot.
The designers say that virtually all sea-going cargo vessels can beretro- or outfitted with the SkySails propulsion system withoutextensive modifications. If 1,600 ships would be equiped with thesesails by 2015 ,it would save over 146 million tonnes of CO2 a year,equivalent to about 15% of Germany’s total emissions.
case 11.1: wind powered ships
references82 FOR THE [R]EVOLUTION SCENARIO WE BASE THE POTENTIAL ON IMPLEMENTING80% OF THE ENERGY EFFICIENCY IMPROVEMENTS, UNLESS OTHERWISE SPECIFIED.

169
passenger and freight trains Savings for passenger and freightrail transport have been taken from Fulton & Eads (2004). Theyreport a historic improvement in the fuel economy of passenger railof 1% per year and for freight rail of between 2 and 3% per year.Since no other studies are available we have assumed for theTechnical scenario a 1% improvement of in energy efficiency peryear for passenger rail and 2.5% for freight rail. The figure belowshows the energy intensity per region in the Reference Scenario andin the two low energy demand scenarios.
freight rail Savings for freight rail are taken from the same studyas for passenger rail. They report a historic improvement in the fueleconomy of freight rail of between 2 and 3% per year. Since noother studies are available we have assumed for the Technicalscenario a 2.5% improvement in energy efficiency per year. Thefigure below shows the energy intensity per region in the ReferenceScenario and in the two low energy demand scenarios.
Energy intensities for passenger rail transport are assumed to be thesame for all regions due to a lack of sufficiently detailed data. Thedifferentiation in energy intensity for freight rail is based on thefollowing assumption: regions with longer average distances for freightrail (such as the US and Former Soviet Union), and where more rawmaterials are transported (such as coal), show a lower energy intensitythan other regions (Fulton & Eads, 2004). Future projections use tenyear historic IEA data. Rail intensities are and will remain highest inOECD Europe and OECD Pacific and lowest in India.
11
tran
spo
rt|
[R]E
VO
LU
TIO
N S
CE
NA
RIO
figure 11.14: energy intensities for passenger railtransport in the reference and [r]evolution scenarios
0.35
0.30
0.25
0.20
0.15
0.10
0.05
0.0
OE
CD
Eur
ope
OE
CD
Nor
th A
mer
ica
OE
CD
Pac
ific
Tran
siti
on E
cono
mie
s
Chi
na
Indi
a
Dev
elop
ing
Asi
a
Lat
in A
mer
ica
Afr
ica
Mid
dle
Eas
t
Wor
ld A
vera
ge (
stoc
k-w
eigh
ted)
•2005
• REFERENCE 2050
• [R]EVOLUTION 2050
•TECHNICAL 2050
Pas
seng
er r
ail e
nerg
y in
tens
ity
MJ/
p-km
figure 11.15: reference scenario and 2050 technicalpotential energy intensities for different regions for freight rail transport
0.45
0.40
0.35
0.30
0.25
0.20
0.15
0.10
0.05
0.0
OE
CD
Eur
ope
OE
CD
Nor
th A
mer
ica
OE
CD
Pac
ific
Tran
siti
on E
cono
mie
s
Chi
na
Indi
a
Dev
elop
ing
Asi
a
Lat
in A
mer
ica
Afr
ica
Mid
dle
Eas
t
Wor
ld A
vera
ge (
stoc
k-w
eigh
ted)
•2005
• REFERENCE 2050
• [R]EVOLUTION 2050
•TECHNICAL 2050
Frei
ght
rail
ener
gy in
tens
ity
MJ/
p-km
© G
RA
FIK
ER
AY/D
RE
AM
STIM
E
© V
. DU
DE
NK
O/D
RE
AM
STIM
Eimage CONTAINER SHIP.
image FREIGHT TRAINS.

170
GLOBAL ENERGY [R]EVOLUTIONA SUSTAINABLE GLOBAL ENERGY OUTLOOK
buses and minibuses The company Enova Systems is promoting a‘clean bus’ with a 100% improvement in fuel economy. We haveadopted this improvement and applied it to 2005 energy intensitynumbers per region. For minibuses the American Council for anEnergy Efficient Economy reports83 a fuel economy improvement of55% by 2015. Since this is a very ambitious target and will mostlikely not be reached, we have extended it up to 2050 and adopted itas the technical potential (see Figure 11.16 and Figure 11.17).Currently, buses in North America consume far and away the mostenergy. The Reference Scenario predicts an increase in all regionsbetween 2005 and 2050. Although in general more efficient buses arebeing produced, this is offset by increases in average bus size, weightand power. OECD buses have much more powerful engines than non-OECD buses, but the latter are likely to catch up over this period.
11
tran
spo
rt|
[R]E
VO
LU
TIO
N S
CE
NA
RIO
trucks (freight by road) Elliott et al., 2006 give possible savingsfor heavy and medium-duty freight trucks. This list of reductionoptions is expanded in Lensink and De Wilde, 2007. For mediumduty trucks a fuel economy saving of 50% is reported by 2030(mainly due to hybridisation). We applied this percentage to 2005energy intensity data, calculated the fuel economy improvement peryear and extrapolated this yearly growth rate up to 2050. For heavyduty trucks we applied the same methodology, arriving at a 39%savings. Current intensities are highest in the Middle East, India andAfrica and lowest in OECD North America. The Reference Scenariopredicts that future values will converge, assuming past improvementpercentages and assuming a higher learning rate in developingregions. The figures below show the energy intensity per region in theReference Scenario and in the two low energy demand scenarios.
figure 11.16: energy intensities for buses in thereference and [r]evolution scenarios
1.2
1.0
0.8
0.6
0.4
0.2
0.0
OE
CD
Eur
ope
OE
CD
Nor
th A
mer
ica
OE
CD
Pac
ific
Tran
siti
on E
cono
mie
s
Chi
na
Indi
a
Dev
elop
ing
Asi
a
Lat
in A
mer
ica
Afr
ica
Mid
dle
Eas
t
Wor
ld A
vera
ge (
stoc
k-w
eigh
ted)
Bus
es e
nerg
y in
tens
ity
MJ/
p-km
figure 11.18: reference scenario and 2050 technicalpotential energy intensities for different regions for medium duty freight transport
8
7
6
5
4
3
2
1
0
OE
CD
Eur
ope
OE
CD
Nor
th A
mer
ica
OE
CD
Pac
ific
Tran
siti
on E
cono
mie
s
Chi
na
Indi
a
Dev
elop
ing
Asi
a
Lat
in A
mer
ica
Afr
ica
Mid
dle
Eas
t
Wor
ld A
vera
ge (
stoc
k-w
eigh
ted)
Med
ium
fre
ight
ene
rgy
inte
nsit
y M
J/t-
km
figure 11.19: reference scenario and 2050 technicalpotential energy intensities for different regions for heavy duty freight transport
2.5
2.0
1.5
1.0
0.5
0.0
OE
CD
Eur
ope
OE
CD
Nor
th A
mer
ica
OE
CD
Pac
ific
Tran
siti
on E
cono
mie
s
Chi
na
Indi
a
Dev
elop
ing
Asi
a
Lat
in A
mer
ica
Afr
ica
Mid
dle
Eas
t
Wor
ld A
vera
ge (
stoc
k-w
eigh
ted)
Hea
vy f
reig
ht e
nerg
y in
tens
ity
MJ/
t-km
figure 11.17: energy intensities for minibuses in the reference and [r]evolution scenarios
1.2
1.0
0.8
0.6
0.4
0.2
0.0
OE
CD
Eur
ope
OE
CD
Nor
th A
mer
ica
OE
CD
Pac
ific
Tran
siti
on E
cono
mie
s
Chi
na
Indi
a
Dev
elop
ing
Asi
a
Lat
in A
mer
ica
Afr
ica
Mid
dle
Eas
t
Wor
ld A
vera
ge (
stoc
k-w
eigh
ted)
Min
ibus
es e
nerg
y in
tens
ity
MJ/
p-km
references83 DECICCO ET AL., 2001.

171
marine transport National marine savings have also been takenfrom the Lensink and De Wilde study. They report 20% savings in2030 for inland navigation as a realistic potential with currentlyavailable technology, and ultimate efficiency savings of up to 30%for the current fleet. To arrive at the potential in 2050, we used thesame approach as described for road freight above. OECD Pacifichas the lowest current energy intensity due to the fact that theyhave a large proportion of long haul trips where larger (less energyintensive) boats can be used. All energy intensities are expected toimprove by 1% per year up to 2050. Reference Scenario energyintensities and the technical potentials for national marinetransport are shown in Figure 11.20.
© S
UL
JO/D
RE
AM
STIM
E
image FREIGHT TRUCK.
11
tran
spo
rt|
[R]E
VO
LU
TIO
N S
CE
NA
RIO
motorcycles For two wheelers we have based the potential onIEA/SMP (2004), where 0.3 MJ/p.km is the lowest value. Forthree wheelers we have assumed that the technical potential is 0.5MJ/p.km in 2050. The uncertainty in these potentials is high,although two and three wheelers only account for 1.5% oftransport energy demand.
The figures below show the energy intensity per region in theReference Scenario and in the two low energy demand scenarios.
171
figure 11.21: energy intensities for two wheelers in the reference and [r]evolution scenarios
16
1.4
1.2
1.0
0.8
0.6
0.4
0.2
0.0
OE
CD
Eur
ope
OE
CD
Nor
th A
mer
ica
OE
CD
Pac
ific
Tran
siti
on E
cono
mie
s
Chi
na
Indi
a
Dev
elop
ing
Asi
a
Lat
in A
mer
ica
Afr
ica
Mid
dle
Eas
t
Wor
ld A
vera
ge (
stoc
k-w
eigh
ted)
2-w
heel
ene
rgy
inte
nsit
y M
J/p-
km
figure 11.20: reference scenario and 2050 technicalpotential energy intensities for different regions for national marine transport
2.0
1.8
1.6
1.4
1.2
1.0
0.8
0.6
0.4
0.2
0.0
OE
CD
Eur
ope
OE
CD
Nor
th A
mer
ica
OE
CD
Pac
ific
Tran
siti
on E
cono
mie
s
Chi
na
Indi
a
Dev
elop
ing
Asi
a
Lat
in A
mer
ica
Afr
ica
Mid
dle
Eas
t
Wor
ld A
vera
ge (
stoc
k-w
eigh
ted)
•2005
• REFERENCE 2050
• [R]EVOLUTION 2050
•TECHNICAL 2050
Nat
iona
l mar
ine
ener
gy in
tens
ity
MJ/
t-km
figure 11.22: energy intensities for three wheelers in the reference and [r]evolution scenarios
1.0
0.9
0.8
0.7
0.6
0.5
0.4
0.3
0.2
0.1
0.0
OE
CD
Eur
ope
OE
CD
Nor
th A
mer
ica
OE
CD
Pac
ific
Tran
siti
on E
cono
mie
s
Chi
na
Indi
a
Dev
elop
ing
Asi
a
Lat
in A
mer
ica
Afr
ica
Mid
dle
Eas
t
Wor
ld A
vera
ge (
stoc
k-w
eigh
ted)
3-w
heel
ene
rgy
inte
nsit
y M
J/p-
km

172
GLOBAL ENERGY [R]EVOLUTIONA SUSTAINABLE GLOBAL ENERGY OUTLOOK
passenger cars This section is based on a special study conductedby the DLR’s Institute for Vehicle Concepts to investigate thepotential for improving the efficiency of existing cars and movingtowards greater use of hybrid or electric vehicles. See Chapter 12for a full account of this analysis.
Many technologies can be used to improve the fuel efficiency ofpassenger cars. Examples include improvements in engines, weightreduction and friction and drag reduction84. The impact of the variousmeasures on fuel efficiency can be substantial. Hybrid vehicles,combining a conventional combustion engine with an electric engine,have relatively low fuel consumption. The most well-known is theToyota Prius, which originally had a fuel efficiency of about five litresof gasoline-equivalent per 100 km (litre ge/100 km). Recently, Toyotapresented an improved version with a lower fuel consumption of 4.3litres ge/100 km. Further developments are underway, as shown bythe presentation of new concept cars by the main US carmanufacturers in 2000 with a specific fuel use as low as three litresge/100 km. There are suggestions that applying new lightweightmaterials, in combination with the new propulsion technologies, canbring fuel consumption levels down to 1 litre ge/100 km.
Based on SRU (2005), the technical potential in 2050 for a dieselfuelled car is 1.6 and for a petrol car 2.0 litres ge/100 km. Based onthe sources in Table 11.6, we have assumed 2.0 litres as the technicalpotential for Europe and adopted the same improvement in efficiency(about 3% per year) for other regions. In order to reach this targetin time, these more efficient cars need to be on the market by 2030 –assuming that the maximum lifetime of a car is 20 years.
the energy [r]evolution scenario for passenger cars The figurebelow gives the energy intensity for cars in the Reference Scenarioand in the two alternative scenarios.
11
tran
spo
rt|
[R]E
VO
LU
TIO
N S
CE
NA
RIO
table 11.6: efficiency of cars and new developments (BLOK, 2004)
FUEL CONSUMPTION (LITRES GE/100 KM)
10.4
~5 (1997)4.3 (2003)
2 – 3
0.8 - 1.6
SOURCE
IEA/SMP (2004)
EPA (2003)
USCAR (2002) Weiss et al (2000)
Von Weizsäcker et al (1998)
BEST PRACTICECURRENT & FUTUREEFFICIENCIES
Present average
Hybrids on the market(medium-sized cars)
Improved hybrids or fuelcell cars (average car)
Ultralights
figure 11.23: energy intensities (litres ge/v-km) for carsin the reference and [r]evolution scenarios
16
14
12
10
8
6
4
2
0
OE
CD
Eur
ope
OE
CD
Nor
th A
mer
ica
OE
CD
Pac
ific
Tran
siti
on E
cono
mie
s
Chi
na
Indi
a
Dev
elop
ing
Asi
a
Lat
in A
mer
ica
Afr
ica
Mid
dle
Eas
t
Wor
ld A
vera
ge (
stoc
k-w
eigh
ted)
•2005
• REFERENCE 2050
• [R]EVOLUTION 2050
•TECHNICAL 2050
LD
V f
reig
ht e
nerg
y in
tens
ity
MJ/
t-km
references84 DECICCO ET AL., 2001.

173
The table below gives a summary of the energy efficiency improvementfor freight transport in the two low energy demand scenarios.
summary of energy savings in the transport sectorin the energy [r]evolution scenario
The table below gives a summary of the energy efficiency improvementfor passenger transport in the two low energy demand scenarios.
The energy intensities for car passenger transport are currentlyhighest in OECD North America and Africa and lowest in OECDEurope. The Reference Scenario shows a decrease in energyintensities in all regions, but the division between highest and lowestwill remain the same, although there will be some convergence. Wehave assumed that the occupancy rate for cars remains the same asin 2005, as shown in the figure below.
11
tran
spo
rt|
[R]E
VO
LU
TIO
N S
CE
NA
RIO
table 11.7: technical efficiency potential for worldpassenger transport
[R]EVOLUTIONSCENARIO
2050
3.9
0.9
1.2
0.3
0.3
0.3
0.5
0.2
REFERENCE SCENARIO2050
8.5
2.0
1.9
0.6
0.6
0.6
0.7
0.3
2005
10.4
2.2
2.6
0.5
0.5
0.5
0.7
0.3
MJ/P-KM
Cars (L/100 v-km)
Cars (MJ/p-km)
Air
Buses
Mini-buses
Two wheels
Three wheels
Passenger rail
table 11.8: technical efficiency potential for world freight transport
[R]EVOLUTIONSCENARIO
2050
2.3
0.7
0.1
0.5
REFERENCE SCENARIO2050
3.9
1.3
0.2
0.5
2005
5.4
1.7
0.2
0.7
MJ/P-KM
Medium trucks
Heavy trucks
Freight rail
National marine
figure 11.24: car occupancy rate in 2005
2.0
1.8
1.6
1.4
1.2
1.0
0.8
0.6
0.4
0.2
0.0
OE
CD
Eur
ope
OE
CD
Nor
th A
mer
ica
OE
CD
Pac
ific
Tran
siti
on E
cono
mie
s
Chi
na
Indi
a
Dev
elop
ing
Asi
a
Lat
in A
mer
ica
Afr
ica
Mid
dle
Eas
t
Wor
ld A
vera
ge (
stoc
k-w
eigh
ted)
© P
N_P
HOT
O/D
RE
AM
STIM
E
image AIRPLANE FLYING OVERHIGHWAY.
image TRANSPORTING CARGO AND OIL.
© M
. LA
PT
EV
/DR
EA
MST
IME

174
12cars of the future
GLOBAL METHODOLOGYENERGY [R]EVOLUTION CAR SCENARIO
“if we’re serious aboutfacing up to climatechange, we need toimprove ALL our cars.”GREENPEACE INTERNATIONALCLIMATE CAMPAIGN
12
MO
VIN
G T
OW
AR
DS
ALT
ER
NA
TIV
ES
NO
LO
NG
ER
BA
SE
D O
N F
OS
SIL
FU
EL
S.
© O
. MIE
RN
Y/D
RE
AM
STIM
E

175
Since the global use of privately owned cars (light duty vehicles)currently accounts for more carbon dioxide emissions than any otherform of transport, the DLR’s Institute for Vehicle Concepts wascommissioned to look specifically at the potential for reductions inthis sector. At the same time, the door has already been opened forboth major technological changes and shifts in personal habits.Rising oil prices, increasing concern about climate change and, insome regions, legislation on everything from bio fuels to vehicleemissions, have together combined to put pressure on internationalvehicle manufacturers to investigate solutions. Numerous technicalfixes are already in production which can improve the efficiency ofthe predominant internal combustion engine, as well as movingtowards alternatives no longer based on fossil fuels.
This specific study of the light duty vehicle market concludes that anumber of measures could help reduce the CO2 emissions from carsvery significantly to a target level of about 80 g CO2 per km for theEuropean Union. These measures include a major shift to vehiclespowered by (renewable) electricity, a range of efficiencyimprovements to the power trains of existing internal combustionengines and behavioural changes leading to an overall reduction inkilometres travelled.
methodology
The DLR developed a global scenario for cars based on a detailedbottom-up model covering ten world regions. The aim was toproduce a challenging but feasible scenario which would lowerglobal CO2 emissions within the context of the overall emissionreduction objective. Cars contribute about 45% of the greenhousegas emissions from the entire transport sector, the largestproportion of any mode.
This approach takes into account a vast range of technicalmeasures to reduce the energy consumption of vehicles, but alsoconsiders the dramatic increase in vehicle ownership and annualmileage taking place in developing countries. The turnover ofreplacement vehicles has been modelled over five year stages from2005 to 2050. The scenario assumes that a large share ofrenewable electricity is available in the future. The majorparameters for achieving increased efficiency are:
• vehicle technology
• alternative fuels
• changes in sales by vehicle size
• changes in vehicle kilometres travelled
This section will examine the development of the world’s car fleet inmore detail and is focused on non-technical as well as technicalsolutions. Light duty vehicles and their technologies are divided intothree vehicle segments (small, medium and large) and ninecategories of fuel/propulsion technology:
• conventional petrol
• petrol hybrid
• conventional diesel
• diesel hybrid
• LPG/CNG (Liquefied Petroleum Gas/Compressed Natural Gas)
• LPG/CNG hybrid
• fuel cell hydrogen
• battery electric
• plug in-hybrid electric vehicles
As a Reference Scenario for the starting point in 2005, the analysis inthe IEA/SMP model85 has been used. This is the most comprehensive anddetailed model available for CO2 emissions from the global transportsector. For those technologies not included in the SMP model, we had todecide starting points for today’s performance values (see below). Wethen created so-called ‘target reference vehicles’ (TRVs), which projectthe energy consumption feasible for each of the main fuel conversiontechnologies. This is described in the section ‘Future vehicle technologies’.The TRVs will be introduced in the different regions of the world over avarying timescale. In general, the technologies to achieve the TRVs areaimed to be available for sale in 2050 - 42 years from now.
In general, we have first introduced the most recent - and mostexpensive - technologies in the currently industrialised countries, andpostponed their introduction in the rest of the world. We have then usedthe option to change the energy source used to fuel light duty transport.This is described in the section ‘Projection of future technology mix’.Various non-technical measures are reflected in the projections forfuture vehicle sales (see ‘Projection of vehicle segment split’), in theprojection for the absolute number of vehicles sold in the future (see‘Projection of global vehicle stock development’) and in the projectionof how much individual vehicles are used compared to other transportmeans in the future (see ‘Projection of kilometres driven’).
reference scenario
The IEA Reference Scenario developed for the Mobility 2030 project86
was used as the starting point for the year 2005 key data and forcomparison as a ‘business as usual’ scenario. It is important to note thatfor this scenario no major new policies were assumed to be implementedbeyond those already introduced by 2003. While for some areas, such aspollution control, further so called policy trajectories have beenassumed, this was not the case for fuel consumption. Trends in futurefuel consumption are therefore based on historical (non-policy driven)trends87. If the serious discussions taking place in Europe and the UnitedStates on the regulation of fuel economy in new vehicles, together withlegal guidelines and proposed long term targets, were taken intoaccount, the business as usual case would be different. However, it isbeyond the scope of this project to redefine the status quo. Nevertheless,we include the most recent political targets in our scenario.
12
cars o
f the fu
ture
|M
ET
HO
DO
LO
GY
references85 FULTON, L. (2004): THE IEA/SMP TRANSPORTATION MODEL; FULTON, L. AND G. EADS(2004): IEA/SMP MODEL DOCUMENTATION AND REFERENCE CASE PROJECTION.86 WBCSD (2004): MOBILITY 2030: MEETING THE CHALLENGES TO SUSTAINABILITY,WORLD BUSINESS COUNCIL FOR SUSTAINABLE DEVELOPMENT.87 FULTON, L. AND G. EADS (2004): IEA/SMP MODEL DOCUMENTATION AND REFERENCECASE PROJECTION
© G
P
image DESIGNS FOR A CLEVER ENGINE.

energy [r]evolution car scenario
The alternative car scenario is targeted towards high CO2
reductions compared to today’s levels. Summarised in brief, wehave focused on the following proposals:
• Efficiency improvements resulting from technological development
• Renewable electricity as the primary alternative fuel
• Influencing customer behaviour in the long term
There is a huge potential for technological options to make today’svehicles more efficient while lowering their CO2 emissions. A cartoday converts the energy in the fuel into mechanical energy inorder to take the compartment we sit in from point A to B, but itdoes it in a very inefficient way. Only 25% to 35% of the chemicalenergy in the fuel is converted into mechanical energy by theengine. The rest is lost as waste heat. Only 10% of the fuel energyis used to overcome driving resistance. Hybrid technologies mark animportant starting point for making vehicles more efficient, whilsttechnologies to lower energy demand, such as lightweight design,reduced rolling resistance wheels and improved aerodynamics, willcontribute to the achievement of very low fuel consumptions.
Renewable electricity can be produced almost everywhere in theworld, and with declining costs in the future. Taking into accountthe enormous development in batteries in recent years, we believethat electric mobility as offered by battery electric cars and plug-inhybrid electric vehicles is the preferred way to make majorreductions in the CO2 emissions of cars.
Consumer behaviour is the third major key to a lower carbon worldfor the transport sector. Here we have relied on programmes,incentives and policy measures to support a shift towards lowcarbon emitting vehicles as well as reducing demand in general.
176
GLOBAL ENERGY [R]EVOLUTIONA SUSTAINABLE GLOBAL ENERGY OUTLOOK
Current starting point values for the world’s regions and vehicletypes are presented in Figure 12.2.
12
cars o
f the fu
ture
|M
ET
HO
DO
LO
GY
figure 12.1: well-to-wheel CO2 emissions from the lightduty fleet as projected in the reference scenario
7,000
6,000
5,000
4,000
3,000
2,000
1,000
Mt 02000 2010 2020 2030 2040 2050
•MIDDLE EAST
• AFRICA
• LATIN AMERICA
• DEVELOPING ASIA
• INDIA
• CHINA
•TRANSITION ECONOMIES
• OECD PACIFIC
• OECD NORTH AMERICA
• OECD EUROPE
figure 12.2: reference values for CO2 emissions for 2005 sales averages per vehicle segment, gasoline and diesel, and world region
300
250
200
150
100
50
0OECD
EuropeOECD North
AmericaOECD Pacific Transition
EconomiesChina India Developing
AsiaLatin
AmericaAfrica Middle East
•GASOLINE SMALL
• DIESEL SMALL• GASOLINE LARGE
• DIESEL LARGE• GASOLINE MEDIUM
• DIESEL MEDIUM
CO
2in
g/k
m

177
future vehicle technologies
The global vehicle market, with about 55 million vehicles sold peryear, is enormous. Around 500 automobile plants produce this hugequantity. Regional markets differ in the size of vehicles and fuel typeused. Depending on income, infrastructure and the spatialcharacteristics of the countries, people have different preferences forthe size of vehicles they use.
The propulsion technology used in all new cars globally does notdiffer very much, however. For the sake of simplicity, therefore, wehave defined the reference target vehicles, which we use throughoutthe world, as characterised by their energy consumption ‘tank-to-wheel’, independent of the fuel used. The energy consumption for thereference target vehicles are presented in Figure 12.3.
Differences in energy consumption ‘tank-to-wheel’ shown in Figure 12.3reflect the different efficiencies with which vehicles convert fuel energyinto movement. The various fuels and energy sources have differentqualities, depending on their upstream production processes. This istaken into account in the model. In the light of high energy prices andthus growing costs for individual mobility, we foresee a market fordedicated small commuter vehicles. These cars would servepredominantly for the transport of a single person, reflecting today’scar usage in industrialised countries. Although there will still be seatsfor three to five people, the comfort for the car passengers will be less.Therefore the ‘small’ passenger vehicle of the future is projected to besmaller than it is today and therefore less energy intensive88.
Due to the differences in income level between the world’s regions,which we have assumed to be still valid in 2050, the referencetarget vehicles are applied to new vehicle sales in the year 2050 fortoday’s most industrialised regions: OECD Europe, North Americaand OECD Pacific. For all other regions, they are envisaged to enterthe market in 2060, ten years later, and 20 years later in Africa.
gasoline and diesel cars
For traditional internal combustion engines, we have only allowedhere for improvements in starting and stopping and no other hybridfeatures. Other vehicle adaptations to be introduced up to 2050 aredescribed in more detail below.
For the small car sector we project a 1.8 litre/100 km (NEDC) four-seater diesel vehicle, as described in simulations by Friedrich89. Wefound corresponding results from our own simulations for a low-energyconcept car with space for three adults and two children. For gasoline,we project 2.4 l/100 km. For the medium size sector, we project thepotential for a 50% reduction in CO2 for gasoline cars and 42% fordiesel cars. Approximately half of these reductions will be derived frompower train improvements (including starting and stopping) and halffrom an improvement in energy demand. Aerodynamics, rollingresistance and lightweight design will contribute as described below.
For the large size sector, a slightly higher 60% emissions reductionis predicted, resulting from higher mass reduction and greaterdownsizing potentials (due to current over-motorisation). Inaddition, we have assumed political measures have been introduced,such as luxury taxes, in addition to high fuel costs, to reduce thesales of very large SUVs (Sport Utility Vehicles) for passengertransport. This means that the size of vehicles within the segmentwill also decrease over the years. Examples of future cross-overSUVs are projected, for example by Lovins and Cramer90.
Although considerable improvements are in sight for conventionalgasoline and diesel engines without hybridisation, they will betechnically hard to reach. Significant CO2 reductions in the short tomedium term will therefore be much easier and cheaper to achievewith the hybridisation of power trains.
12
cars o
f the fu
ture
|E
NE
RG
Y [R
]EV
OL
UT
ION
figure 12.3: energy consumption of reference target vehicles for three size segments in litres of gasoline equivalent per 100 km (VALUES GIVEN FOR THE NEW EUROPEAN DRIVE CYCLE (NEDC) TEST CYCLE).
battery electric
plugin-hybrid electric
fuel cel hydrogen
diesel hybrid
gasoline hybrid
diesel
gasoline
0 1 2 3
Small
0 1 2 3 4 5
Mdedium Large
0 1 2 3 4 5
not available
references88 SIMILAR TO JAPAN’S K-CAR, FIAT 500 ETC.89 FRIEDRICH, A. (2006): FEASIBILITY OF LOW CARBON CARS, IN UMWELTBUNDESAMT.90 LOVINS, A.B. AND D.R. CRAMER (2004): HYPERCARS®, HYDROGEN, AND THEAUTOMOTIVE TRANSITION. INT. J. VEHICLE DESIGN. VOL. 35(NOS. 1/2).
© A
. SA
BE
RI/
DR
EA
MST
IME
© G
P/T
HO
RST
EN
KL
AP
SC
H
image 4 WHEEL DRIVE.
image TESTRIDE SMILE CAR,GREENPEACE HELPED PRODUCE ANENVIRONMENTALLY FRIENDLIER CAR.

178
GLOBAL ENERGY [R]EVOLUTIONA SUSTAINABLE GLOBAL ENERGY OUTLOOK
hybrid vehicles
Hybrid drive trains consist of at least two different energy convertersand two energy storage units. The most common is the hybrid-electricdrive train, although there are also proposals for kinetic andhydraulic hybrids. Advantages of the combination of the internalcombustion engine with a second source of power arise from avoidinginefficient working regimes of the internal combustion engine (ICE),recuperation of braking energy, engine displacement downsizing andautomated gear switch. For hybrid-electric vehicles, there are severaldifferent architectures and levels of hybridisation proposed.
Hybrid vehicles have been available since the 1990s. In 2006,approximately 400,000 hybrid cars were sold, which is less than 1%of world car production. An increasing number of hybrid models arebeing announced, however. For this study we have used referencevalues of 491, 4.592, 8.393 lge/100 km respectively for small, mediumand large gasoline vehicles94.
For the reference target vehicles in 2050, we have projected thefollowing values, depending on the vehicle segment.
small segment: As explained above, the small segment vehicles willbe of the ‘1 litre car’ type - smaller and lighter than today. Adedicated vehicle in the 500 kg class, with three seats and with ahighly efficient propulsion system, will be standard by 2050,especially for commuting or other journeys were no multi-purposefamily type vehicle is necessary. The fuel consumption for this type ofvehicle is projected to be 1.6 lge/100 km.
medium segment: We developed our vision of reaching 60 g CO2
per km for the medium segment following the technological buildingblocks described below, although this might not be the only way toreach the target.
• A 25% emissions reduction is envisaged by using turbo chargingwith variable turbine geometry, external cooled exhaust gasrecirculation, gasoline direct injection (2nd generation) andvariable valve control/cam phase shifting with respectivescavenging strategies. These measures all result in a downsizingand down speeding of the engine95.
• An additional potential for a 25% saving, related to the previous step,will come from hybridisation and the benefits in terms of start/stopimprovements, regenerative braking and further downsizing. Wasteheat recovery by thermoelectric generators will contribute to the on-board power supply, which saves an additional 3 to 5%96 97.
• A reduction in the vehicle’s mass from 360 kg to 1,000 kg will reduceenergy demand by about 18%98. To achieve lightweight construction,methods such as topology optimisation, multi-material design and highlyintegrated components will be used. Mass reductions of 60 to 120 kgfor midsized cars have already been achieved99. The production andrecycling processes of lightweight materials such as magnesium andcarbon fibres will also be improved in 30-40 years time, thus avoiding ashift in emissions from the utilisation to the production phase.
• Aerodynamic resistance, aerodynamic drag and frontal areas offerfurther potential for improvements. By optimising the car’sunderside, engine air flows and contours we project an additionallowering of energy demand by 8%.
• Rolling resistance depends on the material used for the tyre, theconstruction of the tyre and its radius, tyre pressures and drivingspeed. The tyre industry has proposed new concepts for wheels whichare intended to lower rolling resistance by 50% by 2030100 101.Reducing the rolling coefficient by 1/1000 will lead to fuel savings of0.08 l/100 km102. This results in an additional 12% CO2 savings.
• Further potentials for energy savings will come from ‘intelligentcontrollers’ which improve energy management and drive traincontrol strategies by recognising frequently driven journeys. Improvedtraffic management to help a driver find the energy optimised routemight also make a contribution. Other options for hybridisation couldcome from free piston linear generators, which produce electricitywith a constant high efficiency, at the same time avoiding part loadconditions because of the variable cylinder capacity103.
From the technologies and potentials described here, we project thatwithin the next 40 years an improvement of 64% in energyconsumption for hybrid vehicles is achievable, resulting in 2.6 l/100km or 60 g CO2/km for a middle sized car in the NEDC test cycle. Thiscorresponds to an annual improvement of 2.2%. It is likely that othercombinations will lead to similar results, for example by following fullhybridisation first, with a potential saving of 44%104[26] and addingcomplementary measures. We have also applied an 18% increase infuel consumption based on a realistic assessment of driving patterns.The Volkswagen Golf V FSI 1.6 l, with a 1,360 kg mass and 163 gCO2/km in NEDC was used as a starting point105.
large segment: For large vehicles, the same technologies asdescribed for the medium segment can be applied. We believe,however, that the potential for improvements is higher and projectfuel consumption in 2050 at 3.5 lge/100 km. In addition, we assumethat political measures to reduce the sales of very large SUVs forpassenger transport have been introduced, so that the size ofvehicles within the segment will also decrease.
12
cars o
f the fu
ture
|E
NE
RG
Y [R
]EV
OL
UT
ION
references91 OWN ESTIMATE92 TOYOTA PRIUS II IN NEDC TEST CYCLE93 LEXUS RX 400 H IN NEDC TEST CYCLE94 KBA FUEL CONSUMPTION AND EMISSIONS TYPE APPROVAL FIGURES WITH A NATIONALOR EC WHOLE VEHICLE TYPE APPROVAL, KRAFTFAHRT-BUNDESAMT: FLENSBURG.95 FRAIDL, G.K., P.E. KAPUS, K. PREVEDEL, AND A. FÜRHAPTER (2007): DI TURBO: DIENÄCHSTEN SCHRITTE. IN 28. INTERNATIONALES WIENER MOTORENSYMPOSIUM, WIEN: VDI.96 THACHER, E.F., B.T. HELENBROOK, M.A. KARRI, AND C.J. RICHTER (2006): TESTING OFAN AUTOMOBILE EXHAUST THERMOELECTRIC GENERATOR IN A LIGHT TRUCK. PROC.IMECHE VOL. 221 PART D: J. AUTOMOBILE ENGINEERING. VOL. 221(JAUTO51).97 FRIEDRICH, H.E., P. TREFFINGER, AND W.E. MÜLLER (2007): MANAGEMENT VONSEKUNDÄRENERGIE UND ENERGIEWANDLUNG VON VERLUSTWÄRMESTRÖMEN, INDOKUMENTATION CO2 - DIE HERAUSFORDERUNG FÜR UNSERE ZUKUNFT, VIEWEG / GWVFACHVERLAGE GMBH: MÜNCHEN.98 RELATED TO THE ALREADY LOWER ENERGY USE OF THE PREVIOUS STEP99 SLC (2007): SUSTAINABLE PRODUCTION TECHNOLOGIES OF EMISSION REDUCEDLIGHT-WEIGHT CAR CONCEPTS: SUPERLIGHT-CAR/SLC, COLLABORATIVE RESEARCH &DEVELOPMENT PROJECT CO-FUNDED BY THE EUROPEAN COMMISSION UNDER THE 6THFRAMEWORK PROGRAMME.100 MICHELIN (2005): DIE REIFEN-FELGEN-KOMBINATION „TWEEL“ KOMMT VÖLLIGOHNE LUFTDRUCK AUS. PRESS RELEASE. IN NORTH AMERICAN INTERNATIONALAUTOSHOW (NAIAS).101 WIES, B. (2007): IST DER GUMMI AUSGEREIZT? PRÄSENTATION IMNATURHISTORISCHES MUSEUM, WIEN, 1. OKTOBER 2007.102 POSZNANSKI-EISENSCHMIDT (2007): VDA TECHNICAL CONGRESS.103 ACHTEN, P.A.J., J.P.J.V.D. OEVER, J. POTMA, AND G.E.M. VAEL (2000): HORSEPOWER WITHBRAINS: THE DESIGN OF THE CHIRON FREE PISTON ENGINE, IN SAE TECHNICAL PAPERSERIES, 2000-01-2545; MAX, E. (2005): FREE PISTON ENERGY CONVERTER, IN ELECTRICVEHICLE SYMPOSIUM 21: MONACO; POHL, S.-E. AND M. GRÄF (2005): DYNAMIC SIMULATIONOF A FREE PISTON LINEAR ALTERNATOR, IN MODELICA 2005, SCHMITZ, G.: HAMBURG.104 SCHMIDT, G. (2006): ANTRIEBE FÜR DEN EUROPÄISCHEN MARKT UND DIE ROLLE VONHYBRIDKONZEPTEN, IN 10. HANDELSBLATT JAHRESTAGUNG AUTOMOBILTECHNOLOGIEN.105 KBA FUEL CONSUMPTION AND EMISSIONS TYPE APPROVAL FIGURES WITH A NATIONALOR EC WHOLE VEHICLE TYPE APPROVAL, KRAFTFAHRT-BUNDESAMT: FLENSBURG.

179
battery electric vehicles
Battery electric vehicles already have a long history, starting in1881 with the first electric vehicle powered by a secondary Plantébattery106. Considerable activity in the 1990s resulted in a number ofproduction scale electric cars such as the EV1 (GM), Saxoelectrique (Citroen), Hijet EV (Daihatsu), Th!nk City (Ford), EVPlus (Honda), Altra EV (Nissan), Clio Electric (Renault) and theRAV 4 (Toyota). At the beginning of the 21st century the TeslaRoadster is among the most prominent. There is also a continuousflow of prototype electric cars, including the Ion (Peugeot), E1(BMW), A-Class electric (DaimlerChysler) and E-com (Toyota).
Battery electric vehicles are already very efficient. A fuelconsumption of 1.7 litres gasoline equivalent /100 km is reportedfor the Ford e-Ka107, 2.1 l/100 km for the Ford Ecostar and 3.4l/100 km for the Chrysler van108. In the future we anticipatereference target values of 0.7 l/100 km for small size cars based onsimulations for micro cars and 1.4 l/100 km for medium sizevehicles based on simulations of city and compact class vehicles. Wedo not consider battery vehicles for the large vehicle segment.
There is a considerable gap between test cycle results and realdriving experience because of auxiliary power needs, for example forheating, cooling and other electrical services. We have thereforeapplied a factor of 1.7 to the transfer from test cycle to real worlddriving based on simulation results.
Battery electric vehicles carry their energy along on board in achemical form. The future battery technology for vehicles will mostprobably be based on Lithium because of good energy densities andcost prospects. Remaining issues associated with the application ofbatteries in vehicles are safety, long term durability and costs.However, under the most optimistic estimates for batterydevelopment, battery electric vehicles will mainly be small vehiclesand those with dedicated usage profiles like urban fleets. Otherproblems to be solved are fast recharging and cycle stability.Technical solutions have already been proposed, and the costreduction target for batteries in the long term is to reach 1/40th oftoday’s figures. An enormous amount of research is being carried out,as well as production of the first vehicle-type batteries. This scenarioassumes the introduction of battery electric vehicles from 2015.
plug-in-hybrid electric vehicles
Plug-in-hybrids are a combination of conventional hybrids andbattery electric vehicles. They promise to provide both advantages:using low carbon and cheap energy from the grid, a wide travelrange and grid independent driving when necessary. Plug-in-hybridscan be adapted from conventional hybrids by changing to a highercapacity battery, but different concepts, so-called series hybrids, arealso proposed. Again, depending on the control strategy, differentconcepts are possible. The ICE, for example, is designed as a range-extender to recharge the battery only or a battery plusICE/generator provides energy, depending on the power need. Fueland energy consumption depend very much on the system layout andcontrol strategy, combined with the distance, frequency and speeddriven. We project 2.3, 2.4, 4.5 lge/100 km following the announcedspecification for the Volvo Recharge concept car and other input109.
By the year 2050 we project that plug-in hybrids will use 10% moreenergy in electric mode compared to our projection for batteryelectric vehicles due to their increased weight. Once the battery isbelow the recharge limit, the ICE/generator will provide the energyin part or full. In this operating mode we again project 10% higherfuel consumption than their conventional hybrid counterparts. Interms of CO2 balance the distribution of kilometres driven in electricand ICE modes is crucial. We anticipate that 80% of all kilometreswill be driven in electric mode. In this scenario the introduction ofplug-in-hybrid electric vehicles starts in 2015.
fuel cell hydrogen
Fuel cell vehicles have reached a high level of readiness for massproduction. The polymer electrolyte membrane fuel cell provides highpower density, resulting in low weight, cost and volume . Averagedrive cycle efficiencies have reached 3.5 lge/100 km111. Majorproblems still to be solved are durability, operating temperature rangeand cost reductions. Hydrogen on-board storage to provide a largedriving range is a further issue not finally solved. Nevertheless, thetechnology seems ready to begin the transition into the mass market.
The main problem in fact is not so much the vehicles themselves asthe hydrogen they need. Before the vehicles can operate, a hydrogeninfrastructure needs to be established. The investment involved isrisky, not least because of the competing electric systems. Becauseof energy losses in the hydrogen production chain, electricity appearsto be cheaper, easier to handle and more environmentally friendly –at least until there is renewable electricity in abundance.
The hydrogen fuel cell vehicle might find its niche, however, wherethe driving range of battery electric vehicles is too low and/or locallyemission free driving is demanded or the freedom from grid-connecting is valued more highly. We have projected a 35%improvement compared to today’s fuel cell vehicles as the targetreference value because of the potential for both fuel cell systemimprovement and lightweight, rolling resistance and aerodynamicvehicles, as already described.
12
cars o
f the fu
ture
|E
NE
RG
Y [R
]EV
OL
UT
ION
© R
. MA
RIN
ELL
O/D
RE
AM
TIM
E
image NEW FUEL EFFICIENT HYBRIDCAR DESIGN.
image CHARGING AN ELECTRIC CAR.
© M
. SH
AK
E/D
RE
MST
IME
references106 WESTBROOK, M.H. (2001): THE ELECTRIC CAR. DEVELOPMENT AND FUTURE OFBATTERY, HYBRID AND FUEL-CELL CARS: THE INSTITUTION OF ELECTRICAL ENGINEERS.107 BUSCH, R. AND P. SCHMITZ (2001): THE E-KA - AN ELECTRIC VEHICLE ASTECHNOLOGY DEMONSTRATOR, IN EVS18: BERLIN.108 OTA (1995): ADVANCED AUTOMOTIVE TECHNOLOGY: VISIONS OF A SUPER-EFFICIENTFAMILY CAR, OFFICE OF TECHNOLOGY ASSESSMENT.109 BANDIVADEKAR, A.P. (2008): EVALUATING THE IMPACT OF ADVANCED VEHICLE ANDFUEL TECHNOLOGIES IN U.S. LIGHT-DUTY VEHICLE FLEET, IN ENGINEERING SYSTEMSDIVISION, MASSACHUSETTS INSTITUTE OF TECHNOLOGY.110 NEBURCHILOV, V., J. MARTIN, H. WANG, AND J. ZHANG (2007): A REVIEW OF POLYMERELECTROLYTE MEMBRANES FOR DIRECT METHANOL FUEL CELLS. JOURNAL OF POWERSOURCES. 169(2): P. 221-238; ZHANG, J., Z. XIE, J. ZHANG, Y. TANG, C. SONG, T. NAVESSIN, Z.SHI, D. SONG, H. WANG, D.P. WILKINSON, Z.-S. LIU, AND S. HOLDCROFT (2006): HIGHTEMPERATURE PEM FUEL CELLS. JOURNAL OF POWER SOURCES. 160(2): P. 872-891.111 HONDA (2007): FCX CLARITY, WWW.HONDA.COM.

180
GLOBAL ENERGY [R]EVOLUTIONA SUSTAINABLE GLOBAL ENERGY OUTLOOK
projection of future vehicle technology mix
We are convinced that the share of hybrid cars will grow enormously.For the industrialised regions, we anticipate a sales share of 65% forhybrid power trains by 2050 and for all other regions 50%, apartfrom Africa, with 25%. This share includes all types of non-gridconnected hybrids. In 2050 the balance of different hybrids will bethat in Europe, North America and OECD Pacific roughly 20% arepowered by conventional ICE engines, roughly 40% are grid-connectable and 40% are autonomous hybrids. For all other regions,34% will be conventional, a third plug-in-hybrids and a thirdautonomous hybrids. Africa is again treated differently.
To power all sizes of vehicles with the same technology does not makesense. We have therefore further projected that a large share of plug-in-electric cars in the small vehicle segment (80%) will be batteryelectric vehicles. Two-thirds of the medium sized vehicles and all of thelarge vehicles will be plug-in-hybrids, thus still having an internalcombustion engine on board.
projection of vehicle segment split
We have disaggregated the light duty vehicle sales into threesegments: small, medium and large vehicles. This gives us theopportunity to show the effect of ‘driving smaller cars’. The size andCO2 emissions of the vehicles are particularly interesting in the lightof the enormous growth predicted in the LDV stock. For ourpurposes we have divided up the numerous car types as follows. Thesmall car bracket includes city, supermini, microvans, mini SUV,minicompact cars and two seaters. The medium sized bracketincludes lower medium/subcompact, medium class and compactcars, car derived vans and small station wagons, upper mediumclass, midsize cars and station wagons, executive class, passengervans (subcompact, compact and standard MPV), car derivedpickups, subcompact and compact SUVs, 2WD and 4WD. Withinthe large car bracket we have included all kinds of luxury class,luxury MPV, medium and heavy vans, compact and full-size pickuptrucks (2WD, 4WD), standard and luxury SUVs.
In examining the segment split, we have focused most strongly onthe two world regions which will be the largest emitters of CO2 fromcars in 2050: North America and China. In North America todaythe small vehicle segment is almost non-existant. We havenonetheless applied a considerable growth rate of 8% per year,triggered by rising fuel prices and possibly vehicle taxes. For China,we have anticipated the same share of the mature car market as forEurope and projected that the small segment will grow by 2.3% peryear at the expenses of the larger segments in the light of risingmass mobility. The segment split is shown in Figure 12.5.
12
cars o
f the fu
ture
|E
NE
RG
Y [R
]EV
OL
UT
ION
figure 12.4: sales share of conventional ICE, autonomoushybrid and grid-connectable vehicles in 2050
100%
90%
80%
70%
60%
50%
40%
30%
20%
10%
0
OE
CD
Eur
ope
OE
CD
Nor
th A
mer
ica
OE
CD
Pac
ific
Tran
siti
on E
cono
mie
s
Chi
na
Indi
a
Dev
elop
ing
Asi
a
Lat
in A
mer
ica
Afr
ica
Mid
dle
Eas
t
•AUTONOMOUS HYBRID VEHICLES
• GRID-CONNECTABLE VEHICLES
• CONVENTIONAL
figure 12.5: vehicle sales by segment in 2005 and 2050 for ten world regions
100%
90%
80%
70%
60%
50%
40%
30%
20%
10%
0
2005
2050
OECDEurope
2005
2050
OECD NorthAmerica
2005
2050
OECDPacific
2005
2050
TransitionEconomies
2005
2050
China
2005
2050
India
2005
2050
DevelopingAsia
2005
2050
LatinAmerica
2005
2050
Africa
2005
2050
Middle East
•LARGE
•MEDIUM
• SMALL

181
projection of switch to alternative fuels
A switch to renewable fuels in the car fleet is one of the cornerstonesof our low CO2 car scenario, with the most prominent element thedirect use of renewable electricity in cars. The different types ofelectric and hybrid cars, such as battery electric and plug-in-hybrid,are summarised as ‘plug-in electric’. Their introduction will start inindustrialised countries in 2015, following an s-curve pattern, and areprojected to reach about 40% of total LDV sales in the EU, NorthAmerica and the Pacific OECD by 2050. Due to the higher costs ofthe technology and renewable electricity availability, we have slightlydelayed progress in other countries. More cautious targets areapplied for Africa. The sales split in vehicles by fuel is presented inFigure 12.7 for 2005 and 2050.
projection of global vehicle stock development
Differences in forecasts for the growth of vehicle sales in developingcountries are huge112. We have mainly used the projections from theReference Scenario. Slight changes were applied to vehicle sales insaturated markets such as Europe and North America, where we believethat massive policy intervention to promote modal shift and alternativeforms of car usage will show effects in vehicle sales in the long run.
12
cars o
f the fu
ture
|E
NE
RG
Y [R
]EV
OL
UT
ION
© T
AR
AN
55/D
RE
AM
STIM
E
© S
HU
TTLE
COCK
/DR
EA
MST
IMEimage PARKING SPACE FOR
HYBRIDS ONLY.
image INTERNAL WORKINGS OF A HYBRID CAR.
figure 12.6: development of the global car market
2,000
1,800
1,600
1,400
1,200
1,000
800
600
400
200
0REF2000
REF2010
REF2020
REF2030
REF2040
REF2050
•MIDDLE EAST
• AFRICA
• LATIN AMERICA
• DEVELOPING ASIA
• INDIA
• CHINA
•TRANSITION ECONOMIES
• OECD PACIFIC
• OECD NORTH AMERICA
• OECD EUROPE
Sto
ck o
f fl
ight
dut
y ve
hicl
es (
mill
ions
)
2,000
1,800
1,600
1,400
1,200
1,000
800
600
400
200
0E[R]2000
E[R]2010
E[R]2020
E[R]2030
E[R]2040
E[R]2050
Sto
ck o
f fl
ight
dut
y ve
hicl
es (
mill
ions
)
figure 12.7: fuel split in vehicle sales for 2005 and 2050 by ten world regions
100%
90%
80%
70%
60%
50%
40%
30%
20%
10%
0
2005
2050
OECDEurope
2005
2050
OECD NorthAmerica
2005
2050
OECDPacific
2005
2050
TransitionEconomies
2005
2050
China
2005
2050
India
2005
2050
DevelopingAsia
2005
2050
LatinAmerica
2005
2050
Africa
2005
2050
Middle East
•PLUGIN ELECTRIC
• HYDROGEN
• CNG/LPG
• DIESEL
• PETROL
references112 MEYER, I., M. LEIMBACH, AND C.C. JAEGER (2007): INTERNATIONAL PASSENGERTRANSPORT AND CLIMATE CHANGE: A SECTOR ANALYSIS IN CAR DEMAND ANDASSOCIATED CO2 EMISSIONS FROM 2000 TO 2050. ENERGY POLICY. 35(12): P. 6332-6345.

182
GLOBAL ENERGY [R]EVOLUTIONA SUSTAINABLE GLOBAL ENERGY OUTLOOK
projection of kilometres driven per year
Until a complete shift from fossil to renewable fuels is completed,driving on the road will be linked to CO2 emissions. Thus driving lesscontributes to our target for emissions reduction. However this isnot necessarily linked to less mobility because we have relied on themultitude of excellent opportunities for shifts from individualpassenger road transport towards less CO2 intense public or non-motorised transport.
In our scenario we have taken into account the effects of a variety ofpolicy measures which could be implemented all over the world andsummarised them in two indicators: numbers of vehicles (see thesection above) and annual kilometres driven (AKD). For AKD wehave applied a 0.25% reduction per year, assuming the first visibleeffect in 2010, resulting in a roughly 10% reduction by 2050. Thishas been coordinated into a model which projects the shift from carto rail or bus at 5%, with the additional 5% coming from LDVs aspart of the predicted demand reduction for all modes of transport113.
Figure 12.9 shows the effect of vehicle travel reduction over time byworld region. China shows a less typical pattern: while in Chinatoday many vehicles are used intensively, with many kilometrestravelled per year, with a growing individual mobility we assume thatAKD will move towards the global average.
summary of scenario results114
A combination of ambitious efforts to introduce higher efficiencyvehicle technologies, a major switch to grid-connected electricvehicles and incentives for travellers to save CO2 all lead to theconclusion that it is possible to reduce emissions from well-to-wheelin 2050 by roughly 25%115 compared to 1990 and 40% comparedto 2005. Even so, 74% of the final energy used in cars will still comefrom fossil fuel sources, 70% from gasoline and diesel. Renewableelectricity covers 19% of total car energy demand, bio fuels cover5% and hydrogen 2%. Energy consumption in total is reduced by23% in 2050 compared to 2005, in spite of tremendous increases insome world regions. The peak in global CO2 emissions occurs between2010 and 2015. From 2010 onwards, new legislation in the US andEurope contributes towards breaking the upwards trend in emissions.From 2020 onwards, we can see the effect of introducing grid-connected electric cars. The development of CO2 emissions, takinginto account upstream emissions, is shown in Figure 12.8.
12
cars o
f the fu
ture
|E
NE
RG
Y [R
]EV
OL
UT
ION
figure 12.9: average annual kilometres driven per world region
2000 2010 2020 2030 2040 2050
•OECD EUROPE
• OECD NORTH AMERICA
• OECD PACIFIC
•TRANSITION ECONOMIES
• CHINA
• INDIA
• DEVELOPING ASIA
• LATIN AMERICA
• AFRICA
•MIDDLE EAST
25,000
20,000
15,000
10,000
5,000
Kms 0
CO
2em
issi
ons
per
year
in M
t
figure 12.8: well-to-wheel CO2 emissions of light duty vehicles in the reference and energy [r]evolution scenarios from 2000 to 2050
6,000
5,000
4,000
3,000
2,000
1,000
0
RE
F
E[R
]
2000
RE
F
E[R
]
2005
RE
F
E[R
]
2010
RE
F
E[R
]
2015
RE
F
E[R
]
2020
RE
F
E[R
]
2025
RE
F
E[R
]
2030
RE
F
E[R
]
2035
RE
F
E[R
]
2040
RE
F
E[R
]
2045
RE
F
E[R
]
2050
•MIDDLE EAST
• AFRICA
• LATIN AMERICA
• DEVELOPING ASIA
• INDIA
• CHINA
•TRANSITION ECONOMIES
• OECD PACIFIC
• OECD NORTH AMERICA
• OECD EUROPE
references113 GRAUS, W. AND E. BLOMEN (2008): GLOBAL LOW ENERGY DEMAND SCENARIOS -UPDATE 2008, ECOFYS NETHERLANDS BV114 THESE RESULTS ARE FROM THE DEVELOPMENT OF THE LDV SCENARIO WITHSEVERAL SPECIFIC ASSUMPTIONS ON E.G. UPSTREAM EMISSIONS ETC. WHICH ARE NOTCOORDINATED WITH THE SCENARIO DEVELOPMENT OVER ALL SECTORS. ONLY THEMESAP MODEL WILL GIVE THE FINAL RESULTS.115 THERE IS NO RELIABLE NUMBER FOR THE GLOBAL 1990 LDV EMISSIONSAVAILABLE, THEREFORE THIS HAS TO BE UNDERSTOOD AS A ROUGH ESTIMATE..

183
13policy recommendations
GLOBAL
“...so I urge thegovernment to act and to act quickly.”LYN ALLISON LEADER OF THE AUSTRALIAN DEMOCRATS, SENATOR 2004-2008
13
STANDBY POWER IS WASTED POWER.GLOBALLY, WE HAVE 50 DIRTY POWERPLANTS RUNNING JUST FOR OUR WASTEDSTANDBY POWER. OR: IF WE WOULDREDUCE OUR STANDBY TO JUST 1 WATT, WE CAN AVOID THE BUILDING OF 50 NEWDIRTY POWER PLANTS. © M. DIETRICH/DREAMSTIME

184
GLOBAL ENERGY [R]EVOLUTIONA SUSTAINABLE GLOBAL ENERGY OUTLOOK
At a time when governments around the world are in the process ofliberalising their electricity markets, the increasing competitivenessof renewable energy should lead to higher demand. Withoutpolitical support, however, renewable energy remains at adisadvantage, marginalised by distortions in the world’s electricitymarkets created by decades of massive financial, political andstructural support to conventional technologies. Developingrenewables will therefore require strong political and economicefforts, especially through laws which guarantee stable tariffs overa period of up to 20 years.
At present new renewable energy generators have to compete withold nuclear and fossil fuelled power stations which produceelectricity at marginal costs because consumers and taxpayers havealready paid the interest and depreciation on the originalinvestments. Political action is needed to overcome these distortionsand create a level playing field.
Renewable energy technologies would already be competitive if theyhad received the same attention as fossil fuels and nuclear in termsof R&D funding, subsidies, and if external costs were reflected inenergy prices. Removing public subsidies to fossil fuels and nuclearand applying the ‘polluter pays’ principle to the energy markets,would go a long way to level the playing field and drastically reducethe need for renewables support. Unless this principle is fullyimplemented, renewable energy technologies need to receivecompensation and additional support measures in order to competein the distorted market.
Support mechanisms for the different sectors and technologies canvary according to regional characteristics, priorities or startingpoints. But some general principles should apply to any kind ofsupport mechanism. These criteria are:
effectiveness in reaching the targets The experiences in somecountries show that it is possible with the right design of a supportmechanism to reach agreed national targets. Any system to beadopted at a national level should focus on being effective indeploying new installed capacity and meeting the targets.
long term stability Whether price or quantity-based, policy makersneed to make sure that investors can rely on the long-term stabilityof any support scheme. It is absolutely crucial to avoid stop-and-gomarkets by changing the system or the level of support frequently.Therefore market stability has to be created with a stable long-termsupport mechanism.
simple and fast administrative procedures Complex licensingprocedures constitute one of the most difficult obstacles thatrenewables projects have to face. Administrative barriers have to beremoved at all levels. A ‘one-stop-shop’ system should be introducedand a clear timetable set for approving projects.
encouraging local and regional benefits and public acceptanceThe development of renewable technologies can have a significantimpact on local and regional areas, resulting from both installationand manufacturing. Some support schemes include publicinvolvements that hinder or facilitate the acceptance of renewabletechnologies. A support scheme should encourage local/regionaldevelopment, employment and income generation. It should alsoencourage public acceptance of renewables, including their positiveimpact and increased stakeholder involvement.
The following is an overview of current political frameworks andbarriers that need to be overcome in order to unlock renewableenergy’s great potential to become a major contributor to globalenergy supply. In the process it would also contribute to sustainableeconomic growth, high quality jobs, technology development, globalcompetitiveness and industrial and research leadership.
renewable energy targets
In recent years, as part of their greenhouse gas reduction policiesas well as for increasing security of energy supply, an increasingnumber of countries have established targets for renewable energy.These are either expressed in terms of installed capacity or as apercentage of energy consumption. Although these targets are notoften legally binding, they have served as an important catalyst forincreasing the share of renewable energy throughout the world,from Europe to the Far East to the USA.
A time horizon of just a few years is not long enough in theelectricity sector, where the investment horizon can be up to 40years. Renewable energy targets therefore need to have short,medium and long term steps and must be legally binding in order tobe effective. They should also be supported by mechanisms such asthe ‘feed-in tariff’. In order for the proportion of renewable energyto increase significantly, targets must be set in accordance with thelocal potential for each technology (wind, solar, biomass etc) andaccording to the local infrastructure, both existing and planned.
In recent years the wind and solar power industries have shown that itis possible to maintain a growth rate of 30 to 35% in the renewablessector. In conjunction with the European Photovoltaic IndustryAssociation, the European Solar Thermal Power Industry Associationand the European Wind Energy Association116, Greenpeace and EREChave documented the development of those industries from 1990onwards and outlined a prognosis for growth up to 2020.
13
po
licy recom
men
da
tion
s|
TA
RG
ET
S
references116 SOLAR GENERATION (EPIA), CONCENTRATED SOLAR THERMAL POWER – NOW!(GREENPEACE), WINDFORCE 12 (EWEA), GLOBAL WIND ENERGY OUTLOOK 2006, GWEC..

185
demands for the energy sector
Greenpeace and the renewables industry have a clear agenda forchanges which need to be made in energy policy to encourage ashift to renewable sources. The main demands are:
• Phase out all subsidies for fossil fuels and nuclear energy.
• Internalise the external costs (social and environmental) ofenergy production through ‘cap and trade’ emissions trading.
• Mandate strict efficiency standards for all energy consumingappliances, buildings and vehicles.
• Establish legally binding targets for renewable energy andcombined heat and power generation.
• Reform the electricity markets by guaranteeing priority access tothe grid for renewable power generators.
• Provide defined and stable returns for investors, for examplethrough feed-in tariff programmes.
• Implement better labelling and disclosure mechanisms to providemore environmental product information.
• Increase research and development budgets for renewable energyand energy efficiency.
Conventional energy sources receive an estimated $250-300117
billion in subsidies per year worldwide, resulting in heavily distortedmarkets. Subsidies artificially reduce the price of power, keeprenewable energy out of the market place and prop up non-competitive technologies and fuels. Eliminating direct and indirectsubsidies to fossil fuels and nuclear power would help move ustowards a level playing field across the energy sector. The 2001report of the G8 Renewable Energy Task Force argued that “re-addressing them [subsidies] and making even a minor re-directionof these considerable financial flows toward renewables, provides anopportunity to bring consistency to new public goals and to includesocial and environmental costs in prices.” The Task Forcerecommended that “G8 countries should take steps to removeincentives and other supports for environmentally harmful energytechnologies, and develop and implement market-based mechanismsthat address externalities, enabling renewable energy technologiesto compete in the market on a more equal and fairer basis.”
Renewable energy would not need special provisions if markets werenot distorted by the fact that it is still virtually free for electricityproducers (as well as the energy sector as a whole) to pollute.Subsidies to fully mature and polluting technologies are highlyunproductive. Removing subsidies from conventional electricitywould not only save taxpayers’ money. It would also dramaticallyreduce the need for renewable energy support.
This is a fuller description of what needs to be done to eliminate orcompensate for current distortions in the energy market.
removal of energy market distortions A major barrier preventingrenewable energy from reaching its full potential is the lack of pricingstructures in the energy markets that reflect the full costs to society ofproducing energy. For more than a century, power generation wascharacterised by national monopolies with mandates to financeinvestments in new production capacity through state subsidies and/orlevies on electricity bills. As many countries are moving in thedirection of more liberalised electricity markets, these options are nolonger available, which puts new generating technologies, such as windpower, at a competitive disadvantage relative to existing technologies.This situation requires a number of responses.
internalisation of the social and environmental costs ofpolluting energy The real cost of energy production by conventionalenergy includes expenses absorbed by society, such as health impactsand local and regional environmental degradation - from mercurypollution to acid rain – as well as the global negative impacts fromclimate change. Hidden costs include the waiving of nuclear accidentinsurance that is too expensive to be covered by the nuclear powerplant operators. The Price Anderson Act, for instance, limits theliability of US nuclear power plants in the case of an accident to anamount of up to $ 98 million per plant, and only $15 million per yearper plant, with the rest being drawn from an industry fund of up to $10 billion. After that the taxpayer becomes responsible118.
Environmental damage should, as a priority, be rectified at source.Translated into energy generation that would mean that, ideally,production of energy should not pollute and it is the energyproducers’ responsibility to prevent it. If they do pollute they shouldpay an amount equal to the damage the production causes tosociety as a whole. The environmental impacts of electricitygeneration can be difficult to quantify, however. How do we put aprice on lost homes on Pacific Islands as a result of melting icecapsor on deteriorating health and human lives?
An ambitious project, funded by the European Commission - ExternE– has tried to quantify the true costs, including the environmentalcosts, of electricity generation. It estimates that the cost of producingelectricity from coal or oil would double and that from gas wouldincrease by 30% if external costs, in the form of damage to theenvironment and health, were taken into account. If thoseenvironmental costs were levied on electricity generation according totheir impact, many renewable energy sources would not need anysupport. If, at the same time, direct and indirect subsidies to fossilfuels and nuclear power were removed, the need to support renewableelectricity generation would seriously diminish or cease to exist.
introduce the “polluter pays" principle As with the othersubsidies, external costs must be factored into energy pricing if themarket is to be truly competitive. This requires that governmentsapply a “polluter pays” system that charges the emittersaccordingly, or applies suitable compensation to non-emitters.Adoption of polluter pays taxation to electricity sources, orequivalent compensation to renewable energy sources, and exclusionof renewables from environment-related energy taxation, is essentialto achieve fairer competition in the world’s electricity markets.
13
po
licy recom
men
da
tion
s|
TA
RG
ET
S
references117 ‘WORLD ENERGY ASSESSMENT: ENERGY AND THE CHALLENGE OFSUSTAINABILITY’, UNITED NATIONS DEVELOPMENT PROGRAMME, 2000118 HTTP://EN.WIKIPEDIA.ORG/WIKI/PRICE-ANDERSON_NUCLEAR_INDUSTRIES_INDEMNITY_ACT
© G
P/K
AT
E D
AV
ISO
N
image LOCALS AND GREENPEACE SETTING UP WINDTURBINES IN THAILAND.

186
GLOBAL ENERGY [R]EVOLUTIONA SUSTAINABLE GLOBAL ENERGY OUTLOOK
electricity market reform Renewable energy technologies couldalready be competitive if they had received the same attention asother sources in terms of R&D funding and subsidies, and if externalcosts were reflected in power prices. Essential reforms in theelectricity sector are necessary if new renewable energy technologiesare to be accepted on a larger scale. These reforms include:
removal of electricity sector barriers Complex licensingprocedures and bureaucratic hurdles constitute one of the mostdifficult obstacles faced by renewable energy projects in manycountries. A clear timetable for approving projects should be set forall administrations at all levels. Priority should be given torenewable energy projects. Governments should propose moredetailed procedural guidelines to strengthen the existing legislationand at the same time streamline the licensing procedure forrenewable energy projects.
A major barrier is the short to medium term surplus of electricitygenerating capacity in many OECD countries. Due to over-capacity itis still cheaper to burn more coal or gas in an existing power plantthan to build, finance and depreciate a new renewable power plant.The effect is that, even in those situations where a new technologywould be fully competitive with new coal or gas fired power plants,the investment will not be made. Until we reach a situation whereelectricity prices start reflecting the cost of investing in new capacityrather than the marginal cost of existing capacity, support forrenewables will still be required to level the playing field.
Other barriers include the lack of long term planning at national,regional and local level; lack of integrated resource planning; lackof integrated grid planning and management; lack of predictabilityand stability in the markets; no legal framework for internationalbodies of water; grid ownership by vertically integrated companiesand a lack of long-term R&D funding.
There is also a complete absence of grids for large scale renewableenergy sources, such as offshore wind power or concentrating solarpower (CSP) plants; weak or non-existant grids onshore; littlerecognition of the economic benefits of embedded/distributedgeneration; and discriminatory requirements from utilities for gridaccess that do not reflect the nature of the renewable technology.
The reforms needed to address market barriers to renewables include:
• Streamlined and uniform planning procedures and permittingsystems and integrated least cost network planning.
• Fair access to the grid at fair, transparent prices and removal ofdiscriminatory access and transmission tariffs.
• Fair and transparent pricing for power throughout a network, withrecognition and remuneration for the benefits of embedded generation.
• Unbundling of utilities into separate generation and distribution companies.
• The costs of grid infrastructure development and reinforcementmust be carried by the grid management authority rather thanindividual renewable energy projects.
• Disclosure of fuel mix and environmental impact to end users toenable consumers to make an informed choice of power source.
priority grid access Rules on grid access, transmission and costsharing are very often inadequate. Legislation must be clear,especially concerning cost distribution and transmission fees.Renewable energy generators should be guaranteed priority access.Where necessary, grid extension or reinforcement costs should beborne by the grid operators, and shared between all consumers,because the environmental benefits of renewables are a public goodand system operation is a natural monopoly.
support mechanisms for renewables The following sectionprovides an overview of the existing support mechanisms andexperiences of their operation. Support mechanisms remain asecond best solution for correcting market failures in the electricitysector. However, introducing them is a practical political solution toacknowledge that, in the short term, there are no other practicalways to apply the polluter pays principle.
Overall, there are two types of incentive to promote deployment ofrenewable energy. These are Fixed Price Systems where thegovernment dictates the electricity price (or premium) paid to theproducer and lets the market determine the quantity, andRenewable Quota Systems (in the USA referred to as RenewablePortfolio Standards) where the government dictates the quantity ofrenewable electricity and leaves it to the market to determine theprice. Both systems create a protected market against abackground of subsidised, depreciated conventional generatorswhose external environmental costs are not accounted for. Their aimis to provide incentives for technology improvements and costreductions, leading to cheaper renewables that can compete withconventional sources in the future.
The main difference between quota based and price based systemsis that the former aims to introduce competition between electricityproducers. However, competition between technologymanufacturers, which is the most crucial factor in bringing downelectricity production costs, is present regardless of whethergovernment dictates prices or quantities. Prices paid to wind powerproducers are currently higher in many European quota basedsystems (UK, Belgium, Italy) than in fixed price or premiumsystems (Germany, Spain, Denmark).
• fixed price systems Fixed price systems include investmentsubsidies, fixed feed-in tariffs, fixed premium systems and tax credits.
Investment subsidies are capital payments usually made on thebasis of the rated power (in kW) of the generator. It is generallyacknowledged, however, that systems which base the amount ofsupport on generator size rather than electricity output can leadto less efficient technology development. There is therefore aglobal trend away from these payments, although they can beeffective when combined with other incentives.
Fixed feed-in tariffs (FITs), widely adopted in Europe, haveproved extremely successful in expanding wind energy inGermany, Spain and Denmark. Operators are paid a fixed pricefor every kWh of electricity they feed into the grid. In Germanythe price paid varies according to the relative maturity of theparticular technology and reduces each year to reflect fallingcosts. The additional cost of the system is borne by taxpayers orelectricity consumers.
13
po
licy recom
men
da
tion
s|
TA
RG
ET
S

187
The main benefit of a FIT is that it is administratively simple andencourages better planning. Although the FIT is not associatedwith a formal Power Purchase Agreement, distribution companiesare usually obliged to purchase all the production from renewableinstallations. Germany has reduced the political risk of the systembeing changed by guaranteeing payments for 20 years. The mainproblem associated with a fixed price system is that it does notlend itself easily to adjustment – whether up or down - to reflectchanges in the production costs of renewable technologies.
Fixed premium systems, sometimes called an “environmentalbonus” mechanism, operate by adding a fixed premium to thebasic wholesale electricity price. From an investor perspective,the total price received per kWh is less predictable than under afeed-in tariff because it depends on a constantly changingelectricity price. From a market perspective, however, it is arguedthat a fixed premium is easier to integrate into the overallelectricity market because those involved will be reacting tomarket price signals. Spain is the most prominent country tohave adopted a fixed premium system.
Tax credits, as operated in the US and Canada, offer a creditagainst tax payments for every kWh produced. In the UnitedStates the market has been driven by a federal Production TaxCredit (PTC) of approximately 1.8 cents per kWh. It is adjustedannually for inflation.
• renewable quota systems Two types of renewable quota systemshave been employed - tendering systems and green certificate systems.
Tendering systems involve competitive bidding for contracts toconstruct and operate a particular project, or a fixed quantity ofrenewable capacity in a country or state. Although other factorsare usually taken into account, the lowest priced bid invariablywins. This system has been used to promote wind power inIreland, France, the UK, Denmark and China.
The downside is that investors can bid an uneconomically lowprice in order to win the contract, and then not build the project.Under the UK’s NFFO (Non-Fossil Fuel Obligation) tendersystem, for example, many contracts remained unused. It waseventually abandoned. If properly designed, however, with longcontracts, a clear link to planning consent and a possible minimumprice, tendering for large scale projects could be effective, as it hasbeen for offshore oil and gas extraction in Europe’s North Sea.
Tradable green certificate (TGC) systems operate by offering“green certificates” for every kWh generated by a renewableproducer. The value of these certificates, which can be traded on amarket, is then added to the value of the basic electricity. A greencertificate system usually operates in combination with a risingquota of renewable electricity generation. Power companies arebound by law to purchase an increasing proportion of renewablesinput. Countries which have adopted this system include the UK,Sweden and Italy in Europe and many individual states in theUS, where it is known as a Renewable Portfolio Standard.
Compared with a fixed tender price, the TGC model is more riskyfor the investor, because the price fluctuates on a daily basis,unless effective markets for long-term certificate (and electricity)contracts are developed. Such markets do not currently exist. Thesystem is also more complex than other payment mechanisms.
Which one out of this range of incentive systems works best?Based on past experience it is clear that policies based on fixedtariffs and premiums can be designed to work effectively.However, introducing them is not a guarantee for success. Almostall countries with experience in mechanisms to supportrenewables have, at some point in time, used feed-in tariffs, butnot all have contributed to an increase in renewable electricityproduction. It is the design of a mechanism, in combination withother measures, which determines its success.
renewables for heating and cooling Largely forgotten, butequally important, is the heating and cooling sector. In manyregions of the world, such as Europe, nearly half of the total energydemand is for heating/cooling, a demand which can be addressedeasily at competitive prices.
Policies should make sure that specific targets and appropriatemeasures for renewable heating and cooling are part of anynational renewables strategy. These should foresee a coherent set ofmeasures dedicated to the promotion of renewables for heating andcooling, including financial incentives, awareness raising campaigns,training of installers, architects and heating engineers, anddemonstration projects. For new buildings, and those undergoingmajor renovation, an obligation to cover a minimum share of heatconsumption by renewables should be introduced, as alreadyimplemented in some countries and regions.
Measures should stimulate the deployment of the large potentialfor cost effective renewable heating and cooling, available alreadywith today’s technologies. At the same time, increased R&D effortsshould be undertaken, particularly in the fields of heat storage andrenewable cooling.
13
po
licy recom
men
da
tion
s|
TA
RG
ET
S
© G
P/V
INA
I D
ITH
AJO
HN
image A YOUNG BOY IS PART OF A GATHERING AT THECLIMATE DEFENDERS CAMP WHERE LOCALCOMMUNITIES AND PRO-RENEWABLE ENERGY GROUPSPLEDGE TO CONTINUE WORK TO HELP STOP CLIMATECHANGE. THE CAMP WAS ESTABLISHED TO OPPOSECOAL POWER PLANT CONSTRUCTION IN ILOILO CITY INTHE PHILIPPINES.

188
GLOBAL ENERGY [R]EVOLUTIONA SUSTAINABLE GLOBAL ENERGY OUTLOOK
14glossary & appendix
GLOBAL GLOSSARYAPPENDIX
14
“because we use suchinefficient lighting, 80 coal fired power plants are running day and night to produce the energy that is wasted.”GREENPEACE INTERNATIONALCLIMATE CAMPAIGN
ima
geC
OA
L F
IRE
D P
OW
ER
PL
AN
T.
© F
. FU
XA
/DR
EA
MST
IME

189
glossary of commonly used terms and abbreviations
CHP Combined Heat and Power CO2 Carbon dioxide, the main greenhouse gasGDP Gross Domestic Product (means of assessing a country’s wealth)PPP Purchasing Power Parity (adjustment to GDP assessment
to reflect comparable standard of living)IEA International Energy Agency
J Joule, a measure of energy: kJ = 1,000 Joules, MJ = 1 million Joules, GJ = 1 billion Joules, PJ = 1015 Joules, EJ = 1018 Joules
W Watt, measure of electrical capacity: kW = 1,000 watts, MW = 1 million watts, GW = 1 billion watts
kWh Kilowatt-hour, measure of electrical output: TWh = 1012 watt-hours
t/Gt Tonnes, measure of weight: Gt = 1 billion tonnes
definition of sectors
The definition of different sectors is analog to the sectorial breakdown of the IEA World Energy Outlook series.
All definitions below are from the IEA Key World Energy Statistics
Industry sector: Consumption in the industry sector includes thefollowing subsectors (energy used for transport by industry is notincluded -> see under “Transport”)
• Iron and steel industry
• Chemical industry
• Non-metallic mineral products e.g. glass, ceramic, cement etc.
• Transport equipment
• Machinery
• Mining
• Food and tobacco
• Paper, pulp and print
• Wood and wood products (other than pulp and paper)
• Construction
• Textile and Leather
Transport sector: The Transport sector includes all fuels fromtransport such as road, railway, aviation, domestic and navigation. Fuelused for ocean, costal and inland fishing is included in “Other Sectors”.
Other sectors: ‘Other sectors’ covers agriculture, forestry, fishing,residential, commercial and public services.
Non-energy use: This category covers use of other petroleumproducts such as paraffin waxes, lubricants, bitumen etc.
© S
. TE
SK
E
image NEXT EXIT ‘SUNSHINE’, CANADA.
conversion factors - fossil fuels
kJ/t
kJ/t
GJ/barrel
kJ/m3
1 cubic
1 barrel
1 US gallon
1 UK gallon
0.0283 m3
159 liter
3.785 liter
4.546 liter
FUEL
Coal
Lignite
Oil
Gas
23.03
8.45
6.12
38000.00
conversion factors - different energy units
Gcal
238.8
1
107
0.252
860
Mbtu
947.8
3.968
3968 x 107
1
3412.00
GWh
0.2778
1.163 x 10⁻³
11630
2.931 x 10⁻⁴
1
FROM
TJ
Gcal
Mtoe
Mbtu
GWh
Mtoe
2.388 x 10⁻⁵
10(-7)
1
2.52 x 10⁻⁸
8.6 x 10⁻⁵
TO: TJMULTIPLY BY
1
4.1868 x 10⁻³
14
glo
ssary &
ap
pen
dix
|G
LO
SS
AR
Y

appendix: global reference scenario
District heating plantsFossil fuelsBiomassSolar collectorsGeothermal
Heat from CHP Fossil fuelsBiomassGeothermal
Direct heating1)
Fossil fuelsBiomassSolar collectorsGeothermal
Total heat supply1)
Fossil fuelsBiomassSolar collectorsGeothermal
RES share (including RES electricity)
1) heat from electricity (direct and from electric heat pumps) not included; covered in the model under ‘electric appliances’
Condensation power plantsCoalLigniteGasOilDiesel
Combined heat & power productionCoalLigniteGasOil
CO2 emissions electricity & steam generationCoalLigniteGasOil & diesel
CO2 emissions by sector% of 1990 emissionsIndustryOther sectorsTransportElectricity & steam generationDistrict heating
Population (Mill.)CO2 emissions per capita (t/capita)
190
GLOBAL ENERGY [R]EVOLUTIONA SUSTAINABLE GLOBAL ENERGY OUTLOOK
appendix: global reference scenario
table 14.1: global: electricity generationTWh/a
table 14.4: global: installed capacity GW
table 14.6: global: primary energy demand PJ/A
table 14.3: global: co2 emissionsMILL t/a
table 14.2: global: heat supplyPJ/A
2010
19,6736,9551,6203,3041,048
282,824
1683,362
2741372
51
2,107567141
1,142104151
2
1,484623
21,78014,910
7,5221,7614,4471,1522,824
284,0473,362
27413
31874
51
1,9581,941
017,890
287
1.3%
18.6%
2020
263209,9571,8134,925
94320
3,068324
4,164887
68119
266
2,487642134
1,331102272
6
1,579908
28,80719,86810,599
1,9476,2561,0453,068
205,8714,164
88768
595125
266
2,5412,579
523,677
961
3.3%
20.4%
2030
32,38013,153
1,9646,376
78617
3,173474
4,8331,260
120158
5412
2,989777137
1,597103367
9
1,8131,177
35,36924,91013,930
2,1017,974
8893,173
177,2864,8331,260
120841167
5412
2,9993,095
1729,256
1,392
3.9%
20.6%
2040
39,23317,505
2,1897,433
72515
3,345578
5,4401,545
167196
7720
3,392901136
1,78098
46612
1,9411,451
42,62630,87218,406
2,3249,213
8233,345
158,4995,4401,545
1671,044
2077720
3,3003,601
2735,698
1,731
4.1%
19.9%
2050
46,84922,892
2,4258,291
73314
3,517650
6,0271,736
213229
9528
3,7571,014
1361,917
60613
17
2,0621,695
50,60637,48223,905
2,56110,208
7933,517
149,6086,0271,736
2131,263
2459528
3,5694,058
4042,938
1,978
3.9%
19.0%
Power plantsCoalLigniteGasOilDieselNuclearBiomassHydroWindPVGeothermalSolar thermal power plantsOcean energy
Combined heat & power productionCoalLigniteGasOilBiomassGeothermalCHP by producerMain activity producersAutoproducers
Total generationFossil
CoalGasLigniteOilDiesel
NuclearRenewables
HydroWindPVBiomassGeothermalSolar thermalOcean energy
Distribution lossesOwn consumption electricityElectricity for hydrogen productionFinal energy consumption (electricity)
Fluctuating RES (PV, Wind, Ocean)Share of fluctuating RES
RES share
2005
16,3115,0891,5322,6311,047
332,768
1242,923
1032
5611
1,915438166
1,088113109
1
1,410505
18,22612,138
5,5271,6983,7191,160
332,7683,3212,923
1032
23458
11
1,5961,597
015,018
106
0.6%
18.2%
2010
4,4151,209
268979371
55369
28989124
1011
20
605172
45301
4442
0
460144
5,0203,4451,382
3131,280
41555
3691,206
989124
107011
20
1342.7%
24.0%
2020
5,9401,758
2961,404
36437
39252
1,215346
4917
82
683181
38360
3568
1
478205
6,6224,4731,939
3331,763
39937
3921,7571,215
34649
11918
82
3966.0%
26.5%
2030
7,2622,342
3231,814
31330
40572
1,399440
862212
4
815211
36465
3171
2
556259
8,0775,5642,554
3582,279
34430
4052,1081,399
44086
1432412
4
5316.6%
26.1%
2040
8,8163,104
3612,236
32425
42686
1,558526120
2815
7
912245
35518
2784
2
602310
9,7276,8753,350
3962,754
35125
4262,4261,558
526120170
3015
7
6526.7%
24.9%
2050
10,7994,060
4022,807
44623
45295
1,711593153
3317
9
995279
35555
15109
3
636359
11,7948,6204,339
4373,362
46123
4522,7221,711
593153203
3617
9
7556.4%
23.1%
Power plantsCoalLigniteGasOilDieselNuclearBiomassHydroWindPVGeothermalSolar thermal power plantsOcean energy
Combined heat & power productionCoalLigniteGasOilBiomassGeothermal
CHP by producerMain activity producersAutoproducers
Total generationFossil
CoalLigniteGasOilDiesel
NuclearRenewables
HydroWindPVBiomassGeothermalSolar thermalOcean energy
Fluctuating RES (PV, Wind, Ocean)Share of fluctuating RES
RES share
2005
3,690874257803354
65368
21878
592910
565141
54281
5632
0
439125
4,2542,8851,015
3111,084
41065
3681,001
87859
252
910
611.4%
23.5%
2010
532,251434,042128,188
18,389111,600175,865
30,81067,39812,103
985409
51,9241,974
212.6%
2020
632,485516,377161,262
18,422135,291201,402
33,47982,62914,989
3,1951,429
59,3753,621
2013.1%
2030
721,342591,380190,020
19,462157,044224,854
34,62395,33917,399
4,5362,572
65,6115,179
4313.2%
2040
794,412652,760211,515
20,907170,244250,093
36,497105,155
19,5855,5613,749
69,8986,289
7213.2%
2050
867,705716,620235,422
22,113180,559278,527
38,372112,713
21,6966,2514,775
72,3507,510
10113.0%
TotalFossilHard coalLigniteNatural gasCrude oil
NuclearRenewablesHydroWindSolarBiomassGeothermalOcean EnergyRES share
2005
474,905383,120103,515
18,12499,741
161,739
30,20161,58610,521
372176
48,5941,921
212.9%
2010
11,0436,8121,8161,611
76341
1,793677225786105
12,8367,4892,0412,396
910
27,932131%4,8633,6456,411
12,442571
6,8944.1
2020
14,4169,5541,8522,284
69432
1,694623193795
83
16,11110,178
2,0453,078
810
33,541157%5,6184,0657,718
15,605535
7,6524.4
2030
17,36411,994
1,9702,769
60230
1,762642190858
72
19,12712,636
2,1603,627
703
38,716181%6,1994,4239,020
18,579496
8,3004.7
2040
19,55113,865
2,1152,987
55727
1,858682205909
61
21,41014,548
2,3213,896
645
43,095201%6,6844,630
10,52120,793
467
8,8034.9
2050
21,90115,964
2,2603,089
56325
1,880716195936
33
23,78116,680
2,4554,025
622
47,773223%7,1384,802
12,28323,106
443
9,1695.2
2005
8,7654,9771,7251,273
74348
1,899621287826165
10,6645,5982,0122,099
956
24,351114%4,2923,4055,800
10,293561
6,5033.7
2010
6,1215,512
5960
13
10,6599,958
68022
131,02997,29833,387
344
148,032112,768
34,663345257
24%
2020
6,3235,545
7591
19
11,96110,721
1,18852
146,045110,049
34,9051,091
165,256126,315
36,8511,091
998
24%
2030
6,5605,4651,070
224
13,21311,740
1,39579
160,350122,267
36,1371,946
181,830139,472
38,6011,9481,809
23%
2040
6,9225,4401,448
232
13,77112,147
1,516107
171,953131,179
37,9022,872
195,064148,766
40,8672,8742,558
24%
2050
7,3345,4481,841
342
14,34912,308
1,889152
182,702139,579
39,4603,664
207,744157,336
43,1893,6673,553
24%
2005
5,9005,305
5840
11
10,1369,637
48911
120,21788,07431,978
165
136,402103,015
33,050166171
24%
table 14.5: global: final energy demandPJ/a 2010
366,401332,134
93,53788,515
2,3901,2321,399
2560
1.6%
105,60228,351
5,4058,138
60921,05815,00925,100
107,914
2113.2%
132,99534,654
6,1997,918
6094,819
22,41626,882
33435,779
19332.4%
58,56416.0%
34,26725,753
6,4462,068
2020
433,428392,504114,452106,246
3,2342,8362,123
42614
2.9%
125,10737,915
7,7368,878
89025,53716,30527,610
1088,560
19514.0%
152,94445,199
9,2018,651
9354,635
25,56430,293
98337,017
60231.9%
69,49116.0%
40,92429,808
8,0063,110
2030
495,497449,948134,667123,913
3,9613,9582,790
57045
3.4%
142,28445,845
9,3979,3321,090
28,27017,59131,076
2019,588
38114.5%
172,99756,68511,796
9,6681,1954,385
27,98133,784
1,74637,693
1,05530.9%
78,68015.9%
45,54832,857
9,2863,405
2040
558,541508,478157,633144,436
4,5395,0343,552
71873
3.7%
158,35854,45510,822
9,5001,235
29,98118,99533,955
31210,600
55914.9%
192,48770,50014,18610,412
1,4824,210
28,78536,566
2,56037,982
1,47330%
86,97515.6%
50,06335,83010,535
3,698
2050
625,878571,298183,081168,647
5,0424,9494,333
852110
3.2%
174,85463,80712,174
9,7301,531
31,66820,17836,765
44411,412
84915.1%
213,36386,43316,42611,165
1,8874,009
29,02139,537
3,21938,025
1,95328.8%
93,73415.0%
54,58038,79511,794
3,992
Total (incl. non-energy use)Total (energy use)TransportOil productsNatural gasBiofuelsElectricity
RES electricityHydrogenRES share Transport
IndustryElectricity
RES electricityDistrict heat
RES district heatCoalOil productsGasSolarBiomass and wasteGeothermalRES share Industry
Other SectorsElectricity
RES electricityDistrict heat
RES district heatCoalOil productsGasSolarBiomass and wasteGeothermalRES share Other Sectors
Total RESRES share
Non energy useOilGasCoal
2005
328,700299,300
83,93680,145
2,077784930173
01.1%
91,75922,251
4,3128,009
50217,35713,62423,172
57,328
1213.3%
123,60530,885
5,2397,308
5334,795
20,76424,972
16034,583
13732.9%
53,77016.4%
29,40122,728
5,4981,174
14
glo
ssary &
ap
pen
dix
|A
PP
EN
DIX
- GL
OB
AL

appendix: global energy [r]evolution scenario
Condensation power plantsCoalLigniteGasOilDiesel
Combined heat & power productionCoalLigniteGasOil
CO2 emissions electricity & steam generationCoalLigniteGasOil & diesel
CO2 emissions by sector% of 2000 emissionsIndustryOther sectorsTransportElectricity & steam generationDistrict heating
Population (Mill.)CO2 emissions per capita (t/capita)
2010
361,501327,393
92,88987,364
2,3921,7181,415
2730
2.1%
102,32127,788
5,6328,6371,099
19,57913,90523,479
2928,279
36215.3%
132,18334,467
6,5968,127
9584,858
21,40326,053
52336,352
40033.9%
62,48417.3%
34,10822,348
9,7422,018
2020
383,814347,127
92,23380,879
2,6924,9963,3651,053
3016.9%
112,29533,91610,74611,668
3,91920,25910,26524,030
1,7579,1981,202
23.9%
142,59838,67312,92310,925
3,4823,624
16,28928,737
4,08038,727
1,54542.6%
93,75024.4%
36,68824,342
9,9362,410
2030
392,442354,335
89,98072,286
2,5007,9966,5723,105
62713.0%
114,02136,58316,97214,128
6,80116,959
6,61623,501
4,5339,5282,174
35.1%
150,33443,21821,60414,090
7,0632,825
11,44626,09310,65338,871
3,13854.1%
132,82833.8%
38,10725,39010,204
2,512
2040
393,451353,803
85,79659,949
2,20110,72611,851
7,7931,069
22.8%
113,58338,49323,77216,83510,79811,263
3,56520,969
7,91010,475
4,07350.2%
154,42348,03632,03616,63710,873
2,2577,029
20,91217,88836,704
4,96066.4%
178,81345.4%
39,64826,47710,558
2,612
2050
390,327349,845
83,30647,723
1,90612,75719,64415,595
1,27635.6%
110,78739,31229,07119,38014,491
4,6041,582
17,09811,92910,748
6,13365.3%
155,75253,12341,94317,37712,858
1,2523,818
14,84524,76932,984
7,58477.1%
221,65856.8%
40,48227,04610,796
2,640
Total (incl. non-energy use)Total (energy use)TransportOil productsNatural gasBiofuelsElectricity
RES electricityHydrogenRES share Transport
IndustryElectricity
RES electricityDistrict heat
RES district heatCoalOil productsGasSolarBiomass and wasteGeothermalRES share Industry
Other SectorsElectricity
RES electricityDistrict heat
RES district heatCoalOil productsGasSolarBiomass and wasteGeothermalRES share Other Sectors
Total RESRES share
Non energy useOilGasCoal
2005
328,700299,300
83,93680,145
2,077784930173
01.1%
91,75922,251
4,3128,009
50217,35713,62423,172
57,328
1213.3%
123,66530,885
5,2397,308
5344,795
20,76424,972
16034,583
13732.9%
53,77016.4%
29,40122,728
5,4981,174
District heating plantsFossil fuelsBiomassSolar collectorsGeothermal
Heat from CHP Fossil fuelsBiomassGeothermal
Direct heating1)
Fossil fuelsBiomassSolar collectorsGeothermal
Total heat supply1)
Fossil fuelsBiomassSolar collectorsGeothermal
RES share (including RES electricity)‘Efficiency’ savings (compared to Ref.)
1) heat from electricity (direct and from electric heat pumps) not included; covered in the model under ‘electric appliances’
191
appendix: global energy [r]evolution scenario
table 14.7: global: electricity generationTWh/a
table 14.10: global: installed capacity GW
table 14.11: global: primary energy demand PJ/A
table 14.9: global co2 emissionsMILL t/a
table 14.8: global: heat supplyPJ/A
2010
193156,6591,4513,474
99126
2,688211
3,334362
2682
93
2,207514127
1,230109219
8
1,493714
21,52314,581
7,1731,5784,7041,100
262,6884,2543,334
36226
43090
93
1,9251,904
017686
3901.8%
19.8%
207
2020
22,5077,587
7264,383
60213
1,647343
4,0102,255
386231267
58
3,237570
701,743
47741
65
1,7891,447
25,74315,741
8,157797
6,126649
131,6478,3554,0102,255
3861,084
296267
58
2,2432,279
12621,095
2,69810.5%
32.5%
2,583
2030
24,8726,874
1934,406
30310
678423
4,4254,3981,351
4881,172
151
4,252696
211,929
121,403
191
2,2112,041
29,12414,444
7,570215
6,335315
10678
14,0024,4254,3981,3511,826
6791,172
151
2,4282,457
30223,937
5,90020.3%
48.1%
5,320
2040
27,5245,101
293,575
855
168531
4,9186,2712,663
8303,010
338
5,392863
01,884
02,221
422
2,6602,731
32,91611,543
5,96529
5,45985
5168
21,2054,9186,2712,6632,7521,2523,010
338
2,5882,592
57027,166
9,27228.2%
64.4%
8,542
2050
30,7143,285
02,321
2130
6705,3487,7384,3491,0485,255
677
64021,006
01,880
02,858
657
2,9743,428
37,1168,5174,291
04,201
2130
28,5995,3487,7384,3493,5271,7055,255
677
2,7672,743
79230,814
12,76434.4%
77.1%
12,145
Power plantsCoalLigniteGasOilDieselNuclearBiomassHydroWindPVGeothermalSolar thermal power plantsOcean energy
Combined heat & power productionCoalLigniteGasOilBiomassGeothermalCHP by producerMain activity producersAutoproducers
Total generationFossil
CoalGasLigniteOilDiesel
NuclearRenewables
HydroWindPVBiomassGeothermalSolar thermalOcean energy
Distribution lossesOwn consumption electricityElectricity for hydrogen productionFinal energy consumption (electricity)
Fluctuating RES (PV, Wind, Ocean)Share of fluctuating RES
RES share
‘Efficiency’ savings (compared to Ref.)
2005
16,3115,0891,5322,6311,047
332,768
1242,923
1032
5611
1,915438166
1,088113109
1
1,410505
18,22612,138
5,5271,6983,7191,160
332,7683,3212,923
1032
23458
11
1,5961,597
015,018
1060.6%
18.2%
0
2010
4,3911,160
2401,025
34951
35235
978164
2112
51
632154
43323
5160
2
467165
5,0233,3951,314
2831,348
40051
3521,276
978164
219514
51
1853.7%
25.4%
2020
5,7471,340
1201,284
23527
21356
1,178893269
338317
859169
21461
18177
13
543316
6,6063,6741,509
1411,745
25327
2132,7191,178
893269233
468317
1,17917.8%
41.2%
2030
7,0401,230
331,320
126198865
1,3001,622
92171
19944
1,085217
6544
4275
38
653431
8,1243,5001,447
391,865
1301989
4,5361,3001,622
921341108199
44
2,58831.8%
55.8%
2040
8,430959
61,155
47112281
1,4432,2201,799
120468
98
1,319280
0546
0411
82
764554
9,7493,0041,239
61,701
481122
6,7231,4432,2201,799
492203468
98
4,11742.2%
69.0%
2050
9,843651
0716
1460
991,5652,7332,911
152801194
1,526325
0557
0521124
837689
11,3692,269
9760
1,27314
60
9,1001,5652,7332,911
620276801194
5,83851.4%
80%
Power plantsCoalLigniteGasOilDieselNuclearBiomassHydroWindPVGeothermalSolar thermal power plantsOcean energy
Combined heat & power productionCoalLigniteGasOilBiomassGeothermal
CHP by producerMain activity producersAutoproducers
Total generationFossil
CoalLigniteGasOilDiesel
NuclearRenewables
HydroWindPVBiomassGeothermalSolar thermalOcean energy
Fluctuating RES (PV, Wind, Ocean)Share of fluctuating RES
RES share
2005
3,690874257803354
65368
21878
592910
565141
54281
5632
0
439125
4,2542,8851,015
3111,084
41065
3681,001
87859
252
910
611.4%
23.5%
2010
524,782422,770122,826
16,613115,011168,321
29,33272,67112,001
1,3011,063
55,3722,934
913.8%7,651
2020
540,753409,286125,197
7,711128,798147,580
17,971113,288
14,4358,1198,978
71,71210,045
20721%
91,434
2030
525,939355,467104,040
2,136123,203126,088
7,397163,075
15,93015,83226,31583,20721,247
54430.9%
195,425
2040
503,437281,284
77,118260
100,995102,912
1,832220,321
17,70622,57650,00692,00336,811
1,21843.6%
291,424
2050
480,861209,962
51,4380
74,59683,927
0270,899
19,25327,85776,44194,77950,131
2,43756.1%
387,023
TotalFossilHard coalLigniteNatural gasCrude oil
NuclearRenewablesHydroWindSolarBiomassGeothermalOcean EnergyRES share‘Efficiency’ savings (compared to Ref.)
2005
474,907383,120103,515
18,12499,741
161,739
30,20161,58410,521
372176
48,5941,921
212.9%
0
2010
10,6306,5611,6271,691
71438
1,756608217824106
12,3867,1691,8442,515
858
26,954126%4,5533,5266,332
11,992550
6,8943.9
2020
10,2316,980
7502,040
44120
1,668577106947
38
11,8997,557
8562,987
500
25,380119%4,4633,2135,891
11,382432
7,6523.3
2030
7,8715,512
2011,916
22617
1,595583
36967
8
9,4666,095
2372,883
251
20,98198%
3,8752,6515,2728,902
281
8,3002.5
2040
5,1733,683
291,390
5912
1,515604
0911
0
6,6884,287
292,301
71
15,58173%
2,9932,0044,3786,078
128
8,8031.8
2050
2,8952,079
0792
159
1,451622
0829
0
4,3462,701
01,622
24
10,58949%
2,0671,3333,4933,675
21
9,1691.15
2005
8,7654,9771,7251,273
74348
1,899621287826165
10,6645,5982,0122,099
956
24,351114%4,2923,4055,800
10,293561
6,5033.7
2010
6,4385,327
910113
88
11,0799,9711,032
76
127,87992,10134,125
815838
145,397107,399
36,067,928
1002
26%2,636
2020
8,1104,6802,011
784636
15,28411,115
3,560608
133,36487,37436,945
5,8373,208
156,757103,169
42,5166,6214,452
34%8,499
2030
9,8453,4412,8592,0451,499
19,20411,453
6,0011,750
133,33474,43437,42115,185
6,294
162,38289,32746,28117,231
9,543
45%19,448
2040
11,4611,6793,4263,7862,571
22,86510,764
8,2863,815
129,71756,22337,08025,79810,617
164,04368,66648,79129,58417,002
58%31,021
2050
11,555325
2,9845,1693,077
26,06910,257
9,9205,892
124,08236,58034,86036,69815,944
161,70547,16147,76441,86724,913
71%46,039
2005
5,9005,305
5840
11
10,1369,637
48911
120,21788,07431,978
165150
136,402103,015
33,050166171
24%0
table 14.12: global: final energy demandPJ/a
14
glo
ssary &
ap
pen
dix
|A
PP
EN
DIX
- GL
OB
AL

District heating plantsFossil fuelsBiomassSolar collectorsGeothermal
Heat from CHP Fossil fuelsBiomassGeothermal
Direct heating1)
Fossil fuelsBiomassSolar collectorsGeothermal
Total heat supply1)
Fossil fuelsBiomassSolar collectorsGeothermal
RES share (including RES electricity)
1) heat from electricity (direct and from electric heat pumps) not included; covered in the model under ‘electric appliances’
192
GLOBAL ENERGY [R]EVOLUTIONA SUSTAINABLE GLOBAL ENERGY OUTLOOK
Condensation power plantsCoalLigniteGasOilDiesel
Combined heat & power productionCoalLigniteGasOil
CO2 emissions electricity & steam generationCoalLigniteGasOil & diesel
CO2 emissions by sector% of 1990 emissionsIndustryOther sectorsTransportElectricity & steam generationDistrict heating
Population (Mill.)CO2 emissions per capita (t/capita)
appendix: oecd north america reference scenario
table 14.13: oecd north america: electricity generationTWh/a
table 14.16: oecd north america: installed capacity GW
table 14.17: oecd north america: primary energy demand PJ/A
table 14.15: oecd north america: CO2 emissionsMILL t/a
table 14.14: oecd north america: heat supplyPJ/A
2010
5,2051,3621,112
767188
9935
55681
624
2910
36057
2233
2147
1
208153
5,5653,7511,4201,1141,000
2099
935879681
624
10230
10
641065
376394
04,795
66
1.2%
15.8%
2020
6,0841,6011,250
970148
61,001
112694225
2246
91
39665
2241
1868
2
217180
6,4814,3011,6661,2521,211
1666
1,0011,179
694225
22180
4891
641365
425450
55,600
248
3.8%
18.2%
2030
6,8702,0411,3191,075
1144
1,045146698324
325615
2
48086
0283
1691
4
267213
7,3504,9382,1271,3191,358
1304
1,0451,367
698324
32237
5915
2
641465
468502
96,372
358
4.9%
18.6%
2040
7,7722,6591,4041,155
903
1,074168704388
406420
4
553113
0313
11110
5
299255
8,3255,7492,7721,4041,468
1013
1,0741,502
704388
40278
6920
4
641565
515560
147,236
432
5.2%
18.0%
2050
8,7463,4401,4941,212
602
1,098176705415
456825
7
632145
0345
4130
9
329303
9,3786,7013,5841,4941,557
642
1,0981,579
705415
45306
7725
7
641665
562627
238,166
467
5.0%
16.8%
Power plantsCoalLigniteGasOilDieselNuclearBiomassHydroWindPVGeothermalSolar thermal power plantsOcean energy
Combined heat & power productionCoalLigniteGasOilBiomassGeothermalCHP by producerMain activity producersAutoproducers
Total generationFossil
CoalGasLigniteOilDiesel
NuclearRenewables
HydroWindPVBiomassGeothermalSolar thermalOcean energy
ImportImport RES
ExportDistribution lossesOwn consumption electricityElectricityFinal energy consumption (electricity)
Fluctuating RES (PV, Wind, Ocean)Share of fluctuating RES
RES share
2005
4,7651,2091,021
666192
12914
44664
190
2410
35355
2235
2140
0
204149
5,1183,4131,2641,023
901212
12914792664
190
8424
10
641065
348367
04,403
19
0.4%
15.5%
2010
1,151220180324
6021
1148
18928
2410
11226
167
712
0
7735
1,263905246181390
6621
114244189
282
20410
302.4%
19.3%
2020
1,322257202361
4813
12116
1909212
630
11325
165
616
0
7340
1,435977282202426
5413
121337190
921232
730
1057.3%
23.5%
2030
1,465333216390
368
12722
190114
18821
12930
074
519
1
8346
1,5941,093
364216464
418
127374190114
1840
921
1338.3%
23.5%
2040
1,613433230404
296
13025
192128
22932
14540
080
321
1
9253
1,7581,225
473230484
326
130403192128
224610
32
1528.7%
22.9%
2050
1,772560245416
204
13326
192136
2610
43
16450
086
225
2
10163
1,9361,382
609245502
214
133422192136
265111
43
1648.5%
21.8%
Power plantsCoalLigniteGasOilDieselNuclearBiomassHydroWindPVGeothermalSolar thermal power plantsOcean energy
Combined heat & power productionCoalLigniteGasOilBiomassGeothermal
CHP by producerMain activity producersAutoproducers
Total generationFossil
CoalLigniteGasOilDiesel
NuclearRenewables
HydroWindPVBiomassGeothermalSolar thermalOcean energy
Fluctuating RES (PV, Wind, Ocean)Share of fluctuating RES
RES share
2005
1,071198168301
5826
1126
18790300
11424
171
711
0
7637
1,184855222169372
6626
112217187
90
17300
90.8%
18.3%
2010
123,563105,718
15,24410,89128,71150,872
10,2027,6432,452
22393
4,424450
16.1%
2020
133,975112,779
16,38510,72130,20555,467
10,92210,274
2,498810312
5,826824
47.6%
2030
144,339120,529
18,78111,36031,48958,899
11,40212,407
2,5131,166
5587,0191,144
78.5%
2040
154,364128,099
22,72511,65432,32661,394
11,71814,546
2,5341,397
8278,3731,400
149.4%
2050
164,342137,565
27,66911,95233,35464,590
11,98014,797
2,5381,4941,0757,9701,695
259.0%
TotalFossilHard coalLigniteNatural gasCrude oil
NuclearRenewablesHydroWindSolarBiomassGeothermalOcean EnergyRES share
2005
115,88898,89114,11710,22626,25948,290
9,9687,0292,390
7058
3,886625
06.0%
2010
2,8951,1971,208
348135
7
12019
18812
3,0151,2171,209
436154
6,851119%
664852
2,3432,991
1
45914.9
2020
3,0651,3791,189
391101
5
10214
17710
3,1671,3931,190
468116
7,297126%
564959
2,6333,136
5
50014.6
2030
3,3501,5941,261
41676
3
12323
090
9
3,4721,6171,261
50689
7,838136%
5491,0172,8363,430
6
53314.7
2040
3,7381,9611,294
42160
2
15541
0107
7
3,8932,0031,294
52869
8,410146%
5401,0333,0003,829
7
55915.0
2050
4,1842,3991,327
41640
2
21175
0133
2
4,3952,4741,327
55044
9,135158%
5631,0283,2434,294
6
57715.8
2005
2,6561,0761,133
301137
9
16351
2101
9
2,8201,1271,135
402155
6,433111%
641768
2,2262,797
0
43614.7
2010
1212
000
687502175
9
23,25420,743
2,3647572
23,95321,258
2,5397581
11.3%
2020
4443
100
833578236
20
24,24721,244
2,518201284
25,12421,864
2,754202304
13.0%
2030
6360
310
1,099770295
34
25,81022,017
2,877391526
26,97322,846
3,175391560
15.3%
2040
7264
610
1,4091,021
34148
26,69522,169
3,241613672
28,17723,254
3,588614720
17.5%
2050
745913
10
1,8811,424
38177
27,55922,317
3,553824866
29,51523,800
3,947825943
19.4%
2005
00000
643488155
0
21,08018,909
2,0815635
21,72319,397
2,2355635
10.7%
table 14.18: oecd north america: final energy demandPJ/a 2010
86,28077,58233,11532,507
30449128
220
1.4%
17,4425,304
927553162
1,2251,9296,849
11,577
415.3%
27,02511,829
1,724115
1984
3,9839,757
751,125
5611.1%
6,1407.9%
8,6987,775
91210
2020
95,01485,71137,76936,515
56816367
7714
2.4%
16,4555,8131,119
582193784
1,7355,957
321,484
6817.6%
31,48713,978
2,421265
5884
4,54710,892
1691,407
14513.3%
7,9919.3%
9,3038,323
96910
2030
103,18793,22641,18239,316
791,096
667145
243.0%
16,5976,0601,136
685221610
1,7335,789
661,543
11118.5%
35,44716,209
2,935447105
644,948
11,412324
1,759283
15.3%
9,72810.4%
9,9618,9201,030
10
2040
110,769100,159
44,37541,573
1051,6391,017
21641
4.2%
16,8376,3261,117
828248422
1,7195,639
1121,654
13719.4%
38,94718,702
3,322623141
444,945
11,703501
2,052376
16.4%
11,52411.5%
10,6109,5091,090
10
2050
118,571107,316
47,46944,924
134976
1,369269
662.6%
17,4946,7701,1221,076
287308
1,7295,592
1501,679
19019.6%
42,35321,253
3,520849179
414,561
12,120674
2,373482
17.1%
11,90211.1%
11,25510,094
1,15010
Total (incl. non-energy use)Total (energy use)TransportOil productsNatural gasBiofuelsElectricity
RES electricityHydrogenRES share Transport
IndustryElectricity
RES electricityDistrict heat
RES district heatCoalOil productsGasSolarBiomass and wasteGeothermalRES share Industry
Other SectorsElectricity
RES electricityDistrict heat
RES district heatCoalOil productsGasSolarBiomass and wasteGeothermalRES share Other Sectors
Total RESRES share
Non energy useOilGasCoal
2005
80,22472,21831,31030,884
25355
4712
01.2%
16,0674,456
813465139
1,2181,9616,433
01,529
415.5%
24,84011,348
1,567147
14120
3,6428,659
56837
3110.1%
5,3577.4%
8,0067,147
84910
14
glo
ssary &
ap
pen
dix
|A
PP
EN
DIX
- OE
CD
NO
RT
H A
ME
RIC
A

193
2010
83,74374,48332,46631,811
31499125
240
1.6%
15,3374,960
957660279750
1,5375,802
1601,424
4418.7%
26,68011,702
1,905294135324
3,7349,253
1271,194
5212.8%
6,8019.1%
9,2604,5264,268
466
2020
82,20174,00330,41927,176
642,404
585253190
8.7%
14,3325,1201,9321,411
847299905
4,684356
1,373185
32.7%
29,25212,051
4,4381,412
9910
2,52910,541
4712,061
18827.9%
15,57921.1%
8,1984,0163,765
417
2030
79,82672,15227,52021,887
893,8351,354
846355
17.0%
13,7195,0132,9312,0321,516
41480
3,708738
1,404304
50.2%
30,91312,615
7,3863,0972,572
221,3548,6942,1562,453
52248.8%
26,90937.3%
7,6743,7633,516
395
2040
73,20665,72722,29714,311
1004,6882,6562,107
54230.5%
13,1064,7933,7382,5572,213
6199
2,679951
1,381540
67.3%
30,32412,718
9,9424,2623,689
5800
6,0223,2712,396
85166.4%
36,20855.1%
7,4803,6703,424
386
2050
62,72155,45916,721
6,74679
5,1084,2714,004
51754.5%
12,3564,1923,9192,7492,503
4177
2,0411,1221,360
71177.8%
26,38312,15111,330
3,7693,259
1652
3,9643,2581,748
84077.5%
39,37571.0%
7,2623,5653,321
376
Total (incl. non-energy use)Total (energy use)TransportOil productsNatural gasBiofuelsElectricity
RES electricityHydrogenRES share Transport
IndustryElectricity
RES electricityDistrict heat
RES district heatCoalOil productsGasSolarBiomass and wasteGeothermalRES share Industry
Other SectorsElectricity
RES electricityDistrict heat
RES district heatCoalOil productsGasSolarBiomass and wasteGeothermalRES share Other Sectors
Total RESRES share
Non energy useOilGasCoal
2005
80,22472,21831,31030,884
25355
4712
01.2%
16,0674,456
813465139
1,2181,9616,433
01,529
415.5%
24,84011,348
1,567147
14120
3,6428,659
56837
3110.1%
5,3577.4%
8,0067,147
84910
District heating plantsFossil fuelsBiomassSolar collectorsGeothermal
Heat from CHP Fossil fuelsBiomassGeothermal
Direct heating1)
Fossil fuelsBiomassSolar collectorsGeothermal
Total heat supply1)
Fossil fuelsBiomassSolar collectorsGeothermal
RES share (including RES electricity)‘Efficiency’ savings (compared to Ref.)
1) heat from electricity (direct and from electric heat pumps) not included; covered in the model under ‘electric appliances’
Condensation power plantsCoalLigniteGasOilDiesel
Combined heat & power productionCoalLigniteGasOil
CO2 emissions electricity & steam generationCoalLigniteGasOil & diesel
CO2 emissions by sector% of 1990 emissionsIndustryOther sectorsTransportElectricity & steam generationDistrict heating
Population (Mill.)CO2 emissions per capita (t/capita)
table 14.19: oecd north america: electricity generationTWh/a
table 14.22: oecd north america: installed capacity GW
table 14.23: oecd north america:primary energy demand PJ/A
table 14.21: oecd north america: CO2 emissionsMILL t/a
table 14.20: oecd north america: heat supplyPJ/A
2010
4,9901,271
979831168
8848
69690
784
4032
42152
1282
2260
3
215206
5,4113,6151,323
9801,113
1908
848948690
784
12943
32
641065
365383
04,663
831.5%
17.5%
134
2020
5,0821,090
4721,078
514
40880
794697137138115
19
71121
0482
16178
14
277434
5,7933,2141,111
4721,560
674
4082,172
794697137258152115
19
641365
385398
784,932
85314.7%
37.5%
668
2030
5,366961
86975
282
5383
8431,173
400333376
53
86850
4510
37834
320548
6,2342,508
96686
1,42628
253
3,673843
1,173400461367376
53
641465
403418140
5,273
162626.1%
58.9%
1,100
2040
5,680361
0752
517
84878
1,414720586752120
97910
3170
60457
353626
6,6591,437
3610
1,069517
5,215878
1,414720688643752120
641565
411438207
5,602
2,25433.9%
78.3%
1,644
2050
5,70019
0175
000
85902
1,5341,018
7141,078
175
1,05600
2470
73375
386670
6,756442
190
422000
6,315902
1,5341,018
818789
1,078175
641665
401438191
5,726
2,72740.4%
93.5%
2,461
Power plantsCoalLigniteGasOilDieselNuclearBiomassHydroWindPVGeothermalSolar thermal power plantsOcean energy
Combined heat & power productionCoalLigniteGasOilBiomassGeothermalCHP by producerMain activity producersAutoproducers
Total generationFossil
CoalGasLigniteOilDiesel
NuclearRenewables
HydroWindPVBiomassGeothermalSolar thermalOcean energy
ImportImport RES
ExportDistribution lossesOwn consumption electricityElectricity for hydrogen productionFinal energy consumption (electricity)
Fluctuating RES (PV, Wind, Ocean)Share of fluctuating RES
RES share
‘Efficiency’ savings (compared to Ref.)
2005
4,7651,2091,021
666192
12914
44664
190
2410
35355
2235
2140
0
204149
5,118341312641023
901212
12914792664
190
8424
10
641065
348367
04,403
190.4%
15.5%
0
2010
1,140205
158.9353
5319
103.59.8
19235.4
2.25.52.00.6
12523
179
715
1
7748
1,265899228160432
5919
104263192
352
25621
383.0%
20.8%
2020
1,412175
76.1435
161049
11.5217
284.577.219.534.1
5.5
17980
1234
413
8495
1,591848184
76558
201049
693217284
77522234
5
36723.1%
43.6%
2030
1,602157
14.1403
956
12.2230
413.5227.1
48.161.615.3
19410
1080
787
78116
1,796698158
14511
956
1,092230414227
90556215
65636.5%
60.8%
2040
1,75459
0322
22.5
112.3239
469.3409.7
84.8117.8
34.2
19900
700
11711
73126
1,953456
590
392231
1,496239469410130
96118
34
91346.8%
76.6%
2050
1,71830
57000
12.4246
504.5577.5103.3163.9
50.5
20800
520
14115
75132
1,926112
30
109000
1,814246504577153118164
51
1,13358.8%
94.2%
Power plantsCoalLigniteGasOilDieselNuclearBiomassHydroWindPVGeothermalSolar thermal power plantsOcean energy
Combined heat & power productionCoalLigniteGasOilBiomassGeothermal
CHP by producerMain activity producersAutoproducers
Total generationFossil
CoalLigniteGasOilDiesel
NuclearRenewables
HydroWindPVBiomassGeothermalSolar thermalOcean energy
Fluctuating RES (PV, Wind, Ocean)Share of fluctuating RES
RES share
2005
1,071198168301
5826
1126
18790300
11424
171
711
0
7637
1,184855222169372
6626
112217187
90
17300
90.8%
18.3%
2010
119,660101,704
14,5369,595
31,60445,970
9,2478,7092,484
279365
4,827747
77.2%3,917
2020
111,06386,67811,395
4,04634,00937,228
4,44619,939
2,8582,5092,0739,7022,729
6817.9%22,934
2030
102,97468,313
9,201741
29,17229,200
57834,082
3,0354,2236,574
13,7586,302
19133.0%41,434
2040
92,41645,908
3,9110
22,11419,883
7646,432
3,1615,090
10,90416,22110,623
43250.2%62,037
2050
77,69726,617
1,1750
13,91111,531
051,079
3,2475,522
13,23015,90312,547
63065.7%86,736
TotalFossilHard coalLigniteNatural gasCrude oil
NuclearRenewablesHydroWindSolarBiomassGeothermalOcean EnergyRES share‘Efficiency’ savings (compared to Ref.)
2005
115,88898,89114,11710,22626,25948,290
9,9687,0292,390
7058
3,886625
06.0%
2010
2,6911,132
1,064.2371
116.97
13218
1102
10
2,8231,1501,065
474134
6,452112%
540828
2,2932,791
0
45914.1
2020
1,869928
449.1454
34.93.3
16460
1508
2,034934449604
46
5,13189%410790
1,9611,969
0
50010.3
2030
1,243751
82.2389
18.71.6
14820
1460
1,391753
82535
21
3,80866%299613
1,5821,314
0
5337.1
2040
553266
02833.30.8
12110
1210
675267
0404
4
2,27239%202438
1,037595
0
5594.1
2050
7314
060
00
9700
970
17014
0157
0
1,05818%156316491
950
5771.8
2005
2,6561,0761,133
301137
9
16351
2101
9
2,8201,1271,135
402155
6,433111%
641768
2,2262,797
0
43614.7
2010
2110
1204645
848595226
27
21,31518,640
2,280287108
22,37319,235
2,626333180
14%
1,580
2020
1,1430
538332273
1,7911,022
644125
21,16816,918
2,959827464
24,10217,940
4,1411,159
862
26%
1,022
2030
2,6070
1,098886623
2,6341,0601,272
302
20,14512,845
3,3302,8941,076
25,38613,905
5,6993,7812,002
45%
1,586
2040
3,5560
1,3241,383
849
3,377928
1,937513
17,9388,6263,2814,2231,809
24,8729,5536,5415,6053,172
62%
3,305
2050
3,0090
9971,305
707
3,624765
2,182677
15,0315,9402,7314,3791,981
21,6646,7055,9105,6843,365
69%
7,850
2005
00000
643488155
0
21,08018,909
2,0815635
21,72319,397
2,2355635
11%
table 14.24: oecd north america: final energy demandPJ/a
appendix: oecd north america energy [r]evolution scenario
14
glo
ssary &
ap
pen
dix
|A
PP
EN
DIX
- OE
CD
NO
RT
H A
ME
RIC
A

194
GLOBAL ENERGY [R]EVOLUTIONA SUSTAINABLE GLOBAL ENERGY OUTLOOK
District heating plantsFossil fuelsBiomassSolar collectorsGeothermal
Heat from CHP Fossil fuelsBiomassGeothermal
Direct heating1)
Fossil fuelsBiomassSolar collectorsGeothermal
Total heat supply1)
Fossil fuelsBiomassSolar collectorsGeothermal
RES share (including RES electricity)
1) heat from electricity (direct and from electric heat pumps) not included; covered in the model under ‘electric appliances’
Condensation power plantsCoalLigniteGasOilDiesel
Combined heat & power productionCoalLigniteGasOil
CO2 emissions electricity & steam generationCoalLigniteGasOil & diesel
CO2 emissions by sector% of 1990 emissionsIndustryOther sectorsTransportElectricity & steam generationDistrict heating
Population (Mill.)CO2 emissions per capita (t/capita)
appendix: latin america reference scenario
table 14.25: latin america: electricity generationTWh/a
table 14.28: latin america: installed capacity GW
table 14.29: latin america: primary energy demand PJ/A
table 14.27: latin america: CO2 emissionsMILL t/a
table 14.26: latin america: heat supplyPJ/A
2010
1,13224
9237
747
2725
72240300
5104000
05
1,137356
269
24174
727
754722
40
25300
661264
18442
0914
4
0.4%
66.3%
2020
1,5573614
4356036
436
91513
1700
3980
29020
039
1,596586
4414
46460
436
974915
131
38700
941790
23372
01,295
14
0.9%
61.0%
2030
1,9785623
64141
23448
1,09522
212
20
7313
055
050
073
2,051831
6923
69641
234
1,1861,095
222
5312
20
12322
118264
910
1,701
24
1.2%
57.8%
2040
2,510185
35857
352
3259
1,25031
317
30
9515
071
090
095
2,6051,200
20135
92835
232
1,3731,250
313
6817
30
15928
153266139
02,206
35
1.3%
52.7%
2050
3,158423
501,085
352
3071
1,39041
623
40
10014
075
011
0
0100
3,2581,683
43750
1,16035
230
1,5451,390
416
8223
40
20236
195264191
02,811
47
1.4%
47.4%
Power plantsCoalLigniteGasOilDieselNuclearBiomassHydroWindPVGeothermalSolar thermal power plantsOcean energy
Combined heat & power productionCoalLigniteGasOilBiomassGeothermalCHP by producerMain activity producersAutoproducers
Total generationFossil
CoalLigniteGasOilDiesel
NuclearRenewables
HydroWindPVBiomassGeothermalSolar thermalOcean energy
ImportImport RES
ExportDistribution lossesOwn consumption electricityElectricity for hydrogen productionFinal energy consumption (electricity)
Fluctuating RES (PV, Wind, Ocean)Share of fluctuating RES
RES share
2005
90618
6128
878
1719
61900200
0000000
00
906248
186
12887
817
641619
00
19200
539
51147
280
734
0
0%
70.8%
2010
2795
1.2781810
3.94.6
1571.8
00.5
00
1001000
01
280113
51
791810
3.9164157
20
4.6000
1.80.7%
58.4%
2020
4036
2.0152
206
5.16.1
1995.20.71.00.1
0
9206000
09
412194
82
15820
65.1
212199
51
6.5100
5.91.4%
51.6%
2030
50910
3.1214
163
4.97.2
2389.01.31.80.4
0
1630
12010
016
525261
133
22516
34.9
259238
91
8.3200
10.32.0%
49.3%
2040
65737
4.9295
153
4.68.2
27211.9
2.32.70.5
0
2040
14020
020
677373
415
31015
34.6
299272
122
10310
14.22.1%
44.2%
2050
84694
7.1388
163
4.39.1
30215.5
4.13.50.5
0
2130
15020
021
867526
977
40216
34.3
337302
154
11.4310
19.62.3%
38.9%
Power plantsCoalLigniteGasOilDieselNuclearBiomassHydroWindPVGeothermalSolar thermal power plantsOcean energy
Combined heat & power productionCoalLigniteGasOilBiomassGeothermal
CHP by producerMain activity producersAutoproducers
Total generationFossil
CoalLigniteGasOilDiesel
NuclearRenewables
HydroWindPVBiomassGeothermalSolar thermalOcean energy
Fluctuating RES (PV, Wind, Ocean)Share of fluctuating RES
RES share
2005
2134
0.8391711
2.43.8
1350.2
00.4
00
0000000
00
21372
41
391711
2.4139135
00
3.8000
0.20.1%
65.1%
2010
24,03116,860
1,048110
5,52610,176
2956,8762,599
142
4,158102
027.9%
2020
30,19621,510
1,245160
8,15911,946
3938,2943,294
467
4,718229
026.7%
2030
36,37426,199
1,507234
10,60113,857
3719,8033,942
7921
5,372389
026.2%
2040
43,85932,550
2,652332
13,28216,284
34910,961
4,500113
365,777
5350
24.3%
2050
52,26839,867
4,478448
15,95518,985
32712,074
5,004147
506,198
6750
22.5%
TotalFossilHard coalLigniteNatural gasCrude oil
NuclearRenewablesHydroWindSolarBiomassGeothermalOcean EnergyRES share
2005
21,14314,730
89478
4,2469,511
1836,2302,229
12
3,90989
028.7%
2010
2192512
1165015
31020
2232712
11965
954144%
234128372219
0
4792.0
2020
2923418
19342
6
2160
140
3134018
20748
1,220184%
293181453292
0
5342.3
2030
3654926
25929
3
3410
024
0
3985826
28332
1,481223%
346224546365
0
5802.6
2040
551149
37339
242
3910
029
0
590159
37367
26
1,873282%
394266662551
0
6133.1
2050
810315
50421
232
3890
290
849324
50450
25
2,350354%
439310791810
0
6323.7
2005
17420
9675920
00000
17420
96779
827125%
189120344174
0
4501.8
2010
00000
2828
00
6,5134,0772,433
20
6,5414,1052,433
20
37.2%
2020
22000
176167
90
7,7655,2002,524
239
7,9435,3692,533
239
32.4%
2030
44000
274255
190
8,9616,2322,633
790
9,2386,4902,652
790
29.7%
2040
55000
308280
280
10,2177,2962,756
12153
10,5297,5812,784
12153
28.0%
2050
55000
308274
340
11,5568,4122,897
16231
11,8698,6902,931
16231
26.8%
2005
00000
0000
5,9113,5272,381
20
5,9113,5272,381
20
40.3%
table 14.30: latin america: final energy demandPJ/a 2010
18,72417,365
5,5955,017
192377
960
6.8%
6,5721,5551,031
280
4201,4761,455
01,639
040.6%
5,1981,7271,145
000
1,331512
21,626
053.4%
5,82631.1%
1,358917436
6
2020
23,33821,708
6,9336,185
137601
1060
8.8%
8,1682,2061,347
1760
4591,7451,759
01,811
1338.8%
6,6082,4471,493
008
1,841767
21,534
946.0%
6,81629.2%
1,6301,100
5237
2030
28,11126,210
8,4857,499
95880
1160
10.4%
9,7002,9091,682
2740
5002,0062,071
01,911
3037.4%
8,0253,2031,852
00
382,1431,074
71,538
2142.6%
7,92728.2%
1,9021,283
6108
2040
33,40931,23610,216
9,13665
1,00313
70
9.9%
11,3883,7881,996
3080
5372,2842,397
02,023
5135.7%
9,6314,1412,182
00
622,4511,385
121,544
3639.2%
8,85426.5%
2,1731,467
6979
2050
39,29536,85012,13510,948
421,127
1890
9.4%
13,2694,8422,296
3080
5712,5842,741
02,147
7734.1%
11,4465,2582,493
00
802,7741,707
161,557
5436.0%
9,77524.9%
2,4451,650
78410
Total (incl. non-energy use)Total (energy use)TransportOil productsNatural gasBiofuelsElectricity
RES electricityHydrogenRES share Transport
IndustryElectricity
RES electricityDistrict heat
RES district heatCoalOil productsGasSolarBiomass and wasteGeothermalRES share Industry
Other SectorsElectricity
RES electricityDistrict heat
RES district heatCoalOil productsGasSolarBiomass and wasteGeothermalRES share Other Sectors
Total RESRES share
Non energy useOilGasCoal
2005
16,70615,484
5,1314,598
232292
960
5.8%
5,6831,255
88800
3331,1011,348
01,647
044.6%
4,6701,377
974004
1,231492
21,563
054.4%
5,37332.2%
1,222825392
5
14
glo
ssary &
ap
pen
dix
|A
PP
EN
DIX
- LA
TIN
AM
ER
ICA

195
2010
18,65717,288
5,5955,001
253326
1410
06.0%
6,5471,5551,094
13171
3661,1261,534
191,781
3545.8%
5,1461,7241,213
85
351,145
507128
1,58118
57.2%
6,28036.3%
1,369924439
6
2020
20,38418,894
5,7184,952
258459
4940
08.7%
7,2881,9831,629
517403318667
1,570220
1,91299
58.5%
5,8881,8631,531
230179
0883610270
1,890142
68.1%
8,77646.4%
1,4901,006
4786
2030
21,83320,242
5,8424,640
257747180158
1715.8%
7,7222,3292,053
592462130482
1,607374
2,049159
66.0%
6,6792,1061,856
464362
0706570479
2,083271
75.6%
11,06854.7%
1,5911,074
5107
2040
23,33621,637
5,9653,824
2501,205
638589
4830.8%
7,9782,6852,479
815682
29116
1,598400
2,139196
73.9%
7,6942,6062,407
626524
0367518890
2,280407
84.6%
14,24165.8%
1,6991,147
5457
2050
25,04923,229
6,0892,552
2311,8651,3551,282
8553.0%
8,1363,0152,8541,1161,010
664
1,248409
2,041237
80.5%
9,0053,3743,193
772698
0247385
1,2402,426
56290.2%
17,89777.0%
1,8201,228
5848
Total (incl. non-energy use)Total (energy use)TransportOil productsNatural gasBiofuelsElectricity
RES electricityHydrogenRES share Transport
IndustryElectricity
RES electricityDistrict heat
RES district heatCoalOil productsGasSolarBiomass and wasteGeothermalRES share Industry
Other SectorsElectricity
RES electricityDistrict heat
RES district heatCoalOil productsGasSolarBiomass and wasteGeothermalRES share Other Sectors
Total RESRES share
Non energy useOilGasCoal
2005
16,70615,484
5,1314,598
232292
960
5.8%
5,6831,255
88800
3331,1011,348
01,647
044.6%
4,6701,377
974004
1,231492
21,563
054.4%
5,37332.2%
1,222825392
5
District heating plantsFossil fuelsBiomassSolar collectorsGeothermal
Heat from CHP Fossil fuelsBiomassGeothermal
Direct heating1)
Fossil fuelsBiomassSolar collectorsGeothermal
Total heat supply1)
Fossil fuelsBiomassSolar collectorsGeothermal
RES share (including RES electricity)‘Efficiency’ savings (compared to Ref.)
1) heat from electricity (direct and from electric heat pumps) not included; covered in the model under ‘electric appliances’
Condensation power plantsCoalLigniteGasOilDiesel
Combined heat & power productionCoalLigniteGasOil
CO2 emissions electricity & steam generationCoalLigniteGasOil & diesel
CO2 emissions by sector% of 1990 emissionsIndustryOther sectorsTransportElectricity & steam generationDistrict heating
Population (Mill.)CO2 emissions per capita (t/capita)
table 14.31: latin america: electricity generationTWh/a
table 14.34: latin america: installed capacity GW
table 14.35: latin america: primary energy demand PJ/A
table 14.33: latin america: CO2 emissionsMILL t/a
table 14.32: latin america: heat supplyPJ/A
2010
1,10720
4200
787
1840
73061400
240090
150
321
1,130317
204
20978
718
796730
61
55400
661264
191.027.0
0914
70.6%
70.4%
0
2020
1,21350
16520
21885
770115
148
102
12000
290
847
15105
1,333220
50
19420
218
1,095770115
14169
1510
2
771474
212.042.0
0.21,082
1319.8%
82.2%
213
2030
1,38712
0124
025
110785215
801535
4
19200
440
13512
35157
1,579182
120
168025
1,392785215
80245
2735
4
891685
219.075.0
71,282
29918.9%
88.1%
419
2040
1,75160
100000
155800470110
208010
26600
480
18533
48218
2,017155
60
148000
1,863800470110340
538010
10519
101234.0122.0
181,647
59029.2%
92.3%
559
2050
2,28010
91200
234822720160
25200
25
33500
460
22861
60275
2,615140
10
137200
2,475822720160462
86200
25
12522
121253.0183.0
322,151
90534.6%
94.6%
659
Power plantsCoalLigniteGasOilDieselNuclearBiomassHydroWindPVGeothermalSolar thermal power plantsOcean energy
Combined heat & power productionCoalLigniteGasOilBiomassGeothermalCHP by producerMain activity producersAutoproducers
Total generationFossil
CoalLigniteGasOilDiesel
NuclearRenewables
HydroWindPVBiomassGeothermalSolar thermalOcean energy
ImportImport RES
ExportDistribution lossesOwn consumption electricityElectricity for hydrogen productionFinal energy consumption (electricity)
Fluctuating RES (PV, Wind, Ocean)Share of fluctuating RES
RES share
‘Efficiency’ savings (compared to Ref.)
2005
90618
6128
878
1719
61900200
0000000
00
906248
186
12887
817
641619
00
19200
539
51147
280
734
00%
70.8%
2010
2714
0.5661910
2.57.4
1592.70.50.6
00
6002040
15
277101
41
681910
2.5174159
31
11100
3.21.2%
62.6%
2020
31410
587
2.92.5
14.1167
46.910
1.23.20.6
270070
191
423
34175
10
6473
2.5264167
471033
331
57.516.9%
77.4%
2030
38920
410
2.90.7
16.6171
87.857.1
2.35.81.1
4100
110
282
833
43057
20
5203
0.7372171
885745
561
146.034.0%
86.6%
2040
50710
34000
21.5174
178.778.6
3.112.7
2.9
5500
110
376
1144
56247
10
46000
515174179
7959
913
3
260.146.3%
91.6%
2050
67200
33100
30179
273.8114.3
3.830.8
7.1
6700
110
4512
1355
73944
00
43100
695179274114
751631
7
395.253.5%
94.0%
Power plantsCoalLigniteGasOilDieselNuclearBiomassHydroWindPVGeothermalSolar thermal power plantsOcean energy
Combined heat & power productionCoalLigniteGasOilBiomassGeothermal
CHP by producerMain activity producersAutoproducers
Total generationFossil
CoalLigniteGasOilDiesel
NuclearRenewables
HydroWindPVBiomassGeothermalSolar thermalOcean energy
Fluctuating RES (PV, Wind, Ocean)Share of fluctuating RES
RES share
2005
2134
0.83917
10.92.43.8
1350.2
00.4
00
0000000
00
21372
41
391711
2.4139135
00
3.8000
0.20.1%
65.1%
2010
23,71616,019
96548
5,3699,636
1917,5062,628
22150
4,505201
030.8%
302
2020
25,20113,995
7070
5,2718,018
19111,014
2,772414590
6,502729
742.4%4,944
2030
26,94712,695
5820
4,9327,181
5514,198
2,826774
1,2968,0491,239
1451.1%9,349
2040
29,36710,741
4250
4,6815,634
018,626
2,8801,6922,0359,8552,129
3661.4%14,366
2050
32,4848,570
3550
3,9864,229
023,915
2,9592,5923,050
11,9863,237
9071.1%19,582
TotalFossilHard coalLigniteNatural gasCrude oil
NuclearRenewablesHydroWindSolarBiomassGeothermalOcean EnergyRES share‘Efficiency’ savings (compared to Ref.)
2005
21,14314,730
89478
4,2469,511
1836,2302,229
12
3,90989
028.7%
2010
19221
5.498
53.215
50050
19821
5104
68
894135%
208117375193
0
4791.9
2020
9540
7313.9
3
1500
150
10940
8817
749113%
173106371
981
5341.4
2030
6310
050
02.5
2100
210
8310
071
2
65599%143
93349
701
5801.1
2040
4550
4000
2200
220
6750
620
51377%105
65290
530
6130.8
2050
3710
351.4
0
2000
200
5810
561
36956%
7948
19745
0
6320.6
2005
17420
9675920
00000
17420
96779
827125%
189120344174
0
4501.8
2010
81501
1335080
3
6,4093,7002,508
14853
6,5493,7522,594
14856
43%
-9
2020
15117
1051415
608134415
59
6,7943,1722,862
490269
7,5523,3233,383
504343
56%
390
2030
18913
1292819
883179603101
7,2132,7373,140
853482
8,2852,9293,872
882602
65%
953
2040
3006
1896045
1,165177711277
7,4242,0443,3861,291
703
8,8882,2274,2861,3511,025
75%
1,641
2050
4210
232105
84
1,500161813526
7,5431,4593,4441,649
991
9,4641,6194,4891,7541,602
83%
2405
2005
00000
0000
5,9113,5272,381
20
5,9113,5272,381
20
40.3%
table 14.36: latin america: final energy demandPJ/a
appendix: latin america energy [r]evolution scenario
14
glo
ssary &
ap
pen
dix
|A
PP
EN
DIX
- LA
TIN
AM
ER
ICA
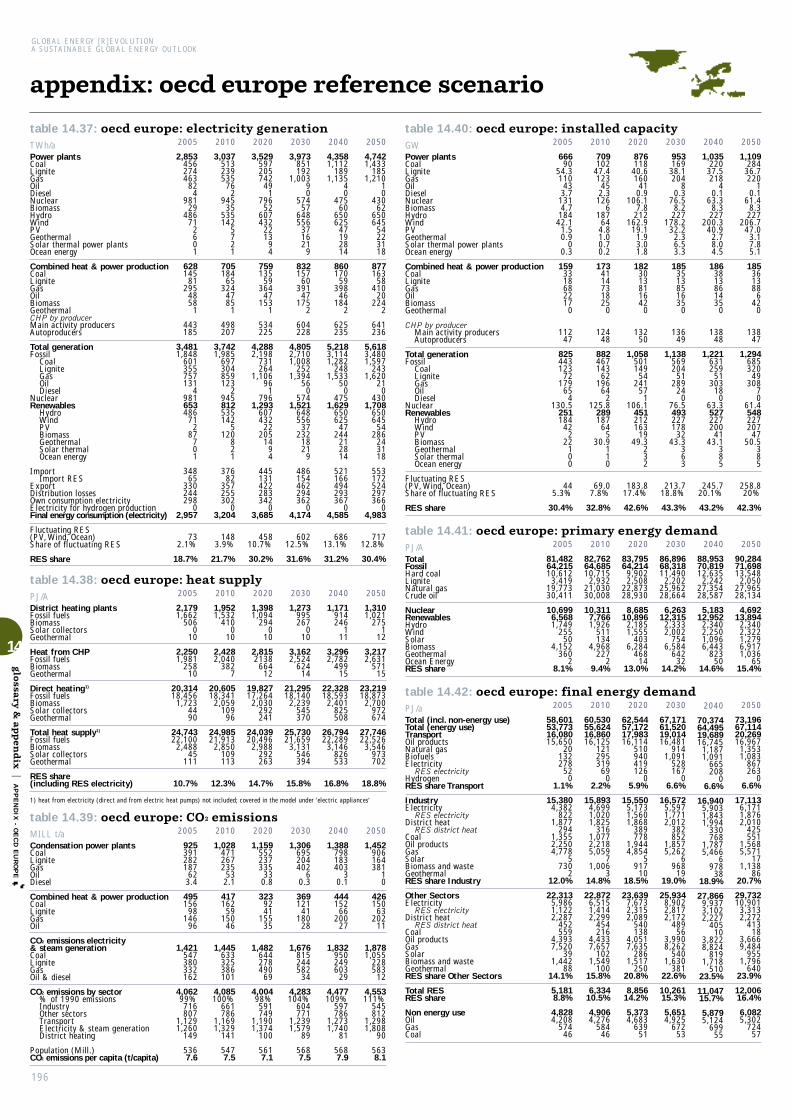
196
GLOBAL ENERGY [R]EVOLUTIONA SUSTAINABLE GLOBAL ENERGY OUTLOOK
District heating plantsFossil fuelsBiomassSolar collectorsGeothermal
Heat from CHP Fossil fuelsBiomassGeothermal
Direct heating1)
Fossil fuelsBiomassSolar collectorsGeothermal
Total heat supply1)
Fossil fuelsBiomassSolar collectorsGeothermal
RES share (including RES electricity)
1) heat from electricity (direct and from electric heat pumps) not included; covered in the model under ‘electric appliances’
Condensation power plantsCoalLigniteGasOilDiesel
Combined heat & power productionCoalLigniteGasOil
CO2 emissions electricity & steam generationCoalLigniteGasOil & diesel
CO2 emissions by sector% of 1990 emissionsIndustryOther sectorsTransportElectricity & steam generationDistrict heating
Population (Mill.)CO2 emissions per capita (t/capita)
appendix: oecd europe reference scenario
table 14.37: oecd europe: electricity generationTWh/a
table 14.40: oecd europe: installed capacity GW
table 14.41: oecd europe: primary energy demand PJ/A
table 14.39: oecd europe: CO2 emissionsMILL t/a
table 14.38: oecd europe: heat supplyPJ/A
2010
3,037513239535
762
94535
535142
5721
705184
65324
4785
1
498207
3,7421,985
697304859123
2945812535142
5120
821
37682
357255302
03,204
1483.9%
21.7%
2020
3,529597205742
491
79652
607432
2213
94
759135
59364
47153
1
534225
4,2882,198
731264
1,10696
1796
1,293607432
22205
1494
445131422283342
03,685
45810.7%
30.2%
2030
3,973851192
1,00390
57457
648556
371621
9
832157
60391
47175
2
604228
4,8052,7101,008
2521,394
560
5741,521
648556
37232
1821
9
486154462294362
04,174
60212.5%
31.6%
2040
4,3581,112
1891,135
40
47560
650625
47192814
860170
59398
46184
2
625235
5,2183,1141,282
2481,533
500
4751,629
650625
47244
212814
521166494293367
04,585
68613.1%
31.2%
2050
4,7421,433
1851,210
10
43062
650645
54223118
877163
58410
20224
2
641236
5,6183,4801,597
2431,620
210
4301,708
650645
54286
243118
553172524297366
04,983
71712.8%
30.4%
Power plantsCoalLigniteGasOilDieselNuclearBiomassHydroWindPVGeothermalSolar thermal power plantsOcean energy
Combined heat & power productionCoalLigniteGasOilBiomassGeothermalCHP by producerMain activity producersAutoproducers
Total generationFossil
CoalLigniteGasOilDiesel
NuclearRenewables
HydroWindPVBiomassGeothermalSolar thermalOcean energy
ImportImport RES
ExportDistribution lossesOwn consumption electricityElectricity for hydrogen productionFinal energy consumption (electricity)
Fluctuating RES (PV, Wind, Ocean)Share of fluctuating RES
RES share
2005
2,853456274463
824
98129
48671
2601
628145
81295
4858
1
443185
3,4811,848
601355757131
4981653486
712
87701
34865
330244298
02,957
732.1%
18.7%
2010
709102
47.4123
452.3
1266
18764
4.81.00.70.2
1734114731825
0
12448
882467143
62196
642
125.8289187
645
30.9110
69.07.8%
32.8%
2020
876118
40.6160
410.9
106.17.8
212162.9
19.11.93.01.8
1823013811642
0
13250
1,058501149
54241
571
106.1451212163
1949.3
232
183.817.4%
42.6%
2030
953169
38.1204
80.3
76.58.2
227178.2
32.22.36.53.3
1853513851635
0
13649
1,138569204
51289
240
76.5493227178
3243.3
363
213.718.8%
43.3%
2040
1,035220
37.5218
40.1
63.38.3
227200.3
40.92.78.04.5
1863813861435
0
13848
1,221631259
51303
180
63.3527227200
4143.1
385
245.720.1%
43.2%
2050
1,109284
36.7220
10.1
61.48.3
227206.7
47.03.17.85.1
185361388
642
0
13847
1,294685320
49308
70
61.4548227207
4750.5
385
258.820%
42.3%
Power plantsCoalLigniteGasOilDieselNuclearBiomassHydroWindPVGeothermalSolar thermal power plantsOcean energy
Combined heat & power productionCoalLigniteGasOilBiomassGeothermal
CHP by producerMain activity producersAutoproducers
Total generationFossil
CoalLigniteGasOilDiesel
NuclearRenewables
HydroWindPVBiomassGeothermalSolar thermalOcean energy
Fluctuating RES (PV, Wind, Ocean)Share of fluctuating RES
RES share
2005
66690
54.3110
433.7
1314.7
18442.1
1.50.9
00.3
1593318682217
0
11247
825443123
72179
654
130.5251184
422
22100
445.3%
30.4%
2010
82,76264,68510,715
2,93221,03030,008
10,3117,7661,926
511134
4,968227
29.4%
2020
83,79564,214
9,9022,508
22,87328,930
8,68510,896
2,1851,555
4036,284
46814
13.0%
2030
86,89668,31811,490
2,20225,96228,664
6,26312,315
2,3332,002
7546,584
64232
14.2%
2040
88,95370,81912,635
2,24227,35428,587
5,18312,952
2,3402,2501,0966,443
82350
14.6%
2050
90,28471,69813,548
2,05027,96528,134
4,69213,894
2,3402,3221,2796,9171,036
6515.4%
TotalFossilHard coalLigniteNatural gasCrude oil
NuclearRenewablesHydroWindSolarBiomassGeothermalOcean EnergyRES share
2005
81,48264,21510,612
3,41919,77330,411
10,6996,5681,749
25550
4,152360
28.1%
2010
1,028471267235
532.1
417162
59150
46
1,445633325386101
4,085100%
661786
1,1691,329
141
5477.5
2020
1,159552237335
330.8
3239241
15535
1,482644278490
69
4,00498%591749
1,1901,374
100
5617.1
2030
1,306695204402
60.3
369121
41180
28
1,676815244582
34
4,283104%
604771
1,2391,579
89
5687.5
2040
1,388798183403
30.1
444152
66200
27
1,832950249603
29
4,477109%
597786
1,2731,740
81
5687.9
2050
1,452906164381
10
426150
63202
11
1,8781,055
228583
12
4,553111%
545812
1,2981,808
90
5638.1
2005
925391282187
623.4
495156
98146
96
1,421547380332162
4,06299%716807
1,1291,260
149
5367.6
2010
1,9521,532
4100
10
2,4282,040
3827
20,60518,341
2,059109
96
24,98521,913
2,850109113
12.3%
2020
1,3981,094
2940
10
2,8152138
66412
19,82717,264
2,030292241
24,03920,496
2,988292263
14.7%
2030
1,273995267
010
3,1622,524
62414
21,29518,140
2,239545370
25,73021,659
3,131546394
15.8%
2040
1,171914246
111
3,2962,782
49915
22,32818,593
2,401825508
26,79422,289
3,146826533
16.8%
2050
1,3101,021
2751
12
3,2172,631
57115
23,21918,873
2,700972674
27,74622,526
3,546973702
18.8%
2005
2,1791,662
5060
10
2,2501,981
25810
20,31418,456
1,7234490
24,74322,100
2,48845
111
10.7%
table 14.42: oecd europe: final energy demandPJ/a 2010
60,53055,62416,86016,125
121295319
690
2.2%
15,8934,6991,0201,825
3161,0772,2185,059
71,006
314.8%
22,8726,5151,4142,299
454216
4,4337,657
1021,549
10015.8%
6,33410.5%
4,9064,276
58446
2020
62,54457,17217,98316,114
510940419126
05.9%
15,5505,1731,5601,868
389778
1,9444,854
5917
1018.5%
23,6397,6732,3152,089
540138
4,0517,635
2861,517
25020.8%
8,85614.2%
5,3734,683
63951
2030
67,17161,52019,01416,481
9141,091
528167
06.6%
16,5725,5971,7712,012
382852
1,8575,262
6968
1919.0%
25,9348,9022,8172,172
48956
3,9908,262
5401,630
38122.6%
10,26115.3%
5,6514,925
67253
2040
70,37464,49519,68916,745
1,1871,091
665208
06.6%
16,9405,9031,8431,994
330768
1,7875,466
6978
3818.9%
27,8669,9373,1022,227
40510
3,8228,824
8191,718
51023.5%
11,04715.7%
5,8795,124
69955
2050
73,19667,11420,26916,967
1,3531,083
867263
06.6%
17,1136,1711,8762,010
425551
1,5685,571
171,138
8620.7%
29,73210,901
3,3132,272
41318
3,6669,484
9551,796
64023.9%
12,00616.4%
6,0825,302
72457
Total (incl. non-energy use)Total (energy use)TransportOil productsNatural gasBiofuelsElectricity
RES electricityHydrogenRES share Transport
IndustryElectricity
RES electricityDistrict heat
RES district heatCoalOil productsGasSolarBiomass and wasteGeothermalRES share Industry
Other SectorsElectricity
RES electricityDistrict heat
RES district heatCoalOil productsGasSolarBiomass and wasteGeothermalRES share Other Sectors
Total RESRES share
Non energy useOilGasCoal
2005
58,60153,77316,08015,650
20132278
520
1.1%
15,3804,382
8221,877
2941,3552,2504,778
5730
212.0%
22,3135,9861,1222,287
452559
4,3937,520
391,442
8814.1%
5,1818.8%
4,8284,208
57446
14
glo
ssary &
ap
pen
dix
|A
PP
EN
DIX
- OE
CD
EU
RO
PE

197
2010
59,68754,78116,86015,747
120669324
760
4.4%
15,3744,6411,0882,124
506255
2,4314,450
451,242
18519.9%
22,5476,3541,4902,355
561415
4,3646,919
721,939
13018.6%
8,00313.4%
4,9064,276
58446
2020
54,20648,83314,37712,217
4001,201
465193
9510%
13,6364,4631,8552,234
803113
1,4753,498
2211,338
29433.1%
20,8216,1912,5732,701
97176
3,0675,949
3292,195
31230.6%
12,32522.7%
5,3734,683
63951
2030
49,55343,90211,770
9,136283
1,409780458162
16.7%
12,4304,1402,4312,4101,190
8694
2,968721
1,069422
46.9%
19,7026,1173,5932,8141,390
611,7895,1131,4931,871
44444.6%
16,58433.5%
5,6514,925
67253
2040
46,63040,751
9,7795,882
1261,7551,7631,367
25233.9%
12,0383,9133,0352,4901,748
39270
2,758983885700
61.1%
18,9345,8214,5153,0272,125
19965
4,6912,3261,510
57658.4%
21,72046.6%
5,8795,124
69955
2050
45,31439,231
8,6933,529
521,8103,0432,610
25953.4%
11,9083,8793,3272,6072,263
770
2,5961,175
709865
70%
18,6305,7484,9303,2712,839
16448
4,3382,9271,193
68867.5%
25,55956.4%
6,0825,302
72457
Total (incl. non-energy use)Total (energy use)TransportOil productsNatural gasBiofuelsElectricity
RES electricityHydrogenRES share Transport
IndustryElectricity
RES electricityDistrict heat
RES district heatCoalOil productsGasSolarBiomass and wasteGeothermalRES share Industry
Other SectorsElectricity
RES electricityDistrict heat
RES district heatCoalOil productsGasSolarBiomass and wasteGeothermalRES share Other Sectors
Total RESRES share
Non energy useOilGasCoal
2005
58,60153,77316,08015,650
20132278
520
1.1%
15,3804,382
8221,877
2941,3552,2504,778
5730
212.0%
22,3135,9861,1222,287
452559
4,3937,520
391,442
8814.1%
5,1818.8%
4,8284,208
57446
District heating plantsFossil fuelsBiomassSolar collectorsGeothermal
Heat from CHP Fossil fuelsBiomassGeothermal
Direct heating1)
Fossil fuelsBiomassSolar collectorsGeothermal
Total heat supply1)
Fossil fuelsBiomassSolar collectorsGeothermal
RES share (including RES electricity)‘Efficiency’ savings (compared to Ref.)
1) heat from electricity (direct and from electric heat pumps) not included; covered in the model under ‘electric appliances’
Condensation power plantsCoalLigniteGasOilDiesel
Combined heat & power productionCoalLigniteGasOil
CO2 emissions electricity & steam generationCoalLigniteGasOil & diesel
CO2 emissions by sector% of 1990 emissionsIndustryOther sectorsTransportElectricity & steam generationDistrict heating
Population (Mill.)CO2 emissions per capita (t/capita)
table 14.43: oecd europe: electricity generationTWh/a
table 14.46: oecd europe: installed capacity GW
table 14.47: oecd europe: primary energy demand PJ/A
table 14.45: oecd europe: CO2 emissionsMILL t/a
table 14.44: oecd europe: heat supplyPJ/A
2010
2,960444230537
702
92540
498194
11621
712168
49340
46106
3
487225
3,6721,886
612279877116
2925861498194
11146
921
37682
357251.0296.0
03,144
2065.6%
23.4%
60
2020
2,767302101630
341
42045
513570110
1126
3
832113
26460
16209
9
516316
3,5991,683
415127
109050
1420
1,496513570110254
2026
3
445138384
241.0291.0
383,089
68319.0%
41.6%
596
2030
2,539104
33565
120
15557
517793215
205413
85242
5475
8298
25
503349
3,3911,244
14638
104020
0155
1,991517793215355
455413
486292255220
272.064
3,066
1,02130.1%
58.7%
1,108
2040
2,3583415
23300
2270
520964330
459332
85530
4140
37860
475380
3,213699
3715
64700
222,492
520964330448105
9332
660649120
206.0257.0
963,194
1,32641.3%
77.6%
1,391
2050
2,43910
0125
000
80520
1040410
75125
54
81300
3280
40777
408405
3,252463
100
453000
2,789520
1040410487152125
54
910906
78210
258.096
3,520
1,50446.3%
85.8%
1,463
Power plantsCoalLigniteGasOilDieselNuclearBiomassHydroWindPVGeothermalSolar thermal power plantsOcean energy
Combined heat & power productionCoalLigniteGasOilBiomassGeothermalCHP by producerMain activity producersAutoproducers
Total generationFossil
CoalLigniteGasOilDiesel
NuclearRenewables
HydroWindPVBiomassGeothermalSolar thermalOcean energy
ImportImport RES
ExportDistribution lossesOwn consumption electricityElectricity for hydrogen productionFinal energy consumption (electricity)
Fluctuating RES (PV, Wind, Ocean)Share of fluctuating RES
RES share
‘Efficiency’ savings (compared to Ref.)
2005
2,853456274463
824
98129
48671
2601
628145
81295
4858
1
443185
3,4811,848
601355757131
4981653486
712
87701
34865
330244298
02,957
732.1%
18.7%
2010
70588
45.6124
422.3
123.26.3
17487.510.5
0.90.70.3
1783811772131
1
12652
883447126
56200
632
123.2312174
871037
210
98.211.1%
35.4%
2020
8106020
13628
0.956.0
6.8179
214.995.7
1.68.71.5
19525
6102
754
2
12670
1,005385
8526
23835
156.0564179215
9661
391
312.131.1%
56.1%
2030
82821
6.5115
110.3
20.78.2
181254.2187.0
2.916.6
4.8
18391
1033
615
10974
1,011270
308
21814
020.7720181254187
698
175
446.044.1%
71.2%
2040
8887
3.045
00.12.99.7
182309.0287.0
6.426.610.3
17310
880
7312
9777
1,062143
73
13300
2.9915182309287
82182710
606.357.1%
86.2%
2050
96420
230
0.10
10.7182
333.3356.5
10.731.315.4
16200
690
7815
8181
1,12693
20
91000
1,033182333357
88263115
705.362.6%
91.7%
Power plantsCoalLigniteGasOilDieselNuclearBiomassHydroWindPVGeothermalSolar thermal power plantsOcean energy
Combined heat & power productionCoalLigniteGasOilBiomassGeothermal
CHP by producerMain activity producersAutoproducers
Total generationFossil
CoalLigniteGasOilDiesel
NuclearRenewables
HydroWindPVBiomassGeothermalSolar thermalOcean energy
Fluctuating RES (PV, Wind, Ocean)Share of fluctuating RES
RES share
2005
66690
54.3110
433.7
130.54.7
18442.1
1.50.9
00.3
1593318682217
0
11247
825443123
72179
654
130.5251184
422
22.0100
43.95.3%
30.4%
2010
81,43261,498
9,2192,711
19,90429,664
10,0939,8421,793
698207
6,611530
212.0%1,289
2020
69,14349,681
5,9871,216
19,73322,746
4,58314,879
1,8472,0521,1798,6521,137
1221.2%14,094
2030
58,89237,644
2,745346
17,38017,173
1,69119,557
1,8612,8553,6529,0122,130
4733.3%26,776
2040
52,20227,196
1,443131
13,16812,454
24024,767
1,8723,4705,9619,2594,090
11549.5%35,096
2050
48,91821,000
1,1450
10,4949,361
027,917
1,8723,7447,8508,9865,271
19459.6%38,617
TotalFossilHard coalLigniteNatural gasCrude oil
NuclearRenewablesHydroWindSolarBiomassGeothermalOcean EnergyRES share‘Efficiency’ savings (compared to Ref.)
2005
81,48264,21510,612
3,41919,77330,411
10,6996,5681,749
25550
4,152360
28.1%
2010
952408
256.7236
48.52.1
391147
44158
42
1,343555301394
92
3,83794%563757
1,1421,230
145
5477.0
2020
705280
117.0285
23.00.8
3027518
19811
1,007355135482
35
2,89571%419574903900
99
5615.2
2030
35585
35.02267.90.3
25832
3217
5
612118
38444
13
1,99049%311429675516
59
5683.5
2040
12224
14.683
00.1
20330
2000
3252715
2830
1,28931%254339432246
19
5682.3
2050
4560
3900
15100
1510
19660
1900
88422%223280258122
0
5631.6
2005
925391282187
623.4
495156
98146
96
1,421547380332162
4,06299%716807
1,1291,260
149
5367.6
2010
2,1911,601
5264420
2,4941,993
47130
19,66916,652
2,564117337
24,35320,246
3,561160386
17%
632
2020
1,9941,167
578140110
3,1452,189
88077
16,74512,583
2,946550666
21,88415,939
4,404689852
27%
2,155
2030
2,046798552471225
3,3832,0751,084
223
15,1409,4272,5342,213
966
20,56912,300
4,1712,6841,415
40%
5,161
2040
2,454294614
1,129417
3,2671,6301,094
543
14,6797,7932,1333,3091,444
20,4009,7173,8414,4382,404
52%
6,394
2050
3,0880
7101,822
556
2,9941,1921,106
696
14,3126,7011,7504,1021,758
20,3947,8933,5675,9243,010
61%
7,352
2005
2,1791,662
5060
10
2,2501,981
25810
20,31418,456
1,7234490
24,74322,100
2,48845
111
10.7%
table 14.48: oecd europe: final energy demandPJ/a
appendix: oecd europe energy [r]evolution scenario
14
glo
ssary &
ap
pen
dix
|A
PP
EN
DIX
- OE
CD
EU
RO
PE
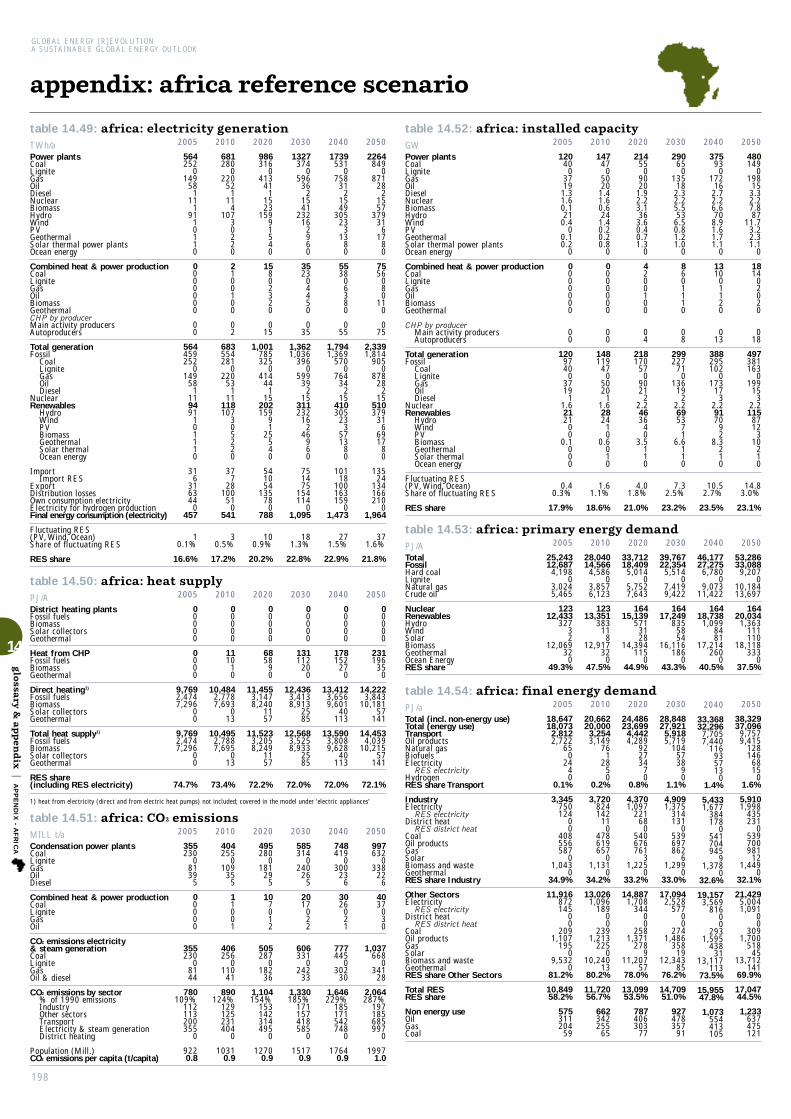
Condensation power plantsCoalLigniteGasOilDiesel
Combined heat & power productionCoalLigniteGasOil
CO2 emissions electricity & steam generationCoalLigniteGasOil & diesel
CO2 emissions by sector% of 1990 emissionsIndustryOther sectorsTransportElectricity & steam generationDistrict heating
Population (Mill.)CO2 emissions per capita (t/capita)
198
GLOBAL ENERGY [R]EVOLUTIONA SUSTAINABLE GLOBAL ENERGY OUTLOOK
District heating plantsFossil fuelsBiomassSolar collectorsGeothermal
Heat from CHP Fossil fuelsBiomassGeothermal
Direct heating1)
Fossil fuelsBiomassSolar collectorsGeothermal
Total heat supply1)
Fossil fuelsBiomassSolar collectorsGeothermal
RES share (including RES electricity)
1) heat from electricity (direct and from electric heat pumps) not included; covered in the model under ‘electric appliances’
appendix: africa reference scenario
table 14.49: africa: electricity generationTWh/a
table 14.52: africa: installed capacity GW
table 14.53: africa: primary energy demand PJ/A
table 14.51: africa: CO2 emissionsMILL t/a
table 14.50: africa: heat supplyPJ/A
2010
681280
0220
521
114
10730220
2100100
02
683554281
0220
531
11118107
305220
377
28100
510
541
30.5%
17.2%
2020
986316
0413
411
1523
15991540
15802320
015
1,001785325
0414
441
15202159
91
25540
541054
13578
0788
100.9%
20.2%
2030
1327374
0596
362
1541
23216
2960
3523
04450
035
1,3621,036
3960
59939
215
311232
162
46960
751475
154114
01,095
181.3%
22.8%
2040
1739531
0758
312
1549
30523
313
80
5538
06380
055
1,7941,369
5700
76434
215
410305
233
5713
80
10118
100163159
01,473
271.5%
22.9%
2050
2264849
0871
282
1557
37931
617
80
7556
080
110
075
2,3391,814
9050
87828
215
510379
316
6917
80
13524
134166210
01,964
371.6%
21.8%
Power plantsCoalLigniteGasOilDieselNuclearBiomassHydroWindPVGeothermalSolar thermal power plantsOcean energy
Combined heat & power productionCoalLigniteGasOilBiomassGeothermalCHP by producerMain activity producersAutoproducers
Total generationFossil
CoalLigniteGasOilDiesel
NuclearRenewables
HydroWindPVBiomassGeothermalSolar thermalOcean energy
ImportImport RES
ExportDistribution lossesOwn consumption electricityElectricity for hydrogen productionFinal energy consumption (electricity)
Fluctuating RES (PV, Wind, Ocean)Share of fluctuating RES
RES share
2005
564252
0149
581
111
9110110
0000000
00
564459252
0149
581
119491
101110
316
316344
0457
10.1%
16.6%
2010
14747
05020
1.41.60.624
1.40.20.20.8
0
0000000
00
148119
470
5020
11.62824
10
0.6010
1.61.1%
18.6%
2020
21455
09020
1.92.23.136
3.60.40.71.3
0
4200100
04
218170
570
9021
22.24636
40
3.5110
4.01.8%
21.0%
2030
29065
0135
182.32.25.553
6.50.81.21.0
0
8601110
08
299227
710
13619
22.26953
71
6.6110
7.32.5%
23.2%
2040
37593
0172
162.72.26.670
8.91.61.71.1
0
1310
01120
013
388295102
0173
173
2.29170
92
8.3210
10.52.7%
23.5%
2050
480149
0198
153.32.27.887
11.73.22.31.1
0
1814
02020
018
497381163
0199
153
2.2115
8712
310
210
14.83.0%
23.1%
Power plantsCoalLigniteGasOilDieselNuclearBiomassHydroWindPVGeothermalSolar thermal power plantsOcean energy
Combined heat & power productionCoalLigniteGasOilBiomassGeothermal
CHP by producerMain activity producersAutoproducers
Total generationFossil
CoalLigniteGasOilDiesel
NuclearRenewables
HydroWindPVBiomassGeothermalSolar thermalOcean energy
Fluctuating RES (PV, Wind, Ocean)Share of fluctuating RES
RES share
2005
12040
03719
1.31.60.121
0.40
0.10.2
0
0000000
00
1209740
03719
11.62121
00
0.1000
0.40.3%
17.9%
2010
28,04014,566
4,5860
3,8576,123
12313,351
38311
812,917
320
47.5%
2020
33,71218,409
5,0140
5,7527,643
16415,139
5713128
14,394115
044.9%
2030
39,76722,354
5,5140
7,4199,422
16417,249
8355854
16,116186
043.3%
2040
46,17727,275
6,7800
9,07311,422
16418,738
1,0998481
17,214260
040.5%
2050
53,28633,088
9,2070
10,18413,697
16420,034
1,363111110
18,118333
037.5%
TotalFossilHard coalLigniteNatural gasCrude oil
NuclearRenewablesHydroWindSolarBiomassGeothermalOcean EnergyRES share
2005
25,24312,687
4,1980
3,0245,465
12312,433
32732
12,06932
049.3%
2010
404255
0109
355
11001
406256
0110
41
890124%
129125231404
0
10310.9
2020
495280
0181
295
107012
505287
0182
36
1,104154%
153142314495
0
12700.9
2030
585314
0240
265
2017
022
606331
0242
33
1,330185%
171157418585
0
15170.9
2040
748419
0300
236
3026
021
777445
0302
30
1,646229%
185171542748
0
17640.9
2050
997632
0338
226
4037
030
1,037668
0341
28
2,064287%
197185685997
0
19971.0
2005
355230
08139
5
00000
355230
08144
780109%
112113200355
0
9220.8
2010
00000
1110
10
10,4842,7787,693
013
10,4952,7887,695
013
73.4%
2020
00000
6858
90
11,4553,1478,240
1157
11,5233,2058,249
1157
72.2%
2030
00000
131112
200
12,4363,4138,913
2585
12,5683,5258,933
2585
72.0%
2040
00000
178152
270
13,4123,6569,601
40113
13,5903,8089,628
40113
72.0%
2050
00000
231196
350
14,2223,843
10,18157
141
14,4534,039
10,21557
141
72.1%
2005
00000
0000
9,7692,4747,296
00
9,7692,4747,296
00
74.7%
table 14.54: africa: final energy demandPJ/a 2010
20,66220,000
3,2543,149
761
2850
0.2%
3,720824142
110
478619657
01,131
034.2%
13,0261,096
18900
2391,213
2250
10,24013
80.2%
11,72056.7%
662342255
65
2020
24,48623,699
4,4424,289
922734
70
0.8%
4,3701,097
22168
0540676761
31,225
033.2%
14,8871,708
34400
2581,371
2789
11,20757
78.0%
13,09953.5%
787406303
77
2030
28,84827,921
5,9185,719
1045738
90
1.1%
4,9091,375
314131
0539697862
61,299
033.0%
17,0942,528
57700
2741,486
35819
12,34385
76.2%
14,70951.0%
927478357
91
2040
33,36832,296
7,7057,440
116935713
01.4%
5,4331,677
384178
0541704945
91,378
032.6%
19,1573,569
81600
2931,595
43831
13,117113
73.5%
15,95547.8%
1,073554413105
2050
38,32937,096
9,7579,415
128146
6815
01.6%
5,9101,998
435231
0539700981
121,449
032.1%
21,4295,0041,091
00
3091,700
51845
13,712141
69.9%
17,04744.5%
1,233637475121
Total (incl. non-energy use)Total (energy use)TransportOil productsNatural gasBiofuelsElectricity
RES electricityHydrogenRES share Transport
IndustryElectricity
RES electricityDistrict heat
RES district heatCoalOil productsGasSolarBiomass and wasteGeothermalRES share Industry
Other SectorsElectricity
RES electricityDistrict heat
RES district heatCoalOil productsGasSolarBiomass and wasteGeothermalRES share Other Sectors
Total RESRES share
Non energy useOilGasCoal
2005
18,64718,073
2,8122,722
650
2440
0.1%
3,345750124
00
408556587
01,043
034.9%
11,916872145
00
2091,107
1950
9,5320
81.2%
10,84958.2%
575311204
59
14
glo
ssary &
ap
pen
dix
|A
PP
EN
DIX
- AF
RIC
A

199
2010
20,66520,003
3,2543,149
761
2850
0.2%
3,720824143
110
478619658
01,131
034.2%
13,0291,099
19000
2391,212
2260
10,24013
80.2%
11,72356.7%
662342255
65
2020
22,92422,174
3,7593,626
81134010
00.6%
3,933995251170
15446485673
571,084
2336.4%
14,4821,505
38000
2821,025
603367
10,66733
79.0%
12,90056.3%
750387289
74
2030
25,26224,412
4,2654,093
78385622
01.4%
4,0161,115
439418
32377322631126966
6340.4%
16,1321,956
77000
305961926859
11,07749
79.1%
14,43957.2%
850439327
84
2040
27,35926,409
4,7704,518
7476
10360
02.9%
4,1111,229
716573
34323187616199894
9047.0%
17,5272,5731,499
00
327900
1,1261,650
10,89359
80.5%
16,17059.1%
950491366
93
2050
29,33628,286
5,2764,914
66130164121
04.8%
4,0711,337
981664
36271
82565254790109
53.3%
18,9393,3342,446
00
353825
1,2842,531
10,54468
82.3%
18,01061.4%
1,050542405103
Total (incl. non-energy use)Total (energy use)TransportOil productsNatural gasBiofuelsElectricity
RES electricityHydrogenRES share Transport
IndustryElectricity
RES electricityDistrict heat
RES district heatCoalOil productsGasSolarBiomass and wasteGeothermalRES share Industry
Other SectorsElectricity
RES electricityDistrict heat
RES district heatCoalOil productsGasSolarBiomass and wasteGeothermalRES share Other Sectors
Total RESRES share
Non energy useOilGasCoal
2005
18,64718,073
2,8122,722
650
2440
0.1%
3,345750124
00
408556587
01,043
034.9%
11,916872145
00
2091,107
1950
9,5320
81.2%
10,84958.2%
575311204
59
District heating plantsFossil fuelsBiomassSolar collectorsGeothermal
Heat from CHP Fossil fuelsBiomassGeothermal
Direct heating1)
Fossil fuelsBiomassSolar collectorsGeothermal
Total heat supply1)
Fossil fuelsBiomassSolar collectorsGeothermal
RES share (including RES electricity)‘Efficiency’ savings (compared to Ref.)
1) heat from electricity (direct and from electric heat pumps) not included; covered in the model under ‘electric appliances’
Condensation power plantsCoalLigniteGasOilDiesel
Combined heat & power productionCoalLigniteGasOil
CO2 emissions electricity & steam generationCoalLigniteGasOil & diesel
CO2 emissions by sector% of 1990 emissionsIndustryOther sectorsTransportElectricity & steam generationDistrict heating
Population (Mill.)CO2 emissions per capita (t/capita)
appendix: africa energy [r]evolution scenario
table 14.55: africa: electricity generationTWh/a
table 14.58: africa: installed capacity GW
table 14.59: africa: primary energy demand PJ/A
table 14.57: africa: CO2 emissionsMILL t/a
table 14.56: africa: heat supplyPJ/A
2010
682280
0220
521
114
10731220
2100100
02
684554281
0220
531
11118107
315220
379
28100.2
51.00
542
40.6%
17.3%
0
2020
880315
0293
4018
17130
2515
430
2
3416
010
053
430
914675331
0303
4018
231130
251522
730
2
481967
113.875.8
0706
424.6%
25.3%
83
2030
1,050316
0286
2020
16150
51110
490
6
9544
027
01410
1085
1,146694360
0313
2020
451150
51110
301590
6
5929
123123.7
89.60
868
16714.6%
39.4%
227
2040
1,496287
0281
1020
18170
82210
7420
10
14262
042
02216
17125
1,639684349
0323
1020
955170
82210
4023
42010
7344
390132.7104.3
01,085
30218.4%
58.3%
389
2050
1,907184
0242
520
21195133350
11750
15
16970
051
02721
19150
2,076553253
0292
520
1,523195133350
4832
75015
9070
562140.8119.9
01,343
49824.0%
73.4%
620
Power plantsCoalLigniteGasOilDieselNuclearBiomassHydroWindPVGeothermalSolar thermal power plantsOcean energy
Combined heat & power productionCoalLigniteGasOilBiomassGeothermalCHP by producerMain activity producersAutoproducers
Total generationFossil
CoalLigniteGasOilDiesel
NuclearRenewables
HydroWindPVBiomassGeothermalSolar thermalOcean energy
ImportImport RES
ExportDistribution lossesOwn consumption electricityElectricity for hydrogen productionFinal energy consumption (electricity)
Fluctuating RES (PV, Wind, Ocean)Share of fluctuating RES
RES share
‘Efficiency’ savings (compared to Ref.)
2005
564252
0149
581
111
9110110
0000000
00
564459252
0149
581
119491
101110
316
316344
0457
10.1%
16.6%
0
2010
14847
05020
1.41.60.624
1.40.50.21.0
0
0000000
00
148119
470
5020
11.62824
101010
1.81.2%
18.8%
2020
20155
06419
1.91.22.330
10.17.60.59.70.6
8402011
17
210146
590
6619
21.2623010
831
101
18.38.7%
29.7%
2030
26155
06510
2.30
2.234
20.755.0
0.614.3
1.7
2311
06032
319
283150
660
7110
20
134342155
53
142
77.427.3%
47.2%
2040
36050
064
52.7
02.539
31.2105.0
0.957.5
2.9
3316
010
043
628
394147
660
74530
2463931
10574
583
139.035.3%
62.6%
2050
47232
055
33.3
02.845
50.6175.0
1.51004.3
3918
012
054
633
511123
500
67330
3884551
17586
1004
229.945.0%
76.0%
Power plantsCoalLigniteGasOilDieselNuclearBiomassHydroWindPVGeothermalSolar thermal power plantsOcean energy
Combined heat & power productionCoalLigniteGasOilBiomassGeothermal
CHP by producerMain activity producersAutoproducers
Total generationFossil
CoalLigniteGasOilDiesel
NuclearRenewables
HydroWindPVBiomassGeothermalSolar thermalOcean energy
Fluctuating RES (PV, Wind, Ocean)Share of fluctuating RES
RES share
2005
12040
03719
1.31.60.121
0.40
0.10.2
0
0000000
00
1209740
03719
11.62121
00
0.1000
0.40.3%
17.9%
2010
28,04514,568
4,5880
3,8596,121
12313,354
3831110
12,91732
047.6%
15
2020
31,17016,238
4,9960
4,9346,308
8714,845
46889
58713,488
2057
47.6%2,646
2030
33,48516,713
5,0270
5,2016,484
016,772
540183
1,70413,830
49422
49.9%6,584
2040
36,40516,902
4,6880
5,5286,685
019,504
612295
4,11813,710
73336
52.4%11,057
2050
38,34716,055
3,7490
5,3846,923
022,292
702479
6,74413,382
93054
56.4%16,743
TotalFossilHard coalLigniteNatural gasCrude oil
NuclearRenewablesHydroWindSolarBiomassGeothermalOcean EnergyRES share‘Efficiency’ savings (compared to Ref.)
2005
25,24312,687
4,1980
3,0245,465
12312,433
32732
12,06932
049.3%
2010
405255
0109
35.45
11001
406256
0110
41
890124%
129125231405
0
10310.9
2020
440279
0129
27.85
1913
050
459292
0134
33
977136%
132136266443
0
12700.8
2030
401266
0115
14.25
4532
012
0
446298
0128
20
991138%
134152299406
0
15170.7
2040
350226
01117.5
6
6243
019
0
412269
0130
13
980137%
130161330360
0
17640.6
2050
240137
094
3.96
6846
022
0
309183
0116
10
895125%
121166358251
0
19970.4
2005
355230
08139
5
00000
355230
08144
780109%
112113200355
0
9220.8
2010
00000
1110
10
10,4842,7787,693
013
10,4952,7887,695
013
73%
0
2020
00000
170121
2227
11,0972,8387,779
42556
11,2662,9587,801
42583
74%
256
2030
00000
418275
5192
11,7712,8337,842
984111
12,1893,1087,894
984203
74%
378
2040
00000
574358
69146
12,5652,7907,7781,850
148
13,1393,1487,8471,850
294
76%
451
2050
00000
665393
83189
13,2382,7017,5762,784
177
13,9023,0947,6582,784
366
78%
551
2005
00000
0000
9,7692,4747,296
00
9,7692,4747,296
00
74.7%
table 14.60: africa: final energy demandPJ/a
14
glo
ssary &
ap
pen
dix
|A
PP
EN
DIX
- AF
RIC
A

200
GLOBAL ENERGY [R]EVOLUTIONA SUSTAINABLE GLOBAL ENERGY OUTLOOK
Condensation power plantsCoalLigniteGasOilDiesel
Combined heat & power productionCoalLigniteGasOil
CO2 emissions electricity & steam generationCoalLigniteGasOil & diesel
CO2 emissions by sector% of 1990 emissionsIndustryOther sectorsTransportElectricity & steam generationDistrict heating
Population (Mill.)CO2 emissions per capita (t/capita)
District heating plantsFossil fuelsBiomassSolar collectorsGeothermal
Heat from CHP Fossil fuelsBiomassGeothermal
Direct heating1)
Fossil fuelsBiomassSolar collectorsGeothermal
Total heat supply1)
Fossil fuelsBiomassSolar collectorsGeothermal
RES share (including RES electricity)
1) heat from electricity (direct and from electric heat pumps) not included; covered in the model under ‘electric appliances’
appendix: middle east reference scenario
table 14.61: middle east: electricity generationTWh/a
table 14.64: middle east: installed capacity GW
table 14.65: middle east: primary energy demand PJ/A
table 14.63: middle east: CO2 emissionsMILL t/a
table 14.62: middle east: heat supplyPJ/A
2010
78842
0448265
302
2820000
1000100
01
789758
420
448265
30
3228
202000
616
9076
0624
20.2%
4.0%
2020
1,14763
0723301
374
3850020
7003310
07
1,1541,096
630
726304
37
5138
505020
928
120113
0922
60.5%
4.4%
2030
1,50780
01,026
321379
4510
0060
15108520
015
1,5221,444
810
1,033327
37
714510
010
060
113
11141150
01,231
100.7%
4.7%
2040
1,925179
11,277
37237
115215
0090
2520
13830
025
1,9501,853
1811
1,290379
37
905215
014
090
155
14156193
01,601
150.8%
4.6%
2050
2,402364
11,451
47337
145819
10
120
3020
15940
030
2,4322,317
3661
1,466482
37
1085819
118
012
0
187
18180239
02,015
200.8%
4.5%
Power plantsCoalLigniteGasOilDieselNuclearBiomassHydroWindPVGeothermalSolar thermal power plantsOcean energy
Combined heat & power productionCoalLigniteGasOilBiomassGeothermalCHP by producerMain activity producersAutoproducers
Total generationFossil
CoalLigniteGasOilDiesel
NuclearRenewables
HydroWindPVBiomassGeothermalSolar thermalOcean energy
ImportImport RES
ExportDistribution lossesOwn consumption electricityElectricity for hydrogen consumptionFinal energy consumption (electricity)
Fluctuating RES (PV, Wind, Ocean)Share of fluctuating RES
RES share
2005
64035
0343238
200
2100000
0000000
00
640619
350
343238
20
2121
000000
514
8257
0501
00%
3.3%
2010
24970
12992
60
0.213
0.70.1
00.1
0
0000000
00
249234
70
12992
60
1513
10
0.2000
0.80.3%
5.9%
2020
36410
0212113
61.00.718
2.20.2
00.8
0
2001100
02
365343
100
212114
61.02118
20
0.8010
2.30.6%
5.9%
2030
48413
0.1305132
61.01.420
4.10.2
00.9
0
3002100
03
488460
130
307133
61.02720
40
1.7010
4.20.9%
5.4%
2040
74432
0.1505169
61.01.822
5.60.2
01.3
0
5003210
05
749717
330
507170
61.03122
60
2.4010
5.80.8%
4.2%
2050
1,28473
0.1854315
61.02.323
7.30.3
01.9
0
6003210
06
12901,253
730
857317
61.03623
70
3.1020
7.60.6%
2.8%
Power plantsCoalLigniteGasOilDieselNuclearBiomassHydroWindPVGeothermalSolar thermal power plantsOcean energy
Combined heat & power productionCoalLigniteGasOilBiomassGeothermal
CHP by producerMain activity producersAutoproducers
Total generationFossil
CoalLigniteGasOilDiesel
NuclearRenewables
HydroWindPVBiomassGeothermalSolar thermalOcean energy
Fluctuating RES (PV, Wind, Ocean)Share of fluctuating RES
RES share
2005
20060
9879
600
1000000
0000000
00
200190
60
9879
60
1010
000000
00%
5.2%
2010
25,56325,341
4202
11,01613,902
0222101
53382
00
0.9%
2020
34,37033,917
6013
16,15017,163
81372138
1952
15211
01.1%
2030
41,51840,874
7554
20,91419,202
79565162
3685
24537
01.4%
2040
48,19347,383
1,5745
24,61321,191
78732186
53116303
740
1.6%
2050
54,98253,974
3,0307
27,32323,614
76931210
69149357145
01.7%
TotalFossilHard coalLigniteNatural gasCrude oil
NuclearRenewablesHydroWindSolarBiomassGeothermalOcean EnergyRES share
2005
21,41621,262
3702
9,07511,815
0154
760
3344
00
0.7%
2010
56834
0289238
7
10001
56935
0289245
1,390191%
246200376568
0
2076.7
2020
76150
0433271
7
50022
76651
0435280
1,833253%
351259462761
0
2497.4
2030
93363
0574289
7
81044
94264
0578299
2,180300%
434308503933
0
2867.6
2040
1,122137
1660319
7
132065
1,135138
1666330
2,533349%
521357533
1,1220
3197.9
2050
1,361271
1697387
7
131075
1,375272
1703399
2,929403%
606404558
1,3610
3478.4
2005
48130
0231214
6
00000
48130
0231220
1,173162%
192179321481
0
1886.2
2010
00000
7700
5,5145,442
4032
0
5,5215,449
4032
0
1.3%
2020
00000
4238
40
7,5427,434
464220
7,5847,473
494220
1.5%
2030
11000
7869
90
9,2099,028
536365
9,2889,098
626365
2.0%
2040
11000
1159817
0
10,97410,700
6083
131
11,09110,800
7783
131
2.6%
2050
11000
125103
220
12,81412,387
67104256
12,94012,491
89104256
3.5%
2005
00000
0000
4,6434,575
3533
0
4,6434,575
3533
0
1.5%
table 14.66: middle east: final energy demandPJ/a 2010
16,66714,329
5,2265,213
130000
0%
4,294477
1970
171,6672,115
010
00.7%
4,8091,767
71000
1,8211,147
3241
03.0%
1721.0%
2,3381,370
9680
2020
22,25519,171
6,4266,407
170100
0%
6,218730
3242
023
2,1813,227
014
30.8%
6,5272,589
115001
2,3491,494
4243
93.2%
2581.2%
3,0841,8071,277
0
2030
26,67922,985
7,0016,977
202300
0%
7,790976
4678
038
2,6114,056
01716
1.0%
8,1933,454
161002
2,6921,913
634821
3.6%
3731.4%
3,6942,1651,529
0
2040
31,22626,905
7,4147,381
223700
0.1%
9,4751,272
59115
053
3,0174,961
02037
1.2%
10,0164,486
206005
3,0232,330
835237
3.8%
4981.6%
4,3212,5321,788
0
2050
35,90530,944
7,7697,725
257
1210
0.1%
11,2421,617
72125
070
3,3925,926
02388
1.6%
11,9335,623
250005
3,3432,746
1045656
3.9%
6581.8%
4,9612,9082,054
0
Total (incl. non-energy use)Total (energy use)TransportOil productsNatural gasBiofuelsElectricity
RES electricityHydrogenRES share Transport
IndustryElectricity
RES electricityDistrict heat
RES district heatCoalOil productsGasSolarBiomass and wasteGeothermalRES share Industry
Other SectorsElectricity
RES electricityDistrict heat
RES district heatCoalOil productsGasSolarBiomass and wasteGeothermalRES share Other Sectors
Total RESRES share
Non energy useOilGasCoal
2005
13,93212,011
4,4604,449
110000
0%
3,324363
1200
201,3951,539
080
0.6%
4,2261,442
48001
1,4261,288
3336
02.8%
1381.0%
1,9221,126
7950
14
glo
ssary &
ap
pen
dix
|A
PP
EN
DIX
- MID
DL
E E
AS
T

201
2010
16,60414,266
5,2265,182
271
1610
0%
4,266466
18171711
1,5062,187
322028
2.7%
4,7741,759
69000
1,4961,395
594817
4.0%
3102.2%
2,3381,370
9680
2020
19,07316,437
5,0044,842
51436010
81.1%
5,604671118235235
01,0703,262
20150
11512.8%
5,8291,964
3451616
01,2672,060
3766879
15.2%
1,65710.1%
2,6361,5451,091
0
2030
20,40117,575
4,6864,305
72132160
7817
4.7%
6,198815398368368
0740
3,294663108210
28.2%
6,6902,2791,112
3737
0933
2,388774
81200
32.9%
4,16923.7%
2,8261,6561,170
0
2040
21,64418,648
4,3323,611
88180431344
2112.5%
6,637972775599599
0591
2,6861,312
168308
47.7%
7,6802,8382,262
170170
0753
1,7051,786
102325
60.5%
8,35044.8%
2,9961,7561,240
0
2050
22,71919,564
3,9902,576
100180
1,1091,060
2531.7%
6,7511,1431,093
819819
0368
1,2662,426
228500
75.0%
8,8233,5873,430
247247
0306595
3,451145491
88.0%
14,09472.0%
3,1551,8491,306
0
Total (incl. non-energy use)Total (energy use)TransportOil productsNatural gasBiofuelsElectricity
RES electricityHydrogenRES share Transport
IndustryElectricity
RES electricityDistrict heat
RES district heatCoalOil productsGasSolarBiomass and wasteGeothermalRES share Industry
Other SectorsElectricity
RES electricityDistrict heat
RES district heatCoalOil productsGasSolarBiomass and wasteGeothermalRES share Other Sectors
Total RESRES share
Non energy useOilGasCoal
2005
13,93212,011
4,4604,449
110000
0%
3,324363
1200
201,3951,539
080
0.6%
4,2261,442
48001
1,4261,288
3336
02.8%
1381.0%
1,9221,126
7950
District heating plantsFossil fuelsBiomassSolar collectorsGeothermal
Heat from CHP Fossil fuelsBiomassGeothermal
Direct heating1)
Fossil fuelsBiomassSolar collectorsGeothermal
Total heat supply1)
Fossil fuelsBiomassSolar collectorsGeothermal
RES share (including RES electricity)‘Efficiency’ savings (compared to Ref.)
1) heat from electricity (direct and from electric heat pumps) not included; covered in the model under ‘electric appliances’
Condensation power plantsCoalLigniteGasOilDiesel
Combined heat & power productionCoalLigniteGasOil
CO2 emissions electricity & steam generationCoalLigniteGasOil & diesel
CO2 emissions by sector% of 1990 emissionsIndustryOther sectorsTransportElectricity & steam generationDistrict heating
Population (Mill.)CO2 emissions per capita (t/capita)
table 14.67: middle east: electricity generationTWh/a
table 14.70: middle east: installed capacity GW
table 14.71: middle east: primary energy demand PJ/A
table 14.69: middle east: CO2 emissionsMILL t/a
table 14.68: middle east: heat supplyPJ/A
2010
78038
0470240
302
2421020
1000000
01
781751
380
470240
30
3124
212020
616
86.073.0
0622
30.3%
3.9%
1
2020
91226
0532200
353
4062
65
301
210030
107
021
933764
260
535200
35
1644062
6131230
1
73
1589.084.0
3749
697.4%
17.6%
174
2030
1,19216
0500100
353
45150
5514
3002
330030
1613
033
1,225622
160
503100
35
59845
150551927
3002
84
13591.097.0
7904
20716.9%
48.8%
328
2040
1,50870
29010
253
48190230
20700
3
550030
2725
055
1,563312
70
29310
25
1,24648
190230
3045
7003
108
17993
1158
1,178
42327.1%
79.7%
423
2050
2,10100
902103
50230420
401260
5
700020
3632
070
2,17196
00
92210
2,07650
230420
3972
1,2605
1211
310104.0138.0
91,622
65530.2%
95.6%
392
Power plantsCoalLigniteGasOilDieselNuclearBiomassHydroWindPVGeothermalSolar thermal power plantsOcean energy
Combined heat & power productionCoalLigniteGasOilBiomassGeothermalCHP by producerMain activity producersAutoproducers
Total generationFossil
CoalLigniteGasOilDiesel
NuclearRenewables
HydroWindPVBiomassGeothermalSolar thermalOcean energy
ImportImport RES
ExportDistribution lossesOwn consumption electricityElectricity for hydrogen productionFinal energy consumption (electricity)
Fluctuating RES (PV, Wind, Ocean)Share of fluctuating RES
RES share
‘Efficiency’ savings (compared to Ref.)
2005
64035
0343238
200
2100000
0000000
00
640619
350
343238
20
2121
000000
514
8257
0501
00%
3.3%
2010
24560
13583
60
0.312
0.90.3
00.8
0
0000000
00
245231
60
13583
60
1412
100010
1.20.5%
5.7%
2020
30040
15675
60.70.418
25.33.10.89.70.3
4001021
04
305242
40
15675
60.7621825
332
100
28.79.4%
20.2%
2030
36230
14941
60.70.520
61.230.6
2.247.6
0.4
7001043
07
369200
30
15041
60.7
168206131
45
480
92.225.0%
45.7%
2040
45110
11555
0.70.520
72.2127.8
3.11000.9
11001065
011
462126
10
11555
0.7335
2072
12868
1001
200.943.5%
72.6%
2050
60000
53130
0.520
87.5233.3
6.2193.8
1.4
14000076
014
61357
00
53130
5562087
2338
12194
1
322.252.5%
90.7%
Power plantsCoalLigniteGasOilDieselNuclearBiomassHydroWindPVGeothermalSolar thermal power plantsOcean energy
Combined heat & power productionCoalLigniteGasOilBiomassGeothermal
CHP by producerMain activity producersAutoproducers
Total generationFossil
CoalLigniteGasOilDiesel
NuclearRenewables
HydroWindPVBiomassGeothermalSolar thermalOcean energy
Fluctuating RES (PV, Wind, Ocean)Share of fluctuating RES
RES share
2005
20060
9879
600
1000000
0000000
00
200190
60
9879
60
1010
000000
00%
5.2%
2010
25,50425,132
3772
11,70713,046
0372
867
108118
530
1.5%60
2020
28,40326,202
2552
14,27911,665
582,143
144223796366610
47.6%6,041
2030
28,96723,441
1682
14,0079,264
575,469
162540
2,875632
1,2545
18.7%13,429
2040
27,66217,090
910
9,8617,137
5610,517
173684
6,806876
1,96711
37.4%21,347
2050
27,59010,089
340
4,7425,312
017,501
180828
12,4801,0372,958
1862.3%28,521
TotalFossilHard coalLigniteNatural gasCrude oil
NuclearRenewablesHydroWindSolarBiomassGeothermalOcean EnergyRES share‘Efficiency’ savings (compared to Ref.)
2005
21,41621,262
3702
9,07511,815
0154
760
3344
00
0.7%
2010
55731
0.2303
216.07
00000
55731
0303223
1,358187%
236190375557
0
2076.5
2020
52621
0.2319180
7
20020
52821
0320186
1,352186%
265210352526
0
2495.4
2030
38913
0.2280
907
20020
39113
0282
96
1,148158%
241203314389
0
2864.0
2040
16960
1508.6
5
10010
17160
15114
781108%
196151265169
0
3192.4
2050
4800
431.6
3
10010
4900
444
39354%
9955
19148
0
3471.1
2005
48130
0231214
6
00000
48130
0231220
1,173162%
192179321481
0
1886.2
2010
100091
8242
5,5045,315
549145
5,5225,317
57100
48
4%
0
2020
10100
9110
155197066
7,0526,164
95577217
7,3086,182
165668293
15%
276
2030
17800
16118
23617
100119
7,9355,883
1551,437
461
8,3495,900
2551,597
597
29%
939
2040
40000
36040
38812
153223
8,5584,490
2263,098
744
9,3464,502
3793,4581,007
52%
1,744
2050
61600
55562
4798
187284
9,1971,775
3175,8781,227
10,2921,784
5056,4321,572
83%
2,648
2005
00000
0000
4,6434,575
3533
0
4,6434,575
3533
0
1.5%
table 14.72: middle east: final energy demandPJ/a
appendix: middle east energy [r]evolution scenario
14
glo
ssary &
ap
pen
dix
|A
PP
EN
DIX
- MID
DL
E E
AS
T

202
GLOBAL ENERGY [R]EVOLUTIONA SUSTAINABLE GLOBAL ENERGY OUTLOOK
Condensation power plantsCoalLigniteGasOilDiesel
Combined heat & power productionCoalLigniteGasOil
CO2 emissions electricity & steam generationCoalLigniteGasOil & diesel
CO2 emissions by sector% of 1990 emissionsIndustryOther sectorsTransportElectricity & steam generationDistrict heating
Population (Mill.)CO2 emissions per capita (t/capita)
District heating plantsFossil fuelsBiomassSolar collectorsGeothermal
Heat from CHP Fossil fuelsBiomassGeothermal
Direct heating1)
Fossil fuelsBiomassSolar collectorsGeothermal
Total heat supply1)
Fossil fuelsBiomassSolar collectorsGeothermal
RES share (including RES electricity)
1) heat from electricity (direct and from electric heat pumps) not included; covered in the model under ‘electric appliances’
appendix: transition economies reference scenario
table 14.73: transition economies: electricity generationTWh/a
table 14.76: transition economies: installed capacity GW
table 14.77: transition economies: primary energy demandPJ/A
table 14.75: transition economies: CO2 emissionsMILL t/a
table 14.74: transition economies: heat supplyPJ/A
2010
1,002137
77135
191
2972
32660300
787160
64526
2610
0
73255
1,7891,146
298141662
451
297346326
60
12300
899
116221279
01,261
60.3%
19.3%
2020
1,322158120272
173
3415
37919
0700
801145
65562
1614
0
74061
2,1231,358
303185834
333
341425379
190
19700
949
134267303
01,513
190.9%
20%
2030
1,544154170330
115
39915
41434
011
10
854139
69616
1317
0
79064
2,3971,507
293239946
245
399491414
340
3111
10
939
139309308
81,726
341.4%
20.5%
2040
1,796235246328
105
43721
44949
015
20
866123
70644
722
0
80066
2,6621,668
358316972
175
437557449
490
4315
20
879
157348315
121,917
491.8%
20.9%
2050
2,055319311342
95
47525
48363
019
20
879107
71672
030
0
81069
2,9341,836
426382
1,01395
475623483
630
5519
20
788
176388321
152,112
642.2%
21.2%
Power plantsCoalLigniteGasOilDieselNuclearBiomassHydroWindPVGeothermalSolar thermal power plantsOcean energy
Combined heat & power productionCoalLigniteGasOilBiomassGeothermalCHP by producerMain activity producersAutoproducers
Total generationFossil
CoalLigniteGasOilDiesel
NuclearRenewables
HydroWindPVBiomassGeothermalSolar thermalOcean energy
ImportImport RES
ExportDistribution lossesOwn consumption electricityElectricity for hydrogen productionFinal energy consumption (electricity)
Fluctuating RES (PV, Wind, Ocean)Share of fluctuating RES
RES share
2005
82161728814
0281
0304
00000
777137
71520
3810
0
72453
1,5981,002
198144608
520
281314304
00
10000
879
126195262
01,101
00%
19.7%
2010
20121
11.819
91
41.80.296
2.30
0.300
2526025
14816
30
24013
454310
8136
16725
141.8102
9620
3.3000
2.30.5%
22.4%
2020
26324
18.04010
348.0
0.61127.0
01.00.1
0
2524520
175840
23914
515343
6838
21518
348.0124112
70
4.2100
7.01.4%
24.1%
2030
30223
25.050
75
56.21.8
12211.4
0.11.50.2
0
2934020
225530
28014
595399
6345
27512
556.2140122
110
5.2100
11.51.9%
23.5%
2040
36739
36.266
65
61.52.6
13216.2
0.22.00.3
0
3043520
243340
29113
671452
7456
30895
61.5158132
160
6.8200
16.42.4%
23.5%
2050
44958
45.898
65
66.93.2
14220.9
0.32.60.4
0
3083020
253060
29414
757515
8866
35065
66.9175142
210
8.8300
21.32.8%
23.1%
Power plantsCoalLigniteGasOilDieselNuclearBiomassHydroWindPVGeothermalSolar thermal power plantsOcean energy
Combined heat & power productionCoalLigniteGasOilBiomassGeothermal
CHP by producerMain activity producersAutoproducers
Total generationFossil
CoalLigniteGasOilDiesel
NuclearRenewables
HydroWindPVBiomassGeothermalSolar thermalOcean energy
Fluctuating RES (PV, Wind, Ocean)Share of fluctuating RES
RES share
2005
1679
11.112
60.1
39.60
890.1
00.1
00
2445328
13525
30
23113
411279
6239
14731
039.6
9389
00
3.2000
0.10%
22.5%
2010
48,35242,918
7,5982,248
23,3749,699
3,2352,1981,172
222
903100
04.5%
2020
52,96146,267
7,0852,593
25,84210,747
3,7212,9741,365
695
1,228306
05.5%
2030
57,02048,922
6,6203,082
27,69311,528
4,3543,7441,490
1229
1,625497
06.5%
2040
60,43450,908
6,8023,771
28,29012,046
4,7684,7581,615
17514
2,271682
07.8%
2050
63,93353,038
6,9884,332
29,08912,628
5,1835,7121,740
22818
2,864863
08.9%
TotalFossilHard coalLigniteNatural gasCrude oil
NuclearRenewablesHydroWindSolarBiomassGeothermalOcean EnergyRES share
2005
46,25441,242
6,4082,401
23,2349,199
3,0701,9421,093
12
82521
04.1%
2010
299119
937114
2.6
996285157522
33
1,296404249593
50
2,47956%329415300
1,258176
3397.3
2020
434132142140
137.1
864229145471
19
1,299361288611
39
2,61659%348457359
1,262191
3327.9
2030
508124199166
810.8
798197143443
15
1,307321342609
34
2,73461%385481398
1,272198
3218.5
2040
628182285145
79.8
721157134423
8
1,349338419567
25
2,86864%409495433
1,318214
3099.3
2050
741238355132
79
655123125407
0
1,396361481539
16
3,00367%435507469
1,367225
29410.2
2005
19954884711
0.2
1,057263179568
48
1,256316267614
59
2,37553%331387278
1,214165
3417.0
2010
2,4312,283
14602
6,0105,939
710
10,2049,783
4042
14
18,64518,005
6212
17
3.4%
2020
2,9172,558
35009
5,6535,564
890
11,34110,787
4444
106
19,91118,909
8834
115
5.0%
2030
3,3472,731
6020
13
5,6095,507
1020
12,54411,819
4945
226
21,49920,057
1,1985
240
6.7%
2040
4,0042,9831,001
020
5,1725,039
1320
13,49912,569
5678
355
22,67520,592
1,7008
375
9.2%
2050
4,5893,1851,377
028
4,8094,637
1730
14,43613,308
62310
495
23,83421,129
2,17310
522
11.3%
2005
2,1962,136
6001
6,2226,149
730
9,9339,484
44126
18,35117,769
57326
3.2%
table 14.78: transition economies: final energy demandPJ/a 2010
32,55130,042
6,5314,1491,835
0547106
01.6%
10,1042,109
4083,475
86713
1,0202,702
083
25.7%
13,4071,882
3644,563
113539
1,4624,540
2410
96.7%
1,5845.3%
2,508873
1,516119
2020
36,25133,386
7,7164,9522,174
1589118
01.5%
10,8572,593
5183,283
168533
1,1073,229
08526
7.3%
14,8122,266
4534,864
249650
1,5255,016
4437
518.1%
2,1116.3%
2,865998
1,731136
2030
39,68336,547
8,4915,4902,400
3578118
211.5%
12,0283,020
6193,329
265523
1,2193,790
08859
8.6%
16,0282,616
5365,185
412599
1,5815,460
5473109
9.6%
2,6907.4%
3,1361,0921,895
149
2040
42,44739,095
9,1185,9592,588
6534112
311.4%
13,0113,427
7173,320
418454
1,3074,278
0129
9710.5%
16,9652,941
6165,405
680526
1,6045,795
8516171
11.7%
3,4768.9%
3,3521,1672,026
159
2050
45,23241,661
9,7476,4482,780
12466
9941
1.2%
14,0153,857
8193,319
560399
1,3934,755
0151140
11.9%
17,8993,278
6965,618
948448
1,6286,120
10558239
13.7%
4,23910.2%
3,5711,2432,158
170
Total (incl. non-energy use)Total (energy use)TransportOil productsNatural gasBiofuelsElectricity
RES electricityHydrogenRES share Transport
IndustryElectricity
RES electricityDistrict heat
RES district heatCoalOil productsGasSolarBiomass and wasteGeothermalRES share Industry
Other SectorsElectricity
RES electricityDistrict heat
RES district heatCoalOil productsGasSolarBiomass and wasteGeothermalRES share Other Sectors
Total RESRES share
Non energy useOilGasCoal
2005
30,92428,620
5,8533,8481,636
0368
720
1.2%
10,2771,901
3743,826
54712802
2,9570
790
4.9%
12,4911,696
3344,199
59399
1,4544,276
2458
66.9%
1,4385.0%
2,304802
1,392109
14
glo
ssary &
ap
pen
dix
|A
PP
EN
DIX
- TR
AN
SIT
ION
EC
ON
OM
IES

203
2010
32,01929,511
6,5314,2231,761
7540107
01.7%
9,7002,080
4123,420
169585686
2,68134
15162
8.5%
13,2801,902
3764,495
222160
1,3344,712
11520147
9.6%
2,2187.5%
2,508873
1,516119
2020
32,24629,693
6,0253,5831,623
94725210
05.0%
9,7322,289
6623,267
718504276
2,336134791134
25.1%
13,9361,989
5754,6751,028
142620
4,541568936465
25.6%
6,31421.3%
2,553889
1,543121
2030
31,97029,460
5,4643,0361,456
247722346
310.9%
9,3502,3091,1063,1251,276
32037
2,091256
1,019192
41.2%
14,6452,1211,0165,0002,041
0369
3,833910
1,3791,033
43.6%
10,82436.7%
2,510874
1,517119
2040
30,52328,128
4,8632,3391,268
400842599
1520.7%
8,6782,2201,5782,8621,768
40134
1,413350
1,194204
58.7%
14,5872,1911,5585,1213,162
0226
2,8091,2131,6541,375
61.4%
15,06453.6%
2,395834
1,447114
2050
28,65126,399
4,2371,5771,069
3661,190
95935
31.9%
7,7562,0601,6612,5451,847
33630
903461
1,164256
69.5%
14,4052,3291,8785,1913,768
0223
1,1371,8011,7731,951
77.5%
17,91567.9%
2,252784
1,361107
Total (incl. non-energy use)Total (energy use)TransportOil productsNatural gasBiofuelsElectricity
RES electricityHydrogenRES share Transport
IndustryElectricity
RES electricityDistrict heat
RES district heatCoalOil productsGasSolarBiomass and wasteGeothermalRES share Industry
Other SectorsElectricity
RES electricityDistrict heat
RES district heatCoalOil productsGasSolarBiomass and wasteGeothermalRES share Other Sectors
Total RESRES share
Non energy useOilGasCoal
2005
30,92428,620
5,8533,8481,636
0368
720
1.2%
10,2771,901
3743,826
54712802
2,9570
790
4.9%
12,4911,696
3344,199
59399
1,4544,276
2458
66.9%
1,4385.0%
2,304802
1,392109
District heating plantsFossil fuelsBiomassSolar collectorsGeothermal
Heat from CHP Fossil fuelsBiomassGeothermal
Direct heating1)
Fossil fuelsBiomassSolar collectorsGeothermal
Total heat supply1)
Fossil fuelsBiomassSolar collectorsGeothermal
RES share (including RES electricity)‘Efficiency’ savings (compared to Ref.)
1) heat from electricity (direct and from electric heat pumps) not included; covered in the model under ‘electric appliances’
Condensation power plantsCoalLigniteGasOilDiesel
Combined heat & power productionCoalLigniteGasOil
CO2 emissions electricity & steam generationCoalLigniteGasOil & diesel
CO2 emissions by sector% of 1990 emissionsIndustryOther sectorsTransportElectricity & steam generationDistrict heating
Population (Mill.)CO2 emissions per capita (t/capita)
table 14.79: transition economies: electricity generationTWh/a
table 14.82: transition economies: installed capacity GW
table 14.83: transition economies: primary energy demandPJ/A
table 14.81: transition economies: CO2 emissionsMILL t/a
table 14.80: transition economies: heat supplyPJ/A
2010
9925868
22014
0305
5320
10100
796132
67538
3326
1
73957
1,7881,129
190135758
470
305354320
10
31200
9717
140216.0273.0
01,256
10.1%
19.8%
5
2020
1,1124740
32060
29010
35028
231
15
8108538
5329
1389
75060
1,9231,077
13278
85215
0290556350
282
14812
115
10125
147228.0259.0
01,390
452.3%
28.9%
124
2030
1,1323725
26530
15010
360210
4048
20
8162315
4961
24139
75066
1,948865
6040
76140
150933360210
40251
438
20
10140
157230
229.01
1,431
27013.9%
47.9%
295
2040
1,16480
11500
3010
370490
955
1525
81900
4190
32278
75069
1,983543
90
53400
301,410
370490
95332
831525
9959
182228.0207.0
61,459
61030.8%
71.1%
458
2050
1,26040
15000
10375710
956
1530
82300
3850
36079
75073
2,083403
40
400000
1,679375710
95370
851530
9576
197229.0189.0
131,550
83540.1%
80.6%
562
Power plantsCoalLigniteGasOilDieselNuclearBiomassHydroWindPVGeothermalSolar thermal power plantsOcean energy
Combined heat & power productionCoalLigniteGasOilBiomassGeothermalCHP by producerMain activity producersAutoproducers
Total generationFossil
CoalLigniteGasOilDiesel
NuclearRenewables
HydroWindPVBiomassGeothermalSolar thermalOcean energy
ImportImport RES
ExportDistribution lossesOwn consumption electricityElectricity for hydrogen productionFinal energy consumption (electricity)
Fluctuating RES (PV, Wind, Ocean)Share of fluctuating RES
RES share
‘Efficiency’ savings (compared to Ref.)
2005
82161728814
0281
0304
00000
777137
71520
3810
0
72453
1,5981,002
198144608
520
281314304
00
10000
879
126195262
01,101
00%
19.7%
2010
1969
10.432
60.1
43.00.694
0.40.10.1
00
2565026
15121
80
24313
452305
5836
18328
043.0104
94009000
0.50.1%
23.0%
2020
2287
6.049
30.1
40.81.3
10310.2
1.90.40.34.3
2502612
1665
392
23613
477275
3418
21590
40.8162103
102
40204
16.43.4%
33.9%
2030
3045
3.742
20.1
21.11.3
10672.442.1
0.51.85.7
24774
1800
488
23314
551244
128
22220
21.1285106
724249
826
120.221.8%
51.8%
2040
41610
200
0.14.21.3
109169.0
1000.72.97.1
23200
1560
6016
21814
647178
10
17600
4.2466109169100
6116
37
276.142.6%
71.9%
2050
4731030
0.10
1.3110
244.81000.82.98.6
22600
1430
6716
21114
698147
10
147000
551110245100
6817
39
353.450.6%
78.9%
Power plantsCoalLigniteGasOilDieselNuclearBiomassHydroWindPVGeothermalSolar thermal power plantsOcean energy
Combined heat & power productionCoalLigniteGasOilBiomassGeothermal
CHP by producerMain activity producersAutoproducers
Total generationFossil
CoalLigniteGasOilDiesel
NuclearRenewables
HydroWindPVBiomassGeothermalSolar thermalOcean energy
Fluctuating RES (PV, Wind, Ocean)Share of fluctuating RES
RES share
2005
1679
11.112
60.1
39.60
890.1
00.1
00
2445328
13525
30
23113
411279
6239
14731
039.6
9389
00
3.2000
0.10%
22.5%
2010
47,78741,436
5,6582,207
24,2859,286
3,3283,0231,152
457
1,525286
06.3%
744
2020
46,63535,100
4,0731,189
23,2296,610
3,1648,3701,260
101792
4,9991,164
5418.0%6,387
2030
43,51027,871
2,535544
19,6915,102
1,63714,002
1,296756
1,5567,3302,991
7232.1%13,504
2040
39,31519,608
2,0100
13,7043,894
32719,380
1,3321,7642,3729,0274,794
9049.1%20,949
2050
35,76413,625
1,8960
8,7902,939
022,139
1,3502,5563,4469,0305,649
10861.9%27,859
TotalFossilHard coalLigniteNatural gasCrude oil
NuclearRenewablesHydroWindSolarBiomassGeothermalOcean EnergyRES share‘Efficiency’ savings (compared to Ref.)
2005
46,25441,242
6,4082,401
23,2349,199
3,0701,9421,093
12
82521
04.1%
2010
25850
81.8116
10.50.3
973235163531
43
1,231286245647
54
2,32152%289380305
1,196151
3396.9
2020
25639
47.51654.50.2
676136
84444
12
933175132609
17
1,83041%226315259903126
3325.5
2030
19529
29.31342.30.2
4203331
3550
6146260
4893
1,33430%174244220588109
3214.2
2040
5870
510
0.2
27300
2730
33170
3240
85019%139175170309
57
3092.8
2050
93060
0.2
23200
2320
24030
2380
53912%101
81115222
20
2941.8
2005
1995488471110
1,057263179568
48
1,256316267614
59
2,37553%331387278
1,214165
3417.0
2010
2,2402,005
2021122
6,0805,890
1845
9,9679,129
55045
243
18,28717,024
93656
271
7%
358
2020
2,6591,861
53280
186
5,6974,660
95878
10,4647,5931,467
702702
18,82014,114
2,957782966
25%
1,091
2030
3,1001,643
775217465
5,4393,4461,637
355
10,7496,0052,1111,1671,467
19,28811,094
4,5231,3842,287
42%
2,212
2040
3,181891954414922
5,2102,3922,118
700
10,3024,3312,5061,5631,902
18,6937,6145,5781,9763,525
59%
3,982
2050
3,151315788788
1,260
4,9811,9902,283
708
9,7122,2082,5852,2622,657
17,8444,5135,6563,0504,625
75%
5,990
2005
2,1962,136
6001
6,2226,149
730
9,9339,484
44126
18,35117,769
57326
3.2%
table 14.84: transition economies: final energy demandPJ/a
appendix: transition economies energy [r]evolution scenario
14
glo
ssary &
ap
pen
dix
|A
PP
EN
DIX
- TR
AN
SIT
ION
EC
ON
OM
IES

204
GLOBAL ENERGY [R]EVOLUTIONA SUSTAINABLE GLOBAL ENERGY OUTLOOK
Condensation power plantsCoalLigniteGasOilDiesel
Combined heat & power productionCoalLigniteGasOil
CO2 emissions electricity & steam generationCoalLigniteGasOil & diesel
CO2 emissions by sector% of 1990 emissionsIndustryOther sectorsTransportElectricity & steam generationDistrict heating
Population (Mill.)CO2 emissions per capita (t/capita)
District heating plantsFossil fuelsBiomassSolar collectorsGeothermal
Heat from CHP Fossil fuelsBiomassGeothermal
Direct heating1)
Fossil fuelsBiomassSolar collectorsGeothermal
Total heat supply1)
Fossil fuelsBiomassSolar collectorsGeothermal
RES share (including RES electricity)
1) heat from electricity (direct and from electric heat pumps) not included; covered in the model under ‘electric appliances’
appendix: india reference scenario
table 14.85: india: electricity generationTWh/a
table 14.88: india: installed capacity GW
table 14.89: india: primary energy demand PJ/A
table 14.87: india: CO2 emissionsMILL t/a
table 14.86: india: heat supplyPJ/A
2010
988667
238533
024
4127
250000
9900000
09
997817676
238533
024
156127
2504000
30.40.1
24367
0690
252.5%
15.6%
2020
1,7621,160
42186
340
8314
18952
3000
4545
00000
045
1,8071,4671,205
42186
340
83257189
523
14000
50.70.2
392108
01,312
553.0%
14.2%
2030
2,6901,808
66292
310
12829
25869
8100
8484
00000
084
2,7742,2811,892
66292
310
128365258
698
29100
81
0.3551151
02,079
772.8%
13.2%
2040
4,0662,936
107348
280
17344
3278613
200
123123
00000
0123
4,1883,5423,059
107348
280
173473327
861344
200
122
0.5710195
03,295
992.4%
11.3%
2050
5,8504,478
164384
260
21960
397104
18200
162162
00000
0162
6,0125,2134,639
164384
260
219581397104
1860
200
183
0.7870239
04,921
1222.0%
9.7%
Power plantsCoalLigniteGasOilDieselNuclearBiomassHydroWindPVGeothermalSolar thermal power plantsOcean energy
Combined heat & power productionCoalLigniteGasOilBiomassGeothermalCHP by producerMain activity producersAutoproducers
Total generationFossil
CoalLigniteGasOilDiesel
NuclearRenewables
HydroWindPVBiomassGeothermalSolar thermalOcean energy
ImportImport RES
ExportDistribution lossesOwn consumption electricityElectricity for hydrogen productionFinal energy consumption (electricity)
Fluctuating RES (PV, Wind, Ocean)Share of fluctuating RES
RES share
2005
699464
166231
017
2100
60000
0000000
00
699574464
166231
017
108100
602000
20.30.1
17548
0478
60.9%
15.5%
2010
2041113.22111
04.20.743
11.20.1
000
2200000
02
206148113
32111
04.2554311
00.7
000
11.35.5%
26.5%
2020
3401785.94512
011.0
2.162
21.12.1
000
1111
00000
011
351253190
64512
011.0
886221
22.1
000
23.26.6%
25.0%
2030
5092709.57911
017.0
4.085
28.25.70.2
00
2121
00000
021
530390291
107911
017.0123
8528
64.0
000
33.96.4%
23.2%
2040
749438
16.09419
023.0
5.9108
35.29.40.3
00
3030
00000
030
779598469
169419
023.0158108
359
5.9000
44.65.7%
20.3%
2050
1042668
25.2104
210
29.08.0
13042.312.9
0.400
4040
00000
040
1082859709
25104
210
29.0194130
4213
8.0000
55.35.1%
17.9%
Power plantsCoalLigniteGasOilDieselNuclearBiomassHydroWindPVGeothermalSolar thermal power plantsOcean energy
Combined heat & power productionCoalLigniteGasOilBiomassGeothermal
CHP by producerMain activity producersAutoproducers
Total generationFossil
CoalLigniteGasOilDiesel
NuclearRenewables
HydroWindPVBiomassGeothermalSolar thermalOcean energy
Fluctuating RES (PV, Wind, Ocean)Share of fluctuating RES
RES share
2005
14777
2.21610
03.00.434
4.00000
0000000
00
147105
772
1610
03.03834
40
0.4000
4.02.7%
26.2%
2010
27,34419,66011,290
2841,5426,545
2627,422
45788
16,876
00
27.1%
2020
40,16130,90917,780
4262,7159,987
9028,350
679186
227,443
200
20.8%
2030
54,67643,78425,521
5693,900
13,794
1,3969,496
929248
558,202
610
17.4%
2040
70,43358,44233,956
8904,421
19,175
1,89110,101
1,178311
948,416
1010
14.3%
2050
89,09076,06744,241
1,3104,693
25,824
2,38610,637
1,428373137
8,560138
011.9%
TotalFossilHard coalLigniteNatural gasCrude oil
NuclearRenewablesHydroWindSolarBiomassGeothermalOcean EnergyRES share
2005
22,34415,150
8,449221
1,2085,272
1897,005
36022
06,623
00
31.3%
2010
870772
324026
0
88000
879781
324026
1,400244%
255126149870
0
1,2201.2
2020
1,3501,194
478524
0
3737
000
1,3871,231
478524
2,216386%
431153283
1,3500
1,3791.7
2030
1,9381,729
63125
200
6161
000
1,9991,790
63125
20
3,207558%
625175469
1,9380
1,5062.3
2040
2,5912,340
99133
190
7777
000
2,6682,418
99133
19
4,361759%
831185754
2,5910
1,5972.9
2050
3,4103,123
145125
170
8787
000
3,4983,210
145125
17
5,7761,005%
1,040186
1,1393,410
0
1,6583.6
2005
666585
253026
0
00000
666585
253026
1,074187%
181119108666
0
1,1341.0
2010
00000
4848
00
8,9803,6455,335
00
9,0283,6935,335
00
59.1%
2020
00000
204204
00
11,0715,3825,665
1113
11,2755,5875,665
1113
50.5%
2030
00000
315315
00
13,3097,2945,951
2737
13,6257,6105,951
2737
44.1%
2040
00000
398398
00
15,6879,3016,278
4761
16,0859,7006,278
4761
39.7%
2050
00000
497497
00
18,07711,356
6,5637285
18,57411,853
6,5637285
36.2%
2005
00000
0000
8,0822,9585,125
00
8,0822,9585,125
00
63.4%
table 14.90: india: final energy demandPJ/a 2010
17,62116,010
2,1562,040
402155
90
1.4%
5,4311,193
18648
01,617
985396
01,192
025.4%
8,4231,235
19300
2951,275
530
5,5650
68.4%
7,16644.8%
1,6111,174
4370
2020
25,03122,728
4,1033,866
7756
10415
01.7%
8,3872,247
320204
02,8691,328
4925
1,2411
18.7%
10,2382,373
33800
2521,636
1256
5,83511
60.5%
7,82834.4%
2,3031,614
6880
2030
33,97730,837
6,7836,418
12584
15621
01.5%
11,6903,476
457315
04,4501,585
56013
1,2892
15.1%
12,3643,852
50700
2221,879
24414
6,12033
54.0%
8,54027.7%
3,1402,201
9390
2040
45,79641,81910,83310,338
172111212
240
1.2%
15,9235,372
606398
06,1172,025
60425
1,3774
12.6%
15,0636,276
70800
2441,938
30822
6,21955
46.5%
9,15221.9%
3,9772,7881,189
0
2050
60,42755,61216,28115,644
219142275
270
1.0%
20,8297,831
756497
07,8872,417
68242
1,4658
10.9%
18,5029,609
92800
2321,917
38330
6,25675
39.4%
9,72917.5%
4,8153,3751,439
0
Total (incl. non-energy use)Total (energy use)TransportOil productsNatural gasBiofuelsElectricity
RES electricityHydrogenRES share Transport
IndustryElectricity
RES electricityDistrict heat
RES district heatCoalOil productsGasSolarBiomass and wasteGeothermalRES share Industry
Other SectorsElectricity
RES electricityDistrict heat
RES district heatCoalOil productsGasSolarBiomass and wasteGeothermalRES share Other Sectors
Total RESRES share
Non energy useOilGasCoal
2005
14,90813,569
1,5491,480
284
3860
0.7%
4,145756117
00
1,093798355
01,143
030.4%
7,875927143
00
3451,143
320
5,4270
70.7%
6,84050.4%
1,3391,028
3110
14
glo
ssary &
ap
pen
dix
|A
PP
EN
DIX
- IND
IA

205
2010
17,61816,009
2,1562,040
402155
90
1.4%
5,4311,193
18648
01,617
985396
01,192
025.4%
8,4221,235
19300
2951,273
540
5,5650
68.4%
7,16644.8%
1,6091,172
4370
2020
23,15421,188
3,7863,342
71112262
680
4.8%
7,5822,003
523313313
1,9201,0121,089
217971
5727.4%
9,8192,106
55066
271972428374
5,62933
67.1%
8,85441.8%
1,9661,433
5330
2030
28,67426,174
5,4174,331
98250737255
09.3%
9,5312,793
966732732
1,870874
1,723569759211
34.0%
11,2273,0551,056
3434
259782611
1,1225,270
9467.5%
11,31843.2%
2,5001,800
7000
2040
34,26431,247
7,0475,259
109363
1,288621
2814.2%
11,5253,7901,8271,7891,7891,586
6411,862
842586427
47.5%
12,6764,4342,137
7171
218634663
1,7144,764
17669.9%
15,33149.1%
3,0172,167
8500
2050
39,56336,263
8,6776,056
112510
1,9281,150
6919.6%
13,4214,9032,9233,1163,1161,228
2971,7891,044
430613
60.6%
14,1656,0593,612
221221182296719
2,3573,890
44274.3%
20,34956.1%
3,3002,350
9500
Total (incl. non-energy use)Total (energy use)TransportOil productsNatural gasBiofuelsElectricity
RES electricityHydrogenRES share Transport
IndustryElectricity
RES electricityDistrict heat
RES district heatCoalOil productsGasSolarBiomass and wasteGeothermalRES share Industry
Other SectorsElectricity
RES electricityDistrict heat
RES district heatCoalOil productsGasSolarBiomass and wasteGeothermalRES share Other Sectors
Total RESRES share
Non energy useOilGasCoal
2005
14,90813,569
1,5491,480
284
3860
0.7%
4,145756117
00
1,093798355
01,143
030.4%
7,875927143
00
3451,143
320
5,4270
70.7%
6,84050.4%
1,3391,028
3110
District heating plantsFossil fuelsBiomassSolar collectorsGeothermal
Heat from CHP Fossil fuelsBiomassGeothermal
Direct heating1)
Fossil fuelsBiomassSolar collectorsGeothermal
Total heat supply1)
Fossil fuelsBiomassSolar collectorsGeothermal
RES share (including RES electricity)‘Efficiency’ savings (compared to Ref.)
1) heat from electricity (direct and from electric heat pumps) not included; covered in the model under ‘electric appliances’
Condensation power plantsCoalLigniteGasOilDiesel
Combined heat & power productionCoalLigniteGasOil
CO2 emissions electricity & steam generationCoalLigniteGasOil & diesel
CO2 emissions by sector% of 1990 emissionsIndustryOther sectorsTransportElectricity & steam generationDistrict heating
Population (Mill.)CO2 emissions per capita (t/capita)
table 14.91: india: electricity generationTWh/a
table 14.94: india: installed capacity GW
table 14.95: india: primary energy demand PJ/A
table 14.93: india: CO2 emissionsMILL t/a
table 14.92: india: heat supplyPJ/A
2010
989667
238533
024
4127
250000
9900000
09
997817676
238533
024
156127
2504000
30.40.1
243.067.0
0690
252.5%
15.6%
0
2020
1,601931
13188
120
5315
189170
134
104
6021
010
024
5
060
1,6611,174
95213
19812
053
434189170
1339
910
4
41
0.2354.0
97.00
1,214
18711.3%
26.1%
98
2030
2,2531,042
8424
30
4320
258310
718
607
15031
022
07523
0150
2,4031,5291,072
8446
30
43831258310
71953060
7
63
0.2455.0125.0
0.61,829
38816.1%
34.6%
250
2040
2,9851,061
4538
00
2425
392416190
16304
14
37059
052
0185
74
0370
3,3551,7141,120
4590
00
241,617
392416190210
90304
14
95
0.3557.0153.0
392,614
62018.5%
48.2%
680
2050
3,7651,044
0546
000
30474520480
16630
25
67087
0114
0335134
0670
4,4351,7911,131
0660
000
2,644474520480365150630
25
118
0.4659.0181.0
933,514
1,02523.1%
59.6%
1,407
Power plantsCoalLigniteGasOilDieselNuclearBiomassHydroWindPVGeothermalSolar thermal power plantsOcean energy
Combined heat & power productionCoalLigniteGasOilBiomassGeothermalCHP by producerMain activity producersAutoproducers
Total generationFossil
CoalLigniteGasOilDiesel
NuclearRenewables
HydroWindPVBiomassGeothermalSolar thermalOcean energy
ImportImport RES
ExportDistribution lossesOwn consumption electricityElectricity for hydrogen productionFinal energy consumption (electricity)
Fluctuating RES (PV, Wind, Ocean)Share of fluctuating RES
RES share
‘Efficiency’ savings (compared to Ref.)
2005
699464
166231
017
2100
60000
0000000
00
699574464
166231
017
108100
602000
20.30.1
17548
0478
60.9%
15.5%
2010
2041113.22111
04.20.743
11.20.2
000
2200000
02
207148113
32111
04.2554311
01000
11.45.5%
26.5%
2020
3511431.846
40
7.02.362
69.29.50.63.31.2
14502051
014
364202148
248
40
7.0155
626910
8231
79.921.9%
42.5%
2030
5721711.2
11510
5.72.885
126.551.0
1.210
1.9
338050
165
033
605300179
1119
10
5.7299
85127
5119
610
2
179.429.7%
49.4%
2040
8271850.6
14600
3.23.3
129169.8135.7
2.548.3
4.1
7715
010
03715
077
904356199
1156
00
3.2545129170136
411748
4
309.634.2%
60.3%
2050
1,157188
0148
000
4.0156
212.2342.9
2.596.9
7.1
13822
023
06627
0138
1,295380210
0170
000
915156212343
702997
7
562.243.4%
70.6%
Power plantsCoalLigniteGasOilDieselNuclearBiomassHydroWindPVGeothermalSolar thermal power plantsOcean energy
Combined heat & power productionCoalLigniteGasOilBiomassGeothermal
CHP by producerMain activity producersAutoproducers
Total generationFossil
CoalLigniteGasOilDiesel
NuclearRenewables
HydroWindPVBiomassGeothermalSolar thermalOcean energy
Fluctuating RES (PV, Wind, Ocean)Share of fluctuating RES
RES share
2005
14777
2.21610
03.00.434
4.00000
0000000
00
147105
772
1610
03.03834
40
0.4000
4.02.7%
26.2%
2010
27,34519,66111,292
2841,5436,540
2627,423
45788
16,876
00
27.1%0
2020
35,21024,94013,410
1313,5967,802
5769,694
679610682
7,340368
1527.5%4,960
2030
41,64428,08012,897
696,4498,665
46713,097
9291,1162,2027,5841,242
2431.4%13,058
2040
47,61728,83312,108
337,1669,526
26018,524
1,4131,4984,4807,7293,353
5238.9%22,872
2050
52,12027,33310,478
07,1169,738
024,787
1,7061,8727,7107,8395,570
9047.6%37,071
TotalFossilHard coalLigniteNatural gasCrude oil
NuclearRenewablesHydroWindSolarBiomassGeothermalOcean EnergyRES share‘Efficiency’ savings (compared to Ref.)
2005
22,34415,150
8,449221
1,2085,272
1897,005
36022
06,623
00
31.3%
2010
870773
31.640
25.90
88000
879781
324026
1,400244%
255126149870
0
12201.2
2020
1,002894
14.585
8.60
2217
050
1,024911
1590
9
1,706297%
338122245
1,0020
13791.3
2030
1,0228307.6
1822.0
0
3222
010
0
1,054853
8191
2
1,824317%
368117318
1,0220
15061.3
2040
9707723.7
19400
5737
020
0
1,027809
4213
0
1,816316%
357105385970
0
15971.2
2050
820648
0172
00
8447
037
0
904695
0209
0
1,662289%
32179
443820
0
16581.0
2005
666585
253026
0
00000
666585
253026
1,074187%
181119108666
0
11341.0
2010
00000
4848
00
8,9803,6455,335
00
9,0283,6935,335
00
59%
0
2020
280
2071
292140108
43
10,5424,5775,283
59192
10,8624,7175,411
598136
57%
413
2030
860
4338
5
681197281203
11,8915,0374,8371,691
325
12,6585,2345,1611,729
533
59%
967
2040
2340
59145
30
1,626360600666
12,3414,7184,4182,556
649
14,2015,0785,0762,7021,345
64%
1,884
2050
4820
58313111
2,855618
1,0311,206
12,1033,8883,6723,4011,142
15,4404,5074,7613,7142,459
71%
3,134
2005
00000
0000
8,0822,9585,125
00
8,0822,9585,125
00
63.4%
table 14.96: india: final energy demandPJ/a
appendix: india energy [r]evolution scenario
14
glo
ssary &
ap
pen
dix
|A
PP
EN
DIX
- IND
IA

206
GLOBAL ENERGY [R]EVOLUTIONA SUSTAINABLE GLOBAL ENERGY OUTLOOK
Condensation power plantsCoalLigniteGasOilDiesel
Combined heat & power productionCoalLigniteGasOil
CO2 emissions electricity & steam generationCoalLigniteGasOil & diesel
CO2 emissions by sector% of 1990 emissionsIndustryOther sectorsTransportElectricity & steam generationDistrict heating
Population (Mill.)CO2 emissions per capita (t/capita)
District heating plantsFossil fuelsBiomassSolar collectorsGeothermal
Heat from CHP Fossil fuelsBiomassGeothermal
Direct heating1)
Fossil fuelsBiomassSolar collectorsGeothermal
Total heat supply1)
Fossil fuelsBiomassSolar collectorsGeothermal
RES share (including RES electricity)
1) heat from electricity (direct and from electric heat pumps) not included; covered in the model under ‘electric appliances’
appendix: developing asia reference scenario
table 14.97: developing asia: electricity generationTWh/a
table 14.100: developing asia: installed capacity GW
table 14.101: developing asia:primary energy demand PJ/A
table 14.99: developing asia: CO2 emissionsMILL t/a
table 14.98: developing asia: heat supplyPJ/A
2010
1,200361
24454136
430
13143
51
2200
10243010
46
1,210983363
28456136
043
184143
51
1422
00
714
10674
01,033
60.5%
15.2%
2020
1,728544
41630137
700
32219
214
3200
3055
14140
624
1,7581,377
54946
644138
070
311219
214
3632
00
1126
143113
01,507
241.4%
17.7%
2030
2,180749
57758111
720
55284
447
4200
5486
283
100
846
2,2341,720
75862
786114
072
442284
447
6542
00
1428
181145
01,914
512.3%
19.8%
2040
2,641967
72886
8674
077
349671052
00
8414
742
417
0
1074
2,7252,078
98179
92890
074
573349
67109452
00
172
10215181
02,337
782.8%
21.0%
2050
3,1811255
881020
6176
0101415
911462
00
10217
750
523
0
1290
3,2832,5031,272
951070
660
76705415
9114
12462
00
212
12246220
02,826
1043.2%
21.5%
Power plantsCoalLigniteGasOilDieselNuclearBiomassHydroWindPVGeothermalSolar thermal power plantsOcean energy
Combined heat & power productionCoalLigniteGasOilBiomassGeothermalCHP by producerMain activity producersAutoproducers
Total generationFossil
CoalLigniteGasOilDiesel
NuclearRenewables
HydroWindPVBiomassGeothermalSolar thermalOcean energy
ImportImport RES
ExportDistribution lossesOwn consumption electricityElectricity for hydrogen productionFinal energy consumption (electricity)
Fluctuating RES (PV, Wind, Ocean)Share of fluctuating RES
RES share
2005
897229
19342122
4206
12000
1700
3030000
30
901716229
23342122
042
143120
006
1700
613
8651
0766
00%
15.8%
2010
30168
3.2122
420
5.03.051
2.10.73.6
00
3021000
21
304239
695
12342
05.06151
21
3.2400
2.80.9%
19.9%
2020
4441145.6
18141
08.35.473
8.42.64.7
00
8123010
35
452349115
8184
410
8.39573
83
6.3500
11.12.5%
21.0%
2030
5741567.9
23436
09.08.194
18.05.06.0
00
13226120
310
586444158
10240
360
9.0133
9418
510.2
600
23.03.9%
22.7%
2040
642179
10.1252
330
9.311.2107
25.67.47.4
00
19429130
315
661489183
12260
340
9.3162107
267
14.6700
32.95.0%
24.5%
2050
716209
12.5268
300
9.514.4118
34.59.88.9
00
2352
10150
419
739539214
15279
310
9.5191118
3410
18.9900
44.36.0%
25.8%
Power plantsCoalLigniteGasOilDieselNuclearBiomassHydroWindPVGeothermalSolar thermal power plantsOcean energy
Combined heat & power productionCoalLigniteGasOilBiomassGeothermal
CHP by producerMain activity producersAutoproducers
Total generationFossil
CoalLigniteGasOilDiesel
NuclearRenewables
HydroWindPVBiomassGeothermalSolar thermalOcean energy
Fluctuating RES (PV, Wind, Ocean)Share of fluctuating RES
RES share
2005
22839
2.68941
05.02.046
00
3.000
2020000
20
230174
395
8941
05.05146
00
2.0300
00%
22.2%
2010
36,30827,061
6,054309
7,55813,140
4698,779
5151610
7,446792
024.2%
2020
45,79734,439
7,611432
10,08616,311
76410,594
7877539
8,5121,181
023.1%
2030
54,63841,405
9,320553
12,35819,174
78612,448
1,022158
679,6421,558
022.8%
2040
60,88746,37310,967
65912,78621,961
80713,707
1,257242100
10,5491,559
022.5%
2050
67,41451,66113,023
75412,95624,928
82914,925
1,493327138
11,4001,567
022.1%
TotalFossilHard coalLigniteNatural gasCrude oil
NuclearRenewablesHydroWindSolarBiomassGeothermalOcean EnergyRES share
2005
31,09522,484
4,718268
6,04711,450
4638,148
43200
7,122594
026.2%
2010
621321
26209
660
132820
634323
34211
66
1,577325%
369149429630
0
10501.5
2020
805424
42262
760
184671
823429
48269
77
2,007414%
447173575811
2
11951.7
2030
986569
55289
730
2666
122
1,012575
61301
75
2,441503%
523197727994
1
13241.8
2040
1,137703
67311
560
3596
172
1,172713
73328
59
2,830583%
591204889
1,1461
14282.0
2050
1,325875
78332
400
3911
620
3
1,364886
84351
43
3,265673%
659211
10601,333
1
15042.2
2005
475233
21166
550
80800
483233
30166
55
1,303268%
330133357483
0
9751.3
2010
11000
8375
70
10,6145,3325,276
60
10,6975,4075,283
60
49.4%
2020
1313
000
142119
220
12,0536,5465,453
2529
12,2086,6795,475
2529
45.3%
2030
1010
000
216173
430
13,7247,8335,803
4246
13,9508,0165,846
4246
42.5%
2040
99000
286223
620
15,6088,8506,634
6361
15,9039,0836,696
6361
42.9%
2050
1313
000
326248
780
17,5569,8707,518
8879
17,89510,130
7,5978879
43.4%
2005
00000
3737
00
10,0874,7455,342
00
10,1234,7815,342
00
52.8%
table 14.102: developing asia: final energy demandPJ/a 2010
25,97723,450
5,9885,908
5022
810
0.4%
7,3341,652
25166
02,0211,4521,227
0915
015.9%
10,1282,058
31315
0241
1,389398
66,022
062.6%
7,53132.1%
2,5261,783
73013
2020
32,56029,280
8,1317,924
70126
1220
1.6%
9,2222,340
414125
22,2491,6981,791
51,006
715.5%
11,9273,072
54326
0273
1,586492
206,435
2358.9%
8,58329.3%
3,2802,315
94817
2030
38,66134,92310,36710,015
87251
1530
2.5%
10,8982,823
559185
42,4151,9412,435
131,071
1615.2%
13,6584,053
80236
1313
1,809551
296,836
3056.4%
9,61427.5%
3,7382,6381,080
19
2040
44,58940,39412,75312,255
104373
2140
3.0%
12,3893,254
684246
52,5472,1882,960
231,145
2615.2%
15,2535,1371,081
421
3531,806
60740
7,23235
55.0%
10,64926.4%
4,1952,9611,212
22
2050
50,89246,23915,27014,621
121500
2860
3.3%
13,9453,739
803285
72,6942,4863,477
351,190
3914.9%
17,0256,4091,376
461
3971,802
64654
7,63140
53.5%
11,68025.3%
4,6523,2841,344
24
Total (incl. non-energy use)Total (energy use)TransportOil productsNatural gasBiofuelsElectricity
RES electricityHydrogenRES share Transport
IndustryElectricity
RES electricityDistrict heat
RES district heatCoalOil productsGasSolarBiomass and wasteGeothermalRES share Industry
Other SectorsElectricity
RES electricityDistrict heat
RES district heatCoalOil productsGasSolarBiomass and wasteGeothermalRES share Other Sectors
Total RESRES share
Non energy useOilGasCoal
2005
22,55420,553
4,9644,914
420710
0%
6,2851,210
19212
01,8811,334
9880
8600
16.7%
9,3051,541
24425
0139
1,351348
05,901
066.0%
7,19935.0%
2,0011,412
57810
14
glo
ssary &
ap
pen
dix
|A
PP
EN
DIX
- DE
VE
LO
PIN
G A
SIA

207
2010
25,97423,448
5,9885,908
5022
810
0.4%
7,3341,652
25166
02,0211,4521,228
0915
015.9%
10,1262,055
31315
0241
1,387399
66,022
062.6%
7,53232.1%
2,5261,783
73013
2020
29,35726,357
6,6376,366
5988
12333
01.8%
8,2922,058
554351225
1,9931,2081,535
168834145
23.2%
11,4282,653
7145837
2411,126
678464
6,14960
65.0%
9,47235.9%
3,0002,117
86815
2030
32,05128,651
7,1896,667
66132323144
13.8%
8,8982,2641,010
667501
1,807927
1,711404813305
34.1%
12,5653,1431,402
8161
210980805
1,1246,108
11470.1%
12,11842.3%
3,4002,398
98517
2040
34,13030,330
7,7406,815
73297539313
178.0%
9,2032,3841,386
858685
1,717565
1,813648743477
42.8%
13,3873,6172,103
9979
160729868
1,6185,919
37775.4%
14,65348.3%
3,8002,6791,102
19
2050
35,72631,625
8,2926,812
79576778524
4813.6%
9,3002,4501,650
989835
1,268299
1,8061,077
705704
53.5%
14,0334,0132,703
119101123384941
2,1885,686
57980.2%
17,36154.9%
4,1012,8711,210
20
Total (incl. non-energy use)Total (energy use)TransportOil productsNatural gasBiofuelsElectricity
RES electricityHydrogenRES share Transport
IndustryElectricity
RES electricityDistrict heat
RES district heatCoalOil productsGasSolarBiomass and wasteGeothermalRES share Industry
Other SectorsElectricity
RES electricityDistrict heat
RES district heatCoalOil productsGasSolarBiomass and wasteGeothermalRES share Other Sectors
Total RESRES share
Non energy useOilGasCoal
2005
22,55420,553
4,9644,914
420710
0%
6,2851,210
19212
01,8811,334
9880
8600
16.7%
9,3051,541
24425
0139
1,351348
05,901
066.0%
7,19935.0%
2,0011,412
57810
District heating plantsFossil fuelsBiomassSolar collectorsGeothermal
Heat from CHP Fossil fuelsBiomassGeothermal
Direct heating1)
Fossil fuelsBiomassSolar collectorsGeothermal
Total heat supply1)
Fossil fuelsBiomassSolar collectorsGeothermal
RES share (including RES electricity)‘Efficiency’ savings (compared to Ref.)
1) heat from electricity (direct and from electric heat pumps) not included; covered in the model under ‘electric appliances’
Condensation power plantsCoalLigniteGasOilDiesel
Combined heat & power productionCoalLigniteGasOil
CO2 emissions electricity & steam generationCoalLigniteGasOil & diesel
CO2 emissions by sector% of 1990 emissionsIndustryOther sectorsTransportElectricity & steam generationDistrict heating
Population (Mill.)CO2 emissions per capita (t/capita)
table 14.103: developing asia:electricity generationTWh/a
table 14.106: developing asia: installed capacity GW
table 14.107: developing asia:primary energy demand PJ/A
table 14.105: developing asia: CO2 emissionsMILL t/a
table 14.104: developing asia: heat supplyPJ/A
2010
1,199360
24454136
04313
14351
2200
10243010
46
1,209982362
28456136
043
184143
51
1422
00
724
106.074.0
01,032
60.5%
15.2%
1
2020
1,489387
15518108
06023
210991839
93
7119
327
213
6
665
1,5601080
40718
545110
060
420210
99183645
93
1046
119.0102.0
01,343
1207.7%
26.9%
164
2030
1,698288
8526
690
4024
240310
956030
8
14745
144
13521
9138
1,845982333
9570
700
40823240310
95598130
8
1166
142.0116.0
21,590
41322.4%
44.6%
324
2040
1,903201
3531
300
1226
263450195
919012
20953
054
06734
12197
2,112872254
3585
300
121,228
263450195
93125
9012
1277
167.0127.0
241,799
65731.1%
58.1%
537
2050
2,106105
0531
1000
29286530325114160
16
25069
054
08147
15235
2,356769174
0585
1000
1,587286530325110160160
16
1398
197.0135.0
641,965
87137.0%
67.4%
862
Power plantsCoalLigniteGasOilDieselNuclearBiomassHydroWindPVGeothermalSolar thermal power plantsOcean energy
Combined heat & power productionCoalLigniteGasOilBiomassGeothermalCHP by producerMain activity producersAutoproducers
Total generationFossil
CoalLigniteGasOilDiesel
NuclearRenewables
HydroWindPVBiomassGeothermalSolar thermalOcean energy
ImportImport RES
ExportDistribution lossesOwn consumption electricityElectricity for hydrogen productionFinal energy consumption (electricity)
Fluctuating RES (PV, Wind, Ocean)Share of fluctuating RES
RES share
‘Efficiency’ savings (compared to Ref.)
2005
897229
19342122
042
6120
00
1700
3030000
30
901716229
23342122
042
143120
006
1700
613
8651
0766
00%
15.8%
2010
30168
3.5122
420
5.03.051
2.10.73.6
00
3021000
21
304239
695
12342
05.06151
213400
2.80.9%
19.9%
2020
40981
2.6149
320
7.13.970
40.412.9
5.62.90.9
17516031
215
426278
864
15533
07.1
141704013
7731
54.112.7%
33.1%
2030
54460
1.8162
220
5.03.679
126.567.9
8.65.02.3
3311
010
074
231
577267
712
17222
05.0
30579
127681113
52
196.734.1%
52.8%
2040
65642
0.9166
200
1.53.881
171.1139.3
13.014.3
3.4
4513
011
013
7
342
700253
551
17720
01.5
44681
171139
172014
3
313.844.8%
63.6%
2050
76223
0166
800
4.182
201.5232.1
16.224.6
4.6
5417
011
016
9
450
816226
410
177800
59082
202232
202625
5
438.253.7%
72.3%
Power plantsCoalLigniteGasOilDieselNuclearBiomassHydroWindPVGeothermalSolar thermal power plantsOcean energy
Combined heat & power productionCoalLigniteGasOilBiomassGeothermal
CHP by producerMain activity producersAutoproducers
Total generationFossil
CoalLigniteGasOilDiesel
NuclearRenewables
HydroWindPVBiomassGeothermalSolar thermalOcean energy
Fluctuating RES (PV, Wind, Ocean)Share of fluctuating RES
RES share
2005
22839
2.68941
05.02.046
00
3.000
2020000
20
230174
395
8941
05.05146
00
2.0300
00%
22.2%
2010
36,29927,051
6,044309
7,56113,137
4698,779
5151610
7,446792
024.2%
14
2020
40,53828,258
6,123169
8,95913,007
65511,625
756356737
7,8611,903
1128.7%5,276
2030
43,39327,548
5,11683
9,66212,688
43615,408
8641,1161,9867,9953,418
2935.5%11,270
2040
43,88425,217
4,22325
8,95112,018
13118,535
9471,6203,3027,9834,640
4342.2%17,048
2050
43,83822,449
3,0430
8,10911,297
021,389
1,0301,9085,0277,9775,390
5848.8%23,642
TotalFossilHard coalLigniteNatural gasCrude oil
NuclearRenewablesHydroWindSolarBiomassGeothermalOcean EnergyRES share‘Efficiency’ savings (compared to Ref.)
2005
31,09522,484
4,718268
6,04711,450
4638,148
43200
7,122594
026.2%
2010
620320
25.8209
65.60
132820
633323
34211
66
1,576325%
369149429629
0
10501.5
2020
594302
15.3216
60.30
3416
313
1
628318
19229
62
1,596329%
390145462598
0
11951.3
2030
4722197.8
20045.2
0
5433
120
1
526251
9220
46
1,482305%
383139484475
0
13241.1
2040
3551462.8
18619.8
0
5836
022
0
413182
3208
20
1,329274%
357120495357
0
14280.9
2050
25373
01736.6
0
6645
021
0
318118
0194
7
1,148236%
30295
496255
0
15040.8
2005
475233
21166
550
80800
483233
30166
55
1,303268%
330133357483
0
9751.3
2010
11000
8375
70
10,6145,3325,276
60
10,6975,4085,283
60
49%
0
2020
352
1688
381233
6979
11,3785,4765,065
632205
11,7945,7115,150
640293
52%
414
2030
382
188
10
723347149227
12,232530949731528
421
12,9935,6585,1411,536
658
56%
957
2040
461
221112
925353234338
13,1544,9315,0812,265
876
14,1255,2855,3382,2761,226
63%
1,778
2050
610
291616
1,065379267419
13,8654,1115,1833,2651,306
14,9904,4905,4793,2811,742
70%
2,904
2005
00000
3737
00
10,0874,7455,342
00
10,1234,7815,342
00
52.8%
table 14.108: developing asia:final energy demandPJ/a
appendix: developing asia energy [r]evolution scenario
14
glo
ssary &
ap
pen
dix
|A
PP
EN
DIX
- DE
VE
LO
PIN
G A
SIA

208
GLOBAL ENERGY [R]EVOLUTIONA SUSTAINABLE GLOBAL ENERGY OUTLOOK
Condensation power plantsCoalLigniteGasOilDiesel
Combined heat & power productionCoalLigniteGasOil
CO2 emissions electricity & steam generationCoalLigniteGasOil & diesel
CO2 emissions by sector% of 1990 emissionsIndustryOther sectorsTransportElectricity & steam generationDistrict heating
Population (Mill.)CO2 emissions per capita (t/capita)
District heating plantsFossil fuelsBiomassSolar collectorsGeothermal
Heat from CHP Fossil fuelsBiomassGeothermal
Direct heating1)
Fossil fuelsBiomassSolar collectorsGeothermal
Total heat supply1)
Fossil fuelsBiomassSolar collectorsGeothermal
RES share (including RES electricity)
1) heat from electricity (direct and from electric heat pumps) not included; covered in the model under ‘electric appliances’
appendix: china reference scenario
table 14.109: china: electricity generationTWh/a
table 14.112: china: installed capacity GW
table 14.113: china: primary energy demand PJ/A
table 14.111: china: CO2 emissionsMILL t/a
table 14.110: china: heat supplyPJ/A
2010
3,7863,030
04758
070
7557
160100
171149
015
250
18153
3,9573,3003,179
06260
070
587557
160
12100
250
24293535
03,129
160.4%
14.8%
2020
6,0594,825
09849
0167
24813
775100
328225
072
624
2
56272
6,3885,2745,050
0170
550
167946813
775
48300
400
39439866
05,083
821.3%
14.8%
2030
7,9806,327
0148
420
25652
1,005133
15200
492260
0165
858
3
117375
8,4726,9486,586
0313
490
2561,2681,005
13315
110500
530
52530
1,1320
6,812
1481.7%
15.0%
2040
9,9287,934
0138
320
34565
1197189
25400
657297
0239
11107
4
179478
10,5858,6508,231
0376
430
3451,5901,197
18925
172700
780
60521
1,3460
8,735
2142.0%
15.0%
2050
11,7869,463
0133
230
43361
1,389245
34500
822343
0287
14173
4
241581
12,60710,263
9,8060
42037
0433
1,9111,389
24534
234900
1050
74476
1,4970
10,665
2792.2%
15.2%
Power plantsCoalLigniteGasOilDieselNuclearBiomassHydroWindPVGeothermalSolar thermal power plantsOcean energy
Combined heat & power productionCoalLigniteGasOilBiomassGeothermalCHP by producerMain activity producersAutoproducers
Total generationFossil
CoalLigniteGasOilDiesel
NuclearRenewables
HydroWindPVBiomassGeothermalSolar thermalOcean energy
ImportImport RES
ExportDistribution lossesOwn consumption electricityElectricity for hydrogen productionFinal energy consumption (electricity)
Fluctuating RES (PV, Wind, Ocean)Share of fluctuating RES
RES share
2005
2,4381,884
03861
053
3397
20000
10197
03000
1388
2,5392,0841,982
04161
053
402397
203000
160
16173330
02,035
20.1%
15.8%
2010
759549
01413
08.91.9
1667.40.20.1
00
4640
05010
937
805620589
01813
08.9
176166
70
2.8000
7.60.9%
21.9%
2020
1,245892
03612
020.4
5.8243
31.43.90.2
00
8762
020
140
2463
1,3321,023
9540
5613
020.4289243
314
9.6100
35.32.7%
21.7%
2030
1,6521,185
051
90
31.010.2300
54.310.7
0.400
13171
050
280
4784
1,7841,3681,256
0101
110
31.0384300
5411
18.6100
65.03.6%
21.6%
2040
2,0431,486
048
70
41.712.7357
71.917.6
0.600
17283
072
215
1
70102
2,2151,6971,569
0119
90
41.7476357
7218
28.2100
89.54.0%
21.5%
2050
2,4211,772
046
50
52.511.8415
93.224.6
0.800
21298
086
325
1
91122
2,6332,0101,870
0132
80
52.5571415
9325
36.9200
117.74.5%
21.7%
Power plantsCoalLigniteGasOilDieselNuclearBiomassHydroWindPVGeothermalSolar thermal power plantsOcean energy
Combined heat & power productionCoalLigniteGasOilBiomassGeothermal
CHP by producerMain activity producersAutoproducers
Total generationFossil
CoalLigniteGasOilDiesel
NuclearRenewables
HydroWindPVBiomassGeothermalSolar thermalOcean energy
Fluctuating RES (PV, Wind, Ocean)Share of fluctuating RES
RES share
2005
483336
09
120
7.00.6
1171.00.1
000
3231
01000
1022
516390367
01112
07.0
119117
10
0.6000
1.10.2%
23.0%
2010
96,34083,94362,553
03,175
18,215
76411,633
2,0055884
9,45234
012.1%
2020
133,181117,931
85,7160
5,87126,344
1,82513,424
2,927277400
9,709111
010.1%
2030
159,872142,596100,422
08,341
33,834
2,79314,482
3,618479710
9,482193
09.0%
2040
174,347155,289103,678
09,600
42,010
3,76115,297
4,309680
1,0169,020
2720
8.7%
2050
185,017164,523103,595
010,51950,409
4,72815,767
5,000882
1,3078,232
3450
8.5%
TotalFossilHard coalLigniteNatural gasCrude oil
NuclearRenewablesHydroWindSolarBiomassGeothermalOcean EnergyRES share
2005
73,00761,62845,951
01,805
13,872
57910,800
1,42980
9,36200
14.8%
2010
3,2053,139
02343
0
205192
012
1
3,4103,330
03545
6,246279%1,664
577529
3,228248
13594.6
2020
4,9734,896
04433
0
275227
044
4
5,2485,123
08837
8,995401%2,124
696913
5,026235
14306.3
2030
6,3176,230
06027
0
284201
079
4
6,6016,431
0139
32
10,969489%2,251
7901340
6,392197
14677.5
2040
6,6476,575
05021
0
308203
0100
6
6,9556,778
0150
27
11,919532%2,308
8291891
6,731160
14588.2
2050
6,6576,600
04215
0
335219
0109
7
6,9936,819
0151
23
12,572561%2,355
8572495
6,746118
14188.9
2005
2,0301,962
02048
0
149146
030
2,1792,108
02348
4,429198%1,295
481360
2,049244
13213.4
2010
1,6791,649
3000
1,1791,137
384
27,43319,903
7,44683
0
30,29022,689
7,51583
4
25.1%
2020
1,9001,799
10100
1,7331,574
14415
33,43425,551
7,481381
21
37,06728,924
7,727381
35
22.0%
2030
1,8121,631
18100
2,0341,744
26822
36,10528,856
6,543656
49
39,95232,231
6,993656
72
19.3%
2040
1,6081,431
17700
2,3101,886
39331
36,94930,336
5,609927
76
40,86733,653
6,179927108
17.7%
2050
1,2901,135
15500
2,6632,048
57639
37,22531,478
4,4621,183
103
41,17834,661
5,1931,183
142
15.8%
2005
1,4801,471
900
809809
00
23,22915,971
7,25800
25,51818,251
7,26700
28.5%
table 14.114: china: final energy demandPJ/a 2010
61,39255,361
7,5577,318
755
17726
01.1%
27,4537,9341,1771,976
3612,811
1,8712,825
037
04.6%
20,3503,154
468852
162,9313,2201,000
839,110
047.5%
11,00619.9%
6,0323,729
5131,790
2020
83,84675,16313,11912,630
12168309
460
1.6%
37,95612,826
1,9002,303
12716,714
2,2713,466
20356
06.3%
24,0895,165
7651,292
712,8224,3211,707
3618,400
1939.9%
12,23316.3%
8,6835,057
8322,794
2030
99,65690,02119,25918,547
15335362
540
2.0%
43,85716,538
2,4752,126
20617,723
2,4924,020
44914
08.3%
26,9047,6221,1411,680
1632,6885,1422,450
6126,662
4732.1%
12,65314.1%
9,6365,5061,0743,055
2040
115,907105,318
27,11826,189
17489422
630
2.0%
48,48020,226
3,0381,946
22017,962
2,6034,335
691,339
09.6%
29,72010,796
1,6211,934
2182,5465,3902,958
8585,164
7326.7%
13,15312.5%
10,5895,9561,3173,317
2050
132,236120,694
35,74134,586
19676459
701
2.1%
52,30023,635
3,5831,741
23818,193
2,5584,539
941,540
010.4%
32,65314,302
2,1682,178
2972,3745,5623,4251,0893,624
9922.3%
13,47811.2%
11,5426,4051,5593,578
Total (incl. non-energy use)Total (energy use)TransportOil productsNatural gasBiofuelsElectricity
RES electricityHydrogenRES share Transport
IndustryElectricity
RES electricityDistrict heat
RES district heatCoalOil productsGasSolarBiomass and wasteGeothermalRES share Industry
Other SectorsElectricity
RES electricityDistrict heat
RES district heatCoalOil productsGasSolarBiomass and wasteGeothermalRES share Other Sectors
Total RESRES share
Non energy useOilGasCoal
2005
47,53443,677
5,0624,986
30
7312
00.2%
20,4054,880
7721,667
99,6741,6272,557
000
3.8%
18,2102,373
376596
32,7232,585
6270
9,3050
53.2%
10,47724.0%
3,8582,626
315917
14
glo
ssary &
ap
pen
dix
|A
PP
EN
DIX
- CH
INA

209
2010
60,78755,359
7,5577,318
755
17727
01.1%
27,4537,9341,2271,976
3612,811
1,8702,826
037
04.7%
20,3493,156
488855
162,9303,2151,003
839,106
047.6%
11,07520%
5,4283,688
4541,286
2020
75,13567,869
9,9929,077
13146753173
33.2%
34,64611,678
2,6892,770
24514,229
1,9273,503
144292103
10%
23,2314,7331,0901,615
1432,5973,1661,687
6248,741
6845.9%
14,45921.3%
7,2664,918
6391,709
2030
79,17071,37012,054
9,80516
4841,695
61855
9.3%
35,24513,220
4,8183,325
50612,082
1,3523,848
535654230
19.1%
24,0716,2162,2652,215
3371,9592,7211,6711,2227,903
16449.4%
19,75527.7%
7,8005,259
7201,821
2040
80,71272,41213,97010,502
20763
2,5661,279
12015.0%
34,02414,102
7,0303,791
9567,052
7563,7291,9911,5921,012
37.0%
24,4197,8683,9222,833
7151,5221,3551,4182,4436,443
53757.6%
28,74339.7%
8,3005,575
8021,923
2050
81,62073,12017,29611,465
201,2084,3892,777
21423.8%
31,36514,139
8,9464,2601,6631,414
1893,2703,6642,4142,015
59.6%
24,4589,2315,8413,2571,271
573365
1,3333,3804,6631,656
68.7%
39,63554.2%
8,5005,687
8581,955
Total (incl. non-energy use)Total (energy use)TransportOil productsNatural gasBiofuelsElectricity
RES electricityHydrogenRES share Transport
IndustryElectricity
RES electricityDistrict heat
RES district heatCoalOil productsGasSolarBiomass and wasteGeothermalRES share Industry
Other SectorsElectricity
RES electricityDistrict heat
RES district heatCoalOil productsGasSolarBiomass and wasteGeothermalRES share Other Sectors
Total RESRES share
Non energy useOilGasCoal
2005
47,53443,677
5,0624,986
30
7312
00.2%
20,4054,880
7721,667
99,6741,6272,557
000
3.8%
18,2102,373
376596
32,7232,585
6270
9,3050
53.2%
10,47724.0%
3,8582,626
315917
District heating plantsFossil fuelsBiomassSolar collectorsGeothermal
Heat from CHP Fossil fuelsBiomassGeothermal
Direct heating1)
Fossil fuelsBiomassSolar collectorsGeothermal
Total heat supply1)
Fossil fuelsBiomassSolar collectorsGeothermal
RES share (including RES electricity)‘Efficiency’ savings (compared to Ref.)
1) heat from electricity (direct and from electric heat pumps) not included; covered in the model under ‘electric appliances’
Condensation power plantsCoalLigniteGasOilDiesel
Combined heat & power productionCoalLigniteGasOil
CO2 emissions electricity & steam generationCoalLigniteGasOil & diesel
CO2 emissions by sector% of 1990 emissionsIndustryOther sectorsTransportElectricity & steam generationDistrict heating
Population (Mill.)CO2 emissions per capita (t/capita)
table 14.115: china: electricity generationTWh/a
table 14.118: china: installed capacity GW
table 14.119: china: primary energy demand PJ/A
table 14.117: china: CO2 emissionsMILL t/a
table 14.116: china: heat supplyPJ/A
2010
3,7743,002
04456
070
7557
381100
173148
018
071
20153
3,9483,2673,150
06256
070
611557
381
14100
242
24278.0
5400
3,130
391.0%
15.5%
0
2020
5,4993,946
09645
0103
29850370
225
285
484291
0124
066
3
184300
5,9834,5034,238
0220
450
1031,378
850370
2295
828
5
369
35407.0808.0
4.64,764
3976.6%
23.0%
319
2030
6,2833,599
0131
250
6358
1,050930190
12200
25
975507
0289
0172
8
535440
7,2584,5504,105
0420
250
632,6451,050
930190230
20200
25
431742
452.0917.0
755,816
114515.8%
36.4%
996
2040
6,7492,813
0155
100
2393
1,2901,330
42019
52075
1,529685
0465
0347
33
934595
8,2784,1283,498
0620
100
234,1271,2901,330
420440
52520
75
552943
472.0958.0
1626,698
182522.0%
49.9%
2,036
2050
7,2711,801
0221
000
1271,5301,510
81023
990260
1,990781
0599
0503107
1,223767
9,2613,4012,581
0820
000
5,8601,5301,510
810630130990260
644545
492.0998.0
2857,505
2,58027.9%
63.3%
3,161
Power plantsCoalLigniteGasOilDieselNuclearBiomassHydroWindPVGeothermalSolar thermal power plantsOcean energy
Combined heat & power productionCoalLigniteGasOilBiomassGeothermalCHP by producerMain activity producersAutoproducers
Total generationFossil
CoalLigniteGasOilDiesel
NuclearRenewables
HydroWindPVBiomassGeothermalSolar thermalOcean energy
ImportImport RES
ExportDistribution lossesOwn consumption electricityElectricity for hydrogen productionFinal energy consumption (electricity)
Fluctuating RES (PV, Wind, Ocean)Share of fluctuating RES
RES share
‘Efficiency’ savings (compared to Ref.)
2005
2,4381,884
03861
053
3397
20000
10197
03000
1388
2,5392,0841,982
04161
053
402397
203000
160
16173330
02,035
20.1%
15.8%
2010
763544
01312
08.91.8
16617.4
0.40.1
00
4740
05010
1037
810614584
01812
08.9
186166
1703000
17.72.2%
23.0%
2020
1,227729
03511
012.5
7.2254
151.015.8
0.89.01.4
14695
041
010
1
8066
1,373910824
07611
012.5450254151
1617
191
168.312.3%
32.8%
2030
1,614673
046
60
7.611.4313
379.6135.7
2.033.3
7.1
301170
0105
025
1
20992
1,915999843
0150
60
7.6909313380136
363
337
522.427.3%
47.5%
2040
1,925552
052
20
2.818.2385
505.73003.2
82.521.4
462235
0173
049
5
342120
2,3861,013
7870
22420
2.81,370
385506300
688
8321
827.134.7%
57.4%
2050
2,311375
074
000
24.8457
574.1578.6
3.8150
74.3
579268
0224
07216
426153
2,890940643
0298
000
1,950457574579
9620
15074
1227.042.5%
67.5%
Power plantsCoalLigniteGasOilDieselNuclearBiomassHydroWindPVGeothermalSolar thermal power plantsOcean energy
Combined heat & power productionCoalLigniteGasOilBiomassGeothermal
CHP by producerMain activity producersAutoproducers
Total generationFossil
CoalLigniteGasOilDiesel
NuclearRenewables
HydroWindPVBiomassGeothermalSolar thermalOcean energy
Fluctuating RES (PV, Wind, Ocean)Share of fluctuating RES
RES share
2005
483336
09
120
7.00.6
1171.00.1
000
3231
01000
1022
516390367
01112
07.0
119117
10
0.6000
1.10.2%
23.0%
2010
95,44982,94961,703
03,124
18,122
76411,736
2,005137
859,476
330
12.3%910
2020
114,43496,97969,859
06,442
20,678
1,12416,331
3,0601,3321,026
10,455440
1814.3%18,787
2030
110,50586,62158,181
08,148
20,292
68723,197
3,7803,3483,288
11,6171,074
9021.0%49,433
2040
104,43870,48242,866
08,811
18,805
25133,706
4,6444,7887,973
13,0063,025
27032.3%70,071
2050
99,15252,99726,160
08,886
17,950
046,155
5,5085,436
13,70213,920
6,652936
46.6%86,179
TotalFossilHard coalLigniteNatural gasCrude oil
NuclearRenewablesHydroWindSolarBiomassGeothermalOcean EnergyRES share‘Efficiency’ savings (compared to Ref.)
2005
73,00761,62845,951
01,805
13,872
57910,800
1,42980
9,36200
14.8%
2010
3,1733,109
022
41.60
205191
014
0
3,3783,300
03642
6,211277%1,662
576529
3,198245
13594.6
2020
3,8053,732
043
30.40
390311
080
0
4,1964,043
0122
30
7,287325%1,847
597657
3,988199
14305.1
2030
2,9382,869
053
16.05
575429
0146
0
3,5133,297
0199
16
6,249279%1,612
511710
3,308108
14674.3
2040
2,0411,978
057
6.60
683485
0198
0
2,7252,463
0255
7
4,779213%1,111
364761
2,49351
14583.3
2050
1,1861,116
070
00
707484
0223
0
1,8931,600
0293
0
3,209143%
557197831
1,6221
14182.3
2005
2,0301,962
02048
0
149146
030
2,1792,108
02348
4,429198%1,295
481360
2,049244
13213.4
2010
1,6631,633
3000
1,1971,140
524
27,42819,901
7,44483
0
30,28722,675
7,52683
4
25%
3
2020
1,7751,571
1078018
2,6502,268
35824
30,78022,111
7,722768178
35,20525,950
8,186848221
26%
1,862
2030
1,268934
95127111
4,3213,543
70970
29,32519,738
7,4111,758
418
34,91324,216
8,2151,884
599
31%
5,038
2040
964484101154225
5,7144,2871,134
293
26,42813,406
6,9334,4351,654
33,10618,177
8,1684,5892,172
45%
7,762
2050
5081066
178254
7,0634,5561,545
962
23,2646,1556,1087,0443,956
30,83510,720
7,7207,2225,172
65%
10,344
2005
1,4801,471
900
809809
00
23,22915,971
7,25800
25,51818,251
7,26700
28.5%
table 14.120: china: final energy demandPJ/a
appendix: china energy [r]evolution scenario
14
glo
ssary &
ap
pen
dix
|A
PP
EN
DIX
- CH
INA

210
GLOBAL ENERGY [R]EVOLUTIONA SUSTAINABLE GLOBAL ENERGY OUTLOOK
Condensation power plantsCoalLigniteGasOilDiesel
Combined heat & power productionCoalLigniteGasOil
CO2 emissions electricity & steam generationCoalLigniteGasOil & diesel
CO2 emissions by sector% of 1990 emissionsIndustryOther sectorsTransportElectricity & steam generationDistrict heating
Population (Mill.)CO2 emissions per capita (t/capita)
District heating plantsFossil fuelsBiomassSolar collectorsGeothermal
Heat from CHP Fossil fuelsBiomassGeothermal
Direct heating1)
Fossil fuelsBiomassSolar collectorsGeothermal
Total heat supply1)
Fossil fuelsBiomassSolar collectorsGeothermal
RES share (including RES electricity)
1) heat from electricity (direct and from electric heat pumps) not included; covered in the model under ‘electric appliances’
appendix: oecd pacific reference scenario
table 14.121: oecd pacific: electricity generationTWh/a
table 14.124: oecd pacific: installed capacity GW
table 14.125: oecd pacific: primary energy demand PJ/A
table 14.123: oecd pacific: CO2 emissionsMILL t/a
table 14.122: oecd pacific: heat supplyPJ/A
2010
1,854539135377149
5472
21137
102700
5746
38620
2433
1,9111,259
543141415155
5472180137
102
24700
000
90121
01,700
120.6%
9.4%
2020
2,145659140456107
3552
23151
3510
811
6553
45741
2639
2,2101,425
664143501114
3552233151
351026
911
000
104135
01,972
462.1%
10.5%
2030
2,332713137508
702
64323
1545217
931
7162
49851
2744
2,4021,494
719139557
782
643265154
52172810
31
000
109141
02,152
702.9%
11.0%
2040
2,499766135552
371
71323
157712510
72
7570
53862
2847
2,5741,558
772135605
451
713303157
71252912
72
000
114147
02,313
983.8%
11.8%
2050
2,665868133583
171
73424
16183351113
3
7960
57872
2950
2,7441,672
874133640
251
734338161
8335301313
3
000
119149
02,476
1214.4%
12.3%
Power plantsCoalLigniteGasOilDieselNuclearBiomassHydroWindPVGeothermalSolar thermal power plantsOcean energy
Combined heat & power productionCoalLigniteGasOilBiomassGeothermalCHP by producerMain activity producersAutoproducers
Total generationFossil
CoalLigniteGasOilDiesel
NuclearRenewables
HydroWindPVBiomassGeothermalSolar thermalOcean energy
ImportImport RES
ExportDistribution lossesOwn consumption electricityElectricity for hydrogen productionFinal energy consumption (electricity)
Fluctuating RES (PV, Wind, Ocean)Share of fluctuating RES
RES share
2005
1,726482123351162
6452
21121
30600
5438
36620
2331
1,7801,175
484131387167
6452153121
30
23600
000
84111
01,585
30.2%
8.6%
2010
41481
20.3100
6313
63.83.263
4.51.41.0
00
14137200
86
428290
8224
1076413
63.87463
51
3.7100
6.01.4%
17.3%
2020
470103
21.9127
497
68.93.770
11.97.11.10.40.1
14228210
77
485321105
23135
517
68.9957012
74.4
100
19.24.0%
19.6%
2030
523119
22.8153
395
80.53.871
16.112.1
1.20.50.3
1620
10210
78
538352121
23163
415
80.5106
711612
4.6110
28.55.3%
19.6%
2040
591146
25.7183
263
89.23.872
22.017.9
1.31.10.6
1720
12210
89
608398148
26195
273
89.2120
722218
4.8211
40.46.7%
19.7%
2050
680193
29.6216
151
91.93.974
25.725.0
1.52.00.9
1820
13210
810
697471195
30228
171
91.9134
742625
4.9221
51.67.4%
19.2%
Power plantsCoalLigniteGasOilDieselNuclearBiomassHydroWindPVGeothermalSolar thermal power plantsOcean energy
Combined heat & power productionCoalLigniteGasOilBiomassGeothermal
CHP by producerMain activity producersAutoproducers
Total generationFossil
CoalLigniteGasOilDiesel
NuclearRenewables
HydroWindPVBiomassGeothermalSolar thermalOcean energy
Fluctuating RES (PV, Wind, Ocean)Share of fluctuating RES
RES share
2005
39472
18.3926816
66.72.955
2.10
1.000
14147200
86
408280
7323997016
66.76255
20
3.3100
2.10.5%
15.2%
2010
39,94633,289
8,6811,6125,811
17,185
5,1501,507
4933642
699237
03.8%
2020
44,32236,002
9,9231,5797,637
16,864
6,0232,297
544126162
1,109355
25.2%
2030
46,21136,39710,091
1,4598,366
16,481
7,0152,799
554187258
1,324472
46.1%
2040
46,71235,622
9,7461,3558,497
16,023
7,7783,312
565256369
1,532583
77.1%
2050
47,02435,140
9,6421,2608,521
15,718
8,0073,877
580299512
1,733743
118.2%
TotalFossilHard coalLigniteNatural gasCrude oil
NuclearRenewablesHydroWindSolarBiomassGeothermalOcean EnergyRES share
2005
37,03530,831
7,7981,5095,070
16,454
4,9271,277
4361228
601200
03.4%
2010
933478179170103
3
27609
11
960484179179118
2,060134%
312287513944
4
20210.2
2020
1,083613175221
722
3970
2310
1,122620175244
84
2,248146%
316296536
1,0974
20211.1
2030
1,075628162238
461
3960
258
1,114634162263
55
2,253146%
312303544
1,0914
19711.4
2040
1,000600150225
241
3860
266
1,038606150251
31
2,176141%
307304544
1,0173
18811.5
2050
963605140206
110.4
3550
265
998610140232
16
2,127138%
300302544979
3
17811.9
2005
804396167144
924
26509
13
831401168153109
1,895123%
303296478814
4
2009.5
2010
463610
00
179172
52
7,6517,253
3363527
7,8777,461
3513530
5.3%
2020
493513
00
297281
115
8,2377,493
505121118
8,5837,809
528121124
9.0%
2030
513416
01
294272
148
8,6637,634
631185213
9,0087,940
661186221
11.9%
2040
523218
11
298267
1714
9,0037,707
756254286
9,3538,006
791254301
14.4%
2050
522921
12
292251
2120
9,3977,735
895338428
9,7408,015
937339450
17.7%
2005
4536
900
175172
30
7,3186,975
2972818
7,5397,183
3092818
4.7%
table 14.126: oecd pacific: final energy demandPJ/a 2010
25,99722,370
7,2567,091
2612
12712
00.3%
7,3592,604
245149
9680
1,7721,814
3326
128.1%
7,7553,388
31973
8272
2,2901,593
329115
6.0%
1,0834.2%
3,6273,514
9618
2020
28,10324,486
7,8317,363
88101279
290
1.7%
7,9252,890
304226
11589
1,6192,074
38421
6710.6%
8,7303,928
414116
18149
2,3371,887
83202
298.5%
1,7166.1%
3,6173,504
9518
2030
29,52325,759
8,1667,452
122159432
480
2.5%
8,2423,070
338196
13621
1,4522,231
53490129
12.4%
9,3514,245
468146
25130
2,3092,059
132285
4510.2%
2,1857.4%
3,7653,647
9918
2040
30,65526,762
8,4127,419
164225603
711
3.5%
8,4823,210
377166
14579
1,3612,371
68557169
14.0%
9,8694,515
531180
36127
2,2112,217
185367
6712.0%
2,6688.7%
3,8933,771
10319
2050
31,79527,772
8,6447,371
220281772
951
4.4%
8,7373,345
412139
15456
1,3512,502
94630221
15.7%
10,3914,796
591201
48105
2,0692,389
244462125
14.2%
3,21910.1%
4,0233,897
10620
Total (incl. non-energy use)Total (energy use)TransportOil productsNatural gasBiofuelsElectricity
RES electricityHydrogenRES share Transport
IndustryElectricity
RES electricityDistrict heat
RES district heatCoalOil productsGasSolarBiomass and wasteGeothermalRES share Industry
Other SectorsElectricity
RES electricityDistrict heat
RES district heatCoalOil productsGasSolarBiomass and wasteGeothermalRES share Other Sectors
Total RESRES share
Non energy useOilGasCoal
2005
24,66921,322
6,7166,613
151
8770
0.1%
6,8472,297
198163
7662
1,8001,629
0289
67.3%
7,7603,322
28654
5297
2,4321,536
288013
5.3%
9193.7%
3,3473,242
8816
14
glo
ssary &
ap
pen
dix
|A
PP
EN
DIX
- OE
CD
PA
CIF
IC

211
2010
25,74622,243
7,2566,984
26116129
130
1.8%
7,1592,484
255183
20685
1,6941,717
2385
89.4%
7,8283,482
358104
19219
2,2431,584
37137
247.3%
1,3765.3%
3,5033,394
9217
2020
25,13421,678
6,5155,699
72437302
615
7.7%
7,2512,655
533400115437
1,2411,880
38553
4717.7%
7,9123,617
727212111
161,6351,639
236391166
20.6%
3,41513.6%
3,4563,348
9117
2030
23,70220,397
5,7744,386
84721567180
1615.7%
6,9132,585
821460218324710
1,921147687
8028.3%
7,7103,6121,147
348229
8851
1,483513646249
36.1%
5,64423.8%
3,3053,202
8716
2040
21,64518,513
5,0332,888
95999
1,025515
2630.3%
6,2842,4041,207
502325110207
1,815232894119
44.2%
7,1963,3711,692
428338
6299
1,093976744278
56.0%
8,33238.5%
3,1323,034
8315
2050
19,62916,669
4,0351,496
961,0041,4161,108
2452.8%
5,7232,1931,716
514398
075
1,615297906123
60.1%
6,9113,2962,579
530453
472
1501,637
916307
85.3%
11,46358.4%
2,9602,868
7814
Total (incl. non-energy use)Total (energy use)TransportOil productsNatural gasBiofuelsElectricity
RES electricityHydrogenRES share Transport
IndustryElectricity
RES electricityDistrict heat
RES district heatCoalOil productsGasSolarBiomass and wasteGeothermalRES share Industry
Other SectorsElectricity
RES electricityDistrict heat
RES district heatCoalOil productsGasSolarBiomass and wasteGeothermalRES share Other Sectors
Total RESRES share
Non energy useOilGasCoal
2005
24,66921,322
6,7166,613
151
8770
0.1%
6,8472,297
198163
7662
1,8001,629
0289
67.3%
7,7603,322
28654
5297
2,4321,536
288013
5.3%
9193.7%
3,3473,242
8816
District heating plantsFossil fuelsBiomassSolar collectorsGeothermal
Heat from CHP Fossil fuelsBiomassGeothermal
Direct heating1)
Fossil fuelsBiomassSolar collectorsGeothermal
Total heat supply1)
Fossil fuelsBiomassSolar collectorsGeothermal
RES share (including RES electricity)‘Efficiency’ savings (compared to Ref.)
1) heat from electricity (direct and from electric heat pumps) not included; covered in the model under ‘electric appliances’
Condensation power plantsCoalLigniteGasOilDiesel
Combined heat & power productionCoalLigniteGasOil
CO2 emissions electricity & steam generationCoalLigniteGasOil & diesel
CO2 emissions by sector% of 1990 emissionsIndustryOther sectorsTransportElectricity & steam generationDistrict heating
Population (Mill.)CO2 emissions per capita (t/capita)
table 14.127: oecd pacific: electricity generationTWh/a
table 14.130: oecd pacific: installed capacity GW
table 14.131: oecd pacific: primary energy demand PJ/A
table 14.129: oecd pacific: CO2 emissionsMILL t/a
table 14.128: oecd pacific: heat supplyPJ/A
2010
1,842521122413145
5445
28138
117710
6037
41631
2535
1,9021,261
523129454151
5445196138
117
31810
000
88.8120.1
01,693
181.0%
10.3%
7
2020
1,951538
85563
862
28336
164120
4914
83
9424
684
133
3757
2,0451,351
54089
63190
2283411164120
494917
83
000
94.2122.5
21,826
1728.4%
20.1%
145
2030
1,972500
33610
441
16441
177256
95181914
12400
771
396
4975
2,0961,266
50033
68745
1164665177256
9580241914
000
91.9118.8
61,879
36517.4%
31.8%
273
2040
1,930323
7580
200
4546
187465163
213637
16700
690
8513
7196
2,097999323
7649
200
451,053
187465163131
343637
000
87.0111.0
101,889
66531.7%
50.2%
424
2050
1,885118
0285
200
51194811281
244772
22600
540
14725
113113
2,111459118
0339
200
1,652194811281198
494772
000
81.0103.0
91,918
1,16455.1%
78.3%
558
Power plantsCoalLigniteGasOilDieselNuclearBiomassHydroWindPVGeothermalSolar thermal power plantsOcean energy
Combined heat & power productionCoalLigniteGasOilBiomassGeothermalCHP by producerMain activity producersAutoproducers
Total generationFossil
CoalLigniteGasOilDiesel
NuclearRenewables
HydroWindPVBiomassGeothermalSolar thermalOcean energy
ImportImport RES
ExportDistribution lossesOwn consumption electricityElectricity for hydrogen productionFinal energy consumption (electricity)
Fluctuating RES (PV, Wind, Ocean)Share of fluctuating RES
RES share
‘Efficiency’ savings (compared to Ref.)
2005
1,726482123351162
6452
21121
30600
5438
36620
2331
1,7801,175
484131387167
6452153121
30
23600
000
84111
01,585
30.2%
8.6%
2010
41878
18.3109
6112
60.14.264
5.05.31.00.2
0
14148110
86
432292
7922
1176212
60.18064
555100
10.32.4%
18.5%
2020
49784
13.3157
395
35.35.976
40.835.1
1.92.60.9
1902
13121
910
515314
8415
16940
535.3166
764135
8231
76.814.9%
32.2%
2030
56483
5.5183
243
20.56.781
79.367.9
2.43.24.0
2400
16071
1113
588316
836
20025
320.5252
81796813
334
151.125.7%
42.9%
2040
64861
1.3192
140.15.67.586
144.0116.4
2.85.7
10.6
3200
150
142
1517
679285
611
20814
05.6
38986
144116
2256
11
271.039.9%
57.3%
2050
71426
0106
200
8.489
251.1200.7
3.27.2
20.6
4100
120
254
2219
754146
260
118200
60989
251201
3377
21
472.462.6%
80.7%
Power plantsCoalLigniteGasOilDieselNuclearBiomassHydroWindPVGeothermalSolar thermal power plantsOcean energy
Combined heat & power productionCoalLigniteGasOilBiomassGeothermal
CHP by producerMain activity producersAutoproducers
Total generationFossil
CoalLigniteGasOilDiesel
NuclearRenewables
HydroWindPVBiomassGeothermalSolar thermalOcean energy
Fluctuating RES (PV, Wind, Ocean)Share of fluctuating RES
RES share
2005
39472
18.3926816
66.72.955
2.10
1.000
14147200
86
408280
7323997016
66.76255
20
3.3100
2.10.5%
15.2%
2010
39,54532,753
8,4431,4576,055
16,798
4,8551,936
4974070
1,070260
04.9%
401
2020
38,95531,213
8,391959
8,34613,518
3,0884,654
590432514
2,347760
1111.9%5,367
2030
35,62226,540
7,590351
8,56110,038
1,7897,293
637922
1,1803,4001,104
5020.5%10,588
2040
30,13119,309
5,35370
7,0116,875
49110,331
6731,6742,0554,3391,457
13334.3%16,582
2050
24,95211,227
3,4020
3,1774,647
013,725
6982,9203,2024,7201,927
25955.0%22,072
TotalFossilHard coalLigniteNatural gasCrude oil
NuclearRenewablesHydroWindSolarBiomassGeothermalOcean EnergyRES share‘Efficiency’ savings (compared to Ref.)
2005
37,03530,831
7,7981,5095,070
16,454
4,9271,277
4361228
601200
03.4%
2010
912462
161.6186
100.43
2650
1110
938466162196114
2,016131%
301278505923
9
20210
2020
939501
106.3272
58.11
4330
355
982503106307
65
1,858120%
264218415955
7
2029.2
2030
795440
39.0286
29.00.7
4000
391
835440
39325
31
1,49997%211150321813
4
1977.6
2040
5102537.8
23613.2
0
3400
340
544253
8270
14
97063%144
86214526
1
1885.1
2050
18482
01011.3
0
2500
250
20982
0126
1
43328%108
16113196
0
1782.4
2005
804396167144
924
26509
13
831401168153109
1,895123%
303296478814
4
2009.5
2010
1158528
20
178167
65
7,5107,009
4214040
7,8037,262
4554244
7%
73
2020
22462
1143414
396328
3830
7,3445,943
766275360
7,9636,333
918309404
20%
619
2030
33150
149109
23
487314115
58
6,9324,6191,087
660566
7,7514,9831,351
769647
36%
1,258
2040
3263
163130
29
619267237115
6,3283,0931,3391,208
688
7,2733,3631,7381,339
833
54%
2,080
2050
2180
1058726
843195422226
5,8171,6421,4941,934
748
6,8781,8372,0202,0211,000
73%
2,862
2005
4536
900
175172
30
7,3186,975
2972818
7,5397,183
3092818
4.7%
table 14.132: oecd pacific: final energy demandPJ/a
appendix: oecd pacific energy [r]evolution scenario
14
glo
ssary &
ap
pen
dix
|A
PP
EN
DIX
- OE
CD
PA
CIF
IC

Greenpeace is a global organisation that uses non-violent directaction to tackle the most crucial threats to our planet’s biodiversityand environment. Greenpeace is a non-profit organisation, present in40 countries across Europe, the Americas, Asia and the Pacific. It speaks for 2.8 million supporters worldwide, and inspires manymillions more to take action every day. To maintain itsindependence, Greenpeace does not accept donations fromgovernments or corporations but relies on contributions fromindividual supporters and foundation grants.
Greenpeace has been campaigning against environmentaldegradation since 1971 when a small boat of volunteers andjournalists sailed into Amchitka, an area west of Alaska, where theUS Government was conducting underground nuclear tests. Thistradition of ‘bearing witness’ in a non-violent manner continuestoday, and ships are an important part of all its campaign work.
Greenpeace InternationalOttho Heldringstraat 5, 1066 AZ Amsterdam, The Netherlandst +31 20 718 2000 f +31 20 514 [email protected] www.greenpeace.org
european renewable energy council - [EREC]Created on 13 April 2000, the European Renewable Energy Council(EREC) is the umbrella organisation of the European renewableenergy industry, trade and research associations active in thesectors of bioenergy, geothermal, ocean, small hydropower, solarelectricity, solar thermal and wind energy. EREC represents thus 40 billion € turnover and provides jobs to around 350,000 people!
EREC is composed of the following non-profit associations andfederations: AEBIOM (European Biomass Association); eBIO(European Bioethanol Fuel Association); EGEC (EuropeanGeothermal Energy Council); EPIA (European Photovoltaic IndustryAssociation); ESHA (European Small Hydropower Association);ESTIF (European Solar Thermal Industry Federation); EUBIA(European Biomass Industry Association); EWEA (European WindEnergy Association); EUREC Agency (European Association ofRenewable Energy Research Centers); EREF (European RenewableEnergies Federation); EU-OEA (European Ocean Energy Association);ESTELA (European Solar Thermal Electricity Association) andAssociate Member: EBB (European Biodiesel Board)
EREC European Renewable Energy CouncilRenewable Energy House, 63-67 rue d’Arlon, B-1040 Brussels, Belgiumt +32 2 546 1933 f+32 2 546 [email protected] www.erec.org
energy[r]evolution
© G
RE
EN
PE
AC
E/N
ICK
CO
BB
ING
image ICEBERGS CALVING FROM THE ILUISSAT GLACIER IN GREENLAND. MEASUREMENTS OF THE MELT LAKES ON THE GREENLAND ICE SHEET SHOW ITS VULNERABILITY TO WARMING TEMPERATURES.