energy, romania 03 march 2017 romanian oil and gas · pdf fileenergy, romania 03 march 2017...
TRANSCRIPT

Energy, Romania 03 March 2017
Romanian Oil and Gas Sector report
Growth in the pipeline
In this report, we reiterate our bullish view on Romgaz and Petrom,
increasing our price targets (PTs) for Petrom (to RON 0.361 from
RON 0.302) and Romgaz (to RON 36.6 from RON 36.4). The natural gas
price recovery since October 2016 should rescue the Romanian market
and players from the asymmetric risks associated from being an
import-only market, in our view. In the near team, we see a recovery in
volumes, as well as prices, a renewal of the taxation and royalty
system, and investments in infrastructure and new development
projects from both companies as driving sentiment, production
volumes and earnings. Of the two companies, we prefer Romgaz
slightly, which we see as a bigger beneficiary of the recovery, and able
to capitalise faster on new markets when the infrastructure is
completed. On the other hand, we like Petrom’s management, its lower
risk diversified business model, and its long term prospects. However,
the company is not as well-positioned to take advantage of the market
changes, in our view. Nonetheless, although Petrom’s share price
performance since the SPO in October 2016 has reduced the level of
potential upside, the company is still undervalued, in our view.
Romanian macro. We expect the Romanian economy to enjoy high GDP
growth (+4.5% in 2017E and +4.0% in 2018E), and see upside in energy
demand in such a scenario. Petrom’s retail business should be a beneficiary
here, in our view.
Emerging Romania. With increased liquidity of existing stocks and an
eventual listing of Hidroelectrica, which we expect in the next 12-24 months,
we see a greater chance of Romania being upgraded from Frontier to
Emerging Market status. As two of the largest companies, Romgaz and
Petrom would benefit from the resulting inflows.
Gas price recovery. European gas prices reached extremely low levels in
2016, driven by low oil prices and excess natural gas volumes. There was a
correction in 4Q16, with prices 33% higher than the first nine months, and
prices have been even better so far in 2017, up a further 19% ytd.
Refinery margins. We believe that 2017E could turn out to be a good year
for refining margins in Europe. We estimate that Petrom will generate 30%
of its EBITDA from downstream in 2017E.
Royalties and taxes. With the election of a new government in December
2016, we expect to see the issue of royalties decided once and for all. We
believe that there will be no significant increases in rates and that the
separate treatment of offshore projects would catalyse investments.
Unexploited resources. Both companies have significant undeveloped
resources that can be developed, once the export infrastructure is in place.
Export infrastructure. Pipeline infrastructure connecting Romania with
markets elsewhere in Europe, which should be completed in the next two
years, in our view, should be a big game changer for both companies, in our
view.
Romgaz
BUY (maintained)
Price: RON 28.5
Price target: RON 36.6 (from
RON 36.4)
Petrom
BUY (maintained)
Price: RON 0.307
Price target: RON 0.361 (from
RON 0.302)
EQUITY
RESEARCH Analysts: Jonathan Lamb, Lucian Albulescu, Ondrej Slama London: +44 20 3530 0621
E-mail: [email protected], [email protected] Website: www.wood.com
Price Upside Mkt EV/EBITDA Div yield
Rating target potential Cap 12M Perf 2016E 2017E 2018E 2016E 2017E 2018E
Romgaz BUY 36.6 28.3% 2,582 21.0% 4.9x 4.1x 4.2x 10.5% 9.9% 9.2%
Petrom BUY 0.361 17.6% 3,374 29.0% 5.0x 4.1x 3.9x 5.0% 5.6% 6.0%

Energy, Romania 2 WOOD & Company
Contents
Investment summary ........................................................................................................................................ 3
Valuation ............................................................................................................................................................ 5
Financial forecast changes ............................................................................................................................. 7
Sector discussion ............................................................................................................................................. 8
Romania’s potential for reclassification to Emerging Markets ................................................................. 14
Company sections
Romgaz .................................................................................................................................................... 17
OMV Petrom ............................................................................................................................................ 27
Important disclosures .................................................................................................................................... 37
Closing Prices as of 01 March 2017
© 2017 by WOOD & Company Financial Services, a.s. All rights reserved. No part of this report may be reproduced or transmitted in any form or by any means electronic or mechanical without written permission from WOOD & Company Financial Services, a.s. This report may not be lent, resold, hired out or otherwise disposed of by way of trade in any form of binding or cover other than that in which it is published without written permission from WOOD & Company Financial Services, a.s. Requests for permission to make copies of any part of this report should be mailed to: WOOD & Company Financial Services a.s. Palladium, Namesti Republiky 1079/1a, 110 00 Prague 1 – Czech Republic tel.: +420 222 096 111 fax: +420 222 096 222 http//:www.wood.cz

Energy, Romania 3 WOOD & Company
Investment summary
We believe the Romanian macro environment should be supportive for energy demand going
forward. In 2016, the European gas price was below Romania’s, which created a major problem,
by drawing imports into a market where gas transfers can only go one way. Romgaz was forced
to reduce production, as well as accept a lower price. A 33% recovery in gas prices in 4Q16 bodes
well for 2017E, in our view, as it removes this asymmetric risk. In the longer term, the risk should
be eliminated by interconnection with the other major markets of Eastern and Central Europe,
which we expect in 2019E. In addition, we see the renewal of the royalties system as a catalyst
that should drive further investment, as well as remove uncertainty from both names.
Romanian macro. Romania shares a positive economic outlook for 2017E with many of its neighbours,
and is also enjoying a newly-elected centre-left government, which is largely a known entity and poses
few risks, in our view. Growing prosperity and increasing vehicle numbers should drive the demand for
energy in the coming years, providing a positive outlook for doing business in Romania, in our view.
Gas price recovery. European gas prices reached extremely low levels in 2016, driven by low oil prices
and excess natural gas volumes. However, from 4Q16, there has been a substantial improvement in
prices, removing the incentives to import gas. Therefore, we see less competitive pressure in the gas
market in 2017E, as well as better unit costs.
Quarterly European spot gas prices (EUR/MWh)
Source: Bloomberg, WOOD Research
Refinery margins. Margins in the region have continued to be strong in 2017 ytd, continuing to benefit
from a mixture of low oil prices, recovering regional demand and a slowdown in capacity additions. Our
expectation for margins in the region in 2017E is about 10% higher than in 2016. Current margins are
even better than this, suggesting that there is upside potential, as well as downside, for our expectations.
Royalties and taxes. After three years of uncertainty, we expect to see the finalisation of a new taxation
and royalty system in 2017E. The temporary system in place for the past three years solved the problem
of the government revenue raising in a high oil price environment, but added a new element of
uncertainty to the companies’ investment thesis. We see a new system as positive for investor
perceptions, but also as a possible catalyst for new investment.
Special treatment for offshore investments is particularly important here as tax incentives can have a
very significant impact on the feasibility of capitally-intensive offshore investments. The government
stated publicly last year that it was its aim to treat offshore in a different way, for this reason.
Unexploited resources. Both companies have major resources that are potential development projects.
If the decision is made to proceed with these projects, the future outlook for reserves and production
replacement is better than in the recent past. Decisions will be based on infrastructure investments and
favourable royalties, which we believe are likely to be forth coming.
Export infrastructure. The construction of a natural gas pipeline link between Romania and Hungary
should substantially change the nature of the market, in our view. It would enable gas produced in the
companies’ growth projects to be exported, improving the returns on large projects in particular. It would
also better enable the complete liberalisation of the market, as Romanian gas prices move into line with
the large markets of Central Europe.
Investment opportunities. Both companies have investment opportunities that required the
confirmation of the new royalty system, as well as investments in pipeline infrastructure. The pipelines
are already under construction, and we believe that 2017E is likely to be a year of big decisions for both
companies.
21.6 21.120.1
17.3
13.2 13.2 13.0
17.4
20.8
0.0
5.0
10.0
15.0
20.0
25.0
1Q 2Q 3Q 4Q
2015 2016 2017

Energy, Romania 4 WOOD & Company
The potential of the deep. In June 2016, Romgaz announced that it had discovered a substantial new
natural gas reservoir. Although the results are very preliminary, it estimated the resource at 150-
170m boe. The gas was discovered at a depth of 4,000 metres. Beyond the immediate impact of this
specific discovery on Romgaz, we believe that it increases the likelihood of further discoveries at depth,
in the only substantially unexplored area in Romania.
Romania no longer frontier. Growing liquidity has put the Romanian stock market in a position where
it may be upgraded from Frontier to Emerging Market status. The increase in Petrom’s free float,
following the SPO in 2016, should help Romania to gain Emerging Market status, in our view. We are
seeing greatly increased interest in the market, as well as passive inflows, which should be a catalyst for
market performance. As two of the largest companies in Romania, Petrom and Romgaz would be
substantial beneficiaries of this reclassification.

Energy, Romania 5 WOOD & Company
Valuation
Romgaz trades at a P/E of 8.6x for 2017E and 8.7x for 2018E, based on our estimates, while Petrom
trades at a P/E of 8.2x for 2017E and 7.6x for 2018E. The European integrated peer companies’ average
P/E ratios of 10.1x for 2017E and 9.2x for 2018E, based on consensus estimates, suggest that Petrom
is undervalued and Romgaz is fairly valued, compared to their peers.
On a price to book metric, the peer average ratio is 1.0x for 2017E and 0.9x for 2018E, based on both
consensus and our estimates. In comparison, Romgaz is trading at 1.1x for both 2017E and 2018E,
while Petrom trades at 0.6x for both 2017E and 2018E, suggesting that Petrom is relatively undervalued
vs. the peer group, in our view.
European peers, group multiples
P/E (x) P/CF (x) P/BV (x)
European integrateds MCAP USD m
Local price 2016 2017E 2018E 2016 2017E 2018E 2016E 2017E 2018E
OMV AT 12,485 36.1 10.9 11.1 8.6 3.6 3.1 3.0 1.0 1.2 1.1
MOL HU 7,329 20,865.0 n.m. 8.3 7.1 4.4 4.0 3.6 1.0 0.9 0.8
Petrom RO 3,987 0.3 15.8 8.2 7.6 3.7 3.1 3.0 0.6 0.6 0.6
PGNiG PL 8,846 6.1 14.9 13.7 12.6 7.4 6.7 6.4 1.1 1.1 1.0
Romgaz RO 2,537 28.2 10.6 8.6 8.7 5.4 5.2 5.0 1.1 1.1 1.0
Average 13.1 10.1 9.2 4.9 4.4 4.2 1.0 1.0 0.9
P/E (x) P/CF (x) P/BV (x)
European downstream MCAP USD m
Local price 2016 2017E 2018E 2016 2017E 2018E 2016E 2017E 2018E
PKN PL 9,902 94.5 8.5 7.2 8.8 5.5 5.1 5.7 1.5 1.2 1.1
TUPRAS TR 5,853 84.1 14.2 9.6 8.8 6.9 5.8 5.7 2.5 2.5 2.2
HELLENIC PETROLEUM GR 1,547 4.8 7.3 9.4 8.6 (1.7) 3.9 3.3 0.0 0.0 0.0
MOTOR OIL (HELLAS) GR 1,706 14.6 6.3 8.3 8.0 23.5 5.8 5.7 2.1 1.9 1.6
LOTOS PL 2,217 49.0 7.6 8.4 10.7 4.8 4.0 4.2 1.0 0.9 0.8
UNIPETROL CP 1,507 212.5 9.0 4.4 5.8 3.5 1.0 0.8
NESTE OYJ SF 9,225 34.0 11.4 13.2 13.0 7.3 8.8 8.3 2.4 2.1 2.0
SARAS SPA IT 1,588 1.6 8.8 9.9 11.2 4.0 4.4 4.3 1.6 1.5 1.4
Average 9.1 8.8 9.9 7.0 5.2 5.3 1.5 1.4 1.3
Source: Bloomberg, WOOD Research
On EV/EBITDA, Petrom’s ratios are 4.1x for 2017E and 3.77x for 2018E, while Romgaz’s ratios are 4.1x
for 2017E and 4.2x for 2018E, on our estimates, compared with 4.6x and 4.2x for its peer group, on
consensus estimates. On this metric, both Petrom and Romgaz look undervalued, in our view.

Energy, Romania 6 WOOD & Company
EV/EBITDA and dividend yields
EV/EBITDA (x) Div yield
European integrateds 2016 2017E 2018E 2016 2017E 2018E
OMV AT 6.0 5.5 4.8 2.8% 3.1% 3.5%
MOL HU 4.3 3.6 3.2 2.6% 2.8% 3.3%
Petrom RO 4.9 4.1 3.8 5.0% 5.6% 6.0%
PGNiG PL 6.0 5.6 5.2 3.4% 3.4% 3.8%
Romgaz RO 4.9 4.1 4.2 9.7% 9.2% 10.7%
Average 5.2 4.6 4.2 4.7% 4.8% 5.0%
EV/EBITDA (x) Div yield
European downstream 2016 2017E 2018E 2016 2017E 2018E
PKN PL 6.2 4.8 5.3 2.3% 3.9% 4.0%
TUPRAS TR 9.7 6.7 6.3 5.8% 8.3% 9.1%
HELLENIC PETROLEUM SA GR 4.8 4.8 4.6 0.0% 3.2% 3.5%
MOTOR OIL (HELLAS) SA GR 3.5 4.2 3.8 6.4% 4.8% 5.0%
LOTOS PL 5.0 5.4 5.9 0.0% 0.0% 0.0%
UNIPETROL CP 4.7 2.4 n.m. 2.4% 2.8%
NESTE OYJ SF 6.7 7.5 7.1 3.5% 3.7% 3.7%
SARAS SPA IT 2.8 3.0 3.0 5.9% 5.5% 5.4%
Average 5.4 4.8 5.1 3.3% 4.0% 4.4%
Source: Bloomberg, WOOD Research

Energy, Romania 7 WOOD & Company
Financial forecast changes
Since our previous report, published on 15 April 2016 (CEE Oil and Gas_Transfer of
Coverage_15Apr2016.pdf, (2 MB)), the problems with natural gas imports cut Romgaz’s sales and
revenues to below our expectations for 2016. We had previously assumed that gas price deregulation
would proceed as planned. However, as the planned increase did not happen in 2016, we have taken a
more conservative view on the process. On the positive side, we assume that exports will start in 2019E,
enabling the company to take advantage of its spare capacity and new discovery. Therefore, the
company’s EBITDA is lower from 2016-19E, but higher after that.
In the case of Petrom, once again, 2016 was below our expectations, but successful cost cutting means
that earnings should be higher from 2017E-onwards, in our view.
EBITDA forecast changes since our last report (RON m)
Source: WOOD Research
0
500
1,000
1,500
2,000
2,500
3,000
3,500
2016 2017E 2018E 2019E 2020E
Romgaz
Previous Current
0
1,000
2,000
3,000
4,000
5,000
6,000
7,000
8,000
2016 2017E 2018E 2019E 2020E
OMV Petrom
Previous Current

Energy, Romania 8 WOOD & Company
Sector discussion
Oil price update
At the end of a year when oil prices had recovered from their early lows, the announcement of production
cuts made by OPEC on 30 November appears to have stabilised oil prices. Brent crude averaged
USD 54.9/bbl in December 2016, USD 55.5/bbl in January 2017 and USD 56.6/bbl in February 2017.
Compared to the recent past, this is an unprecedented low level of volatility.
The key drivers of oil prices in 2017, in our view, are the OPEC cuts, drawdowns of global inventories,
and the recovery of US tight oil production, as well as the usual supply shocks.
OPEC oil production
In December 2016, OPEC was producing 33.14 million barrels per day (m bpd), which fell to 32.3m bpd
in January 2017. This cut has successfully stabilised the global oil price at around USD 55/barrel. The
plan is to cut production by 1.8m bpd for six months, but this may be extended for a longer period if
necessary, according to OPEC. On their own, the cuts will not be enough to completely balance the
market, but should significantly reduce excess stocks, in our view.
OPEC oil production
Source Bloomberg
There are a number of OPEC wildcards that may have a significant impact on crude production volumes.
The most important of these is Libya, which has potential output of 1.5m bpd, but was only producing
380,000 per day on average in 2016. In January 2017, this rose to 670,000 bpd, and we expect this to
increase further. Meanwhile, Iraqi production grew by 400,000 bpd in 2016 and, given the improving
security situation, could continue to grow over 2017E.
The tight oil reaction
The oil price of above USD 50/barrel has already triggered a greater level of activity in the US oil patch
in 4Q16 and so far this year. The rig count reached a nadir of just 323 active rigs in May 2016, which
rebounded to 502 by the end of the year, and 534 in January 2017.
Meanwhile, since reaching its lowest level of 8.48m bpd in July 2016, US crude oil production has
increased by nearly 500,000 bpd as of February 2017. This is still 650,000 bpd below the 2015 peak,
which in itself understates the maximum short-term potential, in our view, given the improvements in
pipeline infrastructure that have been made since that date.
25
26
27
28
29
30
31
32
33
34
35
Jan Feb Mar Apr May Jun Jul Aug Sep Oct Nov Dec
Mil
lio
n B
arr
els
pe
r D
ay
Min / Max Average 2015 2016 2017

Energy, Romania 9 WOOD & Company
US rig count and production
Source: EIA, Baker Hughes, WOOD Research
Crude inventories
During 2016, the oil market was in contango, with 12-month futures prices approximately USD 4.5/barrel
higher than spot prices for the first 11 months of the year. This situation means that oil can be stored at
a profit, with no price risk. This drives inventory levels up. Following the announcement of the OPEC
production cut, spot prices rose, but forward prices did not. The price differential between today and in
12 months’ time fell to USD 1.8 in December and just USD 0.73 for January 2017. We believe that the
disappearance of the contango means that inventories should be released to the market as their related
contracts finish. Therefore, in our view, the primary trend in the oil markets in 2017E should be a
drawdown of inventories, rather than significant changes in price.
Brent crude forward curves
Source: Bloomberg, WOOD Research
0
200
400
600
800
1,000
1,200
1,400
1,600
1,800
Jan Feb Mar Apr May Jun Jul Aug Sep Oct Nov Dec
US oil rig count
Max/Min Average 2015
2016 2017
4.0
5.0
6.0
7.0
8.0
9.0
10.0
Jan Feb Mar Apr May Jun Jul Aug Sep Oct Nov DecMill
ion
Ba
rre
ls p
er
Da
y
US crude production
Min / Max (2010-2014) 2015
2016 Average
2017
30.00
35.00
40.00
45.00
50.00
55.00
60.00
Jan2016
Feb2016
Mar2016
Apr2016
May2016
Jun2016
Jul 2016 Aug2016
Sep2016
Oct2016
Nov2016
Dec2016
Jan2017
1 Month 6 Months 12 Months

Energy, Romania 10 WOOD & Company
European natural gas markets
Given the global glut of natural gas, and the lack of bullish catalysts for oil prices, we expect gas prices
to remain moderate in Europe in the medium term.
The German market is the largest and most liquid, so we use it to illustrate the general European price
trends. The Romanian spot price does not currently follow its German counterpart given that gas can
only flow in one direction.
German natural gas spot prices (EUR/MWh)
Source: Bloomberg, Wood Research
Despite talk over recent years by many industry spokespeople of a decoupling of gas prices from oil
prices and alterations to some supply contracts when oil prices were high, the lagged correlation between
the two still appears to be in place. The graph below compares the current spot price for gas to the
average Brent price for the previous six months, and illustrates nicely, we believe, that the oil price gas
price linkage is still in place.
Crude oil/natural gas price relationship
Source: Bloomberg, WOOD Research
Romanian natural gas business
Although Romania has a connection to pipelines bringing gas from Russia, it remains a gas island, with
the majority of the gas consumed produced locally, and no exports. The market is also heavily regulated,
which is unavoidable given Petrom and Romgaz’s dominance, and the lack of connectivity with
other markets.
With mature fields, gas production volumes have been falling gradually for many years. Improvements
in technology are slowing the declines, but current prices have led to reduced budgets and a reversal of
this trend.
Significant potential exists offshore, but will not be producing this decade because both companies have
a lot of preparation before the final investment decisions (FIDs) can be reached.
0.0
5.0
10.0
15.0
20.0
25.0
30.0
35.0
Jan Feb Mar Apr May Jun Jul Aug Sep Oct Nov Dec
Min / Max (2010-2014) Average 2015 2016 2017
0.0
5.0
10.0
15.0
20.0
25.0
30.0
0.0 10.0 20.0 30.0 40.0 50.0 60.0 70.0 80.0
Gas price/trailing 6M oil price

Energy, Romania 11 WOOD & Company
Natural gas infrastructure
The natural gas transmission system is operated by Transgaz. It was built largely as a closed system,
for delivering domestically-produced gas to domestic customers. The pressure in the lines is lower than
in neighbouring countries, which makes exporting technically impossible. Imports, however, are possible
and happen when prices or volumes necessitate them. It is a priority for the European Union to see
energy markets integrated, to reduce the risks to energy supplies, and it has pressured the Romanian
government to speed up investments to integrate its markets.
Transgaz is constructing a gas corridor between Bulgaria and Hungary, which is expected to be
completed in 2019E. With this in place, Romanian gas producers would be able to export gas and
consumers would have a greater choice of suppliers. Further enhancements in this pipeline would also
enable bigger volumes to be exported from Black Sea projects if necessary. The European Union has
contributed EUR 179m to the project already, which it views as an enhancement for energy security and
vital for the integration of gas markets in the region.
Romanian natural gas consumption and production (mcm)
Source: WOOD Research, BP
Regulation
As of 1 July 2007, the Romanian gas market became fully open for all consumers, allowing them to freely
choose a gas supplier from the ones licensed by ANRE, and directly negotiate the gas supply clauses
and prices (law no.123/2012 sets the legal framework to converge the domestic gas price with the import
gas price; while government decision no.22/2013 provides for a calendar of domestic gas price increases
with respect to the regulated market).
In June 2016, the Romanian government decided to suspend the price increase for domestic consumers
for nine months. Prices were to have risen from RON 60 to RON 66 as of the beginning of July 2016,
but the government decided against it at the last minute.
The regulator is trying to make it a true market, with gas traded on centralised platforms, while a really
competitive market would be created by connecting Romania to other regional markets. The wholesale
markets for gas were deregulated at the beginning of 2015, and domestic gas prices are going through
the process of deregulation. Current low gas prices make this process politically smoother, but there are
always political risks associated with such moves.
Currently, the regulator is attempting to increase the volumes of gas sold through the trading exchange.
The combination of deregulation and interconnection offers opportunities for the two main players, but
comes with risks attached, especially in light of the current global gas glut.
European refining sector
The European refining sector continues to benefit from a mixture of low oil prices, recovering regional
demand and a slowdown in capacity additions.
As a method of monitoring the market conditions, we have created our own benchmark, which we
calculate from daily product prices. It is based on a mixture of heavy Middle Eastern crude oils, a 50%
diesel yield, 25% gasoline and 25% fuel oil. This margin was very strong in 4Q16, and has continued to
be so in 1Q17 qtd.
10
11
12
13
14
15
16
17
18
19
2000 2001 2002 2003 2004 2005 2006 2007 2008 2009 2010 2011 2012 2013 2014
Production Consumption

Energy, Romania 12 WOOD & Company
WOOD’s Mediterranean benchmark margin
Source: Bloomberg, WOOD Research
Romanian refining sector
There are three refineries operating currently in Romania: Petrom’s Petrobrazi Refinery, LUKOIL’s
Ploiești Refinery and Rompetrol’s Petromidia plant. All are relatively small but high complexity plants.
They process predominantly Russian and domestically produced crude oil. Previously, Romania had a
number of other refineries, which have all been closed or are used for the production of niche products.
Capacity and complexity of Romanian refineries
Source: WOOD Research
The Romanian market is also supplied with products from Bulgaria, Hungary, Belarus and elsewhere.
Romanian petrol retail sector
Car numbers
The Romanian car parc is one of the fastest growing in the region. In the five years to 2015, the number
of cars in Romania grew by an average 3.9% per year to reach more than 5m. In addition to new car
sales, large numbers of second-hand cars are imported from other EU countries, which lowers the cost
of increasing motor vehicle penetration and therefore speeds the process up.
0.0
2.0
4.0
6.0
8.0
10.0
12.0
14.0
16.0
Jan Feb Mar Apr May Jun Jul Aug Sep Oct Nov Dec
Med 2,1,1 margin
Min / Max Average 2015 2016 2017
Petrom
Lukoil
Rompetrol
0.0
1.0
2.0
3.0
4.0
5.0
6.0
9.6 9.8 10.0 10.2 10.4 10.6 10.8 11.0 11.2 11.4 11.6 11.8
Ca
pa
city, m
illio
n to
nn
es
Nelson Complexity

Energy, Romania 13 WOOD & Company
Number of cars in Romania (millions)
Source: ACEA, WOOD Research
Romanian refined product demand, monthly (m tonnes)
Source: Bloomberg, WOOD Research
The main players in the Romanian market are: Petrom/OMV, MOL, Rompetrol, LUKOIL, as well as some
other small players.
4.24.3 4.3
4.5
4.7
4.9
5.15
4.0
4.2
4.4
4.6
4.8
5.0
5.2
5.4
2009 2010 2011 2012 2013 2014 2015
Mill
ion
s
0.40
0.50
0.60
0.70
0.80
0.90
1.00
1.10
Jan Feb Mar Apr May Jun Jul Aug Sep Oct Nov Dec
Mil
lio
n t
on
ne
s
Min / Max 2016 2015 Average

Energy, Romania 14 WOOD & Company
Romania’s potential for reclassification to Emerging Markets
Investors’ attention has started to focus on the potential chances of Romania being reclassified to the
Emerging Markets group. In our view, the chances for such a development have increased along with
OMV Petrom’s free float being boosted by the MSCI in December 2016 (as announced along with the
SAIR in November 2016) from 9% to 20%. As a general rule, the MSCI requires a stock market to have
three companies meeting (simultaneously) the criteria below (in use for the November 2016 SAIR;
updated on a semi-annual basis) to put it on the “watch list” for potential reclassification from frontier to
the emerging markets group:
a) A minimum of three companies with full market capitalisation of a minimum of USD 1,269m;
b) A minimum of three companies with free float adjusted market capitalisation at a minimum of
USD 635m; and
c) A minimum of three companies with both 3M and 12M ATVRs at a minimum of 15%.
According to our calculations, out of the five members of the MSCI Romania index, three stocks met
these requirements as of the end of January 2017. In our view, this means that Romania’s stock market
fulfils (in theory) the very basic size and liquidity criteria set by the MSCI for a market to be put on
its watchlist.
MSCI Romania index members (closing prices as of 1 March 2017; ATVRs calculated as of 28 February 2017)*
Weights in MSCI RO Index MCap (USDm) MSCI FF FF-Mcap (USDm) 3M ATVR 12M ATVR
Banca Transilvania SA 38.9% 2,346 0.70 1,642 24% 25%
ROMGAZ SA 18.1% 2,547 0.30 764 18% 22%
Electrica SA 12.2% 1,145 0.45 515 11% 12%
BRD-Groupe Societe Generale SA 11.5% 1,943 0.25 486 22% 17%
OMV Petrom SA 19.2% 4,054 0.20 811 23% 17%
Source: WOOD Research, Bloomberg, MSCI; *shaded areas denote that the mentioned figures meet the MSCI’s minimum requirements
However, we also note that the MSCI also requires these criteria to be met with a “comfortable” margin.
Moreover, the index provider always has certain discretion over its final decisions on reclassification, so
fulfilling the criteria does not automatically guarantee inclusion. Given that, from our point of view, it
seems that the 2ppts margin with which OMV Petrom meets the 12M ATVR requirement is unlikely to
be deemed “comfortable”, we stress that Romania fulfils the requirements only “in theory”. However, if
the liquidity of the stock continues to improve, and the margin widens, the probability of placing Romania
on the list improves as well, in our view. Therefore, we stress that it is definitely worth monitoring the
situation on Romania’s stock market, as its chances of joining the Emerging Markets group are
increasing, in our view.

Energy, Romania 15 WOOD & Company
Company sections

Energy, Romania 16 WOOD & Company
This page has been left intentionally blank

Energy, Romania 03 March 2017
Romgaz Buy
Maintained
Price: RON 28.5 Price target: RON 36.6
(From RON 36.4)
Not just a pipe dream
We maintain our BUY recommendation on Romgaz, with an updated 12-
month price target (PT) of RON 36.6, offering upside of 28%. Romgaz had
a terrible 2016, driven by competition from imports: a function of the very
low natural gas prices in Europe. The company had to cut production and
prices in response to the intense level of competition. We see 2017E as
a potentially better year, due to a recovery in natural gas prices. We also
see Romgaz as well-placed to benefit from changes in the Romanian gas
market, driven by pipeline connections to the European markets and
price deregulation. Romgaz has spare capacity and is sitting on a major
new discovery, both of which are awaiting suitable customers. With the
completion of the pipeline connection due in 2019E, Romgaz should add
a substantial export business to its current domestic one, in our view.
Higher prices. Better prices for gas would boost the company’s results in
2017E and beyond. The recovery in gas prices should be beneficial as
importers are deterred from the market. As the biggest loser last year in terms
of sales, we see Romgaz as potentially the biggest winner in 2017E.
MSCI potential. In our view, the chances of Romania gaining reclassification
to the Emerging Markets group has increased with Petrom’s better free float
following the deals in 2016, and the potential transactions to come in 2017E.
As one of the Romanian market’s biggest companies, Romgaz stands to
benefit from any upgrade, in our view.
Dividends. Romgaz is one of the best dividend payers among its peers and
we see its ability to pay dividends increasing with rising gas prices and
potential improvements in its sales volumes. New rules demand a 90% payout
from state-owned companies for this year. We forecast lower payouts in the
following years, but 90% may be also imposed in the future.
Deregulation. Although we are aware that the timelines for deregulation have
not been set in stone, the biggest participant in the regulated market should,
by definition, be the biggest beneficiary once the rules are changed.
Exports. From 2019E-onwards, we see Romgaz becoming an exporter of
natural gas, making use of its spare capacity and newly-discovered resources.
This would enable revenues to grow by 33% between 2018-20E, on
our estimates.
Big new resource. Romgaz discovered a large new gas resource last year,
beneath its existing operations. The contingent resource is estimated at
150-170m boe. We believe this can be fast-tracked at a relatively low cost, and
exported.
Reserves replacement. Romgaz has a better reserves replacement track
record than its competitor OMV Petrom, with an 85% RRR over the past three
years. This should also improve once the new discovery can be classified as
reserves, following an investment decision.
Expected events
1Q17 results 12 May
2Q17 results 11 August
Key data
Market Cap USD 2,540m
Free float 30%
Shares outstanding 385.0m
Major shareholder Government 70%
Reuters code ROSNG.BX
Bloomberg code SNG.RO
Price performance
52-w range RON 19.28-28.90
52-w performance 21%
Relative performance -3.5%
Romgaz 12M share price performance
18.0
22.0
26.0
30.0
34.0
Ma
r-16
Apr-
16
Ma
y-1
6
Ju
n-1
6
Ju
l-1
6
Aug
-16
Sep
-16
Oct-
16
Nov-1
6
Dec-1
6
Ja
n-1
7
Fe
b-1
7
SNG RO Equity BETI Index
EQUITY
RESEARCH Analysts: Jonathan Lamb, Lucian Albulescu, Ondrej Slama London: +44 20 3530 0621
E-mail: [email protected], [email protected] Website: www.wood.com
Sales EBITDA EBIT Net income EPS P/E P/CF P/BV EV/EBITDA ROCE DPS Div yield
RONm RONm RONm RONm RON x x x x % RON %
2014 4,493 2,541 1,764 1,410 3.66 9.37 5.53 1.36 3.16 18% 3.15 9.2%
2015 4,053 2,242 1,449 1,194 3.10 8.45 4.91 1.07 3.57 16% 3.025 11.3%
2016 3,412 1,573 1,262 1,025 2.66 10.65 5.47 1.13 4.91 14% 2.961 10.5%
2017E 4,079 1,947 1,521 1,268 3.29 8.60 5.20 1.11 4.07 17% 2.796 9.9%
2018E 4,202 2,021 1,566 1,253 3.25 8.71 4.96 1.09 4.19 15% 2.600 9.2%
2019E 4,853 2,412 1,938 1,550 4.02 7.04 4.84 1.04 3.61 17% 3.017 10.7%

Romgaz 18 WOOD & Company
Company snapshot – BUY, PT RON 36.6
RomgazBUY SHARE PRICE PERFORMANCE COMPANY DESCRIPTION
Bloomberg ticker SNG RO
Closing price (RON) 28.5
Price target (RON) 36.6
Upside to PT 28.3%
Shares outstanding (m) 385.0
MCAP (USD m) 2,582
Free float 30.0%
ADTV (USD m) 0.8
52 Week Range (RON) 19.28-28.90
RATIOS
PER SHARE RATIOS 2014 2015 2016 2017E 2018E 2019E FINANCIAL RATIOS 2014 2015 2016 2017E 2018E 2019E
EPS 3.66 3.10 2.66 3.29 3.25 4.02 Working capital to sales, days 80 92 85 62 55 55
CEPS 19.78 19.38 18.40 19.26 21.14 23.17 Capex/depreciation 0.9x 1.5x 1.0x 1.0x 0.9x 0.8x
BVPS 25.20 25.15 25.11 25.44 25.89 27.31 Capex/net fixed assets 0.29x (0.07)x 0.20x 0.10x 0.09x 0.12x
DPS 3.15 3.03 2.96 2.80 2.60 3.02 Op. cash flow/capex 1.3x (5.5)x 1.4x 2.6x 2.6x 2.1x
EBITDA margin 56.5% 55.3% 46.1% 47.7% 48.1% 49.7%
VALUATION RATIOS 2014 2015 2016 2017E 2018E 2019E EBIT margin 61.4% 61.0% 60.2% 70.4% 69.4% 71.8%
P/E 9.4x 8.4x 10.6x 8.6x 8.7x 7.0x Pre-tax margin 39.8% 36.2% 37.5% 37.3% 37.3% 39.9%
P/CF 5.5x 4.9x 5.5x 5.2x 5.0x 4.8x Net margin 31.4% 29.5% 30.0% 31.1% 29.8% 31.9%
P/BV 1.4x 1.1x 1.1x 1.1x 1.1x 1.0x ROE 14.5% 12.3% 10.6% 12.9% 12.6% 14.7%
EV/EBITDA 3.2x 3.6x 4.9x 4.1x 4.2x 3.6x ROCE (avg) 18.5% 16.0% 14.4% 17.1% 15.4% 17.4%
EV/CE 1.1x 1.1x 1.1x 1.1x 1.0x 1.0x
EV/Sales 1.8x 2.0x 2.3x 1.9x 2.0x 1.8x
EV/EBIT 2.9x 3.2x 3.8x 2.8x 2.9x 2.5x
FCF, RON m 569 2,902 438 1,082 1,031 1,016
FCF yield 5.2% 26.6% 4.0% 9.9% 9.5% 9.3%
Dividend yield 9.2% 11.3% 10.5% 9.9% 9.2% 10.7%
COMPANY FINANCIALS
INCOME STATEMENT, RON m 2014 2015 2016 2017E 2018E 2019E BALANCE SHEET, RON m 2014 2015 2016 2017E 2018E 2019E
Net Sales 4,493 4,053 3,412 4,079 4,202 4,853 Cash & cash equivalents 1,954 740 281 76 30 43
Operating Expenses -1,231 -1,384 -997 -1,003 -1,080 -1,111 Accounts receivable 1,000 601 829 757 700 809
EBITDA 2,541 2,242 1,573 1,947 2,021 2,412 Inventories 392 560 576 407 525 607
DD&A -777 -794 -456 -426 -455 -474 Other CA 1,018 2,286 3,034 3,034 2,534 2,284
EBIT 1,764 1,449 1,262 1,521 1,566 1,938 Total current assets 4,364 4,188 4,719 4,274 3,789 3,743
Other Expenses -1,035 -1,041 -882 -1,252 -1,249 -1,445 PP&E 5,963 5,996 5,787 6,365 7,035 7,720
Pre-tax profit 1,788 1,469 1,280 1,521 1,566 1,938 Other LT assets 485 501 470 470 470 470
Net profit 1,410 1,194 1,025 1,268 1,253 1,550 Total fixed assets 6,448 6,497 6,257 6,835 7,505 8,189
Total assets 10,812 10,685 10,976 11,109 11,293 11,932
Accounts payable 217 187 569 575 584 674
CASH FLOW, RON m 2014 2015 2016 2017E 2018E 2019E Other ST liabilities 452 439 377 377 377 377
Total current liabilities 669 626 946 952 961 1,051
CF from Operations 2,327 2,454 1,595 1,747 1,656 1,925
Thereof depreciation 485 582 354 426 455 474 Asset retirement obligations 202 201 194 194 194 194
Thereof changes in w/c -511 -382 -473 -200 -365 -487 Pension obligation 97 103 120 120 120 120
CF from Investments -1,758 448 -1,157 -665 -625 -909 Other 131 63 40 40 40 40
Dividends -988 -1,215 -1,041 -1,141 -1,078 -1,002 Total LT liabilities 431 366 354 354 354 354
Change in Net debt -419 1,687 -603 -59 -47 14 Minority interest - - - - - -
Total shareholders' equity 9,712 9,692 9,676 9,803 9,978 10,526
Total liab. & equity 10,812 10,685 10,976 11,109 11,293 11,932
OPERATIONS 2014 2015 2016 2017E 2018E 2019E
Net Working Capital 2,194 3,260 3,870 3,623 3,176 3,025
Production, mmcm 5,664 5,563 4,218 5,100 5,000 5,500
Production, boepd 97,000 95,000 72,000 87,000 85,000 94,000 MACRO ASSUMPTIONS 2014 2015 2016 2017E 2018E 2019E
Growth, % 0% -2% -24% 21% -2% 10% Brent crude, USD/bbl 99.0 52.5 43.6 53.8 55.0 60.0
German hub price, EUR/MWh 22.2 20.7 14.8 18.9 19.2 19.8
Regulated gas price, RON/mcm 51 58 60 60 65 70 RON/USD 3.35 4.01 4.00 4.00 4.04 4.08
Market gas price, RON/mcm 99 92 67 85 87 91
PROFITABILITY TRENDS
Per barrel economics (USD/bbl)
Revenues, USD/boe 37.7 31.5 27.2 30.6 31.9 33.2
EBITDA, USD/boe 21.4 16.1 15.0 15.3 16.1 17.2
Opex. USD/boe -10.4 -10.0 -9.5 -7.9 -8.6 -7.9
Romgaz is the largest domestic natural gas exploration and production (E&P) company in Romania,
producing c.50% of the Romanian output (4.2bcm in 2016 ). Romgaz had 62bcm of proved (1P) and 75bcm of
proved and probable (2P) reserves as of end-2015. Romgaz has 147 commercial reservoirs in Transylvania its
largest producing basin, with 90%+ of production, Moldavia and Muntenia, mostly in mature fields, which it
has been producing for 30+ years, in most cases. Romgaz also has successful exploration activities, with a
c.65% drilling success rate and a very major find in 2016. The company has non-operated stakes in some
Black Sea offshore fields, exploration interests in Slovakia and Poland, and some JVs for the production
enhancement of depleted fields. Romgaz owns and operates six underground gas storage (UGS) facilities,
with a total capacity of 2.76bcm. Storage is a fully regulated. 18.0
22.0
26.0
30.0
34.0
Ma
r-16
Apr-
16
May-1
6
Jun-1
6
Jul-16
Aug
-16
Sep
-16
Oct-
16
Nov-1
6
De
c-1
6
Ja
n-1
7
Fe
b-1
7
SNG RO Equity BET Index
3.23.0
3.0
2.8
2.63.0
0
0.5
1
1.5
2
2.5
3
3.5
0
1
1
2
2
3
3
4
4
5
2014 2015 2016 2017E 2018E 2019E
EPS DPS
37.72
31.55
27.17
30.6031.88
33.19
21.44
16.14 14.95 15.33 16.13 17.22
0
5
10
15
20
25
30
35
40
2014 2015 2016 2017E 2018E 2019E
Revenue / Bbl Ebitda / Bbl

Romgaz 19 WOOD & Company
Investment case
We see Romgaz as a major potential beneficiary from the recovery in European gas prices from
the extremely low levels seen in 2016. We believe that, in the longer term, Romgaz should be the
biggest beneficiary of interconnection between the Romanian and other European gas markets.
Given that it is purely a gas company, Romgaz was the biggest loser in volume terms from the
extremely low price environment that we saw in 2016. It also has a bigger share of the regulated
domestic market than OMV Petrom. Conversely, we would expect it to be the biggest beneficiary
of a purely market price-based environment, which we expect to see in 2019E. Access to a bigger
market should also enable it to utilise its spare capacity and to develop its new gas discovery, in
our view. We also see few other companies with the same dividend yield as Romgaz in
our universe.
European gas prices. So far in 2017, the European spot gas price has averaged EUR 21.2/MWh vs.
EUR 14.2/MWh in 2016. Although we do not see this affecting Romanian prices to the same degree, we
believe that it should stem the flow of cheap imports, which was such a problem in 2016. For 2017E, we
believe that Romgaz should obtain better prices and be able to produce higher volumes on the back of
this price trend.
Reserve replacement. Compared to its competitor OMV Petrom, Romgaz has a better track record of
reserve replacement, which has been at 85% in the past three years. When the major discovery from
2016 is added in, this should improve to over 100%, in our view.
Dividends. Traditionally, Romgaz has paid out around 70% of its earnings, which already put it on an
attractive dividend yield. New state-imposed rules this year are forcing a 90% payout ratio, and we see
dividend yields of 9.2% and 8.1% for 2017E and 2018E, respectively.
Romgaz: expected DPS, RON
Source: Wood Research
Deregulation. The liberalisation of the prices for the domestic consumption and district heating
segments has been delayed from 2016, but will eventually have to be implemented over the coming
years, in our view. Romgaz should benefit disproportionately from this because a great percentage of its
sales comes from this segment.
Export infrastructure. The construction of a natural gas pipeline link between Romania and Hungary
should benefit Romgaz the most, in our view, thanks to its significant spare capacity, as well as its newly
discovered resources, which we believe can be fast-tracked into production, if demand necessitates it.
Given the oversupply in the Romanian market, we see the export pipeline as the only way of unlocking
this potential.
Spare capacity. Romgaz already has significant spare capacity, which management estimates to be at
least equivalent to 25% of current production. The only thing missing is customer demand. The ability to
export should unlock this, and we see this as a significant driver of earnings in 2019E and beyond.
Big new resource. In 2016, Romgaz discovered a large new hydrocarbon resource, beneath its existing
operations. The contingent resource is estimated at 150-170m boe. We believe this could be fast-tracked
at a relatively low cost, depending on access to new customers. Moreover, as the first major deep-level
find onshore, there is a possibility that there may be more such discoveries to come.
2.732.58
2.28
2.65
3.01
3.39
0.00
0.50
1.00
1.50
2.00
2.50
3.00
3.50
4.00
2016E 2017E 2018E 2019E 2020E 2021E

Romgaz 20 WOOD & Company
Valuation
DCF
Our valuation for Romgaz is derived using a 10-year DCF, with -5% terminal growth. We calculate a 12-
month price target (PT) of RON 36.6, offering upside of 28%.
Romgaz: 10-year DCF
RON m 2017E 2018E 2019E 2020E 2021E 2022E 2023E 2024E 2025E 2026E
EBITDA 1,947 2,021 2,412 2,851 3,165 3,146 3,127 3,107 3,068 3,011
Taxes 254 244 253 264 258 241 217 194 173 173
Capex 1,004 1,125 1,159 1,194 1,229 1,266 1,304 1,343 1,384 1,425
Change in WC 13 39 -100 -112 -75 0 0 1 5 0
FCF 676 613 1,100 1,505 1,753 1,638 1,606 1,570 1,507 1,413
PV of FCF 620 515 848 1,064 1,137 974 875 785 691 594
Source: WOOD Research
Romgaz: DCF summary and WACC calculation
SUM of PV 7,509 Risk free rate 4.5%
PV of TV 2,129 ERP 4.5%
Levered beta 1.10
Total EV 9,639 Cost of equity 9.5%
Net debt 3,173 Tax rate 16.0%
Equity value 12,812 After-tax cost of debt 5.5%
Per share (RON) 33.3 % of debt 10.0%
% of equity 90.0%
12M PT (RON) 36.6 WACC 9.1%
Source: WOOD Research
Ratios
At current prices, Romgaz trades at P/E ratios of 8.6x for 2017E and 8.7x for 2018E, on our estimates,
vs. 10.1x and 9.2x for its European peer group, on both WOOD and consensus estimates. On
EV/EBITDA, the company’s ratios are 4.1x for 2017E and 4.2x for 2018E, on our estimates, compared
with 4.6x and 4.2x for its peer group. On these metrics, Romgaz looks slightly undervalued, in our view.
We see the company becoming cheaper as its sales volumes increase from 2019E-onwards.
Romgaz: valuation ratios
2014 2015 2016E 2017E 2018E 2019E 2020E
P/E 9.37 8.45 10.65 8.60 8.71 7.04 5.78
P/CF 5.53 4.91 5.47 5.20 4.96 4.84 4.64
P/BV 1.36 1.07 1.13 1.11 1.09 1.04 0.97
EV/EBITDA 3.16 3.57 4.91 4.07 4.19 3.61 3.09
EV/CE 1.05 1.07 1.09 1.07 1.04 0.98 0.90
EV/sales 1.79 1.98 2.26 1.94 2.02 1.79 1.58
EV/EBIT 2.91 3.24 3.76 2.76 2.91 2.50 2.13
FCF, RONm 569 2,902 438 1,082 1,031 1,016 1,124
FCF yield 5.2% 26.6% 4.0% 9.9% 9.5% 9.3% 10.3%
Dividend yield 9.2% 11.3% 10.5% 9.9% 9.2% 10.7% 12.1%
Source: WOOD Research
WOOD vs. the consensus
We are slightly below the consensus on EBITDA for both 2017E and 2018E, but above the consensus
in 2019E. We believe this is due to the consensus numbers not including the impact of the export
business in 2019E and beyond as of yet.
WOOD vs. the consensus
RON m Revenues EBITDA EBIT Net profit
2017E 2018E 2019E 2017E 2018E 2019E 2017E 2018E 2019E 2017E 2018E 2019E
WOOD Research 4,079 4,202 4,853 1,947 2,021 2,412 1,521 1,566 1,938 1,268 1,253 1,550
Consensus 3,775 3,933 3,866 2,031 2,185 2,325 1,310 1,435 1,434 1,130 1,203 1,309
% difference 8.1% 6.8% 25.5% -4.12% -7.50% 3.72% 16.11% 9.13% 35.11% 12.18% 4.18% 18.40%
Source: Bloomberg, WOOD Research

Romgaz 21 WOOD & Company
Company background
Romgaz is the largest natural gas producer and the main gas supplier in Romania. It has three production
areas: the Transylvanian Basin, which accounts for around 90% of production; the Muntenia Moesian
Platform; and the Moldavia Platform.
Reserves
The company has a mature onshore natural gas reserves base of 62bcm 1P and 75bcm 2P reserves.
Its 25 largest fields contain c.70% of Romgaz’s reserves (the average size of the proved reserves per
average field is 450m m3; with 17 fields with over 1bcm). The recovery factors are between 55% and
85% for most fields, with 90% in the more mature fields.
Reserves replacement ratios
Source: Romgaz, WOOD Research
Ownership structure
Romgaz is a joint stock company whose majority shareholder is the Romanian sate, which owns a 70%
stake. The company is listed on the Bucharest Stock Exchange, and its GDRs are also traded on the
London Stock Exchange. Following Fondul Proprietatea’s disposal of its 5.85% stake in April 2016, 30%
of the shares are now in free float.
Company history
In 1991, the Romanian national gas company was named Romgaz, which became a brand for natural
gas exploration, production and storage in Romania after 2000.
In 2013, Romgaz acquired the lernut electricity power plant, in lieu of the payment of outstanding debts.
In 2016, it made the most significant onshore discovery for years, at Muntenia Nord-Est.
Operations
Exploration and production
Romgaz is the titleholder of petroleum operations for exploration, development and production in nine
blocks in Romania, with 100% participation interest, and is co-titleholder in four blocks, based on
concession contracts. These blocks include 141 commercial fields, and five fields recording experimental
production. It also holds exploration and production rights in Slovakia and Poland.
The Transylvanian Basin accounts for around 90% of Romgaz’s production.
Production was 4.2bcm in 2016, which was a 24% yoy decline.
Development areas
The company has been exploring deeper layers beneath its existing gas fields, which it believes hold a
lot of potential. In June 2016, gas was discovered in the Moesian Platform, within the Caragele structure.
The contingent resources were estimated at 150-170mboe, or between 25-28bcm.
Romgaz has also been exploring two blocks in the Black Sea, in partnership with Lukoil and PanAtlantic
Petroleum: EX29 Est Rapsodia and EX30 Trident. In February 2016, the Rapsodia block was
relinquished, following disappointing results. Exploration activities are continuing in the Trident Block,
57% 49%
92%
155%
323%
70%
94%82%
0%
50%
100%
150%
200%
250%
300%
350%
2008 2009 2010 2011 2012 2013 2014 2015
Romgaz 22 WOOD & Company
where a major gas accumulation was discovered in 2015 (potentially 30bcm of gas). Romgaz’s
participation in these blocks is 10% in each.
Electricity generation
Romgaz owns CTE Iernut, a condensation electric power plant with intermediate superheating and
800MWh of installed power. Its capacity accounts for 5% of the domestic/national market share of
electricity production. However, it requires significant investment to remain competitive.
Gas storage
The underground gas storage business operates six storage units, with total active capacity of
2.77bcm/cycle, equivalent to a market share of over 90% in Romania.
Sales
In 2015, 54.1% of Romgaz’s gas sales were to households and thermal plants for the gas used for
household heating, which are sold at regulated prices. The other 45.9% of sales were to industry.
Around 63% of Romgaz’s gas sales, in terms of volumes, were to E.ON Energie and Engie (formerly
GDF Suez).
Management
The board of directors consists of seven members, three of which are independent.

Romgaz 23 WOOD & Company
Risks
We associate the following risks with Romgaz
As the dominant supplier of gas to the Romanian regulated domestic and district heating
segments, Romgaz has the most to lose from delays in price liberalisation.
As a pure-play natural gas company, a repeat of the very low gas prices of 2016 would suppress
volumes and earnings significantly.
The district heating business, in particular, is susceptible to bad payment problems. These could
lead to write-offs, or the company taking ownership of low-value assets as payment.
With 70% state ownership, management is susceptible to interference.
Romgaz 24 WOOD & Company
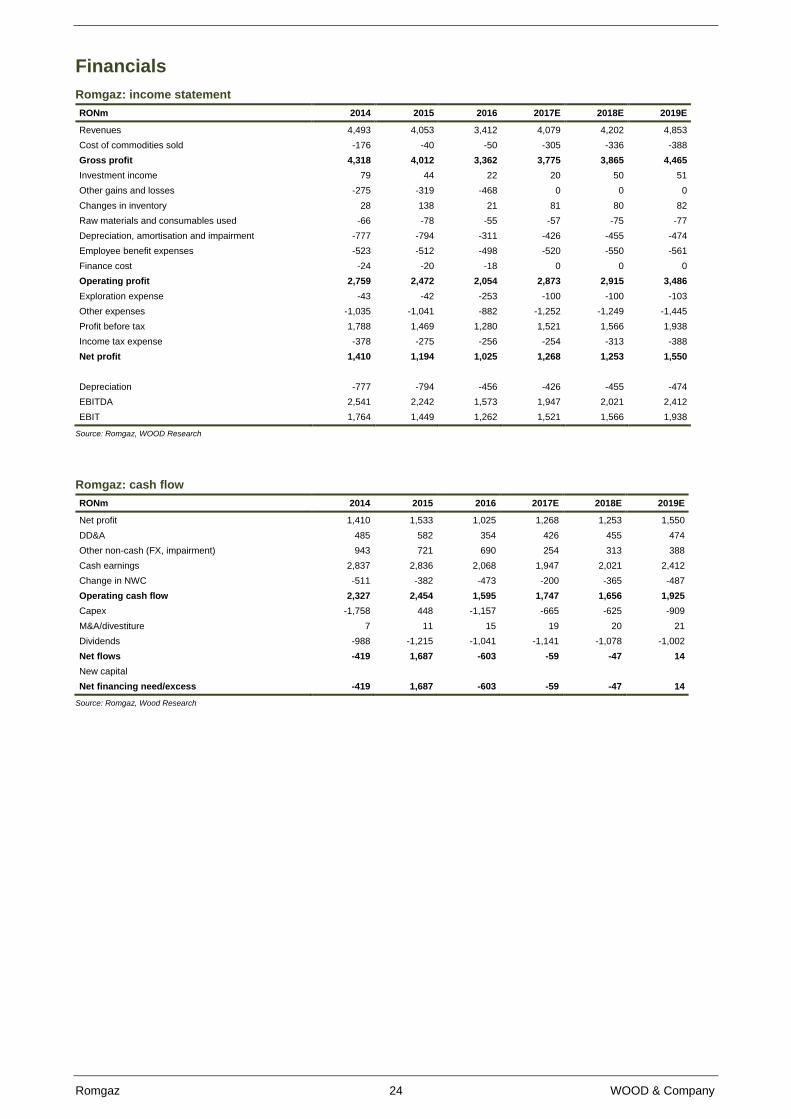
Financials
Romgaz: income statement
RONm 2014 2015 2016 2017E 2018E 2019E
Revenues 4,493 4,053 3,412 4,079 4,202 4,853
Cost of commodities sold -176 -40 -50 -305 -336 -388
Gross profit 4,318 4,012 3,362 3,775 3,865 4,465
Investment income 79 44 22 20 50 51
Other gains and losses -275 -319 -468 0 0 0
Changes in inventory 28 138 21 81 80 82
Raw materials and consumables used -66 -78 -55 -57 -75 -77
Depreciation, amortisation and impairment -777 -794 -311 -426 -455 -474
Employee benefit expenses -523 -512 -498 -520 -550 -561
Finance cost -24 -20 -18 0 0 0
Operating profit 2,759 2,472 2,054 2,873 2,915 3,486
Exploration expense -43 -42 -253 -100 -100 -103
Other expenses -1,035 -1,041 -882 -1,252 -1,249 -1,445
Profit before tax 1,788 1,469 1,280 1,521 1,566 1,938
Income tax expense -378 -275 -256 -254 -313 -388
Net profit 1,410 1,194 1,025 1,268 1,253 1,550
Depreciation -777 -794 -456 -426 -455 -474
EBITDA 2,541 2,242 1,573 1,947 2,021 2,412
EBIT 1,764 1,449 1,262 1,521 1,566 1,938
Source: Romgaz, WOOD Research
Romgaz: cash flow
RONm 2014 2015 2016 2017E 2018E 2019E
Net profit 1,410 1,533 1,025 1,268 1,253 1,550
DD&A 485 582 354 426 455 474
Other non-cash (FX, impairment) 943 721 690 254 313 388
Cash earnings 2,837 2,836 2,068 1,947 2,021 2,412
Change in NWC -511 -382 -473 -200 -365 -487
Operating cash flow 2,327 2,454 1,595 1,747 1,656 1,925
Capex -1,758 448 -1,157 -665 -625 -909
M&A/divestiture 7 11 15 19 20 21
Dividends -988 -1,215 -1,041 -1,141 -1,078 -1,002
Net flows -419 1,687 -603 -59 -47 14
New capital
Net financing need/excess -419 1,687 -603 -59 -47 14
Source: Romgaz, Wood Research

Romgaz 25 WOOD & Company
Romgaz: balance sheet
RONm 2014 2015 2016E 2017E 2018E 2019E
PPE 5,963 5,996 5,787 6,365 7,035 7,720
Intangible assets 407 400 399 399 399 399
Other long-term assets 78 101 71 71 71 71
Fixed assets 6,448 6,497 6,257 6,835 7,505 8,189
Inventories 392 560 576 407 525 607
Receivables 1,000 601 829 757 700 809
Cash & cash equivalents 1,954 740 281 76 30 43
Other short-term financial assets 916 2,147 2,893 2,893 2,393 2,143
Other short-term assets 102 140 141 141 141 141
Current assets 4,364 4,188 4,719 4,274 3,789 3,743
Total assets 10,812 10,685 10,976 11,109 11,293 11,932
Share capital 385 385 385 385 385 385
Reserves 2,142 2,582 3,020 3,020 3,020 3,020
Retained earnings 7,184 6,725 6,271 6,398 6,573 7,121
Equity 9,712 9,692 9,676 9,803 9,978 10,526
Decommissioning provisions 202 201 194 194 194 194
Pension liabilities 97 103 120 120 120 120
Total non-current liabilities 431 366 354 354 354 354
Trade and other payables 217 187 569 575 584 674
Short-term debt 0 0 0 0 0 0
Other short-term liabilities 452 439 377 377 377 377
Total current liabilities 669 626 946 952 961 1,051
Total liabilities and equity 10,812 10,685 10,976 11,109 11,293 11,932
Net debt -1,751 -539 -87 127 168 128
Working capital 2,194 3,260 3,870 3,623 3,176 3,025
Net capital employed 7,623 7,471 7,093 7,425 8,067 8,760
Source: Romgaz, WOOD Research

Romgaz 26 WOOD & Company
This page has been left intentionally blank

Energy, Romania 03 March 2017
OMV Petrom Buy
Maintained
Price: RON 0.307 Price target: RON 0.361
(From RON 0.302)
Patience is a virtue
We maintain our BUY recommendation on OMV Petrom (Petrom), with an
updated 12-month price target (PT) of RON 0.361, offering upside of 18%.
We see Petrom as a disciplined, low-cost producer, with a balanced
business model. It has a small, but profitable, downstream business,
which mitigates the downside risk; and also dominates its own retail
market. Important catalysts include government decisions on the fiscal
regime, and further news on the Neptun Deep offshore project. However,
we see few major catalysts in the short term, with the final investment
decision (FID) for the Neptun project not expected until 2018E. Prior to
the secondary offering in 2016, we believed that liquidity was a major
impediment to performance. Following that offering, however, the share
price has risen 36%. Despite this, we believe the company is still
undervalued, given the low multiples and improving macro outlook.
Reserves replacement a worry. Petrom has done a very good job of
maintaining production, but has lagged in reserve replacement (RR) in recent
years. Currently, only the Neptun project offers RR upside.
Higher prices. Better prices for oil and gas should boost the company’s results
in 2017E and beyond. The recovery in gas prices, in particular, should to be
beneficial as importers are deterred from the market.
Liquidity. Since October, when the offering occurred, daily trading volume in
the stock has been about five times higher than before. We believe this has
led directly to a rerating of the stock. The existence of a GDR, though
accounting for less than 1% of trades currently, should make it easier to attract
new investors to the company.
MSCI potential. In our view, the chances of Romania gaining reclassification
to the Emerging Markets group has increased along with OMV Petrom’s free
float being boosted by the MSCI in December 2016, from 9% to 20%.
Dividends. The return of the dividend, and at a level above that which we (and
our peers) had expected, is a welcome development. Given the strength of the
balance sheet, we see further opportunities for increased payouts.
Lower costs. Operating costs/bbl have been trending down, as cost control
became a major priority, due to lower prices. This improves leverage to rising
prices, and strengthens cash flow.
Resilient downstream. As the period of low oil prices has shown, Petrom’s
downstream segment provides a hedge against upstream problems. The
refinery is complex, with incremental upgrade potential and its retail business
is the market leader.
Neptun Deep. This is be an investment that could transform the company’s
prospects, but its realisation is still years in the future.
Expected events
1Q17 results 11 May 2017
2Q17 results 10 August 2017
Key data
Market cap USD 3,374m
Free float 28.3%
Shares outstanding 56,644m
Major shareholder OMV 51%
Reuters code SNPP.BX
Bloomberg code SNP.RO
Price performance
52-w range 0.22-0.31
52-w performance 29%
Relative performance 2%
OMV Petrom 12M share price
performance
0.20
0.22
0.24
0.26
0.28
0.30
0.32
Ma
r-16
Ma
r-16
Apr-
16
Ma
y-1
6
Ju
n-1
6
Ju
l-1
6
Aug
-16
Sep
-16
Oct-
16
Nov-1
6
Dec-1
6
Ja
n-1
7
Fe
b-1
7
SNP RO Equity BET Index rebased
EQUITY
RESEARCH Analysts: Jonathan Lamb, Lucian Albulescu, Ondrej Slama London: +44 20 3530 0621
E-mail: [email protected], [email protected] Website: www.wood.com
Sales EBITDA EBIT Net income EPS P/E P/CF P/BV EV/EBITDA ROCE DPS Div yield
RON m RON m RON m RON m RON x x x x % RON %
2014 21,541 8,144 3,338 2,100 0.04 8.12 2.50 0.63 3.17 6% 0.01 3.7%
2015 18,145 6,231 -530 -690 -0.01 -24.72 3.23 0.66 4.20 -2% 0.000 0.0%
2016 16,247 4,932 1,469 1,038 0.02 16.43 3.83 0.64 5.02 3% 0.015 5.0%
2017E 18,436 5,844 2,484 2,086 0.04 8.17 3.12 0.61 4.06 6% 0.017 5.6%
2018E 18,342 6,040 2,675 2,235 0.04 7.63 3.00 0.58 3.87 6% 0.018 6.0%
2019E 19,193 6,366 2,996 2,516 0.04 6.78 2.85 0.56 3.64 7% 0.020 6.8%

OMV Petrom 28 WOOD & Company
Company snapshot – BUY, PT RON 0.361
OMV PetromBUY SHARE PRICE PERFORMANCE COMPANY DESCRIPTION
Bloomberg ticker SNP RO
Closing price (RON) 0.307
Price target (RON) 0.361
Upside to PT 17.6%
Shares outstanding (m) 56,644
MCAP (USD m) 3,374
Free float 28.3%
ADTV (USD m) 0.9
52 Week Range (RON) 0.22-0.31
RATIOS
PER SHARE RATIOS 2014 2015 2016 2017E 2018E 2019E FINANCIAL RATIOS 2014 2015 2016 2017E 2018E 2019E
EPS 0.037 (0.012) 0.018 0.037 0.039 0.044 Working capital to sales, days 13.7x 23.1x 28.2x 22.3x 21.1x 20.7x
CEPS 0.671 0.653 0.641 0.645 0.661 0.683 Capex/depreciation 1.9x 1.0x 0.7x 1.1x 1.3x 1.4x
BVPS 0.477 0.453 0.471 0.493 0.516 0.542 Capex/net fixed assets 0.2x 0.1x 0.1x 0.1x 0.1x 0.1x
DPS 0.011 0.000 0.015 0.017 0.018 0.020 Op. cash flow/capex 1.1x 1.4x 1.8x 1.5x 1.3x 1.3x
EBITDA margin 37.8% 34.3% 30.4% 31.7% 34.4% 34.7%
VALUATION RATIOS 2014 2015 2016 2017E 2018E 2019E EBIT margin 15.5% -2.9% 9.0% 13.5% 14.6% 15.6%
P/E 8.1x n.m. 16.4x 8.2x 7.6x 6.8x Pre-tax margin 13.5% -4.0% 7.8% 13.3% 14.5% 15.6%
P/CF 2.5x 3.2x 3.8x 3.1x 3.0x 2.8x Net margin 9.7% -3.8% 6.4% 11.3% 12.2% 13.1%
P/BV 0.6x 0.7x 0.6x 0.6x 0.6x 0.6x ROE 7.8% -2.7% 3.9% 7.5% 7.6% 8.2%
EV/EBITDA 3.2x 4.2x 5.0x 4.1x 3.9x 3.6x ROCE (avg) 5.5% -1.9% 2.9% 5.7% 6.0% 6.5%
EV/Sales 1.2x 1.4x 1.5x 1.3x 1.3x 1.2x Net debt/EBITDA 7.3% 15.9% -9.0% -25.3% -30.7% -32.3%
EV/EBIT 5.1x (32.2)x 11.6x 6.9x 6.4x 5.7x
Cash flow from ops, RON m 6,830 5,283 4,454 5,473 5,679 5,990
EV, RON m 25,824 26,188 24,752 23,719 23,344 23,142
FCF, RON m 1,172 329 1,559 1,853 1,319 1,230
FCF yield 6.9% 1.9% 9.1% 10.9% 7.7% 7.2%
Dividend yield 3.7% 0.0% 5.0% 5.6% 6.0% 6.8%
COMPANY FINANCIALS
INCOME STATEMENT, RON m 2014 2015 2016 2017E 2018E 2019E BALANCE SHEET, RON m 2014 2015 2016 2017E 2018E 2019E
Net Sales 21,541 18,145 16,247 18,436 18,342 19,193 Cash & cash equivalents 1,268 813 1,996 2,829 3,104 3,206
EBITDA 8,144 6,231 4,932 5,844 6,040 6,366 Accounts receivable 1,424 1,318 1,540 1,553 1,457 1,472
Depreciation 3,344 3,947 3,566 3,360 3,400 3,501 Inventories 2,250 1,965 1,950 1,874 1,910 1,998
EBIT 3,338 (530) 1,469 2,484 2,675 2,996 Other CA 926 884 526 526 526 526
EBIT by segments Total current assets 5,868 4,980 6,012 6,783 6,997 7,203
Exploration & Production 3,832 -1,836 509 1,342 1,333 1,636 Long-term investments 2,192 2,628 2,593 2,593 2,593 2,593
Downstream -179 1,208 1,299 1,141 1,365 1,422 PP&E 32,290 29,278 28,326 28,586 29,546 30,805
Corporate & Other -315 98 -339 0 -22 -62 Intangibles 1,657 2,430 2,536 2,536 2,536 2,536
Net financials -429 -196 -204 -30 -15 0 Other non-current assets 1,104 1,684 1,675 1,675 1,675 1,675
Associates contribution 11 7 7 0 0 0 Total fixed assets 37,243 36,020 35,129 35,389 36,349 37,609
Pre-tax profit 2,909 (726) 1,265 2,454 2,660 2,996 Total assets 43,125 41,118 41,414 42,445 43,619 45,084
Income tax -810 36 -227 -368 -426 -479 Short-term debt 274 379 410 410 410 410
Minority interest -3 -14 -6 0 0 0 Accounts payable 2,899 2,318 2,290 2,292 2,291 2,368
Net profit 2,100 (690) 1,038 2,086 2,235 2,516 Total current liabilities 6,160 5,038 4,485 4,479 4,478 4,555
Long-term debt 1,589 1,424 1,141 941 841 741
CASH FLOW, RON m 2014 2015 2016 2017E 2018E 2019E Provisions 7,538 8,180 8,148 8,148 8,148 8,148
CF from Operations 6,830 5,283 4,454 5,473 5,679 5,990 Other non-current liabilities 833 778 798 798 798 798
Thereof depreciation 4,806 6,761 3,464 3,360 3,400 3,501 Total LT liabilities 9,960 10,382 10,087 9,887 9,787 9,687
Thereof changes in w/c 31 -342 -106 130 -66 27 Minority interest (36) (55) (63) (63) (63) (63)
CF from Investments -5,658 -4,953 -2,896 -3,620 -4,360 -4,760 Total shareholders' equity 27,005 25,688 26,706 27,942 29,218 30,706
Dividends -1,731 -631 -1 -850 -959 -1,028 Total liab. & equity 43,125 41,118 41,414 42,445 43,619 45,084
Net equity issues 0 0 0 0 0 1 Net Debt 595 990 (446) (1,479) (1,854) (2,056)
Change in Net debt -140 -455 1,183 833 275 102 Net Working Capital 775 966 1,200 1,135 1,076 1,103
OPERATIONS 2014 2015 2016 2017E 2018E 2019E MACRO ASSUMPTIONS 2014 2015 2016 2017E 2018E 2019E
Total production (m boe) 65.8 65.2 63.7 62.0 60.8 59.5 RON/USD avg. 3.35 4.01 4.05 4.00 4.04 4.08
Total production (boepd) 180.5 178.8 174.0 170.1 166.7 163.4 Brent oil price, USD/bbl 99.1 52.4 42.7 53.8 55.0 60.0
growth, % -1.0% -2.7% -2.2% -2.0% -2.0% Urals/Brent differential, USD/bbl 1.02 0.88 1.60 1.50 1.50 1.50
Liquids production, bpd 85 83 80 79 83 82 Indicator Refining Margin 1.68 8.70 7.00 7.38 7.18 6.53
Natgas production, boepd 96 95 94 91 83 82
Refinery throughput, kt 4,010 4,180 4,220 4,200 4,123 4,123
Filling stations 781 780 784 780 780 780
Profitability PROFITABILITY TRENDS
E&P EBITDA/bbl, USD 32.7 15.7 12.0 15.9 15.9 17.5
R&M EBITDA/bbl, reported, USD 6.0 15.0 16.3 15.5 17.1 16.8
Petrom, majority-owned (51%) by OMV, is an integrated oil&gas company in Romania, with some activity in
Kazakhstan and the Balkans. It produces c. 180,000 boepd oil&gas (172,000 boepd in Romania) and is physically
integrated with refining (Petrobrazi, with 4.5m tpa capacity) to best monetise its oil. Petrom has a filling station
network of 777 sites (548 in Romania with c. 38% market share). Petrom E&P operates in a fixed fiscal regime until
the end of 2015 with a benign royalty of c.7%. It has mature fields with an annual base-line decline rate of c.5-10%,
on our estimates. Heavy capex is aimed at reducing the decline rate and achieving a 50% RRR. Petrom made a
major off-shore gas discovery in the Black Sea in 2012 with Exxon. While the oil market is liberalised, Romania used
to regulate gas prices until 2013. The natgas price deregulation is to be completed in 2018. The key risks relate to
the oil macro, politics and regulation (gas prices, royalties and taxes), geology (reservoir quality).0.20
0.22
0.24
0.26
0.28
0.30
0.32
Mar-
16
Mar-
16
Apr-
16
May-1
6
Ju
n-1
6
Jul-16
Aug
-16
Sep
-16
Oct-
16
Nov-1
6
De
c-1
6
Jan-1
7
Feb-1
7
SNP RO Equity BET Index rebased
0.378065164
0.3434007640.3035854820.316968064
0.3441533760.347027474
0
0.05
0.1
0.15
0.2
0.25
0.3
0.35
0.4
3,000
4,000
5,000
6,000
7,000
8,000
9,000
2014 2015 2016 2017E 2018E 2019E
EBITDA EBITDA margin
32.6
8545182
15.6
9393286
11.9
9503811
15.8
9637097
15.9
285325
17.4
9641327
6.0
21837981
15.0
260513
16.3
4198365
15.5
0378343
17.1
0009544
16.7
9238067
0
5
10
15
20
25
30
35
2014 2015 2016 2017E 2018E 2019E
E&P EBITDA/bbl, USD R&M EBITDA/bbl, reported, USD
OMV Petrom 29 WOOD & Company
Investment case
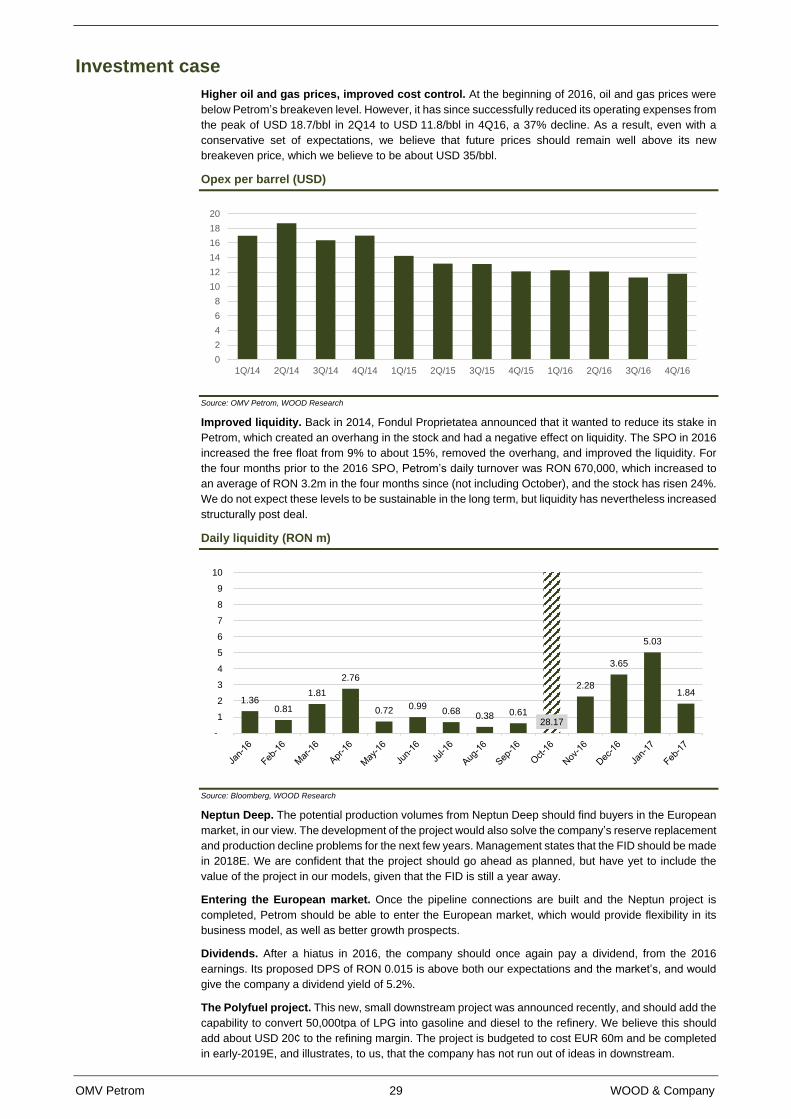
Higher oil and gas prices, improved cost control. At the beginning of 2016, oil and gas prices were
below Petrom’s breakeven level. However, it has since successfully reduced its operating expenses from
the peak of USD 18.7/bbl in 2Q14 to USD 11.8/bbl in 4Q16, a 37% decline. As a result, even with a
conservative set of expectations, we believe that future prices should remain well above its new
breakeven price, which we believe to be about USD 35/bbl.
Opex per barrel (USD)
Source: OMV Petrom, WOOD Research
Improved liquidity. Back in 2014, Fondul Proprietatea announced that it wanted to reduce its stake in
Petrom, which created an overhang in the stock and had a negative effect on liquidity. The SPO in 2016
increased the free float from 9% to about 15%, removed the overhang, and improved the liquidity. For
the four months prior to the 2016 SPO, Petrom’s daily turnover was RON 670,000, which increased to
an average of RON 3.2m in the four months since (not including October), and the stock has risen 24%.
We do not expect these levels to be sustainable in the long term, but liquidity has nevertheless increased
structurally post deal.
Daily liquidity (RON m)
Source: Bloomberg, WOOD Research
Neptun Deep. The potential production volumes from Neptun Deep should find buyers in the European
market, in our view. The development of the project would also solve the company’s reserve replacement
and production decline problems for the next few years. Management states that the FID should be made
in 2018E. We are confident that the project should go ahead as planned, but have yet to include the
value of the project in our models, given that the FID is still a year away.
Entering the European market. Once the pipeline connections are built and the Neptun project is
completed, Petrom should be able to enter the European market, which would provide flexibility in its
business model, as well as better growth prospects.
Dividends. After a hiatus in 2016, the company should once again pay a dividend, from the 2016
earnings. Its proposed DPS of RON 0.015 is above both our expectations and the market’s, and would
give the company a dividend yield of 5.2%.
The Polyfuel project. This new, small downstream project was announced recently, and should add the
capability to convert 50,000tpa of LPG into gasoline and diesel to the refinery. We believe this should
add about USD 20¢ to the refining margin. The project is budgeted to cost EUR 60m and be completed
in early-2019E, and illustrates, to us, that the company has not run out of ideas in downstream.
0
2
4
6
8
10
12
14
16
18
20
1Q/14 2Q/14 3Q/14 4Q/14 1Q/15 2Q/15 3Q/15 4Q/15 1Q/16 2Q/16 3Q/16 4Q/16
1.360.81
1.81
2.76
0.720.99
0.680.38 0.61
28.17
2.28
3.65
5.03
1.84
-
1
2
3
4
5
6
7
8
9
10

OMV Petrom 30 WOOD & Company
Valuation
DCF
Our valuation for Petrom is derived using a 10-year DCF, with a zero terminal growth rate for the
downstream business and -3% for upstream. We calculate a 12-month price target (PT) of RON 0.361,
offering upside of 18%.
OMV Petrom: 10-year DCF
RONm 2017E 2018E 2019E 2020E 2021E 2022E 2023E 2024E 2025E 2026E
Downstream 1,901 2,079 2,063 2,092 2,118 2,149 2,181 2,214 2,247 2,277
Upstream 3,942 3,910 4,252 4,390 4,504 4,655 4,791 4,936 5,082 5,174
Total EBITDA 5,844 5,990 6,314 6,482 6,623 6,805 6,972 7,150 7,330 7,451
Taxes 369 426 479 474 476 493 503 514 525 522
Capex 3,620 4,360 4,760 4,838 4,918 4,999 5,081 5,166 5,252 5,340
Change in WC 66 -27 -8 -8 -25 -19 -20 -20 -3 0
FCF 1,790 1,231 1,083 1,178 1,254 1,332 1,409 1,491 1,556 1,589
PV of FCF 1,641 1,035 835 833 813 792 768 745 713 668
Source: WOOD Research
OMV Petrom: DCF summary and WACC calculation
SUM of PV 8,845 Risk-free rate 4.5%
PV of TV 9,291 ERP 4.5%
Levered beta 1.10
Total EV 18,137 Cost of equity 9.5%
Net debt/cash 446 Tax-rate 16.0%
Equity value 18,582 After-tax cost of debt 5.5%
Per share (RON) 0.328 % of equity 90.0%
% of debt 10.0%
12M PT (RON) 0.361 WACC 9.1%
Source: WOOD Research
Ratios
At current prices, OMV Petrom trades at P/E ratios of 8.2x for 2017E and 7.6x for 2018E, on our
estimates, vs. 10.1x and 9.2x for its European peer group, on WOOD/consensus estimates. On an
EV/EBITDA, the company’s ratios are 4.1x for 2017E and 3.8x for 2018E, on our estimates, compared
with 4.6x and 4.2x for its peer group. On these metrics, Petrom looks undervalued, in our view.
OMV Petrom: valuation ratios
2014 2015 2016E 2017E 2018E 2019E 2020E
P/E 7.82 -23.82 16.43 8.17 7.63 6.75 6.83
P/CF 2.41 3.11 3.83 3.12 3.00 2.84 2.79
P/BV 0.61 0.64 0.64 0.60 0.58 0.55 0.53
EV/EBITDA 3.09 4.10 5.02 4.06 3.77 3.56 3.46
EV/CE 0.66 0.69 0.68 0.65 0.62 0.59 0.57
EV/sales 1.17 1.41 1.52 1.29 1.24 1.18 1.16
EV/EBIT 4.92 -31.01 11.60 6.86 6.37 5.69 5.77
FCF, RONm 1,172 329 1,559 1,853 1,919 1,152 1,209
FCF yield 7.1% 2.0% 9.1% 10.9% 11.3% 6.8% 7.1%
Dividend yield 3.8% 0.0% 5.0% 5.6% 6.0% 6.8% 6.7%
Source: WOOD Research
WOOD vs. the consensus
We are roughly in line with the consensus on EBITDA and EBIT for both 2017E and 2018E, but are a
little above for 2019E. The figures are based on a small number of forecasts, however, and may not be
up to date, which is almost certainly the case for the 2019E net profit expectations, where we are
considerably higher than the consensus.
WOOD vs. the consensus
RONm Revenues EBITDA EBIT Net profit
2017E 2018E 2019E 2017E 2018E 2019E 2017E 2018E 2019E 2017E 2018E 2019E
WOOD Research 18,436 18,342 19,193 5,844 6,040 6,366 2,484 2,675 2,996 2,086 2,235 2,516
Consensus 17,578 18,053 18,377 6,024 6,364 5,855 2,393 2,766 2,833 2,420 2,329 1,608
% difference 4.9% 1.6% 4.4% -3.0% -5.1% 8.7% 3.8% -3.3% 5.8% -13.8% -4.0% 56.4%
Source: Bloomberg, WOOD Research

OMV Petrom 31 WOOD & Company
Company background
OMV Petrom is the largest oil and gas group in south-east Europe, with activities in upstream,
downstream gas and downstream oil. It accounts for almost all crude oil production in Romania, and
supplies around half of the internal gas production. OMV Petrom operates 239 commercial oil and gas
fields in Romania, from which a combined volume of 171.41kboe/d was produced in 2014. OMV Petrom
supplies gas through the natural gas division. Its annual oil and gas production is c.66m boe (mboe).
The company also operates in the Caspian region, specifically Kazakhstan.
As of 31 December 2015, the total proved oil and gas reserves in OMV Petrom Group’s portfolio
amounted to 582mboe, of which Romania represented 558mboe; while proved and probable oil and gas
reserves amounted to 977mboe, of which Romania represented 930mboe.
OMV Petrom processes crude at the Petrobrazi refinery, near Ploiesti, with refining capacity of 4.5mtpa.
The refinery underwent a EUR 600m modernisation programme from 2010-14, allowing it to process all
of OMV Petrom’s Romanian crude production, while improving energy efficiency and product yields.
OMV Petrom is also present in the distribution market for oil products in Romania, the Republic of
Moldova, Bulgaria and Serbia, through a network of c.780 filling stations, operated under two brands,
Petrom and OMV.
Ownership structure
OMV, Austria’s largest listed industrial company, holds a 51.0% share in Petrom. The Romanian state,
via the Ministry of Economy, holds another 20.6%, Fondul Proprietatea (FP) holds 12.6% and 15.8% is
free float on the Bucharest Stock Exchange. We expect to see further reductions in FP’s stake, resulting
in increases in free float, although there is a 12-month lock-up period following the recent SPO.
OMV Petrom: shareholder structure
Source: OMV Petrom, WOOD Research
Company history
Petrom was created from a number of companies in 1997, as the national oil company of Romania. In
2004, it was privatised and 51% of the shares were sold to OMV. The Arpechim refinery was closed in
2011 and a major upgrade of the Petrobrazi refinery was completed in 2014. In recent years, its most
important hydrocarbon discovery was made in the Neptun Block of the Black Sea in 2012.
Timeline
Source: OMV Petrom, WOOD Research
In 2016, FP sold 6.4% of the company’s shares in an SPO, increasing the free float to 16%. A GDR was
also issued as part of the offering.
OMV51.0%
Romanian State20.6%
Fondul12.6%
Free Float15.8%
1997 Company Founded
2004
OMV acquired 51% of Petrom
2011
Arpechim Refinery closed
2012
Gas discovered in Neptun Block
2014
Petrobrazi Refinery upgrade
Completed

OMV Petrom 32 WOOD & Company
Upstream operations
The majority of the company’s production comes from onshore oil and gas fields, many of which have
been in operation for decades. These are mature and declining, and slowing this decline and maximising
the recovery rates are the core activity in this market. It also has opportunities offshore and at deeper
levels onshore. Its two major projects are currently Totea and Lebada, while Neptun is a potentially
transformational project that may be undertaken in the longer term.
Totea Deep
Totea Deep is one of the most important onshore gas discoveries in Romania in recent years. Its three
producing wells are the largest in OMV Petrom’s portfolio and have significantly contributed to mitigating
the production decline of its mature gas fields in the area. After the successful result of the 4539 Totea
exploration well in 2011, an investment programme of c.EUR 200m was started. In 2015, OMV Petrom
continued to invest in optimising the output of the Totea Deep wells by performing workovers and
debottlenecking surface facilities in order to be able to increase production rates to average daily
production of 15kboe in 2015. The success of the Totea Deep development has highlighted the upside
potential of the portfolio for new discoveries in deep layers through seismic and deep drilling technology.
Lebada Est
The field redevelopment project is aimed at optimising the exploitation value of Lebada Est by upgrading
the existing gas compression system within the platform limits, in order to accommodate optimum
non-associated gas production in parallel to the asset’s associated gas for the next 10-15 years. The
project progressed according to plan and the first stage of execution was successfully completed in
November 2015, consisting of increasing the low-pressure compression capacity. The remaining scope
includes upgrading the non-associated gas compression system and was finalised in 2016.
Neptun Block (deep water sector)
The Neptun Block deep water sector covers an area of approximately 7,500km2 in water depths ranging
from 100-1,700 metres. In November 2008, ExxonMobil Exploration and Production Romania Limited
and OMV Petrom signed an agreement for the former to acquire a 50% interest in the deep water sector
of the Neptun Block. In 2012, ExxonMobil and OMV Petrom announced that the Domino-1 exploration
well, located 170km offshore in water about 1,000 meters deep, had encountered natural gas. The field
contains between 1.5tcf and 3tcf, or 250-500m boe.
Kazakhstan
In Kazakhstan, OMV Petrom holds development and production licences for the TOC fields (Tasbulat,
Turkmenoi, Aktas) and Komsomolskoe. In 2014, its average oil and gas production in Kazakhstan was
8.9kboe/d.
Downstream
OMV Petrom processes crude at its Petrobrazi refinery, near Ploiesti, with a refining capacity of 4.5mtpa.
The refinery has a Nelson Complexity of 11.4, making it one of the more complex in the region. It
produces 34% gasoline and 45% middle distillates, with only 15% heavy products.
Product yields
Source: Company data, WOOD Research
Gasoline, 34%
Diesel, 40%
Kerosene/Jet fuel, 5%
HFO, 8%
LPG total, 6%
Petroleum coke, 7%

OMV Petrom 33 WOOD & Company
The refinery was upgraded in 2014, with a revamp of the diesel hydrotreater and the addition of a fluid
catalytic cracker unit. The company’s other refinery, Arpechim Pitesti Refinery, was closed in 2011.
Petrom is currently investing in a new Polyfuel unit, the first commercial installation of what is an
innovative new technology, which should be able to process low-value LPG olefins into a diesel-rich
mixture of automotive fuels. The unit’s capacity should be 200,000tpa. We believe the unit should add
value, particularly when processing gas condensates.
Retail
Petrom also has a retail network of close to 780 petrol stations, of which about 550 are in Romania,
making it the largest player in this segment in the country. It also has retail networks in Bulgaria, Moldovia
and Serbia. The retail sites are under both the Petrom and OMV brands.
Natural gas and power downstream
OMV Petrom owns and operates Brazi gas-operated power plant with an installed capacity of 860MW.
In 2016, OMV Petrom’s total gas sales volumes declined by 0.5% compared to 2015, in a highly
competitive market.
The Dorobanţu Wind Park has an installed capacity of 45MW, consisting of 15 turbines, with a capacity
of 3MW each, and a 110kV substation,
Management
The President of the Executive Board, Mariana Gheorghe, is also OMV’s CEO, while four other members
of the board have also been appointed by OMV. Three board members are appointed on the proposal
of the Government of Romania and one represent the interests of Fondul.
The Executive Board is elected by the Supervisory Board, manages the day-to-day and monitors the
activity of its group companies. The Executive Board consists of five members.
OMV Petrom 34 WOOD & Company
Risks
Given the importance of the Neptun project to the long-term maintenance of production and
reserves, a decision not to go ahead would be very negative. In addition, given the size of the
project, budget or time schedule overruns would be negative for cash flows.
The new regulatory system may be more expensive than the current one, reducing cash flows.
Oversupply of natural gas in Europe could lead to a repeat of the high volumes of imports seen
in 2016.

OMV Petrom 35 WOOD & Company
Financials
OMV Petrom: income statement
RON m 2014 2015 2016 2017E 2018E 2019E
Revenues 21,541 18,145 16,247 18,436 18,342 19,193
Cost of sales -15,815 -16,403 -12,941 -13,865 -14,325 -14,800
Gross profit on sales 5,246 1,359 3,003 4,191 4,404 4,788
Gross profit margin 24% 7% 18% 23% 24% 25%
SG&A -1,423 -1,699 -1,326 -1,520 -1,550 -1,581
Other income/expenses -485 -190 -208 -187 -179 -210
EBIT 3,338 -530 1,469 2,484 2,675 2,996
Upstream 3,832 -1,836 509 1,342 1,333 1,636
Downstream -179 1,208 1,299 1,141 1,365 1,422
Other 0 0 0 0 0 0
Net finance income and costs -429 -196 -204 -30 -15 0
Profit/(loss) before tax 2,909 -726 1,265 2,454 2,660 2,996
Tax expense -810 36 -227 -368 -426 -479
Net profit/(loss) 2,100 -690 1,038 2,086 2,235 2,516
EPS 0.04 -0.01 0.02 0.04 0.04 0.04
Depreciation 3,344 3,947 3,566 3,360 3,400 3,501
EBITDA
Upstream 7,201 4,099 3,094 3,942 3,910 4,252
Downstream 590 1,837 2,037 1,901 2,079 2,063
Other 354 295 -198 0 50 52
Total 8,144 6,231 4,932 5,844 6,040 6,366
Source: OMV Petrom, WOOD Research
OMV Petrom: cash flow
RON m 2014 2015 2016 2017E 2018E 2019E
Net profit 2,909 -726 1,265 2,454 2,660 2,996
Depreciation 4,806 6,761 3,464 3,360 3,400 3,501
Changes in working capital 31 -342 -106 130 -66 27
Other -917 -410 -168 -470 -315 -533
Net cash from/(used in) operations 6,830 5,283 4,454 5,473 5,679 5,990
Cash flows - investing activities
Capital investments -5,910 -5,025 -2,917 -3,620 -4,360 -4,760
Financial investments -45 0 -1 0 0 0
Other 296 72 23 0 0 0
Net cash (used) in investing activities -5,658 -4,953 -2,896 -3,620 -4,360 -4,760
Cash flows from financing activities
Change in net debt 397 -164 -375 -170 -85 -100
Dividend paid -1,731 -631 -1 -850 -959 -1,028
Cash flows from financing activities -1,334 -794 -376 -1,020 -1,045 -1,128
Net (decrease)/increase in cash -140 -455 1,183 833 275 102
Source: OMV Petrom, WOOD Research

OMV Petrom 36 WOOD & Company
OMV Petrom: balance sheet
RON m 2014 2015 2016 2017E 2018E 2019E
Cash & equivalents 1,268 813 1,996 2,829 3,104 3,206
Receivables 1,424 1,318 1,540 1,553 1,457 1,472
Inventories 2,250 1,965 1,950 1,874 1,910 1,998
Other 926 884 526 526 526 526
Current assets 5,868 4,980 6,012 6,783 6,997 7,203
Financial assets 2,192 2,628 2,593 2,593 2,593 2,593
Net tangible assets 32,290 29,278 28,326 28,586 29,546 30,805
Intangibles 1,657 2,430 2,536 2,536 2,536 2,536
Other non-current 1,104 1,684 1,675 1,675 1,675 1,675
Total fixed assets 37,243 36,020 35,129 35,389 36,349 37,609
Total Assets 43,125 41,118 41,414 42,445 43,619 45,084
Short-term debt 274 379 410 410 410 410
Accounts payable 2,899 2,318 2,290 2,292 2,291 2,368
Other current liabilities 2,987 2,342 1,786 1,778 1,778 1,778
Total current liabilities 6,160 5,038 4,485 4,479 4,478 4,555
Long-term debt 1,589 1,424 1,141 941 841 741
Provisions 7,538 8,180 8,148 8,148 8,148 8,148
Other non-current liabilities 833 778 798 798 798 798
Total long-term liabilities 9,960 10,382 10,087 9,887 9,787 9,687
Share capital 5,664 5,664 5,664 5,664 5,664 5,664
Reserves 21,377 20,079 21,105 22,341 23,616 25,105
Minority interest -36 -55 -63 -63 -63 -63
Total shareholders’ equity 27,005 25,688 26,706 27,942 29,218 30,706
Total liabilities & equity 43,125 41,118 41,414 42,445 43,619 45,084
Working capital 775 966 1,200 1,135 1,076 1,103
Total debt 1,863 1,802 1,550 1,350 1,250 1,150
Net debt 595 990 -446 -1,479 -1,854 -2,056
Net capital employed 38,018 36,985 36,329 36,524 37,425 38,711
Source: OMV Petrom, WOOD Research

Energy, Romania 37 WOOD & Company
Important disclosures This investment research is published by Wood & Company Financial Services, a.s. (“Wood & Co”) and/or one of its branches who are authorised and regulated by the
CNB as Home State regulator and in Poland by the KNF, in Slovakia by the NBS, in Italy by the CONSOB and in the UK by the FCA as Host State regulators.
Wood’s ratings and price targets history for OMV Petrom
Rating Price target
15/04/2016 BUY – transfer of coverage 15/04/2016 RON 0.302
03/03/2017 RON 0.361
Wood’s ratings and price targets history for Romgaz
Rating Price target
15/04/2016 BUY – transfer of coverage 15/04/2016 RON 36.4
03/03/2017 RON 36.6
Explanation of Ratings
BUY: The stock is expected to generate total returns of over 15% during the next 12 months as measured by the target price.
HOLD: The stock is expected to generate total returns of 0-15% during the next 12 months as measured by the tnarget price.
SELL: The stock is expected to generate a negative total return during the next 12 months as measured by the target price.
RESTRICTED: Financial forecasts, and/or a rating and/or a target price is restricted from disclosure owing to Compliance or other regulatory/legal considerations such
as a blackout period or a conflict of interest.
NOT RATED: Suspension of rating after 30 consecutive weekdays where the current price vis-à-vis the target price has been out of the range dictated by the current
BUY/HOLD/SELL rating.
COVERAGE IN TRANSITION: Due to changes in the Research team, the disclosure of a stock’s rating and/or target price and/or financial information are temporarily
suspended.
Equity Research Ratings (as of 3 March 2017)
Buy Hold Sell Restricted Not rated Coverage in transition
Equity Research Coverage 46% 46% 7% N.A. N.A.% 1%
IB Clients 1% 1% N.A. N.A. N.A. N.A.
Securities Prices
Prices are taken as of the previous day’s close on the home market unless otherwise stated.
Valuation & Risks
Analysis of specific risks to set stock target prices highlighted in our investment case(s) are outlined throughout the report. For details of methodologies used to determine
our price targets and risks related to the achievement of the targets referred to in the main body of the report or at http://www.wood.com in the Section Corporate
Governance or via the link http://www.wood.com/research.html
Users should assume that the investment risks and valuation methodology in Daily news or flash notes not changing our estimates or ratings is as set out in the most
recent substantive research note on that subject company and can be found on our website at www.wood.com
Wood Research Disclosures (as of 3 March 2017) Company Disclosures
AT&S 5
BRD 5
BZ WBK 5
CD Projekt 5
CETV 5
CEZ 5
Conpet 1
DO&CO 1
Erste Group Bank 5
Enea 5
Energa 5
Fortuna 5
S.C. Fondul Proprietatea S.A. 1, 4, 5
Getin Noble Bank 5
GTC 5
ITG 1, 3
Immofinanz 5
IPF 5
JSW 5
KGHM 5
Komercni 5
mBank 5
MedLife 1, 2, 3
Millennium 5
MONETA Money Bank 1, 2, 3, 5
Netia 5
Orange PL 5
Pekao 5
PGE 5
Philip Morris 5
PKO BP 1, 2, 3, 5
PKN 5
PZU 5
RC2 4
Romgaz 5
SIF2 10
SNP 3, 5
O2 CR 1, 4, 5
Transilvania 5
Transgaz 1
WSE 1
Warimpex 1, 5
# Description
1 The company currently is, or in the past 12 months was, a client of Wood & Co or its affiliated companies for the provision of investment banking services.
2 In the past 12 months, Wood & Co or its affiliated companies have received compensation for Corporate Finance/Investment Banking services from this company.
3 In the past 12 months, Wood & Co or any of its affiliated companies have been lead manager, co-lead manager or co-manager of a public offering of the company’s
financial instruments.
4 Wood & Co acts as corporate broker to this company and/or Wood & Co or any of its affiliated companies may have an agreement with the company relating to the
provision of Corporate Finance/Investment Banking services.
5 Wood & Co or any of its affiliated companies is a market maker or liquidity provider in relation to securities issued by this company.
6 In the past 12 months, Wood & Co, its partners, affiliated companies, officers or directors, or any authoring analyst involved in the preparation of this investment research
has provided services to the company for remuneration, other than normal course investment advisory or trade execution services.
7 Those persons identified as the author(s) of this investment research, or any individual involved in the preparation of this investment research, have purchased/received
shares in the company prior to a public offering of those shares, and the price at which they were acquired along with the date of acquisition are disclosed above.

Energy, Romania 38 WOOD & Company
8 The authoring analyst, a member of the authoring analyst's household, or any individual directly involved in the preparation of this investment research has a direct
ownership position in securities issued by this company.
9 A partner, director, officer, employee or agent of Wood & Co and its affiliated companies, or a member of his/her household, is an officer, or director, or serves as an
advisor or board member of this company.
10 As of the month end immediately preceding the date of publication of this investment research Wood & Co or its affiliate companies, in the aggregate, beneficially owned
1% or more of any class of the total issued share capital or other common equity securities of the company or held a material non-equity financial interest in this company.
11 As of the month end immediately preceding the date of publication of this investment research the relevant company owned 1% or more of any class of the total issued
share capital in Wood & Co or any of its affiliated companies.
12 Other specific disclosures as described above.
WOOD & Company announces that its affiliated company WOOD & Company Funds SICAV p.l.c (through its mutual funds) increased its stake in Pegas Nonwovens to
22.33%. Some entities of WOOD & Company Group are investors of these mutual funds.
The authoring analysts who are responsible for the preparation of this investment research have received (or will receive) compensation based upon (among other factors)
the Corporate Finance/Investment Banking revenues and general profits of Wood & Co. However, such authoring analysts have not received, and will not receive,
compensation that is directly based upon or linked to one or more specific Corporate Finance/Investment Banking activities, or to recommendations contained in the
investment research.
Wood & Co and its affiliated companies may have a Corporate Finance/Investment Banking or other relationship with the company that is the subject of this investment
research and may trade in any of the designated investments mentioned herein either for their own account or the accounts of their customers, in good faith or in the
normal course of market making. Accordingly, Wood & Co or their affiliated companies, principals or employees (other than the authoring analyst(s) who prepared this
investment research) may at any time have a long or short position in any such designated investments, Related designated investments or in options, futures or other
derivative instruments based thereon.
Wood & Co manages conflicts of interest arising as a result of preparation and publication of research through its use of internal databases, notifications by the relevant
employees and Chinese Walls as monitored by Compliance. For further details see our website at www.wood.com in the Section Corporate Governance or via the link
http://www.wood.com/research.html
The information contained in this investment research has been compiled by Wood & Co from sources believed to be reliable, but (with the exception of the information
about Wood & Co) no representation or warranty, express or implied, is made by Wood & Co, its affiliated companies or any other person as to its fairness, accuracy,
completeness or correctness. Wood & Co has not independently verified the facts, assumptions, and estimates contained herein. All estimates, opinions and other
information contained in this investment research constitute Wood & Co’ judgement as of the date of this investment research, are subject to change without notice and
are provided in good faith but without legal responsibility or liability.
Wood & Co salespeople, traders, and other professionals may provide oral or written market commentary or trading strategies to our clients and our proprietary trading
desk that reflect opinions that are contrary to the opinions expressed in this investment research. Wood & Co’ affiliates, proprietary trading desk, and investing businesses
may make investment decisions that are inconsistent with the recommendations or views expressed in this investment research.
This investment research is provided for information purposes only and does not constitute an offer or solicitation to buy or sell any designated investments discussed
herein in any jurisdiction where such offer or solicitation would be prohibited. As a result, the designated investments discussed in this investment research may not be
eligible for sale in some jurisdictions. This investment research is not, and under no circumstances should be construed as, a solicitation to act as a securities broker or
dealer in any jurisdiction by any person or company that is not legally permitted to carry on the business of a securities broker or dealer in that jurisdiction. This material
is prepared for general circulation to clients and does not have regard to the investment objectives, financial situation or particular needs of any particular person. Investors
should obtain advice based on their own individual circumstances before making an investment decision. To the fullest extent permitted by law, none of Wood & Co, its
affiliated companies or any other person accepts any liability whatsoever for any direct or consequential loss arising from or in connection with the use of this material.
For United Kingdom or European Residents:
This investment research is for persons who are Eligible Counterparties or Professional Clients only and is exempt from the general restrictions in section 21 of the
Financial Services and Markets Act 2000 (or any analogous legislation) on the communication of invitations or inducements to engage in investment activity on the
grounds that it is being distributed in the United Kingdom only to persons of a kind described in Article 19(5) (Investment Professionals) and 49(2) (High Net Worth
companies, unincorporated associations etc) of the Financial Services and Markets Act 2000 (Financial Promotion) Order 2005 (as amended). It is not intended to be
distributed or passed on, directly or indirectly, to any other class of persons. This material is not for distribution in the United Kingdom or Europe to retail clients, as defined
under the rules of the Financial Conduct Authority.
For United States Residents:
This investment research distributed in the United States by Wood & Co, and in certain instances by Enclave Capital LLC (‘Enclave’), a U.S registered broker dealer, only
to “major U.S. institutional investors”, as defined under Rule 15a-6 promulgated under the US Securities Exchange Act of 1934, as amended, and as interpreted by the
staff of the US Securities and Exchange Commission. This investment research is not intended for use by any person or entity that is not a major U.S institutional investor.
If you have received a copy of this research and are not a major U.S institutional investor, you are instructed not to read, rely on or reproduce the contents hereof, and to
destroy this research or return it to Wood & Co or to Enclave. Analyst(s) preparing this report are employees of Wood & Co who are resident outside the United States
and are not associated persons or employees of any US registered broker-dealer. Therefore the analyst(s) are not be subject to Rule 2711 of the Financial Industry
Regulatory Authority (FINRA) or to Regulation AC adopted by the U.S Securities and Exchange Commission (SEC) which among other things, restrict communications
with a subject company, public appearances and personal trading in securities by a research analyst. Any major U.S Institutional investor wishing to effect transactions
in any securities referred to herein or options thereon should do so by contacting a representative of Enclave Capital LLC. Enclave is a broker-dealer registered with the
SEC and a member of FINRA and the Securities Investor Protection Corporation. Its address is 19 West 44th Street, Suite 1410, New York, NY 10036 and its telephone
number is 646-454-8600. Wood & Co is not affiliated with Enclave Capital LLC or any other U.S registered broker-dealer.
CONTACTS
Czech Republic
namesti Republiky 1079/1a Palladium 110 00 Praha 1 Czech Republic Tel +420 222 096 111 Fax +420 222 096 222
Romania
Metropolis Center 89-97 Grigore Alexandrescu St. 010624 Bucharest 1 Tel.: +40 316 30 11 81
Poland
Skylight Zlote Tarasy Zlota 59 00 120 Warszawa Poland Tel +48 22 222 1530 Fax +48 22 222 1531
UK
City Point, 15th Floor 1 Ropemaker Street London EC2Y 9HT Tel +44 20 3530 0691
Italy
Via Vittor Pisani, 22 20124 Milan Italy Tel + 39 02 67910 963
Kristen Andrasko/ Sadiq Razak Co-Heads of Equities +420 222 096 253/ +44 20 3530 0681 [email protected] [email protected]
Bloomberg page WUCO
www.wood.com
Research Co-Head of Research/ Head of Research Poland
Marta Jezewska-Wasilewska +48 22 222 1548 [email protected]
Co-Head of Research/Head of Greek Research
Alex Boulougouris +30 211 106 9447 [email protected]
Head of Turkish Equity Research
Oytun Altasli +44 203 530 0627 [email protected]
Macroeconomics
Raffaella Tenconi +44 20 3530 0685 [email protected]
Head of Consumer/Industrials
Lukasz Wachelko +48 22 222 1560 [email protected]
Energy
Jonathan Lamb +44 20 3530 0621 [email protected]
Romania
Lucian Albulescu +420 222 096 273 [email protected]
Utilities/Mining/Pharma
Bram Buring +420 222 096 250 [email protected]
Financials/Turkey
Can Demir +44 20 3530 0623 [email protected]
Non-banks financials
Jerzy Kosinski +48 22 222 1564 [email protected]
Metals/Mining
Andy Jones +44 20 3530 0629 [email protected]
Consumer/Industrials
Gabriela Burdach + 48 22 222 1545 [email protected]
Real Estate
Jakub Caithaml +420 222 096 481 jakub.caithaml @wood.com
Consumer/Industrials
Maciej Wardejn +48 22 222 1546
Poland
Pawel Wieprzowski +48 22 222 1549
Poland
Piotr Raciborski +48 22 222 1551
Ondrej Slama +420 222 096 484 [email protected]
Jakub Mician +420 222 096 320
Sales Head of Sales
Kristen Andrasko +420 222 096 253 [email protected]
Jan Koch +48 22 222 1616 [email protected]
Piotr Kopec +48 22 222 1615 [email protected]
Ioana Pop +44 20 3530 0693 [email protected]
Vinay Ruparelia +44 20 3530 0624 [email protected]
Grzegorz Skowronski +48 22 222 1559 [email protected]
Jan Thomson
+420 222 096 841
Jarek Tomczynski +44 203 530 0688 [email protected]
Kostas Tsigkourakos +30 694 082 5810 [email protected]
Markus Ulreich +421 2 3240 9046
Tatiana Sarandinaki Enclave Capital in association with WOOD & Company +1 646 454 8657 [email protected]
Sales Trading and Execution Services
Ashley Keep +44 20 3530 0683 [email protected]
Jennifer Ewing +44 20 3530 0692 [email protected]
Jan Jandak +420 222 096 363 [email protected]
Zuzana Mora +420 222 096 283 [email protected]
Ermir Shkurti +420 222 096 847 [email protected]
Martin Stuchlik +420 222 096 855 [email protected]
Vladimir Vavra +420 222 096 397 [email protected]
RECENTLY PUBLISHED REPORTS Date Company/Sector Title Analyst
02/03/17 Raiffeisen Bank International A new beginning Jerzy Kosinski
22/02/17 Fondul Proprietatea Re-energised Lucian Albulescu, Jonathan Lamb
17/02/17 Kruk All debt is good debt Jerzy Kosinski
14/02/17 Halkbank Time for a breather, full valuation Can Demir
14/02/17 Stock Spirits Group Vodka, but no juice Jakub Mician, Lukasz Wachelko
13/02/17 OTE Still waiting for a certain something Bram Buring, Piotr Raciborski
10/02/17 Polish Oil and Gas Twins peaked Jonathan Lamb, Ondrej Slama
10/02/17 Enka Insaat Staying on board Oytun Altasli, Ondrej Slama
08/02/17 Conpet Budget points to stable earnings Lucian Albulescu, Jonathan Lamb
07/02/17 MedLife A healthy play on the Romanian consumer Bram Buring, Lucian Albulescu
Although the information contained in this report comes from sources Wood & Company believes to be reliable, we do not guarantee its accuracy, and such information may be incomplete or condensed. All opinions and estimates included in this report constitute our judgment as of this date and are subject to change without notice. This report is for information purposes only and is not intended as an offer or solicitation with respect to the purchase or sale of any security.