energy saving potentials of integrating personal thermal
TRANSCRIPT
1
Energy Saving Potentials of Integrating Personal Thermal Comfort Models for
Control of Building Systems
Wooyoung Jung1, Farrokh Jazizadeh2*
1Graduate Research Assistant, Department of Civil and Environmental Engineering, Virginia Tech, 315B
Patton Hall, 750 Drillfield, Blacksburg, VA, 24061; email: [email protected]
2Assistant professor, Department of Civil and Environmental Engineering, Virginia Tech, 200 Patton
Hall, 750 Drillfield, Blacksburg, VA, 24061; email: [email protected]
*Corresponding author
Graphical Abstract
Abstract
Research studies provided evidence on the energy efficiency of integrating personal thermal comfort
profiles into the control loop of Heating, Ventilation, and Air-Conditioning (HVAC) systems (i.e., comfort-
driven control). However, some conflicting cases with increased energy consumption were also reported.
Addressing the limited and focused nature of those demonstrations, in this study, we have presented a
comprehensive assessment of the energy efficiency implications of comfort-driven control to (i) understand
the impact of a wide range of contextual factors and their combinatorial effect and (ii) identify the
operational conditions that benefit from personal comfort integration. In doing so, we have proposed an
agent-based modeling framework, coupled with EnergyPlus simulations. We considered five potentially
influential parameters and their combinatorial arrangements including occupants’ thermal comfort
characteristics, diverse multioccupancy scenarios, number of occupants in thermal zones, control strategies,
and climate. We identified the most influencing factor to be the variations across occupants’ thermal
comfort characteristics - reflected in probabilistic models of personal thermal comfort - followed by the
number of occupants that share a thermal zone, and the control strategy in driving the collective setpoint in
a zone. In thermal zones, shared by fewer than six occupants, we observed high potentials for energy
efficiency gain (between 11% to 21% maximum gain) from comfort-driven control. Accounting for a wide
range of personal comfort profiles, we have also demonstrated probabilistic bounds of energy saving
potentials from comfort-driven control with a mean of 70-80% chance of energy saving in multioccupancy
scenarios in a building with multiple thermal zones.
Keywords: HVAC; Personal Thermal Comfort; Thermal Comfort Models; Human-in-the-loop; Energy
Efficiency; Thermal Comfort Sensitivity; Multioccupancy
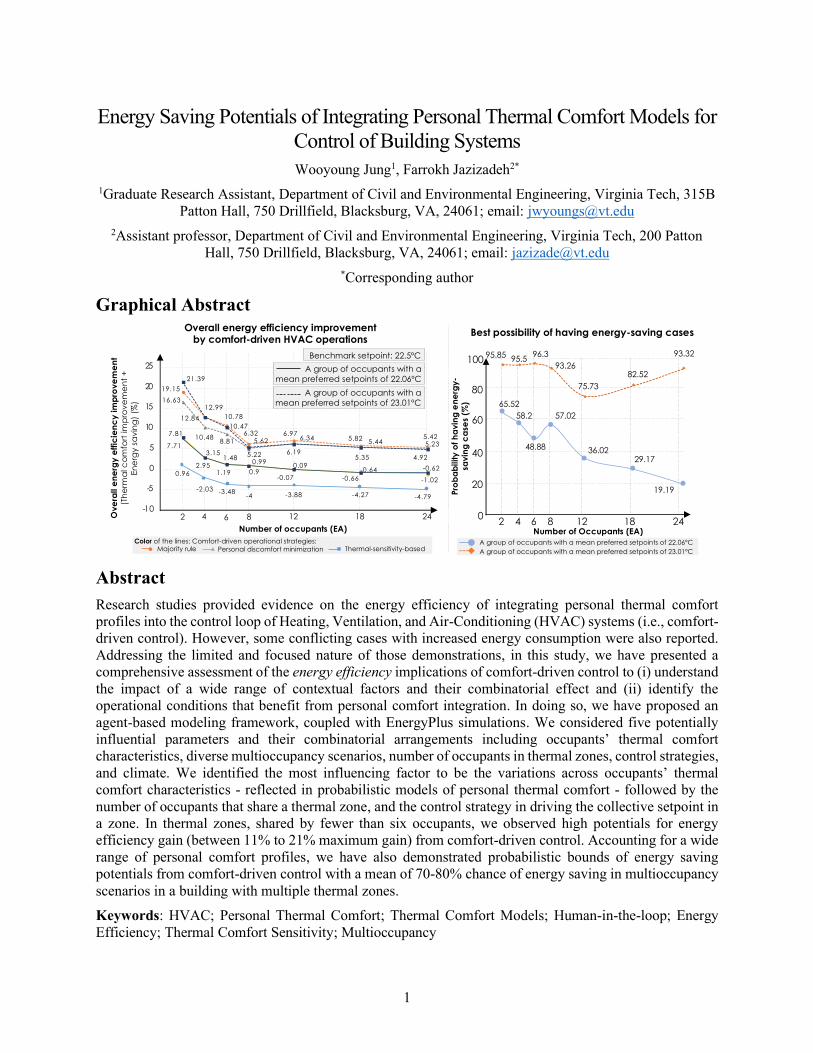
Majority rule Personal discomfort minimization Thermal-sensitivity-basedColor of the lines: Comfort-driven operational strategies:
Overall energy efficiency improvement by comfort-driven HVAC operations
Best possibility of having energy-saving cases
65.52
58.2
48.88
57.02
36.0229.17
19.19
95.8595.5
96.3
93.26
75.73
82.52
93.32
0
20
40
60
80
100
2 4 6 8 12 18 24
100
80
60
40
20
0
Pro
ba
bility
of h
avin
g e
ne
rgy-
savin
g c
ase
s (%
)
Number of Occupants (EA)
A group of occupants with a mean preferred setpoints of 23.01ºC
Number of occupants (EA)
Ove
rall e
ne
rgy
eff
icie
nc
y im
pro
ve
me
nt
(Th
erm
al c
om
fort
imp
rov
em
en
t +
En
erg
y s
av
ing
) (%
)
A group of occupants with a mean preferred setpoints of 22.06ºC
19.15
12.99
10.78
6.32 6.975.82 5.42
16.63
10.488.81
5.22 6.19
5.44 5.23
21.39
12.84
10.47
5.62 6.34
5.35 4.92
7.81
2.951.19 0.9
0.09-0.64
-1.020.96
-2.03 -3.48-4 -3.88 -4.27 -4.79
7.713.15
1.480.99
-0.07 -0.66
-0.62
-10
-5
0
5
10
15
20
25
Benchmark setpoint: 22.5ºC
A group of occupants with a
mean preferred setpoints of 22.06ºC
A group of occupants with a
mean preferred setpoints of 23.01ºC
2 186 124 8 24
2
1. Introduction
Comfort-driven control of Heating, Ventilation, and Air-Conditioning (HVAC) systems, which accounts
for feedback from personal thermal comfort models or profiles in the control loop, has gained attention as
one of the advanced control techniques for higher energy efficiency. Through our exhaustive literature
synthesis study [1], we have observed that across the studies that demonstrated the effectiveness of comfort-
driven HVAC control, a median value of 20% of energy saving potentials have been reported. Since such
outcomes came along with, at least, maintaining the level of user comfort, energy efficiency of HVAC
systems has been improved by providing comfort with minimum energy use. When it comes to energy use,
shifting a temperature setpoint (hereinafter a setpoint) according to users’ preferences does not guarantee
energy saving, and the energy efficiency outcome could be affected by several contextual factors. We have
further observed that in theses analyses, studies have investigated the impact of different potentially
influential factors, such as individual thermal comfort characteristics, the number of occupants in a thermal
zone, the configuration of thermal zones, the control strategy, and climate. Although previous studies have
investigated energy efficiency, these studies have commonly focused on control framework development
and looked at limited number of factors and contextual conditions. Therefore, a comprehensive
understanding of the effect and potentials of comfort-driven control has not been presented in prior studies
to provide an insight on its efficacy under different contextual circumstances.
Although studies have demonstrated energy use reduction, in certain cases, reported in the literature, the
use of comfort-driven HVAC control have brought about increases in energy consumption. [2], through a
field study of single-occupancy spaces, observed an increase in energy consumption for a subspace by using
a comfort-driven control strategy. This was associated with the occupants’ thermal preferences that required
additional conditioning load, compared to the use of conventional setpoint. Another similar example can
be found in the study by [3], which evaluated the energy implication of the comfort-driven HVAC operation
in multiple climate zones at different building scales through simulation. They have shown different levels
of energy savings – an average of 2.1% of energy reduction compared to a fixed building level setpoint of
22.5 °C and 6.1% of energy increase compared to the Department of Energy (DOE) reference setpoint of
24.0 °C. Furthermore, as observed in our literature assessment [1], majority of the studies on comfort-driven
HVAC control have considered the warm Mediterranean climate, where cooling is the dominant
conditioning mode for most of the year. In other words, due to the prevalence of overcooling in this climate,
energy saving could potentially be seen when applying comfort-driven HVAC control. Therefore,
understanding the impact of diversity in personal thermal comfort profiles is critical in identifying the
energy efficiency bounds of comfort-driven control.
In addition, the selection of a specific comfort-driven HVAC control strategy (i.e., the method for
integrating personal thermal comfort models into the control loop) can play a part in the observed
performance of the HVAC systems. As noted, different studies have proposed different methods for
combining the personal comfort feedbacks into a collective control signal. [4] showed that personal comfort
deviation minimization could result in improved energy efficiency and [5] further demonstrated that
additional energy saving could be achieved by also accounting for energy use aspect in a multi-objective
optimization process. However, in the latter study, they have shown increased energy use by 7.3% in one
the thermal zone (due to occupants’ preferences), while the other zones had additional reduction in energy
use by -18.8% and -32.3%. In other words, studies have shown that the implementation of different comfort-
driven control strategies could lead to diverse results based on contextual conditions. Different studies have
proposed a diverse set of comfort-driven control strategies including accounting for majority vote [6],
discomfort minimization [4], multi-objective optimization of energy and comfort [5], and personal thermal
comfort sensitivity [7, 8]. These strategies could result in different outcomes in terms of energy use and
comfort satisfaction depending on the contextual conditions.
Moreover, the impact of thermal zone scale on comfort-driven HVAC control is a less explored factor.
When it comes to occupancy-driven HVAC control, another major modality of Human-In-The-Loop
(HITL) HVAC control [1], studies have demonstrated the usefulness of having multiple thermal zones,
3
rather than a single thermal zone, to adapt to the sporadic dynamics of occupancy [9, 10]. However,
according to our extensive literature analyses [1], the impact of occupancy density in thermal zones and the
resolution of thermal zones (i.e., the number of thermal zones in a building) on the efficiency of comfort-
driven control strategies has been rarely investigated.
Accordingly, in spite of the valuable demonstrations of potentials in comfort-driven HVAC control,
understanding the energy use implications of comfort-driven HVAC control strategies calls for further
investigations. Therefore, we have explored the impact of the aforementioned factors in driving the range
of energy efficiency of comfort-driven HVAC control. As noted, energy efficiency refers to the effective
(i.e., optimum) use of energy consumption for achieving thermal comfort satisfaction. In doing so, different
combinations of these factors have been accounted for in this study to provide a comprehensive assessment
on their impacts. Also, energy implications of an control strategy that we introduced in our previous studies
[7, 8, 11] has not been explored. This approach enhances the collective thermal comfort in a multi-
occupancy thermal zone by leveraging thermal comfort sensitivity (i.e., individual responses to temperature
variations) compared to the strategies that focus only on occupants’ preferred temperatures.
Therefore, through this study, the following research questions have been explored:
• What is the impact of occupant diversity, building, and climate features on the energy use of
comfort-driven HVAC control?
• What is the impact of comfort-driven control strategies on energy efficiency?
• What is the probability of energy saving given the diversity in personal comfort preferences?
• Under what contextual conditions, the use of personal comfort profiles shows higher efficacy?
The first question aimed to investigate the impact of (1) occupants’ thermal-comfort-related features, (2)
number of occupants in thermal zones, (3) number of thermal zones in a building, (4) comfort-driven control
strategy and (5) climate. The second question was investigated to provide insight into the pros and cons of
each comfort-driven control strategy from different perspectives of energy efficiency. The third question
seeks to identify the energy efficient circumstances given the uncertainty of diverse thermal comfort
preferences. Lastly, through the investigations of the first three questions, the fourth question gets answered.
The rest of this paper is structured as follows. Section 2 discusses the research background on advances of
comfort-driven HVAC control for energy efficiency enhancement. Section 3 explains the methodology of
the study. Specifically, we have elaborated on the Agent-Based Model (ABM) that replicates the
mechanism of comfort-driven HVAC control and its use, coupled with an EnergyPlus prototype of an office
model developed by Pacific Northwest National Laboratory (PNNL). Section 4 explains the results and
findings of the study. Section 5 presents the limitations of this study to provide the ground for further
discussions and research. Lastly in Section 6, the conclusion and future directions of this study are provided.
2. Comfort-driven HVAC Operation Paradigm
In conventional control of HVAC systems, thermostats play a central role in acquiring occupants’ feedback
in the control logic of HVAC systems. However, their unsuitable locations and unclear authority over the
devices often impede Human-Building Interaction (HBI) [12, 13]. These circumstances lead to
underwhelming performance of indoor conditioning systems despite their significant role in the total energy
consumption of building systems and occupants’ thermal comfort [14]. Several studies have shown that the
office occupants, who often face these limitations [12, 13], reported lower thermal satisfaction, compared
to the residential occupants [13, 15]. Therefore, research efforts sought to enable the integration of
contextual thermal comfort information into the control of HVAC systems. Starting from web-based
surveys [16], which are highly accessible to users, studies have proposed different methods from using
mobile devices [17, 18] to physiological sensing [19-21] in order to empower enhanced HBI. These
methods have paved the way for collecting individual users’ feedback on the environment in the form of
thermal perceptions or preferences as opposed to desired temperature values in the legacy system (as
thermostat settings). In this new paradigm, an indoor environment could be evaluated by using the personal
4
thermal comfort models developed by using the thermal votes of individual users and other contextual
environmental and human-related factors (i.e., personalized thermal comfort profiles or models) [22]. These
models could provide information such as the probability distribution of thermal comfort associated with
different contextual conditions.
The availability of users’ thermal comfort feedback and their personalized profiles has enabled the comfort-
driven HVAC control – that is, a system could adjust the indoor conditions based on actual and individual
users’ thermal preferences and sensitivities. Through simulation and field study evaluations, previous
studies have shown the elevated performance of comfort-driven HVAC systems [2, 4, 5, 23, 24]. These
studies have proposed specific strategies and frameworks for integrating the personal comfort models into
the control loops and evaluated their performance. The findings show that such a control paradigm not only
improves users’ comfort, but also prevents over-conditioning beyond their thermal comfort zones.
In the course of implementing this strategy, one of the inevitable questions is which setpoint should be
chosen in multi-occupancy spaces to achieve collectively comfortable environments. The use of thermal
zones (a number of rooms conditioned simultaneously by an HVAC unit) in current buildings reduces the
occupancy density in multi-occupancy spaces. As the number of thermal zones decreases addressing the
conflict between different occupants could be more challenging. As an example, most of residential
buildings are designed as single thermal zones [25]. In these cases, diverse thermal preferences and
responses to ambient temperatures from different occupants could complicate the choice of a setpoint [26].
Accordingly, studies have introduced several strategies to generate collectively comfortable conditions as
follows:
• Majority rule – adjusting a setpoint based on the majority vote [6],
• Error minimization – identifying a setpoint where the total gap (i.e., errors) between setpoints and
desired temperatures is minimized [4, 27],
• Collective learning – updating the PMV model based on collective thermal comfort feedback [23].
• Thermal-comfort-sensitivity-based optimization – benefiting from each user’s thermal sensitivity
in addition to thermal preferences to find an optimal setpoint [8, 11].
These control strategies were shown to have potentials for improving users’ thermal comfort as well as
energy efficiency. In an example study, the majority rule strategy was shown to consume 20% less energy
while maintaining users’ thermal comfort, compared to the conventional default setpoint setting [6]. The
error minimization strategy was shown to result in 39% reduction in average daily air flow (i.e., energy
saving) while keeping the temperature close to users’ thermal preferences [4]. The collective learning
strategy, proposed by [23], not only saved 10.1% of energy but also improved the overall thermal comfort.
However, despite the promising results in these studies, each study has used different benchmarks as well
as different contexts in their studies. Such single demonstrations limit the comprehensive understanding of
the viability of comfort-driven control strategy. Therefore, as noted, an in-depth understanding of the
differences between these strategies calls for further assessment under the same context and circumstances.
In a recent study, [28] have shown the energy implications of a comfort-driven strategy. In this study, the
setpoint selection was carried out by summing all occupants’ thermal comfort profiles in a thermal zone
and selecting the setpoint with the maximum probability, similar to [5]. Nonetheless, the impact of having
diverse number of occupants (with varied preferences) and thermal zones has not been addressed.
Therefore, this study contributes to the understanding of the efficacy of comfort-driven control strategies
by (i) investigating the energy efficiency implications derived from diverse comfort-driven HVAC control
strategies under different contextual conditions as elaborated above, and (ii) quantifying the energy
efficiency bounds given the uncertainty of occupants’ thermal comfort preferences and contextual
conditions.

5
3. Methodology
3.1. Overall framework
The overall framework of this study is presented in Figure 1. In general, the framework is a combination of
(1) an Agent-Based Model (ABM) for interaction of users with the environment and (2) a building energy
use simulation platform (i.e., EnergyPlus [29]). Even though EnergyPlus, developed by the U.S. DOE, is a
powerful tool, it has limited capabilities in accounting for occupant behavioral dynamics and characteristics
[30-33]. Hence, to incorporate individuals’ thermal comfort features and implement comfort-driven HVAC
control according to dynamic thermal comfort demands, we have developed the ABM module in the
framework. This module enables us to reflect the dynamics of occupants and their interactions with the
indoor environment as agents, which have their own objectives, behaviors, and properties. Accordingly,
through the use of ABM, a diverse set of scenarios could be created and tested. The specific application of
the proposed ABM model, in the context of this study, is the identification of setpoints according to personal
thermal comfort models and different comfort-driven control strategies. Then, setpoint information is fed
into the energy simulation environment to assess and quantify the energy implications of HVAC control.
As noted, we have identified different parameters that could potentially affect the energy use of building
systems. Accordingly, the framework, in Figure 1, depicts the components, the required data, and the flow
of the information between different components. In the following subsections, we have described the
specifics of each component and the required data.
Figure 1. Overall simulation framework — coupled ABM and EnergyPlus Models
3.2. Agent-based modeling component
3.2.1. General mechanism
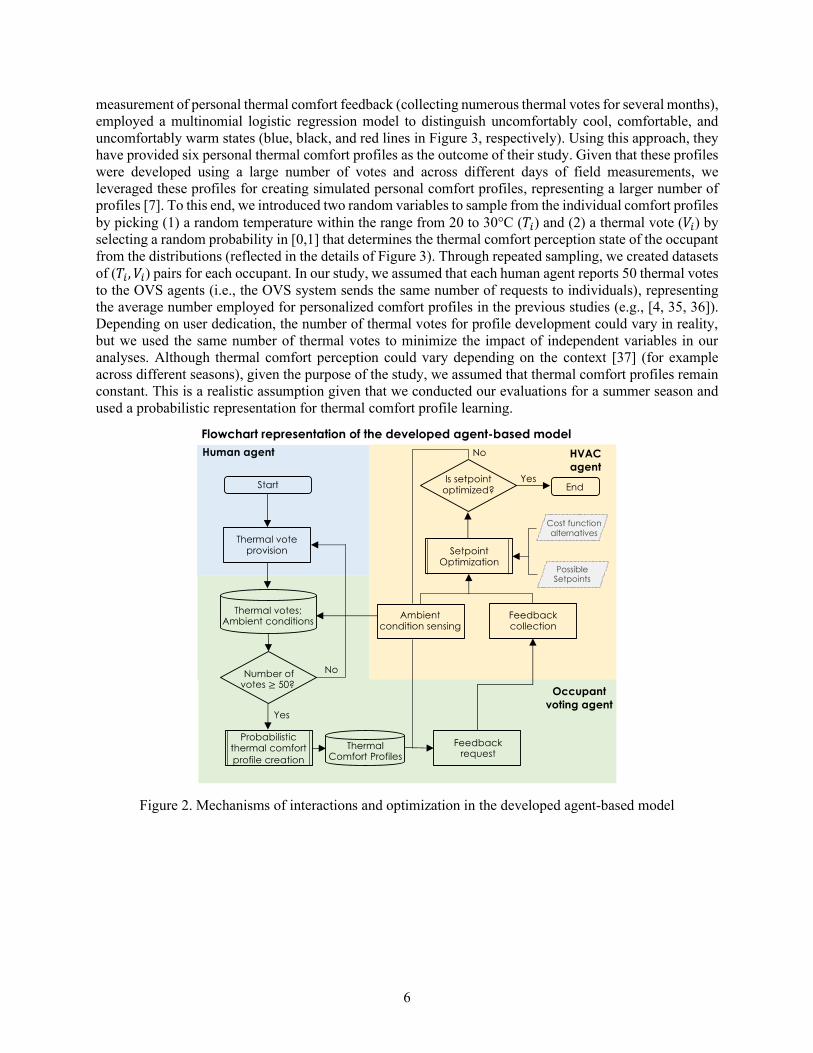
The developed ABM replicates the mechanism of comfort-driven HVAC control as reflected in Figure 2.
This mechanism includes multiple agents, including human, Occupant Voting System (OVS), and HVAC
agents that communicate with each other to seek an optimal setpoint that maximizes human agents’
collective thermal comfort. Specifically, human agents report their perceptions about thermal environments
as thermal votes to OVS agents, and OVS agents generate individual thermal comfort profiles. Then, the
HVAC agent optimizes the setpoint by requesting feedback from OVS agents. The HVAC agent could use
alternative control strategies for setpoint optimization. Each thermal zone has agents that interact to derive
the operational setpoint of that specific zone independent of other zones. Given the simulation nature of our
study, in the ABM simulations, we have assumed that the conditioned air is equally distributed in a space.
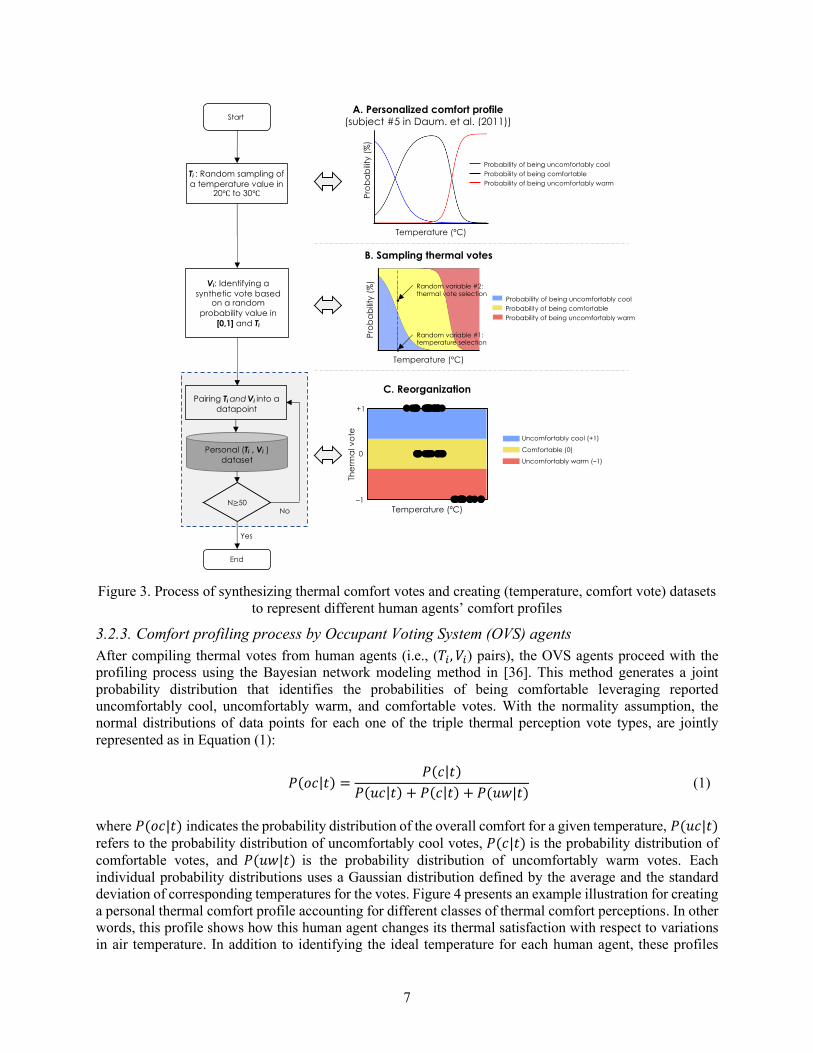
3.2.2. Human agents’ thermal vote creation
To understand the impact of the diversity in individual preferences and the corresponding uncertainty in
driving the energy use, we have created diverse sets of thermal comfort profiles (representing human
agents) to be leveraged in various scenarios of multioccupancy. To this end, we have leveraged actual
thermal comfort profiles reported by [34] and developed a data-driven process of thermal comfort profiling.
This process is composed of three steps as reflected in Figure 3. [34], upon a comprehensive field
Temperature
Setpoint (! ") for thermal zone(s)
Overall framework
Personal thermal
comfort model #1
Personal thermal
comfort model #k
…
Comfort-driven HVAC
operational strategy
ABM
Agent-based Model Environment Energy Simulation Environment
Building
Characteristics
Energy Simulation
Building
Geometry and
metadata
Climate and
weather information
6
measurement of personal thermal comfort feedback (collecting numerous thermal votes for several months),
employed a multinomial logistic regression model to distinguish uncomfortably cool, comfortable, and
uncomfortably warm states (blue, black, and red lines in Figure 3, respectively). Using this approach, they
have provided six personal thermal comfort profiles as the outcome of their study. Given that these profiles
were developed using a large number of votes and across different days of field measurements, we
leveraged these profiles for creating simulated personal comfort profiles, representing a larger number of
profiles [7]. To this end, we introduced two random variables to sample from the individual comfort profiles
by picking (1) a random temperature within the range from 20 to 30°C (𝑇𝑖) and (2) a thermal vote (𝑉𝑖) by
selecting a random probability in [0,1] that determines the thermal comfort perception state of the occupant
from the distributions (reflected in the details of Figure 3). Through repeated sampling, we created datasets
of (𝑇𝑖, 𝑉𝑖) pairs for each occupant. In our study, we assumed that each human agent reports 50 thermal votes
to the OVS agents (i.e., the OVS system sends the same number of requests to individuals), representing
the average number employed for personalized comfort profiles in the previous studies (e.g., [4, 35, 36]).
Depending on user dedication, the number of thermal votes for profile development could vary in reality,
but we used the same number of thermal votes to minimize the impact of independent variables in our
analyses. Although thermal comfort perception could vary depending on the context [37] (for example
across different seasons), given the purpose of the study, we assumed that thermal comfort profiles remain
constant. This is a realistic assumption given that we conducted our evaluations for a summer season and
used a probabilistic representation for thermal comfort profile learning.
Figure 2. Mechanisms of interactions and optimization in the developed agent-based model
7
Figure 3. Process of synthesizing thermal comfort votes and creating (temperature, comfort vote) datasets
to represent different human agents’ comfort profiles
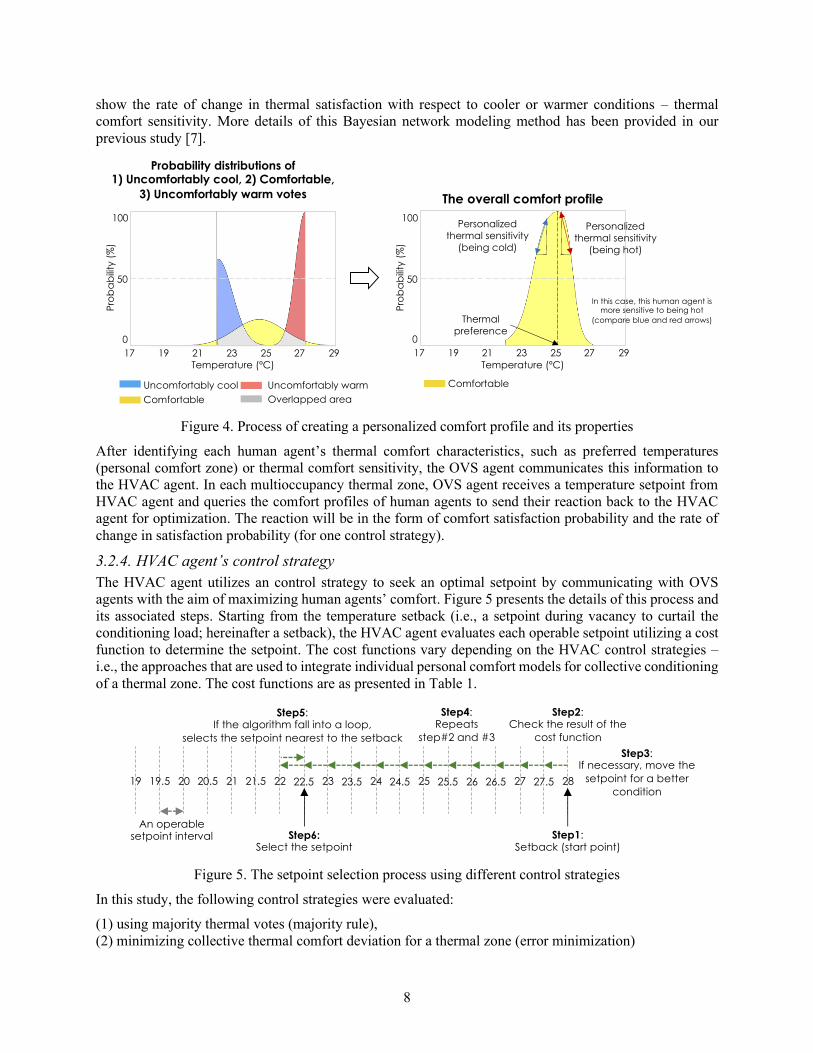
3.2.3. Comfort profiling process by Occupant Voting System (OVS) agents
After compiling thermal votes from human agents (i.e., (𝑇𝑖, 𝑉𝑖) pairs), the OVS agents proceed with the
profiling process using the Bayesian network modeling method in [36]. This method generates a joint
probability distribution that identifies the probabilities of being comfortable leveraging reported
uncomfortably cool, uncomfortably warm, and comfortable votes. With the normality assumption, the
normal distributions of data points for each one of the triple thermal perception vote types, are jointly
represented as in Equation (1):
𝑃(𝑜𝑐|𝑡) =𝑃(𝑐|𝑡)
𝑃(𝑢𝑐|𝑡) + 𝑃(𝑐|𝑡) + 𝑃(𝑢𝑤|𝑡) (1)
where 𝑃(𝑜𝑐|𝑡) indicates the probability distribution of the overall comfort for a given temperature, 𝑃(𝑢𝑐|𝑡)
refers to the probability distribution of uncomfortably cool votes, 𝑃(𝑐|𝑡) is the probability distribution of
comfortable votes, and 𝑃(𝑢𝑤|𝑡) is the probability distribution of uncomfortably warm votes. Each
individual probability distributions uses a Gaussian distribution defined by the average and the standard
deviation of corresponding temperatures for the votes. Figure 4 presents an example illustration for creating
a personal thermal comfort profile accounting for different classes of thermal comfort perceptions. In other
words, this profile shows how this human agent changes its thermal satisfaction with respect to variations
in air temperature. In addition to identifying the ideal temperature for each human agent, these profiles
8
show the rate of change in thermal satisfaction with respect to cooler or warmer conditions – thermal
comfort sensitivity. More details of this Bayesian network modeling method has been provided in our
previous study [7].
Figure 4. Process of creating a personalized comfort profile and its properties
After identifying each human agent’s thermal comfort characteristics, such as preferred temperatures
(personal comfort zone) or thermal comfort sensitivity, the OVS agent communicates this information to
the HVAC agent. In each multioccupancy thermal zone, OVS agent receives a temperature setpoint from
HVAC agent and queries the comfort profiles of human agents to send their reaction back to the HVAC
agent for optimization. The reaction will be in the form of comfort satisfaction probability and the rate of
change in satisfaction probability (for one control strategy).
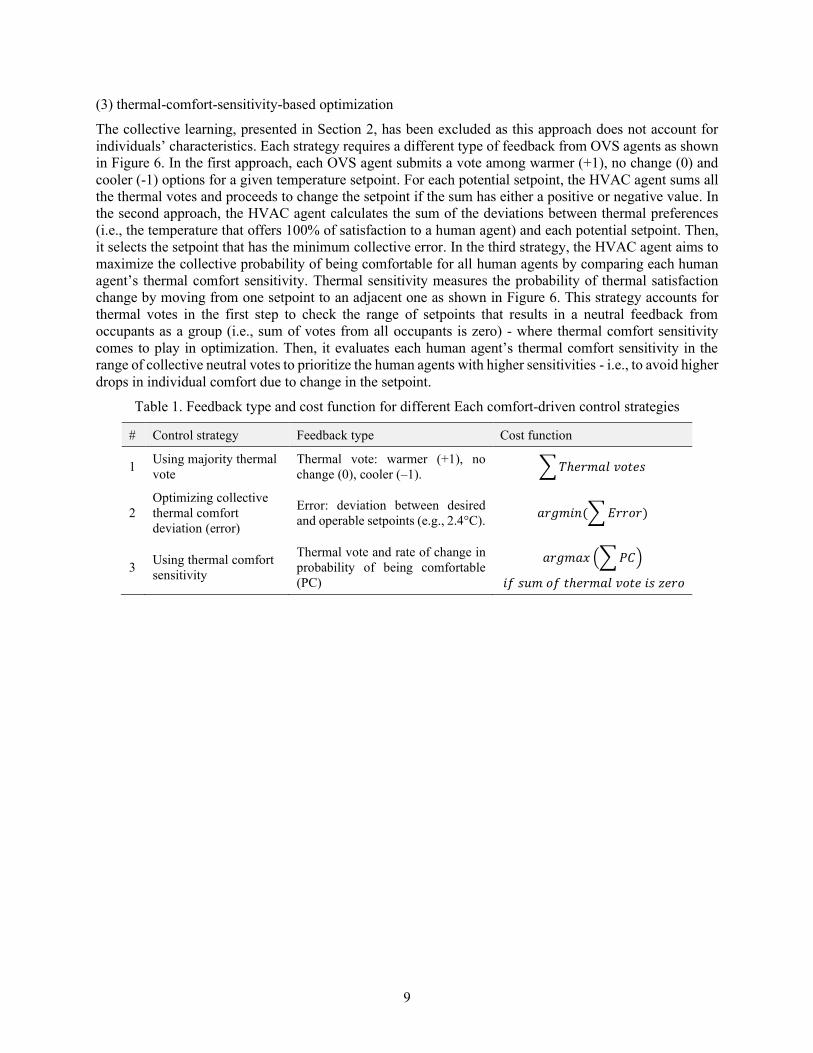
3.2.4. HVAC agent’s control strategy
The HVAC agent utilizes an control strategy to seek an optimal setpoint by communicating with OVS
agents with the aim of maximizing human agents’ comfort. Figure 5 presents the details of this process and
its associated steps. Starting from the temperature setback (i.e., a setpoint during vacancy to curtail the
conditioning load; hereinafter a setback), the HVAC agent evaluates each operable setpoint utilizing a cost
function to determine the setpoint. The cost functions vary depending on the HVAC control strategies –
i.e., the approaches that are used to integrate individual personal comfort models for collective conditioning
of a thermal zone. The cost functions are as presented in Table 1.
Figure 5. The setpoint selection process using different control strategies
In this study, the following control strategies were evaluated:
(1) using majority thermal votes (majority rule),
(2) minimizing collective thermal comfort deviation for a thermal zone (error minimization)
Pro
ba
bili
ty (
%)
17 292725232119
Temperature (ºC)
100
0
50
Comfortable
Personalized
thermal sensitivity
(being cold)
The overall comfort profile
Thermal
preference
Probability distributions of 1) Uncomfortably cool, 2) Comfortable,
3) Uncomfortably warm votes
Pro
ba
bili
ty (
%)
17 292725232119
Temperature (ºC)
100
0
50
Uncomfortably cool
Comfortable
Uncomfortably warm
Overlapped area
Personalized
thermal sensitivity
(being hot)
In this case, this human agent is more sensitive to being hot
(compare blue and red arrows)
22 25 2819 20 21 23 24 26 2719.5 20.5 21.5 22.5 23.5 24.5 25.5 26.5 27.5
Step1:Setback (start point)
Step2: Check the result of the
cost function
Step3: If necessary, move the
setpoint for a better
condition
An operable setpoint interval
Step4:Repeats
step#2 and #3
Step5:If the algorithm fall into a loop,
selects the setpoint nearest to the setback
Step6:Select the setpoint
9
(3) thermal-comfort-sensitivity-based optimization
The collective learning, presented in Section 2, has been excluded as this approach does not account for
individuals’ characteristics. Each strategy requires a different type of feedback from OVS agents as shown
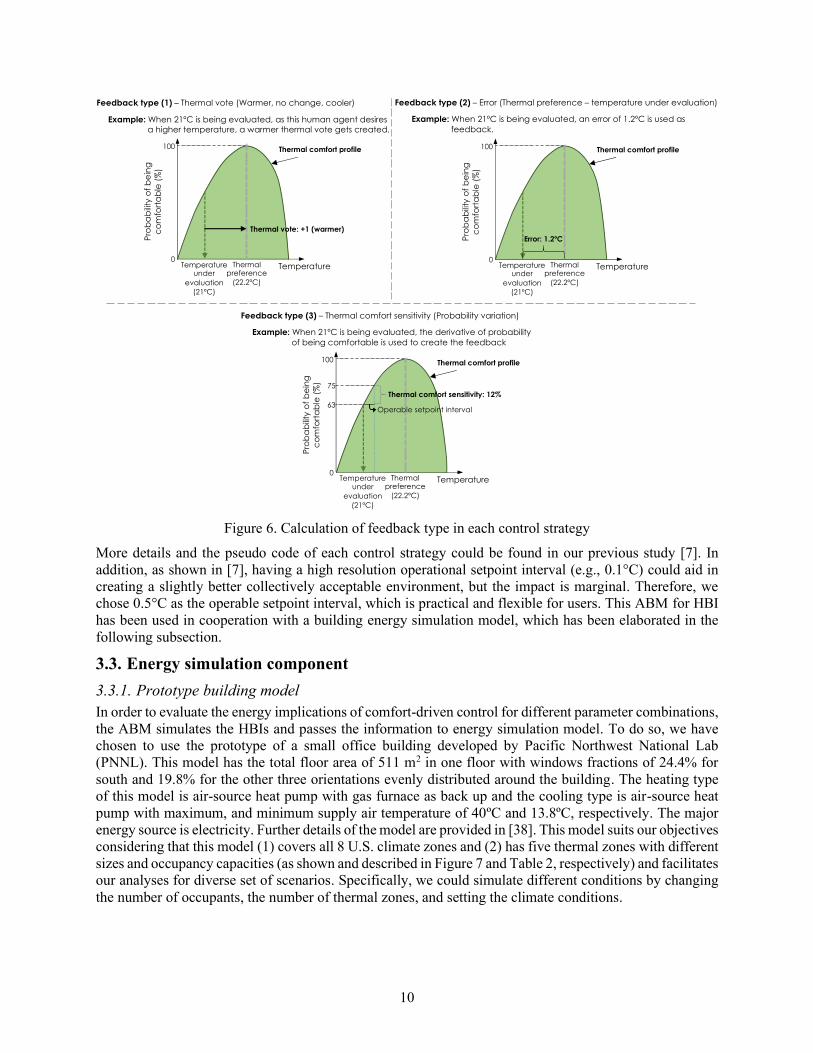
in Figure 6. In the first approach, each OVS agent submits a vote among warmer (+1), no change (0) and
cooler (-1) options for a given temperature setpoint. For each potential setpoint, the HVAC agent sums all
the thermal votes and proceeds to change the setpoint if the sum has either a positive or negative value. In
the second approach, the HVAC agent calculates the sum of the deviations between thermal preferences
(i.e., the temperature that offers 100% of satisfaction to a human agent) and each potential setpoint. Then,
it selects the setpoint that has the minimum collective error. In the third strategy, the HVAC agent aims to
maximize the collective probability of being comfortable for all human agents by comparing each human
agent’s thermal comfort sensitivity. Thermal sensitivity measures the probability of thermal satisfaction
change by moving from one setpoint to an adjacent one as shown in Figure 6. This strategy accounts for
thermal votes in the first step to check the range of setpoints that results in a neutral feedback from
occupants as a group (i.e., sum of votes from all occupants is zero) - where thermal comfort sensitivity
comes to play in optimization. Then, it evaluates each human agent’s thermal comfort sensitivity in the
range of collective neutral votes to prioritize the human agents with higher sensitivities - i.e., to avoid higher
drops in individual comfort due to change in the setpoint.
Table 1. Feedback type and cost function for different Each comfort-driven control strategies
# Control strategy Feedback type Cost function
1 Using majority thermal
vote
Thermal vote: warmer (+1), no
change (0), cooler (–1). ∑ 𝑇ℎ𝑒𝑟𝑚𝑎𝑙 𝑣𝑜𝑡𝑒𝑠
2
Optimizing collective
thermal comfort
deviation (error)
Error: deviation between desired
and operable setpoints (e.g., 2.4°C). 𝑎𝑟𝑔𝑚𝑖𝑛(∑ 𝐸𝑟𝑟𝑜𝑟)
3 Using thermal comfort
sensitivity
Thermal vote and rate of change in
probability of being comfortable
(PC)
𝑎𝑟𝑔𝑚𝑎𝑥 (∑ 𝑃𝐶)
𝑖𝑓 𝑠𝑢𝑚 𝑜𝑓 𝑡ℎ𝑒𝑟𝑚𝑎𝑙 𝑣𝑜𝑡𝑒 𝑖𝑠 𝑧𝑒𝑟𝑜
10
Figure 6. Calculation of feedback type in each control strategy
More details and the pseudo code of each control strategy could be found in our previous study [7]. In
addition, as shown in [7], having a high resolution operational setpoint interval (e.g., 0.1°C) could aid in
creating a slightly better collectively acceptable environment, but the impact is marginal. Therefore, we
chose 0.5°C as the operable setpoint interval, which is practical and flexible for users. This ABM for HBI
has been used in cooperation with a building energy simulation model, which has been elaborated in the
following subsection.
3.3. Energy simulation component
3.3.1. Prototype building model
In order to evaluate the energy implications of comfort-driven control for different parameter combinations,
the ABM simulates the HBIs and passes the information to energy simulation model. To do so, we have
chosen to use the prototype of a small office building developed by Pacific Northwest National Lab
(PNNL). This model has the total floor area of 511 m2 in one floor with windows fractions of 24.4% for
south and 19.8% for the other three orientations evenly distributed around the building. The heating type
of this model is air-source heat pump with gas furnace as back up and the cooling type is air-source heat
pump with maximum, and minimum supply air temperature of 40ºC and 13.8ºC, respectively. The major
energy source is electricity. Further details of the model are provided in [38]. This model suits our objectives
considering that this model (1) covers all 8 U.S. climate zones and (2) has five thermal zones with different
sizes and occupancy capacities (as shown and described in Figure 7 and Table 2, respectively) and facilitates
our analyses for diverse set of scenarios. Specifically, we could simulate different conditions by changing
the number of occupants, the number of thermal zones, and setting the climate conditions.
Temperature
Pro
ba
bili
ty o
f b
ein
g
co
mfo
rta
ble
(%
)
100
0
Thermal comfort profile
Thermal preference
(22.2ºC)
Feedback type (1) – Thermal vote (Warmer, no change, cooler)
Temperature under
evaluation
(21ºC)
Thermal vote: +1 (warmer)
Example: When 21ºC is being evaluated, as this human agent desires
a higher temperature, a warmer thermal vote gets created.
Feedback type (2) – Error (Thermal preference – temperature under evaluation)
Example: When 21ºC is being evaluated, an error of 1.2ºC is used as
feedback.
Temperature
Pro
ba
bili
ty o
f b
ein
g
co
mfo
rta
ble
(%
)
100
0
Thermal comfort profile
Thermal preference
(22.2ºC)
Temperature under
evaluation
(21ºC)
Error: 1.2ºC
Feedback type (3) – Thermal comfort sensitivity (Probability variation)
Example: When 21ºC is being evaluated, the derivative of probability
of being comfortable is used to create the feedback
Temperature
Pro
ba
bili
ty o
f b
ein
g
co
mfo
rta
ble
(%
)
100
0
Thermal comfort profile
Thermal preference
(22.2ºC)
Temperature under
evaluation
(21ºC)
Operable setpoint interval
75
63
Thermal comfort sensitivity: 12%

11
Table 2. Details of thermal zones in the office building model for our study taken from [38]
Thermal zone name Area (m2) Volume (m3) Occupancy capacity
Core 150 457 9
Perimeter top 113 346 7
Perimeter bottom 113 346 7
Perimeter left 67 205 4
Perimeter right 67 205 4
Total 510 1559 31
Figure 7. Schematics of prototype small office building, developed by PNNL for EnergyPlus simulation
[38]
3.3.2. Control and experimental scenarios
We considered different values for each one of the aforementioned parameters. Furthermore, a number of
parameters in the analyses were set to be the same (i.e., default parameters) across all the scenarios to
facilitate the interpretation of the results and focus on the parameters of the study. The adopted parameters
for different scenarios and the method for their calculations are as elaborated below.
Default parameters: Table 3 shows the default parameters used in this study. For the period of analyses,
the summer season has been chosen. Although the data used for creating the personal thermal comfort
models were collected through a longitudinal survey over three years [34], with the assumption that thermal
comfort profiles might not vary significantly in a season, we chose the summer season. The setback was set
to be at 29.44°C (i.e., 85°F), which was the initial temperature in the EnergyPlus model by PNNL.
Moreover, a uniform occupancy profile was considered for the environment – full occupancy from 9:00 am
to 6:00 pm during weekdays and vacancy during weekends.
Table 3. Default constant parameters and their values in energy simulation
Parameter Value
Period of simulation Summer (June to August)
Occupancy profile 100% from 9:00 am to 6:00 pm during weekdays
Temperature setback 29.44°C (85°F)
Thermal comfort profiles: As indicated in Table 2, given the full capacity of the prototype building, we
generated sets of 31 human agents with different thermal behaviors using our proposed ABM simulation
OVS agent component. With the aim of addressing the impact of having diverse groups of occupants with
different thermal comfort characteristics in a building, we have chosen two sets of 31 human agents with
distinguishable patterns for our analyses. These two sets represent cases in which most of the occupants in
a building prefer a warmer environment or a cooler environment. These representative occupant profiles
help us consider the impact of a wide range of occupant diversity in assessing the uncertainty of energy
efficiency potentials. More details on this process is presented in Section 4.
Building shape
Core thermal zone
Perimeter top thermal zone
Perimeter bottom thermal zone
Pe
rim
ete
r le
ft
the
rma
l zo
ne
Pe
rime
ter rig
ht
the
rma
l zon
e
Thermal zone
12
Climate conditions: In order to account for the impact of varied climate conditions, three locations, with
moderate climates, were selected given their different temperature characteristics as shown in Table 4. We
excluded locations with extreme climates.
Table 4. Climate zone type, location, and characteristics used for simulations Zone type Location Characteristics
2B Tucson, Arizona Hot and dry
4B Albuquerque, New Mexico Mixed and dry
6B Great Falls, Montana Cold and dry
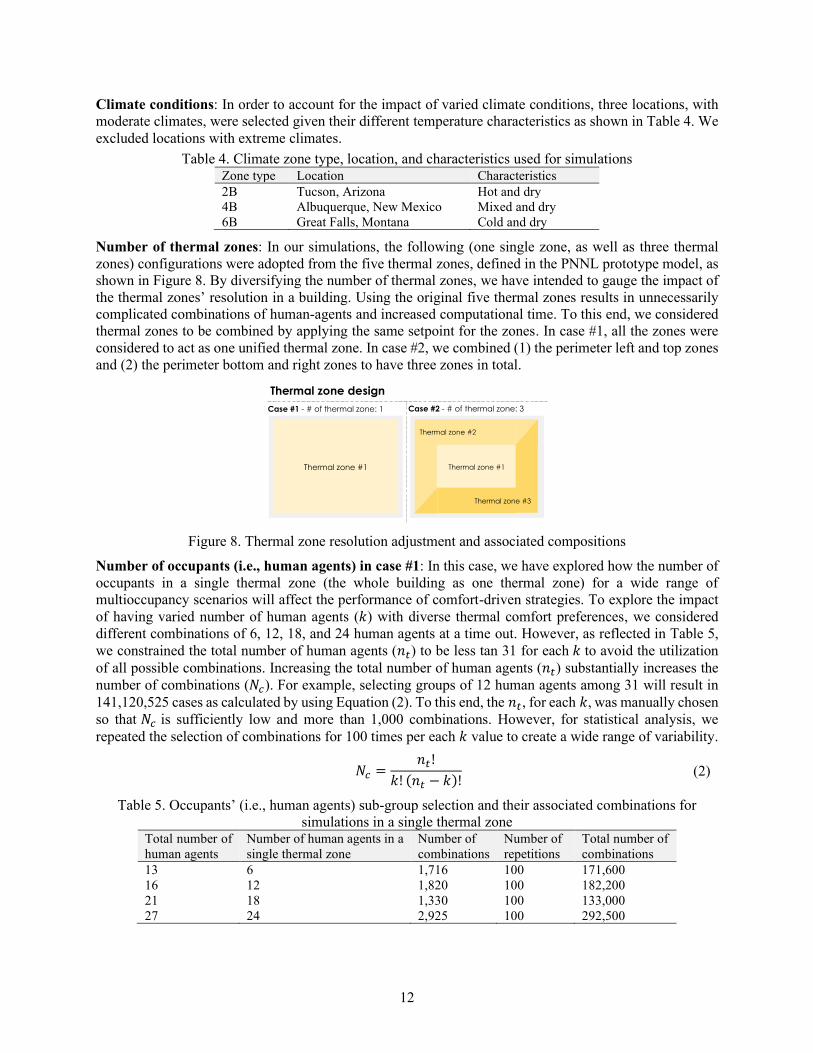
Number of thermal zones: In our simulations, the following (one single zone, as well as three thermal
zones) configurations were adopted from the five thermal zones, defined in the PNNL prototype model, as
shown in Figure 8. By diversifying the number of thermal zones, we have intended to gauge the impact of
the thermal zones’ resolution in a building. Using the original five thermal zones results in unnecessarily
complicated combinations of human-agents and increased computational time. To this end, we considered
thermal zones to be combined by applying the same setpoint for the zones. In case #1, all the zones were
considered to act as one unified thermal zone. In case #2, we combined (1) the perimeter left and top zones
and (2) the perimeter bottom and right zones to have three zones in total.
Figure 8. Thermal zone resolution adjustment and associated compositions
Number of occupants (i.e., human agents) in case #1: In this case, we have explored how the number of
occupants in a single thermal zone (the whole building as one thermal zone) for a wide range of
multioccupancy scenarios will affect the performance of comfort-driven strategies. To explore the impact
of having varied number of human agents (𝑘) with diverse thermal comfort preferences, we considered
different combinations of 6, 12, 18, and 24 human agents at a time out. However, as reflected in Table 5,
we constrained the total number of human agents (𝑛𝑡) to be less tan 31 for each 𝑘 to avoid the utilization
of all possible combinations. Increasing the total number of human agents (𝑛𝑡) substantially increases the
number of combinations (𝑁𝑐). For example, selecting groups of 12 human agents among 31 will result in
141,120,525 cases as calculated by using Equation (2). To this end, the 𝑛𝑡, for each 𝑘, was manually chosen
so that 𝑁𝑐 is sufficiently low and more than 1,000 combinations. However, for statistical analysis, we
repeated the selection of combinations for 100 times per each 𝑘 value to create a wide range of variability.
𝑁𝑐 =𝑛𝑡!
𝑘! (𝑛𝑡 − 𝑘)! (2)
Table 5. Occupants’ (i.e., human agents) sub-group selection and their associated combinations for
simulations in a single thermal zone Total number of
human agents
Number of human agents in a
single thermal zone
Number of
combinations
Number of
repetitions
Total number of
combinations
13 6 1,716 100 171,600
16 12 1,820 100 182,200
21 18 1,330 100 133,000
27 24 2,925 100 292,500
Thermal zone design
Thermal zone #1 Thermal zone #1
Thermal zone #2
Thermal zone #3
Case #1 - # of thermal zone: 1 Case #2 - # of thermal zone: 3
13
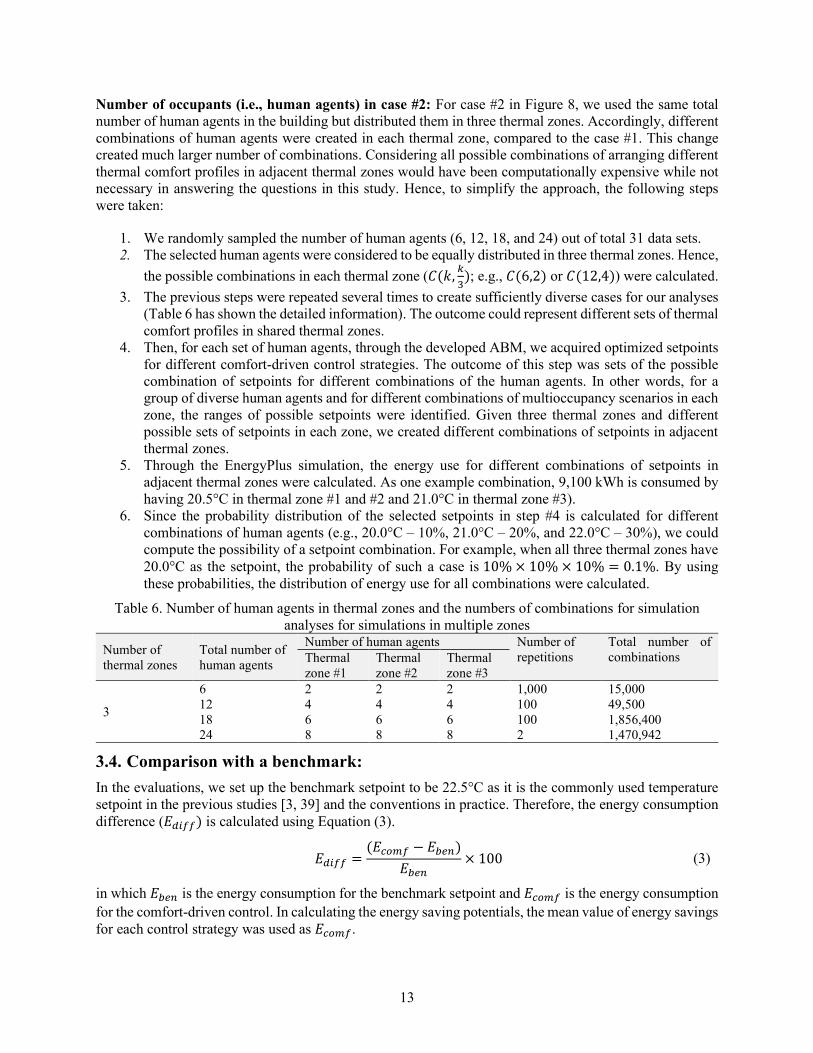
Number of occupants (i.e., human agents) in case #2: For case #2 in Figure 8, we used the same total
number of human agents in the building but distributed them in three thermal zones. Accordingly, different
combinations of human agents were created in each thermal zone, compared to the case #1. This change
created much larger number of combinations. Considering all possible combinations of arranging different
thermal comfort profiles in adjacent thermal zones would have been computationally expensive while not
necessary in answering the questions in this study. Hence, to simplify the approach, the following steps
were taken:
1. We randomly sampled the number of human agents (6, 12, 18, and 24) out of total 31 data sets.
2. The selected human agents were considered to be equally distributed in three thermal zones. Hence,
the possible combinations in each thermal zone (𝐶(𝑘,𝑘
3); e.g., 𝐶(6,2) or 𝐶(12,4)) were calculated.
3. The previous steps were repeated several times to create sufficiently diverse cases for our analyses
(Table 6 has shown the detailed information). The outcome could represent different sets of thermal
comfort profiles in shared thermal zones.
4. Then, for each set of human agents, through the developed ABM, we acquired optimized setpoints
for different comfort-driven control strategies. The outcome of this step was sets of the possible
combination of setpoints for different combinations of the human agents. In other words, for a
group of diverse human agents and for different combinations of multioccupancy scenarios in each
zone, the ranges of possible setpoints were identified. Given three thermal zones and different
possible sets of setpoints in each zone, we created different combinations of setpoints in adjacent
thermal zones.
5. Through the EnergyPlus simulation, the energy use for different combinations of setpoints in
adjacent thermal zones were calculated. As one example combination, 9,100 kWh is consumed by
having 20.5°C in thermal zone #1 and #2 and 21.0°C in thermal zone #3).
6. Since the probability distribution of the selected setpoints in step #4 is calculated for different
combinations of human agents (e.g., 20.0°C – 10%, 21.0°C – 20%, and 22.0°C – 30%), we could
compute the possibility of a setpoint combination. For example, when all three thermal zones have
20.0°C as the setpoint, the probability of such a case is 10% × 10% × 10% = 0.1%. By using
these probabilities, the distribution of energy use for all combinations were calculated.
Table 6. Number of human agents in thermal zones and the numbers of combinations for simulation
analyses for simulations in multiple zones
Number of
thermal zones
Total number of
human agents
Number of human agents Number of
repetitions
Total number of
combinations Thermal
zone #1
Thermal
zone #2
Thermal
zone #3
3
6 2 2 2 1,000 15,000
12 4 4 4 100 49,500
18 6 6 6 100 1,856,400
24 8 8 8 2 1,470,942
3.4. Comparison with a benchmark:
In the evaluations, we set up the benchmark setpoint to be 22.5°C as it is the commonly used temperature
setpoint in the previous studies [3, 39] and the conventions in practice. Therefore, the energy consumption
difference (𝐸𝑑𝑖𝑓𝑓) is calculated using Equation (3).
𝐸𝑑𝑖𝑓𝑓 =(𝐸𝑐𝑜𝑚𝑓 − 𝐸𝑏𝑒𝑛)
𝐸𝑏𝑒𝑛× 100 (3)
in which 𝐸𝑏𝑒𝑛 is the energy consumption for the benchmark setpoint and 𝐸𝑐𝑜𝑚𝑓 is the energy consumption
for the comfort-driven control. In calculating the energy saving potentials, the mean value of energy savings
for each control strategy was used as 𝐸𝑐𝑜𝑚𝑓.
14
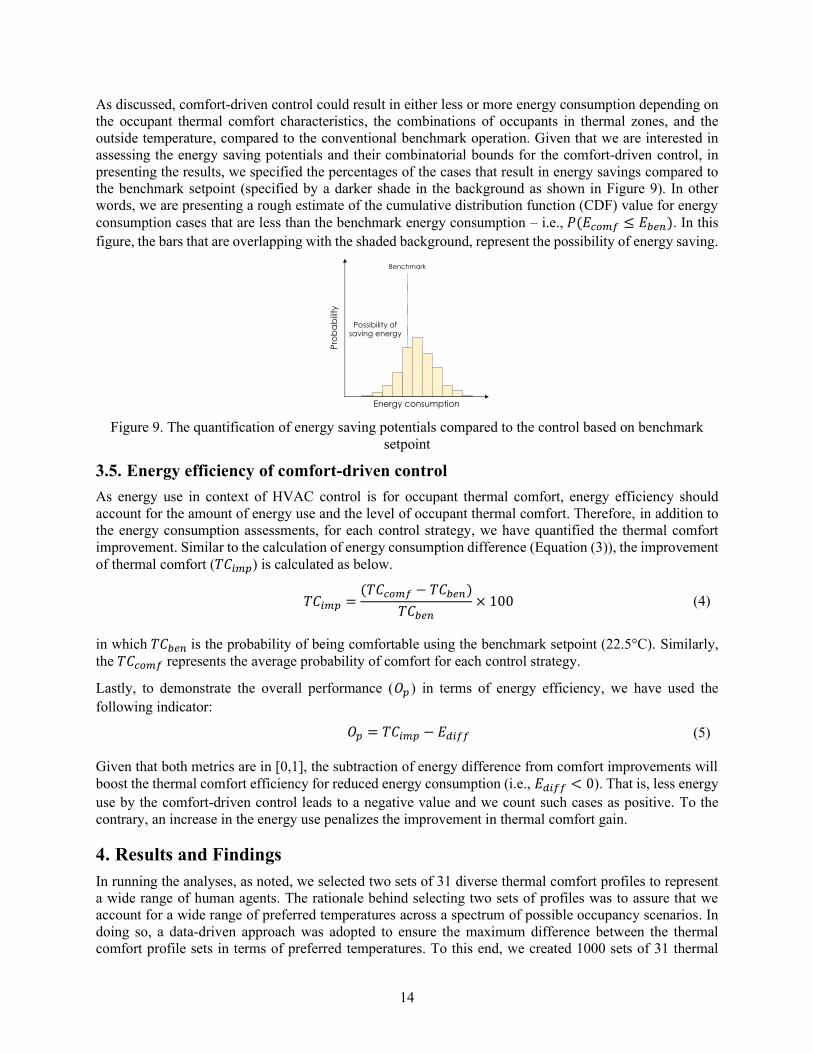
As discussed, comfort-driven control could result in either less or more energy consumption depending on
the occupant thermal comfort characteristics, the combinations of occupants in thermal zones, and the
outside temperature, compared to the conventional benchmark operation. Given that we are interested in
assessing the energy saving potentials and their combinatorial bounds for the comfort-driven control, in
presenting the results, we specified the percentages of the cases that result in energy savings compared to
the benchmark setpoint (specified by a darker shade in the background as shown in Figure 9). In other
words, we are presenting a rough estimate of the cumulative distribution function (CDF) value for energy
consumption cases that are less than the benchmark energy consumption – i.e., 𝑃(𝐸𝑐𝑜𝑚𝑓 ≤ 𝐸𝑏𝑒𝑛). In this
figure, the bars that are overlapping with the shaded background, represent the possibility of energy saving.
Figure 9. The quantification of energy saving potentials compared to the control based on benchmark
setpoint
3.5. Energy efficiency of comfort-driven control
As energy use in context of HVAC control is for occupant thermal comfort, energy efficiency should
account for the amount of energy use and the level of occupant thermal comfort. Therefore, in addition to
the energy consumption assessments, for each control strategy, we have quantified the thermal comfort
improvement. Similar to the calculation of energy consumption difference (Equation (3)), the improvement
of thermal comfort (𝑇𝐶𝑖𝑚𝑝) is calculated as below.
𝑇𝐶𝑖𝑚𝑝 =(𝑇𝐶𝑐𝑜𝑚𝑓 − 𝑇𝐶𝑏𝑒𝑛)
𝑇𝐶𝑏𝑒𝑛× 100 (4)
in which 𝑇𝐶𝑏𝑒𝑛 is the probability of being comfortable using the benchmark setpoint (22.5°C). Similarly,
the 𝑇𝐶𝑐𝑜𝑚𝑓 represents the average probability of comfort for each control strategy.
Lastly, to demonstrate the overall performance (𝑂𝑝 ) in terms of energy efficiency, we have used the
following indicator:
𝑂𝑝 = 𝑇𝐶𝑖𝑚𝑝 − 𝐸𝑑𝑖𝑓𝑓 (5)
Given that both metrics are in [0,1], the subtraction of energy difference from comfort improvements will
boost the thermal comfort efficiency for reduced energy consumption (i.e., 𝐸𝑑𝑖𝑓𝑓 < 0). That is, less energy
use by the comfort-driven control leads to a negative value and we count such cases as positive. To the
contrary, an increase in the energy use penalizes the improvement in thermal comfort gain.
4. Results and Findings
In running the analyses, as noted, we selected two sets of 31 diverse thermal comfort profiles to represent
a wide range of human agents. The rationale behind selecting two sets of profiles was to assure that we
account for a wide range of preferred temperatures across a spectrum of possible occupancy scenarios. In
doing so, a data-driven approach was adopted to ensure the maximum difference between the thermal
comfort profile sets in terms of preferred temperatures. To this end, we created 1000 sets of 31 thermal
Pro
ba
bili
ty
Energy consumption
Benchmark
Possibility of saving energy
15
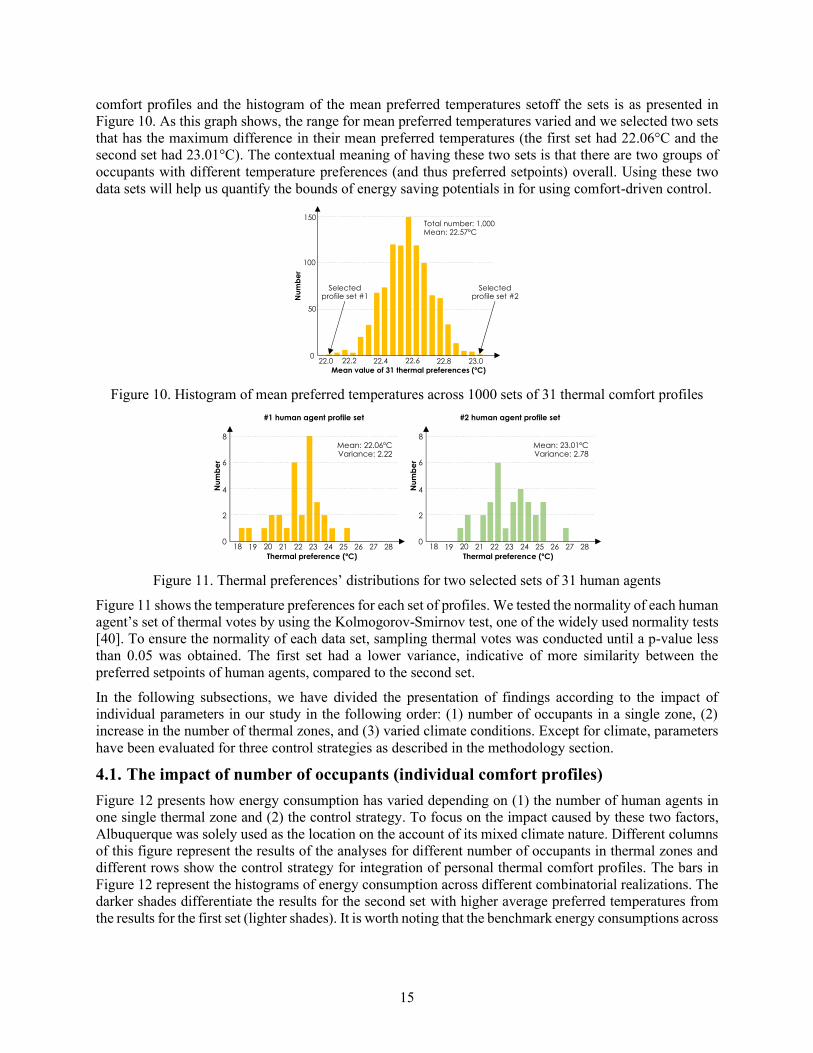
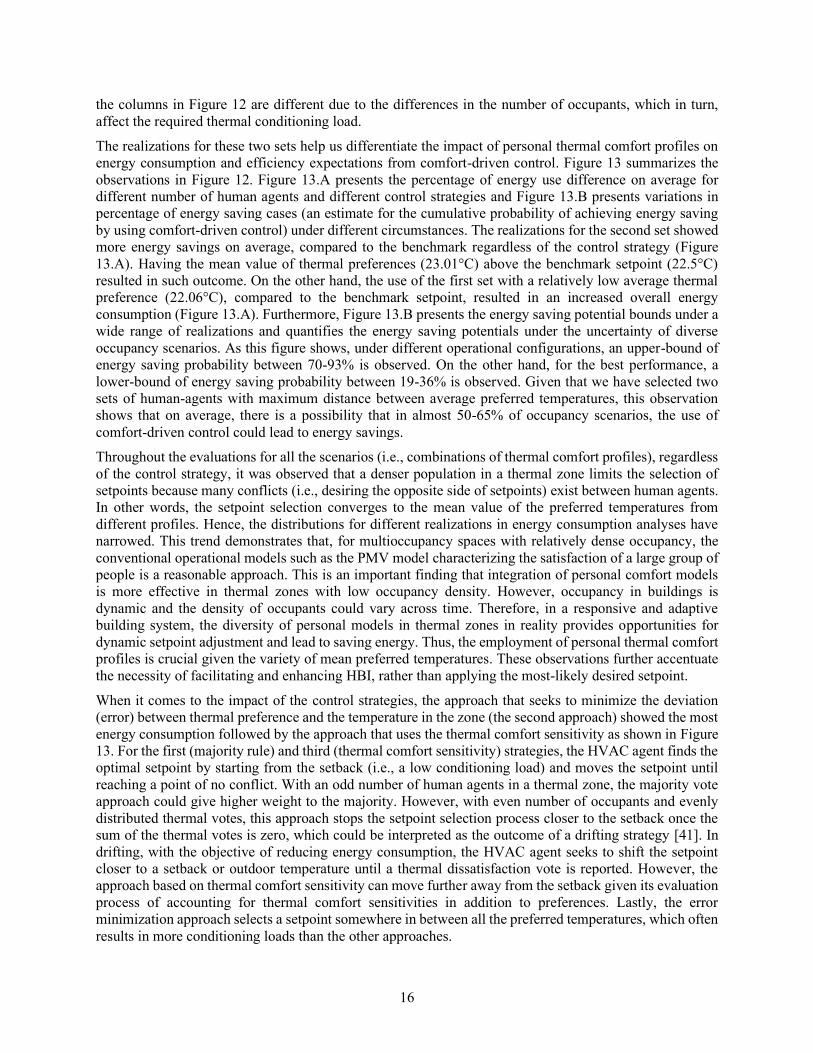
comfort profiles and the histogram of the mean preferred temperatures setoff the sets is as presented in
Figure 10. As this graph shows, the range for mean preferred temperatures varied and we selected two sets
that has the maximum difference in their mean preferred temperatures (the first set had 22.06°C and the
second set had 23.01°C). The contextual meaning of having these two sets is that there are two groups of
occupants with different temperature preferences (and thus preferred setpoints) overall. Using these two
data sets will help us quantify the bounds of energy saving potentials in for using comfort-driven control.
Figure 10. Histogram of mean preferred temperatures across 1000 sets of 31 thermal comfort profiles
Figure 11. Thermal preferences’ distributions for two selected sets of 31 human agents
Figure 11 shows the temperature preferences for each set of profiles. We tested the normality of each human
agent’s set of thermal votes by using the Kolmogorov-Smirnov test, one of the widely used normality tests
[40]. To ensure the normality of each data set, sampling thermal votes was conducted until a p-value less
than 0.05 was obtained. The first set had a lower variance, indicative of more similarity between the
preferred setpoints of human agents, compared to the second set.
In the following subsections, we have divided the presentation of findings according to the impact of
individual parameters in our study in the following order: (1) number of occupants in a single zone, (2)
increase in the number of thermal zones, and (3) varied climate conditions. Except for climate, parameters
have been evaluated for three control strategies as described in the methodology section.
4.1. The impact of number of occupants (individual comfort profiles)
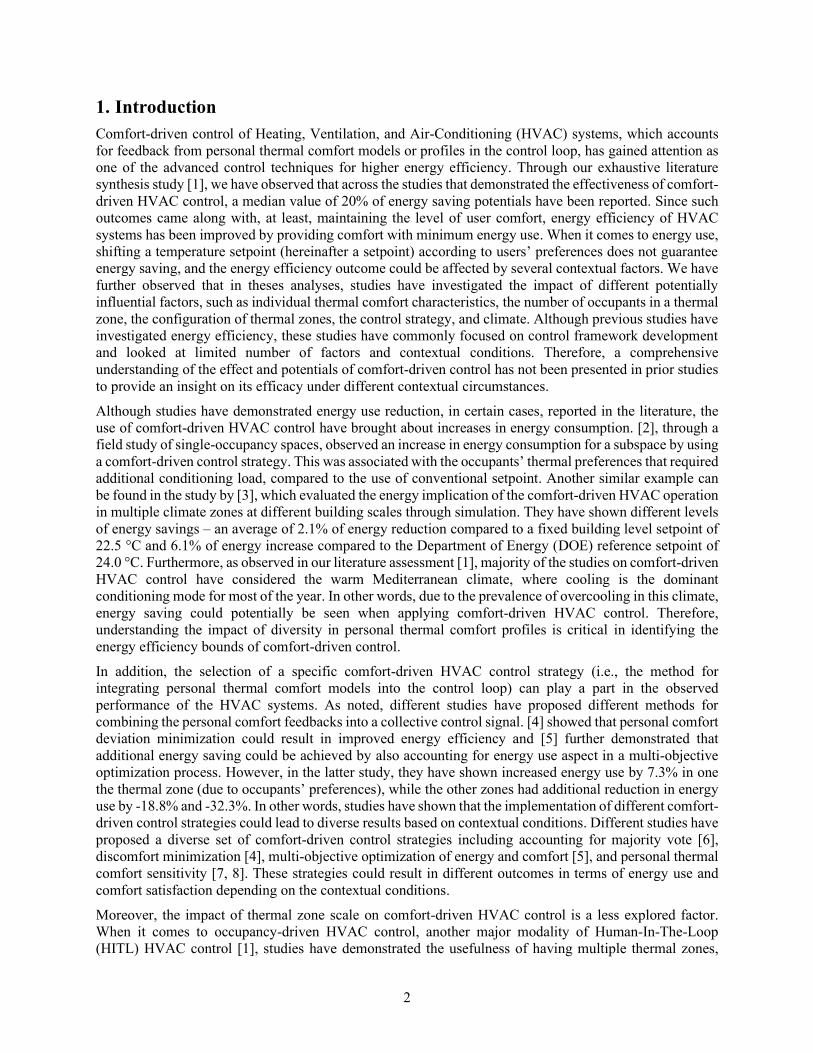
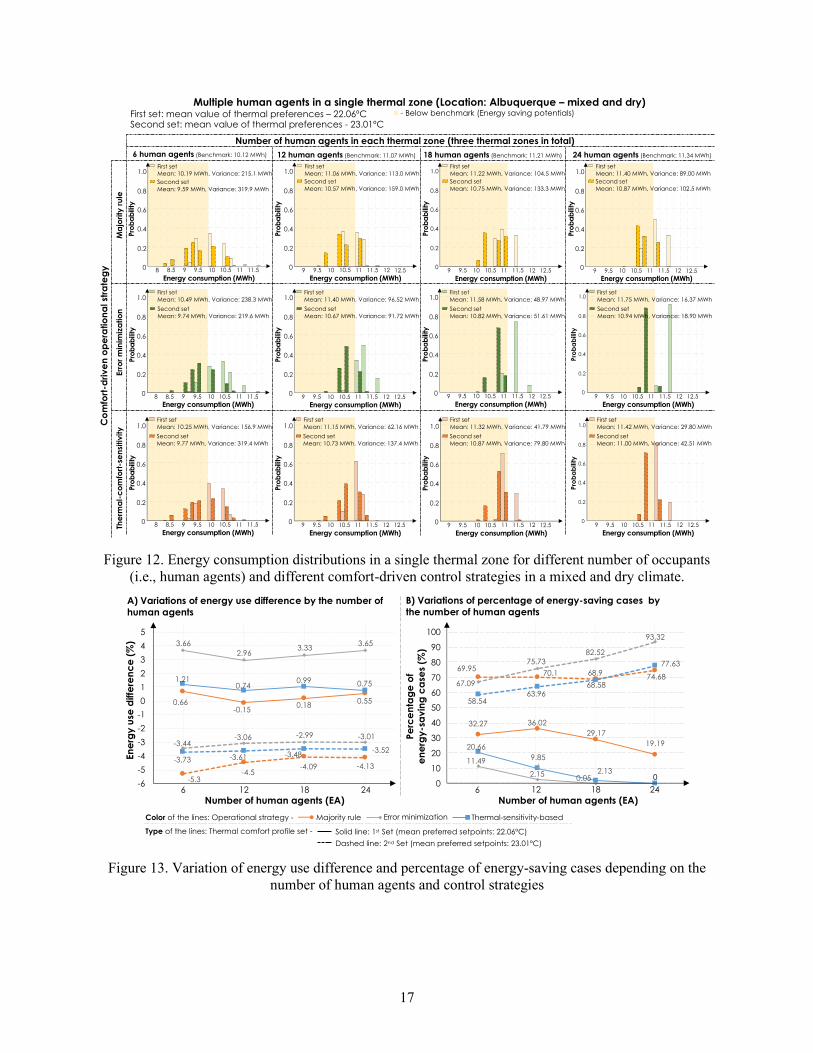
Figure 12 presents how energy consumption has varied depending on (1) the number of human agents in
one single thermal zone and (2) the control strategy. To focus on the impact caused by these two factors,
Albuquerque was solely used as the location on the account of its mixed climate nature. Different columns
of this figure represent the results of the analyses for different number of occupants in thermal zones and
different rows show the control strategy for integration of personal thermal comfort profiles. The bars in
Figure 12 represent the histograms of energy consumption across different combinatorial realizations. The
darker shades differentiate the results for the second set with higher average preferred temperatures from
the results for the first set (lighter shades). It is worth noting that the benchmark energy consumptions across
22.0
Mean value of 31 thermal preferences (ºC)
22.2
Nu
mb
er
0
50
100
150
22.4 22.6 22.8 23.0
Total number: 1,000Mean: 22.57ºC
Selected profile set #1
Selected profile set #2
18
Thermal preference (ºC)
19 20 21 22 23 24 25 26 27 28
Nu
mb
er
0
2
4
6
8Mean: 23.01ºCVariance: 2.78
18
Thermal preference (ºC)
19 20 21 22 23 24 25 26 27 28
Nu
mb
er
0
2
4
6
8Mean: 22.06ºCVariance: 2.22
#1 human agent profile set #2 human agent profile set
16
the columns in Figure 12 are different due to the differences in the number of occupants, which in turn,
affect the required thermal conditioning load.
The realizations for these two sets help us differentiate the impact of personal thermal comfort profiles on
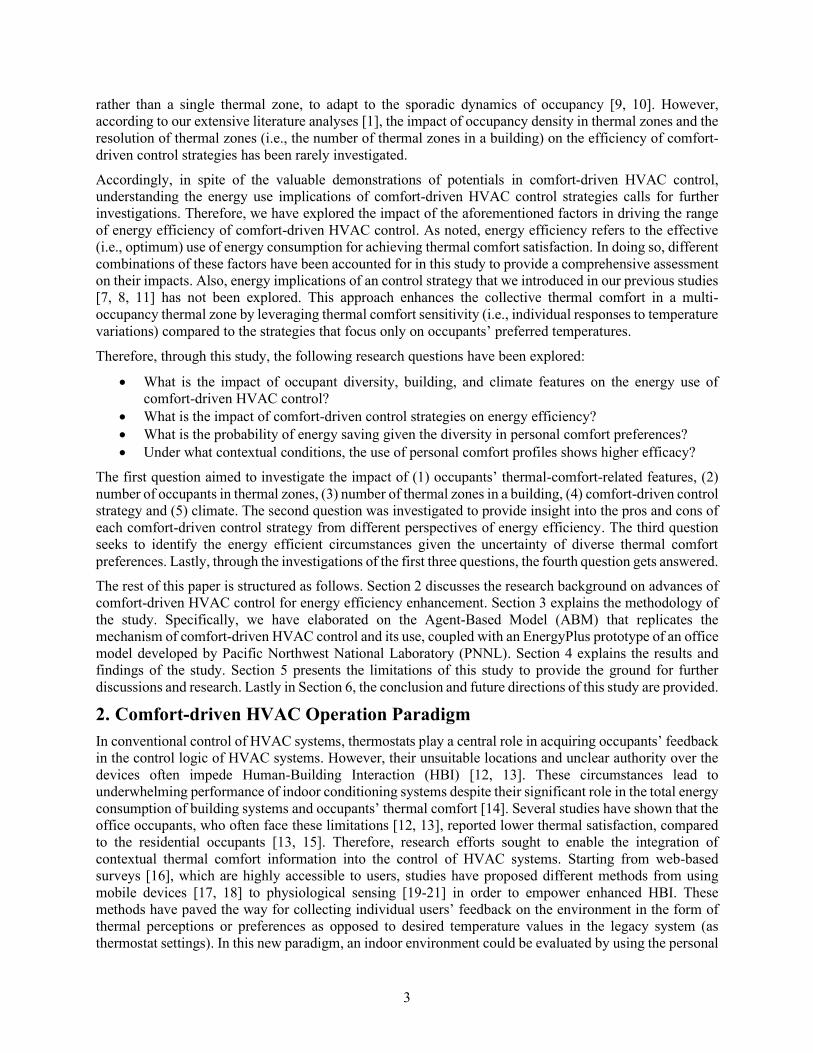
energy consumption and efficiency expectations from comfort-driven control. Figure 13 summarizes the
observations in Figure 12. Figure 13.A presents the percentage of energy use difference on average for
different number of human agents and different control strategies and Figure 13.B presents variations in
percentage of energy saving cases (an estimate for the cumulative probability of achieving energy saving
by using comfort-driven control) under different circumstances. The realizations for the second set showed
more energy savings on average, compared to the benchmark regardless of the control strategy (Figure
13.A). Having the mean value of thermal preferences (23.01°C) above the benchmark setpoint (22.5°C)
resulted in such outcome. On the other hand, the use of the first set with a relatively low average thermal
preference (22.06°C), compared to the benchmark setpoint, resulted in an increased overall energy
consumption (Figure 13.A). Furthermore, Figure 13.B presents the energy saving potential bounds under a
wide range of realizations and quantifies the energy saving potentials under the uncertainty of diverse
occupancy scenarios. As this figure shows, under different operational configurations, an upper-bound of
energy saving probability between 70-93% is observed. On the other hand, for the best performance, a
lower-bound of energy saving probability between 19-36% is observed. Given that we have selected two
sets of human-agents with maximum distance between average preferred temperatures, this observation
shows that on average, there is a possibility that in almost 50-65% of occupancy scenarios, the use of
comfort-driven control could lead to energy savings.
Throughout the evaluations for all the scenarios (i.e., combinations of thermal comfort profiles), regardless
of the control strategy, it was observed that a denser population in a thermal zone limits the selection of
setpoints because many conflicts (i.e., desiring the opposite side of setpoints) exist between human agents.
In other words, the setpoint selection converges to the mean value of the preferred temperatures from
different profiles. Hence, the distributions for different realizations in energy consumption analyses have
narrowed. This trend demonstrates that, for multioccupancy spaces with relatively dense occupancy, the
conventional operational models such as the PMV model characterizing the satisfaction of a large group of
people is a reasonable approach. This is an important finding that integration of personal comfort models
is more effective in thermal zones with low occupancy density. However, occupancy in buildings is
dynamic and the density of occupants could vary across time. Therefore, in a responsive and adaptive
building system, the diversity of personal models in thermal zones in reality provides opportunities for
dynamic setpoint adjustment and lead to saving energy. Thus, the employment of personal thermal comfort
profiles is crucial given the variety of mean preferred temperatures. These observations further accentuate
the necessity of facilitating and enhancing HBI, rather than applying the most-likely desired setpoint.
When it comes to the impact of the control strategies, the approach that seeks to minimize the deviation
(error) between thermal preference and the temperature in the zone (the second approach) showed the most
energy consumption followed by the approach that uses the thermal comfort sensitivity as shown in Figure
13. For the first (majority rule) and third (thermal comfort sensitivity) strategies, the HVAC agent finds the
optimal setpoint by starting from the setback (i.e., a low conditioning load) and moves the setpoint until
reaching a point of no conflict. With an odd number of human agents in a thermal zone, the majority vote
approach could give higher weight to the majority. However, with even number of occupants and evenly
distributed thermal votes, this approach stops the setpoint selection process closer to the setback once the
sum of the thermal votes is zero, which could be interpreted as the outcome of a drifting strategy [41]. In
drifting, with the objective of reducing energy consumption, the HVAC agent seeks to shift the setpoint
closer to a setback or outdoor temperature until a thermal dissatisfaction vote is reported. However, the
approach based on thermal comfort sensitivity can move further away from the setback given its evaluation
process of accounting for thermal comfort sensitivities in addition to preferences. Lastly, the error
minimization approach selects a setpoint somewhere in between all the preferred temperatures, which often
results in more conditioning loads than the other approaches.
17
Figure 12. Energy consumption distributions in a single thermal zone for different number of occupants
(i.e., human agents) and different comfort-driven control strategies in a mixed and dry climate.
Figure 13. Variation of energy use difference and percentage of energy-saving cases depending on the
number of human agents and control strategies
9 10 11 1210.59.5 11.5 12.5
Energy consumption (MWh)
0
0.2
0.4
0.6
0.8
1.0
Pro
ba
bili
ty
0
0.2
0.4
0.6
0.8
1.0
Pro
ba
bili
ty
0
0.2
0.4
0.6
0.8
1.0
Pro
ba
bili
ty
0
0.2
0.4
0.6
0.8
1.0
Pro
ba
bility
12 human agents (Benchmark: 11.07 MWh) 18 human agents (Benchmark: 11.21 MWh) 24 human agents (Benchmark: 11.34 MWh)6 human agents (Benchmark: 10.12 MWh)
0
0.2
0.4
0.6
0.8
1.0
Pro
ba
bili
ty
0
0.2
0.4
0.6
0.8
1.0
Pro
ba
bili
ty
0
0.2
0.4
0.6
0.8
1.0
Pro
ba
bili
ty
0
0.2
0.4
0.6
0.8
1.0
Pro
ba
bili
ty
0
0.2
0.4
0.6
0.8
1.0
Pro
ba
bili
ty
0
0.2
0.4
0.6
0.8
1.0Pro
ba
bili
ty
0
0.2
0.4
0.6
0.8
1.0
Pro
ba
bili
ty
Ma
jori
ty r
ule
Err
or
min
imiz
atio
nTh
erm
al-
co
mfo
rt-s
en
sitiv
ity
Co
mfo
rt-d
riv
en
op
era
tio
na
l st
rate
gy
Number of human agents in each thermal zone (three thermal zones in total)
Multiple human agents in a single thermal zone (Location: Albuquerque – mixed and dry)
9 10 11 1210.59.5 11.5 12.5
Energy consumption (MWh)9 10 11 1210.59.5 11.5 12.5
Energy consumption (MWh)
9 10 11 1210.59.5 11.5 12.5
Energy consumption (MWh)
9 10 11 1210.59.5 11.5 12.5
Energy consumption (MWh)9 10 11 1210.59.5 11.5 12.5
Energy consumption (MWh)
8 9 10 119.58.5 10.5 11.5
Energy consumption (MWh)
8 9 10 119.58.5 10.5 11.5
Energy consumption (MWh)9 10 11 1210.59.5 11.5 12.5
Energy consumption (MWh)9 10 11 1210.59.5 11.5 12.5
Energy consumption (MWh)
9 10 11 1210.59.5 11.5 12.5
Energy consumption (MWh)
0
0.2
0.4
0.6
0.8
1.0
Pro
ba
bili
ty
8 9 10 119.58.5 10.5 11.5
Energy consumption (MWh)
Second set
Mean: 9.59 MWh, Variance: 319.9 MWh
First setMean: 10.19 MWh, Variance: 215.1 MWh
Second set
Mean: 10.57 MWh, Variance: 159.0 MWh
First set
Mean: 11.06 MWh, Variance: 113.0 MWh
Second set
Mean: 10.75 MWh, Variance: 133.3 MWh
First set
Mean: 11.22 MWh, Variance: 104.5 MWh
Second set
Mean: 10.87 MWh, Variance: 102.5 MWh
First set
Mean: 11.40 MWh, Variance: 89.00 MWh
Second set
Mean: 9.74 MWh, Variance: 219.6 MWh
First set
Mean: 10.49 MWh, Variance: 238.3 MWh
Second set
Mean: 10.67 MWh, Variance: 91.72 MWh
First set
Mean: 11.40 MWh, Variance: 96.52 MWh
Second set
Mean: 10.82 MWh, Variance: 51.61 MWh
First set
Mean: 11.58 MWh, Variance: 48.97 MWh
Second set
Mean: 10.94 MWh, Variance: 18.90 MWh
First set
Mean: 11.75 MWh, Variance: 16.37 MWh
Second set
Mean: 9.77 MWh, Variance: 319.4 MWh
First set
Mean: 10.25 MWh, Variance: 156.9 MWh
Second set
Mean: 10.73 MWh, Variance: 137.4 MWh
First set
Mean: 11.15 MWh, Variance: 62.16 MWh
Second set
Mean: 10.87 MWh, Variance: 79.80 MWh
First set
Mean: 11.32 MWh, Variance: 41.79 MWh
Second set
Mean: 11.00 MWh, Variance: 42.51 MWh
First set
Mean: 11.42 MWh, Variance: 29.80 MWh
First set: mean value of thermal preferences – 22.06ºCSecond set: mean value of thermal preferences - 23.01ºC
- Below benchmark (Energy saving potentials)
2418126
0.66-0.15
0.180.55
3.66
2.963.33
3.65
1.210.74
0.99 0.75
-5.3-4.5
-4.09 -4.13-3.73 -3.61 -3.48
-3.52-3.44
-3.06 -2.99 -3.01
-6
-5
-4
-3
-2
-1
0
1
2
3
4
5
6 12 18 24
Majority rule Error minimization Thermal-sensitivity-based
Number of human agents (EA)
En
erg
y u
se d
iffe
ren
ce
(%
)
Color of the lines: Operational strategy -
Type of the lines: Thermal comfort profile set - Solid line: 1st Set (mean preferred setpoints: 22.06ºC)
Dashed line: 2nd Set (mean preferred setpoints: 23.01ºC)
32.27 36.02
29.17
19.19
11.49
2.150.05 0
20.66
9.85
2.130
69.9570.1 68.9
74.6867.09
75.73
82.52
93.32
58.5463.96
68.58
77.63
0
10
20
30
40
50
60
70
80
90
100
Number of human agents (EA)
Pe
rce
nta
ge
of
en
erg
y-s
av
ing
ca
ses
(%)
A) Variations of energy use difference by the number of
human agents
B) Variations of percentage of energy-saving cases by
the number of human agents
18
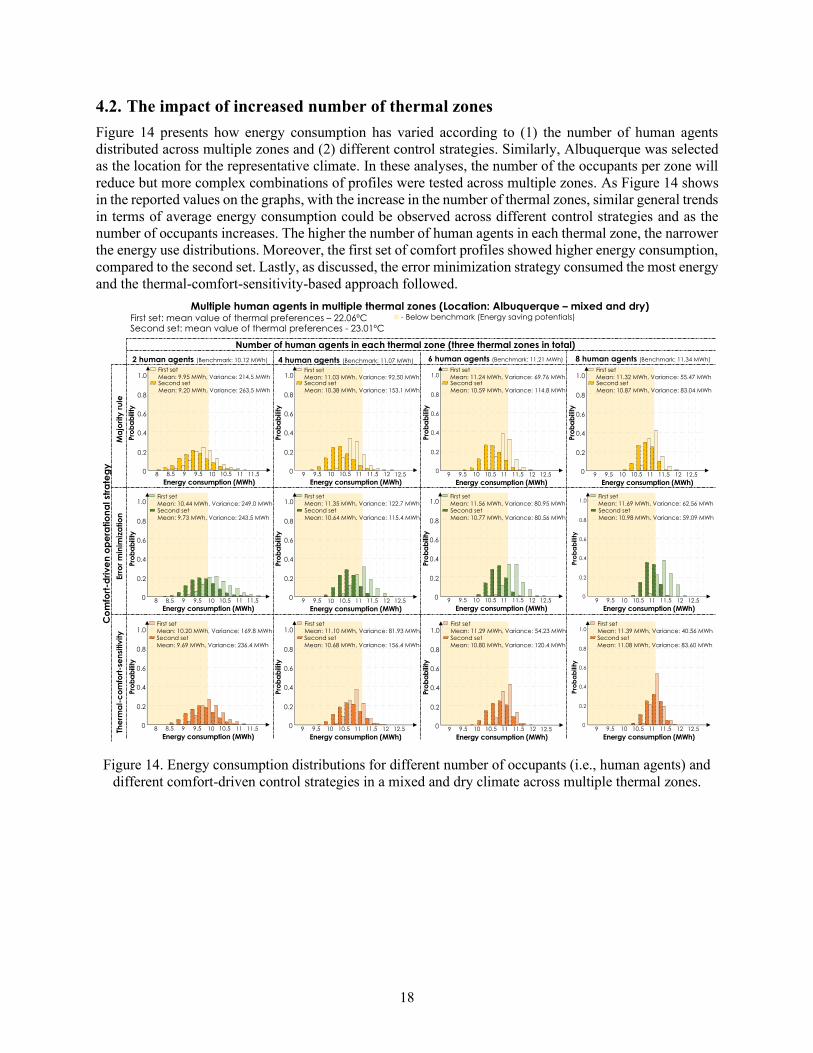
4.2. The impact of increased number of thermal zones
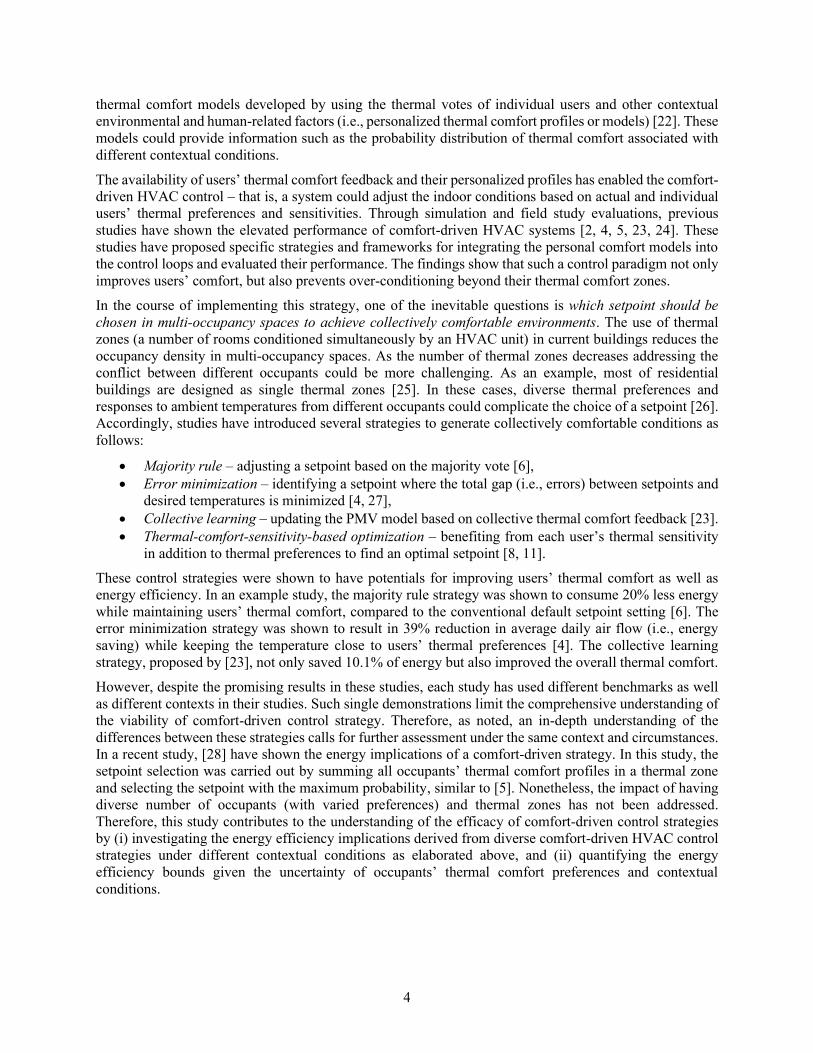
Figure 14 presents how energy consumption has varied according to (1) the number of human agents
distributed across multiple zones and (2) different control strategies. Similarly, Albuquerque was selected
as the location for the representative climate. In these analyses, the number of the occupants per zone will
reduce but more complex combinations of profiles were tested across multiple zones. As Figure 14 shows
in the reported values on the graphs, with the increase in the number of thermal zones, similar general trends
in terms of average energy consumption could be observed across different control strategies and as the
number of occupants increases. The higher the number of human agents in each thermal zone, the narrower
the energy use distributions. Moreover, the first set of comfort profiles showed higher energy consumption,
compared to the second set. Lastly, as discussed, the error minimization strategy consumed the most energy
and the thermal-comfort-sensitivity-based approach followed.
Figure 14. Energy consumption distributions for different number of occupants (i.e., human agents) and
different comfort-driven control strategies in a mixed and dry climate across multiple thermal zones.
9 10 11 1210.59.5 11.5 12.5
Energy consumption (MWh)
0
0.2
0.4
0.6
0.8
1.0
Pro
ba
bili
ty
0
0.2
0.4
0.6
0.8
1.0
Pro
ba
bili
ty
0
0.2
0.4
0.6
0.8
1.0
Pro
ba
bili
ty
0
0.2
0.4
0.6
0.8
1.0
Pro
ba
bili
ty
0
0.2
0.4
0.6
0.8
1.0
Pro
ba
bili
ty
0
0.2
0.4
0.6
0.8
1.0
Pro
ba
bili
ty
0
0.2
0.4
0.6
0.8
1.0
Pro
ba
bili
ty
0
0.2
0.4
0.6
0.8
1.0
Pro
ba
bili
ty
0
0.2
0.4
0.6
0.8
1.0
Pro
ba
bili
ty
0
0.2
0.4
0.6
0.8
1.0
Pro
ba
bili
ty
0
0.2
0.4
0.6
0.8
1.0
Pro
ba
bility
Ma
jori
ty r
ule
Err
or
min
imiz
atio
nTh
erm
al-
co
mfo
rt-s
en
sitiv
ity
Co
mfo
rt-d
riv
en
op
era
tio
na
l st
rate
gy
Number of human agents in each thermal zone (three thermal zones in total)
Multiple human agents in multiple thermal zones (Location: Albuquerque – mixed and dry)
9 10 11 1210.59.5 11.5 12.5
Energy consumption (MWh)9 10 11 1210.59.5 11.5 12.5
Energy consumption (MWh)
9 10 11 1210.59.5 11.5 12.5
Energy consumption (MWh)
9 10 11 1210.59.5 11.5 12.5
Energy consumption (MWh)9 10 11 1210.59.5 11.5 12.5
Energy consumption (MWh)
8 9 10 119.58.5 10.5 11.5
Energy consumption (MWh)
8 9 10 119.58.5 10.5 11.5
Energy consumption (MWh)9 10 11 1210.59.5 11.5 12.5
Energy consumption (MWh)9 10 11 1210.59.5 11.5 12.5
Energy consumption (MWh)
9 10 11 1210.59.5 11.5 12.5
Energy consumption (MWh)
0
0.2
0.4
0.6
0.8
1.0
Pro
ba
bili
ty
8 9 10 119.58.5 10.5 11.5
Energy consumption (MWh)
MATLAB Figure: Width – 3.29’’, Height – 2.50’’
Second set
Mean: 9.20 MWh, Variance: 263.5 MWh
First set
Mean: 9.95 MWh, Variance: 214.5 MWhSecond set
Mean: 10.38 MWh, Variance: 153.1 MWh
First set
Mean: 11.03 MWh, Variance: 92.50 MWhSecond set
Mean: 10.59 MWh, Variance: 114.8 MWh
First set
Mean: 11.24 MWh, Variance: 69.76 MWhSecond set
Mean: 10.87 MWh, Variance: 83.04 MWh
First set
Mean: 11.32 MWh, Variance: 55.47 MWh
Second set
Mean: 9.73 MWh, Variance: 243.5 MWh
First set
Mean: 10.44 MWh, Variance: 249.0 MWhSecond set
Mean: 10.64 MWh, Variance: 115.4 MWh
First set
Mean: 11.35 MWh, Variance: 122.7 MWhSecond set
Mean: 10.77 MWh, Variance: 80.56 MWh
First set
Mean: 11.56 MWh, Variance: 80.95 MWhSecond set
Mean: 10.98 MWh, Variance: 59.09 MWh
First set
Mean: 11.69 MWh, Variance: 62.56 MWh
Second set
Mean: 9.69 MWh, Variance: 236.4 MWh
First set
Mean: 10.20 MWh, Variance: 169.8 MWhSecond set
Mean: 10.68 MWh, Variance: 156.4 MWh
First set
Mean: 11.10 MWh, Variance: 81.93 MWhSecond set
Mean: 10.80 MWh, Variance: 120.4 MWh
First set
Mean: 11.29 MWh, Variance: 54.23 MWhSecond set
Mean: 11.08 MWh, Variance: 83.60 MWh
First set
Mean: 11.39 MWh, Variance: 40.56 MWh
First set: mean value of thermal preferences – 22.06ºCSecond set: mean value of thermal preferences - 23.01ºC
- Below benchmark (Energy saving potentials)
4 human agents (Benchmark: 11.07 MWh) 6 human agents (Benchmark: 11.21 MWh) 8 human agents (Benchmark: 11.34 MWh)2 human agents (Benchmark: 10.12 MWh)
19
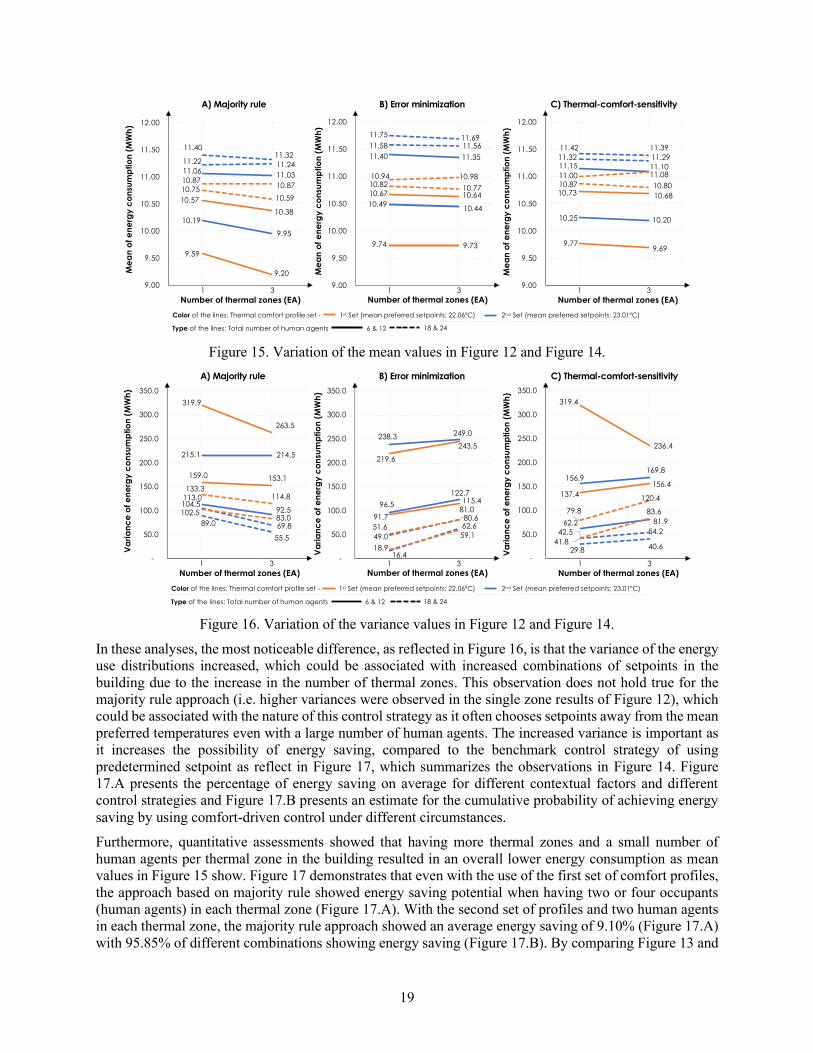
Figure 15. Variation of the mean values in Figure 12 and Figure 14.
Figure 16. Variation of the variance values in Figure 12 and Figure 14.
In these analyses, the most noticeable difference, as reflected in Figure 16, is that the variance of the energy
use distributions increased, which could be associated with increased combinations of setpoints in the
building due to the increase in the number of thermal zones. This observation does not hold true for the
majority rule approach (i.e. higher variances were observed in the single zone results of Figure 12), which
could be associated with the nature of this control strategy as it often chooses setpoints away from the mean
preferred temperatures even with a large number of human agents. The increased variance is important as
it increases the possibility of energy saving, compared to the benchmark control strategy of using
predetermined setpoint as reflect in Figure 17, which summarizes the observations in Figure 14. Figure
17.A presents the percentage of energy saving on average for different contextual factors and different
control strategies and Figure 17.B presents an estimate for the cumulative probability of achieving energy
saving by using comfort-driven control under different circumstances.
Furthermore, quantitative assessments showed that having more thermal zones and a small number of
human agents per thermal zone in the building resulted in an overall lower energy consumption as mean
values in Figure 15 show. Figure 17 demonstrates that even with the use of the first set of comfort profiles,
the approach based on majority rule showed energy saving potential when having two or four occupants
(human agents) in each thermal zone (Figure 17.A). With the second set of profiles and two human agents
in each thermal zone, the majority rule approach showed an average energy saving of 9.10% (Figure 17.A)
with 95.85% of different combinations showing energy saving (Figure 17.B). By comparing Figure 13 and
1 31 3
1st Set (mean preferred setpoints: 22.06ºC) 2nd Set (mean preferred setpoints: 23.01ºC)
Number of thermal zones (EA)
Color of the lines: Thermal comfort profile set -
Type of the lines: Total number of human agents 6 & 12
B) Error minimization
Me
an
of e
ne
rgy
co
nsu
mp
tio
n (
MW
h)
1 3
A) Majority rule
18 & 24
Me
an
of e
ne
rgy
co
nsu
mp
tio
n (
MW
h)
Me
an
of e
ne
rgy
co
nsu
mp
tio
n (
MW
h)
C) Thermal-comfort-sensitivity
Number of thermal zones (EA) Number of thermal zones (EA)
10.49 10.44
9.74 9.73
11.40 11.35
10.67 10.64
11.58 11.56
10.82 10.77
11.75 11.69
10.94 10.98
9.00
9.50
10.00
10.50
11.00
11.50
12.00
10.25 10.20
9.77 9.69
11.15 11.10
10.73 10.68
11.32 11.29
10.87 10.80
11.42 11.39
11.00 11.08
9.00
9.50
10.00
10.50
11.00
11.50
12.00
10.19
9.95
9.59
9.20
11.06 11.03
10.57
10.38
11.22 11.24
10.75 10.59
11.40 11.32
10.87 10.87
9.00
9.50
10.00
10.50
11.00
11.50
12.00
1 31 3
215.1 214.5
319.9
263.5
113.0
92.5
159.0 153.1
104.5
69.8
133.3 114.8
89.0
55.5
102.5 83.0
-
50.0
100.0
150.0
200.0
250.0
300.0
350.0
1st Set (mean preferred setpoints: 22.06ºC) 2nd Set (mean preferred setpoints: 23.01ºC)
Number of thermal zones (EA)
Color of the lines: Thermal comfort profile set -
Type of the lines: Total number of human agents 6 & 12
B) Error minimization
238.3 249.0
219.6
243.5
96.5
122.7
91.7
115.4
49.0
81.0
51.6 80.6
16.4
62.6
18.9
59.1
-
50.0
100.0
150.0
200.0
250.0
300.0
350.0
156.9 169.8
319.4
236.4
62.2 81.9
137.4
156.4
41.8
54.2
79.8
120.4
29.8 40.6
42.5
83.6
-
50.0
100.0
150.0
200.0
250.0
300.0
350.0
Va
ria
nc
e o
f e
ne
rgy
co
nsu
mp
tio
n (
MW
h)
1 3
A) Majority rule
18 & 24
Va
ria
nc
e o
f e
ne
rgy
co
nsu
mp
tio
n (
MW
h)
Va
ria
nc
e o
f e
ne
rgy
co
nsu
mp
tio
n (
MW
h)
C) Thermal-comfort-sensitivity
Number of thermal zones (EA) Number of thermal zones (EA)
20
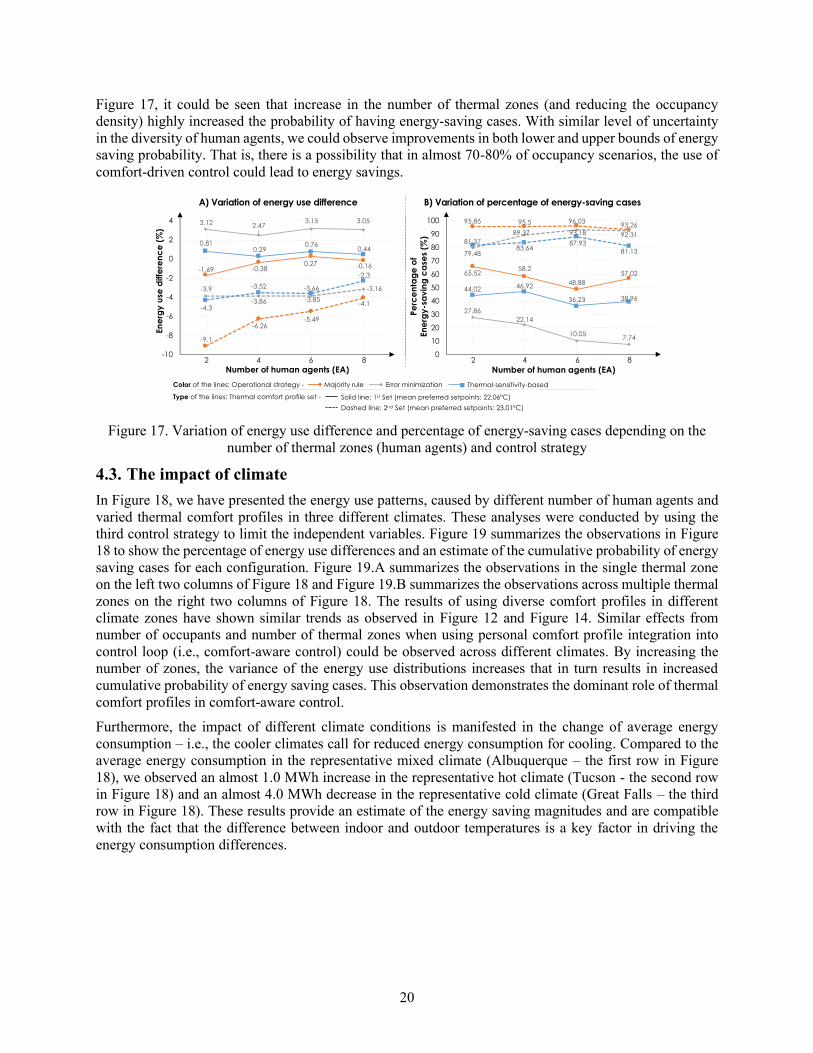
Figure 17, it could be seen that increase in the number of thermal zones (and reducing the occupancy
density) highly increased the probability of having energy-saving cases. With similar level of uncertainty
in the diversity of human agents, we could observe improvements in both lower and upper bounds of energy
saving probability. That is, there is a possibility that in almost 70-80% of occupancy scenarios, the use of
comfort-driven control could lead to energy savings.
Figure 17. Variation of energy use difference and percentage of energy-saving cases depending on the
number of thermal zones (human agents) and control strategy
4.3. The impact of climate
In Figure 18, we have presented the energy use patterns, caused by different number of human agents and
varied thermal comfort profiles in three different climates. These analyses were conducted by using the
third control strategy to limit the independent variables. Figure 19 summarizes the observations in Figure
18 to show the percentage of energy use differences and an estimate of the cumulative probability of energy
saving cases for each configuration. Figure 19.A summarizes the observations in the single thermal zone
on the left two columns of Figure 18 and Figure 19.B summarizes the observations across multiple thermal
zones on the right two columns of Figure 18. The results of using diverse comfort profiles in different
climate zones have shown similar trends as observed in Figure 12 and Figure 14. Similar effects from
number of occupants and number of thermal zones when using personal comfort profile integration into
control loop (i.e., comfort-aware control) could be observed across different climates. By increasing the
number of zones, the variance of the energy use distributions increases that in turn results in increased
cumulative probability of energy saving cases. This observation demonstrates the dominant role of thermal
comfort profiles in comfort-aware control.
Furthermore, the impact of different climate conditions is manifested in the change of average energy
consumption – i.e., the cooler climates call for reduced energy consumption for cooling. Compared to the
average energy consumption in the representative mixed climate (Albuquerque – the first row in Figure
18), we observed an almost 1.0 MWh increase in the representative hot climate (Tucson - the second row
in Figure 18) and an almost 4.0 MWh decrease in the representative cold climate (Great Falls – the third
row in Figure 18). These results provide an estimate of the energy saving magnitudes and are compatible
with the fact that the difference between indoor and outdoor temperatures is a key factor in driving the
energy consumption differences.
65.5258.2
48.88
57.02
27.86
22.14
10.057.74
44.02 46.92
36.23 38.96
95.85 95.5 96.0393.26
79.48
89.37 93.18 92.3181.37
83.6487.93
81.13
0
10
20
30
40
50
60
70
80
90
100
-1.69 -0.380.27 -0.16
3.12 2.473.15 3.05
0.810.29
0.760.44
-9.1
-6.26-5.49
-4.1
-3.9
-3.86 -3.85
-3.16
-4.3
-3.52 -3.66
-2.3
-10
-8
-6
-4
-2
0
2
4
86422 4 6 8
Majority rule Error minimization Thermal-sensitivity-based
Number of human agents (EA)
En
erg
y u
se d
iffe
ren
ce
(%
)
Color of the lines: Operational strategy -
Type of the lines: Thermal comfort profile set - Solid line: 1st Set (mean preferred setpoints: 22.06ºC)
Dashed line: 2nd Set (mean preferred setpoints: 23.01ºC)
Number of human agents (EA)
Pe
rce
nta
ge
of
En
erg
y-s
av
ing
ca
ses
(%)
A) Variation of energy use difference B) Variation of percentage of energy-saving cases
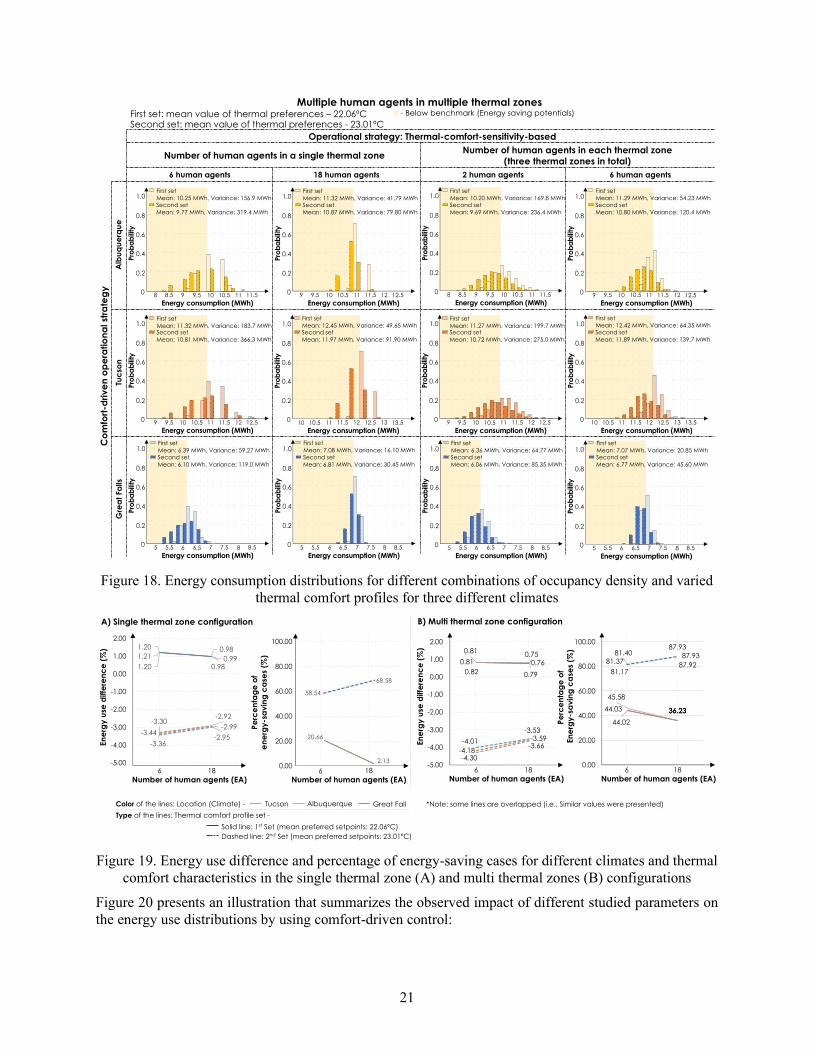
21
Figure 18. Energy consumption distributions for different combinations of occupancy density and varied
thermal comfort profiles for three different climates
Figure 19. Energy use difference and percentage of energy-saving cases for different climates and thermal
comfort characteristics in the single thermal zone (A) and multi thermal zones (B) configurations
Figure 20 presents an illustration that summarizes the observed impact of different studied parameters on
the energy use distributions by using comfort-driven control:
Co
mfo
rt-d
riv
en
op
era
tio
na
l st
rate
gy
Operational strategy: Thermal-comfort-sensitivity-based
Multiple human agents in multiple thermal zones
0
0.2
0.4
0.6
0.8
1.0
Pro
ba
bili
ty
0
0.2
0.4
0.6
0.8
1.0
Pro
ba
bili
ty
Alb
uq
ue
rqu
e
8 9 10 119.58.5 10.5 11.5
Energy consumption (MWh)9 10 11 1210.59.5 11.5 12.5
Energy consumption (MWh)
Second set
Mean: 9.69 MWh, Variance: 236.4 MWh
First set
Mean: 10.20 MWh, Variance: 169.8 MWhSecond set
Mean: 10.80 MWh, Variance: 120.4 MWh
First set
Mean: 11.29 MWh, Variance: 54.23 MWh
First set: mean value of thermal preferences – 22.06ºCSecond set: mean value of thermal preferences - 23.01ºC
- Below benchmark (Energy saving potentials)
6 human agents2 human agents
Number of human agents in each thermal zone
(three thermal zones in total)
0
0.2
0.4
0.6
0.8
1.0
Pro
ba
bili
ty9 10 11 1210.59.5 11.5 12.5
Energy consumption (MWh)
Second set
Mean: 10.72 MWh, Variance: 275.0 MWh
First set
Mean: 11.27 MWh, Variance: 199.7 MWh
0
0.2
0.4
0.6
0.8
1.0
Pro
ba
bili
ty
10 11 12 1311.510.5 12.5 13.5
Energy consumption (MWh)
Second set
Mean: 11.89 MWh, Variance: 139.7 MWh
First set
Mean: 12.42 MWh, Variance: 64.35 MWh
Tuc
son
Gre
at
Falls
0
0.2
0.4
0.6
0.8
1.0
Pro
ba
bili
ty
0
0.2
0.4
0.6
0.8
1.0
Pro
ba
bili
ty
5 6 7 86.55.5 7.5 8.5
Energy consumption (MWh)5 6 7 86.55.5 7.5 8.5
Energy consumption (MWh)
Second set
Mean: 6.06 MWh, Variance: 85.35 MWh
First set
Mean: 6.36 MWh, Variance: 64.77 MWhSecond set
Mean: 6.77 MWh, Variance: 45.60 MWh
First set
Mean: 7.07 MWh, Variance: 20.85 MWh
Number of human agents in a single thermal zone
18 human agents6 human agents
0
0.2
0.4
0.6
0.8
1.0
Pro
ba
bili
ty
10 11 12 1311.510.5 12.5 13.5
Energy consumption (MWh)
Second set
Mean: 11.97 MWh, Variance: 91.90 MWh
First set
Mean: 12.45 MWh, Variance: 49.65 MWh
0
0.2
0.4
0.6
0.8
1.0
Pro
ba
bili
ty
9 10 11 1210.59.5 11.5 12.5
Energy consumption (MWh)
Second set
Mean: 10.81 MWh, Variance: 366.3 MWh
First set
Mean: 11.32 MWh, Variance: 183.7 MWh
0
0.2
0.4
0.6
0.8
1.0
Pro
ba
bili
ty
5 6 7 86.55.5 7.5 8.5
Energy consumption (MWh)
Second set
Mean: 6.81 MWh, Variance: 30.45 MWh
First set
Mean: 7.08 MWh, Variance: 16.10 MWh
0
0.2
0.4
0.6
0.8
1.0
Pro
ba
bili
ty
5 6 7 86.55.5 7.5 8.5
Energy consumption (MWh)
Second set
Mean: 6.10 MWh, Variance: 119.0 MWh
First set
Mean: 6.39 MWh, Variance: 59.27 MWh
0
0.2
0.4
0.6
0.8
1.0
Pro
ba
bili
ty
8 9 10 119.58.5 10.5 11.5
Energy consumption (MWh)
Second set
Mean: 9.77 MWh, Variance: 319.4 MWh
First set
Mean: 10.25 MWh, Variance: 156.9 MWh
0
0.2
0.4
0.6
0.8
1.0
Pro
ba
bili
ty
9 10 11 1210.59.5 11.5 12.5
Energy consumption (MWh)
Second set
Mean: 10.87 MWh, Variance: 79.80 MWh
First set
Mean: 11.32 MWh, Variance: 41.79 MWh
6 18
20.66
2.13
58.54
68.58
0.00
20.00
40.00
60.00
80.00
100.001.20 0.981.21 0.991.20 0.98
-3.30-2.92
-3.44-2.99
-3.36-2.95
-5.00
-4.00
-3.00
-2.00
-1.00
0.00
1.00
2.00
1866 18
Tucson Albuquerque Great Fall
Number of human agents (EA)
En
erg
y u
se d
iffe
ren
ce
(%
)
Color of the lines: Location (Climate) -
Type of the lines: Thermal comfort profile set -
Solid line: 1st Set (mean preferred setpoints: 22.06ºC)
Dashed line: 2nd Set (mean preferred setpoints: 23.01ºC)
Number of human agents (EA)
Pe
rce
nta
ge
of
en
erg
y-s
av
ing
ca
ses
(%)
0.810.75
0.81 0.76
0.82 0.79
-4.18
-3.59
-4.30
-3.66-4.01
-3.53
-5.00
-4.00
-3.00
-2.00
-1.00
0.00
1.00
2.00
44.03 36.23
44.02
36.23
45.58
36.23
81.4087.93
81.3787.93
81.1787.92
0.00
20.00
40.00
60.00
80.00
100.00
Number of human agents (EA)
En
erg
y u
se d
iffe
ren
ce
(%
)
Number of human agents (EA)
Pe
rce
nta
ge
of
En
erg
y-s
av
ing
ca
ses
(%)
6 18
A) Single thermal zone configuration B) Multi thermal zone configuration
*Note: some lines are overlapped (i.e., Similar values were presented)
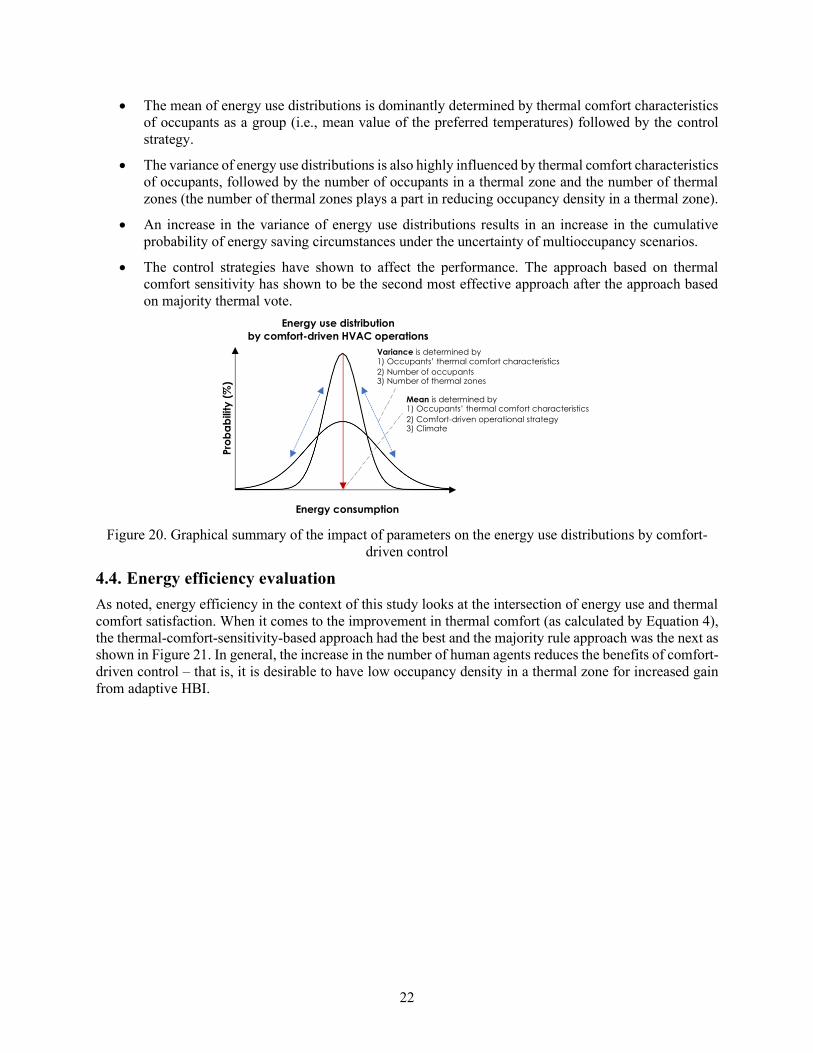
22
• The mean of energy use distributions is dominantly determined by thermal comfort characteristics
of occupants as a group (i.e., mean value of the preferred temperatures) followed by the control
strategy.
• The variance of energy use distributions is also highly influenced by thermal comfort characteristics
of occupants, followed by the number of occupants in a thermal zone and the number of thermal
zones (the number of thermal zones plays a part in reducing occupancy density in a thermal zone).
• An increase in the variance of energy use distributions results in an increase in the cumulative
probability of energy saving circumstances under the uncertainty of multioccupancy scenarios.
• The control strategies have shown to affect the performance. The approach based on thermal
comfort sensitivity has shown to be the second most effective approach after the approach based
on majority thermal vote.
Figure 20. Graphical summary of the impact of parameters on the energy use distributions by comfort-
driven control
4.4. Energy efficiency evaluation
As noted, energy efficiency in the context of this study looks at the intersection of energy use and thermal
comfort satisfaction. When it comes to the improvement in thermal comfort (as calculated by Equation 4),
the thermal-comfort-sensitivity-based approach had the best and the majority rule approach was the next as
shown in Figure 21. In general, the increase in the number of human agents reduces the benefits of comfort-
driven control – that is, it is desirable to have low occupancy density in a thermal zone for increased gain
from adaptive HBI.
Energy consumption
Pro
ba
bili
ty (
%)
Variance is determined by1) Occupants’ thermal comfort characteristics
2) Number of occupants3) Number of thermal zones
Mean is determined by1) Occupants’ thermal comfort characteristics
2) Comfort-driven operational strategy3) Climate
Energy use distribution
by comfort-driven HVAC operations
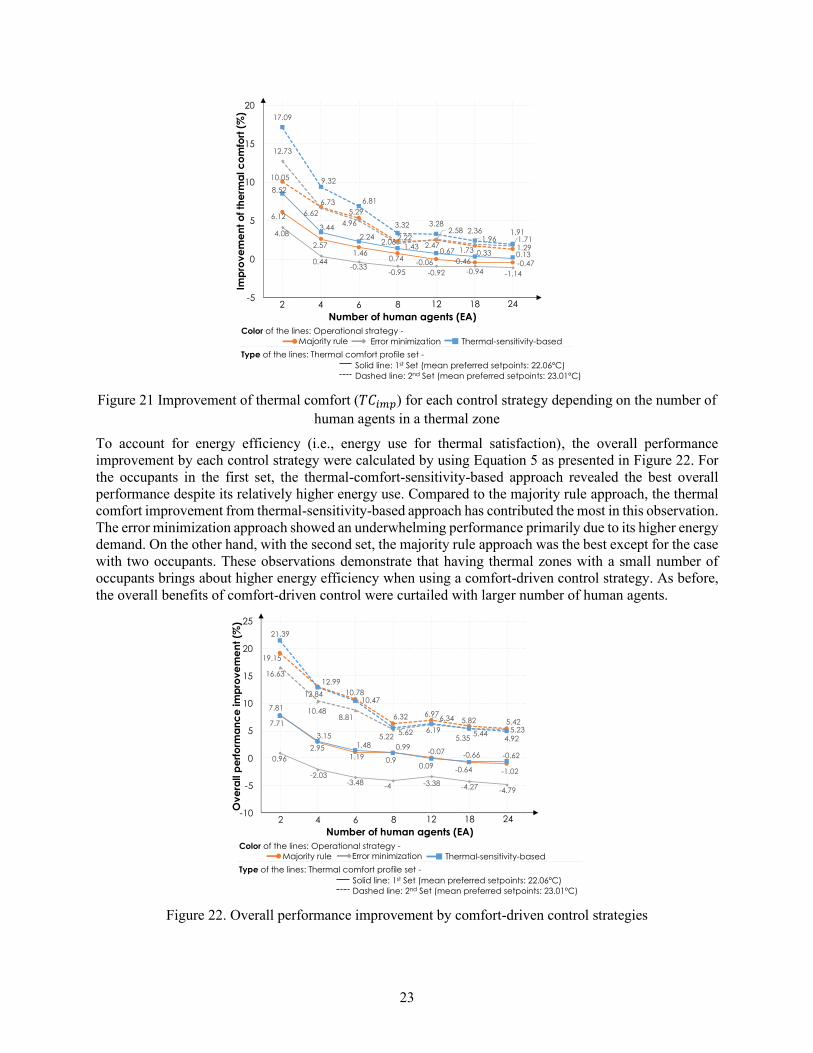
23
Figure 21 Improvement of thermal comfort (𝑇𝐶𝑖𝑚𝑝) for each control strategy depending on the number of
human agents in a thermal zone
To account for energy efficiency (i.e., energy use for thermal satisfaction), the overall performance
improvement by each control strategy were calculated by using Equation 5 as presented in Figure 22. For
the occupants in the first set, the thermal-comfort-sensitivity-based approach revealed the best overall
performance despite its relatively higher energy use. Compared to the majority rule approach, the thermal
comfort improvement from thermal-sensitivity-based approach has contributed the most in this observation.
The error minimization approach showed an underwhelming performance primarily due to its higher energy
demand. On the other hand, with the second set, the majority rule approach was the best except for the case
with two occupants. These observations demonstrate that having thermal zones with a small number of
occupants brings about higher energy efficiency when using a comfort-driven control strategy. As before,
the overall benefits of comfort-driven control were curtailed with larger number of human agents.
Figure 22. Overall performance improvement by comfort-driven control strategies
2 186 12
Majority rule Error minimization Thermal-sensitivity-based
Number of human agents (EA)
Imp
rov
em
en
t o
f th
erm
al c
om
fort
(%
)
Color of the lines: Operational strategy -
Type of the lines: Thermal comfort profile set -
Solid line: 1st Set (mean preferred setpoints: 22.06ºC)
Dashed line: 2nd Set (mean preferred setpoints: 23.01ºC)
6.12
2.571.46
0.74-0.06 -0.46 -0.47
4.08
0.44-0.33
-0.95 -0.92 -0.94 -1.14
8.52
3.44
2.24
1.430.67 0.33 0.13
10.05
6.73
5.29
2.222.47
1.73 1.29
12.73
6.62
4.96
2.06
2.581.96 1.71
17.09
9.32
6.81
3.32 3.282.36 1.91
-5
0
5
10
15
20
4 8 24
2 186 12
Majority rule Error minimization Thermal-sensitivity-based
Number of human agents (EA)
Ov
era
ll p
erf
orm
an
ce
im
pro
ve
me
nt
(%)
Color of the lines: Operational strategy -
Type of the lines: Thermal comfort profile set -
Solid line: 1st Set (mean preferred setpoints: 22.06ºC)
Dashed line: 2nd Set (mean preferred setpoints: 23.01ºC)
4 8 24
7.81
2.951.19 0.9
0.09-0.64 -1.02
0.96
-2.03-3.48 -4 -3.38 -4.27 -4.79
7.71
3.15
1.48 0.99-0.07 -0.66 -0.62
19.15
12.99
10.78
6.32 6.975.82 5.42
16.63
10.488.81
5.226.19 5.44
5.23
21.39
12.8410.47
5.62
6.34
5.35 4.92
-10
-5
0
5
10
15
20
25
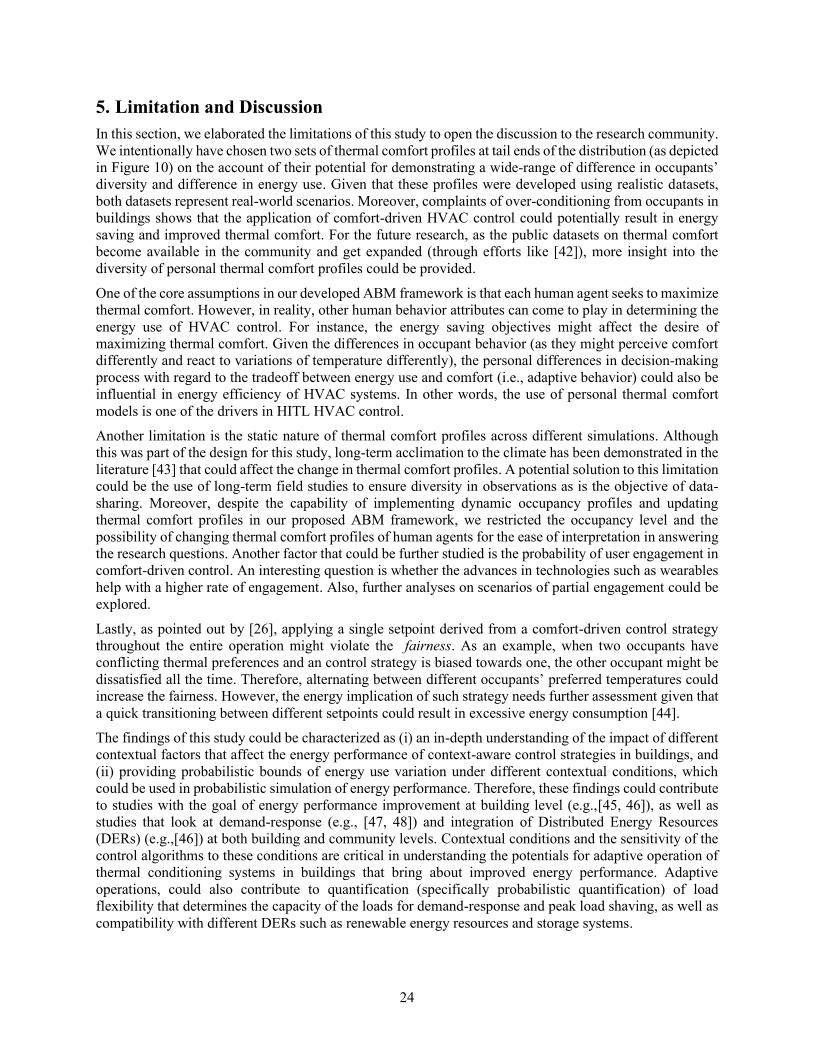
24
5. Limitation and Discussion
In this section, we elaborated the limitations of this study to open the discussion to the research community.
We intentionally have chosen two sets of thermal comfort profiles at tail ends of the distribution (as depicted
in Figure 10) on the account of their potential for demonstrating a wide-range of difference in occupants’
diversity and difference in energy use. Given that these profiles were developed using realistic datasets,
both datasets represent real-world scenarios. Moreover, complaints of over-conditioning from occupants in
buildings shows that the application of comfort-driven HVAC control could potentially result in energy
saving and improved thermal comfort. For the future research, as the public datasets on thermal comfort
become available in the community and get expanded (through efforts like [42]), more insight into the
diversity of personal thermal comfort profiles could be provided.
One of the core assumptions in our developed ABM framework is that each human agent seeks to maximize
thermal comfort. However, in reality, other human behavior attributes can come to play in determining the
energy use of HVAC control. For instance, the energy saving objectives might affect the desire of
maximizing thermal comfort. Given the differences in occupant behavior (as they might perceive comfort
differently and react to variations of temperature differently), the personal differences in decision-making
process with regard to the tradeoff between energy use and comfort (i.e., adaptive behavior) could also be
influential in energy efficiency of HVAC systems. In other words, the use of personal thermal comfort
models is one of the drivers in HITL HVAC control.
Another limitation is the static nature of thermal comfort profiles across different simulations. Although
this was part of the design for this study, long-term acclimation to the climate has been demonstrated in the
literature [43] that could affect the change in thermal comfort profiles. A potential solution to this limitation
could be the use of long-term field studies to ensure diversity in observations as is the objective of data-
sharing. Moreover, despite the capability of implementing dynamic occupancy profiles and updating
thermal comfort profiles in our proposed ABM framework, we restricted the occupancy level and the
possibility of changing thermal comfort profiles of human agents for the ease of interpretation in answering
the research questions. Another factor that could be further studied is the probability of user engagement in
comfort-driven control. An interesting question is whether the advances in technologies such as wearables
help with a higher rate of engagement. Also, further analyses on scenarios of partial engagement could be
explored.
Lastly, as pointed out by [26], applying a single setpoint derived from a comfort-driven control strategy
throughout the entire operation might violate the fairness. As an example, when two occupants have
conflicting thermal preferences and an control strategy is biased towards one, the other occupant might be
dissatisfied all the time. Therefore, alternating between different occupants’ preferred temperatures could
increase the fairness. However, the energy implication of such strategy needs further assessment given that
a quick transitioning between different setpoints could result in excessive energy consumption [44].
The findings of this study could be characterized as (i) an in-depth understanding of the impact of different
contextual factors that affect the energy performance of context-aware control strategies in buildings, and
(ii) providing probabilistic bounds of energy use variation under different contextual conditions, which
could be used in probabilistic simulation of energy performance. Therefore, these findings could contribute
to studies with the goal of energy performance improvement at building level (e.g.,[45, 46]), as well as
studies that look at demand-response (e.g., [47, 48]) and integration of Distributed Energy Resources
(DERs) (e.g.,[46]) at both building and community levels. Contextual conditions and the sensitivity of the
control algorithms to these conditions are critical in understanding the potentials for adaptive operation of
thermal conditioning systems in buildings that bring about improved energy performance. Adaptive
operations, could also contribute to quantification (specifically probabilistic quantification) of load
flexibility that determines the capacity of the loads for demand-response and peak load shaving, as well as
compatibility with different DERs such as renewable energy resources and storage systems.
25
6. Conclusion
In this study, we have investigated the energy efficiency implications of comfort-driven HVAC control
strategies in multi-occupancy cases – i.e., integrating personal thermal comfort profiles of occupants into
the control loop of HVAC systems – to better understand their potentials under a diverse set of contextual
conditions. Prior research studies have evaluated the performance of comfort-driven control for specific
contextual conditions and reported both positive and negative energy saving outcomes. These observations
have called for a comprehensive understanding of the efficacy of comfort-driven HVAC control in terms
of energy efficiency. By reviewing the literature and the reported energy efficiency trends, we identified
the potential parameters that could affect the energy efficiency of these strategies: (1) the diversity in
occupants’ thermal comfort characteristics and uncertainty in multioccupancy scenarios, (2) the thermal
zone configuration, (3) climate, and (4) the control strategy. To this end, by developing diverse sets of
thermal comfort profiles from real-world field data, we employed a coupled agent-based modeling scheme
and EnergyPlus simulation to evaluate the impact of the aforementioned parameters for different
combinations. Then, we have provided quantified bounds of energy saving potentials given the uncertainty
in multioccupancy scenarios. The thermal comfort profiles were selected to be distributed across a range of
preferred indoor temperatures to show the impact of diversity in individual differences. In these evaluations,
we looked at the histogram of energy use across different combinatorial realizations.
The results showed that the occupants’ thermal comfort characteristics and the number of occupants per
thermal zone are the most impactful parameters in shaping the energy use distributions and determining the
energy saving potentials of comfort-driven control. In other words, if the average of preferred temperatures
by occupants in a building lies above the standard setpoints, the probability of energy saving increases and
vice versa. However, the impact of comfort-driven control comes into play regardless of the average
preferred temperature by groups of occupants in a building. Our analyses over a wide spectrum of
occupants’ characteristics show an average estimate for cumulative probability of energy saving cases of
50-65% in a single thermal zone and 70-80% in multiple thermal zones.
Analyses on energy efficiency in this study (i.e., the use of energy for improving thermal comfort) showed
that as the number of occupants per multioccupancy zones increases, the opportunities for energy efficiency
improvement by using personal comfort profiles decreases. The use of comfort-driven control showed to
have a maximum of 21% to 11% improvement in energy efficiency when a thermal zone is shared by 2 to
6 occupants, respectively. By having more than six occupants per zone, the benefits of using personal
comfort diminishes although there are still potential for improved energy performance. In those cases, the
integration of personal comfort models converges to more conventional models such as the PMV model.
In addition, control strategies were proven to be effective in driving energy efficiency of control.
Specifically, the thermal-comfort-sensitivity-based approach showed to result in the best performance in
generating collectively comfortable conditions and thermal-vote-based approach was shown to be more
energy efficient than the other strategies. Among the future directions of this study are the investigation of
energy efficiency potentials at the intersection of occupancy and comfort modalities, as well as investigating
the impact of temperature distributions through more advanced simulations or field studies, where the
temperature distributions across a thermal zone could be affected by different contextual variables and
result in varied occupant experiences.
7. Acknowledgment
This material is based upon work supported by the National Science Foundation under grant #1663513.
Any opinions, findings, and conclusions or recommendations expressed in this material are those of the
authors and do not necessarily reflect the views of the National Science Foundation.
8. References
1. Jung, W. and F. Jazizadeh, Human-in-the-loop HVAC operations: A quantitative review on
occupancy, comfort, and energy-efficiency dimensions. Applied Energy, 2019. 239: p. 1471-1508.
26
2. Jazizadeh, F., et al. Personalized Thermal Comfort Driven Control in HVAC Operated Office
Buildings. in ASCE International Workshop on Computing in Civil Engineering (IWCCE)
Conference. 2013.
3. Aryal, A. and B. Becerik-Gerber, Energy consequences of Comfort-driven temperature setpoints
in office buildings. Energy and Buildings, 2018. 177: p. 33-46.
4. Jazizadeh, F., et al., User-led decentralized thermal comfort driven HVAC operations for improved
efficiency in office buildings. Energy and Buildings, 2014. 70: p. 398-410.
5. Ghahramani, A., F. Jazizadeh, and B. Becerik-Gerber, A knowledge based approach for selecting
energy-aware and comfort-driven HVAC temperature set points. Energy and Buildings, 2014. 85:
p. 536-548.
6. Murakami, Y., et al., Field experiments on energy consumption and thermal comfort in the office
environment controlled by occupants’ requirements from PC terminal. Building and Environment,
2007. 42(12): p. 4022-4027.
7. Jung, W. and F. Jazizadeh, Comparative assessment of HVAC control strategies using personal
thermal comfort and sensitivity models. Building and Environment, 2019. 158: p. 104-119.
8. Jung, W. and F. Jazizadeh. Multi-Occupancy Indoor Thermal Condition Optimization in
Consideration of Thermal Sensitivity. in Advanced Computing Strategies for Engineering. 2018.
Cham: Springer International Publishing.
9. Sookoor, T. and K. Whitehouse. RoomZoner: occupancy-based room-level zoning of a centralized
HVAC system. in Proceedings of the ACM/IEEE 4th International Conference on Cyber-Physical
Systems. 2013. ACM.
10. Capozzoli, A., et al., Data analytics for occupancy pattern learning to reduce the energy
consumption of HVAC systems in office buildings. Sustainable Cities and Society, 2017. 35: p. 191-
208.
11. Jung, W. and F. Jazizadeh, Multi-Occupancy Indoor Condition Optimization in consideration of
Thermal Sensitivity, in EG-ICE 2018. 2018: Lausanne, Switzerland.
12. Karjalainen, S. and O. Koistinen, User problems with individual temperature control in offices.
Building and Environment, 2007. 42(8): p. 2880-2887.
13. Karjalainen, S., Thermal comfort and use of thermostats in Finnish homes and offices. Building
and Environment, 2009. 44(6): p. 1237-1245.
14. Huizenga, C., et al., Air quality and thermal comfort in office buildings: Results of a large indoor
environmental quality survey. 2006.
15. Amasyali, K. and N.M. El-Gohary, Energy-related values and satisfaction levels of residential and
office building occupants. Building and Environment, 2016. 95: p. 251-263.
16. Huizenga, C., K. Laeser, and E. Arens, A web-based occupant satisfaction survey for benchmarking
building quality. Indoor Air, 2002: p. 1-6.
17. Jazizadeh, F., et al., Continuous Sensing of Occupant Perception of Indoor Ambient Factors. 2011.
p. 161-168.
18. Li, D., C.C. Menassa, and V.R. Kamat, A Personalized HVAC Control Smartphone Application
Framework for Improved Human Health and Well-Being, in Computing in Civil Engineering 2017.
2017.
19. Jazizadeh, F. and W. Jung, Personalized thermal comfort inference using RGB video images for
distributed HVAC control. Applied Energy, 2018. 220: p. 829-841.
20. Jung, W. and F. Jazizadeh, Vision-based thermal comfort quantification for HVAC control.
Building and Environment, 2018. 142: p. 513-523.
21. Jung, W. and F. Jazizadeh. Towards Integration of Doppler Radar Sensors into Personalized
Thermoregulation-Based Control of HVAC. in 4th ACM Conference on Systems for Energy-
Efficient Built Environment (BuildSys' 17). 2017. Delft, The Netherlands: ACM.
22. Jazizadeh, F., et al., Human-Building Interaction Framework for Personalized Thermal Comfort-
Driven Systems in Office Buildings. Journal of Computing in Civil Engineering, 2013.
27
23. Erickson, V.L. and A.E. Cerpa, Thermovote: participatory sensing for efficient building HVAC
conditioning, in Proceedings of the Fourth ACM Workshop on Embedded Sensing Systems for
Energy-Efficiency in Buildings. 2012, ACM: Toronto, Ontario, Canada. p. 9-16.
24. Li, D., C.C. Menassa, and V.R. Kamat, Personalized human comfort in indoor building
environments under diverse conditioning modes. Building and Environment, 2017. 126: p. 304-
317.
25. Guo, W. and M. Zhou. Technologies toward thermal comfort-based and energy-efficient HVAC
systems: A review. in 2009 IEEE International Conference on Systems, Man and Cybernetics. 2009.
26. Shin, E.-J., et al. Exploring fairness in participatory thermal comfort control in smart buildings. in
The 4th ACM International Conference on Systems for Energy-efficient Built Environments
(BuildSys 2017). 2017. Delft, The Netherlands: ACM.
27. Jazizadeh, F., et al., Human-Building Interaction Framework for Personalized Thermal Comfort-
Driven Systems in Office Buildings. Journal of Computing in Civil Engineering, 2014. 28(1): p. 2-
16.
28. Aryal, A. and B. Becerik-Gerber, A comparative study of predicting individual thermal sensation
and satisfaction using wrist-worn temperature sensor, thermal camera and ambient temperature
sensor. Building and Environment, 2019. 160: p. 106223.
29. U.S. Department of Energy. EnergyPlus. 2018 March 23 [cited 2019 02.28]; Available from:
https://energyplus.net/.
30. Davis, J.A. and D.W. Nutter, Occupancy diversity factors for common university building types.
Energy and Buildings, 2010. 42(9): p. 1543-1551.
31. Wang, D., C.C. Federspiel, and F. Rubinstein, Modeling occupancy in single person offices. Energy
and Buildings, 2005. 37(2): p. 121-126.
32. Yang, Z. and B. Becerik-Gerber, Modeling personalized occupancy profiles for representing long
term patterns by using ambient context. Building and Environment, 2014. 78: p. 23-35.
33. Bonte, M., F. Thellier, and B. Lartigue, Impact of occupant's actions on energy building
performance and thermal sensation. Energy and Buildings, 2014. 76: p. 219-227.
34. Daum, D., F. Haldi, and N. Morel, A personalized measure of thermal comfort for building controls.
Building and Environment, 2011. 46(1): p. 3-11.
35. Kim, J., et al., Personal comfort models: Predicting individuals' thermal preference using occupant
heating and cooling behavior and machine learning. Building and Environment, 2018. 129: p. 96-
106.
36. Ghahramani, A., C. Tang, and B. Becerik-Gerber, An online learning approach for quantifying
personalized thermal comfort via adaptive stochastic modeling. Building and Environment, 2015.
92: p. 86-96.
37. de Dear, R.J., et al., Developing an adaptive model of thermal comfort and preference / Discussion.
ASHRAE Transactions, 1998. 104: p. 145.
38. U.S. Department of Energy. Commercial Prototype Building Models. 2018 [cited 2019 06/27];
Available from: https://www.energycodes.gov/development/commercial/prototype_models.
39. Ghahramani, A., et al., Energy savings from temperature setpoints and deadband: Quantifying the
influence of building and system properties on savings. Applied Energy, 2016. 165: p. 930-942.
40. Ghasemi, A. and S. Zahediasl, Normality tests for statistical analysis: a guide for non-statisticians.
International journal of endocrinology and metabolism, 2012. 10(2): p. 486.
41. Purdon, S., et al. Model-free HVAC control using occupant feedback. in 38th Annual IEEE
Conference on Local Computer Networks - Workshops. 2013.
42. Ličina, V.F., et al., Development of the ASHRAE global thermal comfort database II. Building and
Environment, 2018. 142: p. 502-512.
43. Nikolopoulou, M. and K. Steemers, Thermal comfort and psychological adaptation as a guide for
designing urban spaces. Energy and Buildings, 2003. 35(1): p. 95-101.
44. Pritoni, M., J.M. Woolley, and M.P. Modera, Do occupancy-responsive learning thermostats save
energy? A field study in university residence halls. Energy and Buildings, 2016. 127: p. 469-478.

28
45. Wang, C., Y. Zhu, and X. Guo, Thermally responsive coating on building heating and cooling
energy efficiency and indoor comfort improvement. Applied Energy, 2019. 253: p. 113506.
46. Bianchini, G., et al., An integrated model predictive control approach for optimal HVAC and
energy storage operation in large-scale buildings. Applied energy, 2019. 240: p. 327-340.
47. Yin, R., et al., Quantifying flexibility of commercial and residential loads for demand response
using setpoint changes. Applied Energy, 2016. 177: p. 149-164.
48. Afzalan, M. and F. Jazizadeh, Residential loads flexibility potential for demand response using
energy consumption patterns and user segments. Applied Energy, 2019. 254: p. 113693.