energy self-reliant states - institute for local self-reliance
TRANSCRIPT

POLICY BRIEFNovember 2008
Energy Self-Reliant StatesHomegrown Renewable Power
JOHN [email protected]
Executive Summary
How much energy could be generated by states tapping into internal renewable resources? To date, no study has addressed this question comprehensively. This report is a first attempt to do so.
The data in this report, while preliminary, suggest that at least half of the fifty states could meet all their internal energy needs from renewable energy generated inside their borders, and the vast majority could meet a significant percentage. And these estimates may well be conservative.
A national renewable energy policy should reflect the unique distribution of these energy sources. Wind and solar and, to a lesser extent, biomass, can be found in abundance in virtually all parts of the country. A federal policy that focuses on harnessing local renewable resources for local markets could dramatically expand the number of communities and states economically benefiting from the use of renewable fuels while minimizing the transportation-related environmental impact of moving energy products long distances.
Yet current federal energy policy is largely focused on harnessing renewable energy in a few states and transporting it hundreds or even thousands of miles to customers in other states.
The rationale for this reliance on long distribution lines is that while renewable energy is widely distributed, the resources and cost of harnessing them vary widely state-by-state.
That is true. Agricultural states in the heartland can grow biomass in larger quantities and at a lower cost than states on the coasts. A state like Nevada has significantly more annual solar energy than Oregon. North Dakota’s high wind speeds translate into lower production costs.
However, while significant variations in renewable energy among states exist; in most cases, when transmission or transportation costs are taken into account, the net cost variations are quite modest. Homegrown energy is almost always cheaper than imports, especially when you factor in social, environmental and economic benefits.
Policies that encourage energy self-reliance at a state and even in many cases a local level could enable communities and regions to achieve economic and environmental goals simultaneously. It’s a win-win situation.
New Rules Project1313 5th St. SE, Suite 303Minneapolis, MN 55414
612-379-3815www.newrules.org
DAVID [email protected]
This report has been significantly updated and expanded. The new version is available at http://bit.ly/energyselfreliantstates

AcknowledgmentsThe authors would like to thank the researchers at the National Renewable Energy Laboratory and the Pacific Northwest National Lab for their excellent survey of wind and solar resources and Brooke Gullikson for helping to midwife this report and shepherd it out into the world.
Recent Publications Rural Power: Community-Scaled Renewable Energy and Rural Economic DevelopmentBy John Farrell and David Morris, August 2008
Balancing Budgets by Raising Depletion Taxes, by Justin Dahlheimer, June 2008
Concentrating Solar and Decentralized Power: Government Incentives Hinder Local Ownership, by John Farrell, May 2008
Driving Our Way to Energy Independence, by David Morris, April 2008
Broadening Wind Energy Ownership by Changing Federal Incentives, by John Farrell, April 2008
Ethanol and Land Use Changes, by David Morris, February 2008
Carbon Caps With Universal Dividends: Equitable, Ethical & Politically Effective Climate Policy, by John Bailey, January 2008
Minnesota Feed-In Tariff Could Lower Cost, Boost Renewables and Expand Local Ownership, by John Farrell, January 2008
Municipal Broadband: Demystifying Wireless and Fiber-Optic Options, by Christopher Mitchell, January 2008
The Policy Gap: Minnesota Energy Policy vs. Minnesota Climate Policy, by John Farrell, John Bailey and David Morris, November 2007
Big-Box Swindle: The True Cost of Mega-Retailers and the Fight for America’s Independent Businesses, by Stacy Mitchell, November 2007, Beacon Press
Burlington Telecom Case Study, by Christopher Mitchell, August 2007
Wind and Ethanol: Economies and Diseconomies of Scale, by John Farrell, July 2007
Since 1974, the Institute for Local Self-Reliance (ILSR) has worked with citizen groups, governments and private businesses to extract the maximum value from local resources.
A program of ILSR, the New Rules Project helps policy makers to design rules as if community matters. 2008 by the Institute for Local Self-Reliance. Permission is granted under a Creative Commons license to replicate and distribute this report freely for noncommercial purposes. To view a copy of this license, visit http://creativecommons.org/licenses/by-nc-nd/3.0/.
New Rules Project www.newrules.org 1

IntroductionRenewable energy is unique because it is available almost everywhere and in many cases, can most effectively be harnessed in distributed fashion. Nevertheless, federal policy unaccountably subsidizes and encourages the harnessing of renewable fuels in a few states and sending the energy long distances to customers in other states.
The rationale for this policy is that renewable energy should be harnessed for the least cost – where the wind blows most strongly and reliably, or the sun shines most often, or the soil is most productive.
If carried to its logical conclusion, this could result in a centralization of our power supply. Advocates of this policy, for example, note that sufficient solar radiation falls on just a section of Nevada to power the entire country. The two Dakotas have enough wind electricity potential to meet over 80% of U.S. annual electricity consumption. The agricultural heartland can grow crops less expensively, and in greater abundance, than coastal states.
This philosophy has led federal policy to focus on developing the means to transport electricity and transportation fuel generated from wind and sunlight and soil out of the middle and southwestern parts of the country to coastal markets. And this in turn leads to calls for a dramatic expansion of high voltage transmission grids and rail lines and terminals.
There is no question that the abundance and cost effectiveness of renewable energy does indeed vary from state to state. Nevada, for example, can produce solar electricity from photovoltaic panels for about 20 percent less than Iowa and about 35 percent less than Pittsburgh, PA.1 Iowa has thirty times the biomass resource of Nevada and could produce biofuel more cheaply. A typical North Dakota commercial wind turbine could produce electricity at a cost close to 30 percent less than an Ohio one. But in most cases, these significant variations result in modest variations in the cost of energy to the ultimate consumer because of the cost of transporting the energy.
For example, if Ohio’s electricity came from North Dakota wind farms – 1,000 miles away – the cost of constructing new transmission lines to carry that power and the electricity losses during transmission would surpass the lower cost of production, resulting in an electricity cost 15 percent higher than local generation with minimal transmission upgrades.2
State based renewable energy strategies can strengthen local and regional economies. States have clearly indicated their desire that renewable energy be harnessed within their borders and in most cases consumed by in-state businesses and households. For example, Minnesota enacted a Community-Based Energy Development statute that helps secure more locally owned wind power, and an ethanol producer payment that supports small-scale ethanol plants. Missouri has an incentive for locally owned biodiesel refineries and also provides a producer incentive for ethanol, but only if it is made from in-state agricultural products.3 Louisiana recently passed a biofuel law that prioritizes in-state production of “advanced biofuel” from Louisiana-grown feedstocks.4 Delaware requires its major utility to request proposals for new in-state generation.5
A handful of states do focus on renewable energy exports largely because their renewable energy production currently exceeds in-state demand. But in-state markets could expand as the country moves to higher proportions of renewable energy. For example, Minnesota exports almost two thirds of its in-state ethanol production. Much of it goes some 2,000 miles to California. This is because of a federally imposed 10 percent limit on the amount of ethanol Minnesota vehicles can use. If this limit were raised to 30 percent, all Minnesota ethanol could be consumed within the state. This would be attractive to Minnesota biorefineries because they could avoid the cost of transporting their product long distances. It would also be attractive to consumers, who would be less reliant on the vagaries of the international oil market.6
How much energy could be generated by states tapping into their own renewable resources? In this report we examine the potential for renewable electricity and transportation fuel. The report does not include the third leg of U.S. energy consumption – building heating. Thus, about 30 percent of a state’s energy use is not considered in this analysis.7
The data is preliminary and we hope others can refine and expand on it. But the data we have suggests an important conclusion: the majority of states could satisfy a significant amount of their internal electricity and transportation fuel needs from local resources and by tapping their human ingenuity. Indeed, as the report discusses, we believe current data may considerably understate the potential.
New Rules Project www.newrules.org 2
A Note on MethodologyThis report examines the potential for states to increase their generation of electricity from wind and rooftop solar photovoltaics (PV) and their production of cellulosic biofuels (primarily ethanol). In the case of wind and solar, the study likely underestimates the full potential of state generation, an issue explored further in the respective sections.
WindThe wind power data in this report is derived from the 1991 Pacific Northwest Laboratory (PNL) study, An Assessment of the Available Wind Land Area and Wind Energy Potential in the Contiguous United States.8 This study surveyed the available wind data measured at 30 meters (and extrapolated the data to 50 meters) in each of the lower 48 states. Land was excluded from wind energy development based on environmental limitations (park designations, etc) and various land uses (urban areas, wetlands, etc).
ILSR’s analysis used the “moderate” land exclusion estimates and also updated the 1991 study. Wind power density was estimated by extrapolation to 80 meters using the 1/7th power law. Power losses were reduced from 25% to 15%.9
We believe the resulting ILSR estimate may well considerably underestimate wind power potential for at least two reasons.
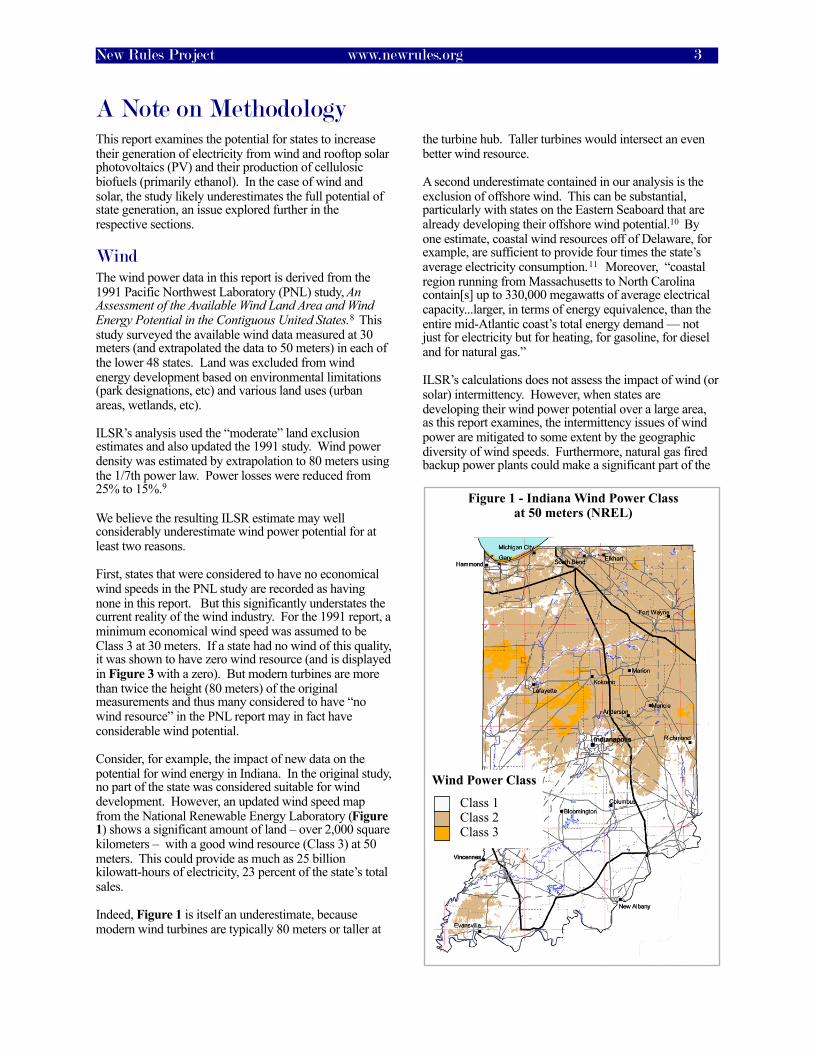
First, states that were considered to have no economical wind speeds in the PNL study are recorded as having none in this report. But this significantly understates the current reality of the wind industry. For the 1991 report, a minimum economical wind speed was assumed to be Class 3 at 30 meters. If a state had no wind of this quality, it was shown to have zero wind resource (and is displayed in Figure 3 with a zero). But modern turbines are more than twice the height (80 meters) of the original measurements and thus many considered to have “no wind resource” in the PNL report may in fact have considerable wind potential.
Consider, for example, the impact of new data on the potential for wind energy in Indiana. In the original study, no part of the state was considered suitable for wind development. However, an updated wind speed map from the National Renewable Energy Laboratory (Figure 1) shows a significant amount of land – over 2,000 square kilometers – with a good wind resource (Class 3) at 50 meters. This could provide as much as 25 billion kilowatt-hours of electricity, 23 percent of the state’s total sales.
Indeed, Figure 1 is itself an underestimate, because modern wind turbines are typically 80 meters or taller at
the turbine hub. Taller turbines would intersect an even better wind resource.
A second underestimate contained in our analysis is the exclusion of offshore wind. This can be substantial, particularly with states on the Eastern Seaboard that are already developing their offshore wind potential.10 By one estimate, coastal wind resources off of Delaware, for example, are sufficient to provide four times the state’s average electricity consumption.11 Moreover, “coastal region running from Massachusetts to North Carolina contain[s] up to 330,000 megawatts of average electrical capacity...larger, in terms of energy equivalence, than the entire mid-Atlantic coast’s total energy demand — not just for electricity but for heating, for gasoline, for diesel and for natural gas.”
ILSR’s calculations does not assess the impact of wind (or solar) intermittency. However, when states are developing their wind power potential over a large area, as this report examines, the intermittency issues of wind power are mitigated to some extent by the geographic diversity of wind speeds. Furthermore, natural gas fired backup power plants could make a significant part of the
New Rules Project www.newrules.org 3
Wind Power Class
Class 1Class 2Class 3
Figure 1 - Indiana Wind Power Class at 50 meters (NREL)

wind power “firm.”12 Finally, rapid advances are occurring in battery storage which, if massively deployed, could ameliorate the intermittency impact. (See below for discussion of electrified vehicles.)
SolarThe solar power data comes from a national estimate of rooftop solar PV potential in 2015 by Navigant Consulting.13 That report estimated total roof space available on residential and commercial buildings, taking into account shading, orientation, and structural adequacy. The report concluded that only 25 percent of residential rooftop space and 60 percent of commercial rooftop area are available for rooftop solar arrays.
For the solar modules, Navigant assumed a current efficiency of 13.5 percent, rising to 18.5 percent by 2015. The figures used in this report are the 2015 estimates, even though the Navigant data may be an overestimate of rooftop potential because the overall module efficiency of PVs is likely to be less than the 18.5 percent assumed in the report.
However, this overestimate of rooftop potential is dwarfed by the exclusion of many other sources of
solar electricity. For example, the report does not include installation options such as parking lot canopies or building facades. These could generate several times more electricity than rooftop arrays. The state of California, for example, did a solar resource assessment and found that while its rooftop potential was close to 38,000 megawatts (MW), its total PV potential was over 16 million MW – 400 times greater.14 And the California estimate still contained many land use and practical exclusions.15
The data also excludes the vast potential for in-state concentrating solar power (CSP), such as parabolic trough or power tower plants. The previously mentioned California study found a technical potential of 1,000 gigawatts (GW) of concentrating solar power in California. A study for the Western Governors’ Association identified over 200 GW of prime CSP potential within their states,16 enough to provide 1/6th of U.S. power needs, as well as several thousand GW of technically feasible development.17
Finally, this report does not examine other solar technologies that could displace electricity, for example, solar water heating or a greater use of natural light – day-lighting – in buildings.
New Rules Project www.newrules.org 4
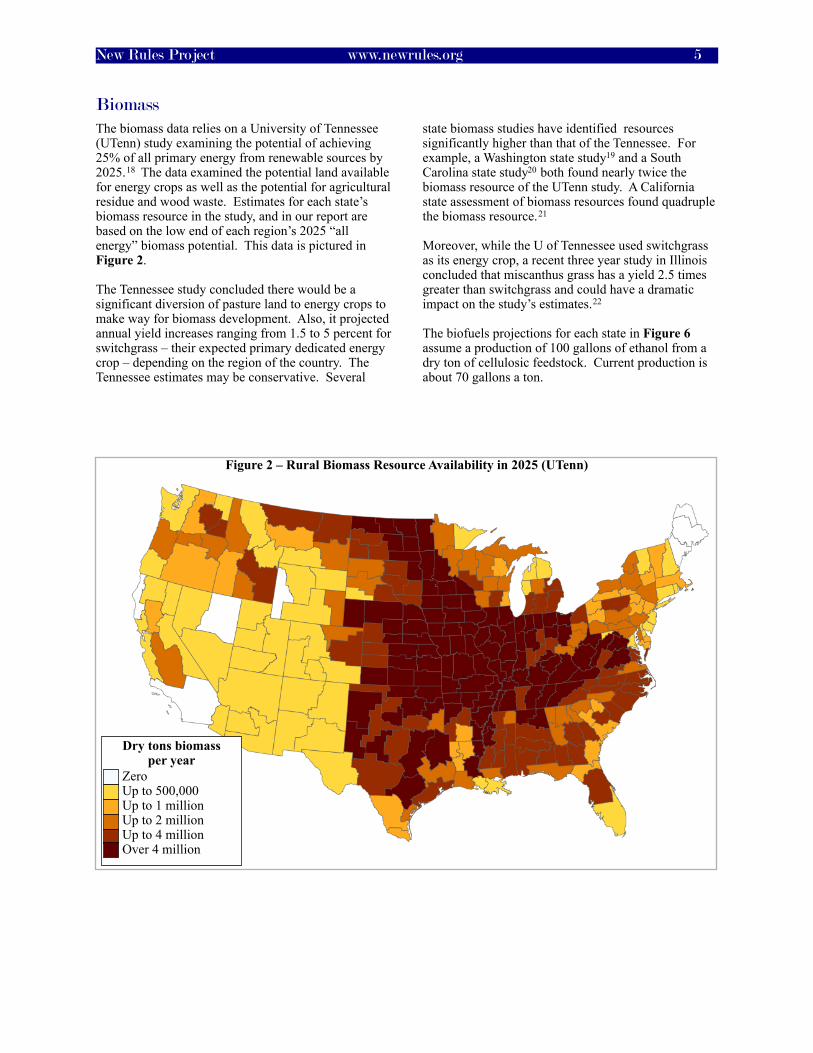
BiomassThe biomass data relies on a University of Tennessee (UTenn) study examining the potential of achieving 25% of all primary energy from renewable sources by 2025.18 The data examined the potential land available for energy crops as well as the potential for agricultural residue and wood waste. Estimates for each state’s biomass resource in the study, and in our report are based on the low end of each region’s 2025 “all energy” biomass potential. This data is pictured in Figure 2.
The Tennessee study concluded there would be a significant diversion of pasture land to energy crops to make way for biomass development. Also, it projected annual yield increases ranging from 1.5 to 5 percent for switchgrass – their expected primary dedicated energy crop – depending on the region of the country. The Tennessee estimates may be conservative. Several
state biomass studies have identified resources significantly higher than that of the Tennessee. For example, a Washington state study19 and a South Carolina state study20 both found nearly twice the biomass resource of the UTenn study. A California state assessment of biomass resources found quadruple the biomass resource.21
Moreover, while the U of Tennessee used switchgrass as its energy crop, a recent three year study in Illinois concluded that miscanthus grass has a yield 2.5 times greater than switchgrass and could have a dramatic impact on the study’s estimates.22
The biofuels projections for each state in Figure 6 assume a production of 100 gallons of ethanol from a dry ton of cellulosic feedstock. Current production is about 70 gallons a ton.
New Rules Project www.newrules.org 5
Figure 2 – Rural Biomass Resource Availability in 2025 (UTenn)
Dry tons biomassper year
ZeroUp to 500,000Up to 1 millionUp to 2 millionUp to 4 millionOver 4 million

Renewable Electricity PotentialWind Power
ILSR’s analysis reveals an impressive potential for electricity self-reliance from wind alone. As many as 17 states could match their entire 2007 electricity sales with wind power; 24 could meet at least half (if sufficient storage were provided).23 Figure 3 shows the self-reliance of each state based on its wind potential and its 2007 electricity sales.24
New Rules Project www.newrules.org 6
Figure 3 - Potential State Electricity Self-Reliance from Wind Power
0
0
1317%
3063%
8231%
6671300%
CT-720%
DE-220%
DC-0
0
21%
0
101425%
8557%
0
7631700%
14793650% 0
0
78660%
MD-46%
NJ-1518%
RI-116%
MA-3561%
VT-6111%
NH-654%
9183%
9091300%
0
7285%
140710,000%
12044250%70
196%
6032700%
8658%
108%
167614,000%
53%
10041800%
59121%
6241%
11%
142013,500%
22%
34121% 17
15%
4554%
721%
78110%1034
6700%
9091300%
Wind Potential (billion kWh)
Wind potential as a percent of electricity sales
Percent of Electricity that Wind Power Could Supply
0 to 10%10 to 25%25 to 50%50 to 100%100% or more
1650528%

Solar Power
By simply relying on rooftop solar photovoltaic (PV) panels, many states could satisfy a substantial portion of their electricity needs.
One state, California, could meet at least half its electricity demand solely with rooftop solar (and sufficient electricity storage). A majority of states could generate more than a quarter of their electricity from rooftop solar power.
Figure 4 illustrates the percent of each state’s 2007 electricity sales that could be met by rooftop solar PV.25
New Rules Project www.newrules.org 7
Figure 4 - Potential State Electricity Self-Reliance from Rooftop Solar PV
Percent of Electricity that Rooftop Solar PV Could Supply
0 to 10%10 to 25%25 to 50%50 to 100%
2426%
2.034%
3345%
1225%
13453%
2244%
CT-2244%
DE-328%
DC-326%
10144%
4835%
546%
627%
4430%
2623%
1126%
1128% 20
21%
2127%
431%
MD-2133%
NJ-1924%
RI-231%
MA-1730%
VT-230%
NH-432%
3532%
2130%
1328%
2225%
322%
724%
1649%
837%
3423%
4232%
322%
4528%
1629%
1429%
2818%
2126%
327%
3129%
11735%
1139% 36
33%
2529%
617%
2129%2
13%
2130%
Rooftop Solar PV Potential
(billion kWh)Solar potential as a percent of electricity sales

New Rules Project www.newrules.org 8
Figure 5 - Potential State Electricity Self-Reliance on Wind and Rooftop Solar PV
Percent of Electricity from Wind and Solar
0 to 10%10 to 25%25 to 50%50 to 100%100% or more
2426%
234%
4660%
4288%
21782%
6881350%
CT-1749%
DE-648%
DC-326%
10144%
5137%
546%
627%
107452%
2624%
7751700%
14903700% 20
22%
2127%
81700%
MD-2539%
NJ-3442%
RI-447%
MA-5291%
VT-8141%
NH-1086%
126115%
9291350%
1328%
94110%
141010,300%
12114300%
86242%
6112800%
12081%
5240%
167814,300%
5031%
10201850%
73151%
9059%
2227%
142313,500%
3331%
1770528%
44160%
5348%
7083%
1338%
99139%
10366700%
2130%
Wind+Solar Potential
(billion kWh)Wind+solar potential
as a percent of electricity sales

Combined Wind and Solar
Combining the solar rooftop PV resource potential with the previously mapped wind resources would allow 21 U.S. states to fully satisfy their electricity needs with renewable electricity (Figure 5); 30 states could generate at least half their electricity just from wind and solar rooftop generators.
New Rules Project www.newrules.org 9
Figure 6 - Potential State Transportation Fuel Self-Reliance on Corn and Cellulosic Ethanol
Potential Percent of Gasoline Displaced by Ethanol
0 to 25%25 to 50%50 to 100%100% or more
134051%
230285%
Potential corn + cellulosic ethanol
production (million gallons gasoline
equivalent)
Percent of gasoline consumption
0%
311%
2010138%
6514%
35717% CT-34
2%
DE-348%
DC0%
4025%
147429%
40264%
0%
289555%
213266%
3347202%
2296172% 1627
70%
90539%
23533%
MD-1686%
MA-672%
84217%
230285%
2144130%
251678%
46994%
2682306%
NH-13419%
0%
NJ-341%
879%
60310%
147433%
2553707%
161131%
187698%
60339%
73714%
RI0%
67026%
1537352%
165354%
243221%
676%
VT-6719%
147437%
63724%
80494%
105741%70
21%
Renewable Fuel PotentialTransportation fuel self-reliance is a greater challenge than renewable electricity self-reliance. Many states lack the agricultural land to grow crops like corn and soybeans that provide the foundation for current ethanol and biodiesel production.
But the nation is moving from the corn ethanol era to the cellulosic, and non-food crop, era. The 2007 Energy Act requires 36 billion gallons of biofuels by 2022, and more than 75 percent of the new production after 2008 will consist of what is called “advanced biofuels.” Cellulosic feedstocks, unlike conventional crops, will be grown to maximize overall mass and can be grown over a much wider area, giving more states the ability to nurture a homegrown biofuels industry. Figure 2 shows how much biomass could be cultivated by 2025.26 The biomass resources on this map include crop residues (e.g. corn leaves and stalks – “stover”), dedicated energy crops (switchgrass), forest residues, and mill wastes.
Assuming states convert all of their non-food biomass into biofuel and continue to produce corn ethanol at current levels, at least seven states could produce as much or more ethanol than their current demand for gasoline, on an energy equivalent basis (Figure 6). A further 11 states could meet at least half their current demand, and over half of all states could meet at least a quarter of their gasoline demand with cellulosic ethanol.
Cellulose can be converted into a product that can be upgraded to diesel, and of course, biodiesel substitutes for diesel. We did not examine the potential for diesel substitution. Gasoline accounts for about 80 percent of vehicle fuel use, so one can change the estimates used here accordingly to arrive at a percentage of total transportation fuel capable of being displaced with biofuels.
New Rules Project www.newrules.org 10
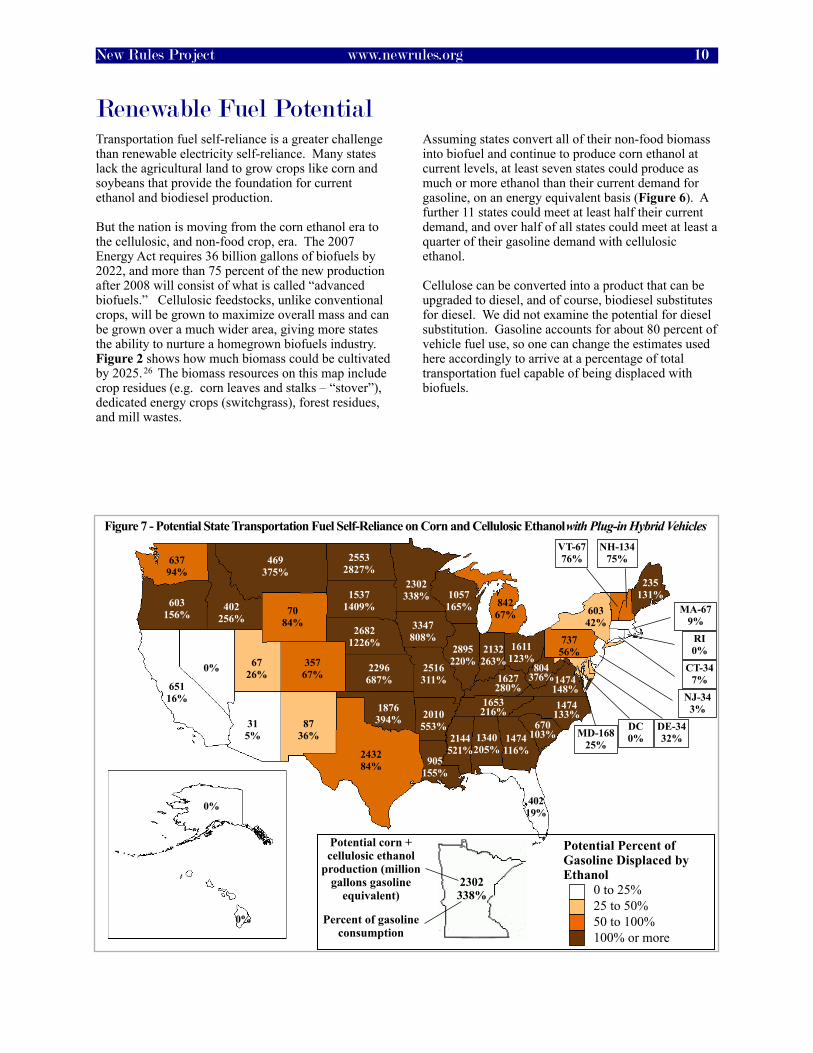
Figure 7 - Potential State Transportation Fuel Self-Reliance on Corn and Cellulosic Ethanol with Plug-in Hybrid Vehicles
Potential Percent of Gasoline Displaced by Ethanol
0 to 25%25 to 50%50 to 100%100% or more
1340205%
2302338%
Potential corn + cellulosic ethanol
production (million gallons gasoline
equivalent)
Percent of gasoline consumption
0%
315%
2010553%
65116%
35767% CT-34
7%
DE-3432%
DC0%
40219%
1474116%
402256%
0%
2895220%
2132263%
3347808%
2296687% 1627
280%
905155%
235131%
MD-16825%
MA-679%
84267%
2302338%
2144521%
2516311%
469375%
26821226%
NH-13475%
0%
NJ-343%
8736%
60342%
1474133%
25532827%
1611123%
1876394%
603156%
73756%
RI0%
670103%
15371409%
1653216%
243284%
6726%
VT-6776%
1474148%
63794%
804376%
1057165%70
84%
Marrying Electricity and TransportationSo far in this report, we have assumed that the electric sector and the transportation sector do not overlap. However, there is growing interest in electric hybrid and all-electric vehicles in the United States by major car companies and federal and state policy makers.
ILSR has elaborated the argument for electrified vehicles elsewhere.27 In brief, electric vehicles are more efficient than gasoline powered vehicles. Electricity is a virtually oil free transportation fuel. And the battery storage of electrified vehicles can help overcome the Achilles heel of renewable electricity generation – intermittency.
For the foreseeable future, electric vehicles will largely be sold with a liquid fuel backup engine, but drivers with the capability of using electricity will try to maximize its use because the fuel cost of driving on electricity is about 3 cents per mile while the fuel cost of driving on gasoline is about 15 cents per mile.
Urban drivers will use electricity to power a much greater percentage of their vehicle’s miles than would rural motorists. Overall, we might assume that with a 40 mile electric only driving range, electricity would account for 75 percent of all miles driven.
The widespread introduction of electrified vehicles would affect this report’s conclusions regarding electricity and transportation fuels in two respects.
First, the amount of electricity needed by each state would rise by 10-25 percent, but this would not significantly change our maps.28 As noted above, state capacity for electricity self-reliance is widespread, and the built-in underestimates mean that the increased need for electricity is likely accounted for by undercounting native resources.
Second, since the backup engine will power only 25 percent or so of the vehicle’s driving, the amount of biomass and biofuel needed drops dramatically, leading to a significant redrawing of the state-by-state map.
Figure 7 shows the redrawn map of state biofuel production potential, based on the full adoption of plug-in hybrid vehicles and 75 percent of car miles powered by electricity. Twenty-seven states could now be self-reliant in vehicle fuel, producing enough biomass-derived biofuel to supply a fleet of plug-in hybrid vehicles.
ImplicationsThe potential is clear – most states can be energy independent by relying on their homegrown, renewable resources. At least twenty-one could satisfy 100 percent of their electricity needs from in-state renewable energy. At least seventeen could satisfy 50 percent of their gasoline demand with domestic biofuels. If electricity becomes a major transportation fuel, twenty-seven states could meet their entire demand for automobile fuel with renewable biofuel.
This report’s estimates may be considered very conservative, since it does not consider non-rooftop solar or offshore wind. Moreover, it doesn’t examine other potentially significant renewable electricity sources. The U.S. Geological Survey, for example, issued a recent report that found Alaska, Hawaii, and 11 western states could generate more electricity from in-state, high temperature geothermal than they use.29 Low-temperature geothermal – a significant potential source of building climate control available everywhere, which could lead to a reduction in electricity use for air conditioning, for example – has scarcely been tapped. Micro-hydro can also contribute significant additional amounts of electricity.30
In other words, by tapping into human ingenuity, states and many countries can approach energy self-sufficiency. As noted in the beginning of this report, states have been the driving force behind renewable energy developments, largely because they correctly view these as economic development initiatives. In the next 20 years, the United
States may invest up to $1 trillion in new renewable energy projects. To date, the federal government is providing incentives that favor large scale and centralized renewable energy projects and that demand long distance transportation of the energy product. But in most cases, the implementation of these projects will be dependent on state acquiescence.
As the data in this report suggests, states would do well to look inward for their energy security. This strategy can yield profound economic and social benefits. Widely dispersed energy production can be the basis for a resilient energy system where a branch falling on an electric line in
New Rules Project www.newrules.org 11
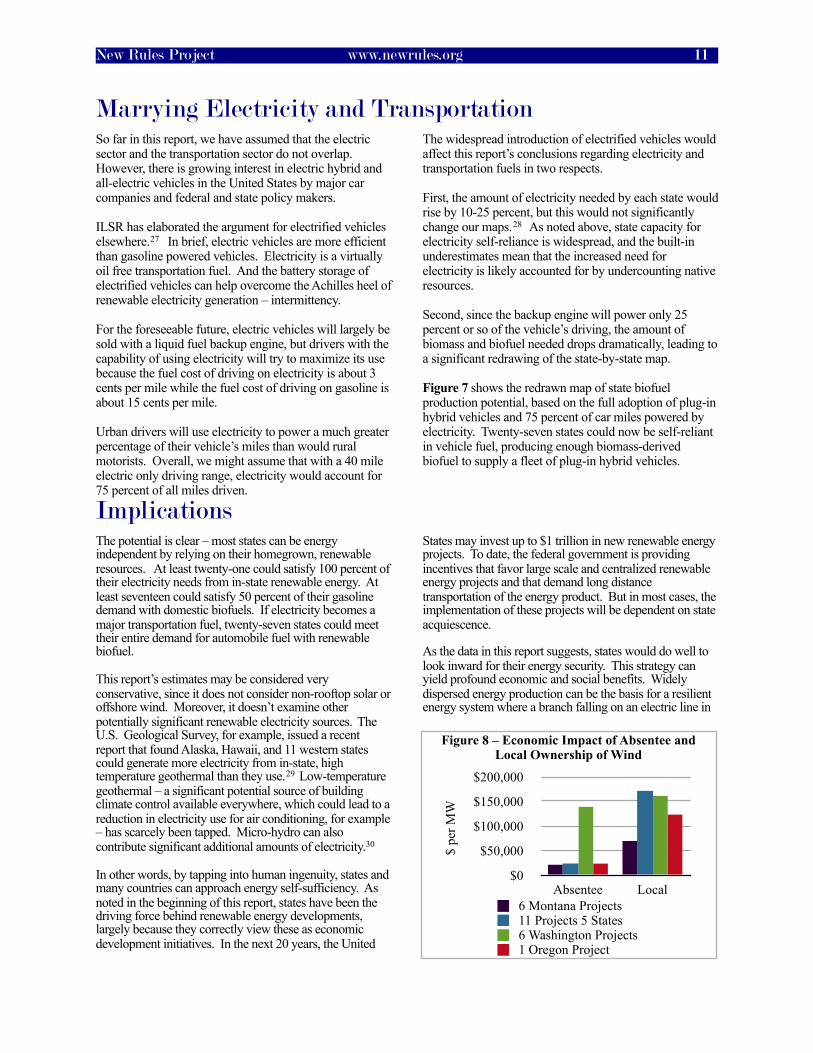
$0
$50,000
$100,000
$150,000
$200,000
Absentee Local
$ pe
r MW
Figure 8 – Economic Impact of Absentee and Local Ownership of Wind
6 Montana Projects 11 Projects 5 States 6 Washington Projects 1 Oregon Project

Ohio does not result in a 12-state blackout as happened in 2003, and where Georgia motorists do not have to wait for hours in line to get gasoline because a hurricane in the Gulf of Mexico disrupted a major oil pipeline.
The principle of decentralization that argues for states to pursue a policy of domestic energy self-reliance also applies to in-state energy policy. Large states should look to distribute energy production facilities as widely as possible.
Some might argue that bigger is better within a state. Previous reports by ILSR have examined the economies of scale of renewable energy production and found that they are modest and largely or totally disappear when one takes into account the cost of transporting the energy product long distances to the final customer.31
Renewable energy should be used as close as possible to where it is generated. Small scale, distributed energy facilities also lend themselves to local ownership. As other reports by ILSR have concluded, the economic benefit to a community and a state is much higher when there is local ownership than when facilities are owned by absentees (Figure 8).32
Local ownership has another benefit. It confers a greater sense of responsibility and self-reliance on the project
owners than a similar project where local residents are just observers.33
Looking inward for our energy solutions may require different federal and state energy policies. For example, currently much of the focus is on building more high voltage transmission lines to enable the export of renewable electricity from a handful of states. A better strategy, at least for the next decade, would be to focus on using existing transmission and subtransmission and distribution lines more efficiently so that additional distributed electricity can be built without the need for substantial investments in new lines.
Similarly, much focus currently is put on beefing up the railroad infrastructure to accommodate the increased production of ethanol from a handful of states. A better strategy would be to raise the percentage of biofuels vehicles are allowed to use, thereby creating in-state markets for those states currently in surplus in biofuels production, and to encourage the development of thousands of smaller biorefineries located in a majority of America’s rural counties. The data are clear. Most states have substantial renewable energy resources. Many states can be self-sufficient on renewable energy All states could benefit from policies that encourage local ownership and control of renewable energy development.
ReferencesPhoto CreditsPage 4: Ascension Technology, Inc., NREL PIXPage 6: Energy Northwest, NREL PIX Page 7: groSolar, NREL PIX
New Rules Project www.newrules.org 12
1 PVWatts, Version 1. (National Renewable Energy Laboratory). Accessed 9/18/08 at http://tinyurl.com/529yq6.
2 Transmission construction costs based on 10,000 MW wind farms connected with new transmission to the Ohio market. Estimates based on: Pattanariyankool, Sompop and Lester B. Lave. "Optimizing Transmission from Distant Wind Farms." (Carnegie Mellon University, Electricity Industry Center, Working Paper CEIC-08-05). Accessed 6/11/08 at http://tinyurl.com/4cwlhu.
Line and conversion losses from the following: Factor, Tom and Tom Wind. “Delivering 2,000 MW of Wind Energy to the Metropolitan Centers in the Midwest.” (Iowa DNR, March 2002).
3 “Missouri Incentives and Laws.” (State and Federal Incentives and Laws, Alternative Fuels and Advanced Vehicles Data Center, U.S. Department of Energy). Accessed 9/24/08 at http://tinyurl.com/3wloqv.
4 “Louisiana Incentives and Laws.” (State and Federal Incentives and Laws, Alternative Fuels and Advanced Vehicles Data Center, U.S. Department of Energy). Accessed 9/24/08 at http://tinyurl.com/49jkyk.
5 “House Bill 6.” Enacted 2006. Accessed 9/24/08 at http://tinyurl.com/3g8qum.
6 For more on the diseconomies of long distance transportation see Farrell, John, “Wind and Ethanol: Economies and Diseconomies of Scale,” (ILSR, July 2007).
7 “U.S. Primary Energy Consumption by Source and Sector, 2007.” Annual Energy Review. (Energy Information Administration, 6/23/08). Accessed 9/23/08 at http://tinyurl.com/3kdhe6.
8 Elliot, D.L., et al. “An Assessment of the Available Wind Land Area and Wind Energy Potential in the Contiguous United States.” (Pacific Northwest Laboratory, August 1991). Accessed 9/18/08 at http://tinyurl.com/3obebz.
9 Based on a conversation with the PNL author Marc Schwartz about modern turbine efficiency, Sept. 2008.

New Rules Project www.newrules.org 13
10 “Investing in Offshore Wind Farms in the United States.” (Triplepundit blog post, 10/8/08). Accessed 10/8/08 at http://tinyurl.com/4rx6u2.
11 Svenvold, Mark. “Wind-Power Politics.” (New York Times, 9/12/08). Accessed 9/23/08 at http://tinyurl.com/4anayp.
12 Firm power is the most reliable type for an electric utility.
13 Paidipati, Jay, et al. "Rooftop Photovoltaics Market Penetration Scenarios." (Navigant Consulting, Inc., for NREL: February 2008). Accessed 8/13/08 at http://tinyurl.com/6qplow.
14 Simons, George and Joe McCabe. "California Solar Resources." (California Energy Commission, April 2005). Accessed 10/16/08 at http://tinyurl.com/yqqxo9.
15 From Simons: The technical potential of solar PV in California excludes “solar resources over large bodies of water or located in pristine areas of the state are assumed to be unavailable for use. Other areas excluded from the technical potential include forests (due to shading), agricultural lands, reserves, parks, areas with sensitive habitats (e.g., coastal sage scrub, wetlands, coastal zone and riparian management areas), and regions with north slopes greater than five percent.”
16 Primarily in California, New Mexico, Arizona, and Nevada.
17 “Clean and Diversified Energy Initiative.” (Solar Task Force Report, Western Governors Association; January 2006). Accessed 9/24/08 at http://tinyurl.com/5vcbdm.
18 English, Burton C., et al. “25% Renewable Energy for the United States by 2025: Agricultural and Economic Impacts.” (UTenn, November 2006).
19 “Biomass Inventory and Bioenergy Assessment.” (Washington State Dept. of Ecology and Washington State University, December 2005).
20 Harris, Robert A., et al. “Potential for Biomass Energy Development in South Carolina.” (South Carolina Forestry Commission, undated).
21 “Biomass Resource Assessment in California.” (California Biomass Collaborative for the California Energy Commission, April 2005).
22 Pyter, Rich, et al. “Giant Miscanthus: Biomass Crop for Illinois .” (Issues in new crops and new uses, 2007). Accessed 10/8/08 at http://tinyurl.com/3f7y92.
23 “Historical 1990 through Current Month Retail Sales, Revenues, and Average Retail Price of Electricity by State and by Sector.” (Energy Information Administration, 2008). Accessed 10/24/08 at http://tinyurl.com/6oouwp.
24 Wind potential data drawn from “An Assessment of the Available Windy Land Area and Wind Energy Potential in the Contiguous United States.” (Pacific Northwest Laboratory, 1991). The data was adjusted for taller turbine towers (80 meter hub height instead of 50 meters) and lower losses from modern wind farms (15% instead of 25%).
Electricity sales data collected from the Energy Information Administration, 2008.
25 Paidipati.
26 English, Burton C., et al.
27 Morris, David. “Driving Our Way to Energy Independence.” (ILSR, April 2008), 14. http://tinyurl.com/6rddhz
28 Morris.
29 "Assessment of Moderate- and High-Temperature Geothermal Resources of the United States." (USGS, 2008). Accessed 10/2/08 at http://tinyurl.com/3pbtlw.
30 See “State Resource Assessment Reports.” (Idaho National Laboratory, 1995-97). Accessed 10/27/08 at http://tinyurl.com/6frdvh.
31 Farrell, John and David Morris. “Rural Power: Community-Scaled Renewable Energy and Rural Economic Development.” (ILSR, August 2008).
32 Farrell, John and David Morris.
33 Farrell, John and David Morris.