energy storage roadmap reportenergysystemsnetwork.com/wp...energystorageroadmap... · 2 energy...
TRANSCRIPT
Energy StorageRoadmap Report
ENERGY STORAGE ROADMAP REPORTB
OWNERSHIP RIGHTSAll reports are owned by Energy Systems Network (ESN) and protected
by United States copyright and international copyright/intellectual
property laws under applicable treaties and/or conventions. User agrees
not to export any report into a country that does not have copyright/
intellectual property laws that will protect ESN’s rights therein.
GRANT OF LICENSE RIGHTSESN hereby grants user a non-exclusive, non-refundable, non-
transferable Enterprise License, which allows you to (i) distribute
the report within your organization across multiple locations to its
representatives, employees or agents who are authorized by the
organization to view the report in support of the organization’s internal
business purposes; and (ii) display the report within your organization’s
privately hosted internal intranet in support of your organization’s
internal business purposes. Your right to distribute the report under
an Enterprise License allows distribution among multiple locations or
facilities to Authorized Users within your organization.
ESN retains exclusive and sole ownership of this report. User agrees not
to permit any unauthorized use, reproduction, distribution, publication
or electronic transmission of any report or the information/forecasts
therein without the express written permission of ESN.
DISCLAIMER OF WARRANTY AND LIABILITYESN has used its best efforts in collecting and preparing each
report. ESN, its employees, affiliates, agents, and licensors do not
warrant the accuracy, completeness, correctness, non-infringement,
merchantability, or fitness for a particular purpose of any reports
covered by this agreement. ESN, its employees, affiliates, agents, or
licensors shall not be liable to user or any third party for losses or injury
caused in whole or part by our negligence or contingencies beyond
ESN’s control in compiling, preparing or disseminating any report or for
any decision made or action taken by user or any third party in reliance
on such information or for any consequential, special, indirect or
similar damages, even if ESN was advised of the possibility of the same.
User agrees that the liability of ESN, its employees, affiliates, agents
and licensors, if any, arising out of any kind of legal claim (whether in
contract, tort or otherwise) in connection with its goods/services under
this agreement shall not exceed the amount you paid to ESN for use of
the report in question.
© 2017 Energy Systems Network. All rights reserved.

1ABOUT ENERGY SYSTEMS NETWORK/ABOUT THE ANALYSTS
ENERGY SYSTEMS NETWORK: BUILDING AN ENERGY ECOSYSTEM®
Energy Systems Network (ESN) is a non-profit organization focused on growing the advanced
energy technology sector. ESN is building an energy ecosystem that integrates all aspects of
the energy landscape: energy generation, distribution, the built environment, and transportation.
We leverage our network of Fortune 500 and global companies, academia, national research
laboratories, and other non-profits to develop integrated energy solutions to increase quality
of life for today and tomorrow. Our collective focus is to: reduce costs, emissions and waste;
influence policy; and advance technological innovation.
ESN and our network of subject matter experts have decades of experience in energy storage
technologies. We have worked on a wide range of projects that include energy storage applications
for transportation and the electric grid. ESN led the formation and launch of the Battery Innovation
Center (BIC) – a $20 million R&D and prototype manufacturing facility – which aims to accelerate
the advanced energy storage market by linking manufacturers, government agencies and research
labs, and academia. The BIC also is home to Underwriters Laboratories’ (UL) Battery & Energy
Storage Technology (BEST) Test Center, UL’s North American testing and validation center.
For more information, contact [email protected].
PAUL J. MITCHELL, PRESIDENT AND CEO, ENERGY SYSTEMS NETWORKPaul has been President and CEO of Energy Systems Network (ESN) since just after
ESN's launch in 2009. During his tenure with ESN, Paul has led the organization to lead
collaborative projects, offer consulting services, and provide strategic planning efforts
for its partner organizations.
Prior to joining ESN, Mr. Mitchell served in the Office of Governor Mitch Daniels where he was
Policy Director for Economic Development, Workforce and Energy. In this capacity, he oversaw
legislation, policy, and program development for the Indiana Economic Development Corporation,
Indiana Department of Workforce Development, and Indiana Department of Labor, and acted as
Governor’s liaison to the Indiana Utility Regulatory Commission and Office of Utility Consumer
Counselor. During his tenure with the Governor’s Office, Mr. Mitchell also led the formation of and
directed the Indiana Office of Federal Grants and Procurement.
A native of West Lafayette, Ind., he holds a Master of Public Affairs from the Indiana University
School of Public and Environmental Affairs (SPEA) in Bloomington, Ind. where he graduated
as valedictorian.
A B O U T E N E RG Y S Y S T E M S N E T W O R K
A B O U T T H E A N A LY S T S
2 ENERGY STORAGE ROADMAP REPORT
JOHN E. WATERS, CTO, ENERGY SYSTEMS NETWORK John is the Chief Technology Officer at ESN and has over 25 years’ experience in energy
storage research, design, building, testing, producing, and warranty of energy storage
systems. Having invented the first battery packs for electric vehicles (General Motors),
John has also led global initiatives in integrating energy storage to the electrical grid –
inside the automotive vehicle or outside the vehicle. He has deep knowledge of various lithium
battery formulations, performance capabilities, supply chain and product portfolios, having led the
first-in-the-U.S. large-format lithium battery production at Delphi and EnerDel.
While at the Rocky Mountain Institute, John initiated the (battery) vehicle-to-grid (V2G) thesis with
Google and Pacific Gas & Electric (2006) and eventually launched a V2G plug-in automotive OEM with
strategic support from Alcoa, Coca-Cola, Cox Enterprises, Duke Energy, Google, and Johnson Controls.
As an energy storage industry expert, John has provided global insights to multiple corporations
including 3M, Alcoa, A.T. Kearney, Boston Consulting Group, Booze & Co., GE, Goldman-Sachs,
and the United Nations. He has nine U.S. and international patents, holds two defensive papers in
battery pack designs, and has received numerous industry awards. He is a graduate of the University
of Arkansas with a Bachelor of Science in Mechanical Engineering and a member of Pi Tau Sigma
Mechanical Engineering Honorary Society.
CONTRIBUTORSDAN ESPOSITODan currently serves as an Analyst at the Indiana Office of Utility Consumer Counselor. He earned
his Master of Public Affairs and Master of Science in Environmental Science at Indiana University’s
SPEA in Bloomington, Ind. in 2016, where he focused on energy policy. Previously, he earned his
Bachelor of Science in Physics and Mathematics at the University of Dayton in 2014.
During his time at Indiana University, Dan provided research support for a forthcoming report
providing recommendations for the midterm reviews of the federal Corporate Average Fuel
Economy (CAFE) standards and the California Zero Emission Vehicles program. Dan worked at the
White House Council on Environmental Quality to assist with the Obama Administration’s Mid-
Century Strategy for Deep Decarbonization. Dan also worked as a Verification Associate at the
Center for Resource Solutions as part of its Green-e Energy certification program.
DAVID MICHAELDavid has 15 years’ experience as an analytical chemist working in research and development. He
is currently a graduate student in the SPEA at Indiana University pursuing a dual masters’ degree in
chemistry and environmental science, with a focus on the science and economics of energy. Prior to
working for ESN, David worked for Dr. John Graham, Dean of IU SPEA, and Professor Sanya Carley
as a research associate examining the supply chain of lithium-ion batteries and the economic impacts
of CAFE standards on the U.S. economy (A Macroeconomic Study of Federal and State Automotive Regulation, March 2017).
3TABLE OF CONTENTS
3 Table of Contents 4 List of Figures 4 List of Tables
5 Report Background
6 Primer: A Technology Roadmap 6 Battery Types 12 Power Density and Energy Density 14 Cycle Life 16 Balance-of-System 20 Applications
26 Primer: Economics of Energy Storage 26 Drivers of Battery Prices 27 Battery System Cost Breakdown 28 Market Maturity of Energy Storage Cost Components 30 Battery Pricing Analysis and Forecasts 36 Economical Applications of Energy Storage 39 Measuring the Value of Storage Compared to Alternatives
43 Primer: Policy and Regulatory Implications 44 Federal Policy 46 Independent System Operators and Regional Transmission Organizations 49 State Policy 52 Safety and Technical Standards
54 Energy Systems Network Insights
67 Appendix
77 Endnotes
TA B L E O F C O N T E N T S

4 ENERGY STORAGE ROADMAP REPORT
LIST OF FIGURESFigure 1: Sample Ragone Chart
Figure 2: Battery Performance by Weight
and Volume
Figure 3: Balance-of-System
Figure 4: Battery Pack Price Forecasts by
Industry Market Study, 2010-2025
Figure 5: ESN Price Forecast for Full Battery
Systems, 2010-2025
Figure 6: Comparison of Industry and ESN
Battery Pack Price Forecasts,
2010-2025
Figure 7: Price Comparison of Stationary and
Automotive Energy Storage Systems
– 2017
Figure 8: Installed Energy Storage
Applications by Chemistry
Figure 9: U.S. Energy Storage Activity by
ISO/RTO
Figure 10: Installed Energy Storage
Applications by ISO/RTO
Figure 11: Energy Storage Activity by State
LIST OF TABLESTable 1: Battery Chemistry Comparisons
Table 2: Average Pricing for Stationary Energy
Storage Systems – 2017
Table 3: Levelized Cost of Storage Ranges
by Chemistry

5REPORT BACKGROUND
T he term “energy storage” is becoming more
ingrained in the global vernacular. From
first world nations to developing nations, the
common energy consumer is discovering – and
capitalizing on – the emerging value proposition
of energy storage: the battery.
Historically, the vast electrical grid with
its centralized power plants has provided
excessive electricity to industry, communities,
and homes, otherwise referred to as the built
environment. The grid has been used to convey
an ample supply of electrons to all the “nodes”
of demand that tap into the grid and require
electrical power for lighting lights, pressing
metal, cooking, or cooling food.
The centralized power plant typically uses a
fuel (e.g., coal, natural gas, etc.) for a variety of
functions: to heat water, make steam, turn an
electric turbine generator, generate electrons,
and ship those electrons on copper cables to
substations and the like, to eventually be used
by individuals for powering devices like light
bulbs and ovens.
The centralized power plant and grid strategy
is to maintain a large “base load” of power
and add in flexible power sources for peak
use of the grid, such as a natural gas “peaker
plant.” Historically, the base load and peaker
plant strategy works well, as the dynamics of
energy supply and demand can be tolerated
with massive infrastructures that absorb the
nuances of power supply and demand conveyed
by the grid.
With the advent and growth of renewable
but intermittent energy sources (e.g., solar
R E P O RT B AC KG RO U N D
and wind), and the increased focus on energy
efficiency and smart grid, the need for energy
storage as a means of stabilizing 24-hour
energy supply has come to the forefront of the
energy conversation and strategy.
The Energy Storage Roadmap Report aims to
provide comprehensive research, technical and
trend data with expert opinion to answer the
following questions:
• Will improvements in energy storage continue to drive performance and price per kWh down, and at what point will it reach parity with existing technology options?
• What market adjustments are required to allow energy storage systems, which can be both a load and a generation resource, to contribute their full benefits to the grid?
• How should energy storage projects be financed (e.g., rate base, independent power producers, etc.)?
• What role will public utility commissions (PUCs) need to play in developing policies or approving projects?
• How can utility providers create new revenue streams and business models using energy storage systems?
In order to comprehensively and uniquely
answer questions like these, ESN has performed
extensive research; reviewed professional
research materials, market forecasts, and other
data; interviewed experts; and established
essential criteria for scenario planning of the
economic implementation of energy storage to
the built environment.
6 ENERGY STORAGE ROADMAP REPORT
P R I M E R : A T E C H N O LO G Y ROA D M A P
T he purpose of this section is to educate
the reader on technology, terms, and
performance criteria of various energy storage
systems. A comparison matrix has been
developed and can be reviewed in Table 1. A
glossary of terms has been provided in Appendix A.
It is important to note that the battery industry
has a vast and historical reputation for
ambiguous or misleading product performance
claims. Confusion is often created by early
scientific discoveries that have not been
fully matured into products, yet the claims
are made public. The publicity of battery
“inventions” or “discoveries” often motivate
established battery producers to respond in
their marketing materials or public claims and
address improvements in safety, power, energy,
cycle life, and the like. This public confusion
in the battery industry causes experienced
financial analysts, scientists, customers, and
engineers to be wary of published materials
and “breakthrough” battery claims.
Historically, the most recent battery
technologies to hit the automotive market
over the past three decades (e.g., VRLA,
NiMH, Li-ion) have roughly been 10-year,
$100 million high-risk ventures into an
undetermined market. It is helpful to evaluate
all “headlines of future batteries” from this
perspective and interpret the “breakthrough
technology” future, its timing, and investment
in the context of battery investment history.
BATTERY TYPESA battery is a cell or connected group of cells
that converts chemical energy into electrical
energy by reversible chemical reactions and that
may be recharged by passing a current through
it in the direction opposite to that of its discharge
– also called a storage cell. There are a variety
of chemistry types that have varying levels of
energy density, power density, costs, and cycle
life all applying to a variety of applications in the
energy marketplace. In this section, an overview
of each of the major chemistries follows.
LEAD ACID
The most prolific battery type in history,
referred to as lead acid (PbA), was invented in
1859 by French physicist Gaston Planté and
is also the oldest type of rechargeable battery.
Despite having a relatively poor energy density
(50 watt-hours per kilogram, or 50 Wh/kg),
PbA does have an ability to supply high surge
currents and have a relatively large power-to-
weight ratio. These features, along with their
low cost, makes PbA the battery of choice for
“starting, lighting, ignition” (SLI) batteries for
automotive vehicles.
Inexpensive compared to newer technologies,
PbA batteries are widely used when weight
and volume are not important or essential
requirements. Large-format lead acid designs
are commonly used for storage in backup
power supplies (i.e., UPS) in cell phone towers,
data centers, hospitals, and stand-alone
power systems.
Since PbA batteries have literally started the
internal combustion engine (ICE) on every car
since the 1912 Cadillac (first implemented and
attributed to inventor Charles F. Kettering),
there exists over 100 years of statistical data on
the performance of PbA from the automotive
industry. Paramount in its discovery, two-year
7PRIMER: A TECHNOLOGY ROADMAP
warranty claims for PbA SLI batteries were
the highest in hot-weather regions, indicating
higher temperatures (i.e., above 100°F/38°C)
have detrimental effects on PbA battery life
(e.g., voltage drop and capacity fade).
When General Motors (GM) began its
electric car development efforts in the early
1990s, it quickly realized that a better PbA
technology must be developed, and in parallel
with significant investment in other advanced
battery types (e.g., nickel metal hydride, lithium
ion). Gel-cells and absorbent glass-matte
(AGM) batteries were successfully developed
by GM and originally referred to as valve-
regulated lead acid (VRLA) batteries. First
introduced to the global automotive sector on
GM’s EV1 electric car program, Delco Remy’s
VRLA batteries delivered a 30 percent increase
in energy density and a doubling of cycle life
PBA BATTERY SALES
Today, it is estimated that PbA battery
sales account for 40-45 percent of
batteries sold worldwide (excluding
China and Russia), and have a
manufacturing market value of about
$15 billion (today the majority of all-
electric scooters and bicycles in China
are powered by PbA technology).
Market Valueof Batteries Sold
$15B
over previous “maintenance-free” flooded
battery types (also invented by Delco Remy and
attributed to William B. Wylam).
NICKEL METAL HYDRIDE
Invented in 1967 and often abbreviated as
NiMH (less often as “NMH”) batteries, NiMH
began at the Battelle-Geneva Research Center.
Daimler-Benz and Volkswagen AG sponsored a
NiMH development over a 20-year period. The
early NiMH batteries' specific energy reached
50 Wh/kg (180 kJ/kg), power density up to
1,000 W/kg, and a life of 500 charge cycles
(at 100 percent depth of discharge). Patent
applications were filed in European countries
(Switzerland), the United States, and Japan.
The patents transferred to Daimler-Benz.
Interest grew in the 1970s with the
commercialization of the NiMH batteries for
satellite applications. The first consumer-grade
NiMH cells became commercially available
in 1989. In the early 1990s, GM purchased
a controlling stake in the Ovonic Battery
Company, which had improved the (Ti–Ni) alloy
structure of the battery cell and received a
patent for its innovations.
Mainly due to the wildly successful Toyota Prius
hybrid electric vehicle (HEV) platform, more
than two million hybrid cars worldwide were
manufactured with NiMH batteries by 2008.1
NiMH batteries have superior power and energy
densities over PbA battery types (see Table 1).
The first NiMH battery packs were introduced
to GM’s EV1 owners in approximately 1996
for purchase or upgrade to their PbA original
battery packs. NiMH had capabilities of doubling
the range of its PbA counterpart (i.e., from 100
miles per charge to 200 miles per charge). GM’s
initial NiMH battery packs had an internal cost

8 ENERGY STORAGE ROADMAP REPORT
over three times the retail price of the EV1
vehicle. However, with production scaling and
commodity stabilization of Nickel, the NiMH
advanced battery solution could be brought
in line with an expanding market in electric
vehicles (EVs). Unfortunately, as documented in
the award-winning film “Who Killed the Electric
Car,” the electric vehicle market was crushed by
the OEMs who publicly blamed expensive and
limited advanced batteries for lack of customer
adoption.2 History has proven that Toyota was
very successful in its scaling of NiMH batteries
for its Prius program(s), and additional
HEV platforms.
With its moderate energy density, power
density and cycle life capabilities, the NiMH
battery has been fundamentally replaced with
lithium ion in most automotive applications
where range (deep cycling) and (10-year)
warranty are internal drivers to OEMs (e.g.,
plug-in electric vehicles, PHEVs, or EVs).
Table 1: Battery Chemistry Comparisons
Lithium Battery Type
LCO LMO (spinel) LCA NCM LFP LTO
Nominal Voltage
3.6 3.7-3.8 3.65 3.7 3.2 2.7
Operating Temperature (C)
0-55 0-55 -20-55 0-55 0-55 -40-55
Charge/Discharge (C-rate cont.)
1C (limit) 5C 2C 5C 10C 30C
Specific Energy (Wh/kg)
170-190 140-180 200 130-150 90-130 70
Cycle Life Energy (100% Depth-of-Discharge )
500 1000-2000 3500 2000+ 3000+ 15000+
ApplicationsCell phone,
laptops, camerasCell phone,
laptops, camerasAutomotive - EV/
PHEVAutomotive - EV/
PHEVPower tools,
HEV, PHEV, GridPower tools,
HEV, Grid
Safety poor good poor good excellent excellent
Environmental poor good poor good good good
Comments
“18650” cylindrical design used in laptops, Tesla Roadster
In Chevy Volt and Nissan Leaf, replacement design for LCO
Johnson Controls, Saft design, Panasonic Tesla Model S (NCA)
Emerging, gaining market share in auto applications
Iron phosphate additive improves thermal runaway temp but decreases energy
High power performance, broad temperature range, low energy density (equal to NiMH), high cycle life
© Waters & Associates, LLC
9PRIMER: A TECHNOLOGY ROADMAP
LITHIUM ION
Sometimes referred to as Li-ion battery
or Lithium Polymer, Lithium Ion (Li-ion) is
a somewhat generic term for a family of
rechargeable, or secondary,a battery types in
which ions of lithium (the lightest metallic
element in the periodic table) move from the
negative electrode to the positive electrode
during discharge and move back when charging.
The Li-ion battery is often referred to as the
“rocking chair” battery as lithium ions “rock”
back and forth from electrode to electrode
upon discharge and charging of the cell.
Li-ion batteries use an intercalated (i.e., inserted
between or among existing elements or layers)
lithium compound that is applied to a substrate
or an electrode material such as a copper or
aluminum thin film sheet. Between the two
electrodes is a polymer-based separator, which
acts as an insulator between the two oppositely
charged electrodes. The separator also acts
as a conveyance mechanism or portal for the
ion to “rock” back and forth from electrode to
electrode (the polymer separator is actually
porous and has micro-openings for ions to
jump through to the opposite electrode). The
addition of liquid electrolytes into the cell forms
a fluid path for ionic movement through the
separator. The two electrodes (with terminals),
the separator, the electrolyte, and the external
packaging (e.g., cylindrical or prismatic) are
the constituent components of a rechargeable
lithium-ion battery cell.
Historically, it is believed that M. Stanley
Whittingham first initiated lithium battery
development while working for Exxon in the
1970s. Sony and Asahi Kasei produced the first
a Non-rechargeable, or primary, batteries will not
be addressed in this report.
commercial lithium-ion batteries in 1991 for the
consumer electronics industry. GM had developed
partnerships in Li-ion technology, and eventually
a joint venture with Valence Corporation, and
started developing Li-ion batteries in 1991 for
the electric vehicle industry.
Li-ion batteries are currently one of the most
popular types of rechargeable batteries for
portable electronics, stationary power, and
automotive applications with a high energy
density, high power density, negligible memory
effect, and low self-discharge.
There are many popular Li-ion family
derivatives available today on the open
market including (see Table 1):
• Lithium Cobalt Oxide (LCO)
• Lithium Iron Phosphate (LFP)
• Lithium Manganese Oxide (LMO)
• Lithium Nickel Manganese Cobalt Oxide
(NMC)
• Lithium Nickel Cobalt Aluminum Oxide
(LCA)
• Lithium Titanate (LTO)
Promising Li-ion family derivatives not
available but under development include:
• Lithium Sulfur (LiS)
• Lithium-Air (Li-Air)
10
T he automotive industry
has been at the
forefront of energy storage
technologies for over a
century. With the advent of
Li-ion technology, and the
increased electrification of the
automobile, the automotive
industry collectively has
invested over $10 billion
in the safety, performance,
durability, and warranty
targets of Li-ion technology.
ENERGY STORAGE ROADMAP REPORT
As noted previously, the automotive industry
has been at the forefront of energy storage
technologies for over a century (i.e., 1912
Cadillac with electric starter and battery).
With the advent of Li-ion technology, and the
increased electrification of the automobile
from 400 Watts in 1912 to over 100 kW
today, the automotive industry collectively
has invested over $10 billion in the safety,
performance, durability, and warranty targets
of Li-ion technology. The utility provider or
building developer would be very judicious
in leveraging the lessons learned through the
tremendous investment of the automotive
industry on the complex subject of Li-ion
energy storage solutions.
In regard to promising Li-ion family derivatives,
Li-S batteries have the potential to be
significantly less expensive to create than
conventional Li-ion batteries, mostly due to
the low cost of sulfur. However, present Li-S
batteries suffer from various instabilities,
resulting in significant drops of efficiency
and increased self-discharge. In addition,
current Li-S battery electrodes can swell up
to 80 percent, making it difficult to design
battery enclosure materials. Nevertheless,
Li-S batteries are one of the most promising
technologies for the future.
Similarly, Li-Air has enormous potential to have
energy densities approaching gasoline (12,200
Wh/kg), which would provide a Tesla Model S a
range of 20,000 miles per full charge. The Li-Air
battery cell is designed to use metallic lithium
on its negative electrode and reacts with
atmospheric oxygen on its positive electrode.
In theory, only half of the battery materials are
required to store the same amount of energy in
the air medium, and can reduce the weight of
the battery by 50 percent.
Due to the appealing science of Li-Air battery
technology, IBM announced substantial
investment in 2009 and many claims of
technological progress are coming out
of Cambridge University (addressing Li-
Air poor cycle life issues).3 As with all new
electrochemistry and battery products, Li-
Air has a substantial development journey
ahead before achieving the life cycle costs
of conventional Li-ion batteries and being
produced for the marketplace.
ULTRACAPACITORS
Formerly referred to as an electric double-
layer capacitor (EDLC), the ultracapacitor
(or “supercapacitor”) is a high-capacity
electrochemical capacitor with a performance
value much higher than standard
11PRIMER: A TECHNOLOGY ROADMAP
capacitors that emulates the cyclical nature
of rechargeable batteries. Ultracapacitors
typically store 100 times more energy per unit
(volume or mass) than electrolytic capacitors,
and can accept and deliver charge much faster
than batteries. Ultracapacitors can provide a
revolutionary amount of charge and discharge
cycles over rechargeable batteries. However,
their energy densities are extremely small when
compared to batteries, and can be more than
10 times larger than conventional batteries for
a given capacity or energy density.
Ultracapacitors are used in applications
requiring many very fast discharges or
rapid charge/discharge cycles, and in colder
temperatures. If long energy durations are
required (e.g., consumer electronics, golf carts,
passenger vehicles, etc.) then ultracapacitors
would be an improper fit for the application.
However, if short-term energy storage or burst-
mode power delivery is required (as in the
cases of regenerative braking on cars, buses,
trains, cranes and elevators) then “ultracaps” or
“supercaps” might be an economic fit as they can
provide short bursts, or short charge/discharge
cycles, over a long period of time and cycles.
Historically, ultracapacitors have always
been an attractive and promising technology
for many electrical applications. However,
when lithium-ion battery technology began
producing high-power battery options with
impressive cycle life such as lithium titanate
(LTO), the value proposition of ultracapacitors
diminished significantly due to its poor energy
density and cost per kWh.
ZINC-AIR
Described as metal-air batteries powered by
oxidizing zinc with oxygen from the air, these
batteries have high energy densities and range
from very small button cells for hearing aids to
batteries for the electrical grid.
Zinc-air batteries operate similarly to fuel cells
where the zinc is the fuel and the reaction rate
can be controlled by varying the airflow. Once
the electrolyte paste oxidizes (zinc) it can be
replaced with fresh paste. Zinc-air has been
used as a non-rechargeable, primary battery
but a recent company has converted it into a
rechargeable secondary battery.
Spun out from research at Arizona State
University,4 a Zinc-air battery company
called Fluidic is providing Zinc-air “mini-grid
solutions” to more than 400,000 residents in
100 remote villages and communities in rural
Madagascar. The company also recently signed
a memorandum of understanding to deploy
similar solutions in Indonesia.
Fluidic has raised more than $150 million
in funding from venture capitalists and
government sources, and now has the financial
backing of Caterpillar Inc. (CAT).
Fluidic claims to own more than 100 patents
and claims to have more than 75,000 batteries
in use around the world delivering electricity to
2.7 million people, with a stated goal of serving
100 million by 2025.5
SODIUM SULFUR
Invented by Ford Motor Company in the early
1960s, a sodium sulfur battery is referred to as
a “molten-salt battery” constructed from liquid
sodium (Na) and sulfur (S). It produces fairly high
energy density (better than PbA efficiency in
charge/discharge at 89–92 percent), good cycle
life, and is fabricated from inexpensive materials.
However, the operating temperature of sodium
sulfur batteries is 300°-350°C and is highly

12 ENERGY STORAGE ROADMAP REPORT
corrosive in nature, which makes the battery
more suitable for stationary energy storage
applications. Sodium sulfur batteries have been
used in the auto industry for more than a decade,
primarily in Europe (e.g., “Th!nk” EV car program).
Typical sodium sulfur batteries have a solid
electrolyte membrane between the anode and
cathode, and are usually made in a cylindrical
configuration. A steel casing that protects the
cell from internal corrosion also encloses the
entire cell. This outside casing serves as the
positive electrode, while the liquid sodium
serves as the negative electrode. The container
is sealed with an airtight lid. In commercial
applications, the cells are arranged in blocks for
better heat conservation and are encased in a
vacuum-insulated box.
Pure sodium presents a significant fire
hazard because it spontaneously burns
in contact with air and moisture, thus the
system must be protected from water and
oxidizing atmospheres.
FLOW BATTERY
A flow battery, or redox flow battery (after
reduction–oxidation), is a type of rechargeable
battery by two chemical liquid components
contained within the system and separated
by a membrane. Ion exchange (providing
flow of electric current) occurs through the
membrane while both liquids circulate in
their own respective space. Cell voltage is
chemically determined and ranges from 1.0
to 2.2 volts (per cell, and cells can be placed in
infinite strings).
While a flow battery has technical advantages
such as potentially separable liquid tanks
and near unlimited longevity over most
conventional recharging (i.e., just add
more chemicals), current product offerings
inherently have less power-producing
capability than all other energy storage
products and are 5-10 times larger than a Li-
ion battery of similar energy densities (Wh/l).
POWER DENSITY AND ENERGY DENSITYPOWER DENSITY
The battery engineer considers many
parameters in properly selecting the best
energy storage solution for a given application.
Power density (W/kg or W/l) is a parameter often
On June 6, 1994, the
Chicago Tribune
infamously reported, “Ford
Unplugs Electric Vans After
2 Fires” (due to improper
design and use of sodium
sulfur batteries):
DEARBORN, Mich. — Ford Motor
Co. said it asked users of its Ecostar
electric utility vans to park their vehicles
outdoors and stop using them after an
Ecostar being tested by the California
Air Resources Board caught fire.
It was the second Ecostar to catch
fire in the last month. The first incident
occurred May 2, when an Ecostar
leased by the Electric Power Research
Institute in Palo Alto, Calif., burst into
flames while recharging.6
13PRIMER: A TECHNOLOGY ROADMAP
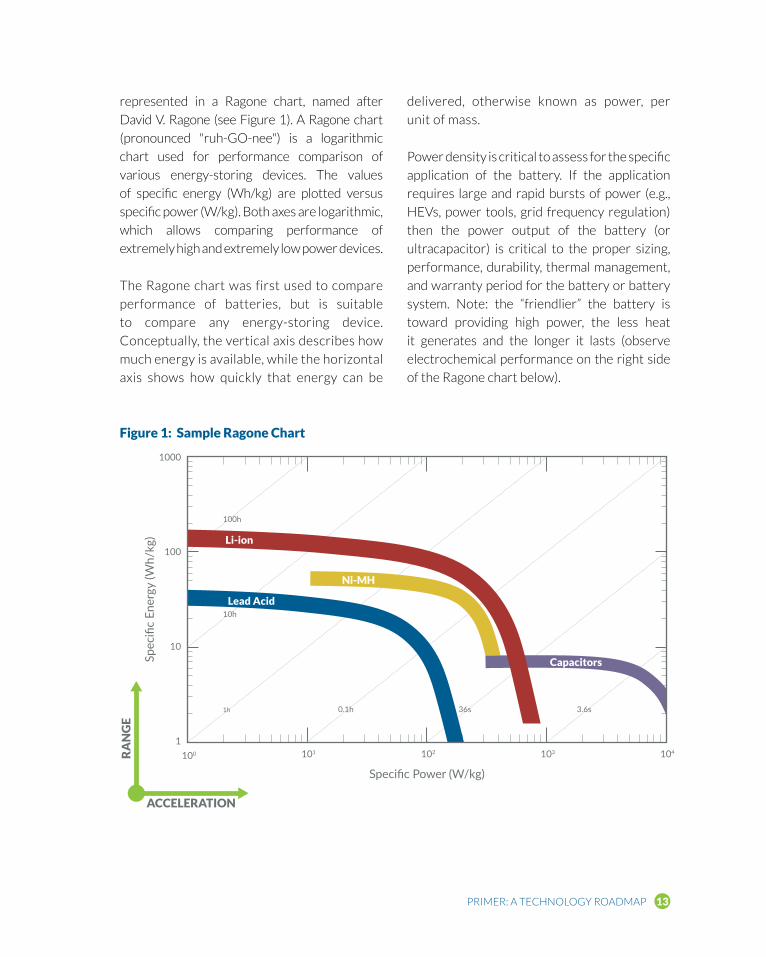
represented in a Ragone chart, named after
David V. Ragone (see Figure 1). A Ragone chart
(pronounced "ruh-GO-nee") is a logarithmic
chart used for performance comparison of
various energy-storing devices. The values
of specific energy (Wh/kg) are plotted versus
specific power (W/kg). Both axes are logarithmic,
which allows comparing performance of
extremely high and extremely low power devices.
The Ragone chart was first used to compare
performance of batteries, but is suitable
to compare any energy-storing device.
Conceptually, the vertical axis describes how
much energy is available, while the horizontal
axis shows how quickly that energy can be
delivered, otherwise known as power, per
unit of mass.
Power density is critical to assess for the specific
application of the battery. If the application
requires large and rapid bursts of power (e.g.,
HEVs, power tools, grid frequency regulation)
then the power output of the battery (or
ultracapacitor) is critical to the proper sizing,
performance, durability, thermal management,
and warranty period for the battery or battery
system. Note: the “friendlier” the battery is
toward providing high power, the less heat
it generates and the longer it lasts (observe
electrochemical performance on the right side
of the Ragone chart below).
Specific Power (W/kg)
Spec
ific
Ener
gy (W
h/kg
)
RA
NG
E
ACCELERATION
Li-ion
Ni-MH
Lead Acid
Capacitors
1h
100
1
10
100
1000
101 102 103 104
10h
100h
3.6s36s0.1h
Figure 1: Sample Ragone Chart

14 ENERGY STORAGE ROADMAP REPORT
ENERGY DENSITY
Usually in tension, or in a performance trade-
off with power density, energy density is also
critical to assess and size for the specific
application of the battery. If the application
allows or requires large, slow energy output
or throughput (e.g., EVs, laptop computers,
storing solar energy for use at night) or
requires a maximum vehicle driving range
(e.g., Tesla goal of 300 miles), then the
energy density of the battery is paramount
to the proper battery selection. Note: the
higher the energy density of the battery,
the smaller and lighter the battery will be,
and usually directly relates to the system
cost of the application if size and volume
are critical to the value proposition (observe
electrochemical performance on the upward
direction in Figure 2).
CYCLE LIFEA single charge cycle is the process of charging
a rechargeable battery and discharging it.
Often specified or referred to as “Depth-
of-Discharge” (DOD), a full cycle can be
determined by the user or the application (i.e.,
software). The number of cycles the battery
can repeat at a certain performance level is
referred to as “cycle life” but it can be affected
by several parameters.
PARAMETERS
The cycle life of a battery can be affected by
the following:
• Depth-of-Discharge (DOD): As noted earlier,
the DOD of the battery can range from 100
percent (deep discharge) to 0.1 percent
(trickle discharge). Inherently, the deeper
WattHour/Liter
WattHour/Kilogram
Lead Acid
Nickel CadmiumCylindrical Prismatic
Nickel Metal HydrideCylindrical Prismatic
Lithium IonCylindricalAluminum CansPrismatic
Lithium Phosphate
Lithium PolymerPrismatic
50 100 150 200 250 300 350 400 450
50
100
150
200
250
Figure 2: Battery Performance by Weight and Volume

15PRIMER: A TECHNOLOGY ROADMAP
the discharge of the battery the greater
the impact on its cycle life. For example, a
PbA SLI application battery is capable of
approximately 200 cycles at 100 percent
DOD. However, in an SLI application where
the DOD is only 5-10 percent, the PbA
cycle life can last over 200,000 cycles. This
relationship between DOD and cycle life is
common to most electrochemical energy
storage technologies.
• Temperature: Briefly mentioned previously,
typically temperatures above 100°F/38°C
accelerate “aging” or reduce cycle life
of the battery (unless the battery is a
“hot” chemistry, such as sodium sulfur or
rechargeable lithium metal). Most energy
storage products available today are
developed to operate most efficiently at
77°F to 104°F (25°C to 40°C).
Cold temperatures at the freezing
point (32°F/0°C) or below can limit
charge and discharge capability of the
battery. Lithium-based and Nickel-
based batteries are virtually impotent
at freezing temperatures (with the
exception of LTO which, remarkably, can
discharge 80 percent of its capacity at
-35°F/-37°C). PbA can provide cranking
power (SLI) at freezing temperatures
and below.
Obviously, external thermal management
systems can ensure performance and
cycle life of the battery system. Economic
or “system” trade-offs must be made
to evaluate the cost of the thermal
management system to ensure battery
life per the annual ambient temperature
in the application. For example, LTO
chemistry is capable of charging and
discharging at freezing temperatures, but
it is more expensive on a cost per kWh
basis than other Li-ion chemistries (due to
its lower energy density). Depending on
the system and warranty requirements,
LTO could be an overall less expensive
solution since it requires less thermal
management and temperature control.
• Time: Sometimes referred to as “self-
discharge,” it is essential to analyze the time
or calendar life performance of batteries
to determine maintenance, replacement,
and warranty targets of the energy storage
solution. A calendar life test evaluates cell
degradation as a result of the passage of
time with minimal cycling of the battery.
This testing is not a pure “shelf-life” test,
as the cells under test must be periodically
subjected to reference discharges to
determine the changes (if any) in their
performance characteristics.
• Charge Rate (C): Charge and discharge
rates of a battery are commonly referred
to as C-rates. The charge rate of a 1 kWh
capacity battery is commonly rated at
1C, meaning that a fully charged battery
discharged at a rate of 1 kilowatt (C = 1
kW) can provide 1 kilowatt of constant
power for one hour. The same battery
discharged at a rate of C/2 can provide
500 watts for two hours, and finally, at a
2C discharge rate the battery delivers 2
kilowatts continuously for 30 minutes.
It is important to realize that higher
C-rates can increase internal
thermodynamic reactions to the
battery cell electrodes, seals, and

16 ENERGY STORAGE ROADMAP REPORT
packaging and can shorten the cycle life
of the cell. Typically, the energy storage
application defines the requirements
or drives the need for battery
C-rates. For example, most laptop
computing batteries are discharged at
a C/5, and as low as C/20, under mild
ambient temperatures. Conversely,
EV batteries can be subjected to 5C
to 10C discharge rates under harsh
accelerations or rapid recharge (i.e.,
Level III charging), and under harsh
ambient temperatures.
Individual electrochemistries and
the internal battery cell structure
design dictate the charge/discharge
rate capabilities of the battery cell. In
addition, individual cells can be ganged
together in a parallel string to better
accommodate and distribute high charge/
discharge rates in a battery pack system.
BALANCE-OF-SYSTEMBATTERY MANAGEMENT SYSTEM (BMS)
The Battery Management System (BMS) is
often referred to as the “brain” of the battery
(unit, string, module, or pack). The BMS is
designed to provide cell (voltage) balance,
control, and consistent performance over the
lifecycle of the battery. The BMS is a circuit
board with an integrated microprocessor that
monitors, records, and actually sends signals
for charging and discharging individual lithium
battery cells (or cell strings) to maintain voltage
balance and system performance. (See Figure 3).
Lithium battery cell voltages are divergent in
nature (to one another) and require an external
control device (i.e., BMS) to maintain synchronized
cell voltages as cells are “topped off” at full
charge. All lithium batteries utilized today in
energy storage systems, and when placed in a
voltage series string, require a BMS to maintain
safety, cell balance, performance, and warranty.
Mono-Cell• Basic cell
chemistry• Basic cell
voltage• Voltage:
2VDC to 4 VDC• Capacity:
2-3 Amp-hours (Ah)
Cell• Stack of
mono-cells• Connected
in parallel• Voltage:
2VDC to 4 VDC• Capacity:
10 Ah to 40 Ah
Module• Stack of cells• Connected in series
and/or parallel• Voltage: 4 VDC to
60 VDC (typical)• Capacity: 0.5 kWh
to 5 kWh (typical)
Battery Pack• Stack of modules• Connected in series
and/or parallel• Voltage: 100 VDC to
700 VDC (typical)• Capacity: 10 kWh to
500 kWh (typical)
Battery System• Stack of battery packs• Connected in series
and/or parallel• Voltage: 100 VDC to
700 VDC (typical)• Capacity: 500 kWh to
50 MWh (typical)
Battery Management SystemAnode
Separator
Cathode
Data+ –
Figure 3: Balance-of-System
17PRIMER: A TECHNOLOGY ROADMAP
The BMS has “bleed resistors” on the circuit
board which are used to divert charging energy
of individual battery cells once the individual cells
have reached their maximum charge voltage.
For example, if the battery cell or the string
cutoff charging voltage is 4.0 volts (i.e., maximum
charge voltage per cell), and once the 4.0 VDC
value has been reached via charging on an
individual battery cell, the BMS diverts charging
energy from that cell to the bleed resistor(s).
The bleed resistor(s) converts the charge energy
into heat and dissipates into the ambient air.
These heat-generating bleed resistors must be
considered in the overall thermal management
of the lithium battery system.
BUSSING/CONNECTIONS
Critical to the efficient and reliable operation
of an integrated battery system are the
dozens, hundreds, and sometimes thousands
(e.g., Tesla) of connections between cells and
electrical bussing between cell modules (see
Figure 3). Every buss bar weld, connection, or
electrical joint is a potential failure point and
can introduce electrical resistance into the
energy storage system. Where resistance is
evident or measurable, heat is generated causing
secondary thermal management conditions that
must be monitored and controlled for proper
energy storage system use and operations.
Bussing and connections are critical engineering
areas where volumes of research have been
applied toward discovering low-cost, reliable,
and low-resistance attachments or welds. As
noted previously, the automotive industry has
applied more investment and research into this
area than any other industrial sector.
THERMAL MANAGEMENT
Emphasized throughout this report, the
thermal maintenance of the individual battery
cells is critical to the safety, performance, and
warranty of the energy storage system. The
industry has developed two fundamental
thermal management solution paths:
• Active: Typically a liquid cooling system
where a coolant, such as ethylene glycol,
is circulated around and through heat
generating areas to transfer heat from
inside the battery system to outside and
through a cooling loop, such as a radiator -
often referred to as “convection.” Similarly,
thermal management can be accomplished
through a forced-air system provided by a
blower fan and ducting, but forced air is
less effective in extracting larger amounts
of heat from the cells or keeping cells
warm in colder ambient temperatures.
• Passive: Due to the impressive 95
percent charge/discharge (under
moderate C-rates) efficiency of most
Li-ion technology, many energy storage
solutions do not make provisions for
active cooling systems and allow the
minimal heat gains of the lithium cell to
dissipate passively. Depending on the
application, whether the energy storage
system is moving or stationary, passive
air channels can be designed into the
enclosure allowing airflow, and even
conduction of thermal conditions, to
circulate past the individual battery cells
for passive thermal management.
PACKAGING/ENCLOSURES
As noted in Figure 3, battery cells (Ah) are often
placed and integrated into modules (Wh) then
into battery packs (kWh). Multiple battery
packs can comprise a battery system (e.g.,
MWh). Electrical design, mechanical design,
material selection, thermal management,

ENERGY STORAGE ROADMAP REPORT18
bussing, and connections are all critical to the
external cell packaging, module packaging, pack
enclosures, and the battery system.
In automotive battery packs, the packaging,
wiring, connections, enclosures, etc. can
approach 50 percent of the bill of material cost
(the other 50 percent being the cells). Due to
the harsh operating conditions and liability
ramifications of the automotive industry,
products, packaging, and enclosures are
highly engineered and validated to automotive
requirements for battery pack designs. Again,
most automotive battery packs are considered
powertrain products incorporating a 10-year,
100,000-mile warranty (with only a 20 percent
capacity fade at end of year 10).
Conversely, stationary battery packs in
moderate ambient air environments have
less engineering and validation requirements.
This allows for less expensive materials,
bussing, thermal management, etc. At the
right volumes over time, and depending on
voltage requirements, the reduced application
requirements in stationary power applications
should move the ratio of battery pack bill of
material costs to approximately 30 percent
or less (the other 70 percent being the cells).
Conversely, consideration must be given to the
higher voltages of stationary grid-tied energy
storage, which may require more specialized and
thus expensive bussing, wiring, and connections.
INVERTERS
Inverters are electronic devices or circuitry
that “inverts” direct current (DC) to alternating
current (AC). The input voltage, output voltage,
and the voltage frequency depend on the
design of the specific device or circuitry, but
the inverter does not produce any power as the
power is provided by the DC source.
Examples of inverting include
the following:
• 12 VDC: smaller consumer and
commercial inverters that typically run
from an SLI 12 VDC PbA battery or
automotive electrical outlet
• 24, 36 and 48 VDC: common standards
for home energy systems
• 200 to 400 VDC: common for
photovoltaic solar panels
• 300 to 450 VDC: common for electric
vehicle battery packs and vehicle-to-grid
systems
• 700 to 800 VDC: common for large
electric buses and mass transit systems
• 100,000+ VDC: common for
high-voltage direct current power
transmission system
A power inverter in higher voltage batteries
(above 48 VDC) is typically comprised of
electronic circuitry using the “switching”
capability of silicon (used in power transistors
and diodes).
BRICKS & MORTAR/HVAC
A safe and reliable control of the energy
storage system is crucial for an economically
viable operation. For large stationary energy
storage systems, a supervisory control and data
acquisition (SCADA) system is required. A SCADA
coordinates the data from the multiple BMS’s,
the power conversion systems (e.g., inverters,
inverter controllers) and external requests (e.g.,
19PRIMER: A TECHNOLOGY ROADMAP
electrical grid). As noted previously, the BMS
monitors all relevant and individual battery cell
measurements and ensures safe operation of
the battery. If any of these limits is exceeded due
to failure of any SCADA component, the BMS
can switch off its inherent batteries by opening
electrical contactors.
Additionally, there are auxiliary power
loads caused by heating, ventilation and air
conditioning (HVAC) and the SCADA. For
simplification, the power need related to the
HVAC can be assumed to be a percentage of
thermal losses caused by the batteries (and
dependent on the coefficient of performance,
or COP, of the AC).
It is important to quantify system losses, often
called “parasitic losses,” of the battery thermal
loads to the HVAC to the SCADA in order to
properly calculate the true value proposition
and overall system efficiency value for Return
on Investment (ROI), Internal Rate of Return
(IRR), etc. calculations.
On top of the SCADA, an energy management
system (EMS) can be placed which optimizes
the power dispatch and incorporates losses,
aging of the cells or modules, thermal loads,
and more. Designing and building a large
energy storage system (MWh+) is a planning-
intensive process where standardization
of safety, battery technologies, building
requirements, definitions of Key Performance
Indicators (KPIs), and communication signals
for SCADA are required. If best practices can
be leveraged from the automotive industry,
then significant gains can be made in the
built environment at a fraction of the cost
for internal development of large energy
storage systems.
SAFETY
Due to poor systems engineering or poor
handling in the public eye, Li-ion batteries
have a negative public perception. However,
like all energy storage mediums, including
liquid fuels like gasoline, under certain
conditions Li-ion batteries can pose a safety
hazard. Since Li-ion batteries are sealed
batteries, usually under pressure, and have
the highest energy densities available in
the battery market, improper handling
(i.e., shorting) and/or thermal management
can cause what the industry has termed a
“thermal runaway” event.
In 1999, an infamous lithium battery fire
occurred at the Los Angeles International (LAX)
airport, upon two aircraft cargo pallets at the
Northwest Airlines cargo facility at LAX.7
The pallets had been taken off Northwest
Airlines Flight 0026, an inbound passenger-
carrying flight, from Osaka, Japan. The event
consisted of two pallets, one containing
100,000 primary (non-rechargeable) Sanyo
lithium cells, the other containing 20,000 more
cells, some primary and some rechargeable
or secondary cells. The cells were physically
abused many times by forklift truck operators
as they moved the pallets around an outdoor
cargo area of the airport. Abuse occurred
over a several-hour period resulting in a fire
that could not initially be put out with the
portable firefighting equipment and was
finally extinguished when a large fire truck
doused the pallets with large volumes of
water, thus suffocating the flaming cells. The
exact cause of the fire may never be known.
Once the packaging integrity of the cells was
destroyed, the cells could have been crushed,
short-circuited, overcharged or experience a
forced discharge.
ENERGY STORAGE ROADMAP REPORT20
The U.S. National Transportation Safety
Board's (NTSB's) investigation of this
incident resulted in the issuance of formal
safety recommendations, which initiated
regulations on the entire lithium battery
industry, including soon-to-be adopted
regulations for the United Nations.
The First Law of Thermodynamics, also known
as Law of Conservation of Energy, states that
energy cannot be created or destroyed in an
isolated system. Therefore, battery cells or
energy storage devices do not “create” fires or
even energy transfers.
Proper handling and engineering of individual
batteries and battery pack systems is required
for safe use and operation over the 20-year
expectancy of Li-ion products. The more recent
Boeing 787 Dreamliner incident (2013)8
is an additional example of an improperly
engineered Li-ion battery system where
proper and tested thermal management design
(per automotive standards and requirements)
was not implemented prior to flight.
As Li-ion-based and other electrochemistry
energy storage systems are potentially
evaluated and placed on the electrical grid
and in the home, safety issues and robust
systems engineering are highly relevant.
Again, borrowing best practices from
the automotive industry, which has dealt
extensively with the thermal runaway issue
of large battery systems for over three
decades, can provide expertise and insight
to the safety, handling, operation, and
response to thermal incidents in energy
storage systems for the built environment.
Furthermore, standards bodies like
Society of Automotive Engineers (SAE)
and Underwriters Laboratories (UL) have
developed a range of safety standards and
certifications for mobile stationary energy
storage systems that should be leveraged to
reduce the risk of deploying energy storage
on the grid.
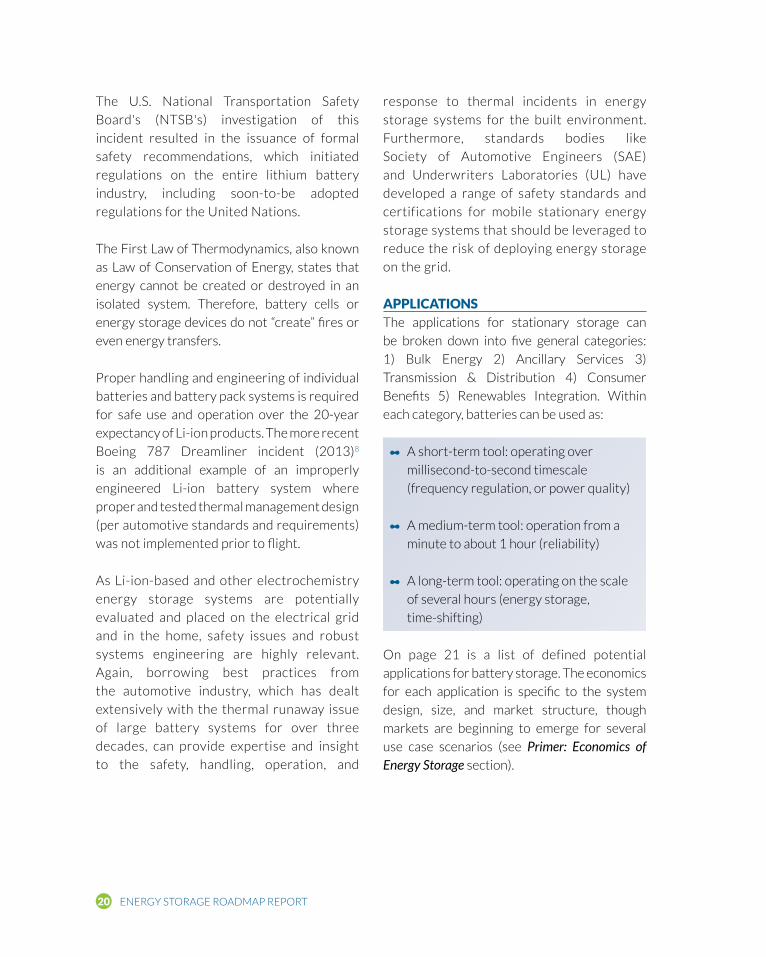
APPLICATIONSThe applications for stationary storage can
be broken down into five general categories:
1) Bulk Energy 2) Ancillary Services 3)
Transmission & Distribution 4) Consumer
Benefits 5) Renewables Integration. Within
each category, batteries can be used as:
• A short-term tool: operating over
millisecond-to-second timescale
(frequency regulation, or power quality)
• A medium-term tool: operation from a
minute to about 1 hour (reliability)
• A long-term tool: operating on the scale
of several hours (energy storage,
time-shifting)
On page 21 is a list of defined potential
applications for battery storage. The economics
for each application is specific to the system
design, size, and market structure, though
markets are beginning to emerge for several
use case scenarios (see Primer: Economics of Energy Storage section).
21PRIMER: A TECHNOLOGY ROADMAP
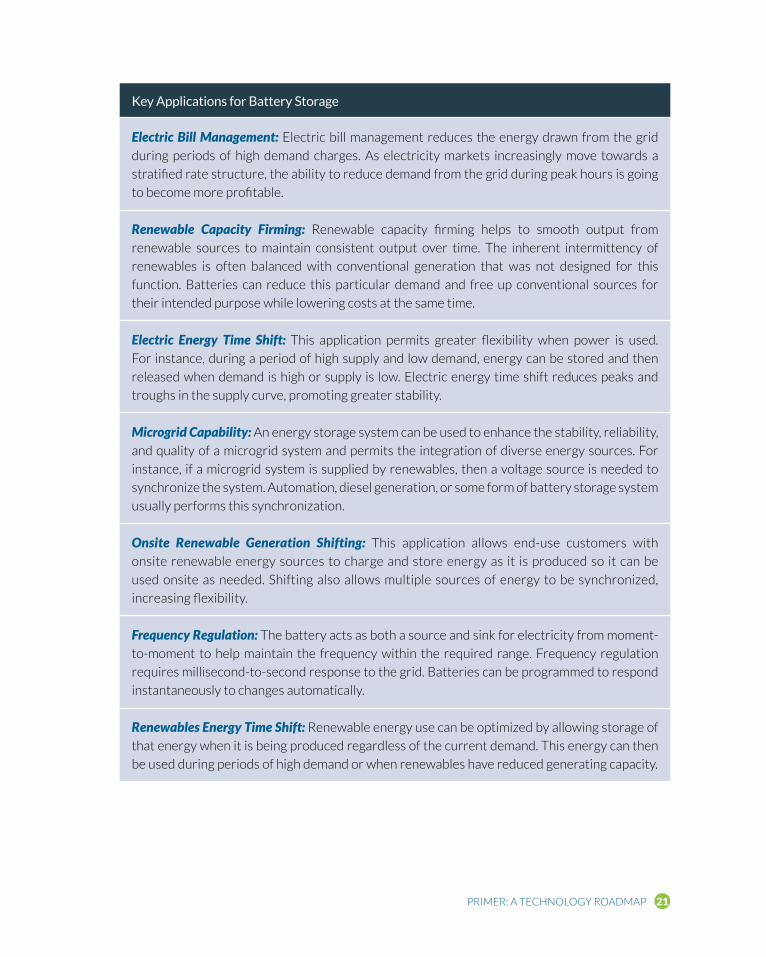
Key Applications for Battery Storage
Electric Bill Management: Electric bill management reduces the energy drawn from the grid
during periods of high demand charges. As electricity markets increasingly move towards a
stratified rate structure, the ability to reduce demand from the grid during peak hours is going
to become more profitable.
Renewable Capacity Firming: Renewable capacity firming helps to smooth output from
renewable sources to maintain consistent output over time. The inherent intermittency of
renewables is often balanced with conventional generation that was not designed for this
function. Batteries can reduce this particular demand and free up conventional sources for
their intended purpose while lowering costs at the same time.
Electric Energy Time Shift: This application permits greater flexibility when power is used.
For instance, during a period of high supply and low demand, energy can be stored and then
released when demand is high or supply is low. Electric energy time shift reduces peaks and
troughs in the supply curve, promoting greater stability.
Microgrid Capability: An energy storage system can be used to enhance the stability, reliability,
and quality of a microgrid system and permits the integration of diverse energy sources. For
instance, if a microgrid system is supplied by renewables, then a voltage source is needed to
synchronize the system. Automation, diesel generation, or some form of battery storage system
usually performs this synchronization.
Onsite Renewable Generation Shifting: This application allows end-use customers with
onsite renewable energy sources to charge and store energy as it is produced so it can be
used onsite as needed. Shifting also allows multiple sources of energy to be synchronized,
increasing flexibility.
Frequency Regulation: The battery acts as both a source and sink for electricity from moment-
to-moment to help maintain the frequency within the required range. Frequency regulation
requires millisecond-to-second response to the grid. Batteries can be programmed to respond
instantaneously to changes automatically.
Renewables Energy Time Shift: Renewable energy use can be optimized by allowing storage of
that energy when it is being produced regardless of the current demand. This energy can then
be used during periods of high demand or when renewables have reduced generating capacity.

ENERGY STORAGE ROADMAP REPORT22
Key Applications for Battery Storage
Electric Bill Management with Renewables: This application for energy storage permits
the storage of energy during low-rate periods to be used during high-rate periods. Storage
combined with renewables can work in conjunction with each other to improve the economics
of both renewables and battery storage.
Resiliency: Resiliency enhances the ability to supply demanded power in the event of disruption.
Storage systems can permit an orderly shutdown of the system or may act as a backup to
maintain function until power is restored.
Voltage Support: Large power loads can move the voltage out of the specified range locally.
Storage can dampen these effects with minimal draw of power from the battery.
Onsite Power: The battery can provide power locally as needed. These systems can be used
in conjunction with, or in replacement of, conventional generators. For instance, institutions
such as hospitals, server farms, and some manufacturing activities must have robust and
uninterruptable energy supplies. Even in the event of a dedicated generator, backup power is
usually installed as a fail-safe.
Grid-Connected Commercial (Reliability & Quality): Battery storage can maintain consistent
power output in the event of a disruption of a commercial enterprise. The system may provide
the needed power during the disruption or permit an orderly system shutdown or smooth
transition to a backup generation unit. The storage system can also smooth out any unwanted
variability such as spikes or drops in voltage or frequency.
Grid-Connected Residential (Reliability): Battery storage can maintain consistent power output
in the event of a disruption for residential customers. The system may provide the needed
power during the disruption or permit an orderly system shutdown or smooth transition to a
backup generation unit. The storage system can also smooth out any unwanted variability such
as spikes or drops in voltage or frequency.
Electric Supply Capacity: Having electric supply capacity can decrease the need to buy
generating capacity on the wholesale market or build new generation capacity. Uncertainty
in market demand for electricity - for instance, in new housing developments where demand
may grow quickly if the development is successful or fail to materialize if the development
falls through - is a source of risk for electricity suppliers. Storage may be effective in providing
flexibility to energy suppliers.
23PRIMER: A TECHNOLOGY ROADMAP
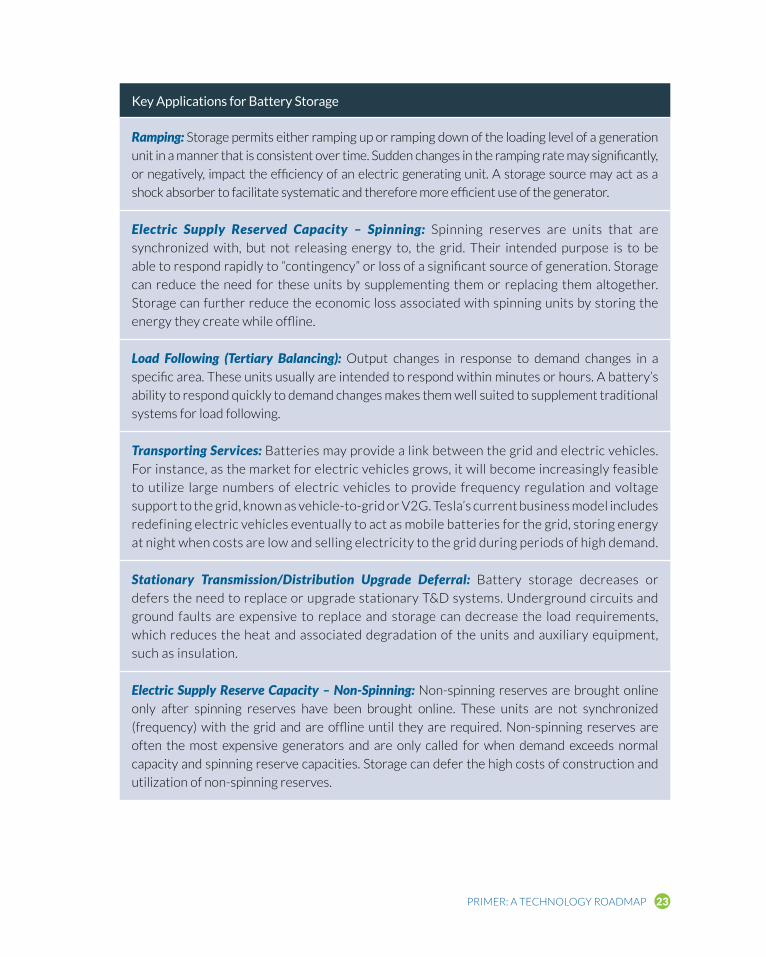
Key Applications for Battery Storage
Ramping: Storage permits either ramping up or ramping down of the loading level of a generation
unit in a manner that is consistent over time. Sudden changes in the ramping rate may significantly,
or negatively, impact the efficiency of an electric generating unit. A storage source may act as a
shock absorber to facilitate systematic and therefore more efficient use of the generator.
Electric Supply Reserved Capacity – Spinning: Spinning reserves are units that are
synchronized with, but not releasing energy to, the grid. Their intended purpose is to be
able to respond rapidly to “contingency” or loss of a significant source of generation. Storage
can reduce the need for these units by supplementing them or replacing them altogether.
Storage can further reduce the economic loss associated with spinning units by storing the
energy they create while offline.
Load Following (Tertiary Balancing): Output changes in response to demand changes in a
specific area. These units usually are intended to respond within minutes or hours. A battery’s
ability to respond quickly to demand changes makes them well suited to supplement traditional
systems for load following.
Transporting Services: Batteries may provide a link between the grid and electric vehicles.
For instance, as the market for electric vehicles grows, it will become increasingly feasible
to utilize large numbers of electric vehicles to provide frequency regulation and voltage
support to the grid, known as vehicle-to-grid or V2G. Tesla’s current business model includes
redefining electric vehicles eventually to act as mobile batteries for the grid, storing energy
at night when costs are low and selling electricity to the grid during periods of high demand.
Stationary Transmission/Distribution Upgrade Deferral: Battery storage decreases or
defers the need to replace or upgrade stationary T&D systems. Underground circuits and
ground faults are expensive to replace and storage can decrease the load requirements,
which reduces the heat and associated degradation of the units and auxiliary equipment,
such as insulation.
Electric Supply Reserve Capacity – Non-Spinning: Non-spinning reserves are brought online
only after spinning reserves have been brought online. These units are not synchronized
(frequency) with the grid and are offline until they are required. Non-spinning reserves are
often the most expensive generators and are only called for when demand exceeds normal
capacity and spinning reserve capacities. Storage can defer the high costs of construction and
utilization of non-spinning reserves.
ENERGY STORAGE ROADMAP REPORT24
Key Applications for Battery Storage
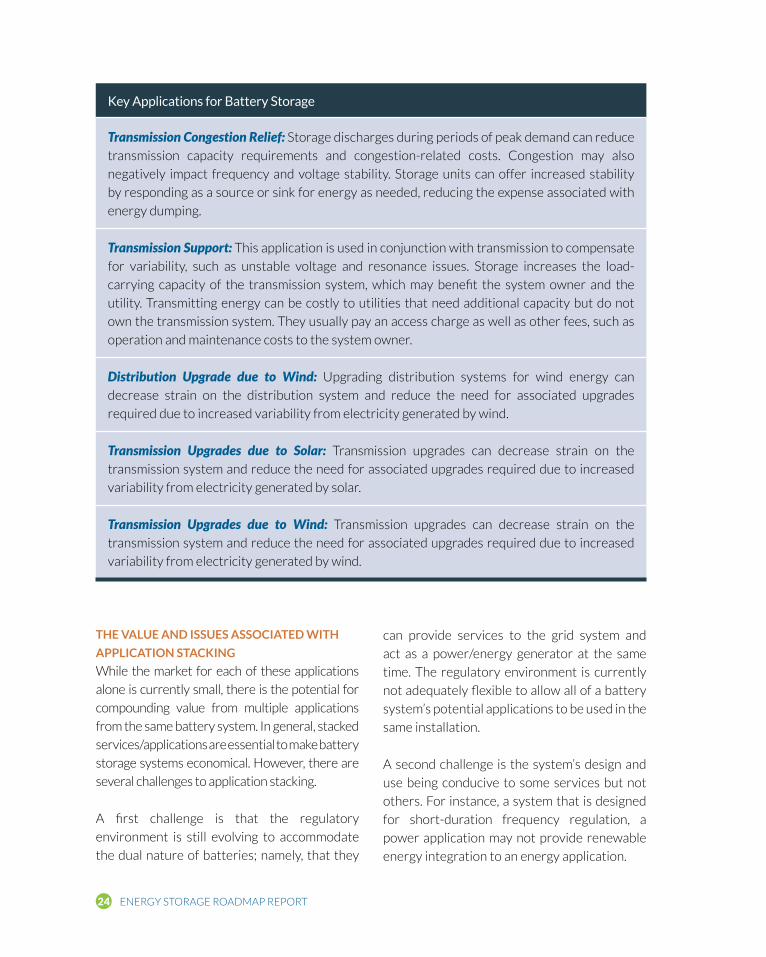
Transmission Congestion Relief: Storage discharges during periods of peak demand can reduce
transmission capacity requirements and congestion-related costs. Congestion may also
negatively impact frequency and voltage stability. Storage units can offer increased stability
by responding as a source or sink for energy as needed, reducing the expense associated with
energy dumping.
Transmission Support: This application is used in conjunction with transmission to compensate
for variability, such as unstable voltage and resonance issues. Storage increases the load-
carrying capacity of the transmission system, which may benefit the system owner and the
utility. Transmitting energy can be costly to utilities that need additional capacity but do not
own the transmission system. They usually pay an access charge as well as other fees, such as
operation and maintenance costs to the system owner.
Distribution Upgrade due to Wind: Upgrading distribution systems for wind energy can
decrease strain on the distribution system and reduce the need for associated upgrades
required due to increased variability from electricity generated by wind.
Transmission Upgrades due to Solar: Transmission upgrades can decrease strain on the
transmission system and reduce the need for associated upgrades required due to increased
variability from electricity generated by solar.
Transmission Upgrades due to Wind: Transmission upgrades can decrease strain on the
transmission system and reduce the need for associated upgrades required due to increased
variability from electricity generated by wind.
THE VALUE AND ISSUES ASSOCIATED WITH
APPLICATION STACKING
While the market for each of these applications
alone is currently small, there is the potential for
compounding value from multiple applications
from the same battery system. In general, stacked
services/applications are essential to make battery
storage systems economical. However, there are
several challenges to application stacking.
A first challenge is that the regulatory
environment is still evolving to accommodate
the dual nature of batteries; namely, that they
can provide services to the grid system and
act as a power/energy generator at the same
time. The regulatory environment is currently
not adequately flexible to allow all of a battery
system’s potential applications to be used in the
same installation.
A second challenge is the system’s design and
use being conducive to some services but not
others. For instance, a system that is designed
for short-duration frequency regulation, a
power application may not provide renewable
energy integration to an energy application.
25PRIMER: A TECHNOLOGY ROADMAP
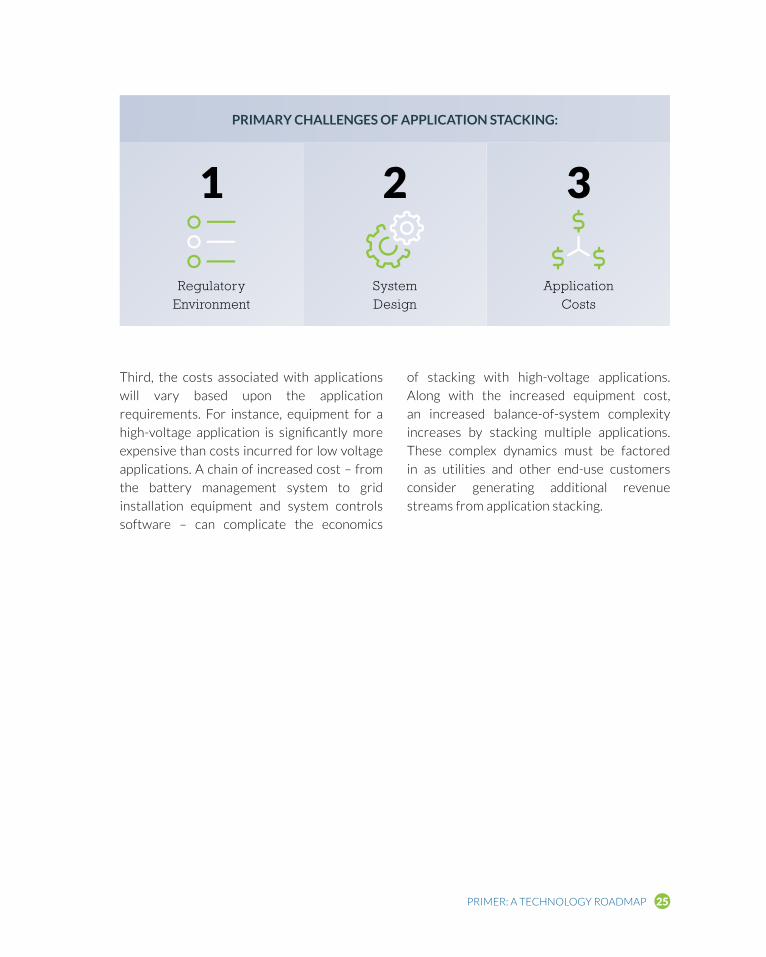
Third, the costs associated with applications
will vary based upon the application
requirements. For instance, equipment for a
high-voltage application is significantly more
expensive than costs incurred for low voltage
applications. A chain of increased cost – from
the battery management system to grid
installation equipment and system controls
software – can complicate the economics
of stacking with high-voltage applications.
Along with the increased equipment cost,
an increased balance-of-system complexity
increases by stacking multiple applications.
These complex dynamics must be factored
in as utilities and other end-use customers
consider generating additional revenue
streams from application stacking.
PRIMARY CHALLENGES OF APPLICATION STACKING:
Regulatory Environment
System Design
Application Costs
1 2 3

ENERGY STORAGE ROADMAP REPORT26
P R I M E R : E C O N O M I C S O F E N E RG Y S TO R AG E
The goal of this primer is to educate the
reader on the economics and market
conditions impacting the price of stationary
energy storage. The section reviews key criteria
that make up the full cost of energy storage,
including pricing targets and forecasts; identifies
which applications are currently economical; and
addresses current efforts to compare energy
storage pricing to alternative technologies.
DRIVERS OF BATTERY PRICESThe battery industry is global, with a supply chain
spanning several continents. For Li-ion batteries,
roughly 85 percent of manufacturing capacity is
concentrated in China, Japan, and South Korea.
The European Union and the United States
cover most of the rest of production.9 The lead
acid battery market is even more diffuse, with
production again centered in Asia Pacific, North
America, and Europe.10
There are several factors at play that are
impacting the costs of batteries:
• Raw materials: A fundamental component
of the cost of different battery chemistries
will rely on a wide variety of raw materials,
and each with their own supply chain. A
drop in the price of raw materials should
lead directly to the cost of batteries falling.
Conversely, a supply shortage could trigger
sharp price increases (e.g., nickel). Thus,
sourcing raw materials from an unstable
region could lead to a higher risk of
disruption and price shocks.
• Technological innovation: Through extensive
research and development, technological
innovation can result in battery designs
that are much more efficient and powerful,
which lowers the cost of performing a
certain function. However, as discussed in
the Primer: A Technology Roadmap (see page
6), the battery industry has a history of
overhyping the immediate market impact of
technical innovations, and “breakthrough”
electrochemistry or battery claims.
Therefore, energy storage advances in
technology require careful analysis to
understand if and when such improvements
can be realized in a real-world application
(e.g., automotive battery packs).
• Production volume: Demand for battery
technologies, and the volume of cell and
module production to meet demand, is
a key cost driver. For instance, lead acid
batteries are used mostly in automobiles
(SLI), and the industrialization of developing
countries has continued to suppress prices
for the technology.11 Sustained demand
for consumer electronics and increased
demand for electric vehicles may be the
dominant forces lowering the price of Li-ion
batteries. The market for Li-ion batteries
used in other applications (e.g., for grid
purposes) also benefits since it shares
the same underlying technology. Most
recently, Tesla launched its Gigafactory in
order to meet demand for its own line of
electric vehicles.12 Tesla’s Gigafactory is
one example of increased demand leading
to suppliers moving toward very high
production volume facilities and taking
advantage of the resulting economies of
scale. Similar lithium production facilities
have been, or are being, developed by BYD
and Daimler-Benz.

27PRIMER: ECONOMICS OF ENERGY STORAGE
• Policy and regulation: Government
policy and regulation shapes the market
through taxes, subsidies, procurement
mandates, government-funded research
and development, international trade
laws, and by shaping rules for market
participation. The Primer: Policy and Regulatory Implications section (see page
43) in this report goes into further detail
on how policy drives the market for energy
storage more generally.
• Cost of competing technologies: The cost of
conventional and competing technologies
can influence the degree of market
penetration that storage technologies
can achieve. For grid-scale applications,
energy storage will always be competing
with other technologies and techniques
that have traditionally accomplished the
same functions. For instance, barring any
regulatory mandates, batteries serving the
function of transmission upgrade deferral
will only be deployed if they are less
expensive than the transmission upgrades
themselves. Similarly, energy storage
technologies capable of dispatching energy
to the grid will compete with conventional
power plants. However, energy storage
technologies may have advantages that can
bridge the price gap, such as being more
responsive or able to dispatch more quickly.
• Balance-of-system (BOS) costs: BOS
costs, including non-battery hardware
components (e.g., inverters) and soft costs
(e.g., interconnection), are a substantial
component of the overall cost of a battery
energy storage system. As batteries reach
higher levels of commercialization and
module costs fall, attention will likely turn
to reducing BOS costs to bring costs down
further. This has been seen in rooftop solar;
after the biggest gains in module costs
were realized, attention turned to reducing
BOS costs. Such actions have been the
dominant drivers of cost declines over the
past few years.13, 14
BATTERY SYSTEM COST BREAKDOWNInstalled battery systems for stationary storage
are designed for a specific purpose and the costs
can vary widely according to each use case. The
costs of a battery storage system are a function
of a wide-ranging list of factors, including:
chemistry, battery management system,
system size, power electronics and balance-
of-system, grid interconnection requirements,
installation cost, battery life, operations and
maintenance, whether the battery is for power
or energy, discharge timescale (milliseconds
to hours), grid condition and demands on the
storage system, local operation conditions
(such as climate), etc. Within each layer is
a range of associated costs. The economics
of a battery system and associated revenue
streams is directly affected by the local market
conditions in which the system will operate,
available alternatives, government policies,
expected market growth rates, market size,
rate structures, etc. The highly variable nature
of each system and the conditions in which
they operate produced a wide variability in the
economics of battery storage.
The costs associated with an installed battery
system can be broken down into five categories:
• Cells
• Packs (including battery
management system)
• Balance-of-system
• Installation
• Operation and Maintenance

ENERGY STORAGE ROADMAP REPORT28
MARKET MATURITY OF ENERGY STORAGE COST COMPONENTSThe below synopsis and analysis of energy storage
cost components is based on data compiled
from approximately 20 different industry and
government agency reports. See the ESN Insights
section (see page 54) for the author’s perspectives
on this data and future market forecasts.
BATTERY CELLS
The markets associated with energy storage
cost components are at varying degrees of
maturity. Japan’s “first-mover” status in the
consumer electronics industry in the 1980s
means the supply chain for Li-ion batteries
themselves is relatively mature thanks to Asia’s
nodal manufacturing practices and close ties
with raw and processed material suppliers and
manufacturers. Battery cell manufacturing
in gigafactories in Asia and the United States
associated with electric vehicle manufacturing
is extending the role of batteries from consumer
electronics into applications with high energy
and power demands. These gigafactories
are quickly achieving cost reductions due to
economies of scale and standardization.
BATTERY PACKS
Li-ion battery pack prices for transportation
applications have declined by 65 percent since
2010 with costs decreasing from $1,000 to
$350/kWh in 2015.15 It should be noted that
in the automotive market, battery pack pricing
and estimates often include cells (only) but
other reports include modules, and BMS,
but rarely include enclosure costs and other
balance-of-system components. In general,
overall high-voltage battery pack prices are
expected to continue decreasing at a rate
between 8 and 15 percent per year depending
on electric vehicle growth rate and policy
implementation assumptions.16
L i-ion battery pack prices
for transportation
applications have declined
by 65 percent since 2010
with costs decreasing from
$1,000 to $350/kWh in
2015. In general, overall high-
voltage battery pack prices
are expected to continue
decreasing at a rate between
8 and 15 percent per year
depending on electric vehicle
growth rate and policy
implementation assumptions.
BALANCE-OF-SYSTEM (BOS)
The market becomes less developed, however,
as the cost component chain moves from
packs to BOS and installation, particularly for
stationary storage. The growth of the solar
industry is putting pressure on inverter prices,
and this is expected to extend somewhat into
the stationary storage market; but two-way
inverters for battery systems are inherently
more complex, and therefore more expensive
than solar inverters. The wide diversity of
stationary storage systems in terms of size
and interconnection requirements means that
standardization in the BOS market will be
slower to materialize. A lack of uniformity in the
industry and adoption of safety standards and
certifications could mean increased cost in the
medium term.

29PRIMER: ECONOMICS OF ENERGY STORAGE
INSTALLATION
Battery systems are often unique and the
skilled workforce needed to install them
is relatively small. In many cases, the only
personnel qualified to install and troubleshoot
these systems will be those who work for the
manufacturer, and in the absence of significant
competition this will keep prices relatively high
for these services in the near- to medium term.
Furthermore, increased safety standards such
as those included in the most recent National
Fire Code may require more specialized
technicians to oversee installations.
OPERATION AND MAINTENANCE (O&M)
A similar trend is expected in the operation
and maintenance (O&M) market. A lack of
widely available qualified technicians will place
a premium on O&M and monitoring services.
Utilities are expected to initially internalize
these costs to support pilot- and small-scale
deployments. However, these high costs should
provide an incentive for third-party specialists
who will bring more competition to the market
and reduce prices in the medium- to long term.
Battery manufacturers are likely to respond by
providing competitive service contracts with
their systems. Established BOS companies
could bid for these contracts and drive
prices down further through standardization;
however, without the levels of investment in
the supply chain seen in the electric vehicle
industry, O&M costs are unlikely to decrease at
a rate comparable to battery cells or packs.
Installation in progress
for the Clay Terrace
Plug-In Ecosystem, a
first-of-its-kind advanced
plug-in electric vehicle
charging system with
solar and battery
storage integration.
The system, now fully
operational in Carmel,
Ind., includes Level 2 and
quick charge charging
stations connected to a
10-kilowatt roof-mounted
solar panel.
ESN's partners include
Duke Energy, ITOCHU
Corporation, Simon
Property Group, and
Toshiba Corporation.

ENERGY STORAGE ROADMAP REPORT30
BATTERY PRICING ANALYSIS AND FORECASTSSUMMARY OF RESEARCH
Understanding current and future pricing of
energy storage systems is a complex task. While
there are many reputable government, market
analysts, manufacturers, and end users publishing
data on battery and energy storage system
pricing, the underlying assumptions and specific
components included in such price forecasts vary
widely. ESN reviewed more than a dozen research
reports and market studies addressing current
and future battery pricing. After a comprehensive
review, we narrowed our focus to eight reports
that we felt were coming from reputable sources
and were not too dated. The majority of the
reports focus on price forecasts for battery
packs in the automotive industry, for which the
market is most mature. It should be noted that
the accumulation of this data represents several
tens of thousands of dollars in value to access
and review the reports and markets studies that
draw from a wide range of automotive OEMs,
Tier One battery suppliers, battery industry
consultants, and government entities.
Each research and consulting firm’s results have
been plotted and represented in Figure 4.
Year
$/kW
h
20152014 2016 201720112010 2012 2013 2018 2019 2020 2021 2022 2023 2024 20250
200
400
600
800
1,000
1,200McKinsey (2017)SAE/Lux (2015)HSBC (2016)CSIRO (2015)EIA (2013)BNEF (2013)Navigant (2013)GTM (2016)Trend Line
Figure 4: Battery Pack Price Forecasts by Industry Market Study, 2010-2025
Assumptions and Disclaimers:
1. Trend line calculated by average of all reported prices forecasted for each year of data included.

31PRIMER: ECONOMICS OF ENERGY STORAGE
As one can immediately observe from
the data plots, the deviation among the
reports’ battery pack pricing projections
demonstrates great variance among the
researchers and market analysts. In fact, the data is so varied that it calls into question any valid guidance to the future of battery pack pricing in the automotive industry. Frankly,
this deviation in industry research, and in
regard to the battery industry, is nothing
new. There are two key factors that we
believe lead to this variation.
First, researchers do not clearly define what
specific cell chemistries or components are
included in their “battery pack” pricing. In
many cases, and as noted previously, report
pricing represents only the cost of cells,
battery management systems and modules,
and possibly battery pack enclosures
and housing, while not addressing or
comprehending other important components
like active thermal management, wiring
and cabling connections, buss-bars, cost of
assembly, etc.
Second, market researchers often derive their
price forecasts by seeking direct figures from
OEMs. This sensitive market dynamic Q&A with
an OEM can lead to artificially low price quotes as
a result of OEMs seeking to communicate to the
market (primarily the investment community)
that battery pack prices are actually coming
down to justify their higher volume sales
projections for EVs and PHEVs.
Therefore, having an accurate and comprehensive
pricing roadmap for energy storage could
be more useful and strategic than having
access to the majority of “expert” reports
available today.
THE BATTERY PRICING FUTURE: AN
ESN PERSPECTIVE
One of the reasons there is such a wide
variety of data and debate in the future of
energy storage pricing topic is due to the wide
range of unique concepts and technologies
involved in an automotive battery pack. Many
of these technologies are often overlooked or
improperly assessed.
To reach the highest integrity in assessment, ESN
has broken down the automotive battery pack
into the following sub-components and topics:
• Battery cells (i.e., NMC, NCA, LFP, LTO)
• BMS and module assemblies (e.g., plastic parts and connections used in sub-assemblies)
• Passive thermal management (e.g., thermal conduction)
• Active thermal management (e.g., thermal convection via air/fans, liquid, etc.)
• High-voltage safety (e.g., automatic, and manual disconnect and switching devices)
• Wiring and cabling connections and buss-bars (between modules)
• Battery pack enclosures and structural housings (i.e., crashworthiness)
• Manufacturing (pack) assembly and
end-of-line (EOL) quality testing
Research and consulting firms are typically
not comprised of engineers or battery pack
specialists, so they rely heavily on industry
journals, interviews, and some inside industry
consultants. In the reports, there appears
to be little appreciation or close agreement
on a consistent “bill of materials” or even the
fundamental battery pack design concept, and
what it includes and does not include. An “apples-
to-apples” comparison approach is needed before

ENERGY STORAGE ROADMAP REPORT32
attempting to assess the future costs of energy
storage in the automotive industry.
As mentioned throughout this report, the
automotive industry is the global leader in (high-
voltage) energy storage solutions; therefore,
a direct correlation to future energy storage
pricing and stationary power applications
or “grid-tied” solutions can be accurately
assessed by drawing from the experience of the
automotive industry. In reality, the durability
and life cycle performance requirements for
automotive battery packs are much higher than
stationary energy storage applications, thereby
over time driving battery pack costs higher
in the automotive industry. The stationary
battery industry would be wise to “borrow” the
learnings, pricing structures, and supply chain
reductions of the automotive industry and
apply to stationary applications. Otherwise,
common mistakes and costs are repeated (e.g.,
Boeing 787 Dreamliner incident; see page 20).
2,1502,100 2,100 2,050
1,950
1,550
1,450 1,450
1,3501,250
1,150
1,0501,000
900 900850
2,1502,100 2,100 2,050
1,950
1,550
1,450 1,450
1,3501,250
1,150
1,0501,000
900 900850
1,6001,550 1,550
1,500
1,350
1,000
900 900800
750
650550
500450
400 400
1,6001,550 1,550
1,500
1,350
1,000
900 900800
750
650550
500450
400 400
2010 2011 2012 2013 2014 2015 2016 2017 2018 2019 2020 2021 2022 2023 2024 20250
500
1,000
1,500
2,000
2,500
Year
$/k
Wh
Passive Thermal
Active Thermal
High Voltage
Connector & Bussing
MFG Costs & QC
Battery Pack Enclosures & Housing
BMS & Modules
NMC/NCA Chemistry
LFP Chemistry
LTO Chemistry
Trend Line - High
Trend Line - Mid
Trend Line - Low
Figure 5: ESN Price Forecast for Full Battery Systems, 2010-2025
Assumptions and Disclaimers:
1. Individual component costs (i.e., thermal, BMS, connector and bussing, etc.) are not precise estimates, but reflect an approximate percentage of the total system cost.
2. Pricing of raw materials for NCM and NCA chemistries is fairly similar, so their pricing is combined in this report.

33PRIMER: ECONOMICS OF ENERGY STORAGE
The reader can observe the plots on ESN’s
“Price Forecast for Full Battery Systems,
2010-2025,” in Figure 5. Notice the previous
years-to-date and the future projections. The
previous years are highly accurate with unique
industry expertise that ESN has been able
to acquire through detailed battery system
engineering and manufacturing expertise. The
future projections were not merely developed
for this report, but leverage learnings from
the past 25 years of energy storage solution
pricing in the automotive industry.
It should also be noted that the ESN price forecast
includes variation for cell chemistry which can
impact the batteries’ energy vs. power profile, cycle
life, and safety as well as the full balance-of-system
components required to deliver an energy storage
system for an automotive application. The forecast
does not include an inverter, which is commonly
included in a stationary energy storage system
bill of materials but typically viewed as a separate
system in automotive applications.
If you compare the ESN trend line to the average
trend line from the eight industry reports, you
will see that ESN shows a much higher cost
for a true energy storage system than what is
commonly being reported in most market
studies. However, given that most market
studies only consider a battery pack to include
the lowest cost chemistries and a subset of
the true balance-of-system components, ESN
developed a second trend line that represents
more of an “apples-to-apples” comparison. This
second trend line that does not include full
systems costs is much closer to the average
trend line of the eight industry reports.
Year
$/kW
h
20152014 2016 201720112010 2012 2013 2018 2019 2020 2021 2022 2023 2024 20250
200
400
600
800
1,200
1,800
1,400
1,600
1,000
327.38 279.56
900
650
450
350
Industy Trend
ESN (Full System)ESN Battery Packs*
Figure 6: Comparison of Industry and ESN Battery Pack Price Forecasts, 2010-2025
Assumptions and Disclaimers:
1. The Industry trend line represents an approximation of pricing trends averaged across all previously mentioned market studies.
2. "ESN Battery Packs" pricing includes approximate pricing (based on approximate percentage of total system cost) for cells (NMC/NCA chemistry), BMS and modules, battery pack enclosures and housing only.
3. "ESN Full System" trend line represents all system costs as represented in Figure 5.
*

ENERGY STORAGE ROADMAP REPORT34
EXPLAINING THE VARIANCE
There are many external factors driving
the disparity between industry data and
ESN’s projections:
1. Inconsistent ingredients: Until recently,
industry analysts did not distinguish
between battery cells and the balance-
of-system. Even today, it is difficult to tell
if analysts are accurately evaluating the
price of individual lithium-ion chemistries,
battery management systems, thermal
management systems, connections,
structural housing and containment, and
the cost of assembly and QC final checks. It
is ESN’s opinion that all these components
are critical to understanding the reality of
the full battery costs. Excluding them makes
for an incomplete and unrealistic picture of
what commercial or retail customers can
expect to pay for these systems. And for the
stationary storage market, ignoring these
components is not a luxury to be afforded.
ESN, as a result, has included all of the above
components to ensure a complete view of
system costs.
2. Public statements made by company leaders: The financial sector is quite in tune
with the fact that the future success of the
electric vehicle market is highly dependent
on battery risk and cost. In order to create a
vision for shareholders and future investors,
OEM CEOs or company leaders often
make orchestrated statements on future
projections of costs per kilowatt-hour on
both battery cells and battery packs. When
these statements are made, the financial
analysis ensues. Nevertheless, investment
decisions are made by large institutions
investing based on their assessment of the
OEM costs per kWh of the future.
3. Illusion of battery pricing moving to $0/kWh: The automotive industry is infamous
for driving profit out of its Tier One supply
communities to the point of bankrupting
companies (e.g., Delphi, Visteon, etc.).
The U.S. Department of Energy (DOE) set
industry target projections several years
ago for automotive battery packs reaching
$100/kWh. The reality of this target pricing
could only result from commodity pricing
of aluminum, cobalt, copper, lithium,
manganese, and nickel reaching $1/
ton of materials or less. It is simply not a
sustainable future for battery suppliers not
to make a profit on their R&D, supply chain,
assembly, and battery delivery products.b
Resources within ESN have been accurately
predicting the future of advanced energy
storage since 2005, with documented and
positive results. As the world increases their
demand for energy storage, more attention
will be paid to the automotive industry which
is driving global supply chains, production,
assembly, warranty, and recycling efforts of
lithium-ion chemistries. ESN has the unique
experience and advanced systems approach
to provide an Energy Storage Roadmap with the
highest integrity and insight possible.
Leveraging the “lessons learned” from the
automotive industry will accelerate stationary
energy storage implementation in the built
environment and decrease technology risk.
Conversely, ignoring the “lessons learned” from
the automotive industry will increase costs, delays,
and risk in advanced energy storage solutions.
Since its introduction to the market in
the late 1990s, the lithium-ion camcorder
battery has retailed between $75-$100
(maintaining profits for two decades).
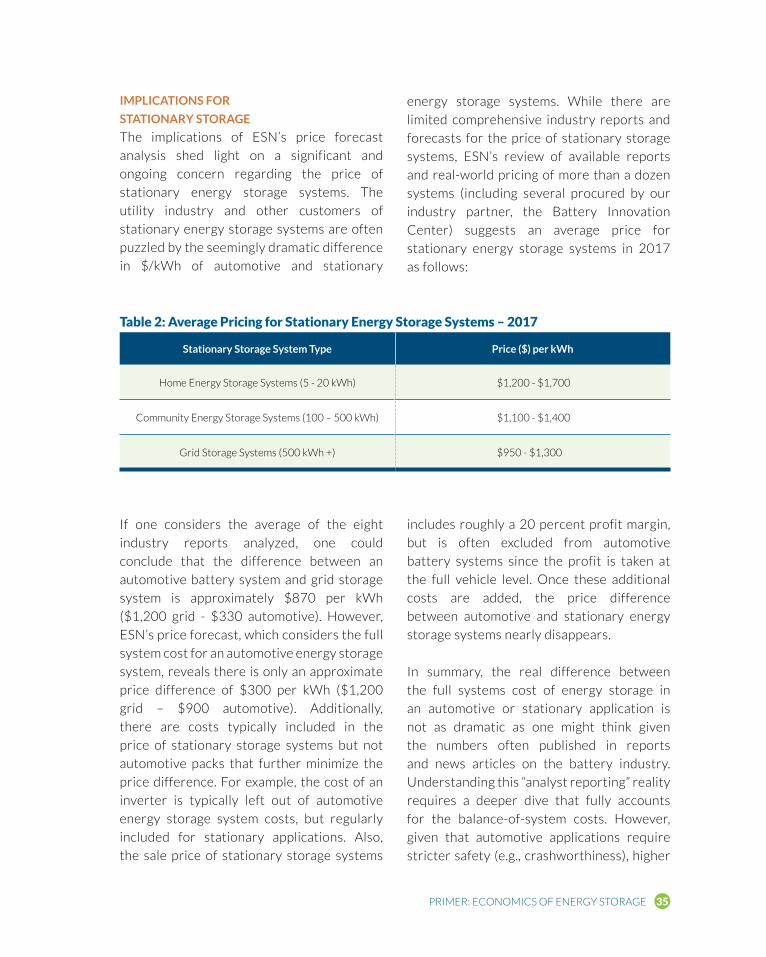
35PRIMER: ECONOMICS OF ENERGY STORAGE
IMPLICATIONS FOR
STATIONARY STORAGE
The implications of ESN’s price forecast
analysis shed light on a significant and
ongoing concern regarding the price of
stationary energy storage systems. The
utility industry and other customers of
stationary energy storage systems are often
puzzled by the seemingly dramatic difference
in $/kWh of automotive and stationary
energy storage systems. While there are
limited comprehensive industry reports and
forecasts for the price of stationary storage
systems, ESN’s review of available reports
and real-world pricing of more than a dozen
systems (including several procured by our
industry partner, the Battery Innovation
Center) suggests an average price for
stationary energy storage systems in 2017
as follows:
If one considers the average of the eight
industry reports analyzed, one could
conclude that the difference between an
automotive battery system and grid storage
system is approximately $870 per kWh
($1,200 grid - $330 automotive). However,
ESN’s price forecast, which considers the full
system cost for an automotive energy storage
system, reveals there is only an approximate
price difference of $300 per kWh ($1,200
grid – $900 automotive). Additionally,
there are costs typically included in the
price of stationary storage systems but not
automotive packs that further minimize the
price difference. For example, the cost of an
inverter is typically left out of automotive
energy storage system costs, but regularly
included for stationary applications. Also,
the sale price of stationary storage systems
includes roughly a 20 percent profit margin,
but is often excluded from automotive
battery systems since the profit is taken at
the full vehicle level. Once these additional
costs are added, the price difference
between automotive and stationary energy
storage systems nearly disappears.
In summary, the real difference between
the full systems cost of energy storage in
an automotive or stationary application is
not as dramatic as one might think given
the numbers often published in reports
and news articles on the battery industry.
Understanding this “analyst reporting” reality
requires a deeper dive that fully accounts
for the balance-of-system costs. However,
given that automotive applications require
stricter safety (e.g., crashworthiness), higher
Table 2: Average Pricing for Stationary Energy Storage Systems – 2017
Stationary Storage System Type Price ($) per kWh
Home Energy Storage Systems (5 - 20 kWh) $1,200 - $1,700
Community Energy Storage Systems (100 – 500 kWh) $1,100 - $1,400
Grid Storage Systems (500 kWh +) $950 - $1,300
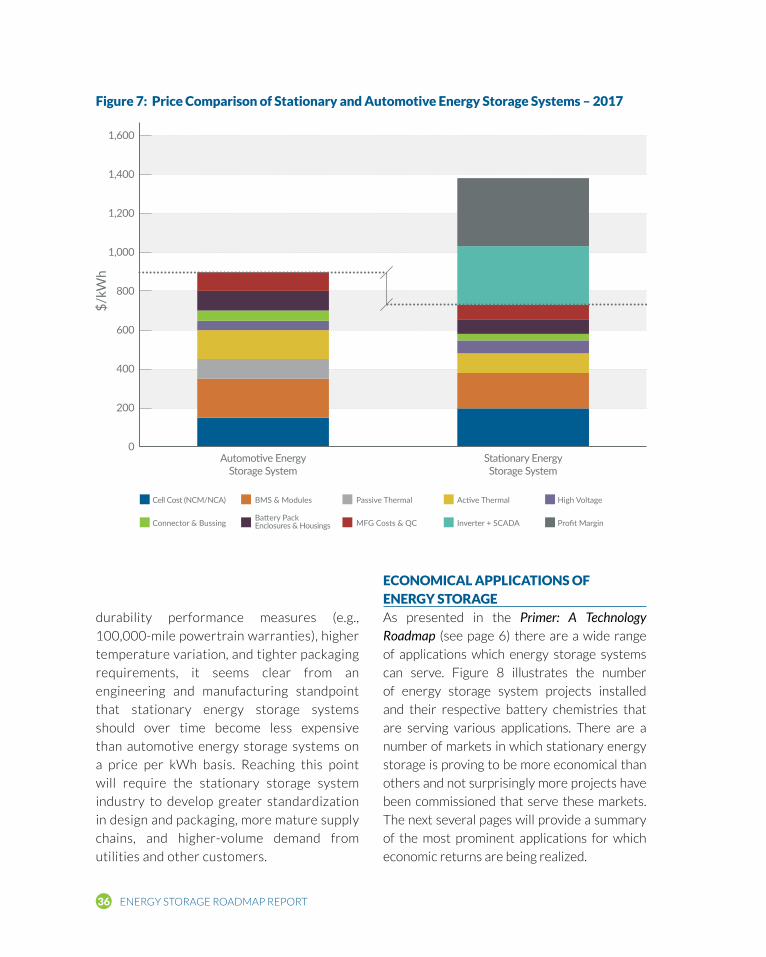
ENERGY STORAGE ROADMAP REPORT36
durability performance measures (e.g.,
100,000-mile powertrain warranties), higher
temperature variation, and tighter packaging
requirements, it seems clear from an
engineering and manufacturing standpoint
that stationary energy storage systems
should over time become less expensive
than automotive energy storage systems on
a price per kWh basis. Reaching this point
will require the stationary storage system
industry to develop greater standardization
in design and packaging, more mature supply
chains, and higher-volume demand from
utilities and other customers.
0
200
400
600
800
1,000
1,200
1,400
1,600
Automotive EnergyStorage System
Stationary EnergyStorage System
$/kW
h
Cell Cost (NCM/NCA) BMS & Modules Passive Thermal Active Thermal High Voltage
Connector & BussingBattery Pack Enclosures & Housings MFG Costs & QC Inverter + SCADA Profit Margin
Figure 7: Price Comparison of Stationary and Automotive Energy Storage Systems – 2017
ECONOMICAL APPLICATIONS OF ENERGY STORAGEAs presented in the Primer: A Technology Roadmap (see page 6) there are a wide range
of applications which energy storage systems
can serve. Figure 8 illustrates the number
of energy storage system projects installed
and their respective battery chemistries that
are serving various applications. There are a
number of markets in which stationary energy
storage is proving to be more economical than
others and not surprisingly more projects have
been commissioned that serve these markets.
The next several pages will provide a summary
of the most prominent applications for which
economic returns are being realized.
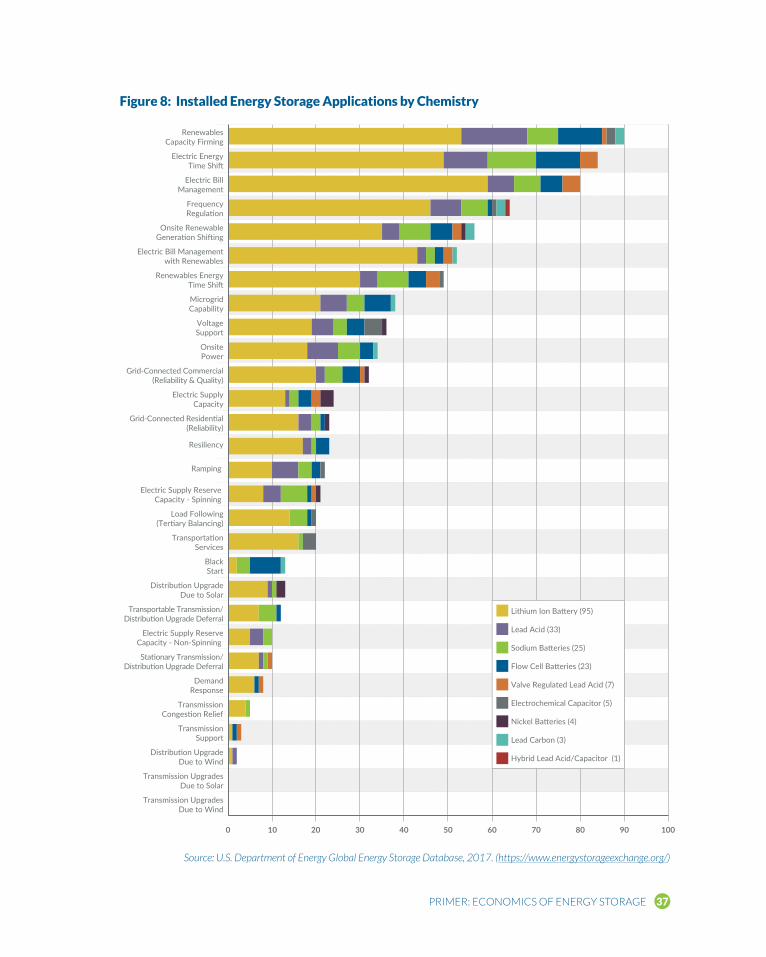
37PRIMER: ECONOMICS OF ENERGY STORAGE
0 10 20 30 40 50 60 70 80 90 100
Transmission UpgradesDue to Wind
Transmission UpgradesDue to Solar
Distribution UpgradeDue to Wind
TransmissionSupport
TransmissionCongestion Relief
DemandResponse
Stationary Transmission/Distribution Upgrade Deferral
Electric Supply ReserveCapacity - Non-Spinning
Transportable Transmission/Distribution Upgrade Deferral
Distribution UpgradeDue to Solar
BlackStart
TransportationServices
Load Following(Tertiary Balancing)
Electric Supply Reserve Capacity - Spinning
Ramping
Resiliency
Grid-Connected Residential(Reliability)
Electric SupplyCapacity
Grid-Connected Commercial(Reliability & Quality)
OnsitePower
VoltageSupport
MicrogridCapability
Renewables EnergyTime Shift
Electric Bill Managementwith Renewables
Onsite RenewableGeneration Shifting
FrequencyRegulation
Electric BillManagement
Electric EnergyTime Shift
RenewablesCapacity Firming
Lithium Ion Battery (95)
Lead Acid (33)
Sodium Batteries (25)
Flow Cell Batteries (23)
Valve Regulated Lead Acid (7)
Electrochemical Capacitor (5)
Nickel Batteries (4)
Lead Carbon (3)
Hybrid Lead Acid/Capacitor (1)
Figure 8: Installed Energy Storage Applications by Chemistry
Source: U.S. Department of Energy Global Energy Storage Database, 2017. (https://www.energystorageexchange.org/)
ENERGY STORAGE ROADMAP REPORT38
RENEWABLES CAPACITY FIRMING
Renewables such as wind and solar are
intermittent in nature and pose a challenge to
a grid that is designed for generation from coal,
natural gas, and nuclear power – all of which
are more consistent sources of generation.
As renewables connected to the grid grow,
the value of a storage system that can smooth
the power/energy profile will grow as well.
The value of these storage systems will need
to be compared with the cost of fast-ramping
generation sources, such as natural gas, which
is also currently being used to compensate for
the intermittency of renewables. Renewable
capacity firming is the most stated potential
application for battery systems (90) according
to the U.S. Department of Energy Global
Energy Storage database, accounting for about
11 percent of all declared potential applications
for batteries.
DEMAND CHARGE MANAGEMENT
In general, long-term energy storage is the most
expensive application of a battery. The economics
of long-term storage is most likely to be feasible
only when the cost of energy is high, such as high
peak demand charges. Various studies currently
place the break-even price point for demand
charge management at between $.09 and $.15/
kWh25 As the costs of battery systems decline,
the break-even price point should decline as well
– possibly as low as $.04-.05/kWh by 2020.26
Electric bill management accounts for 10
percent of all declared potential applications for
installed battery systems in the U.S., according
to the U.S. Department of Energy Global Energy
Storage database.
FREQUENCY REGULATION
Frequency regulation is a short-term
(millisecond-to-second) combination of energy
absorption and emission by the storage system
to help maintain optimum operating frequency
range on the grid. These applications do not
necessarily require high-energy-density,
large-capacity battery systems; therefore,
they are more likely to provide value without
the relatively high capital investment that is
required for long-term discharge systems that
are needed for demand charge management
and time shifting systems. Services such
as frequency regulation play to batteries’
strengths as a technology that can both receive
and produce energy and operate on shorter
timescales than conventional technologies.
Frequency regulation accounts for 8 percent
of all declared potential application for
installed battery systems in the U.S., according
to the U.S. Department of Energy Global
Energy Storage database.
TRANSMISSION AND DISTRIBUTION
UPGRADE DEFERRAL
The grid system needs to be designed to
manage energy demands throughout the
year. Even in a relatively stable profile, there
will be times when energy demand can peak
above what is normally required. Knowing
this, utilities must be prepared for peak loads
that may only be expected to happen over
a very short time frame – sometimes only a
few peak hours throughout the entire year.
Installing equipment to account for this fact
is very expensive and the equipment is often
permanent – a sunk cost.
Energy storage is likely to have real value in
this case because it can be installed in place of
expensive transmission and distribution (T&D)
equipment to handle the expected, but rare, peak
loads. This may serve the needs of the utility for
a couple of years. However, as the local market
grows, the demands may exceed the ability of
the storage system to meet those needs. At this

39PRIMER: ECONOMICS OF ENERGY STORAGE
point, the storage system can be called on to
meet other needs such as frequency regulation,
capacity firming, etc. It should also be noted that
it is possible the storage system was performing
these functions since it was installed, so it may
have value as a stacked resource beyond simply
providing T&D equipment investment deferral.
Furthermore, the system can be moved to
another location and again permit the deferral
of T&D investment elsewhere. In this way, the
storage system’s value can be extended over a
longer time frame and for multiple applications.
Transmission and distribution upgrade deferral
can also be used to reduce the risks associated
with uncertainty in demand growth. For
instance, a new housing development may
quickly become a source of growing electricity
demand, but the development itself is a source
of uncertainty. A utility may avoid investing
in permanent infrastructure and use storage
to meet peak demand until the development
becomes more ascertainable.
ELECTRIC CAPACITY SPINNING RESERVES
Spinning reserves are systems that are
already frequency synchronized but not
releasing energy to the grid. Usually they
are spare capacity in a unit that is currently
generating electricity. Storage is seeing a small
but growing market as an element in spinning
reserves. One example is the GE-Southern
California Edison (SCE) partnership to create
a battery/gas turbine hybrid system to mitigate
the gas supply shortages associated with the
Aliso Canyon gas leak.27 There are currently at
least 22 battery systems with the potential to
act as spinning reserves throughout the U.S.,
including several in California, Texas, Alaska,
New York and the Midwest.
While the market for each of these applications
alone is currently small, there is the potential
for added value from multiple applications
from the same battery system. See "The
Values and Issues Associated with Application
Stacking" in the Applications section.
These economical applications are demonstrated
by real-world installations across the United
States, illustrated in Figure 10 (see page 48).
MEASURING THE VALUE OF STORAGE COMPARED TO ALTERNATIVESTo attract private investment in the budding
storage industry, investors must have confidence
that storage technologies will bring greater
value (adjusted for risk) than that of comparable
investments. Thus, measuring the value of
storage is key to being able to compare it to
that of other technologies. This continues
to be a great challenge and priority for the
storage industry.
The levelized cost of electricity (LCOE)
(sometimes referred to as “levelized cost of
energy”) is a metric developed as a means to
compare the competitiveness of different power
generation technologies. The LCOE gives a $/
kWh value representing the cost of building,
financing, fueling, operating, and maintaining
a plant over its useful life, inclusive of certain
operating assumptions (e.g., capacity factor).
The advantages of LCOE are its familiarity in the
power industry and its ability to offer a method
of easily comparing technologies. However,
LCOE depends heavily on the assumptions it
embodies – particularly the cost of different
fuels and estimates of government policies. The
LCOE is also less useful at the local level, where
other factors may be more important in making
decisions regarding which technology is best to
meet a given need.28
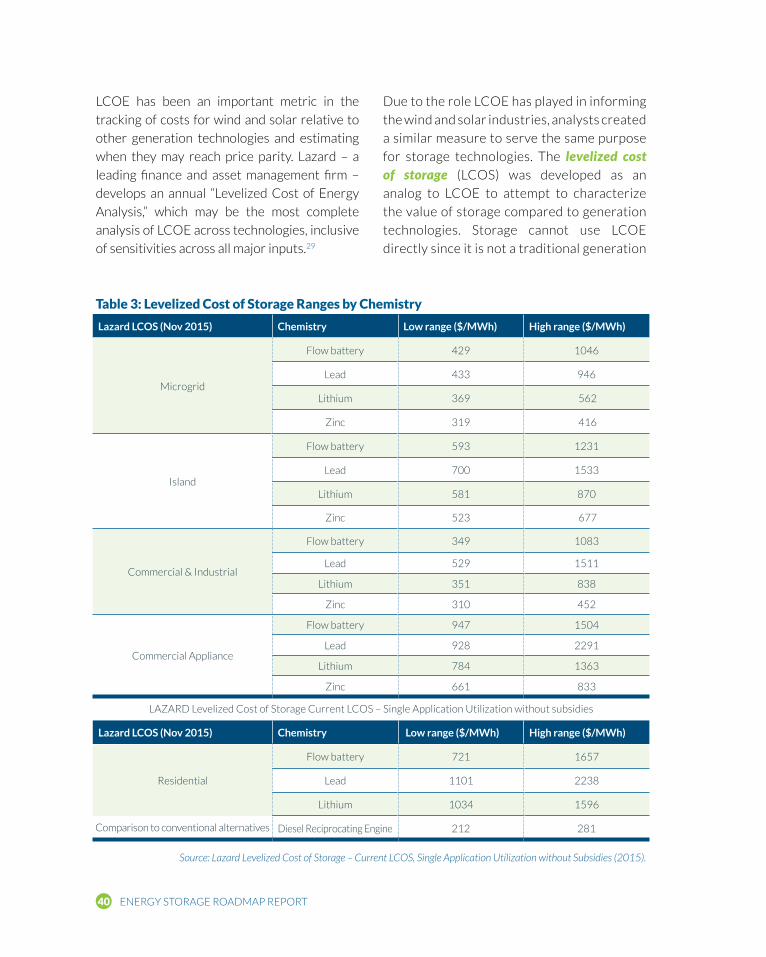
ENERGY STORAGE ROADMAP REPORT40
Source: Lazard Levelized Cost of Storage – Current LCOS, Single Application Utilization without Subsidies (2015).
LCOE has been an important metric in the
tracking of costs for wind and solar relative to
other generation technologies and estimating
when they may reach price parity. Lazard – a
leading finance and asset management firm –
develops an annual “Levelized Cost of Energy
Analysis,” which may be the most complete
analysis of LCOE across technologies, inclusive
of sensitivities across all major inputs.29
Due to the role LCOE has played in informing
the wind and solar industries, analysts created
a similar measure to serve the same purpose
for storage technologies. The levelized cost of storage (LCOS) was developed as an
analog to LCOE to attempt to characterize
the value of storage compared to generation
technologies. Storage cannot use LCOE
directly since it is not a traditional generation
Table 3: Levelized Cost of Storage Ranges by Chemistry
Lazard LCOS (Nov 2015) Chemistry Low range ($/MWh) High range ($/MWh)
Microgrid
Flow battery 429 1046
Lead 433 946
Lithium 369 562
Zinc 319 416
Island
Flow battery 593 1231
Lead 700 1533
Lithium 581 870
Zinc 523 677
Commercial & Industrial
Flow battery 349 1083
Lead 529 1511
Lithium 351 838
Zinc 310 452
Commercial Appliance
Flow battery 947 1504
Lead 928 2291
Lithium 784 1363
Zinc 661 833
LAZARD Levelized Cost of Storage Current LCOS – Single Application Utilization without subsidies
Lazard LCOS (Nov 2015) Chemistry Low range ($/MWh) High range ($/MWh)
Residential
Flow battery 721 1657
Lead 1101 2238
Lithium 1034 1596
Comparison to conventional alternatives Diesel Reciprocating Engine 212 281
41PRIMER: ECONOMICS OF ENERGY STORAGE
asset; even when serving an application for
the provision of energy, its costs depend
on the price of charging. LCOS attempts to
measure the average net revenue per unit of
energy a storage system must bring in over
its lifetime to recover its capital and O&M
costs.30 Table 3 (see page 40) demonstrates
the LCOS range by chemistry across several
different applications.
However, even the LCOS is far from a perfect
means of comparing storage and generation
technologies. The measure is arbitrary in that
its value depends on the actual application it
serves and the context in which it’s deployed.
It is also incomplete, as it does not capture
all of the avenues through which storage
can generate revenue.31 The LCOS may not
take other important features into account,
including a storage technology’s advantage
in flexibility, dispatch time, or added value
to the grid in terms of reliability or reduced
emissions. At this time, there is no single
method of comparing storage with generation
assets, making it difficult to know when a
technology reaches cost parity.
Lazard is also the primary source for
LCOS estimates. Lazard’s analysis covers a
combination of a wide range of energy storage
technologies and ten “use cases.” Yet while the
analysis provides insightful information, Lazard
recognizes and states upfront that it does not
analyze several important aspects, including:
• Storage systems serving and drawing
revenue from multiple applications;
• The value of storage in a particular
market context;
• A clear comparison to conventional
generation technologies, among
other factors.32
In measuring the true value of storage, one
must consider a range of factors. The cost
curve is a very important component of a
storage technology’s financial viability and
must be understood. On the revenue side,
a representation of a storage technology’s
revenue streams – derived from the value
storage can bring to the grid by serving
one or more applications – is also needed.
Revenue streams depend on context (e.g.,
application, generation portfolio of the grid,
market structure), so one measure (e.g.,
LCOS) likely cannot exist to characterize
storage in general.33 Thus, focus should be
placed on the specific value storage can bring
to a particular situation.
However, while LCOS and Lazard's study
may not tell the whole story, they do provide
helpful cost-based information and represent
R evenue streams
depend on context
(e.g., application, generation
portfolio of the grid, market
structure), so one measure
(e.g., LCOS) likely cannot exist
to characterize storage in
general. Thus, focus should
be placed on the specific
value storage can bring to a
particular situation.

ENERGY STORAGE ROADMAP REPORT42
the best generalized measure of value available
at this time. As long as market analysts
understand that there are value aspects that
LCOS does not cover, they can still glean
useful information about the value of different
storage technologies in different applications.
They can also make educated guesses about
how they compare to relevant conventional
technologies and discuss the value of storage
with a common unit of measure. Thus, it is still
a useful exercise to become familiar with the
latest LCOS estimates.
The Battery Innovation Center (BIC), formed and launched in 2013 by ESN, is a $20 million R&D and prototype
manufacturing facility focused on advancing the energy storage market. It is also home to Underwriters Laboratories' (UL)
Battery & Energy Storage Technology (BEST) Test Center.
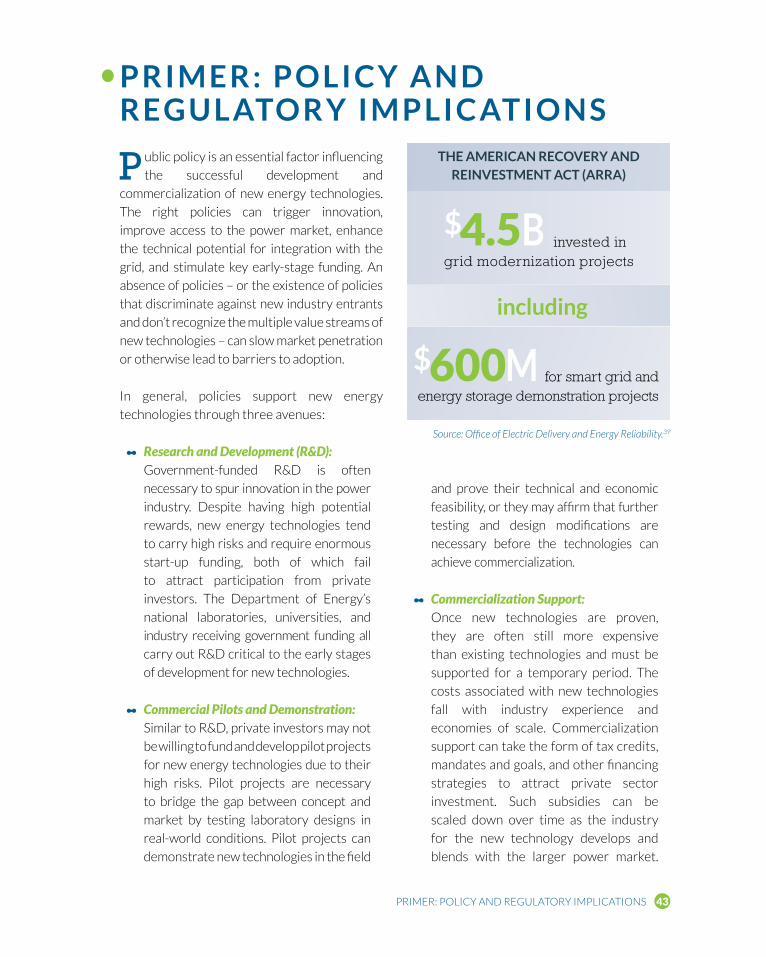
43PRIMER: POLICY AND REGULATORY IMPLICATIONS
P ublic policy is an essential factor influencing
the successful development and
commercialization of new energy technologies.
The right policies can trigger innovation,
improve access to the power market, enhance
the technical potential for integration with the
grid, and stimulate key early-stage funding. An
absence of policies – or the existence of policies
that discriminate against new industry entrants
and don’t recognize the multiple value streams of
new technologies – can slow market penetration
or otherwise lead to barriers to adoption.
In general, policies support new energy
technologies through three avenues:
• Research and Development (R&D):Government-funded R&D is often
necessary to spur innovation in the power
industry. Despite having high potential
rewards, new energy technologies tend
to carry high risks and require enormous
start-up funding, both of which fail
to attract participation from private
investors. The Department of Energy’s
national laboratories, universities, and
industry receiving government funding all
carry out R&D critical to the early stages
of development for new technologies.
• Commercial Pilots and Demonstration: Similar to R&D, private investors may not
be willing to fund and develop pilot projects
for new energy technologies due to their
high risks. Pilot projects are necessary
to bridge the gap between concept and
market by testing laboratory designs in
real-world conditions. Pilot projects can
demonstrate new technologies in the field
P R I M E R : P O L I C Y A N D R E G U L ATO R Y I M P L I C AT I O N S
and prove their technical and economic
feasibility, or they may affirm that further
testing and design modifications are
necessary before the technologies can
achieve commercialization.
• Commercialization Support: Once new technologies are proven,
they are often still more expensive
than existing technologies and must be
supported for a temporary period. The
costs associated with new technologies
fall with industry experience and
economies of scale. Commercialization
support can take the form of tax credits,
mandates and goals, and other financing
strategies to attract private sector
investment. Such subsidies can be
scaled down over time as the industry
for the new technology develops and
blends with the larger power market.
THE AMERICAN RECOVERY AND REINVESTMENT ACT (ARRA)
Source: Office of Electric Delivery and Energy Reliability.39
grid modernization projectsinvested in
$4.5B
including
energy storage demonstration projects
$600M for smart grid and
ENERGY STORAGE ROADMAP REPORT44
Additionally, commercialization support
may also take the form of changing or
clarifying market rules, particularly for
technologies that do not fit traditional
models for the power industry.
FEDERAL POLICYKEY FEDERAL BODIES:
• The Federal Energy Regulatory Commission (FERC) is an independent federal agency
responsible for regulating the interstate
transmission of natural gas, oil, and
electricity. FERC also has regulatory
power over the wholesale electricity
market; it does not have jurisdiction at the
retail level, however.34 FERC plays a role in
the commercialization of energy storage
by revising market rules to level the
playing field and enable new technologies
to participate in wholesale power markets.
FERC has been fairly active in the energy
storage space over the last decade; initially,
it issued orders preventing discrimination
against storage technologies, and more
recently considered a rule that would
create a market participation model for
energy storage resources that accounts
for their unique characteristics.35,36,37
• The Department of Energy (DOE) is a
federal agency overseeing several energy,
environmental, and nuclear programs. DOE
affects energy storage through research
and development at its national laboratories,
and by funding advanced research projects
and grid modernization, clean energy, and
energy efficiency programs.38 DOE oversaw
the implementation of funding for energy
projects from the American Recovery and
Reinvestment Act (ARRA) of 2009. Through
ARRA, DOE invested about $4.5 billion
in grid modernization projects, including
$600 million dedicated to smart grid and
energy storage demonstration projects.39
ARRA also granted the initial budget of
DOE’s Advanced Research Projects Agency
– Energy (ARPA-E), which funds high-
potential, high-impact energy technologies
that are not sufficiently developed to attract
private sector investment.40
• The North American Electric Reliability Corporation (NERC) is a nonprofit
international organization that focuses on
maintaining the reliability and security of
the North American power grid. NERC
accomplishes this by designing and enforcing
reliability standards and monitoring the grid.
While NERC’s reliability standards indirectly
affect the use of energy storage as a grid
asset, NERC does not focus specifically on
the advancement of these technologies, nor
does it promote a public-facing position.41
A n absence of policies
– or the existence of
policies that discriminate
against new industry
entrants and don’t recognize
the multiple value streams
of new technologies – can
slow market penetration or
otherwise lead to barriers
to adoption.
45PRIMER: POLICY AND REGULATORY IMPLICATIONS
Over the years, certain orders, programs, and
standards from FERC, DOE, and NERC have
changed the landscape regarding the capacity
of, and market rules for, energy storage to
participate in the grid. These bodies are also the
entities most likely to change federal, interstate,
and wholesale market rules moving forward.
PROMINENT FEDERAL ACTIONS:
• FERC Order 890 in 2007 required increased
transparency and coordination in the planning
and use of the transmission system, with a
goal of addressing undue discrimination (i.e.,
against the use of energy storage).42,43
• The DOE Smart Grid Demonstration Program (SGDP), first authorized by
the Energy Independence and Security
Act of 2007, was created as a means to
demonstrate the feasibility of new smart
grid-related technologies. Through this
program, DOE offers to fund up to 50
percent of the costs of selected projects.
Energy storage projects used for grid-scale
applications are specifically identified as
being eligible for SGDP grants.44,b
• FERC Order 719 in 2008 required
Independent System Operators (ISOs)
and Regional Transmission Organizations
(RTOs) to allow demand response (DR)
resources to participate in ancillary service
and joint energy-ancillary service markets.
Such resources must make clear their limits
on the duration, frequency, and amount of
the service they are offering. This order
therefore allows energy storage systems
to participate directly in such markets.45,46
b The Smart Grid Investment Grant (SGIG)
program operates in a similar manner, and also
includes funding for energy storage projects.
• FERC Order 1000 in 2011 is a landmark
rule that reformed FERC’s requirements
for electric transmission planning and cost
allocation for public utility transmission
providers. Under this order, grid operators
must plan transmission on a regional level
and allow for competition by independent
power producers (IPPs) in building power
lines. Since energy storage can often provide
a cost-effective alternative to building or
upgrading transmission lines, this order
provides another avenue for storage
participation in the power market.47,48,49
• FERC Order 755 in 2011 requires
that technologies providing frequency
regulation services to the grid receive
compensation based on the value of the
service. ISOs and RTOs traditionally look to
a variety of resources to provide frequency
regulation, but these resources differ on
their flexibility and accuracy. This order
promotes energy storage technologies,
since they have the potential to provide
much higher quality frequency regulation
services and now must be compensated
for their added value.50,51
• In 2016, the White House announced
executive actions and private sector
commitments expected to result in
more than 1.3 GW of energy storage
procurement or deployment and $1 billion
in energy storage investments within the
next five years. Such actions range from
building new storage capacity on military
bases to utilities announcing programs to
install smart water heaters.52
• FERC issued a policy statement in 2017
through Docket No. PL17-2-000 providing
guidance for energy storage resources

ENERGY STORAGE ROADMAP REPORT46
looking to recover costs through cost- and
market-based revenues. The statement
discusses that energy storage technologies
are technically capable of providing
multiple services, and it clarifies issues
that should be addressed should a storage
system seek to recover costs through
multiple revenue streams.53
• The DOE Energy Storage Technology Advancement Partnership (ESTAP) is a
cooperative between DOE and interested
states that provides funding for and
promotes information sharing regarding
energy storage technologies. ESTAP
manages the State Energy Storage Network,
gathers information about state energy
storage activities, works with stakeholders to
develop new storage projects, and provides
technical assistance through energy
storage webinars.54
ACTIONS UNDER CONSIDERATION:
• Under FERC NOPR 16-23-000 issued in
November of 2016, FERC is proposing
to remove several barriers to energy
storage participation in ISO/RTO
capacity, energy, and ancillary service
markets. The first portion of the proposal
looks to implement market rules that
accommodate the unique “physical and
operational characteristics” of energy
storage technologies. The second
portion defines a “distributed energy
resource aggregator” as an entity that
can participate in any markets in which
it is capable of serving based on its
characteristics.55,56 A distributed energy
resource aggregator may consist of solar
PV, battery storage, and a hot water
heater, for example.57
INDEPENDENT SYSTEM OPERATORS (ISO) AND REGIONAL TRANSMISSION ORGANIZATIONS (RTO)ISOs and RTOs have been set up around the
country and play a few key roles, including
managing unbiased access to the transmission
system for all resources; managing the reliable,
efficient commitment and dispatch of those
resources with respecting to the flow limits
of the transmission system; and directing the
overall reliability of the system. They commit
and dispatch generation and other resources
based on the offers provided by the asset
owners. They also set the terms by which assets
must participate in each particular market.
These rules are tariff-based and regulated
by FERC. RTOs are voluntary organizations.
Choosing to opt in generally reduces a utility’s
cost and provides them opportunities to sell
excess capacity or energy. Seven ISO/RTOs
serve various regions across the United States,
while the Southeast and much of the Southwest
(except California) operate independent of an
ISO/RTO. The seven ISO/RTOs are as follows:
• California Independent System Operator (CAISO) occupies most of California and
parts of Nevada. CAISO has been very active
in the energy storage space, working with the
California Public Utility Commission and the
California Energy Commission on a detailed
roadmap to advance the use of storage
technologies.58 CAISO’s roles in the roadmap
include clarifying rules and evaluating
new opportunities in rate treatment,
interconnection, and market participation
of energy storage. CAISO is also working
through a multi-phase Energy Storage and
Distributed Energy Resources (ESDER)
initiative, which has recently led to new tariff
structures and FERC filings.59 California’s
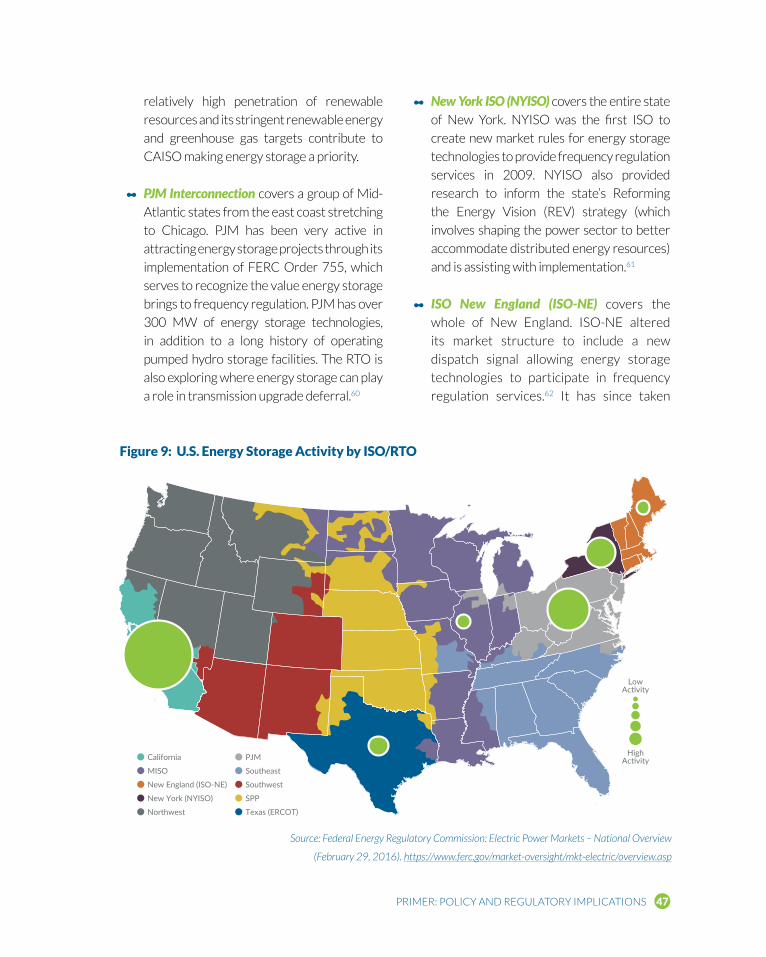
47PRIMER: POLICY AND REGULATORY IMPLICATIONS
relatively high penetration of renewable
resources and its stringent renewable energy
and greenhouse gas targets contribute to
CAISO making energy storage a priority.
• PJM Interconnection covers a group of Mid-
Atlantic states from the east coast stretching
to Chicago. PJM has been very active in
attracting energy storage projects through its
implementation of FERC Order 755, which
serves to recognize the value energy storage
brings to frequency regulation. PJM has over
300 MW of energy storage technologies,
in addition to a long history of operating
pumped hydro storage facilities. The RTO is
also exploring where energy storage can play
a role in transmission upgrade deferral.60
• New York ISO (NYISO) covers the entire state
of New York. NYISO was the first ISO to
create new market rules for energy storage
technologies to provide frequency regulation
services in 2009. NYISO also provided
research to inform the state’s Reforming
the Energy Vision (REV) strategy (which
involves shaping the power sector to better
accommodate distributed energy resources)
and is assisting with implementation.61
• ISO New England (ISO-NE) covers the
whole of New England. ISO-NE altered
its market structure to include a new
dispatch signal allowing energy storage
technologies to participate in frequency
regulation services.62 It has since taken
California
MISO
New England (ISO-NE)
New York (NYISO)
Northwest
PJM
Southeast
Southwest
SPP
Texas (ERCOT)
LowActivity
HighActivity
Figure 9: U.S. Energy Storage Activity by ISO/RTO
Source: Federal Energy Regulatory Commission: Electric Power Markets – National Overview
(February 29, 2016). https://www.ferc.gov/market-oversight/mkt-electric/overview.asp
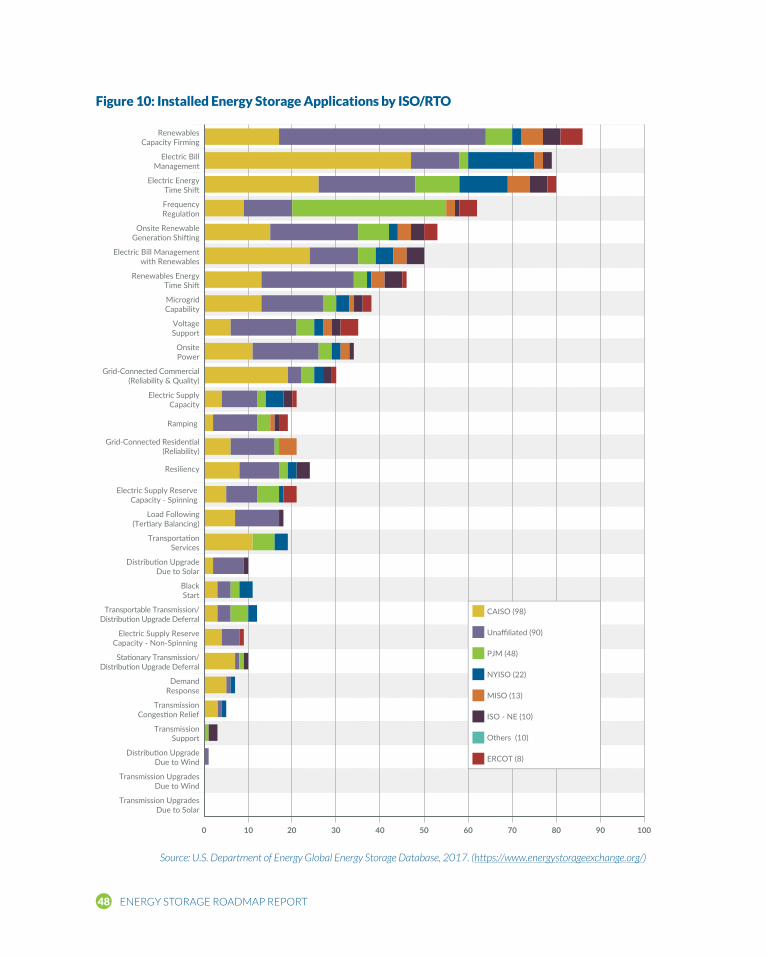
ENERGY STORAGE ROADMAP REPORT48
CAISO (98)
Unaffiliated (90)
PJM (48)
NYISO (22)
MISO (13)
ISO - NE (10)
Others (10)
ERCOT (8)
Transmission UpgradesDue to Solar
Transmission UpgradesDue to Wind
Distribution UpgradeDue to Wind
TransmissionSupport
TransmissionCongestion Relief
DemandResponse
BlackStart
Distribution UpgradeDue to Solar
TransportationServices
Resiliency
Ramping
Electric SupplyCapacity
OnsitePower
VoltageSupport
MicrogridCapability
Renewables EnergyTime Shift
Onsite RenewableGeneration Shifting
Electric EnergyTime Shift
Electric BillManagement
RenewablesCapacity Firming
FrequencyRegulation
Electric Bill Managementwith Renewables
Grid-Connected Commercial(Reliability & Quality)
Grid-Connected Residential(Reliability)
Electric Supply Reserve Capacity - Spinning
Load Following(Tertiary Balancing)
Transportable Transmission/Distribution Upgrade Deferral
Electric Supply ReserveCapacity - Non-Spinning
Stationary Transmission/Distribution Upgrade Deferral
0 10 20 30 40 50 60 70 80 90 100
Figure 10: Installed Energy Storage Applications by ISO/RTO
Source: U.S. Department of Energy Global Energy Storage Database, 2017. (https://www.energystorageexchange.org/)
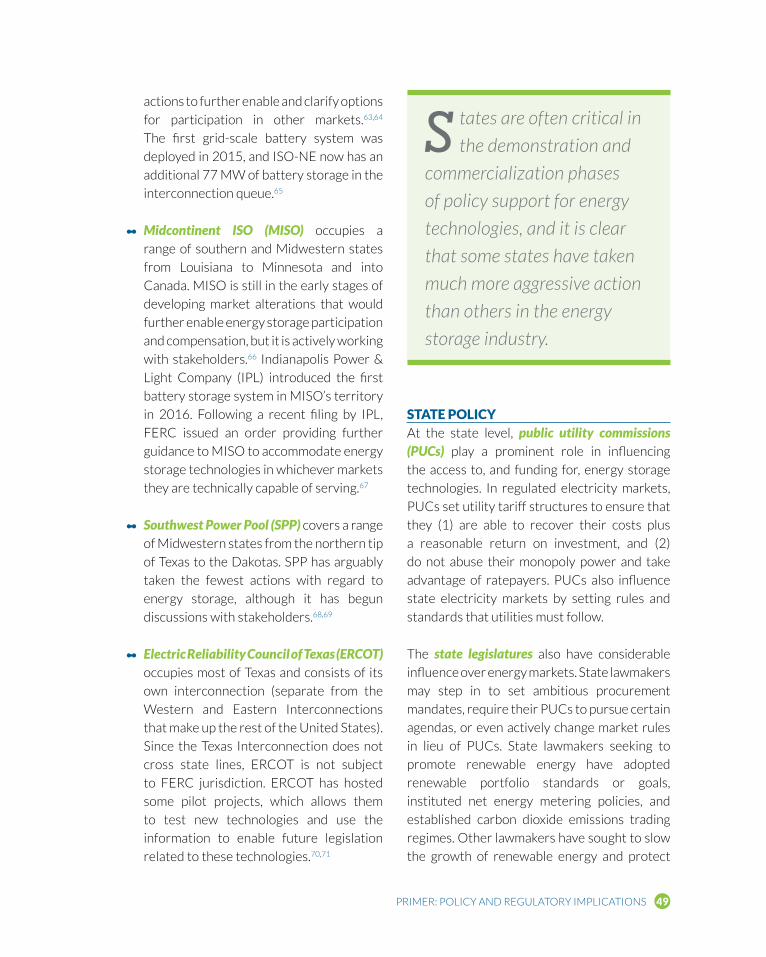
49PRIMER: POLICY AND REGULATORY IMPLICATIONS
actions to further enable and clarify options
for participation in other markets.63,64
The first grid-scale battery system was
deployed in 2015, and ISO-NE now has an
additional 77 MW of battery storage in the
interconnection queue.65
• Midcontinent ISO (MISO) occupies a
range of southern and Midwestern states
from Louisiana to Minnesota and into
Canada. MISO is still in the early stages of
developing market alterations that would
further enable energy storage participation
and compensation, but it is actively working
with stakeholders.66 Indianapolis Power &
Light Company (IPL) introduced the first
battery storage system in MISO’s territory
in 2016. Following a recent filing by IPL,
FERC issued an order providing further
guidance to MISO to accommodate energy
storage technologies in whichever markets
they are technically capable of serving.67
• Southwest Power Pool (SPP) covers a range
of Midwestern states from the northern tip
of Texas to the Dakotas. SPP has arguably
taken the fewest actions with regard to
energy storage, although it has begun
discussions with stakeholders.68,69
• Electric Reliability Council of Texas (ERCOT) occupies most of Texas and consists of its
own interconnection (separate from the
Western and Eastern Interconnections
that make up the rest of the United States).
Since the Texas Interconnection does not
cross state lines, ERCOT is not subject
to FERC jurisdiction. ERCOT has hosted
some pilot projects, which allows them
to test new technologies and use the
information to enable future legislation
related to these technologies.70,71
STATE POLICYAt the state level, public utility commissions (PUCs) play a prominent role in influencing
the access to, and funding for, energy storage
technologies. In regulated electricity markets,
PUCs set utility tariff structures to ensure that
they (1) are able to recover their costs plus
a reasonable return on investment, and (2)
do not abuse their monopoly power and take
advantage of ratepayers. PUCs also influence
state electricity markets by setting rules and
standards that utilities must follow.
The state legislatures also have considerable
influence over energy markets. State lawmakers
may step in to set ambitious procurement
mandates, require their PUCs to pursue certain
agendas, or even actively change market rules
in lieu of PUCs. State lawmakers seeking to
promote renewable energy have adopted
renewable portfolio standards or goals,
instituted net energy metering policies, and
established carbon dioxide emissions trading
regimes. Other lawmakers have sought to slow
the growth of renewable energy and protect
S tates are often critical in
the demonstration and
commercialization phases
of policy support for energy
technologies, and it is clear
that some states have taken
much more aggressive action
than others in the energy
storage industry.
ENERGY STORAGE ROADMAP REPORT50
legacy power plants by repealing policies,
adopting sunset provisions or caps, and even
proposing to tax renewable energy.72 While
some states have put forth significant bills
related to energy storage, legislative action on
this issue is still relatively new.
States are often critical in the demonstration
and commercialization phases of policy support
for energy technologies, and it is clear that some
states have taken much more aggressive action
than others in the energy storage industry. By
looking at PUC and legislative actions, significant
differences become evident among states in their
support of (or indifference to) energy storage.
PROMINENT STATE ACTIONS:
• The California Public Utility Commission (CPUC) enacted the Self Generation Incentive Program (SGIP) in 2009, allowing
customers of qualified behind-the-meter
distributed energy systems to receive
rebates on their purchases on a $/W basis.
The program currently funds advanced energy storage systems, but CPUC
reopened the incentive to energy storage
projects in May 2017.73
• The Public Utility Commission of Texas ordered Project Number 39917 in 2012,
which determined that energy used to
charge an energy storage facility should be
treated as a wholesale transaction rather
than be priced as end-use consumption.
This price difference affects the economic
efficiency and viability of storage projects
and influences decisions regarding their
location on the grid.74
• The California Public Utility Commission
adopted an Energy Storage Procurement
Framework in 2013 (as directed by
Assembly Bill 2514) and set an energy
storage target of 1.325 GW for the state’s
three major utilities by 2020. The utilities
must submit periodic procurement plans
to be approved by the CPUC. The CPUC is
also engaging in continued work to refine
and improve the program.75
• The Public Utility Commission of Texas
ordered Project Number 40150 in 2013,
which granted the Electric Reliability
Council of Texas (ERCOT) the authority to
conduct pilot projects, exempt from ERCOT
rules. These pilot projects allow ERCOT
to test new technologies (e.g., energy
storage), the results of which can influence
future ERCOT rules and procedures.76
• The Hawaii Public Utilities Commission was
directed in 2014 by House Bill 1943 to value
the use of advanced grid modernization
technology in an effort to improve the grid’s
reliability and efficiency. The commission
must base decisions on several principles,
including increasing the ease with which
distributed generation resources can
connect with the grid and determining fair
compensation for different grid services.77
• The State of Utah released an updated 10-Year Strategic Energy Plan in 2014 which
recommends an evaluation of the state’s
role in energy storage strategies with a
focus on compressed air energy storage.78
• In Oregon, House Bill 2193 (signed in 2015)
set a mandate for Oregon’s two largest
utilities to procure at least 5 MWh of energy
storage by January 1, 2020, with a cap of 1
percent of each company’s peak load.79,80

51PRIMER: POLICY AND REGULATORY IMPLICATIONS
• The Vermont Department of Public Service (in a joint effort with the federal
government) awarded a grant to Green
Mountain Power to build a solar and
battery storage project designed as a
microgrid (commissioned in 2015). The
project is intended to demonstrate the
technology and improve the resiliency of
the area.81
• The State of New Mexico released
an Energy Policy & Implementation Plan in 2015 which lists several
recommendations to expand the
development and deployment of
energy storage technologies in the
state. New Mexico is also home to two
existing battery storage demonstration
projects.82
• The New York Public Service Commission
ordered a fundamental change in its
ratemaking model as part of the state’s
Reforming the Energy Vision strategy. The
2016 reform established new ways for
utilities to earn a profit – for example, with
earnings tied to actions that reduce capital
spending and achieve performance goals.
This opens additional funding opportunities
for energy storage systems; for instance, a
utility may install storage technologies to
delay distribution system upgrades.83,84
• In Massachusetts, House Bill 4568 (signed
in 2016) directed the commonwealth’s
Department of Energy Resources to
determine whether a procurement goal for
energy storage would be “prudent,” and if
so, to establish a target for 2020.85,86
Low
High
Figure 11: Energy Storage Activity by State
Source: Compiled by ESN, 2017. See State Policy section, page 49.

ENERGY STORAGE ROADMAP REPORT52
• The Delaware Sustainable Energy Utility – a nonprofit created by the state in
2007 to further its sustainable energy
goals – approved a plan in 2016 to offer
solar and battery storage pilot projects to
four emergency response facilities and
school districts.87,88
• In Indiana, Indianapolis Power & Light Company (IPL) filed a complaint in 2016
(FERC Docket EL17-8-000) to challenge
several aspects of a MISO tariff. FERC
ruled in 2017 in favor of IPL's argument,
providing further guidance to MISO to
allow energy storage systems access to
all markets in which they are technically
capable of participating.89 In addition,
Indiana invested state and public funds
into the Battery Innovation Center
(launched in 2013), a collaborative
research center in southern Indiana
designed to manufacture, test, and
validate battery prototypes to spur them
toward commercialization.90
• In New Jersey, the Board of Public Utilities
created the Renewable Electric Storage Program, which was granted a $3 million
budget for fiscal year 2017. The program
provides financial assistance for energy
storage systems that are coupled with
non-residential renewable energy projects
behind the meter.91
SAFETY AND TECHNICAL STANDARDSEnergy storage technologies – and batteries
in particular – may be subject to existing or
new safety and fire codes. Some of these
codes are developing in parallel to the
increased deployment of batteries along
various points of the grid and behind the
meter. Further, inevitable safety incidents or
storage-related fires resulting from the early,
formative years of the industry will spur
the continued evolution of such codes and
standards over time.
Codes and standards signal maturity for a
particular system or industry. They can also
reduce costs, since companies do not have to
reinvent operational and safety procedures
with each new system. Additionally,
standards can reduce the number of system
failures or health and safety incidents,
thereby increasing consumer and investor
confidence. Alternatively, standards may
also add to costs as manufacturers are
subject to additional testing and validation
requirements to achieve certain listings.
RELEVANT ORGANIZATIONS:
• Underwriters Laboratories (UL) develops
codes and standards for buildings and
equipment and offers certification
services and technical assistance. UL
provides specific codes and services for
battery and energy storage technology
in order to help its clients design safe
systems and achieve compliance.92,93 For
example, UL recently released UL 9540 in
November 2016 – its Standard for Energy
Storage Systems and Equipment.94
• SAE International similarly develops
standards for the mobility engineering
industry. This includes a set of standards
for batteries in electric vehicles.95
• The Institute of Electrical and Electronics Engineers (IEEE) has a Standards
Association (IEEE-SA) that develops
standards and recommended practices
for electrical systems and electronics,
including large stationary batteries.96

53PRIMER: POLICY AND REGULATORY IMPLICATIONS
• The American National Standards Institute (ANSI) works to increase U.S.
competitiveness, consumer health and
safety, and environmental protection
through the development of standards
across all industries.
• The International Code Council (ICC) publishes and updates the International Fire Code (IFC), which sets minimum
regulations for fire prevention and
protection systems.97 The IFC is expected
to add requirements for energy storage
systems in its 2018 edition of the code.98
• The National Fire Protection Association (NFPA) is an international nonprofit
focused on reducing damage and injury
from fire through its codes and standards,
research, technical assistance, and
advocacy. NFPA is currently developing a
Standard for the Installation of Stationary
Energy Storage Systems (NFPA 855).99
NFPA also distributes information about
best practices and industry workshops,
such as the Workshop on Energy Storage
Systems and the Built Environment.100 In
2016, NFPA released the 2017 edition of
the National Electric Code (NEC), in which
a new article addresses the installation,
disconnection, shutdown, and safety
labeling of energy storage systems.101
ENERGY STORAGE ROADMAP REPORT54
E N E RG Y S Y S T E M S N E T W O R K I N S I G H T S
T o provide a full picture of the energy
storage industry and all the factors
affecting its growth and performance in the
future, ESN has outlined key questions facing
the industry and has provided expertise
and insight into these questions based on
extensive review of the research material.
This synopsis is intended to provide the
readers with a summary of research findings
and ESN’s expert perspective in relation to
each question.
very dependent on local conditions, including
the structure of the electricity market, the
utilities’ rate structures and generation
portfolios, and environmental and geographic
factors. Different combinations of the above
conditions, along with regulatory uncertainty
and the lack of market experience for many
storage technologies and applications, make
energy storage pricing very challenging to
accurately forecast.
In their efforts to estimate future prices
of energy storage, most reports focus on
very specific scenarios. For instance, a
2016 GTM Research report forecasts that
1-hour energy storage systems used for
commercial demand charge management
will be attractive investments (i.e., IRR over
5 percent) by 2021 in about one third of U.S.
states under the base scenario, and nearly
half of the states under a more optimistic
scenario.102 In the Australian market, a CSIRO
report (2015) estimates the payback periods
for new integrated solar PV and storage
systems (IPSS) in NEM states as 4-5 years
by 2035 under a standard tariff, and 7-11
years by 2035 under a time-of-use tariff.103
As for direct pricing estimates, HSBC Global
Research (2016) expects large-capacity Li-
ion batteries (used in BEVs) to fall from about
$300-400/kWh in 2016 to $100-150/kWh
in 2020; other studies point to Tesla’s stated
goal of reducing Li-ion battery costs to
$100/kWh by 2020, which its Gigafactory
may be capable of achieving.104,105,106 Other
reports differ in how they talk about energy
storage costs – for instance, by presenting
recent trends, current prices, or forecasts of
prices, penetration, or future market share.
1. Will improvements in energy storage continue to drive performance up and price/kWh down? At what point will it reach parity with existing technology options?
The research literature agrees that the price
of energy storage will continue to fall fairly
quickly over the next several years and
decades. However, the studies disagree on
the price at which energy storage will be
cost competitive with other options, and
when such cost parity will be reached. All
the relevant reports reviewed are prefaced
with some expression of great uncertainty in
their forecasts. Moreover, these reports only
partially or tangentially address the question
of when energy storage might reach cost
parity with competing conventional methods
of achieving the same goals.
Energy storage takes many forms (e.g.,
batteries with different chemistries,
flywheels, pumped hydro, etc.) and can
serve many applications (e.g., voltage
support, transmission deferral, black start,
renewable firming, etc.). The economics of
each system for each application are also
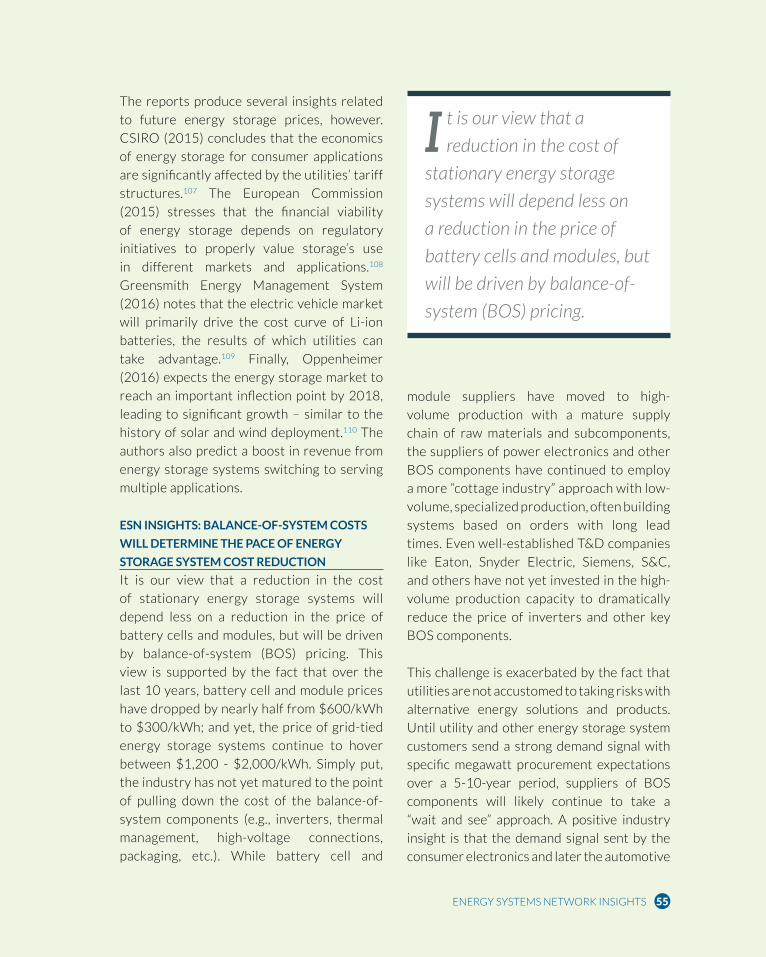
ENERGY SYSTEMS NETWORK INSIGHTS 55
The reports produce several insights related
to future energy storage prices, however.
CSIRO (2015) concludes that the economics
of energy storage for consumer applications
are significantly affected by the utilities’ tariff
structures.107 The European Commission
(2015) stresses that the financial viability
of energy storage depends on regulatory
initiatives to properly value storage’s use
in different markets and applications.108
Greensmith Energy Management System
(2016) notes that the electric vehicle market
will primarily drive the cost curve of Li-ion
batteries, the results of which utilities can
take advantage.109 Finally, Oppenheimer
(2016) expects the energy storage market to
reach an important inflection point by 2018,
leading to significant growth – similar to the
history of solar and wind deployment.110 The
authors also predict a boost in revenue from
energy storage systems switching to serving
multiple applications.
ESN INSIGHTS: BALANCE-OF-SYSTEM COSTS
WILL DETERMINE THE PACE OF ENERGY
STORAGE SYSTEM COST REDUCTION
It is our view that a reduction in the cost
of stationary energy storage systems will
depend less on a reduction in the price of
battery cells and modules, but will be driven
by balance-of-system (BOS) pricing. This
view is supported by the fact that over the
last 10 years, battery cell and module prices
have dropped by nearly half from $600/kWh
to $300/kWh; and yet, the price of grid-tied
energy storage systems continue to hover
between $1,200 - $2,000/kWh. Simply put,
the industry has not yet matured to the point
of pulling down the cost of the balance-of-
system components (e.g., inverters, thermal
management, high-voltage connections,
packaging, etc.). While battery cell and
module suppliers have moved to high-
volume production with a mature supply
chain of raw materials and subcomponents,
the suppliers of power electronics and other
BOS components have continued to employ
a more “cottage industry” approach with low-
volume, specialized production, often building
systems based on orders with long lead
times. Even well-established T&D companies
like Eaton, Snyder Electric, Siemens, S&C,
and others have not yet invested in the high-
volume production capacity to dramatically
reduce the price of inverters and other key
BOS components.
This challenge is exacerbated by the fact that
utilities are not accustomed to taking risks with
alternative energy solutions and products.
Until utility and other energy storage system
customers send a strong demand signal with
specific megawatt procurement expectations
over a 5-10-year period, suppliers of BOS
components will likely continue to take a
“wait and see” approach. A positive industry
insight is that the demand signal sent by the
consumer electronics and later the automotive
I t is our view that a
reduction in the cost of
stationary energy storage
systems will depend less on
a reduction in the price of
battery cells and modules, but
will be driven by balance-of-
system (BOS) pricing.
ENERGY STORAGE ROADMAP REPORT56
industry, which led to a dramatic drop in
battery cell and module pricing, resulted in
similar price drops in inverters and other
BOS costs for automotive energy storage
system “packs.” Companies like Delphi,
Bosch, Hitachi, and others have been able to
substantially pull the cost out of inverters,
DC-to-DC converters, and controllers and
other BOS components for the automotive
industry. Automotive supply companies
did this by leading, embracing risk, using
sound physics and economic assessments,
R&D, and investing heavily in high-volume
production capacity. These actions reduced
packaging size and costs, and increased
round-trip system efficiency based on clear
performance requirements and somewhat
clearer procurement commitments coming
from automakers.
ESN believes that a vision of the future can
be learned from the suppliers of automotive
BOS components and that it is critical
to leverage “lessons learned” and best
practices to those supplying the grid energy
storage system industry. In order to drive
down the cost of energy storage systems, a
concerted effort should be made to send a
clear demand sign to the utility sector’s BOS
suppliers. Cross-industry partnerships need
to be forged to draw from the learnings of
automotive industry suppliers for creating the
market adoption features of advanced energy
storage systems.
Predicting the point at which stationary
energy storage systems will reach price
parity with other options such as generation,
back-up power systems, and traditional T&D
equipment upgrades is quite challenging and
depends on several market and regulatory
factors. However, ESN forecasts and
analyses conclude that price parity for their
specific “use cases” (including frequency
regulation, demand charge management, and
T&D upgrade deferral) can be reached at a
price of approximately $900/kWh in many
markets across the U.S. There are a few
vendors offering stationary storage systems
at the $900/kWh price point today, but
ESN expects additional products to become
available by the end of 2018.
Based on multiple discussions with utilities,
backup power systems integrators, and other
industry experts, ESN forecasts a stationary
energy storage inflection point where many
more “use cases” and applications will hit
economic targets once stationary storage
systems reach a (full system) price of $400/
kWh to $500/kWh, which is projected to
occur by 2025.
E SN forecasts a
stationary energy
storage inflection point where
many more “use cases” and
applications will hit economic
targets once stationary
storage systems reach a
(full system) price of $400/
kWh to $500/kWh, which is
projected to occur by 2025.
ENERGY SYSTEMS NETWORK INSIGHTS 57
T he lack of transparency
in pricing of grid services
leads to distortions that
harm the financial viability of
energy storage.
from generation to end-user. Different
stakeholders are involved at different levels
(e.g., IPPs, transmission system operators,
distribution system operators, consumers),
and some are regulated while others are not.
Questions about who should own storage
systems will also need to be answered. New
business models may be needed to capitalize
on the value that storage systems bring. For
instance, in the near-term, storage provides
more value in the provision of frequency
and voltage regulation than energy. In
some cases, the market challenge is simply
integrating energy storage systems of
different sizes and applications into different
points onto the grid. Targeted upgrades to
distribution and transmission systems to
enable smart grid technologies can facilitate
storage adoption.113
As noted by World Energy Resources, it is also
important to change the discussion around the
value energy storage brings to the grid.114 As
discussed in the Primer: Economics of Energy Storage chapter (see page 26), levelized cost of
energy (LCOE) is a common metric to compare
costs of different sources of power generation,
but its more applicable analog – the levelized
cost of storage (LCOS) – still falls short of
accurately characterizing the value of storage.
2. What market adjustments are required to allow energy storage systems – which can be a load and generation source – to contribute their full benefits to the grid?
Energy storage encompasses a range of
technologies that are in many cases sufficiently
developed to contribute benefits to, and
compete with, more conventional systems
on the grid. Yet unlike more traditional grid
components, energy storage systems can act
in two directions (i.e., as a sink or a source of
energy) and serve a wide range of applications.
As such, the rules for integrating storage
systems and participating in electricity markets
remain largely unclear and underdeveloped.
Further, the lack of transparency in pricing of
grid services leads to distortions that harm the
financial viability of energy storage.111
Independent System Operators (ISOs) and
Regional Transmission Organizations (RTOs)
need to clarify how their current policies and
rules for market participation apply to energy
storage systems. From the perspective of a
well-defined framework, ISO/RTOs and other
stakeholders can then assess barriers to market
participation and identify opportunities for
energy storage to provide and be compensated
for grid services. ISO/RTOs should then focus
on updating existing or defining new rules
to help integrate energy storage systems –
especially those with the greatest near-term
potential – and manage systems serving
multiple applications.112
More generally, it is challenging to define
a broad system of compensation covering
every type and use for energy storage,
which can be placed anywhere on the grid

ENERGY STORAGE ROADMAP REPORT58
An estimate of the LCOS of a particular storage
technology is arbitrary since the value it provides
depends on the application it serves. Further,
the LCOS is incomplete as a cost measure since
it does not capture the unique business models
through which storage can generate revenue.
The cost curve for energy storage is a very
important component of its financial viability,
but a representation of its revenue streams
– derived from the value that storage brings
to the grid – is just as critical. Since revenue
streams depend so heavily on the context of
the storage system (e.g., application, generation
portfolio of the grid, market structure), one
measure (such as LCOS) likely cannot exist to
characterize storage in general. In comparing
storage to other technologies, the focus should
be placed on the specific value storage can
bring in that particular situation.
ESN INSIGHTS: WHOLESALE MARKETS
SHOULD RECOGNIZE AND COMPENSATE
ENERGY STORAGE AS A MULTI-VALUE ASSET
Energy storage is fundamentally different than
the purely generation-based resources to which
it is often compared. In order for energy storage
to fully participate in electricity markets, its value
must be clearly specified in each application, and
rules must be modified or created to explicitly
value these applications. The pressure to develop
these new markets will intensify with the increased
penetration of intermittent energy sources
(i.e., wind, solar) on the grid. As these markets
are developed – and as smart grid technologies
increase opportunities for storage and demand-
side management (DSM) to participate –
rules should be carefully crafted to allow full
participation of energy storage in a manner that
allows for the capture of multiple revenue streams
tied to parallel value propositions. For example,
from a technological standpoint, an energy
storage system using Li-ion batteries with a high
C-rating (e.g., lithium titanate) can simultaneously
follow a frequency regulation signal while also
discharging the balance of its energy into the grid.
Under such a scenario, the energy storage system
should be compensated in both the grid services
market for frequency regulation and the energy
market. However, current rules do not allow for
such stacking of value streams in a way that is
properly compensated.
To more fully understand how energy
storage systems can serve as a multi-value
asset to the grid, deeper dialogue and
engagement is required among FERC, State
PUCs, ISO/RTOs, utilities, and experts in
battery technology to better understand the
diversity of potential use cases associated
with energy storage systems. Pilot projects
that can technically validate the multiple
value streams of energy storage should be
pursued with close oversight from regulators
and ISO/RTOs and shared across states and
regions nationally. Once there is a deeper
understanding of the technology, then ISO/
RTOs will be more open to re-evaluating
market rules and making adjustments that
support further integration of energy storage.
T he cost curve for
energy storage is a very
important component of
its financial viability, but a
representation of its revenue
streams – derived from the
value that storage brings to
the grid – is just as critical.

ENERGY SYSTEMS NETWORK INSIGHTS 59
• Performance ratings that are technology-
and application-specific;
• Performance guarantees to operationalize
ratings, reduce risk, and pave the way
for insurance;
• Energy service performance contracts
for behind-the-meter projects that allow
customers to finance the project through a
service rather than an ownership model.119
The future of battery storage financing is still
unclear, but current and potential options
include the following:120
• Operating Leases: Operating leases
allow customers to use energy storage
without having to furnish the large capital
expenditure up front; these would mostly
be used behind-the-meter for demand
charge reduction.
• Master Limited Partnerships (MLPs): MLPs
allow for tax-exempt financing through
quarterly payments to investors; if the
T he Renewable Energy
Association (REA)
suggests that government
financing and coordinated
support among national
storage initiatives would
signal a commitment to the
industry and draw more
private investment.
3. How should energy storage projects be financed?
The “valley of death” between R&D and
commercial deployment via debt financing
is a major issue stalling growth in the
energy storage industry. Many current
projects are self-funded, indicating a lack
of financing.115 The Renewable Energy
Association (REA) suggests that government
financing and coordinated support among
national storage initiatives would signal a
commitment to the industry and draw more
private investment.116
Government support will need to give way to
standard private sector financing opportunities,
however. Many storage technologies and
applications are relatively new and unproven;
not enough data exists to show investors
that they will obtain a sufficient return from
financing these projects.117 When market rules
are more clearly specified, and as underwriters
increase their familiarity with energy storage
technologies and how they fit into electricity
markets, financing opportunities should
increase sharply.118
A report from Sandia National Laboratories
(2016) describes the U.S. DOE’s strategy
in two parts. First, DOE is to expand and
coordinate on key efforts in which the
agency already plays a role, including data
collection and analysis, safety and standards,
demonstration projects, and the provision of
financing support. Second, DOE is to turn to
private investors to (1) clarify the technology,
business, and credit risks in the industry; (2)
develop methodology to monetize these risks;
and (3) assist lenders through insurance and
contracts. DOE would accomplish this via
the following:

ENERGY STORAGE ROADMAP REPORT60
Master Limited Partnerships Parity Act is
passed, MLPs may be expanded to include
energy storage systems.
• Real Estate Investment Trusts (REITs): It is
too early to tell whether energy storage
systems might qualify for a REIT, but their
chances should improve if the systems are
installed with or as part of a building.
• YieldCos: YieldCos are attractive to
storage developers, but they often require
highly stable revenue streams; developers
may have more luck seeking YieldCos
with storage as part of a larger renewable
energy system.
• Bonds: Bonds are possible down the road, but
the energy storage industry will first need to
achieve a certain level of market maturity,
operational history, and risk reduction.
ESN INSIGHTS: FINANCING ENERGY
STORAGE WILL VARY WIDELY BY MARKET
AND APPLICATION
The multi-value nature of energy storage
makes it hard to categorize for purposes of
financing. It is not similar to wind or solar
which simply provide generation capacity
on the grid. Of further complexity is the
fact that an energy storage asset could be
providing value in multiple markets over the
course of the same day or week: for example,
frequency regulation in the RTO market,
peak shaving for a utility local distribution
network, demand charge management
for an apartment building developer, and
resiliency/back-up power for tenants in the
apartment. Traditional sources of financing
for capital investments prefer predictability
and simplicity, which can drive developers
of energy storage projects toward a single
application use case that can significantly
undervalue the energy storage assets.
To reach the full potential of energy storage
market integration, a range of existing
financing options must be leveraged and
some new approaches developed. Some
of the existing financing options to
consider include:
• Rate-Based Cost Recovery
• Power Purchase Agreements (PPA)
• Operating Leases
• Master Limited Partnerships
• YieldCos
• Real Estate Investment Trusts
• Performance-Based Energy
Services Contracts
• Bank Financing or Bonds
Regardless of the method that is used,
financing energy storage as a standalone asset
today requires a “baseload” use case (e.g.,
frequency regulation, firming renewables,
demand management, etc.) that is driving
the business case. Any additional use cases,
even if they can provide a revenue stream,
are often viewed as a secondary upside for
the project. Over time, as more use cases
are validated with performance data, it will
become easier to finance energy storage as
a multi-value asset. In many cases, financing
an energy storage system as a standalone
asset will not be as attractive as including
energy storage as a component of broader
project financing. For example, a developer
of a commercial building includes an energy
storage system to reduce demand charges,
to participate in a utility DR program, and to
provide back-up power in tandem with an
ENERGY SYSTEMS NETWORK INSIGHTS 61
onsite diesel gen-set, and finances the asset
as part of the overall building construction.
In the near term, the most direct method to
get an energy storage project financed is to
connect the project to a utility rate base. This
may include a utility purchasing an energy
storage system as an asset it will own in their
local distribution network, or a utility providing
a long term PPA- type guarantee to a developer
who will own the asset but provide services
to the utility. Another variation that is likely
to work in the near term is an energy storage
project that is tied in part to a utility rate base
with some portion of the project financed based
on expected wholesale market revenue. Over
time as ISO/RTOs make adjustments to their
market rules to better allow energy storage
to participate in multiple markets in parallel,
and more data on technology performance in
multiple markets is validated, then financing
energy storage projects as standalone assets
outside of a utility rate base will be possible.
This is most likely to happen in CAISO and PJM
markets first based on their current openness
to energy storage.
Finally, the behind-the-meter energy storage
market, which includes smaller systems
located in residential or commercial buildings,
may offer another financing option that has
taken off in the solar industry. Third-party
solar financing companies (e.g., SolarCity,
Vivint Solar, Sunrun, etc.) have already begun
marketing their third-party financing model to
energy storage systems. A third-party financer
is better positioned to deal with the technical,
regulatory, and tax challenges of integrating
energy storage at a residential or commercial
level. They are also able to raise more equity
or risk capital in the market to draw down
larger sums of project financing. In the near
term, market penetration of this model is
limited to states with highly variable energy
rates or additional tax incentives. As saturation
of residential and small commercial solar
increases, state regulators could begin requiring
storage in order to smooth renewables, which
will further increase the value of storage.
In summary, there is no “one size fits all"
solution to financing energy storage. Much
like the multiple use cases that energy
storage systems can support, multiple
financing tools and approaches will be
required. The most likely solution in the near
term is financing tied to a utility rate base,
which could become the norm for many
energy storage applications, particularly
those benefiting the local distribution
system. Energy storage projects that are tied
to performance of the wholesale market will
remain challenging unless multiple market
revenue streams can be accessed. And third-
party financing of behind-the-meter storage
is an attractive model to support broad
adoption, but will depend heavily on time-
of-use energy price variability and future
regulations on rooftop solar.
Investors at large may keep a distance from
the energy storage industry until they have
a better grasp on the risks involved. The
industry can support itself by self-funding more
pilots to demonstrate revenue reliability and
taking advantage of conventional financing
by attaching storage to more familiar projects
(e.g., solar). Developers should also establish
and promote clear, standardized technology
applications of energy storage products to
build investor understanding of, and reduce
perceived risks within, the industry.

ENERGY STORAGE ROADMAP REPORT62
4. What role will PUCs need to play in developing policies or approving projects?
There are several avenues for change at
the rate-making level. First, PUCs should
determine how to compensate behind-the-
meter energy storage systems, particularly
when net energy metering is at play. Next,
PUCs can encourage the adoption of storage
systems by changing the structure of their
base rates to more accurately match the costs
of meeting demand (e.g., by switching to time-
of-use rates). PUCs can also look to ongoing
cases in other areas (e.g., smart grid, load
shifting, electric vehicle charging) to examine
where storage can add value. Finally, PUCs
should both develop a comprehensive and
sophisticated methodology for valuing storage
and require that storage be considered by
utilities as an alternative to other proposed
technologies or upgrades for both generation
and T&D.130,131,132,133,134
PUCs should also improve interconnection
processes. For instance, PUCs can clearly
spell out the requirements for connecting
energy storage projects to both transmission
and distribution systems. They can also look
for opportunities to simplify and streamline
the processes for projects meeting
predetermined criteria. Finally, PUCs can
clarify the costs involved in interconnection
to give project developers the information
they need to make decisions.135
ESN INSIGHTS: TRANSMISSION &
DISTRIBUTION USE CASES ARE THE
FASTEST WAY TO SECURE PUCS'
SUPPORT FOR ENERGY STORAGE
In general, PUCs have been slow to take
directed actions that spur investment in
energy storage technologies, with the
significant exception of California, which
adopted an ambitious energy storage mandate
of 1.3 GW by 2020. Oregon followed that
PUCs can play a role in four key areas: planning,
procurement, ratemaking, and interconnection.
In terms of planning, PUCs should clarify
needs in the distribution system (especially
with greater penetration of distributed energy
resources) and the specifications of resources
that can meet these needs. This will involve
greater discussion with the utilities under
PUC supervision. As part of this process,
PUCs should accept energy storage systems
as potential options to defer or displace
distribution system upgrades. Further
upstream, PUCs should encourage ISO/RTOs
to include storage technologies as market
participants for both energy- and power-
based applications, and call for flexibility in
the market rules that allow for energy storage
systems to participate in multiple markets
simultaneously. Finally, since storage can
play many different roles, PUCs should make
decisions on integrated storage based on
the context of benefits over averaged cost
estimates of one application.121,122,123,124,125
PUCs’ opportunities for procurement include
direct mandates and altering rules around
Resource Adequacy (RA). PUCs can require
the utilities they regulate to procure a certain
capacity of energy storage; for instance, the
CPUC has a mandatory target of 1.3 GW
by 2020 among California’s three largest
utilities.126,127 RA ensures that utilities have the
needed capacity and dispatchability to maintain
safe and consistent service. PUCs have rules
that determine which resources count toward
RA. To remove barriers to storage participation,
PUCs should adjust rules to permit energy
storage systems to act as multi-valued assets as
part of RA plans.128,129
ENERGY SYSTEMS NETWORK INSIGHTS 63
action with a more modest mandate for its
two utilities to procure 5 MWh or 1 percent
of peak capacity by 2020. The California
PUC’s action has created its own unique
market and is by far the strongest demand
signal for energy storage in the U.S. However,
the unique energy market conditions and
state policy history in California makes their
action of a broad energy storage mandate
an unlikely precedent to be followed in
most states. Furthermore, with the change
in federal policies moving away from the
Clean Power Plan and pushing for increased
domestic coal and gas production, it is even
less likely now that individual states will
pursue a mandate approach to support
energy storage deployment.
It is our view that the most likely action by
PUCs to support deployment of energy storage
is through the approval of cost recovery for
utilities so they may include energy storage
systems as part of their updating and further
build-out of their T&D systems. The number
of transmission-related projects in the U.S.
doubled in both 2014 and 2015 compared to
the number of projects added in 2013. Another
$30 billion in T&D construction investment
is slated for the 2016-2017 period. This
dramatic increase in T&D spending is occurring
throughout the country driven by aging
infrastructure in need of modernization as well
as a need to connect new generation assets (i.e.,
gas and renewables) and smart grid systems.
Many PUCs have been granting significant
rate increases to utilities specifically for grid
modernization projects. Investments are also
being made in expanded regional high-voltage
transmission corridors.
Energy storage can offer a wide range of
value propositions to the T&D system at
both the local distribution and high-voltage
transmission levels. Furthermore, the cost
of energy storage is more easily justified
in the context of specific T&D applications,
like deferring the build-out of an expensive
substation by managing peak load, improving
power quality and reliability on an unstable
line, or offering distributed demand side
management. The benefits of such specific
T&D use cases are clear and more easily
quantifiable to PUCs than the more abstract
benefits of energy storage as a way to increase
renewables or reduce CO2 emissions. For this
reason, we expect a number of PUCs to begin
granting cost recovery for energy storage as a
T&D asset, both in terms of specific projects
as well as broader use in utilities' T&D long-
term grid modernization plans. Such action
can create a robust and stable market for
energy storage systems across the country. It
is likely that energy storage systems as a T&D
asset will favor systems in the 50 kWh - to
5 MWh scale vs. home energy storage systems
(5-10 kWh) or large high-voltage grid storage
W ith the change in
federal policies
moving away from the Clean
Power Plan and pushing for
increased domestic coal and
gas production, it is even less
likely now that individual
states will pursue a mandate
approach to support energy
storage deployment.

ENERGY STORAGE ROADMAP REPORT64
systems (10 MW+). Furthermore, a growing
T&D market for energy storage will offer the
clear demand signal to suppliers needed to
spur investments in high-volume production
and to reduce the cost of balance-of-
system components.
5. How can utility providers create new revenue streams and business models using energy storage systems?
create other revenue streams by focusing on
storage as an option for capacity and other
ancillary service markets, and by creating
markets for non-wire upgrades (e.g., T&D
upgrade deferral). In explicitly defining these
markets, utilities may find that storage holds
advantages over more conventional options,
such as by preventing the curtailment of
renewable energy during peak production
by storing the excess and discharging it
later, thereby raising the technologies’
revenue potential.136,137,138,139,140
There are two key aspects utilities must
consider when working to create these
value streams. First, they should account for
the fact that a particular combination of an
energy storage system’s type, location on the
grid, and context with regard to the power
generation portfolio collectively determines
its value.141 Second, they should allow for the
grouping or stacking of storage applications
for a given system. An energy storage
system deployed for a single application may
Utilities face several challenges as they seek
to operate the power grid safely, reliably, and
at low cost. For instance, utilities rely on the
most expensive sources of power to meet
periods of peak capacity. Further, they must
manage increased difficulties in maintaining
power quality, resilience, and robust T&D
networks as more renewable, intermittent,
and distributed energy is deployed on the
grid. To meet their goals, utilities can take
advantage of the benefits that energy
storage technologies have to offer, either
directly through purchase and cost recovery,
or indirectly through creating new revenue
streams for third parties and end users to
adopt storage.
Utilities can explicitly define goals and
specify how storage can serve as competition
to other means of achieving these goals. For
example, to manage demand charges, utilities
can switch to time-of-use electricity pricing;
this alone incentivizes ratepayers to consider
storage as a way to shift the times when
they purchase power to avoid peak charges.
Utilities can also open markets for reliability,
in which storage can bid for providing
voltage support and frequency regulation;
they can also open markets for resiliency, in
which the black start capability of a storage
system can bring in revenue. Utilities can
T o meet their goals,
utilities can take
advantage of the benefits that
energy storage technologies
have to offer, either directly
through purchase and cost
recovery, or indirectly through
creating new revenue streams
for third parties and end users
to adopt storage.

ENERGY SYSTEMS NETWORK INSIGHTS 65
only be active for a fraction of its useful life.
During the time when it is otherwise idle, a
system may be able to serve other functions
without compromising its ability to carry out
its primary use. Stacking applications allows
for flexibility in use and an avenue for extra
revenue that could tip the system into being
economically favorable.142,143,144
Utilities should also look to the development
of “smart markets” as a business model. In
some ways, smart markets – which involve
technologies and strategies allowing for end-
user demand to respond to price changes –
enable energy storage systems to provide their
highest value. For instance, if a homeowner’s
storage system can respond to signals and
prices from the grid or its operators, it can pull
and dispense energy as needed to maximize
grid reliability and efficiency. By definition,
these markets would deploy distributed
storage systems when it is most valuable for
them to do so, thus bringing in the greatest
achievable revenue streams.145,146,147
ESN INSIGHTS: STACKING APPLICATIONS AND
MARKETS WILL GENERATE GREATEST VALUE
AND REVENUE
Energy storage is a uniquely flexible grid
technology in its ability to serve a variety
of use cases. This grouping or stacking
of applications allows for energy storage
systems to provide multiple value streams
to the grid that should result in revenue
streams that reflect such diverse value.
However, there are regulatory, market, and
technological challenges that need to be
overcome to achieve a multi-value/multi-
revenue stream market environment for
energy storage systems. Regulators including
PUCs and ISO/RTOs have to adjust current
or create new regulations and market rules
to allow flexibility in how value or revenue is
applied to energy storage assets. PUCs will
need to offer utilities cost recovery that is
tied to multiple value propositions that may
include a combination of T&D, generation,
and energy efficiency benefits. Similarly,
ISO/RTOs will need to adjust market rules to
ensure energy storage assets can participate
in and move between energy, grid services,
and capacity markets simultaneously. To
support the development of a more flexible
marketplace, improvements in energy
storage system technology integration are
needed. Better software, communications,
and controls capabilities for energy storage
systems that allow for improved remote
operations, monitoring, and reporting are
also needed. Standardized performance
verification and validation that can ensure
regulators, utilities, and end-use customers
that the multi-value benefits of energy
storage are in fact being realized is also an
important step that has yet to be taken.
Utility companies are key to building this
multi-value/multi-revenue stream market
environment. They are on the front lines
interacting with the key stakeholders
including regulators, technology vendors, and
customers. Furthermore, utilities have the
specialized understanding and supporting
data to validate the range of use cases that
energy storage can support and how those
use cases add value to the grid. From 2008
to 2015, utility companies were largely
viewing energy storage as an emerging
technology and used federal grants or special
allocations by PUCs to conduct pilot projects
demonstrating the benefits of energy storage.
However, in 2017 and beyond we can expect
a sea of change with utilities across the
country seeking regulatory approvals with
ENERGY STORAGE ROADMAP REPORT66
PUCs and ISO/RTOs for broader deployment
of energy storage. The pace at which this
happens will vary by state, region, and utility,
but it will be broad enough to establish a
robust marketplace by 2025.
The emergence of a more flexible market for
energy storage will not only benefit utility
companies which can generate new revenue
or save money by deploying energy storage;
third-party developers, and even consumers,
will be able to benefit as well. Third-party
financing companies, which have taken off in
the residential and commercial solar market,
will be able to extend their model to energy
storage systems by linking them to utility
programs or even accessing wholesale markets.
For example, CAISO has allowed for bundling
of smaller-scale residential distributed
energy storage systems to be bid into the
wholesale market by third-party aggregators.
Individual consumer or commercial customers
may use energy storage systems to access
utility DR programs or reduce their bills by
optimizing time-of-use rates or avoiding peak
demand charges.
R egulators including PUCs
and ISO/RTOs have to
adjust current or create new
regulations and market rules
to allow flexibility in how
value or revenue is applied to
energy storage assets.

67APPENDIX
GLOSSARY OF TERMS
Active Thermal
Management
Typically a liquid cooling system where a coolant, such as ethylene glycol, is
circulated around and through heat generating areas to transfer heat from
inside the battery system to outside and through a cooling loop, such as a
radiator, often referred to as “convection.”
American National
Standards Institute
(ANSI)
The American National Standards Institute (ANSI) works to increase
U.S. competitiveness, consumer health and safety, and environmental
protection through the development of standards across all industries.
Application Stacking Application stacking refers to the compounding of multiple use cases for
energy storage to amplify their benefits and minimize costs, making them
more economical. For example, using the same energy storage system
to provide grid services but also act as a power/energy generator at the
same time (currently, the regulatory environment is not flexible enough
to allow all of a battery system’s potential applications to be used in the
same installation).
Balance-of-System
(BOS)
Balance-of-System (BOS) refers to all the hardware components in a
power installation other than the module and power electronics.
Battery Management
System (BMS)
The Battery Management System (BMS) is often referred to as the
“brain” of the battery. The BMS is designed to provide cell (voltage)
balance, control and consistent performance over the lifecycle of the
battery. The BMS is a circuit board with an integrated microprocessor
that monitors, records, and actually sends signals for charging and
discharging individual lithium battery cells (or cell strings) to maintain
voltage balance and system performance.
Charge Rate (C-rate) Charge and discharge rates of a battery are commonly referred to as
C-rates. Higher C-rates can increase internal thermodynamic reactions
to the battery cell electrodes, seals, and packaging and shorten the
cycle life of the cell. Typically, the energy storage application defines
the requirements or drives the need for battery C-rates. The C-rate is
calculated by dividing the power output by the capacity of the battery
(kW/kWh), so a 10 kWh battery that was discharging at a rate of 10 kW
would have a 1 C rating.
A P P E N D I X
ENERGY STORAGE ROADMAP REPORT68
Cycle Life Cycle life is how many single charge cycles the battery can conduct before
reaching the determined “end of life” status.
Demand Charge The price charged for electricity for a specific point in time as a result of
when customers use the highest electrical power - peak energy demand, or
times when more customers are requiring electricity, vs. off-peak energy
demand, when fewer customers need electricity (i.e., overnight).
Department of Energy
(DOE)
The U. S. Department of Energy (DOE) is a federal agency overseeing
several energy, environmental, and nuclear programs.
Depth of Discharge
(DOD)
See Cycle Life
Electric Bill
Management
Reduces the energy drawn from the grid during periods of high demand
charges. As electricity markets increasingly move towards a stratified rate
structure, the ability to reduce demand from the grid during peak hours is
going to become more profitable.
Electric Bill
Management with
Renewables
Permits the storage of energy during low rate periods to be used during
high rate periods. Storage combined with renewables can work in
conjunction with each other to improve the economics of both renewables
and battery storage.
Electric Energy Time
Shift
Permits greater flexibility when power is used. For instance, during a
period of high supply and low demand, energy can be stored and then
released when demand is high or supply is low. Electric energy time shift
reduces peaks and troughs in the supply curve, promoting greater stability.
Electric Supply Capacity Can decrease the need to buy generating capacity on the wholesale
market or build new generation capacity. Uncertainty in market demand
for electricity, for instance, in new housing developments where demand
may grow quickly if the development is successful or fail to materialize if
the development falls through, is a source of risk for electricity suppliers.
Storage may be effective in providing flexibility to energy suppliers.

69APPENDIX
Electric Supply Reserve
Capacity - Non-
Spinning
Non-spinning reserves are brought online only after spinning reserves have
been brought online. These units are not synchronized (frequency) with the
grid and are offline until they are required. Non-spinning reserves are often
the most expensive generators and are only called for when demand exceeds
normal capacity and spinning reserve capacities. Storage can defer the high
costs of construction and utilization of non-spinning reserves.
Electric Supply
Reserved Capacity -
Spinning
Spinning reserves are units that are synchronized with, but do not release
energy to, the grid. Their intended purpose is to be able to respond rapidly
to “contingency” or loss of a significant source of generation. Storage can
reduce the need for these units by supplementing them or replacing them
altogether. Storage can further reduce the economic loss associated with
spinning units by storing the energy they create while offline.
Energy Density The amount of energy able to be stored per unit of mass, measured in
Watt-hours per kilogram units of measurement.
Federal Energy
Regulatory Commission
(FERC)
The Federal Energy Regulatory Commission (FERC) is an independent federal
agency responsible for regulating the interstate transmission of natural gas, oil,
and electricity. FERC also has regulatory power over the wholesale electricity
market; it does not have jurisdiction at the retail level, however.
Flow Battery A flow battery, or redox flow battery (after reduction–oxidation), is a type
of rechargeable battery by two chemical liquid components contained
within the system and separated by a membrane. Ion exchange (providing
flow of electric current) occurs through the membrane while both
liquids circulate in their own respective space. Cell voltage is chemically
determined and ranges from 1.0 to 2.2 volts (per cell, and cells can be
placed in infinite strings).
Frequency Regulation The battery acts as both a source and sink for electricity from moment-
to-moment to help maintain the frequency within the required range.
Frequency regulation requires millisecond-to-second response to
the grid. Batteries can be programmed to respond instantaneously to
changes automatically.
ENERGY STORAGE ROADMAP REPORT70
Grid-Connected
Commercial
Battery storage can maintain consistent power output in the event of
a disruption of a commercial enterprise. The system may provide the
needed power during the disruption or permit an orderly system shut
down or smooth transition to a backup generation unit. The storage
system can also smooth out any unwanted variability, such as spikes or
drops in voltage or frequency.
Grid-Connected
Residential
Battery storage can maintain consistent power output in the event of a
disruption for residential customers. The system may provide the needed
power during the disruption or permit an orderly system shut down or
smooth transition to a backup generation unit. The storage system can
also smooth out any unwanted variability, such as spikes or drops in
voltage or frequency.
Independent System
Operator (ISO) and
Regional Transmission
Organizations (RTO)
ISO/RTOs are nonprofits that coordinate the balancing of supply and
demand of electricity in a region. They essentially control their regions’
respective transmission systems, choosing which generators to run and
when to run them (based on price). They also have control over which
assets can participate, including the particular market and tariff structure.
Utilities can voluntarily opt into or out of participation in an ISO/RTO;
choosing to opt in gives up some autonomy as a utility, but it provides
greater assurance that the reliability standards will be met.
Institute of Electrical
and Electronics
Engineers (IEEE)
The Institute of Electrical and Electronics Engineers (IEEE) has
a Standards Association (IEEE-SA) that develops standards and
recommended practices for electrical systems and electronics, including
large stationary batteries.
International Code
Council (ICC)
The International Code Council (ICC) publishes and updates the
International Fire Code (IFC), which sets minimum regulations for
fire prevention and protection systems. The IFC is expected to add
requirements for energy storage systems in its 2018 edition of the code.
Inverters An electronic device or circuitry that “inverts” direct current (DC) to
alternating current (AC) or vice versa.
71APPENDIX
Lead Acid (PbA) The most prolific battery type in battery history, referred to as lead acid
(PbA), was invented in 1859 by French physicist Gaston Planté and is
also the oldest type of rechargeable battery. Despite having a relatively
poor energy density (50 watt-hours per kilogram, or 50 Wh/kg), PbA does
have an ability to supply high surge currents and have a relatively large
power-to-weight ratio. These features, along with their low cost, makes
PbA the battery of choice for “starting, lighting, ignition” (SLI) batteries for
automotive vehicles.
Levelized Cost of
Electricity (sometimes
referred to as "Levelized
Cost of Energy")
Levelized Cost of Electricity (sometimes referred to as "Levelized
Cost of Energy") is a metric developed as a means to compare the
competitiveness of different power technologies. The LCOE gives
a $/kWh value representing the cost of building, financing, fueling,
operating, and maintaining a plant over its useful life, inclusive of certain
operating assumptions (e.g., capacity factor). The advantages of LCOE
are its familiarity in the power industry and its ability to offer a method
of easily comparing technologies. However, LCOE depends heavily on
the assumptions it embodies—particularly the cost of different fuels
and estimates of government policies. The LCOE is also less useful at
the local level, where other factors may be more important in making
decisions regarding which technology is best to meet a given need.
Levelized Cost of
Storage (LCOS)
Levelized Cost of Storage (LCOS) attempts to measure the average
net revenue per unit of energy a storage system must bring in over
its lifetime to recover its capital and O&M costs. However, even the
LCOS is far from a perfect means of comparing storage and generation
technologies. The measure is arbitrary in that its value depends on
the actual application it serves and the context in which it’s deployed.
It is also incomplete, as it does not capture all of the avenues through
which storage can generate revenue. Finally, the LCOS may not take
other important features into account, including a storage technology’s
advantage in flexibility, dispatch time, or added value to the grid in terms
of reliability. At this time, there is no single method of comparing storage
with generation assets, making it difficult to know when a technology
reaches cost parity.

ENERGY STORAGE ROADMAP REPORT72
Lithium Ion (Li-ion) Lithium ion (Li-ion) is a somewhat generic term for a family of
rechargeable, or secondary, battery types in which ions of lithium
(the lightest metallic element in the periodic table) move from the
negative electrode to the positive electrode during discharge and back
when charging. The Li-ion battery is often referred to as the “rocking
chair” battery as lithium ions “rock” back and forth from electrode to
electrode upon discharge and charging of the cell. Li-ion batteries are
currently one of the most popular types of rechargeable batteries for
portable electronics, stationary power, and automotive applications
with a high-energy density, high power density, negligible memory
effect and low self-discharge.
Load Following Load Following is also referred to as Tertiary Balancing. Output changes
in response to demand changes in a specific area. These units usually
are intended to respond within minutes or hours. A battery’s ability to
respond quickly to demand changes makes them well suited to supplement
traditional systems for load following.
Master Limited
Partnerships (MLPs)
Master Limited Partnerships (MLPs) allow for tax-exempt financing
through quarterly payments to investors; if the Master Limited
Partnerships Parity Act is passed, MLPs may be expanded to include
energy storage systems.
Microgrid Capability Storage system used to enhance the stability, reliability, and quality
of a microgrid system and permits the integration of diverse energy
sources. For instance, if a microgrid system is supplied by renewables
then a voltage source is needed to synchronize the system. Automation,
diesel generation, or some form of battery storage system usually
performs this synchronization.
National Fire Proection
Association (NFPA)
The National Fire Protection Association (NFPA) is an international
nonprofit focused on reducing damage and injury due to fire through its
codes and standards, research, technical assistance, and advocacy.
Net Energy Metering
(NEM)
A unique billing arrangement in which electricity customers with solar
photovoltaic systems can get credit for their excess generated electricity
for the full retail price of the electricity and then draw on that credit when
they have insufficient generation (i.e., winter and night time).
73APPENDIX
Nickel Metal Hydride
(NiMH)
Invented in 1967 and first commercially available in 1989, Nickel Metal
Hydride (NiMH) batteries have superior power and energy densities
over PbA battery types. Toyota Motor Corporation was very successful
in scaling NiMH batteries for its Prius program(s), and additional HEV
platforms. With its moderate energy density, power density, and cycle
life capabilities, the NiMH battery has been fundamentally replaced with
lithium ion in most automotive applications.
North American
Electric Reliability
Corporation (NERC)
The North American Electric Reliability Corporation (NERC) is a nonprofit
international organization that focuses on maintaining the reliability and
security of the North American power grid. NERC accomplishes this by
designing and enforcing reliability standards and monitoring the grid.
Onsite Power The battery can provide power locally as needed. These systems can be
used in conjunction with or replace conventional generators. For instance,
institutions such as hospitals, server farms, and some manufacturing activities
must have robust and uninterruptable energy supplies. Even in the event of a
dedicated generator, backup power is usually installed as a fail-safe.
Onsite Renewable
Generation Shifting
Allows end-use customers with onsite renewable energy sources to
charge and store energy as it is produced so it can be used onsite as
needed. Shifting also allows multiple sources of energy to be synchronized,
increasing flexibility.
Operating Leases Operating leases allow customers to use energy storage without having to
furnish the large capital expenditure up front; these would mostly be used
behind-the-meter for demand charge reduction.
Passive Thermal
Management
Depending on the application, whether the energy storage system is
moving or stationary, passive air channels can be designed into the
enclosure allowing airflow, and even conduction of thermal conditions, to
circulate past the individual battery cells for passive thermal management.
Performance-Based
Energy Services
Contracts
A Performance-based Energy Services Contract is a contract in which
energy customers are provided with a series of energy-saving measures
(e.g., energy efficiency technologies, renewable energy) that guarantee
enough energy cost savings to pay for the project over the life of
the contract.

ENERGY STORAGE ROADMAP REPORT74
Power Density The amount of power available per unit of mass, measured in Watts per
kilogram unit of measurement.
Public Utility
Commission (PUC)
In regulated electricity markets, the Public Utility Commission (PUC) sets
utility tariff structures to ensure that they (1) are able to recover their costs
plus a reasonable return on investment; and (2) do not abuse their monopoly
power and take advantage of ratepayers. PUCs also influence state
electricity markets by setting rules and standards that utilities must follow.
Ragone Chart A Ragone chart (pronounced "ruh-GO-nee") is a logarithmic chart used for
performance comparison of various energy-storing devices. The values
of specific energy (Wh/kg) are plotted versus specific power (W/kg). Both
axes are logarithmic, which allows comparing performance of extremely
high and extremely low power devices.
Ramping Storage permits either ramping up or ramping down the loading level of
generation unit in a manner that is consistent over time. Sudden changes
in the ramping rate may significantly, negatively, impact the efficiency of an
electric generating unit. A storage source may act as a shock absorber to
facilitate systematic and therefore more efficient use of the generator.
Renewable Capacity
Firming
Smoothes output from renewable sources to maintain consistent output
over time. The inherent intermittency of renewables is often balanced with
conventional generation that was not designed for this function. Batteries
can reduce this demand and free up conventional sources for their
intended purpose while lowering costs at the same time.
Renewables Energy
Time Shift
Permits optimal utilization of renewable energy by allowing storage of
that energy when it is being produced regardless of the current demand.
This energy can then be used during periods of high demand or when
renewables have reduced generating capacity.
Resiliency Enhances the ability to supply demanded power in the event of disruption.
Storage systems can permit an orderly shutdown of the system or may act
as a backup to maintain function until power is restored.
SAE International SAE International develops standards for the mobility engineering
industry. This includes a set of standards for batteries in electric vehicles.
75APPENDIX
Sodium Sulfur Invented by Ford Motor Company in the early 1960s, a sodium sulfur
battery is referred to as a “molten-salt battery” constructed from liquid
sodium (Na) and sulfur (S). It produces fairly high energy density (better
than PbA efficiency in charge/discharge at 89–92 percent), good cycle
life, and is fabricated from inexpensive materials. However, the operating
temperature of Sodium Sulfur batteries is 300°-350°C and is highly
corrosive in nature, which makes the battery more suitable for stationary
energy storage applications.
Spinning Reserves See Electric Supply Reserved Capacity - Spinning
Stationary
Transmission/
Distribution Upgrade
Deferral
Battery storage decreases or defers the need to replace or upgrade
stationary transmission and distribution (T&D) systems. Underground
circuits and ground faults are expensive to replace and storage can
decrease the load requirements, which reduces the heat and associated
degradation of the units and auxiliary equipment such as insulation.
Supercapacitors See Ultracapacitors
Supervisory Control
and Data Aquisition
(SCADA)
A Supervisory Control and Data Acquisition (SCADA) coordinates the data
from the battery management system, the power conversion systems (e.g.,
inverters, inverter controllers) and external requests (e.g., electrical grid).
Tertiary Balancing See Load Following
Transmission
Congestion Relief
Storage discharges during periods of peak demand to reduce transmission
capacity requirements and congestion-related costs. Congestion may also
negatively impact frequency and voltage stability. Storage units can offer
increased stability by responding as a source or sink for energy as needed,
reducing the expense associated with energy dumping.
Transmission Support Used in conjunction with transmission to compensate for variability such
as unstable voltage and resonance issues. Storage increases the load
carrying capacity of the transmission system, which may benefit the system
owner and the utility. Transmitting energy can be costly to utilities that
need additional capacity but do not own the transmission system. They
usually pay an access charge as well as other fees such as operation and
maintenance costs to the system owner.
ENERGY STORAGE ROADMAP REPORT76
Transporting Services Batteries may provide a link between the grid and electric vehicles.
For instance, as the market for electric vehicles grows it will become
increasing feasible to utilize large numbers of electric vehicles to provide
frequency regulation and voltage support to the grid, known as vehicle-
to-grid or V2G.
Ultracapacitors Formerly referred to as an electric double-layer capacitor (EDLC), the
ultracapacitor (or “supercapacitor”) is a high-capacity electrochemical
capacitor with a performance value much higher than standard
capacitors which emulates the cyclical nature of rechargeable batteries.
Ultracapacitors typically store 100 times more energy per unit (volume or
mass) than electrolytic capacitors, and can accept and deliver charge much
faster than batteries. Ultracapacitors can provide a revolutionary amount
of charge and discharge cycles over rechargeable batteries. However, their
energy densities are extremely small when compared to batteries, and
can be more than 10 times larger than conventional batteries for a given
capacity or energy density.
Underwriters
Laboratories (UL)
Underwriters Laboratories (UL) develops codes and standards for
buildings and equipment and offers certification services and technical
assistance. UL provides specific codes and services for battery and energy
storage technology in order to help its clients design safe systems and
achieve compliance.
Voltage Support Large power loads can move the voltage out of the specified range
locally. Storage can dampen these effects with minimal draw of power
from the battery.
Zinc-Air Described as metal-air batteries powered by oxidizing zinc with oxygen
from the air, these batteries have high energy densities and range from
very small button cells for hearing aids to batteries for the electrical grid.
Zinc-air batteries operate similarly to fuel cells where the zinc is the fuel
and the reaction rate can be controlled by varying the airflow. Once the
electrolyte paste oxidizes (zinc) it can be replaced with fresh paste. Zinc-
air has been used as a non-rechargeable, primary battery but a recent
company has converted it into a rechargeable secondary battery.
77ENDNOTES
1 Wikipedia. Nickel–metal hydride battery. Wikipedia, The Free Encyclopedia. https://en.wikipedia.org/w/
index.php?title=Nickel%E2%80%93metal_hydride_battery&oldid=778604451. Published May 4, 2017.
Accessed August 2016-May 2017.
2 Paine, Chris. Who Killed the Electric Car? A Lack of Consumer Confidence… or Conspiracy? Sony Pictures.
June 2006.
3 University of Cambridge. New design points a path to the “ultimate” battery. http://www.cam.ac.uk/
research/news/new-design-points-a-path-to-the-ultimate-battery. Published October 29, 2015.
Accessed August 2016-May 2017.
4 Fluidic Energy. http://fluidicenergy.com/our-company. Published 2016. Accessed August 2016-May 2017.
5 Fluidic Energy. http://fluidicenergy.com/our-company. Published 2016. Accessed August 2016-May 2017.
6 Bloomberg Business News. Ford Unplugs Electric Vans After 2 Fires. http://articles.chicagotribune.
com/1994-06-06/business/9406060018_1_ecostar-sodium-sulfur-battery-30-month-evaluation.
Published June 6, 1994. Accessed August 2016-May 2017.
7 National Transportation Safety Board. June 2000. https://phmsa.dot.gov/staticfiles/PHMSA/
DownloadableFiles/Files/NTSB%20Files/12.pdf.
8 Mouawad J. Report on Boeing 787 Dreamliner Battery Flaws Finds Lapses at Multiple Points. The
New York Times. https://www.nytimes.com/2014/12/02/business/report-on-boeing-787-dreamliner-
batteries-assigns-some-blame-for-flaws.html. Published December 1, 2014. Accessed August 2016-
May 2017.
9 Chung D, Elgqvist E, Santhanagopalan S. Automotive Lithium-ion Battery Supply Chain and U.S.
Competitiveness Considerations (pp. 10). June 2015. https://energy.gov/sites/prod/files/2015/06/f23/
Lithium-ion%20Battery%20CEMAC.pdf
10 Future Market Insights. Lead Acid Battery Market- Global Industry Analysis, Size and Forecast, 2014
to 2020. http://www.futuremarketinsights.com/reports/global-lead-acid-battery-market. Published
December 31, 2014. Accessed August 2016-May 2017.
11 Future Market Insights. Lead Acid Battery Market- Global Industry Analysis, Size and Forecast, 2014
to 2020. http://www.futuremarketinsights.com/reports/global-lead-acid-battery-market. Published
December 31, 2014. Accessed August 2016-May 2017.
12 Tesla Blog. Battery Cell Production Begins at the Gigafactory. Tesla. https://www.tesla.com/blog/
battery-cell-production-begins-gigafactory. Published January 4, 2017. Accessed August 2016-
May 2017.
13 Office of Energy Efficiency and Renewable Energy. Soft Costs. Energy.gov. https://energy.gov/eere/
sunshot/soft-costs. Published 2016. Accessed August 2016-May 2017.
14 National Renewable Energy Laboratory. NREL Report Shows U.S. Solar Photovoltaic Costs Continuing
to Fall in 2016. NREL. http://www.nrel.gov/news/press/2016/37745. Published September 28, 2016.
Accessed August 2016-May 2017.
15 Landberg R. Battery Cost Plunge Seen Changing Automakers Most in 100 Years. Bloomberg.com.
https://www.bloomberg.com/news/articles/2016-10-11/battery-cost-plunge-seen-changing-
automakers-most-in-100-years. Published October 11, 2016. Accessed August 2016-May 2017.
E N D N OT E S

ENERGY STORAGE ROADMAP REPORT78
16 Manghani R. The Economics of Commercial Energy Storage in the US. Greentech Media; 2016. http://
greentechmedia.com/research/report/the-economics-of-commercial-energy-storage-in-the-us.
Accessed August 2016-May 2017.
17 Knupher, S.; Hensley, R.; Hertzke, P; Schaufuss, P.; Laverty, N.; Kramer, N. Electrifying Insights: How
Automakers Can Drive Electrified Vehicle Sales and Profitability. McKinsey & Company. 2017.
18 Ashley, S. “Battling the high cost of EV batteries.” SAE International. 2015. Retrieved from http://articles.
sae.org/14195/. Accessed February-March 2017.
19 Falcao A, Jain R, Rajgopal S. Lithium: Charging the Future. HSBC; October 2016.
20 Brinsmead TS, Graham P, Hayward J, Ratnam EL, Reedman L. Future energy storage trends: an
assessment of the economic viability, potential uptake and impacts of electrical energy storage on the
NEM 2015-2035. CSIRO, Australia Report No EP155039. 2015. https://www.researchgate.net/profile/
Luke_Reedman/publication/282737404_Future_energy_storage_trends_An_assessment_of_the_
economic_viability_potential_uptake_and_impacts_of_electrical_energy_storage_on_the_NEM_2015-
2035/links/5620295b08ae70315b55296b.pdf.
21 Chase, Nicholas. “Annual Energy Outlook 2014: Transportation modeling updates and preliminary
results.” U.S. Energy Information Administration. 2013.
22 Sun, Shu. “Lithium-ion battery cost forecast.” Bloomberg New Energy Finance. July 3, 2013.
23 “The Lithium Ion Inflection Point: Advanced Batteries and the Coming Boom in the Global Li-ion Market.”
Navigant Research. November 5, 2013 webinar. http://www.navigantresearch.com/webinar/thelithium-
ion-inflection-point
24 Manghani R. The Economics of Commercial Energy Storage in the US. Greentech Media; 2016. http://
greentechmedia.com/research/report/the-economics-of-commercial-energy-storage-in-the-us.
Accessed August 2016-May 2017.
25 D’Aprile P, Newman J, Pinner D. The new economics of energy storage. Mckinsey. http://www.mckinsey.
com/business-functions/sustainability-and-resource-productivity/our-insights/the-new-economics-of-
energy-storage. Published August 2016. Accessed August 2016-May 2017.
26 Manghani R. The Economics of Commercial Energy Storage in the US. Greentech Media; 2016. http://
greentechmedia.com/research/report/the-economics-of-commercial-energy-storage-in-the-us.
Accessed August 2016-May 2017.
27 Walton R. GE, SCE partner on hybrid battery storage-gas turbine to mitigate Aliso Canyon
shortages. Utility Dive. http://www.utilitydive.com/news/ge-sce-partner-on-hybrid-battery-storage-
gas-turbine-to-mitigate-aliso-can/427747/. Published October 6, 2016. Accessed August-
December 2016.
28 US Energy Information Administration. Levelized Cost and Levelized Avoided Cost of New Generation
Resources in the Annual Energy Outlook 2017. EIA; 2017. https://www.eia.gov/outlooks/aeo/pdf/
electricity_generation.pdf.
29 Lazard. Levelized Cost of Energy Analysis V.10. Lazard; 2016. https://www.lazard.com/media/438038/
levelized-cost-of-energy-v100.pdf.
30 World Energy Council. E-Storage: Shifting from Cost to Value – Wind and Solar Applications. February 2016.
31 World Energy Council. E-Storage: Shifting from Cost to Value – Wind and Solar Applications. February 2016.
32 Lazard. Levelized Cost of Storage V2.0 (pp. 3). 2016. https://www.lazard.com/media/438042/lazard-
levelized-cost-of-storage-v20.pdf.
79ENDNOTES
33 World Energy Council. E-Storage: Shifting from Cost to Value – Wind and Solar Applications.
February 2016.
34 Federal Energy Regulatory Commission. What FERC Does. https://www.ferc.gov/about/ferc-does.asp.
Published May 24, 2016. Accessed August 2016-May 2017.
35 FERC. Final Rule: Preventing Undue Discrimination and Preference in Transmission Service. https://www.ferc.
gov/industries/electric/indus-act/oatt-reform/order-890/fact-sheet.pdf.
36 FERC. Final Rule Transmission Planning and Cost Allocation by Transmission Owning and Operating Public
Utilities. http://breakingenergy.sites.breakingmedia.com/wp-content/uploads/sites/2/2011/08/
FERCOrder1000Presentation.pdf.
37 FERC. Electric Storage Participation in Markets Operated by Regional Transmission Organizations
and Independent System Operators. 2016. https://www.ferc.gov/whats-new/comm-
meet/2016/111716/E-1.pdf.
38 U.S. Department of Energy. Mission. https://energy.gov/mission. Accessed August 2016-May 2017.
39 Office of Electric Delivery and Energy Reliability. Recovery Act: Smart Grid Demonstration Program
(SGDP). https://energy.gov/oe/information-center/recovery-act-smart-grid-demonstration-program-
sgdp. Accessed August 2016-May 2017.
40 Advanced Research Projects Agency-Energy. General Questions. https://arpa-e.energy.gov/?q=faq/
general-questions. Accessed August 2016-May 2017.
41 North American Electric Reliability Corporation. About NERC. http://www.nerc.com/AboutNERC/
Pages/default.aspx. Accessed August 2016-May 2017.
42 FERC. Final Rule: Preventing Undue Discrimination and Preference in Transmission Service. https://www.
ferc.gov/industries/electric/indus-act/oatt-reform/order-890/fact-sheet.pdf.
43 FERC. Final Rule Transmission Planning and Cost Allocation by Transmission Owning and Operating
Public Utilities. http://breakingenergy.sites.breakingmedia.com/wp-content/uploads/sites/2/2011/08/
FERCOrder1000Presentation.pdf.
44 SmartGrid.gov. Smart Grid Demonstration Program. Accessed August 2016-May 2017. https://www.
smartgrid.gov/recovery_act/overview/smart_grid_demonstration_program.html
45 FERC. Wholesale Competition in Regions with Organized Electric Markets. 2008. https://www.ferc.gov/
whats-new/comm-meet/2008/101608/E-1.pdf.
46 Wolkon B. Issue Brief: Energy Storage White Papers. Environmental and Energy Study Institute. http://
www.eesi.org/papers/view/issue-brief-energy-storage. Published August 6, 2013. Accessed August
2016-May 2017.
47 Wolkon B. Issue Brief: Energy Storage White Papers. Environmental and Energy Study Institute. http://
www.eesi.org/papers/view/issue-brief-energy-storage. Published August 6, 2013. Accessed August
2016-May 2017.
48 FERC: Industries - Order No. 1000 - Transmission Planning and Cost Allocation. https://www.ferc.gov/
industries/electric/indus-act/trans-plan.asp. Accessed August 2016-May 2017.
49 FERC. Final Rule Transmission Planning and Cost Allocation by Transmission Owning and Operating
Public Utilities. http://breakingenergy.sites.breakingmedia.com/wp-content/uploads/sites/2/2011/08/
FERCOrder1000Presentation.pdf.
50 FERC. Frequency Regulation Compensation in the Organized Wholesale Power Markets. 2011. https://www.
ferc.gov/whats-new/comm-meet/2011/102011/E-28.pdf.

ENERGY STORAGE ROADMAP REPORT80
51 Wolkon B. Issue Brief: Energy Storage White Papers. Environmental and Energy Study Institute. http://
www.eesi.org/papers/view/issue-brief-energy-storage. Published August 6, 2013. Accessed August
2016-May 2017.
52 Office of The Press Secretary. FACT SHEET: Obama Administration Announces Federal and Private
Sector Actions on Scaling Renewable Energy and Storage with Smart Markets. whitehouse.gov. https://
obamawhitehouse.archives.gov/the-press-office/2016/06/16/fact-sheet-obama-administration-
announces-federal-and-private-sector. Published June 16, 2016. Accessed August 2016-May 2017.
53 FERC. Utilization of Electric Storage Resources for Multiple Services When Receiving Cost-Based Rate
Recovery. 2017. https://www.ferc.gov/whats-new/comm-meet/2017/011917/E-2.pdf.
54 Clean Energy States Alliance. Energy Storage Technology Advancement. U.S. Department of Energy
Electric Delivery and Energy Reliability. https://energy.gov/sites/prod/files/ESTAP.pdf. Published
October 2012. Accessed August 2016-May 2017.
55 FERC. Electric Storage Participation in Markets Operated by Regional Transmission Organizations and
Independent System Operators. 2016. https://www.ferc.gov/whats-new/comm-meet/2016/111716/E-1.pdf.
56 Trabish HK. A silver bullet? Inside FERC’s landmark energy storage rulemaking. Utility Dive. http://
www.utilitydive.com/news/a-silver-bullet-inside-fercs-landmark-energy-storage-rulemaking/433559/.
Published January 10, 2017. Accessed August 2016-May 2017.
57 Trabish HK. How aggregated DERs are becoming the new demand response. Utility Dive. http://www.
utilitydive.com/news/how-aggregated-ders-are-becoming-the-new-demand-response/422725/.
Published July 20, 2016. Accessed August 2016-May 2017.
58 California Independent System Operator. Advancing and Maximizing Energy Storage Technology. CAISO;
2014. https://www.caiso.com/Documents/Advancing-MaximizingValueofEnergyStorageTechnolo
gy_CaliforniaRoadmap.pdf.
59 California Independent System Operator. Energy Storage and Distributed Energy Resources (ESDER)
Stakeholder Initiative. CAISO; 2017. https://www.caiso.com/informed/Pages/StakeholderProcesses/
EnergyStorage_DistributedEnergyResourcesPhase1.aspx
60 Shparber S. Utilization in the Organized Markets of Electric Storage Resources as Transmission Assets
Compensated Through Transmission Rates, for Grid Support Services Compensated in Other Ways, and for
Multiple Services. FERC; 2016. http://www.pjm.com/Media/documents/ferc/filings/2016/20161104-
ad16-25-000.pdf.
61 New York Independent System Operator. Power Trends - Right Sizing the Grid. NYISO; 2015. http://
www.nyiso.com/public/webdocs/media_room/press_releases/2015/Child_PowerTrends_2015/
ptrends2015_FINAL.pdf.
62 New England Independent System Operator. Redesigned Regulation Market Now in Effect. New
England Independent System Operator - Newswire. http://isonewswire.com/updates/2015/4/7/
redesigned-regulation-market-now-in-effect.html. Published April 7, 2015. Accessed August 2016-
May 2017.
63 Johnson E. How Energy Storage Can Participate in New England’s Wholesale Electricity Markets.
New England Independent System Operator; 2016. https://www.iso-ne.com/static-assets/
documents/2016/01/final_storage_letter_cover_paper.pdf.
64 New England Independent System Operator. 2016 Regional Electricity Outlook. New England Independent
System Operator; 2016. https://www.iso-ne.com/static-assets/documents/2016/03/2016_reo.pdf.

81ENDNOTES
65 New England System Operator. Resource Mix. New England System Operator. https://www.iso-ne.com/
about/key-stats/resource-mix. Published 2017. Accessed August 2016-May 2017.
66 Maloney P. How MISO is reforming market rules to spur storage deployment. Utility Dive. http://www.
utilitydive.com/news/how-miso-is-reforming-market-rules-to-spur-storage-deployment/412590/.
Published January 26, 2016. Accessed August 2016-May 2017.
67 Federal Energy Regulatory Commission. Order Granting Complaint in Part and Denying Complaint in Part.
2017. https://www.ferc.gov/CalendarFiles/20170201185632-EL17-8-000.pdf.
68 Alliance CES. CESA Markets Webinar Brief September. Energy Storage Market Update. http://www.
cesa.org/assets/2016-Files/CESA-Markets-Webinar-Brief-September-2015.pdf. Published September
2015. Accessed August 2016-May 2017.
69 Trabish HK. A silver bullet? Inside FERC’s landmark energy storage rulemaking. Utility Dive. http://
www.utilitydive.com/news/a-silver-bullet-inside-fercs-landmark-energy-storage-rulemaking/433559/.
Published January 10, 2017. Accessed August 2016-May 2017.
70 World Nuclear Association. Electricity and Energy Storage. http://www.world-nuclear.org/
information-library/current-and-future-generation/electricity-and-energy-storage.aspx. Accessed
August 2016-May 2017.
71 Texas Public Utility Commission. PUC Rulemaking Proceeding Public Utility Commission Concerning
an ERCOT Pilot Project of Texas. 2012. http://www.puc.texas.gov/agency/rulesnlaws/subrules/
electric/25.361/40150adt.pdf.
72 Richards H. Controversial wind bill intended to help coal; critics question final outcome. Casper Star-
Tribune Online. http://trib.com/business/energy/controversial-wind-bill-intended-to-help-coal-critics-
question-final/article_1e849e05-8f5f-5410-8722-f522746de416.html. Published January 15, 2017.
Accessed August 2016-May 2017.
73 California Energy Commission. Self-Generation Incentive Program. Self-Generation Incentive
Program. http://www.cpuc.ca.gov/General.aspx?id=5935. Published 2017. Accessed August 2016-
May 2017.
74 Texas Public Utility Commission. PUC Rulemaking Proceeding Public Utility Commission Concerning
an ERCOT Pilot Project of Texas. 2012. http://www.puc.texas.gov/agency/rulesnlaws/subrules/
electric/25.361/40150adt.pdf.
75 California Energy Commission. Energy Storage. http://www.cpuc.ca.gov/General.aspx?id=3462.
Published 2017. Accessed August 2016-May 2017.
76 Texas Public Utility Commission. PUC Rulemaking Proceeding Public Utility Commission Concerning
an ERCOT Pilot Project of Texas. 2012. http://www.puc.texas.gov/agency/rulesnlaws/subrules/
electric/25.361/40150adt.pdf.
77 House of Representatives, State of Hawaii. House Bill 1943 Grid Modernization; Hawaii Electric
System; Public Utilities Commission. http://www.capitol.hawaii.gov/session2014/bills/HB1943_
CD1_.pdf.
78 Utah Office of Energy Development. Utah’s 10-Year Strategic Energy Plan 2.0. Utah Office of
Energy Development; February 2014. http://energy.utah.gov/download/reports/10%20Year%20
Strategy_2.0_03042014.pdf.
79 Oregon Legislative Assembly. House Bill 2193 Relating to Energy Storage; and Declaring an Emergency.2015.
https://olis.leg.state.or.us/liz/2015R1/Downloads/MeasureDocument/HB2193.

ENERGY STORAGE ROADMAP REPORT82
80 Trabish HK. Oregon saddles up to implement trailblazing energy storage mandate. Utility Dive.
http://www.utilitydive.com/news/oregon-saddles-up-to-implement-trailblazing-energy-storage-
mandate/409222/. Published November 17, 2015. Accessed August 2016-May 2017.
81 Clean Energy Group. Stafford Hill Solar Farm and Microgrid. Clean Energy Group. http://www.
cleanegroup.org/ceg-projects/resilient-power-project/featured-installations/stafford-hill/. Published
2017. Accessed August 2016-May 2017.
82 New Mexico Energy, Minerals and Natural Resource Department. New Mexico Energy Policy &
Implementation Plan.; 2015. http://www.emnrd.state.nm.us/EnergyPolicy/documents/EMNRD_
EnergyPolicy.pdf.
83 New York Public Utility Commission. Public Service Commission Approves Restructuring of Utility
Regulations to Combat Climate Change & Achieve Nation-Leading Clean Energy Goals. New
York Public Utility Commission; 2016. http://www3.dps.ny.gov/pscweb/WebFileRoom.nsf/
ArticlesByCategory/9B4FB5513905CB5985257FB8006DAD48/$File/pr16028.pdf?OpenElement.
84 Department of Public Service. DPS - Reforming the Energy Vision. DPS -
Reforming the Energy Vision. http://www3.dps.ny.gov/W/PSCWeb.nsf/All/
CC4F2EFA3A23551585257DEA007DCFE2?OpenDocument. Published January 20, 2017. Accessed
August 2016-May 2017.
85 Commonwealth of Massachusetts. House Bill 4568 An Act to Promote Energy Diversity. 2016. https://
malegislature.gov/Bills/189/House/H4568. Accessed August 2016-May 2017.
86 Official Website of the Governor of Massachusetts. Governor Baker Signs Comprehensive Energy
Diversity Legislation. http://www.mass.gov/governor/press-office/press-releases/fy2017/governor-
baker-signs-comprehensive-energy-diversity-law.html. Published August 8, 2016. Accessed August
2016-May 2017.
87 Delaware Sustainability Energy Utility. Delaware Sustainable Energy Utility (DESEU) Board Approves
Delaware’s First Solar Resiliency Pilot Program. 2016. http://gabelassociates.com/wp-content/
uploads/2016/05/DESEU_-Press-Release-Final-5-4-16.pdf.
88 Tweed K. 5 Surprising States Where Commercial Energy Storage Works Today. Greentech Media.
https://www.greentechmedia.com/articles/read/5-surprising-states-where-commercial-energy-storage-
works-today. Published July 20, 2016. Accessed August 2016-May 2017.
89 Federal Energy Regulatory Commission. Order Granting Complaint in Part and Denying Complaint in Part.
2017. https://www.ferc.gov/CalendarFiles/20170201185632-EL17-8-000.pdf.
90 Battery Innovation Center. Mission and Vision. http://www.bicindiana.com/missionandvision. Accessed
August 2016-May 2017.
91 New Jersey Board of Public Utilities. Renewable Electric Storage. New Jersey’s Clean Energy Program.
http://www.njcleanenergy.com/renewable-energy/programs/energy-storage. Published April 13, 2017.
Accessed August 2016-May 2017.
92 UL. Battery and Energy Storage Technology. Battery and Energy Storage Technology. http://industries.ul.com/
energy/battery-and-energy-storage-technology. Published 2017. Accessed August 2016-May 2017.
93 UL. Standard for Portable Power Packs. Standards Catalog. https://standardscatalog.ul.com/standards/
en/standard_2743_1. Published 10/2016. Accessed August 2016-May 2017.
94 UL. Standard for Energy Storage Systems and Equipment. Standards Catalog. https://standardscatalog.
ul.com/standards/en/standard_9540. Published 11/2016. Accessed August 2016-May 2017.
83ENDNOTES
95 SAE International. Automotive Standards on Energy storage systems. http://topics.sae.org/energy-
storage-systems/standards/automotive/. Published 2017. Accessed August 2016-May 2017.
96 IEEE Standards Association. Batteries Standards. https://standards.ieee.org/findstds/standard/batteries.
html. Published 2017. Accessed August 2016-May 2017.
97 International Code Council. publicACCESS™ 2015 International Fire Code. https://codes.iccsafe.org/
public/document/toc/546/
98 Jilani, Ibrahim. Personal correspondence. February 3, 2017.
99 National Fire Protection Association. NFPA 855: Standard for the Installation of Stationary Energy
Storage Systems. http://www.nfpa.org/codes-and-standards/all-codes-and-standards/list-of-codes-
and-standards?mode=code&code=855&tab=about. Published 2016. Accessed August 2016-
May 2017.
100 National Fire Protection Association. Workshop on Energy Storage Systems and the Built Environment
- NFPA. http://www.nfpa.org/news-and-research/fire-statistics-and-reports/research-reports/
proceedings/2016-proceedings/workshop-on-energy-storage-systems-and-the-built-environment.
Published 2016. Accessed August 2016-May 2017.
101 National Fire Protection Association. NFPA 70: National Electrical Code (NEC) Softbound. http://
catalog.nfpa.org/NFPA-70-National-Electrical-Code-NEC-Softbound-P1194.aspx?icid=D536. Published
2017. Accessed August 2016-May 2017.
102 Manghani R. The Economics of Commercial Energy Storage in the US. Greentech Media; 2016. http://
greentechmedia.com/research/report/the-economics-of-commercial-energy-storage-in-the-us.
Accessed August 2016-May 2017.
103 Brinsmead TS, Graham P, Hayward J, Ratnam EL, Reedman L. Future energy storage trends: an
assessment of the economic viability, potential uptake and impacts of electrical energy storage on
the NEM 2015-2035. CSIRO, Australia Report No EP155039. 2015. https://www.researchgate.net/
profile/Luke_Reedman/publication/282737404_Future_energy_storage_trends_An_assessment_
of_the_economic_viability_potential_uptake_and_impacts_of_electrical_energy_storage_on_the_
NEM_2015-2035/links/5620295b08ae70315b55296b.pdf.
104 Falcao A, Jain R, Rajgopal S. Lithium: Charging the Future. HSBC; October 2016.
105 Parks Associates. Li-Ion Batteries to Dominate the Global Battery Energy Storage Market for Smart
Grid Through 2020. Smart Grid Observer. http://www.smartgridobserver.com/n7-8-16-energy-storage-
market.htm. Published July 8, 2016. Accessed August 2016-May 2017.
106 Cho J. Gigafactory a Game Changer. Mirae Assets; 2016.
107 Brinsmead TS, Graham P, Hayward J, Ratnam EL, Reedman L. Future energy storage trends: an
assessment of the economic viability, potential uptake and impacts of electrical energy storage on the
NEM 2015-2035. CSIRO, Australia Report No EP155039. 2015. https://www.researchgate.net/profile/
Luke_Reedman/publication/282737404_Future_energy_storage_trends_An_assessment_of_the_
economic_viability_potential_uptake_and_impacts_of_electrical_energy_storage_on_the_NEM_2015-
2035/links/5620295b08ae70315b55296b.pdf.
108 European Commission. Commercialization of Energy Storage in Europe: A Fact-Based Analysis of the
Implications of Projected Development of the European Electric Power System towards 2030 and beyond for
the Role and Commercial Viability of Energy Storage. March 2015. http://www.fch.europa.eu/sites/default/
files/CommercializationofEnergyStorageFinal_3.pdf.
ENERGY STORAGE ROADMAP REPORT84
109 Kim, K. ESS battery report: State of the industry for stationary energy storage systems. Greensmith Energy
Management System, 2011.
110 Rusch C, Kaye N, Owen K. Stationary Energy Storage: Walking before We Run. Oppenheimer; 2016.
111 International Energy Agency. Technology Roadmap Energy Storage. 2014. https://www.iea.org/
publications/freepublications/publication/TechnologyRoadmapEnergystorage.pdf
112 California Independent System Operator. Advancing and Maximizing Energy Storage Technology. CAISO;
2014. https://www.caiso.com/Documents/Advancing-MaximizingValueofEnergyStorageTechnolo
gy_CaliforniaRoadmap.pdf.
113 European Commission. DG Ener Working Paper: The future role and challenges of Energy Storage. 2013.
https://ec.europa.eu/energy/sites/ener/files/energy_storage.pdf.
114 World Energy Council. E-Storage: Shifting from Cost to Value – Wind and Solar Applications. February 2016.
115 Baxter, R. Energy Storage Financing: A Roadmap for Accelerating Market Growth. Sandia National
Laboratories; August 2016.
116 Renewable Energy Association. Energy Storage in the UK: An Overview. 2015. https://www.r-e-a.net/
upload/rea_uk_energy_storage_report_november_2015_-_final.pdf.
117 Baxter, R. Energy Storage Financing: A Roadmap for Accelerating Market Growth. Sandia National
Laboratories; August 2016.
118 Rusch C, Kaye N, Owen K. Stationary Energy Storage: Walking before We Run. Oppenheimer; 2016.
119 Baxter, R. Energy Storage Financing: A Roadmap for Accelerating Market Growth. Sandia National
Laboratories; August 2016.
120 Baxter, R. Energy Storage Financing: A Roadmap for Accelerating Market Growth. Sandia National
Laboratories; August 2016.
121 California Independent System Operator. Advancing and Maximizing Energy Storage Technology. CAISO;
2014. https://www.caiso.com/Documents/Advancing-MaximizingValueofEnergyStorageTechnolo
gy_CaliforniaRoadmap.pdf.
122 Fitzgerald G, Mandel J, Morris J, Touatl H. The Economics of Battery Storage: How Multi-Use, Customer-Sited
Batteries Deliver the Most Services and Value to Customers and the Grid. Rocky Mountain Institute; 2015.
123 Abele A, Elkind E, Intrator J, Washom B. 2020 Strategic Analysis of Energy Storage in California. California
Energy Commission. University of California Berkeley; 2011.
124 International Energy Agency. Technology Roadmap Energy Storage. 2014. https://www.iea.org/
publications/freepublications/publication/TechnologyRoadmapEnergystorage.pdf.
125 World Energy Council. E-Storage: Shifting from Cost to Value – Wind and Solar Applications.
February 2016.
126 International Energy Agency. Technology Roadmap Energy Storage. 2014. https://www.iea.org/
publications/freepublications/publication/TechnologyRoadmapEnergystorage.pdf.
127 Abele A, Elkind E, Intrator J, Washom B. 2020 Strategic Analysis of Energy Storage in California. California
Energy Commission. University of California Berkeley; 2011.
128 California Independent System Operator. Advancing and Maximizing Energy Storage Technology. CAISO;
2014. https://www.caiso.com/Documents/Advancing-MaximizingValueofEnergyStorageTechnolo
gy_CaliforniaRoadmap.pdf.
129 Abele A, Elkind E, Intrator J, Washom B. 2020 Strategic Analysis of Energy Storage in California. California
Energy Commission. University of California Berkeley; 2011.
85ENDNOTES
130 California Independent System Operator. Advancing and Maximizing Energy Storage Technology. CAISO;
2014. https://www.caiso.com/Documents/Advancing-MaximizingValueofEnergyStorageTechnolo
gy_CaliforniaRoadmap.pdf.
131 International Energy Agency. Technology Roadmap Energy Storage. 2014. https://www.iea.org/
publications/freepublications/publication/TechnologyRoadmapEnergystorage.pdf.
132 Abele A, Elkind E, Intrator J, Washom B. 2020 Strategic Analysis of Energy Storage in California.
California Energy Commission. University of California Berkeley; 2011.
133 European Commission. Commercialization of Energy Storage in Europe: A Fact-Based Analysis of the
Implications of Projected Development of the European Electric Power System towards 2030 and beyond for
the Role and Commercial Viability of Energy Storage. March 2015. http://www.fch.europa.eu/sites/default/
files/CommercializationofEnergyStorageFinal_3.pdf.
134 Fitzgerald G, Mandel J, Morris J, Touatl H. The Economics of Battery Storage: How Multi-Use, Customer-Sited
Batteries Deliver the Most Services and Value to Customers and the Grid. Rocky Mountain Institute; 2015.
135 California Independent System Operator. Advancing and Maximizing Energy Storage Technology. CAISO;
2014. https://www.caiso.com/Documents/Advancing-MaximizingValueofEnergyStorageTechnolo
gy_CaliforniaRoadmap.pdf.
136 Manghani R. The Economics of Commercial Energy Storage in the US. Greentech Media; 2016. http://
greentechmedia.com/research/report/the-economics-of-commercial-energy-storage-in-the-us.
Accessed August 2016-May 2017.
137 European Commission. Commercialization of Energy Storage in Europe: A Fact-Based Analysis of the
Implications of Projected Development of the European Electric Power System towards 2030 and beyond for
the Role and Commercial Viability of Energy Storage. March 2015.
138 Renewable Energy Association. Energy Storage in the UK: An Overview. 2015. https://www.r-e-a.net/
upload/rea_uk_energy_storage_report_november_2015_-_final.pdf.
139 Obama White House Archives. Incorporating Renewables into the Electric Grid: Expanding Opportunities
for Smart Markets and Energy Storage. June 2016. https://obamawhitehouse.archives.gov/sites/default/
files/page/files/20160616_cea_renewables_electricgrid.pdf.
140 Rusch C, Kaye N, Owen K. Stationary Energy Storage: Walking before We Run. Oppenheimer; 2016.
141 Rittershausen J, McDonagh M. Moving Energy Storage from Concept to Reality. Southern California
Edison; 2012. https://www.edison.com/content/dam/eix/documents/innovation/smart-grids/Energy-
Storage-Concept-to-Reality-Edison.pdf.
142 Abele A, Elkind E, Intrator J, Washom B. 2020 Strategic Analysis of Energy Storage in California. California
Energy Commission. University of California Berkeley; 2011.
143 Fitzgerald G, Mandel J, Morris J, Touatl H. The Economics of Battery Storage: How Multi-Use, Customer-Sited
Batteries Deliver the Most Services and Value to Customers and the Grid. Rocky Mountain Institute; 2015.
144 Rusch C, Kaye N, Owen K. Stationary Energy Storage: Walking before We Run. Oppenheimer; 2016.
145 Obama White House Archives. Incorporating Renewables into the Electric Grid: Expanding
Opportunities for Smart Markets and Energy Storage. June 2016. https://obamawhitehouse.archives.
gov/sites/default/files/page/files/20160616_cea_renewables_electricgrid.pdf.
146 Fitzgerald G, Mandel J, Morris J, Touatl H. The Economics of Battery Storage: How Multi-Use, Customer-Sited
Batteries Deliver the Most Services and Value to Customers and the Grid. Rocky Mountain Institute; 2015.
147 Rusch C, Kaye N, Owen K. Stationary Energy Storage: Walking before We Run. Oppenheimer; 2016.

ENERGY STORAGE ROADMAP REPORT86
N OT E S

87NOTES

ENERGY STORAGE ROADMAP REPORT88

LETTER 89
Our MissionWe leverage our network of global thought leaders to
develop integrated energy solutions that:
• Reduce costs, emissions and waste;
• Influence policy; and
• Advance technological innovation
…to increase quality of life for today and tomorrow.
Our VisionESN is building an energy ecosystem that integrates all
aspects of the energy landscape: energy generation,
distribution, the built environment, and transportation.

ENERGY STORAGE ROADMAP REPORT90
111 Monument Circle
Suite 1800
Indianapolis, IN 46204
P: 317.532.4774
F: 317.638.2110
www.energysystemsnetwork.com