energy storage system for railway applicationsetheses.bham.ac.uk/5076/1/hajiabady14mres.pdf ·...
TRANSCRIPT

1
Energy Storage System for Railway Applications &
Analysis and Modelling of Electrochemical Batteries for
Conductor Rail Gap DC Railway
Thesis submitted in accordance with the requirements of the University of
Birmingham for the degree of Master of research
In
Railway Systems Engineering and Integration
College of Engineering, School of Civil Engineering
By
Siavash Hajiabady & Supervised By Dr Pietro Tricoli
September 2013

University of Birmingham Research Archive
e-theses repository This unpublished thesis/dissertation is copyright of the author and/or third parties. The intellectual property rights of the author or third parties in respect of this work are as defined by The Copyright Designs and Patents Act 1988 or as modified by any successor legislation. Any use made of information contained in this thesis/dissertation must be in accordance with that legislation and must be properly acknowledged. Further distribution or reproduction in any format is prohibited without the permission of the copyright holder.

2
Acknowledgements
First and foremost, I would like to express my sincere appreciation to my supervisors Dr
Pietro Tricoli, for his support, guidance, inspiration and patience during my MRes study. I
have greatly benefited from his knowledge and experience.
I am also grateful to Dr Stuart Hillmansen for his support and advices during my research. I
would like to thank Dr Farzad Hayati for his help during my project.
Finally, I would like to thank my family and all my friends. Without their encouragement,
support and understanding, this thesis would not have been possible.

3
ABSTRACT
A new model of energy storage has been created by using electrochemical batteries, which is
helpful to analyse the possibility of using batteries for traction systems of DC railway. As a
result, there are two opportunities of using batteries energy storage for traction system in DC
railway: one is to build On-board applications for covering the discontinuous power supply
over the gap; and the other is to build Stationary storage or track side application for
recovering the braking energy used by batteries. This model can be used to identify the
appropriate batteries for different applications.

4
Table of Contents
Acknowledgements .................................................................................................................... 2
Abstract ………………………………………………………………….……………………3
List of Figures ............................................................................................................................ 6
List of Tables ............................................................................................................................. 9
List of Abbreviations ............................................................................................................... 10
Chapter 1 .................................................................................................................................. 11
Literature Review, Objectives and Methodology of the Project.............................................. 11
1.1 Introduction ........................................................................................................................ 11
1.1.1 Brief History of British Rail ........................................................................................... 11
1.1.2 Different Type of Railway Feeding Systems .................................................................. 12
1.2 Review of Electrical Energy Storage ................................................................................. 13
1.3 Different Types of Energy Storage .................................................................................... 14
1.3.1 Batteries .......................................................................................................................... 14
1.3.1.1 Different Types of Batteries......................................................................................... 15
1.3.1.1.1 Lead Acid Batteries................................................................................................... 15
1.3.1.1.2 Nickel Metal Hydride Batteries ................................................................................ 16
1.3.1.1.3 Lithium-Ion Batteries ................................................................................................ 17
1.3.1.1.4 Sodium - Sulphur (NaS) Batteries ............................................................................ 18
1.3.1.1.5 Flow Batteries ........................................................................................................... 18
1.3.2 Super-Capacitors Technology ......................................................................................... 19
1.3.3 Flywheels for Energy Storage ......................................................................................... 20
1.4 Energy Storage in Different Railway Applications ........................................................... 21
1.4.1 Stationary Energy Storage Application .......................................................................... 21
1.4.2 Onboard Energy Storage Application ............................................................................. 22
1.5 Power Converters ............................................................................................................... 24
1.6 Summary and Discussion ................................................................................................... 25
1.7 Project Objectives .............................................................................................................. 27
1.8 Methodology ...................................................................................................................... 28
1.9 Outline of the Thesis .......................................................................................................... 29
Chapter 2 .................................................................................................................................. 30
Battery Designs for Different Applications ............................................................................. 30
2.1 Mathematical Descriptions of Lead-acid Batteries ............................................................ 30

5
2.1.1Capacity ........................................................................................................................... 30
2.1.2 State of Charge and Depth of Discharge ......................................................................... 31
2.1.3 Internal Resistance and State of Health .......................................................................... 32
2.2 DESIGN STRUCTURE..................................................................................................... 33
2.2.1 System Block Diagram ................................................................................................... 35
2.2.1.1ABC-170 Remote Operation System (ROS) ................................................................ 36
2.2.1.2Planning a Test .............................................................................................................. 37
2.2.2 Charging Operation ......................................................................................................... 39
2.2.3 Discharging Operation .................................................................................................... 40
2.2.3.1 Discharging Operation Results and Discussion ........................................................... 42
2.3 Summary and Discussion ................................................................................................... 47
Chapter 3 .................................................................................................................................. 48
3.1 Design and Model DC Railway Traction System with Conductor Rail Gap .................... 48
3.1.1 Design DC Substations ................................................................................................... 49
3.1.1.1AC-DC 12 Pulse Transformer Rectifier Modelling ...................................................... 49
3.1.1.2 Overall design of substation in MATLAB/SIMULINK .............................................. 50
3.1.2 Design DC Railway with Two Substation and Moving Train ........................................ 52
3.1.3 Design DC Railway with Conductor Rail Gap ............................................................... 56
3.2 Summary and Discussion ................................................................................................... 60
Chapter 4 .................................................................................................................................. 61
4.1 Design the Energy Storage for DC Railway Traction System through the Conductor Rail
Gap for London Underground- Victoria line ........................................................................... 61
4.1.1 Train Specification .......................................................................................................... 61
4.1.2 Train Performance .......................................................................................................... 62
4.2 Design Structure......................................................................................... 63_Toc386916623
4.2.1 Battery Based Energy Required by the Train ................................................................. 64
4.2.2 Energy Storage Design and Discussion .......................................................................... 67
4.2.2.1 Batteries design for London underground gaps ........................................................... 68
4.2.2.2 Super-capacitors design for London underground gaps .............................................. 71
4.3 Summary and Discussion ................................................................................................... 73
Chapter 5 .................................................................................................................................. 74
Conclusion and Future Work ................................................................................................... 74
5.1 Conclusion ......................................................................................................................... 74

6
5.2 Future Work ....................................................................................................................... 74
References ................................................................................................................................ 76
Appendix1 Risk assessment ..................................................................................................... 79
Appendix2 ................................................................................................................................ 87
Battery charging code .............................................................................................................. 87
Battery discharging code.......................................................................................................... 91
Appendix3 ................................................................................................................................ 93
Battery model code .................................................................................................................. 93
Appendix 4 ............................................................................................................................... 95
Appendix 5 ............................................................................................................................... 96

7
List of Figures
Figure 1 Structure of DC Feeding System (Oura, 1998) ......................................................... 12
Figure 2 BT feeding system (Oura, 1998) ............................................................................... 13
Figure 3 AT feeding system (Oura, 1998) ............................................................................... 13
Figure 4 Cross section of Lead Acid Battery (REUK, 2006) .................................................. 16
Figure 5 Cross section of Nickel Metal Hydride Batteries (Rosch, 2001) .............................. 16
Figure 6 Lithium-ion charge mechanism (Brain, 2006) .......................................................... 17
Figure 7 Lithium-ion discharge mechanism (Brain, 2006) ...................................................... 17
Figure 8 Cross section of a sodium-sulphur battery (Blog, 2006) ........................................... 18
Figure 9 Schematic of flow battery (THOMAS, 2007) ........................................................... 19
Figure 10 Figure 10 Structure of electric double-layer capacitor (Hanmin Lee*, n.d.) .......... 19
Figure 11 Flywheel (Schoenung, 2002) ................................................................................... 20
Figure 12 DC voltage network with stationary energy storage (R Barrero1∗, 2009) .............. 22
Figure 13 On-board energy storage application (Steiner, 2005) .............................................. 23
Figure 14 Figure 14 discontinuous power supplies (Kadhim, 2009) ....................................... 24
Figure 15 Bidirectional DC/DC converter ............................................................................... 25
Figure 16 Block diagram of DC railway.................................................................................. 28
Figure 17 Mathematical model with SOC .............................................................................. 32
Figure 18 Safety box ................................................................................................................ 34
Figure 19 Structure of connection between battery and battery cycler ................................... 35
Figure 20 Block diagram ABC-170 structural design ............................................................. 35
Figure 21 Remote Operation System Graphical Test Control ................................................. 37
Figure 22 Automatic mode of ROS software .......................................................................... 39
Figure 23 Charging operation .................................................................................................. 40
Figure 24 Manual mode of ROS software ............................................................................... 41
Figure 25 Discharging Operation............................................................................................. 43
Figure 26 Capacity of battery .................................................................................................. 44
Figure 27 SOC of battery during 60 A discharge current ........................................................ 45
Figure 28 Battery model of lead acid battery in MATLAB ..................................................... 45
Figure 29 Simple model of battery .......................................................................................... 46
Figure 30 Voltage source of battery......................................................................................... 47
Figure 31 Model of a typical DC traction system .................................................................... 48
Figure 32 12-Pulse Rectifier .................................................................................................... 49

8
Figure 33 MATLAB/SIMULINK model of one substation .................................................... 50
Figure 34 Inter phase transformer ............................................................................................ 51
Figure 35 Simulation results of the modelled one substation rectifier .................................... 52
Figure 36 MATLAB/SIMULINK model of two substations .................................................. 53
Figure 37 Simple MATLAB/ SIMULINK model of the system ............................................. 54
Figure 38 The mathematical model of track, voltage drops and their controlled signals ........ 55
Figure 39 Signal builder........................................................................................................... 55
Figure 40 Simulation results model of two substations ........................................................... 56
Figure 41 Dc Railway with Conductor Rail Gap ..................................................................... 57
Figure 42 DC railway current supply....................................................................................... 58
Figure 43 Train performance over the gap .............................................................................. 58
Figure 44 DC Railway with energy storage design ................................................................ 59
Figure 45 Simulation results of DC railway with energy storage ............................................ 60
Figure 46 The arrangement of traction systems and shoe gears .............................................. 62
Figure 47 Train performance tool software ............................................................................. 63
Figure 48 Three-phase non isolated bidirectional dc–dc converter (Jih-Sheng (Jason) Lai,
2007) ........................................................................................................................................ 64
Figure 49 Energy in KWh is needed to run 2009 Tube Stock train over the 15m gap ............ 65
Figure 50 Energy required by train to pass the gap in KWh and Capacity of energy storage
for different distance in different train speed ........................................................................... 65
Figure 51Current required by each A cars during the journey of platform Brixton to platform
Stockwell.................................................................................................................................. 67
Figure 52 Current required by each D and C cars during the journey of platform Brixton to
platform Stockwell ................................................................................................................... 67
Figure 53 Depth of Discharge vs Life Cycle ........................................................................... 68
Figure 54 Safety notice ............................................................................................................ 86
Figure 55 Charging current process ......................................................................................... 89
Figure 56 Voltage of battery during charging.......................................................................... 90
Figure 57 Battery discharge voltage ........................................................................................ 90
Figure 58 Battery voltage in deferent SOC for different discharge current ............................ 94
Figure 59 DC model of railway in SIMULINK....................................................................... 95
Figure 60 Induction motor model in SIMULINK.................................................................... 95
Figure 61 Vector control model ............................................................................................... 96

9
List of Tables
Table 1Energy storage systems (Vazquez, 2010) .................................................................... 14
Table 2 Capacity of battery for different discharge current ..................................................... 43
Table 3 Parameters of three phase source ................................................................................ 51
Table 4 Parameters of three phase transformer (three windings) ............................................ 51
Table 5 Parameters of train ...................................................................................................... 53
Table 6 Different type of batteries design, in order to use them as energy storage system for A
cars ........................................................................................................................................... 69
Table 7 Different type of batteries design, in order to use them as energy storage system for C
cars and D cars ......................................................................................................................... 71
Table 8 Different type of super capacitors design, in order to use them as energy storage
system for this application ....................................................................................................... 72
Table 9 Total cost of super-capacitors for this design ............................................................. 73

10
List of Abbreviations
AC Alternating Current
AT Auto transformer
BR British Rail
BT Booster transformer
C Nominal capacity
CAES Compressed air energy storage
DC Direct Current
DOD Depth of discharge
EDLC Electronic double layer capacitor
ESS Energy storage system
FBs Flow batteries
FES Flywheel energy storage
GWR Gloucestershire Warwickshire Railway
LMSR London, Midland and Scottish Railway
LNER London and North Eastern Railway
Li-ion Lithium-ion
Li-polymer Lithium polymer
Ni.Cd Nickel–cadmium
Ni.MH Nickel metal hydride
Pb-Acid Lead-Acid
ROS Remote Operation System
SOC State of charge
SR Southern Railway
SLI starting, lighting, ignition
VRB vanadium redox battery
ocV open circuit voltage
tV Terminal voltage

11
Chapter 1
Literature Review, Objectives and Methodology of the
Project
1.1 Introduction
Energy storage technologies have made significant strides in helping to alleviate major issues
in the railway domain. They help to reduce overall peak energy demand of the railway
system. Kadhim (2009) identifies the powering of using energy storage in railway, which can
be classified as three aspects:
1. Diesel vehicle (and fuel cell) hybrids;
2. Electric vehicles using batteries only (on-board energy storage);
3. Trackside applications on DC electrified lines (stationary energy storage).
Energy storage technologies face four major challenges that are:
1. Cost,
2. Lifetime,
3. Size,
4. Weight.
This project aims to evaluate the feasibility of the usage of energy storage systems in the
railway. This document will also investigate ways to mitigate the problems arising due to DC
electrification gaps on the lines. This would help reduce the capital costs associated with
electrifying these sections, bring energy savings and improve the overall safety and reliability
of the systems.
1.1.1 Brief History of British Rail
The history of British Rail (BR) can be traced back to post-war rail travel in the UK, and it is
undoubted that the development of BR reflects the overall development of the national
railway network.
12
BR had played a significant role in transforming a collection of exhausted and post-war steam
operators into the modern network between 1948 to 1997. (rail.co.uk, 2013)
In 1948, the UK government decided to modernise its fleet of steam traction with diesel and
electric power locomotives. With the ever increasing share of road haulage in freight this
move was to help the railways become more competitive in the freight market.The closure of
the coal mines and the privatisation of the ports led to a decrease in demand for rail transport.
The passenger segment, which until then was viewed only as an additional income, became
vital to the railways’ finance book. Dr. Beeching’s reports (Beeching, 1963) in 1963 led to
the closure of one thirds of the national railway network. (rail.co.uk, 2013)
The year of 1962 can be regarded as a milestone of BR that became an independent statutory
corporation following the nationalization of the “Big Four” UK railway companies, i.e
LNER, LMSR, GWR and SR. Meanwhile, it took the responsibility of overseeing the
transformation of the UK network until its privatisation in the 1990s (rail.co.uk, 2013).
1.1.2 Different Type of Railway Feeding Systems
Currently, almost 40 per cent of the British rail network is electrified (Rail, 2009). The
railways use both AC and DC feeder systems. The UK standard for AC systems is to use an
overhead line configuration electrified by 25kV, 50Hz. AC systems use high voltage in order
to reduce power loss. DC system uses 3000, 1500, 750 or 600 Volts (3000 Volts DC is not
use in UK); also, they are available either for overhead lines or a third rail.
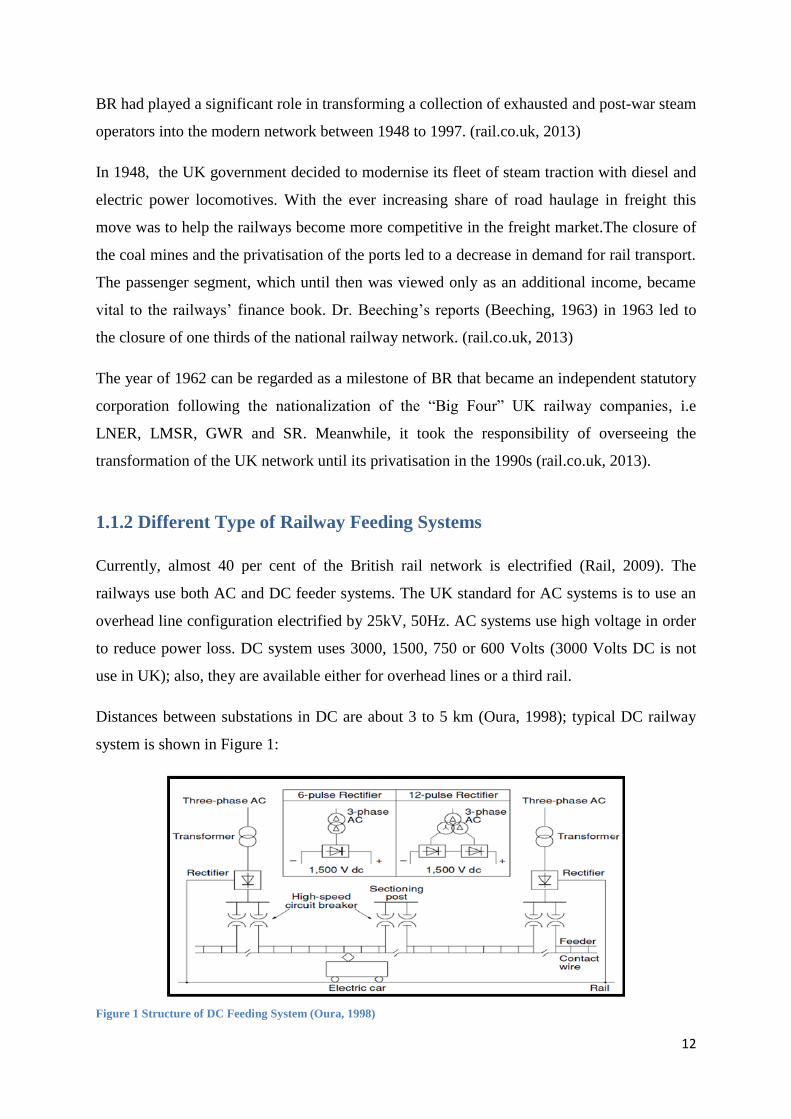
Distances between substations in DC are about 3 to 5 km (Oura, 1998); typical DC railway
system is shown in Figure 1:
Figure 1 Structure of DC Feeding System (Oura, 1998)

13
AC feeding system has two types of feeding systems: auto transformer (AT) and booster
transformer (BT). A BT is installed every 4 km along the track to boost the return circuit
current on the negative conductor; the BT feeding systems is presented in figure 2. In the AT
feeding system, the feeding voltage of the substation is doubled the voltage supply to the
train. An AT, each 10 km along the contact wire, and reload the current from the rail to the
overhead line voltage (Oura, 1998); which is performed in an AT feeding system in Figure 3.
Figure 2 BT feeding system (Oura, 1998)
Figure 3 AT feeding system (Oura, 1998)
1.2 Review of Electrical Energy Storage
Parfomak claims that energy storage technology has great potential to improve electric power
grids; in order to allow expansion in renewable electricity generation, and provide an
alternative to crude oil based fuels in the transportation sector. (Parfomak, 2012)
Electrical energy storage devices essentially convert electrical energy into other forms of
energy, chemical energy, which can be stored and used when required. The option of the ESS
for an application is dependent on its power, energy ratings, response time, weight, volume,

14
and operating temperature. Table 1, shows the details of different types of energy storage
systems.
Table 1: Energy storage systems (Vazquez, 2010)
1.3 Different Types of Energy Storage
There are several technologies employed in the energy storage system industry. However,
this report shall consider only the systems that are suitable to use on the railway system:
Battery, Super Capacitors, and Flywheel. Each will be introduced and explained in the
flowing sub-chapters. However Superconducting Magnetic Energy Storage (SMES) (ltd,
2012) also can be consider for railway industry, but currently this type of energy storage has
not been used for many railway applications.
1.3.1 Batteries
A battery is made by electro-chemical cells, which normally consists of an anode, a cathode,
and an electrolyte; all the equipment’s are fitted in a container. Batteries convert chemical
energy into electrical energy.
For choosing correctly a battery pack, the specific application must be considered; therefore,
it is essential to understand some more details on battery. In order to use batteries for railway
application first of all, it is necessary to know the characteristics of trains, such as input
voltage, maximum power, maximum current, and characteristic of the electrification system.

15
(David Linden, 2002) Then, the battery pack should be chosen on the basis of voltage
required by the railway and power required by the train.
Besides, the capacity of battery is dependent on the system current. For example, when it is
displayed on battery data sheet that the capacity is 100Ah@20 hour, it means that 100 Ah can
be released if the battery is discharged in 20 hours. Therefore, when the battery is discharged
in 5 hours, the capacity of battery would be less then100 Ah. (David Linden, 2002)
In order to choose a battery pack, the C-rate of a battery must be considered. The C-rate is
normally used for indicting the charge and the discharge currents of a battery. Most portable
batteries are rated at 1C, which means that 1Ah battery provides 1A for one hour when it is
discharged at 1C rate; in other words, 1C is 1 hour or 0.2C is 5 hours. (Buchmann, January
2004)
The battery data sheet is based on the assumption that the battery is fully charged. It is
therefore necessary to make ensure that a battery is 100% charged in order to collect accurate
information on the battery during testing.
There are various approaches to measure the State of Charge (SOC) of a battery. The most
common method relies on using the voltage across a battery cell, in order to determine the
SOC of a battery. For example, 12V Li-ion battery has 14.4V when the state of charge is
100%; however, its complete discharge is only 9.6V. Consequently, different voltages of
battery reflect different SOC. (Lee, 2007)
1.3.1.1 Different Types of Batteries
Batteries remain one of the most commonly used energy storage solutions today. There is no
lack of choice on the type of battery to use in a particular situation. The following sections
discuss the types of batteries which are available commercially.
1.3.1.1.1 Lead Acid Batteries
The oldest rechargeable electro-chemical batteries are known as Lead acid batteries, which
have been in use since the mid-1800s. (Vazquez, 2010) Lead acid batteries are made in
different categories by size, and they range from the small 1 Ah units to the large units of
3000 Ah. Lead-acid battery normally has a cell potential of 1.2V, specific energy of 35-50

16
Wh/kg, and energy density of 100 Wh/L. Lead-acid batteries are normally have C/20
discharge rate, where C is the capacity of the battery in Ah. (Bullock, 1994) Figure 4 shows
different part lead Acid batteries.
Figure 4 Cross section of Lead Acid Battery (REUK, 2006)
1.3.1.1.2 Nickel Metal Hydride Batteries
A nickel–metal hydride battery is one type of rechargeable battery. It uses a chemical
composition of either lithium-nickel or titanium-nickel alloy; also, it makes use of potassium-
hydroxide electrolyte, to reform the NiMH cell. Nickel metal hydride batteries have high
capacity, but its cell potential is only 1.35V. Nickel–metal have a higher energy density and
longer cycle life than lead acid batteries. The specific energy is approximately 95 Wh/kg and
the energy density is roughly 350 Wh/L. (Kadhim, 2009).Figure 5 shows how nickel–metal
hydride battery is made.
Figure 5 Cross section of Nickel Metal Hydride Batteries (Rosch, 2001)

17
1.3.1.1.3 Lithium-Ion Batteries
A lithium-ion cell contains a Lithium-manganese-oxide alloy as cathode and the anode is
carbon. The cell voltage of lithium ion batteries is as high as 4.1V when the circuit is opened,
the specific energy is around 125 Wh/kg, and the energy density is more than 300 Wh/L. The
most important advantages of this battery technology are high energy-to-weight ratios, no
memory effect, and a low self-discharge rate. (Lee, 2007). It is very appropriate for hybrid
vehicle applications due to its large energy density. Figure 6 shows charge mechanism of
Lithium-ion and Figure 7 displays discharge mechanism of Lithium-ion.
Figure 6 Lithium-ion charge mechanism (Brain, 2006)
Figure 7 Lithium-ion discharge mechanism (Brain, 2006)

18
1.3.1.1.4 Sodium - Sulphur (NaS) Batteries
A sodium–sulphur battery belongs to the category of molten-salt batteries, which is made by
liquid sodium (Na) and sulphur (S). Its characteristics can be summed up as: a high energy
density, high efficiency of charge/discharge (89–92%), and a long cycle life, as a result, it has
low cost. Besides, it has a solid electrolyte membrane between the anode and cathode. During
discharge possess positive Na ions flow through the circuit of the battery producing about 2
Volts. This process is reversible when current is supplied from an external source. Figure 8
illustrates the cross section of a sodium–sulphur battery (Blog, 2006).
Figure 8 Cross section of a sodium-sulphur battery (Blog, 2006)
1.3.1.1.5 Flow Batteries
As a potential technology, flow batteries (FBs) are available to decouple the total stored
energy from the rated power, which mainly depends on its reactor size; when the auxiliary
tank volume is depended on the stored capacity. As a result, FB is undoubtedly a better
choice for supplying large amounts of power and energy required by electrical applications.
FBs have similar operational principles as hydrogen fuel cells (FCs) due to its two major
structures. They use two electrolytes, which are stored in different tanks, hence eliminating
self-discharge. The micro-porous membrane allows only selected ions to cross through it in

19
order to create an electrical current, but it separates the electrolytes physically. The following
Figure shows how flow batteries are work.
Figure 9 Schematic of flow battery (THOMAS, 2007)
1.3.2 Super-Capacitors Technology
Capacitors store energy by separating two metal foil plates by a dielectric film. Super
capacitors on the other hand rely on a different principle for storing charge. Charge is stored
in the form of a Helmholtz double-layer. This is formed at the interface between the surface
of an electrode and the surface of an electrolytic solution. The distance of separation of
charge in a double-layer is of the order of a few angstroms (0.3-0.8 nm) and it is static in
origin. Super-capacitors are also known as electric double layer capacitors (EDLC) (Conway,
1999). They do not have a conventional solid dielectric film. Figure 10 shows structure of
electric double-layer capacitor. (Hanmin Lee*, n.d.)
Figure 10 Figure 10 Structure of electric double-layer capacitor (Hanmin Lee*, n.d.)
20
Charge dissipation in super-capacitors occurs at the interface, rather than occurring in the
electrode material itself. That’s why they have fast pulse response times; also, they have
longer life cycle than electro-chemical cells, by orders of several magnitude. Super
capacitors, in terms of life time, depth of discharge, operating temperature range, and power
specific ratios, are better than batteries. However, they don’t have good specific energy
compared with batteries (Kadhim, 2009).
South Korea Railway is a good example in this case, who attempts to build ELDC to
regenerate energy from braking. It is reported by Korea Railroad Research Institute that, 90%
of Railway energy is used for traction while 10% of Railway energy is spent on back-up
supply; besides, 40% of energy consumption is wasted on braking. In other words, it is
possible to save up to 40% of train power for the power supply; in order to accelerate the
train. (Hanmin Lee*, n.d.)
1.3.3 Flywheels for Energy Storage
Flywheels are one of oldest systems for storing energy, and it has been used for hundreds of
years. Generally, flywheels energy storage systems utilize kinetic energy that is stored in the
rotor, which is known as mechanical batteries (Whittingham, 2008). Their specific energy is
around 130 (W/kg) while their specific power is about 500 (W/kg).
Flywheel has typical capacities starting from 1 kWh (Whittingham, 2008) onwards, with the
capability of providing megawatts of power for a few seconds. Unlike batteries, they are not
suitable to store energy for a longer period of time. Finally, they are approximately 80%
efficient. (Whittingham, 2008). Figure 11 displays one type of flywheel energy storage.
Figure 11 Flywheel (Schoenung, 2002)

21
1.4 Energy Storage in Different Railway Applications
The applications for using energy storage in railway can be classified into two major types:
1. Stationary storage applications or trackside energy storage applications,
2. On-board energy storage system or mobile storage application
The following sections provide greater detail on each of these types.
1.4.1 Stationary Energy Storage Application
Stationary energy storage systems are a popular choice for industrial transmissions and
distribution power networks in most countries, chiefly in the United States of America.
(Kadhim, 2009) Stationary storage (or track side application) is made by installing one or
more energy storage systems alongside the tracks. It helps recover the braking energy from
the line during periods of low demand. However, this type of system is configured for use
only on DC electrified railways as AC electrified railway systems are inherently receptive.
Because AC electrified system normally have lower levels of transmission loss, which is one
of the main reasons to use stationary energy storage on a DC railway. ((STIB), 2011) . Figure
12 illustrates DC voltage network with stationary energy storage.
Track side application has the following of advantages.
1. It is available for all vehicles running on the same line.
2. It reduces of the peak power demand by averaging loads over a period of time.
3. Storage devices could be useful to increase the number of vehicles without the
improvement of the electrical supply systems.
4. It is environment friendly ((STIB), 2011); as it helps to reduce and remove heat
caused due to mechanical braking from a closed environment like a tunnel. This
especially helps in reducing air-conditioning costs in the tunnel for underground
metro networks.
5. Lastly, it is available in different sizes and configurations to meet the demand of each
railway.
On the other hand, track side application has some assignable disadvantages as well.

22
1. Its capability depends on the distance from the train. It cannot account for the losses
due to transmission from the location of the train.
2. It cannot recover all the braking energy and some energy could still be lost in the
barking resistors.
3. It is impossible to have catenary-free for trains.
4. Lastly, its position, alongside the track, may create a problem in some situations.
((STIB), 2011)
Figure 12 DC voltage network with stationary energy storage (R Barrero1∗, 2009)
1.4.2 Onboard Energy Storage Application
Onboard or mobile energy storage application is generally placed on the roof of the vehicle
((STIB), 2011). As a result, the operation of each onboard system is independent, that
recovers braking energy and sends the energy directly to the storage energy system which is
also located on the train. Therefore, the energy will be available for using anytime when the
train requires it; for example, when the train needs to accelerate out of a station from a
standing stop, when the train requires power supply for complex situations such as when
there is a break in the third rail or overhead line or when the train face some sections of
neutral electrification such as in tunnels or on bridges. ((STIB), 2011) Figure 13 presents
onboard energy application.

23
Figure 13 On-board energy storage application (Steiner, 2005)
There are three possible situations where a locomotive can face a discontinuity in power
supply. In each of these cases different energy storage design should be considered, it can be
designed as following:
I. For the case of gaps having short length (10 to 20 metres), it is unnecessary to have
energy storage.
II. For the cases of small breakings which electrification has 100s of metres, small
energy storage such super capacitors and flywheel can be used. This usually happens
at crossovers, junctions, level crossings, brides, and so on. In this case, super
capacitors are the preferred choice. (Kadhim, 2009)
III. For the case of long discontinuous electrification that energy storage powers a train
for a long distance, such as few kilometres, battery is greater. Kadhim defines this
system as discrete electrification. (Kadhim, 2009)
Three different discontinuous power supplies are shown in Figure 14.

24
Figure 14 Figure 14 discontinuous power supplies (Kadhim, 2009)
1.5 Power Converters
Power converters, in their broadest sense, have the function to transform electrical power
from one type to another. According to traditional literature, they can be classified as four
types: AC/DC, AC/AC, DC/AC, and DC/DC converters.
Two different types of AC/AC and DC/DC converters are available, which are step-down and
step-up. In the step-up converter output voltage is higher than input voltage; in step down
converter output voltage is lower than input voltage.
Another type of type of DC-to-DC is buck–boost converter, which has an output voltage
magnitude that is either bigger or lower than the input voltage magnitude.
In order of use batteries as energy storage for railways, Bidirectional DC/DC converters are
essential. Bidirectional DC/DC converters have both features of step-down and step-up
converters.

25
Railway voltage supply demands that a large number of battery cells are connected in series.
This leads to the possibility of unbalancing of the cells’ voltages over time. Such unbalancing
occurs when a number of cells are connected in series. Each individual cell in a battery has
fairly different capacity and may be at different State of Charge, therefore causing the entire
batter to have an unbalanced voltage (Arendarik, 2012).
Hence power converters play a vital role in order to use energy storage on a railway. Firstly,
they help to step-up the voltage, hence reducing the number of cells in series. Secondly, they
help manage the discharge and recharge of batteries.
Theoretically, the imbalances of battery cell voltage are typically caused by the differences
among cell residual capacities, internal resistances, degradation, and the ambient temperature
gradient during charging or discharging. (Lee, 2006)
In the absence of a converter the current from the batteries is subject to internal resistance.
But with use of the converter, it is possible to control the flow of current from and to the
battery, so control of charge and discharge cycles is gradable.
Figure 15 Shows diagram of Bidirectional DC/DC converter.
Figure 15 Bidirectional DC/DC converter
1.6 Summary and Discussion
Energy storage technology has great impacts on transportation sector. Besides, the categories
of energy storage are various. The report is emphasized on introducing three common storage
types for railway system: batteries, super-capacitors, and flywheels. A battery is made up by
a large number of electro-chemical cells, which normally consists of anode, cathode, and
electrolyte. Batteries simply convert chemical energy into electrical energy and vice versa.

26
Many battery technologies are currently available: Lead Acid, Nickel Metal Hydride Battery,
Lithium-Ion Battery, NaS, and FB. As a result, it is essential to understand different
applications, purpose, and the details of different batteries. Super-capacitors get charge from
the separation of charge in the Helmholtz, double layer at the interface between the surfaces
of a conductor electrode and an electrolytic solution electrolyte. Compared to batteries, they
have better performances on life-time, deep of discharge, operating temperature range, and
specific power. Flywheels are regarded as one of the oldest systems for storing energy, and
have been used hundreds of year. Their characteristics are similar to those of super-
capacitors, with high power densities and a very large number of charge and discharge cycles.
Additionally, the applications for using energy storage for railways can be classified as two
categories, stationary storage application or trackside energy storage application, and on-
board energy storage application or mobile storage application. General speaking, stationary
energy storage system is a popular choice. On-board or mobile energy storage application is
independent, which recovers braking energy and sends the energy directly to the storage
energy system that is also located on the train.
Finally, converters are discussed in this chapter. It can be classified as four types: AC/DC,
AC/AC, DC/AC, and DCDC converters. It is functional to transform electrical power from
one type to another. Meanwhile, it is useful to mitigate the problem of the imbalance caused
by the series connection of battery cells.

27
1.7 Project Objectives
The most important objective of this project is to develop a method to design a battery
storage system to powering the train over the conductor rail gap as the power supply, in order
to do that model of battery must be designed.
In order to model the battery it is necessary to develop a method which can determine the key
parameters of batteries from the discharge tests. The proposed methodology is a model based
approach, that is, to develop a mathematical model of the battery which can represent the
dynamic performance and battery status and characteristics can be investigated through the
analysis of the model.
The first stage of the project is to produce a mathematical model of battery. The dynamic
model is expected to reflect the relevant behaviours of battery when being discharged
including the characteristics of State of Charge, Discharge Current, Battery Voltage and
Terminal Voltage. The unknown parameters in the model will be identified by using battery
cycler with the laboratory experimental data.
The focus of this work is to develop a suitable method for parameter identification for
common battery systems for DC railway application. The lead-acid battery has been chosen
because it has relatively well defined properties and there is a wealth of literature describing
the performance of these types of batteries. From an experimental view point they are also
readily available of low cost.
Furthermore this project focuses on conductor rail gap which has issue in supply power
system. In order to establish an ideal gapping arrangement, this model is developed in
MATLAB to show the effect of gaps on train performance. It also simulates the potential
solution for this issue. Finally this project focuses on London underground conductor rail
gapping issue and therefore tried to discover the most convenient type of energy storage in
order to keep train performance remain the same during each gap.

28
1.8 Methodology
In order to establish the most suitable solution for this project, there are number of steps that
need to be considered:
1- In order to identify and inspect electrochemical batteries (or other types of energy
storage) and inspect their behaviour, a test must be designed to be able to model the
batteries based on different scenarios and requirements.
2- To understand how DC railway works, DC railway traction system with conductor
rail gap models should be designed. The MATLAB/ SIMULINK computer program
tool can be used to model the traction system based on real data’s provided from the
London underground.
3- An example of design the energy storage system has been designed based on the real
data’s provided from London underground for the DC railway traction system while
the train passes the conductor rail gaps for London underground- Victoria line. In
order to find the most suitable type of Energy storage system for this design.
Figure 16 demonstrate the block diagram of DC railway with use of energy storage
system, which must be design in this project.
Substation1 A Substation2A Substation1 B Substation2BGap
No power
supply
TrainTrainTrain Speed
ref
Speed
ref
Speed
ref
DC-DC
ConverterController
Energy storage
system
(Batteries or
super-capacitors)
moving
moving
moving
Figure 16 Block diagram of DC railway

29
1.9 Outline of the Thesis
The thesis is organised into five chapters and the first chapter presents the background and
motivation of the research project. The remaining chapters are briefly described as follows:
Chapter 2: Throughout this chapter a Lead-Acid (model 689-5854) battery has been tested.
There are numbers of tests carried out about charges and discharges of the battery with
different rate of current to characterise this type of battery.
Chapter 3: Throughout this chapter the MATLAB/ SIMULINK computer program tool is
used for modelling the DC railway traction system with conductor rail gap. Energy storage
system has been designed in simulation to contribute enough power for the train while
passing each gap.
Chapter 4: Design the suitable energy storage for DC railway traction system through the
Conductor Rail Gap for London Underground- Victoria line. Therefore, in this part in order
to keep the train performance remain the same during the gaps, different types of energy
storage such as batteries and super capacitors has been designed to find the suitable solution
for powering up the trains though the gaps.
Chapter 5: This is the final chapter. This chapter contains the conclusions of the project and
possible future work.

30
Chapter 2
Battery Designs for Different Applications
The use of lead-acid batteries is widely seen in many applications. Therefore various designs
are required due to the nature of the working environments and duty cycles. One of the most
commonly used lead – acid batteries in the industry today are known as SLI batteries which
are designed for a burst of energy needed to cold – crank an engine. Once the engine is
started the battery will be recharged immediately. SLI battery is widely used in applications
where high electric current is required over a short period of time which has led to its unique
and effective design of a larger surface area of electrode plated comparing to other types of
lead – acid batteries. Although the repeated deep discharge of the battery may reduce its
lifetime, however; the deep cycle batteries are designed to withstand frequent and deep
discharge cycles as the plates used in these batteries are typically very thick. On the other
hand the smaller surface area of a deep cycle battery results to its lack of ability to provide as
much power as the SLI types.
In addition; marine batteries are also used to backup power supplies and providing power in
emergency circumstances. Standby batteries are amongst the most frequently seen marine
batteries used in applications where long lifetime and large capacity is required and repeated
discharge and high current drain does not occur frequently. On the other hand; traction
batteries are designed for regular deep discharge cycles and higher current drain. This leads
to these types of batteries to be slightly bigger and heavier than the other types of the lead –
acid batteries.
2.1 Mathematical Descriptions of Lead-acid Batteries
Throughout this chapter, the studies and researches that have been carried out on a lead – acid
battery to investigate behaviour of batteries and described in depth using concepts such as:
Capacity, State of Charge (SOC), Depth of Charge (DOD), internal resistance and
quantitative descriptions of these concepts.
2.1.1Capacity
The capacity of a battery represents the amount of the electrical charge available and it is
often described in Ampere-hours (Ah). The capacity of a battery depends on the construction

31
factors of the cells that include the materials contained in the electrodes and the acid solution.
Besides the capacity of a battery is not a fixed quantity but depends on to the discharge rate.
According to the Peukert’s law (LUC FRUCHTER, 1986)
tIC k
p Equation 1
Where pC is the capacity at one-ampere discharge rate, and it is a constant.
I is the discharge current (A)
t is the time of discharge (h)
k is the Peukert constant and for a lead-acid batteries has a value between 1.1 and 1.3 (varies
for each individual battery)
It is common to refer to “Cn” as the capacity of battery in Amp-Hours which corresponds to
complete discharge of the battery in n hours. “n” is a subscript that represents the discharge
rate. In industry, the capacity under ten-hour discharge rate (C10) is usually taken as the
nominal capacity.
2.1.2 State of Charge and Depth of Discharge
State of charge (SOC) and depth of discharge (DOD) are variables which describe the battery
charge. The main difference between the two is that the SOC describes the percentage of
remaining charge relative to the nominal capacity while the DOD represents that relative to
the actual capacity under a specific discharge current rate. These two variables can be
obtained by calculating the charge supplied and the battery capacity:
CQSOC e /1 Equation 2
Ie CQDOC /1 Equation 3
Where eQ is the charge consumed by the load (Ah)
C is the nominal capacity (Ah)
IC is the actual capacity under the discharge current I (Ah)
Figure17 illustrates the Mathematical model of lead-acid battery which has been selected to
demonstrate SOC of a battery under the different discharge current and the time taken to
discharge the battery, which is calculated by equation4.

32
tC
I
C
dI
SOC
mm I
m
I
t
m
1
)(
1 0
Equation 4
mI iis sicharge current rate.
Figure 17 Mathematical model with SOC
2.1.3 Internal Resistance and State of Health
The internal resistance of a lead - acid cell is the equivalent resistance of the cell. The value
of the internal resistance depends on many factors. But it could be calculated using the
equation below:
I
VVr toc Equation 5
Where ocV is the open circuit voltage (V)
tV is the terminal voltage when discharging (V)
I is the discharge current (A)
Although the factors in equation 5 are only a method of calculating the internal resistance and
not the determinants, it is shown in various applications that the internal resistance of a lead-
acid battery will increase when discharging as the SOC and the DOD drop. This because
transport effect, basically when the state of charge is going on battery has modifications of
two electrodes, where the reactance are basically transformer products. These products
0
10
20
30
40
50
60
70
80
90
100
0 1 2 3 4 5 6 7 8 9 10
SOC with 10A discharge current
SOC with 20A discharge current
SOC with 30A discharge current
SOC with 40A discharge current
SOC with 50A discharge current
SOC with 60A discharge current
SOC
%
Time (hours)
mImI
Im
mI

33
accumulated around electrodes, so this increase resistance for new products to go towards the
electrodes. Therefore there is increase in the equivalent resistance of batteries.
When a battery undergoes repeated discharged and charged in a number of duty cycles, it
suffers a capacity loss which indicates the weak and inability to supply the same amount of
charge in aged batteries.
State of health is a variable which indicates weakness level of the battery and further
represents the percentage of remaining capacity comparing to the initial capacity when the
battery is brand new and is calculated using equation 5 shown below: (Okoshi, 2006)
new
weak
C
CSOH Equation 6
Where weakC is the remaining capacity of a weak battery (Ah)
newC is the capacity when the battery is brand new (Ah).
One of the main causes of capacity loss is known as sulphation. It is a process when the
amorphous lead sulphates, which are easily converted, back to lead, lead oxide and sulphuric
acid, converts to a stable crystalline form coating the electrodes. This form of lead sulphate
cannot conduct electricity and cannot be converted back to lead, lead dioxide and lead
sulphate under normal charging conditions. The internal resistance of a lead-acid battery
therefore increases and less charge can be provided when discharging. Complete or repeated
deep discharges of a battery at low current densities that lead excessive utilization of the
active material, are the most critical reason for capacity loss, for example a discharge of a
traction battery that draws more than 80% of its nominal capacity (Berndt, 1993)
2.2 DESIGN STRUCTURE
The design aims to collect data for choosing the appropriate electrochemical batteries pack.
Its objectives are twofold: firstly, it can be used for modelling all kinds of batteries; secondly,
it can be used for identifying the characteristics of different batteries before being used in DC
railways.
This test also must ensure that the batteries are always 100% fully charged before discharge.
This could be achieved by programming the battery cycler and identifying the maximum
energy which the battery can be discharge with different discharge currents in different
periods of time.

34
In order to arrange a test to characterise a lead – acid battery in various forms a 12V Lead-
Acid battery modal 689-5854 was selected and the battery cycler model ABC-170 has been
used to run the test. Before any procedure is carried out a safety box has been designed to
protect the battery cycler, prevent any possible damage and / or harm to the equipments and
comply with the safety precautions as shown in figure 18. The designed box consists of 3
current fuses of 60A, 30A and 10A arranged from left to right respectively as shown in the
figure below. This enables various currents to be tested.
Figure 18 Safety box
Figure 19 illustrates the arrangement between the safety box connecting the battery to the
battery cycler. In addition; the cables and connectors used in this experiment are able to
withstand high current to reduce any risk of fire. Appendix 1 demonstrates more about the
experiment plan and risk assessment for Operating the battery cycler with the aim of charging
and discharging.

35
Figure 19 Structure of connection between battery and battery cycler
2.2.1 System Block Diagram
Figure 20 illustrates the system block diagram of ABC-170 structural design.
The AC Inverter connects to the utility by means of an internally installed isolation
transformer. The DC Converter and AC Inverter shift power via an Intermediate DC Bus and
use a RS-485 data bus to communicate. In addition; the DC Converter communicates to the
ABC-170 Remote Operation (ROS) System via an RS-232 data link, or CAN data link based
on system arrangement. The DC Converter also provides the DC interface to a load (or
possibly two separate loads) in one of two configurations. As it shows in the block diagram
of ABC-170 has two channels, A and B. Therefore in this test just channel B has been used.
Figure 20 Block diagram ABC-170 structural design

36
2.2.1.1ABC-170 Remote Operation System (ROS)
The ABC-170 ROS is used as a personal computer based system in order to control the ABC-
170. The system consists of the computer and any peripherals, and the ABC-170 ROS
application.
The ROS software interface provides graphical test control and data display, test scripting
and script management functions, and output file control for test data and logs. Using a
graphical user interface for controlling and monitoring along with the command language
interpreter which allows a simple implementation of complex test programs makes
communication with ABC-170 system easy and provides option of integrating external data
acquisition devices into the system. Figure 21 indicates remote operation systems graphical
test control software.
The channel information consists of three parts: (Vironment, 1998)
1-Status area
2-Control area
3-Display area
STATUS: This area consist of the current state of both channels A and B as well as the
operating limits, the present voltage, current and power values.
CONTROL: The left control area contains information about the mode of both channels,
remote or local control. The right control area shows one of three views at any time.
1. Test Plan: In this view, the user selects Manual or Automatic Control. An output file
can be created to collect data as testing is accomplished. For Automatic Control, the
test script and associated data acquisition interfaces, if required, are also selected
here.
2. Manual Control: The user may select control modes and control values or change
operating limits manually, similar to the local control capabilities on the front panel.
3. Automatic Control: The user may start, stop, and pause the test, and also view the
elapsed test time, present command time, and cycle status, if any.
DISPLAY: This area may be configured by the user to have one or more display windows.
The log file is always displayed. Each window is either a display of alpha-numeric data or a
graph. The script file can also be displayed.
Any data variable in the main program loop, including those received from data acquisition
systems, may be displayed or graphed and multiple displays or graphs may be opened at

37
once, allowing complete user control over how to monitor the test. The control area may be
hidden to provide a larger display area.
Figure 21 Remote Operation System Graphical Test Control
2.2.1.2Planning a Test
Certain parameters have to be determined in order to carry out the test with the battery cycler.
The following checklist may be used as a guideline for preparation:
What load configuration is required?
Independent: It means each channel has its own test plan and they are independent
from each other, therefore two loads may be controlled independently by converter A
and converter B. Each load is attached from the positive terminal of a converter to the
negative terminal of the same converter.
Parallel: It means channels A and B are connected in parallel and they are using same
test plan for the operation, therefore one load is attached to the positive and negative
terminals of converter A
Differential (available in ABC-170 models): One of the possible load configurations
available on ABC-170models (see also independent and parallel). The load is attached
from the terminal of converter A to the terminal of converter B.
What should the operating limits be?
38
Upper voltage limit: Vdc. This is maximum voltage which can be use to charge the
battery. Therefore maximum voltage should not be chosen more than 100% charged
battery voltage.
Upper current limit: Adc. Amount of maximum current which will be use to charge or
discharge.
Upper power limit: Watts. This is depends of maximum current and voltage which are
chosen for the battery cycler.
Lower voltage limit: Vdc. The voltage of 0% SOC of battery should be chosen for
lower voltage limit.
Lower current limit: Adc. This is should be chosen very small to make sure battery is
fully charge. For discharge the battery this is not apply, because battery will discharge
with constant current.
Lower power limit: Watts. Lower power limit: Watts. This is depends of minimum
current and voltage which are chosen for the battery cycler.
Will this test be controlled locally or remotely?
Locally. It means do not use the software and put the value of voltage and current on
battery cycler without using computer.
Remotely. Using ROS software to control the battery cycler.
If remote operation, what test script will be used?
What control mode is required?
Voltage mode. Control the charging and discharging operation by variable voltage,
basically voltage will control operation.
Current mode. Control the charging and discharging operation by variable currant,
basically current will control operation.
Power mode. Control the charging and discharging operation by variable power,
basically power will control operation.
Combination of above modes. This is possible to use combination of above mode by
using the script in this software.
Automatic and manual are the two control modes made available within the software that
enables the user to specify whether the test will be run automatically (using a test script) or
manually (with the preferred input commands). As for this experiment automatic mode has
been chosen for the charging operation and the manual mode is selected for the discharging
operation.

39
2.2.2 Charging Operation
As mentioned earlier for charging the battery the automatic mode was selected. In this
method a test script has been written to control the battery cycler. In addition; the flexibility
of the test script language and the versatility of the language programming almost similar to
“C” enable refined test scripts to be created and control the battery cycler in every practical
way. (Vironment, 1998).
Figure 22 illustrates the use of the automatic mode of the software; there is script which has
been written in this project. When program running the written script, on left side can be seen
in real time the actual value of voltage and current of battery and the limit has been set by the
script not by manual command. To find out more about test script all the code are available in
appendix 2.
Figure 22 Automatic mode of ROS software
The Figure 23 shows the results obtained at the end of the charging process. Firstly; the
battery is charged with the current of 25A with the battery cycler set on the current mode
meaning the current controls the charging operation, after the maximum voltage of 14.4V is
achieved the battery cycler switches to the voltage mode which means the voltage controls
the operation of the charging, therefore; the voltage stays constant and the current reduces
until it reaches almost 1A. This continues until the current becomes constant which indicates
that the battery is fully charged. In this charging test battery was in initial 0% SOC, when
battery reach 100% SOC the total 79Ah was charged.
Script

40
There are reasons why the recharge voltage of battery is limited .The first reason is because
of electrolysis of water. When the voltage a across the cells is bigger than 1.44 then voltage is
strong enough to electrolysis of water, so the water inside the electrolyte start to separating
the oxygen and hydrogen. That is the reason if keeping increasing voltage this reaction
become more important and in some point is possible to get explosions. Another reason why
it needs to have two different mode of charging is because if charging the battery with same
current after period of time battery will reach the maximum voltage, but this is not meaning
that battery is fully charged, therefore if stop charging the battery after period of time it can
be seen the voltage of battery is decreasing, therefore is clearly shows that battery is not fully
charged. To ensure that the battery is fully charge, when battery reached the maximum
voltage by constant current than it need to change current mode to voltage mode. Therefore
battery will charge with lower current, this process need to be continue till voltage and
current both are established.
Figure 23 Charging operation
2.2.3 Discharging Operation
Manual mode has been used to discharge the battery which enables manually controlling
commands and operating limits without the use of the test script. Figure 24 indicates manual
mode of this software.
0
5
10
15
20
25
30
1 3601 7201 10801 14401 18001
Cu
rre
nt(
A)
&V
olt
age
(V)
Time in seconds
Charging
Charging Current battery voltage

41
Figure 24 Manual mode of ROS software
In the following the step by step procedure of the operation of the manual mode is show:
Start button Click the start button to begin the procedure which would enable manual
controls. If the "Start" button is not available, i.e., it is greyed out, ensure that the test plan is
complete and the channel is in Remote operation. If the start is successfully clicked the status
box will turn green, on the other hand; if the status box is gray, it is an indication that no test
is in progress.
Limit Controls On the left part of the Manual Control View the Limit Controls are
presented. The appropriate upper and lower limits for current, power and voltage must be
filled in. the send button is clicked at this stage. Prior to any other action the operating limits
must be checked which would also protect the load during the test.
Command The Command Controls are in the middle of the Manual Control View.
Controls These operate similarly to the buttons on the front panel of the AV PPS, allowing
selection of the control mode and command value by the user.
Standby mode which is indicated as darkened standby button indicates that the test is started.
At this stage another mode, Voltage, Current or Power must be selected by clicking on the
button for that mode. The system will not change modes until the user enters a control value
and presses "Enter" or clicks the "Send" button. Using the manual test enables the user to

42
return to Test Plan View in order to recall the test name or check the data interfaces selected
whilst the test is in progress, however; no alterations must be made to the Test Plan nor a new
test could be started until the test has been stopped.
Stop Clicking the “Stop” button in Manual Control View would start the test. The “Stop All”
button can also be used when both channels need to be paused. (Vironment, 1998).
2.2.3.1 Discharging Operation Results and Discussion
Using the manual mode of the ROS software to discharge the battery assists to identify the
maximum Ampere hours (Ah is unit of electric charge) which could be discharged by
different ranges of current. Figure 25 demonstrates the six tests that have been taken, based
on the discharge currents starting from 10A to 60A. It is clearly noticeable from the graphs
that when the discharge process is carried out with a lower current more capacity of the
battery is discharged over a longer period of time. In addition; discharging the battery with a
higher current results in the maximum capacity that could be extracted to be reduced and as a
result the timer taken to discharge the battery is also reduced. It is important to mention that
the same current could not be used in order to fully discharge the battery and keep the voltage
above the minimum level. Therefore; when the minimum voltage state is reached when
discharging the battery, the discharge current has to be reduced in order to be able to extract
more capacity of the battery, is the same state is occurred in the same process the discharge
current is to be set at a lower value.
The test above has been proven to be very useful and effective in DC railway applications. It
assists the experts to be able to select the most suitable batteries yet effective types
considering its usage / application criteria and appropriate number of the battery cells
depending on its application. Furthermore; the selection of the suitable battery with enough
capacity could reduce the number of the battery cells that has to be placed in an electrical
circuit in parallel connection to be able to provide enough power for the train. Compact size,
less volume and weight of the battery used as energy storage for the railway are amongst the
3 most effective factors when designing and/or introducing energy storage solutions.

43
Figure 25 Discharging Operation
Table 2 shows the Ampere hours (Ah) discharged with different currents, besides; the time
taken for the tests carried out using different currents is shown in the table. In other words,
battery capacity decreases as the discharge rate increases.
Table 2 Capacity of battery for different discharge current
Discharge Current Discharge time in hours Maximum Ah
Discharge with 10 A 8.52 85.2
Discharge with 20 A 3.94 78.8
Discharge with 30 A 2.31 69.3
Discharge with 40 A 1.67 66.8
Discharge with 50 A 1.29 64.5
Discharge with 60 A 1.03 61.8
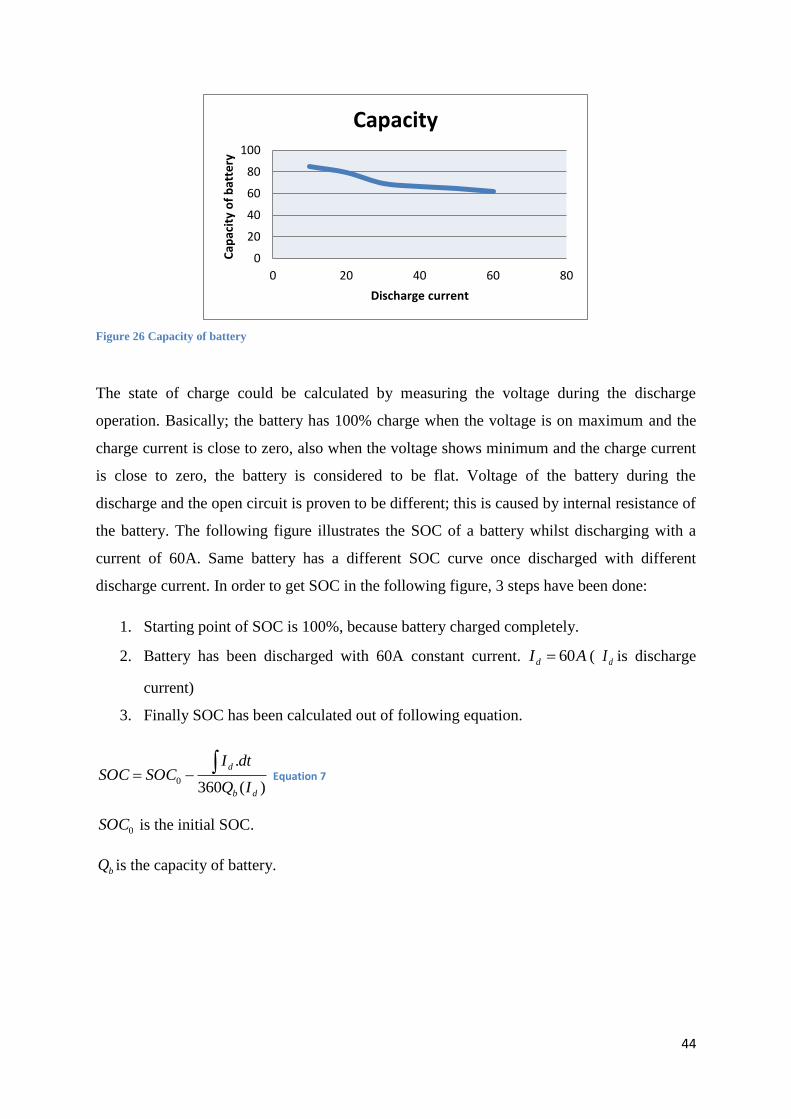
As mentioned before different discharge current values are used for the test ranging from 10
A to 60 A as also shown in table 2. The capacity of the battery during the laboratory tests is
presented in the following figure as function of the output current.
0
2
4
6
8
10
12
14
1 3601 7201 10801 14401 18001 21601 25201 28801
Vo
ltag
e(V
)
Time in seconds
Dischrge battery with 10 A
Dischrge battery with 20 A
Dischrge battery with 30 A
Dischrge battery with 40 A
Dischrge battery with 50 A
Discharge battery with 60 A
44
Figure 26 Capacity of battery
The state of charge could be calculated by measuring the voltage during the discharge
operation. Basically; the battery has 100% charge when the voltage is on maximum and the
charge current is close to zero, also when the voltage shows minimum and the charge current
is close to zero, the battery is considered to be flat. Voltage of the battery during the
discharge and the open circuit is proven to be different; this is caused by internal resistance of
the battery. The following figure illustrates the SOC of a battery whilst discharging with a
current of 60A. Same battery has a different SOC curve once discharged with different
discharge current. In order to get SOC in the following figure, 3 steps have been done:
1. Starting point of SOC is 100%, because battery charged completely.
2. Battery has been discharged with 60A constant current. AId 60 ( dI is discharge
current)
3. Finally SOC has been calculated out of following equation.
)(360
.
0
db
d
IQ
dtISOCSOC
Equation 7
0SOC is the initial SOC.
bQ is the capacity of battery.
0
20
40
60
80
100
0 20 40 60 80
Cap
acit
y o
f b
atte
ry
Discharge current
Capacity

45
Figure 27 SOC of battery during 60 A discharge current
In other to simplify the result obtaining process, the lead acid battery has been modelled in
MATLAB environment based on the data collected from the battery cycler as shown in figure
28, based on which; the value for the voltage is obtained by simply clicking on an area of the
designed battery which hold a particular SOC and discharge current value. Therefore; by
simply clicking elsewhere on the battery these values would change. To find out more about
MATLAB code for this model look at appendix 3.
Figure 28 Battery model of lead acid battery in MATLAB
01234567891011121314
0102030405060708090100
Vo
ltag
e(V
)
SOC percentage(%)
Voltage whenDischarging theBattery with 60A

46
Voltage values of a battery are known to be different at the terminal and at the source
(represents an ideal battery). This is caused by the “internal resistance” as shown in the
following figure.
Figure 29 illustrates the simplified model of an electrochemical battery.
+
-
R
EmVb
Figure 29 Simple model of battery
The following equation is used to calculate the voltage source of battery:
)( mbm IRVE Equation 8
Where;
mE is ideal battery or voltage source of battery
R is internal resistance of battery
bV is the terminal voltage of battery
It is important to mention that this formula just can calculate the approxmely voltage source
of battery. In order to calculated exact value of voltage source, battery must be open each
time to measure the voltage source, which is not possible.
In order to calculate internal resistance of a battery, the voltage of the battery in both the open
circuit and whilst discharging need to be measured. The difference between these two
voltages divided by the discharge current will reveal the internal resistance value as shown in
equation 7.
mI
VR
Equation 9
It is important mention that when measuring the no load voltage, it should not just put the
current to zero and measure the voltage, therefore we wait have to wait until the chemical
reaction of battery get steady again, then measure the no load voltage.

47
Furthermore; the battery has been modelled using excel software in order to obtain the
voltage source of the battery as shown in figure 30.
Figure 30 Voltage source of battery
2.3 Summary and Discussion
Concisely; a new modelled was designed in this part of the project in order to identify and
inspect the behaviour of the electrochemical batteries when put to test based on different
scenarios and requirements. In order to collect correct set of data and choosing the
appropriate battery pack cell, the design ensures that the batteries are always 100% fully
charged before starting the discharge process. It also identifies the maximum energy which
the battery could be discharged using different discharge currents over different period of
time.
Once the model is tested, it is made easy to identify the maximum energy that could be
discharged using different ranges of current once discharging the battery using this method.
This could be very useful once used in industrial scale in DC railways as it assists the
nomination of the correct batteries and the number of battery cells.

48
Chapter 3
3.1 Design and Model DC Railway Traction System with Conductor Rail
Gap
The MATLAB/ SIMULINK computer program tool is used for modelling the traction
system. The integrated model of a DC traction system is shown on figure 31 which consists
of two substations, track section and train driven module. It is assumed that the train starts
from substation 1 to substation 2 and total length of the track section was also considered to
be 5km. This project mainly focuses on the conductor rail gap issues. Therefore; MATLAB/
SIMULINK was used in order to simulate the problem. Throughout the next chapter of the
project the solution is designed and introduced.
Figure 31 Model of a typical DC traction system

49
D1
DIODE
D2
DIODE
D3
DIODE
D4
DIODE
D5
DIODE
D6
DIODE
D7
DIODE
D8
DIODE
D9
DIODE
D10
DIODE
D11
DIODE
D12
DIODE
C
Va
Vb
Vc
0
3.1.1 Design DC Substations
Prior to designing a DC railway the DC substation must be configured and designed. The
substations are fed by AC voltage. Using the transformers in the substation the voltage is
reduced as required by the railway, in addition the AC in converted to DC by using the
rectifiers. There are 3 different rectifiers are available 24, 12 and 6 pulse rectifiers. In order to
use then for DC railway, 24-pulse rectifier is very expensive for that reason they would not
use them for DC railway and 6-pulse rectifier is not good enough to make good ripple.
Consequently a 12-pulse rectifier has been used to do this job.
3.1.1.1AC-DC 12 Pulse Transformer Rectifier Modelling
The 12-pulse rectifier is connected to a variable frequency AC bus which provides the DC
power required to all DC loads. This convertor is known for its high reliability and low input
current harmonics. As shown in figure 32 which illustrates the structure of the 12-pulse
rectifier, the convertor consists of 2 full bridges rectifiers such that each bridge contains 6
diodes. 12-Pulse Rectifier connected to Y: Y: ∆ transformer to cause a phase shift on the
secondary side which reduces the input harmonic currents and improves the power factor
(PF).
The average output voltage from the 12-Pulse Rectifier across the dc capacitor can be
calculated by using the following equation (Rashid, 2004):
Figure 32 12-Pulse Rectifier

50
√
√
Equation 8
Theoretically, since the requirement for the generator in substation is to supply
line to line voltage at frequency. Therefore; the DC output voltage from the 12-Pulse
Rectifier across the DC capacitor could be determined as shown below:
√
√
( ) ( )
3.1.1.2 Overall design of substation in MATLAB/SIMULINK
Using MATLAB/SIMULINK computer program a substation was built as shown in figure
33. The three phase AC source is required in order to generate the AC power in to the
substation. In addition; ∆:∆: Y transformer is needed to produce a phase shift of on the
secondary windings in order to reduce the input harmonic current and also to improve the
power factor. Furthermore; AC-DC 12 pulse uncontrolled full bridge rectifier consisting of
two full bridge rectifiers is connected in parallel through inter-phase transformer to produce
12 pulses as DC output voltage.
Figure 33 MATLAB/SIMULINK model of one substation
As London underground has 3rd
rail and 4th
rail, therefore inter phase transformer has been
design in the model to split the voltage as it shows in figure 34.

51
3rd rail
4th rail
485V
241V
Figure 34 Inter phase transformer
Table 3 and 4 shows all of parameters that were used in the substation model. The default
vale was selected because other value was tested and it would make lots of changes.
Table 3 Parameters of three phase source
Parameters Data Source of Data
Phase-to-phase rms voltage (kV) 11 London Underground data
Frequency (Hz) 50 Standard value
3-phase short-circuit level at base
voltage(MVA)
100 MATLAB default value
Base voltage (kVrms ph-ph) 11 MATLAB default value
X/R ratio 7 MATLAB default value
Table 4 Parameters of three phase transformer (three windings)
Parameters Data Source of Data
Nominal power [ MPn(VA) ] 2.5 London Underground data
Frequency (Hz) 50 Standard value
Winding 1 parameters [ V1 kPh-Ph(Vrms) ,
R1(pu) , L1(pu) ]
[11 , 0.002 ,
0.08 ]
London Underground data
Winding 2 parameters [ V2 Ph-Ph(Vrms) ,
R2(pu) , L2(pu) ]
[ 560 , 0.002 ,
0.08 ]
Calculated value
Winding 3 parameters [ V3 Ph-Ph(Vrms) ,
R3(pu) , L3(pu) ]
[560 , 0.002 ,
0.08 ]
Calculated value
Magnetization resistance Rm (pu) 500 MATLAB default value
Magnetization inductance Lm (pu) 500 MATLAB default value
The following figure shows the results once simulating the designed model of a substation
rectifier connected to a pure DC resistive load of 1500 kW. By inspecting the results it is

52
clear that the voltage between the 3rd
rail and the earth is around 485V, on the other hand; the
DC output voltage between the 3rd
rail and the earth is around 241 V, by adding the two
voltage values a combined voltage value of 736V is obtained which is clearly less than the
typical DC output voltage from the substation (750 V DC) due to the voltage drop across
rectifier as the transformer. It is clear that the current drawn by the load is around 1.94 kA,
which matches the theoretical value (1500/750 =2.00 kA).
Figure 35 Simulation results of the modelled one substation rectifier
3.1.2 Design DC Railway with Two Substation and Moving Train
Figure 36 shows the integrated MATLAB/SIMULINK model of two substation rectifiers
connected to each other through the track model. The train has been also modelled as resistor
of 1500 kW. The train is moving from substation 1 into substation 2 and the distance between
the two substations is assumed to be 5 km. Block diagram of controller 1 and controller 2 will
describe latter in figure 38.
4.9 4.91 4.92 4.93 4.94 4.95 4.96 4.97 4.98 4.99 5470
475
480
485
490
Time(sec)
V1(V
)
4.9 4.91 4.92 4.93 4.94 4.95 4.96 4.97 4.98 4.99 5-250
-248
-246
-244
-242
Time(sec)
V1(V
)
4.9 4.91 4.92 4.93 4.94 4.95 4.96 4.97 4.98 4.99 51800
1850
1900
1950
Time(sec)
Cu
rre
nt(
A)
4.9 4.91 4.92 4.93 4.94 4.95 4.96 4.97 4.98 4.99 5700
710
720
730
Time(sec)
Vo
lta
ge
(V)
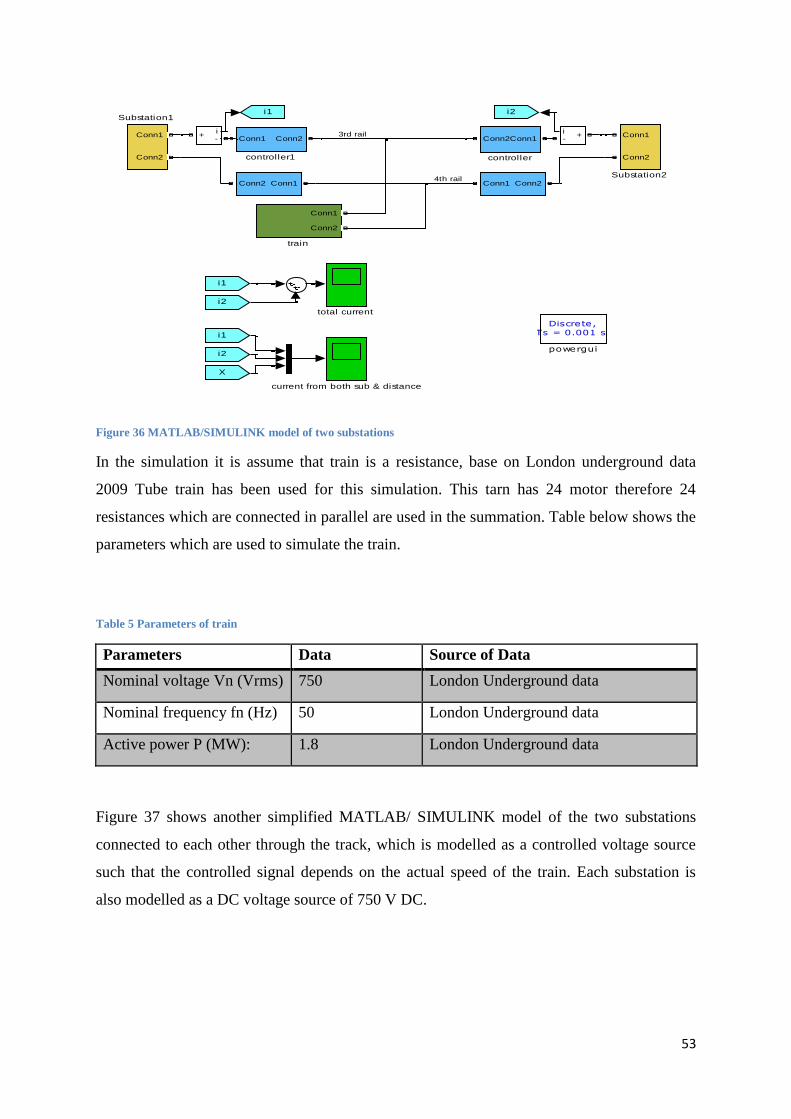
53
Figure 36 MATLAB/SIMULINK model of two substations
In the simulation it is assume that train is a resistance, base on London underground data
2009 Tube train has been used for this simulation. This tarn has 24 motor therefore 24
resistances which are connected in parallel are used in the summation. Table below shows the
parameters which are used to simulate the train.
Table 5 Parameters of train
Parameters Data Source of Data
Nominal voltage Vn (Vrms) 750 London Underground data
Nominal frequency fn (Hz) 50 London Underground data
Active power P (MW): 1.8 London Underground data
Figure 37 shows another simplified MATLAB/ SIMULINK model of the two substations
connected to each other through the track, which is modelled as a controlled voltage source
such that the controlled signal depends on the actual speed of the train. Each substation is
also modelled as a DC voltage source of 750 V DC.
Conn1
Conn2
train
total current
Discrete,Ts = 0.001 s.
powergui
Conn2Conn1
controller1
Conn2Conn1
controller
Conn2Conn1Conn2 Conn1
Conn1
Conn2
Substation2
Conn1
Conn2
Substation1i2i1
X
i2
i1
i2
i1
i+
-i
+-
current from both sub & distance
3rd rail
4th rail

54
Figure 37 Simple MATLAB/ SIMULINK model of the system
Figures 38 shows the suggested controlled signals of the track controlled voltage
sources.These controlled signals are modelled based on the following two equations:
∫ ( ) Equation 9
∫ ( ) Equation 10
Where;
: Voltage drop across the track between substation 1 and the train
: Voltage drop across the track between substation 2 and the train
: Total track resistance
: Total track length
: The DC current generated by substation 1
: The DC current generated by substation 2
( ) : The distance between the train and substation 1
Controlled Voltage Source 2
DC Voltage Source2DC Voltage Source1
s
-
+
Controlled Voltage Source 1
s
-
+
Controlled_signal2Controlled_signal1
Load

55
Figure 38 The mathematical model of track, voltage drops and their controlled signals
Figure bellow shows the signal builder, which is control the speed of train during the
simulation.
Figure 39 Signal builder
Subtract
Signal 1
Group 1
Signal Builder2
Signal 1
Group 1
Signal Builder1
Product1
Product
1
s
Integrator1
1
s
Integrator
Controlled_signal2
Controlled_signal1
v
X
Rtot/Ltot1
Gain1
Rtot/Ltot1
Gain
i1
i2
Rtot
Constant
X
X

56
The Figure 40 shows the simulation results of the previous simplified MATLAB/
SIMULINK model. The graph shows both DC currents, which are generated by the two
substations. Yellow line shows the current taken by train from first substation; purple line
illustrates the current taken by train from second substation and the distance between the train
and the substation 1 is shown by the blue line. The total length of the track was assumed to be
5 km. In this particular case, the range of x (as used in equations 9 and 10) should be between
0 and 5 km. When the train arrives at the midpoint between the two substations at the
intersection point where 2.5 km, the two DC currents are equal to each other as shown in the
simulation results.
3.1.3 Design DC Railway with Conductor Rail Gap
In this part of project conductor rail gaps has been designed to show the effect on the train
when passing through the gaps. A section of London underground Victoria line has been used
as reference for this analysis. Therefore figure 41 shows the integrated
MATLAB/SIMULINK model of the part DC railway model taking into consideration the gap
0 0.
5 1 1.5 2 2.5
x 10 5 0
500
1000
1500
2000
2500
3000
3500
4000
4500
5000
Time (sec)
Current taken by train from first substation Current taken by train from second substation
Current (A) &
Distance(m)
Distance between the train and the substation1
1substation 1
Figure 40 Simulation results model of two substations

57
mentioned earlier. As shown in the model, the ideal switches have been used to disconnect
the DC power delivered to the train when it passes through the gap, which is known to be 15
m according to London underground data. Note that these ideal switches are just used for
modelling purposes. However, in reality once the train passes through the gap, there is no DC
power delivered to the train motors. To find out more about MATLAB function which are
used in this SIMULINK see appendix 5.
Figure 41 Dc Railway with Conductor Rail Gap
Based on the simulation results shown in Figure 42, it is clearly noticeable that the supplied
DC currents by the first two substations collapses to zero when the train passes through the
gap at the point where x= 5km from substation 1, then the train motors are fed by the other
two substations as shown below in the simulation results. Moreover, according to the next
simulation results in Figure 43, when the train passes through the gap, the voltage and current
collapses to zero and also the train speed slightly changes.
trian
Conn1
Conn2
train
total current
Discrete,Ts = 0.001 s.
powergui
Conn2Conn1
controller5
Conn2 Conn1
controller4
Conn2 Conn1
controller3
Conn2Conn1
controller2
Conn2Conn1
controller1
Conn2Conn1
controller
v+-
Vab2
Conn2Conn1Conn2 Conn1
Conn1
Conn2
Substation4
Conn1
Conn2
Substation3
Conn1
Conn2
Substation2
Conn1
Conn2
Substation1
Scope1
x G2
fcn
MATLAB Function2
x G1
fcn
MATLAB Function1
x
v
V
fcn
MATLAB Function
g
12
g
12
g
12
g
12
i+
-
I1
V
I
G2
G1
i4i3i2i1
X
i4
i3
i4
i3
X
i2
i1 I
V
G2
G2
G1
G1
vi2
i1
i+
-
i+
-i
+- i
+-
Current supply f rom f irst two substations
Current supply f rom second to substations
train speed (m/s)
current supply to the tain
v oltage supply to the tain

58
Figure 42 DC railway current supply
Figure 43 Train performance over the gap
0 50 100 150 200 250 300 350 400 450 500-2000
0
2000
4000
6000
8000
10000
Time(sec)
Cu
rre
nt
& D
ista
nc
e
Current supply from first two substations
0 50 100 150 200 250 300 350 400 450 500-2000
0
2000
4000
6000
8000
10000
Time(sec)
Cu
rre
nt
& D
ista
nc
e
Current supply from second two substations

59
In the ideal situation the train would not experience the effect from the gap and as a result it
would not lose any performance. Could be overcome the issue and become closer to the ideal
situation by using an energy storage system has been designed in the simulation as shown in
figure 44. The purpose of the design is to create the ability of providing the power to the train
as equal to the power provided by the conductor rail power supply while the train passes
through the gap, consequently; the train motors do not experience power cut. Chapter 4 will
explain in details how energy storage is chosen for conductor rail gap.
Figure 44 DC Railway with energy storage design
The following figure illustrates the results from simulating the DC railway with the energy
storage imposed. It is clear that once the train passes through the gap the voltage and the
current remain the same and consequently; the speed also remains unaffected. Furthermore;
the train does not experience any loss in its performance and functionality.
trian
Conn1
Conn2
train
total current
Discrete,Ts = 0.001 s.
powergui
Conn2Conn1
controller5
Conn2 Conn1
controller4
Conn2 Conn1
controller3
Conn2Conn1
controller2
Conn2Conn1
controller1
Conn2Conn1
controller
Conn1
Conn2
battery
v+-
Vab2
Conn2Conn1Conn2 Conn1
Conn1
Conn2
Substation4
Conn1
Conn2
Substation3
Conn1
Conn2
Substation2
Conn1
Conn2
Substation1
Scope1
x G2
fcn
MATLAB Function2
x G1
fcn
MATLAB Function1
x
v
V
fcn
MATLAB Function
NOT
NOT
AND
AND
NOT
NOT
g
12
Ideal Switch7
g
12
Ideal Switch5
g
12
g
12
g
12
g
12
i+
-
I1
V
I
G2
G1
i4i3i2i1
X
i4
i3
i4
i3
X
i2
G1
i1
G2
G1
G2
I
V
G2
G2
G1
G1
v
i2
i1
i+
-
i+
-i
+- i
+-

60
Figure 45 Simulation results of DC railway with energy storage
3.2 Summary and Discussion
To summarize the findings of this chapter are the simulations with and without the energy
storage system, conductor rail gap introduce small deep to the speed of train and will disturb
the train performance. Therefore energy storage was designed for the train, in order to pass
through the gap without losing performance. Energy storage designed provides the same DC
voltage as output voltage from the substation. Since the train requires high DC voltage and it
could becoming an expensive solution to use the energy storage alone to provide such
voltage, on the other hand; to be able to provide such voltage a large number of energy
storage cells are required which results in a bigger and heavier and requires more space and
by taking into consideration the limited space available on the train for this purpose, a DC-
DC converter is introduced to the design which could increase the voltage provided by the
energy storage cells to the preferable amount required by the train. In the next chapter the two
main factors known to be capacity and life cycle, which must be considered when using the
energy storage, are discussed along with relative issues to design suitable energy storage for
the conductor rail gap issues.
0 50 100 150 200 250 300 350 400 450 5000
5
10
15
20
25
Time(sec)
Sp
ee
d(m
/s)
Train speed
0 50 100 150 200 250 300 350 400 450 5001000
1200
1400
1600
1800
2000
2200
Time(sec)
Cu
rre
nt(
A)
Current supply to the train
0 50 100 150 200 250 300 350 400 450 5000
200
400
600
800
Time(sec)
Vo
lta
ge
(V)
Voltage supply to the train

61
Chapter 4
4.1 Design the Energy Storage for DC Railway Traction System through
the Conductor Rail Gap for London Underground- Victoria line
From an electrical power perspective, the ideal supply arrangement to rolling stock should
have no discontinuities, via rail gaps. Hence, the load would be connected via moving
contacts – the train shoes - to the conductor rails. This system would only need main and
local isolations. This is not practicable because items require maintenance and this requires
physical gapping in many cases.
Therefore, in this part of project in order to keep the train performance remain the same
during the gaps and establish an ideal gapping arrangement, different type of energy storage
such as batteries and super capacitor has been designed to find the suitable solution for power
up the train though the gaps.
There are two possibilities to design energy storage for the train such as on board and
stationary energy storage. But in this project, the design is only related to London
underground – Victoria line. There are some gaps placed at junctions therefore there are no
places for stationary energy storage, consequently the onboard energy storage is the only
option that could be considered for this specific conductor rail gaps solution.
4.1.1 Train Specification
In order to design the energy storage for train, train specification data is required. Traction
data is required in order to design Energy storage of a train in the Victoria line London
underground use 2009 Tube (Stock, 2009).
This train uses Bombardier 3 phase AC motor, 2009 tube stock consists of 8 vehicles which
in terms of traction are arranged in 4 pairs. Each pair is defined as a local traction system.
Only one vehicle in a pair has shoe gear. The figure 46 shows the arrangement of traction
systems and shoe gears.

62
Figure 46 The arrangement of traction systems and shoe gears
There are 24 motors in this train and 75% of vehicles are motored therefore each motored
vehicles has 4 motors. Each motor rated at 75kW with Regenerative and Rheostatic braking
(Stock, 2009). Tare weight of 8-car train without including passengers is 197.3 tonnes. This
train has capability to have 864 passengers, if assume each passenger as average has 75
kilogram, than total weight of passengers is about 64.8 tonnes. In order to design energy
storage for train the mass of passengers also must be considered, therefore in this design mass
of train with passengers is proximately is 262.1 tonnes.
4.1.2 Train Performance
Train performance tool is software which London underground used to simulate the trains
performance for different lines and between all stations. London underground is using this
software to estimate energy consumption, train speed, time taken and all other behaviour of
train for this specific route. And this is the screenshot of software, where is possible to see
specific route. In particular the actual speed and energy consumption has been used for this
project. In addition in this project the route between Brixton and Stockwell has been selected
on the Victoria line. Figure 47 shows the train performance tool software.
A B C D D C B A
Moving direction
Shoe gears
3 x 17 m4 x 17 m
7 x 17 m
M A M M M M A M

63
Figure 47 Train performance tool software
4.2 Design Structure
London underground trains are supplied at 630V DC. In order to use batteries as energy
storage for London underground, battery cells need to be connected in series. A Battery cell
voltage is depends on electrochemistry of the batteries and the ranges of voltage for battery
cells are usually between 1 to 4 V. Furthermore in order to achieve 630V by the series
connection of the cells, many of them are required. In order to reduce the number of cells in
series, DC-DC converter can be used. Bidirectional DC-DC converters are needed because
when the train is powered by the conductor rail the battery cells can be recharged. For design
of energy storage of London underground in this project interleaved bidirectional DC-DC
converter with the ratio of three have been used, therefore instead of 630V just 210V is
required by energy storage to supply, which this can reduce the number of battery cells by a
third. Is not really possible to use the bigger ratio of converter and this is because of the
resistance of inductance. If want to increase the booster ratio, in that side of converter which
is connected to the battery it has a bigger current and smaller voltage. Therefore at some
point most of energy is dissipated across the inductance, because of high current, so it is not
efficient to use bigger ratio. Typical limit of this converter is three. (Jih-Sheng (Jason) Lai,
2007) Bidirectional DC-DC converter can also be designed with multiphase interleaving.
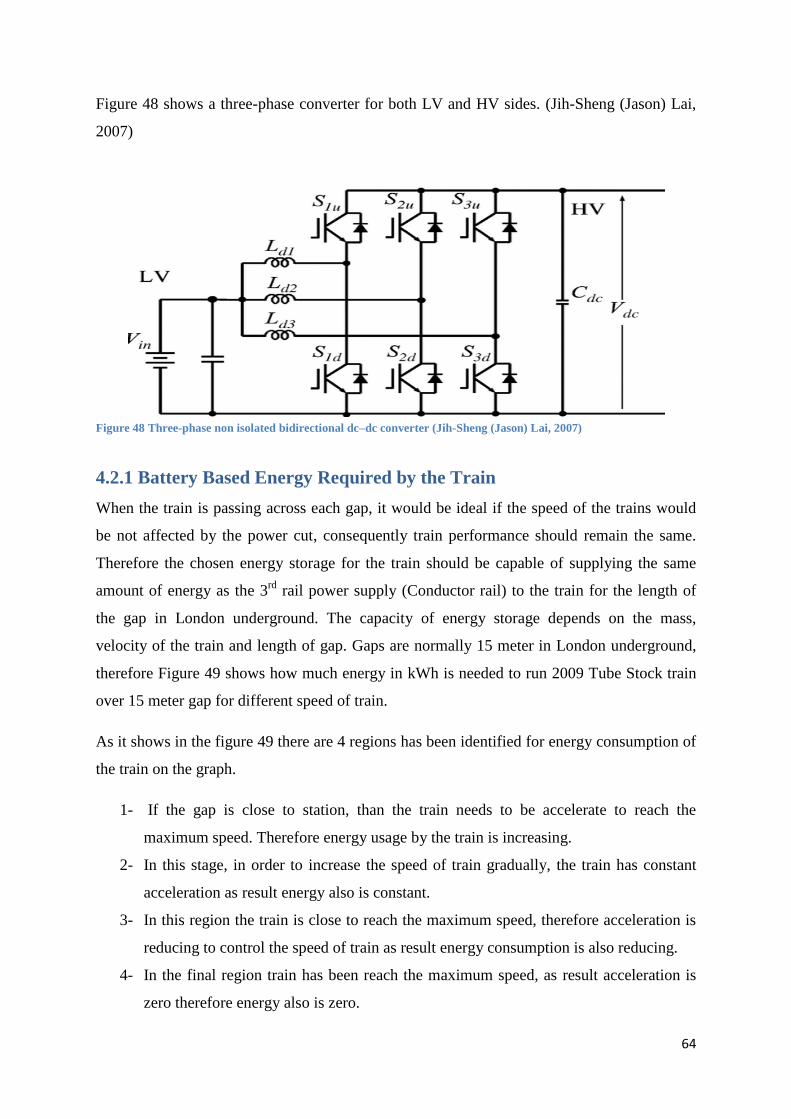
64
Figure 48 shows a three-phase converter for both LV and HV sides. (Jih-Sheng (Jason) Lai,
2007)
Figure 48 Three-phase non isolated bidirectional dc–dc converter (Jih-Sheng (Jason) Lai, 2007)
4.2.1 Battery Based Energy Required by the Train
When the train is passing across each gap, it would be ideal if the speed of the trains would
be not affected by the power cut, consequently train performance should remain the same.
Therefore the chosen energy storage for the train should be capable of supplying the same
amount of energy as the 3rd
rail power supply (Conductor rail) to the train for the length of
the gap in London underground. The capacity of energy storage depends on the mass,
velocity of the train and length of gap. Gaps are normally 15 meter in London underground,
therefore Figure 49 shows how much energy in kWh is needed to run 2009 Tube Stock train
over 15 meter gap for different speed of train.
As it shows in the figure 49 there are 4 regions has been identified for energy consumption of
the train on the graph.
1- If the gap is close to station, than the train needs to be accelerate to reach the
maximum speed. Therefore energy usage by the train is increasing.
2- In this stage, in order to increase the speed of train gradually, the train has constant
acceleration as result energy also is constant.
3- In this region the train is close to reach the maximum speed, therefore acceleration is
reducing to control the speed of train as result energy consumption is also reducing.
4- In the final region train has been reach the maximum speed, as result acceleration is
zero therefore energy also is zero.

65
Figure 49 Energy in KWh is needed to run 2009 Tube Stock train over the 15m gap
In this project the capacity of energy storage for different distance/ train speed has been
calculated. Figure 50 demonstrate the calculation results of how much energy required by
train to pass the gap in kWh and illustrated the calculation results of how much capacity of
energy storage required for different speed in different distance in Ah. In order to choose the
right capacity of energy storage, the maximum energy required by train must be considered,
so in this design energy storage must be capable to provide approximately 1.15 kWh energy.
Capacity of energy storage must be atleast 5.5 Ah.
Figure 50 Energy required by train to pass the gap in KWh and Capacity of energy storage for different distance in
different train speed
0
0.2
0.4
0.6
0.8
1
1.2
0 5 10 15 20
Ene
rgy
(kW
h)
Train Speed (m/s)
Energy for distance 15 m (kWh)
energy fordistance 15m (kWh)
1
2
3
4

66
Capacity of energy storage is not the only thing that needs to be considered and the discharge
current rate is also important therefore the energy storage needs to be capable to discharge
enough high current as required by train. There are 8 cars available in 2009 Tube Stock trains
and 6 of them are motored cars. In total the train has 24 motors; hence there are 4 motors per
car. From the train performance tool software, traction power of the train is already known. In
order to calculate the current required by the train, the traction power needs to be dividing by
630V which is the voltage of the DC supply. Not all the shoes in the train are connected
together, hence different design should be considered for different cars. A car has their own
shoes and there are 2 A cars in this specific train available as it shows in figure 46. Each A
car require to have energy storage enough for 4 motor. In order to calculate the current
required by each A car, firstly the amount of current that can be taken by each motor have to
be calculated, this could be achieved by dividing the total current of train by 24.
Consequently this result simply needs to be multiply by 4 (There are 4 motors per car) in
order to calculate the current required by each A car.
In this train there are 2 D cars and 2 C cars. Each D car is connected parallel to one C car;
therefore they have the same shoe gear to get the power from the conductor rail. For each D
and C cars one set of energy storage is better to be designed, because it could be save some
cost by reducing one converter and extra connection. The method of calculation is similar to
A car but the only difference is that the results of calculation needs to be multiply by 8
instead of 4. The current required by each A car during the journey from route of Brixton to
Stockwell in London underground has been shown below in figure 51, which it demonstrate
the maximum current required (680A) by the train. As the energy storage in this design
operate 210V, than in order for energy storage to proved the same power to run the train,
energy storage in each A car should be capable to discharge current as high as
2040A(680×3).

67
Figure 51Current required by each A cars during the journey of platform Brixton to platform Stockwell
Figure 52 also shows current required by each D and C cars during the same journey, as it
illustrated this time maximum current required by train is 1360A. Therefore energy storage in
D and C cars should be capable to discharge current as high as 4080A.
As results 4 group of energy storage required by this train, two for A cars and two C and D
cars.
Figure 52 Current required by each D and C cars during the journey of platform Brixton to platform Stockwell
4.2.2 Energy Storage Design and Discussion
In this part of project different batteries and super capacitors has been considered, in order to
design the best possibility of energy storage for the train to pass the gaps in London
underground -Victoria line, without loosening any the performance.
0
100
200
300
400
500
600
700
800
1
58
11
5
17
2
22
9
28
6
34
3
40
0
45
7
51
4
57
1
62
8
68
5
74
2
79
9
85
6
Cu
rre
nt(
A)
Time(s)
A car
A car
0
200
400
600
800
1000
1200
1400
1600
1
62
12
3
18
4
24
5
30
6
36
7
42
8
48
9
55
0
61
1
67
2
73
3
79
4
85
5
Cu
rre
nt(
A)
Time(s)
D&C car
D&C car

68
4.2.2.1 Batteries design for London underground gaps
Different type of batteries has been considered. There are two different designs of batteries
required for this specific train. Since there are two different types of cars (A and C&D), the
capacity and discharge current required by those cars are different. In order to pass the gaps
by designing the battery pack for the 2009 Tube Stock, there are some requirements that have
to be taken into account. The first thing that needs to be considered is the output voltage of
the batteries; this is important why the number of batteries that need to be in series must be
calculated. In this design total voltage should be reach to 210V, as mention earlier interleaved
bidirectional DC-DC converter with the ratio of three is used to convert the voltage of
batteries to 630V.
Another important parameter in this design is to find out the maximum discharge current by
the batteries. By connecting the batteries in parallel, the total discharge current required by
the train can be achieved.
Capacity of batteries also need to be considered and should be big enough to supply enough
energy to the train while the train is passing the gap. In order to increase the life cycle of
batteries, it is better to choose a bigger capacity so each time when the train is passing the
gaps, battery will discharge by the smaller percentage of their total capacity. The relation
between the cycle life and the depth of discharge appears to be logarithmic as shown in the
graph 53. In other words, the number of cycles yielded by a battery goes up exponentially the
shallower the DOD. This holds for most cell chemistries. (Technologies, 2005)
Figure 53 Depth of Discharge vs Life Cycle (Technologies, 2005)

69
In order to compare different types of batteries, same capacity for all type of batteries should
be considered.
Weight of batteries are also important, since onboard energy storage is being used it is
important to choose a lighter weight battery for this specific design. Life cycle of batteries
also is important because if it is too short, then batteries need to be replacing more often, with
significant increase of the maintenance costs, it is important to mention that in battery design
energy of batteries is not really important but power is important. Table 3 compare different
types of batteries designs which can use them as energy storage system for A cars.
Table 6 Different type of batteries design, in order to use them as energy storage system for A cars
CAR A
Battery model Lithium ion
(model
9535)
Lithium ion
(model
9522)
Lead-Acid
(model 689-
5854)
Nickel-metal
hydride(model
10-340)
Output voltage(V) 72 28.8 12 12
Max discharge
current(I) 250 125 1000 200
Weight of each
battery(kg) 21.73 11.34 32.3 9
Number of battery in
series for each motored
car 3 8 18 18
Number of battery set
in parallel for each
motored car 12 16 4 30
Capacity of each
battery(Ah) 34 25 100 12
Total capacity of
batteries(Ah) 374 400 400 360
Total capacity of
batteries(kWh) 78.54 84 84 75.6
Total weight of
batteries(kg) 717.09 1451.52 2325 4860
Life cycle at 100%
DOD 800 800 800 10000
Life cycle depends to
number of gap 100000 100000 100000 1250000
70
As it demonstrated in the table above Lithium ion (model 9535) with output voltage of 72V
and max discharge current of 250A with the 21.73 Kg is a suitable battery for this design.
Therefore in order to get the voltage required, three of these batteries need to be connected in
series. Furthermore in order to get the same capacity as other types of batteries that
mentioned above and high discharge current, 12 set of this batteries need to be connected to
each other in parallel. Therefore this set of batteries has a total capacity of 374 Ah and total
weight of this set of batteries is 717.09 kg which is much lighter than other types of batteries
for this design. Life cycle is another advantage of this type of design of batteries. Each time
the train pass the gaps this set of batteries will discharge by 1.5 %( 1.15/78.54=1.5). As
results Lithium ion (model 9535) in this design are capable to power the train for about
100000 gaps. Total length of Victoria line is 21 km and between each 5 to 4 km conductor
rail gaps are located. Therefore approximately there are 5 gaps in the Victoria line; each train
in one day 100 times passing these gaps, as a result battery life Lithium ion (model 9535) in
order to use it for Victoria line trains is about 3 years.
Each Lithium ion (model 9535) battery cost £368.96, therefore batteries for this design will
cost car £13282.56 for each A cars which is excluded the cost of DC-DC converter and
electrical connection. DC-DC converter for this propose is cost about £250 therefore the total
cost of this energy storage with electrical connection is about £14000.
Table 4 compares the different batteries designs that can be used as energy storage system for
C&D cars. Lithium ion (model 9535) is the most suitable type of battery for A cars as well as
for C&D cars. They are the most suitable type of battery for C&D cars, since they have same
benefits as they have been mentioned in the previous paragraph. As the number of batteries
increases, the cost of batteries will increase too, therefore the total cost of batteries will be
£23244.48 for each C&D cars and the total cost is about £24000.

71
Table 7 Different type of batteries design, in order to use them as energy storage system for C cars and D cars
CAR C&D
Battery model Lithium
ion (model
9535)
Lithium ion
(model 9522)
Lead-Acid
(model 689-
5854)
Nickel-metal
hydride(model
10-340)
Output voltage(V) 72 28.8 12 12
Max discharge current(I) 250 125 1000 200
Weight of battery(kg) 21.73 11.34 32.3 9
Number of battery in
series each motored car 3 8 18 18
Number of battery set in
parallel for each motored
car 21 29 7 58
Capacity of each
battery(Ah) 34 25 100 12
total capacity of
battery(Ah) 714 725 700 696
Total capacity of
battery(kWh) 149.94 147 147 146.16
Total weight of battery(kg) 1369 2630.88 4069.8 9396
Life cycle at 100% DOD 800 800 800 10000
Life cycle depends to
number of gap 100000 100000 100000 1250000
4.2.2.2 Super-capacitors design for London underground gaps
The main difference between batteries and super-capacitors is the fact that the super-
capacitors are capable of discharging high current in short time. Therefore this is beneficial to
use them as a power supply to the train during the conductor rail gaps. Super-capacitors have
small capacity; however it has relatively a high number of life cycles, hence in this design
there is no need to increase the number of cells set in parallel for each motored car as they
already have a high number of life cycles and they are capable of discharging high current in
short time.
Various numbers of super-capacitors has been considered in this part of project, in order to
discover the best option for London underground conductor rail gaps.
In order to compare different super-capacitors for this application, first of all total capacity
for different super-capacitors should be chosen at same rate. It has been shown on table 5, the

72
life cycles of all capacitors are high, and consequently to choose the best super-capacitors,
total weight of cells must be considered. Therefore table 5 illustrated super-capacitors model
BMOD0165 P048 BXX has a smaller amount of weight than other types. As a result this type
could be an option in designing energy storage for London underground conductor rail gaps
(this type of super-capacitor has previously been used for some railway application). All the
super-capacitors in this table are capable of high max discharge current, therefore the design
of super-capacitors as energy storage will be the same for all A cars and C&D cars.
Table 8 Different type of super capacitors design, in order to use them as energy storage system for this application
super
capacitor
BMOD0063
P125 B04/B08
BMOD0094
P075 B02
BMOD0130 BMOD0165
P048 BXX
BM0D0500
B02
Output
voltage(V)
125 75 56 48 16
Max discharge
current(I)
1800 1600 1800 1900 2000
Weight (kg) 60.5 25 18 13.5 5.51
Number of
cells in series
each motored
car
5 9 12 13 40
Number of
cells set in
parallel for
each motored
car
3 3 3 3 3
Total weight
of cells(kg)
907.5 675 648 526 661.2
Life cycle
depends to
number of gap
1000000 1000000 1000000 1000000 1000000
Total capacity
(kWh)
1.313 1.25 1.273 1.39 1.39
Due to same information in terms of number of gap for Victoria line in London underground
all the super capacitors which are explained in table 8, in order to use them for Victoria line
trains will have life cycle of about 30 years.
Super-capacitors are more costly than batteries. Therefore each super-capacitors model
BMOD0165 P048 BXX will cost £1209.66. Total cost of these super-capacitors for this
design will be £47176.74 for each A and C&D cars. This design has lower weight compare to
other type to super-capacitors which are introduced in above table but is not the cheapest one.

73
As it shows in table 8, BMOD0063 P125 B04/B08 capacitor is the cheapest super-capacitor
for this design but it is heavier than other super-capacitors.
Table 9 Total cost of super-capacitors for this design
Type of Super-capacitors Total cost for this design
BMOD0063 P125 B04/B08 £23325.00
BMOD0094 P075 B02 £53961.12
BMOD0130 £42537.96
BMOD0165 P048 BXX £47176.74
BM0D0500 B02 £28862.40
4.3 Summary and Discussion
To summarize the founding in this chapter based on calculation and real traction data from
London underground, a number of batteries and super-capacitors have been investigated to
use them as energy storage system for London underground for the period of when trains are
passing the conductor rail gaps. For choosing the best type and model of energy storage,
weight, volume, max discharge current, capacity, life cycle and price of them has been
compared. As results in batteries types, Lithium ion model 9553HV was the best choice for
this design and in super-capacitors type, model BMOD0165 P048 BXX was the best choice.
Finally by compare the batteries and super-capacitors, it can be seen super-capacitors are
more expansive and they need higher capital cost but they have longer life cycle and they can
be run in this design for 30 years and batteries only can be use for 3 years in this application,
therefore after 3 years batteries are required to replaced, which is cost a lot. Consequently is
not worth to use the batteries for this application.

74
Chapter 5
Conclusion and Future Work
5.1 Conclusion
The equivalent circuit mathematical model for the discharging progress of a lead-acid battery
has been developed for this purpose and is implemented under Excel Microsoft software
environment. The model involves most of the important concepts of a battery to reflect the
dynamic response of terminal voltage when discharging.
A series of experimental tests have been carried out during the project for the model
validation and the study of the state of charge. And battery model implemented under
MATLAB/SIMULINK software environment. This battery model which has been made
could help to select right battery for different DC railway application.
After that the integrated model of DC railway with two substations and moving train power
system that has been developed in this project by using MATLAB/ SIMULINK program to
better understanding of how DC railway is working. DC railway power supply has some gaps
which disconnect the power supply to the train, therefore conductor rail gaps has been
designed and simulated to shows what happened to train when passing the gaps. As results
train was losing their performance over the gaps. consequently, in order to keep the train
performance remain the same during the gaps, different type of energy storage such as
batteries and super capacitor has been designed to find the suitable solution for power up the
train though the gaps. As results of investigation, super capacitors are more suitable for this
issue. Because of high current need to be discharged in short period of time, so super
capacitors have batter capability compare to the batteries for discharging the high current. and
most important things about the super capacitor is the life cycle of them, as result super
capacitors for this application have 10 times longer life cycle.
5.2 Future Work
For using batteries in railway application, batteries are required to have high rate of charge
and discharge to cope with the high current flows. As results, it is essential to consider the
batteries life issue. Therefore life cycle of battery must be considered.

75
Generally, the number of cycle which is specified on batteries data sheet is just for one
condition, which is tested in the laboratory. However, railways have different conditions and
life cycle of batteries should be estimated for all routes under different conditions. Therefore,
it is necessary to build up new tool for testing batteries to finding the life cycle of batteries for
different uses in the railways and also to characterize the batteries. This could be future work
area in this project.

76
References
(STIB), F.-O. D., 2011. Overview of braking energy recovery technologies , s.l.: s.n.
Anon., n.d. Nuenergy technologies. [Online]
Available at: http://www.nuenergytech.com/product-development/kinmo-flywheel-energy-storage/
[Accessed 15 02 2013].
Arendarik, S., 2012. Active Cell Balancing in Battery. Freescale Semiconductor.
Beeching, R., 1963. The Reshaping of British Railways - Part 1, s.l.: Her Majesty's Stationery Office.
Berndt, 1993. Maintenance-Free Batteries. A Handbook of Battery. s.l.:Research Studies Press Ltd.
Blog, T. E., 2006. The Energy Blog. [Online]
Available at: http://thefraserdomain.typepad.com/energy/2006/01/sodiumsulfur_na.html
[Accessed 22 02 2013].
Brain, M., 2006. How stuff works. [Online]
Available at: http://electronics.howstuffworks.com/everyday-tech/lithium-ion-battery1.htm
[Accessed 22 02 2013].
Buchmann, I., January 2004. Discharge methods.
Bullock, K. R., 1994. Lead/acid batteries. Journal of Power Sources, Volume 51, pp. 1-17.
Conway, B. E., 1999. Electrochemical Supercapacitors: Scientific Fundamentals and Technological
Applications. Ottawa: s.n.
David Linden, T. B. R., 2002. Handbook of Batteries. 3 ed. s.l.:McGraw Hill Professional.
Dr. Michael Steiner, M. K., n.d. Energy Storage System with UltraCaps on Board of Railway Vehicles,
s.l.: s.n.
Gholam-Abbas Nazri, G. P., 2003. Lithium Batteries: Science and Technology. s.l.:s.n.
Hanmin Lee*, G. K. C. L., n.d. Analysis for EDLC Application on Electric, s.l.: s.n.
Jih-Sheng (Jason) Lai, F. I. a. D. J. N., 2007. Energy Management Power Converters in Hybrid Electric
and Fuel Cell Vehicles. IEEE, Volume 95.
Kadhim, R., 2009. Energy Storage Systems for Railway Applications, London: RSSB.
Lee, J., 2007. Li-ion battery SOC estimation method based on the reduced order extended Kalman
filtering. pp. 9-15.
Lee, Y.-S., 2006. Quasi-Resonant Zero-Current-Switching. IEEE TRANSACTIONS ON POWER
ELECTRONICS, Volume 21.
ltd, S. p., 2012. SUPERCONDUCTING MAGNETIC ENERGY STORAGE (SMES). [Online]
Available at: http://www.superpower-inc.com/content/superconducting-magnetic-energy-storage-

77
smes
[Accessed 15 05 2014].
LUC FRUCHTER, G. C. a. A. L. M., 1986. BATTERIES, IDENTIFIED FRACTAL OBJECTS. Journal of Power
Sources,, p. 51.
Michael Steiner, J. S. H. S. a. T. J., 2008. Energy Storage Systems for Improved Efficiency of Railway
Vehicles.
Namisnyk, A. M., 2003. A SURVEY OF ELECTROCHEMICAL , s.l.: s.n.
Okoshi, T. Y. K. H. T. a. E. A., 2006. Battery condition monitoring. Journal of Power Sources, Issue 2, p.
158.
Oura, Y., 1998. Railway Technology today 3. 16 june.
Parfomak, P. W., 2012. Energy Storage for Power Grids and Electric Transportation: A Technology
Assessment. Congressional Research Service.
Perla B. Balbuena, Y. W., 2004. Lithium-Ion Batteries: Solid-Electrolyte Interphase. s.l.:Imperial
College .
R Barrero1∗, X. T. a. J. v., 2009. Stationary or onboard energy storage systems for energy. Rail and
Rapid Transit.
Rail, B., 2007. rail.co.uk. [Online]
Available at: http://www.rail.co.uk/british-railway-history/british-rail/
[Accessed 23 01 2013].
Rail, N., 2009. Electrification, London: Network Rail.
Rashid, M. H., 2004. “Power Electronics Circuits, Drives and Applications,. ” 3rd Edition. ed.
s.l.:Pearson/Prentice Hall.
REUK, 2006. REUK.co.uk. [Online]
Available at: http://www.reuk.co.uk/Lead-Acid-Batteries.htm
[Accessed 22 02 2013].
Rosch, W., 2001. psmac.com. [Online]
Available at: http://www.pcmag.com/article2/0,2817,1155271,00.asp
[Accessed 22 02 2013].
Schoenung, S. M. &. H., 2002. Long- vs Short-Term Energy Storage Technology Analysis.
Schramm, D. J., 2013. Maxwell Technolgies. [Online]
Available at: http://www.maxwell.com/products/ultracapacitors/products/k2-series
[Accessed 17 06 2013].
Steiner, D. M. D. J. S., 2005. Energy Storage on board of railway vehicles. IEEE.
Stock, L. U. 2., 2009. s.l.: s.n.

78
Technologies, B. a. E., 2005. Battery Life (and Death). [Online]
Available at: http://www.mpoweruk.com/life.htm
[Accessed 21 09 2013].
THOMAS, J., 2007. Storing Sunshine Using Flow Batteries.
Underground, L., 2009. London Underground 2009 Stock. london: London Underground.
Vazquez, S., 2010. Energy Storage Systems for Transport and Grid Applications. IEEE, Volume 57.
Vironment, A., 1998. Remote Operation System 4.0 Manual, California: s.n.
Whittingham, M. S., 2008. Electrical Energy Storage Using Flywheels. Harnessing Materials for
Energy, Volume 33, p. 419.
79
Appendix1 Risk assessment
The following is a risk assessment for Operating the battery cycler with the aim of charging
and discharging 14.4 volt batteries by using predefined current profiles.
Purpose
Aim of task is to determine resistance of battery in different states of charge and also
calculate the resistance of battery with different current.
Action plan
1. The access to the lab must be restricted to personnel involved in test. Nobody is
allowed in to the room when test are in progress. This is because people in the lab
could accidentally touch and be subjected to undesired contact voltages.
2. Put the battery on floor next to battery cycler.bur make sure not in walkway. Way
to emergency door must be clear.
3. Check all fuses in protection box to make sure they are working.
4. Connect with cable of appropriate cross section the protection box between the
battery cycler and battery pack. Section of the cable is selected to according point
3.
5. Tighten securely all the connections.
6. Connect the computer to the battery cycler via RS232 AND set the
programABC150 ready to run.
7. Now power on the battery cycler by closing the disconnected switch.
8. Set maximum current and voltage of the DC side using the front panel. Ensure this
limits are within the range admitted to particular battery connected.
Ones all of these actions have been properly executed there are two task to complete;
Task 1)
1. Discharge the battery pack with constant current equal to the nominal current from
100% to 0% of the state of charge.
2. Control of the current through RS232 and recording data in a logging file.
Task 2)

80
1. Charge the battery pack with constant current equal to nominal current from 0% to10
% of state of charge, and calculate the resistance of battery.
2. Repeat action 1 with increments of 10% of state of charge, till battery is fully charged.
3. Repeat action number 1 and 2 with current equal to 25%, 50 % and 75%nominal
current.
The University Personnel will be:
1. Siavash Hajiabady
2. Pietro Tricoli
Anticipated Tasks:
battery cycler for charge and discharge battery
battery for testing
wire connection
protection box
fuses for safety
computer to program battery cycler
Final copies to;
Andy Dunn NB6
RRC staff Room

81
Hazard and Risk Assessment
Assessment of Hazard and Risk Assuming No Controls Existing Control Measures
HAZARD (List only significant hazards capable
of causing serious harm under
foreseeable conditions)
PERSONS AT RISK (Indicate
number) PERSONAL
HARM?
LIKELIHOOD RISK
LEVEL
CONTROLS/PRACTICE INFORMATION/INSTRUCTION CONTROL
OK
Ug Pg S C V Pa Pu F Mj Mn Y Pr Po R * Y/N?
High dc voltage and
dc current output
Poor training
X X
X
X X
X X
Must not be able to touch
and must be covered.
Staff should be present
until adequate training of
the postgraduate student
is achieved.
High dc voltage and dc current output
is very dangers and it could be cause of
death. Therefore, when the power is on,
we should not be able to touch the live
conductors.
The user first of all should read all
safety and healthy document. If using
the battery cycler for the first time, an
experienced member of staff should be
in the lab to explain all part of machine
to user and he needs to make sure
everything is right. And member of
staff should stay till user working with
the battery cycler.
For the second time of using the battery
cycler, supervisor should in lab to
check if everything is right and he need
to make sure user is ready to work with
battery cycler for next time without
him.
When supervisor deemed user has
competent to use the battery cycler,
supervisor does not have to supervise
directly user’s work, but at least one
member of staff should be in lab to
help in case there are problems with the
machine.
Y Y

82
Fire
Explosion or other
damaged of 14.4V
battery.
Unclean batteries
X X X
X X X
X X X
X X X
Check everything
carefully before
powering on the
equipment. For
example when we want
to connect battery to
battery cycler in case of
any fault happened, we
will use some fuses in
between of connection.
By doing that if
anything goes wrong
just fuses will be
broken.
Battery could be damaged
if the cell voltage is
higher than that
admissible.
If battery allowed to be
unclean (e.g. from dried
spilled acid), it is possible
for charge to slowly
escape along the resulting
electrically conductive
discharge path.
Fuses must be used to connect the
battery to the battery cycle. If anything
goes wrong it might cause of fire in the
battery. Batteries get warm when
charged and we must be sure that the
temperature does not reach critical
value. This is ensured by the control of
the current under the limit given by the
battery manufacturer.
In order to keep away from this
problem, we have to make sure, voltage
going to be use in turn of charging the
battery is in the appropriate range (14.4
V for lead-acid battery, but different
value for NiMh batteries). The machine
can’t power on without setting the
voltage limit to a value admissible for
the battery.
The barterer’s exterior should therefore
be kept clean especially around the
terminals to ensure that no discharge
path exists.
Y Y Y

83
Site area
Connection of the
battery and battery
cycler
Wet hands
Connect battery to
the protection box
Imagine if there is
any person close to
the equipment that
could
accidentally touch
any live conductors
X X X X X
X X X X X
X X
X X X
X X X X X
Site area need to be
restricted access during
tests. Therefore we can
put a notice behind the lab
door warning people that
lab will have restricted for
the duration of the tests.
Use a protection box
between the battery and
the DC-side of the
machine. Make sure
protection box has no
damaged or broken fuses.
If it has any broken fuses,
they should be replaced
before connection.
During the testing we
should not work with wet
hands
Verify the effectiveness
of the connection and the
absence of exposed live
conductors.
In order to make sure this
does not happen, must
cover live conductor and
harm people around that
test on the machine are in
progress.
Site should be restricted because when
we working in lab, equipment will be
live and if everyone can come to the
lab it will be dangers and they might
touch the equipment.
Protection box has been made from
some fuses in order to don’t let the
equipment damage.
This is very dangers because this might
reduce further the protection against
electric shocks.
If this is not, provide better insulation
of the connection.
If a people do suffer accidentally from
electric shock, make sure that the
machine is powered off before helping
him. Call immediately the 999 for an
emergency intervention.
Y Y Y Y Y

84
Turn on the battery
cycler
CCTV camera
Eating or Drinking
X X X
X X
X
X
X
X
X X X
Turn on the battery cycler
by closing the disconnect
or switch and the
circuit breaker. Check that
the machine is in stand-
by. If not, press the
emergency stop (red
button);
When we are working in
the lab. Make sure CCTV
camera is on.
When we are working in
lab, we should not eat or
drink.
CCTV camera should be on. During
the test we are not in the room, So if
anything goes wrong, we should be
able to see and be able to stop the test.
Food waste creates mess in the lab.
Drinks spilled on electrical equipment
could be dangerous due to the
possibility of creating short circuits
and, hence, fire.
Y Y

85
EXAMPLES OF HAZARDS Key PERSONS AT
RISK
PERSONAL
HARM?
LIKELIHOOD
Poor instruction, information,
training
Slipping/tripping
hazards
Electricity Pressure systems Biohazards Ug Undergraduate F Fatality Y Yes/ Very High
Inadequate systems or
procedures
Noise Chemicals/substances Fall of object from
height
Radiation Hazards Pg Postgraduate Mj Major Injury Pr Probable
Inadequate maintenance or
monitoring
Lifting heavy objects Dust Drowning Confined Spaces S Staff M
n
Minor Injury Po Possible
Unsuitable workstation or
equipment
Fall of person from
height
Fume Excavation work Hand tools C Contractor R Remote
Low temperature Fire Moving parts of
machinery
Explosion
(chemical/dust)
Stacking V Visitor
Poor lighting Vehicles Ejection of material Mechanical lifting Compressed Gas Pa Patient
Pu General Public
* Risk/Action Y Pr Po R KEY Priority Action Major Injury: Loss of or broken limb
Matrix F 1 2 2 3 1 1st Priority Action (Immediate Action) Loss of or damaged eye
Mj 2 2 3 3 2 2nd Priority Action (As soon as possible) Loss of consciousness
Mn 3 3 3 4 3 3rd Priority Action Acute illness needing Medical treatment
4 Risk OK, no action Permanent ill health or disability

For safety reason the label below has been design and was installed on safety box.
WHEN YOU SWITCH OFF
THE EQUIPMENT, WAIT
AT LEAST FIVE
MINUTES BEFORE
OPENING THE BOX
Figure 54 Safety notice

87
Appendix2
Battery charging code
/* Battery Pack Model with SOC Dependence*/
/* Written by S Hajiabady 25 Jan 2013*/
#request SG
main ()
{
float Vth = 14.4; /* Fully charged voltage */
float Istart = 25; /* Charging current start value */
float Istop = 1; /* Stop charging at this current */
float Ic = Istart; /* Charching current at each time */
float Vc; /* charging voltage */
float timer; /* a time keeper variable */
float timer2; /* a time keeper variable */
float Iold; /* Previous recorded battery current */
float Rw = 0.06; /* Wire resistance */
int StopIt = 0;
/* Set Limits For ABC-170 */
ABCVmin = 9.6;
ABCVmax = 15.5;
ABCImin = -6.0;
ABCImax = 25.0;
ABCPmin = -1.0;
ABCPmax = 1.0;
ChangeLimits();
ABCCommandMode = 1; /*Current Mode*/
ABCCommandValue = Ic;
/* LogMessage */

88
LogNumberMessage("Start charging with current=", Ic);
timer = TestTime;
while (TestTime-timer < 1.0) {} /* wait for 1 second */
LogNumberMessage("The battery voltage is:", ABCVoltage);
Vc = Vth + (ABCCurrent * Rw); /* Find charging voltage based on battery
current*/
while (ABCVoltage < Vc) /* wait until the battery reaches the voltage specified
above*/
{
Vc = Vth + (ABCCurrent * Rw); /* Find charging voltage based on battery current*/
timer2=TestTime;
while (TestTime-timer2 < 10.0) {} /* wait for 10 second */
}
Vc = Vth + (ABCCurrent * Rw); /* calculate new charging voltage based on new
current*/
LogNumberMessage("The battery voltage reached:", ABCVoltage);
LogMessage("Switch to voltage mode charging.");
ABCCommandMode = 0; /* Switch to Voltage Mode*/
ABCCommandValue = Vc; /* Charging voltage*/
timer=TestTime;
while (TestTime-timer < 10.0) {} /* wait for 1 second */
timer = TestTime; /*save the current time*/
Iold = ABCCurrent; /*save the battery current at the present*/
/* wait until current is bigger than current */
while ((ABCCurrent >= Istop) && (StopIt !=1))
{
if (((TestTime-timer)>3600) && ( abs(ABCCurrent - Istop) < 0.2)) /* if
current is at minimum current wait for one hours*/
{
StopIt=1; /* set the flag to stop waiting */

89
LogNumberMessage("Battery is charging for two hours at current :",
Iold);
LogMessage("Decision has been made to stop charging.");
}
if (ABCCurrent != Iold) /* if the current changed calculate new charging
voltage */
{
Vc = Vth + (ABCCurrent * Rw);
ABCCommandValue = Vc; /* Set new charging voltage*/
timer2=TestTime;
while (TestTime-timer2 < 10.0) {} /* wait for 10 second */
}
}
LogMessage("Stop charging...");
LogNumberMessage("Last Charging Voltage was:", Vc);
LogNumberMessage("Last Charging Current was:", Iold);
ABCCommandMode = 3; /*Standby the system*/
LogMessage("Charging completed!");
}
By running this script, result of charging which are shows current behaviour and voltage
behaviour and downloaded from battery cycler software are as below.
Figure 55 Charging current process

90
Figure 56 Voltage of battery during charging
For discharging operation voltage of battery demonstrated as below.
Figure 57 Battery discharge voltage

91
A lot of data was collected from battery cycler. Table below just shows small amount of this
data.
ABCAh Charging Current ABCImax ABCPower ABCVmax ABCVmin ABCVoltage TimeOfDay
0 0 25 0 15.5 9.6 11.1 46636
0 24.98 25 0.31 15.5 9.6 12.58 46637
0.01 25.06 25 0.32 15.5 9.6 12.64 46638
0.02 25 25 0.32 15.5 9.6 12.64 46639
0.02 24.96 25 0.32 15.5 9.6 12.72 46640
0.03 25 25 0.32 15.5 9.6 12.72 46641
0.04 25 25 0.32 15.5 9.6 12.72 46642
0.04 25.02 25 0.32 15.5 9.6 12.78 46643
0.05 25 25 0.32 15.5 9.6 12.76 46644
0.06 25 25 0.32 15.5 9.6 12.66 46645
0.07 24.98 25 0.32 15.5 9.6 12.78 46646
0.07 24.98 25 0.32 15.5 9.6 12.8 46647
0.08 25.02 25 0.32 15.5 9.6 12.82 46648
0.09 24.98 25 0.32 15.5 9.6 12.84 46649
0.09 24.96 25 0.32 15.5 9.6 12.86 46650
0.1 24.98 25 0.32 15.5 9.6 12.84 46651
0.11 25 25 0.32 15.5 9.6 12.86 46652
0.11 25.04 25 0.32 15.5 9.6 12.92 46653
0.12 25.04 25 0.32 15.5 9.6 12.86 46654
0.13 24.94 25 0.32 15.5 9.6 12.88 46655
0.14 25.04 25 0.32 15.5 9.6 12.86 46656
0.14 25 25 0.32 15.5 9.6 12.9 46657
0.15 25 25 0.32 15.5 9.6 12.9 46658
0.16 25.02 25 0.32 15.5 9.6 12.9 46659
0.16 24.92 25 0.32 15.5 9.6 12.9 46660
Battery discharging code
In this project manual mode has been used but if want used the automatic mode for discharge
the code below is prepared.
/* Battery discharging model */
/* Written by S Hajiabady 25 Jan 2013 */
#request SG
main ()
{
/* Discharging the battery */
92
float Id = -6; /* Discharging current */
float Vstop = 9.6; /* Stopping condition for discharging */
/* Set Limits For ABC-170 */
ABCVmin=9.6;
ABCVmax=14.4;
ABCImin=-6.0;
ABCImax=6.0;
ABCPmin=-1.0;
ABCPmax=1.0;
ChangeLimits();
LogNumberMessage("Start discharging with current=", Id);
ABCCommandMode = 1; /*Current Mode*/
ABCCommandValue = Id;
while (ABCVoltage > Vstop) {} /* wait as long as the battery voltage it higher than
Vstop*/
ABCCommandMode = 3; /*Standby the system*/
LogMessage("Discharging completed!");
}

93
Appendix3
Battery model code
% X = Discharge Current
% Y = SOC
% Z = Voltage of the battery
Xresolution = 1; %currect
Yresolution = 0.01; %soc
%X=10:10:60; % Original X values (10 20 30 ... 60)
%Y=100:-10:0; % Original X values (100 90 80 ... 0)
Z = xlsread('matrix.xlsx'); %read the data from excel file
[Ydim Xdim] = size(Z); %get the size of read data
X = linspace(10,60,Xdim); % from 10 to 60 divide by the size of our data
Y = linspace(100,0,Ydim);
Xfine = 10:Xresolution:60; % Fine X values (10 11 12 ... 60)
Yfine = 100:-Yresolution:0; % Fine Y values (100 99 98 ... 0)
[Xfmesh Yfmesh] = meshgrid(Xfine,Yfine); % Create a fine mesh to be used by Interpol
function
Zf = interp2(X,Y,Z,Xfmesh,Yfmesh); % calculate interpol values of Z based on new X and Y
hndl = figure;
%mesh(Xfine,Yfine,Zf);
if Yresolution < 1
surf(Xfine,Yfine,Zf, 'linestyle', 'none');
else
surf(Xfine,Yfine,Zf);
end
Xlabel('Discharge Current');
Ylabel('SOC');
Zlabel('Battery Voltage');
title('Model of the battery');
dcm = datacursormode(hndl);
set(dcm,'Enable','on','UpdateFcn',@xyzchange);
function output_txt = xyzchange(obj,event_obj)
% Display the position of the data cursor

94
% obj Currently not used (empty)
% event_obj Handle to event object
% output_txt Data cursor text string (string or cell array of strings).
pos = get(event_obj,'Position');
output_txt = {['Discharge Current: ',num2str(pos(1),4)],...
['SOC: ',num2str(pos(2),4)]};
% If there is a Z-coordinate in the position, display it as well
if length(pos) > 2
output_txt{end+1} = ['Battery Voltage: ',num2str(pos(3),4)];
end
Figure below also shows another model of battery which is show battery voltage in deferent
SOC for different discharge current.
Figure 58 Battery voltage in deferent SOC for different discharge current
100 90 80 70 60 50 40 30 20 10 09.5
10
10.5
11
11.5
12
12.5
13
13.5
X: 39.4
Y: 11.91
SOC %
VBatt
ery
[V
olt]
Battery Voltage vs SOC
10 A
20 A
30A
40A
50A
60A
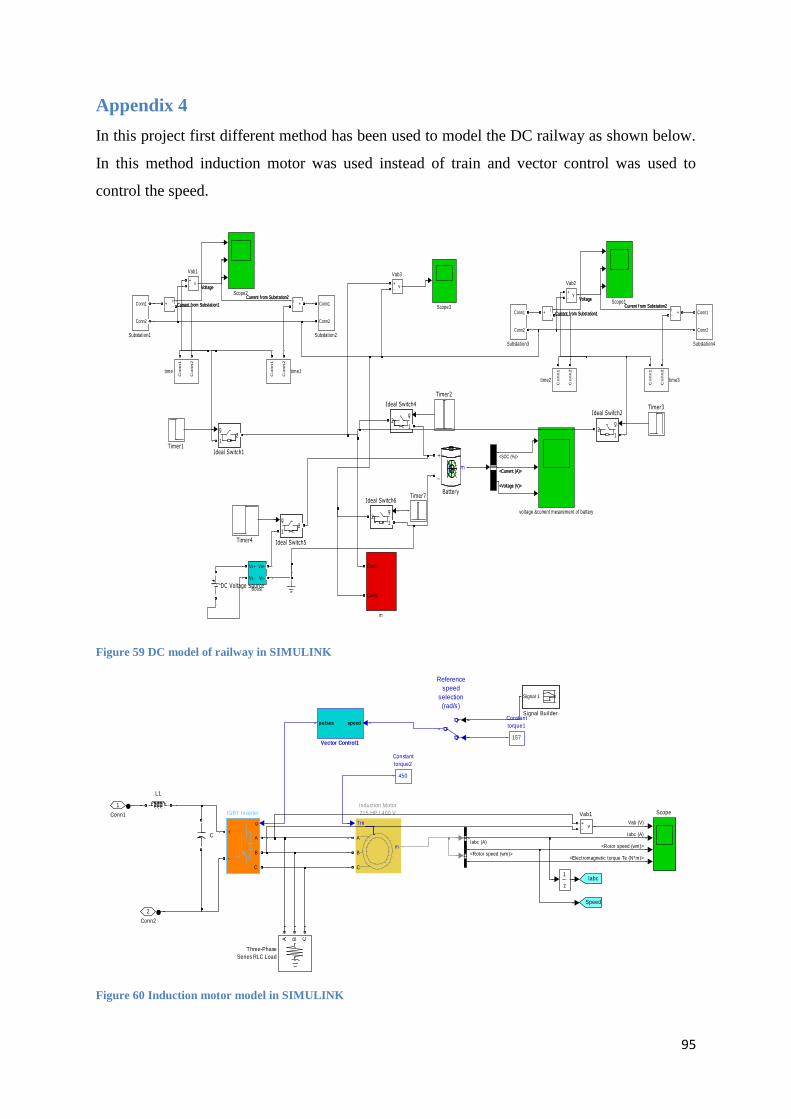
95
Appendix 4
In this project first different method has been used to model the DC railway as shown below.
In this method induction motor was used instead of train and vector control was used to
control the speed.
Figure 59 DC model of railway in SIMULINK
Figure 60 Induction motor model in SIMULINK
voltage ¤t mesurement of battery
Co
nn
1
Co
nn
2
time3
Co
nn
1
Co
nn
2
time2
Co
nn
1
Co
nn
2
time1
Co
nn
1
Co
nn
2
time
Discrete,Ts = 1e-005 s.
powergui
Conn1
Conn2
m
v+-
Vab3
v+-
Vab2v+-
Vab1
Timer7
Timer4
Timer3
Timer2
Timer1
Conn1
Conn2
Substation4
Conn1
Conn2
Substation3
Conn1
Conn2
Substation2
Conn1
Conn2
Substation1
Scope3
Scope2
Scope1
g
12
Ideal Switch6
g
12
Ideal Switch5
g
12
Ideal Switch4
g
12
Ideal Switch2
g
12
Ideal Switch1
DC Voltage Source
i+
-i
+-
i+
-i
+-
Vo+
Vo-
Vs+
Vs-
Boost
+
_
m
Battery
Current f rom Substation2Current f rom Substation2
Current f rom Substation1Current f rom Substation1
VoltageVoltage
Current f rom Substation2Current f rom Substation2
Current f rom Substation1Current f rom Substation1
VoltageVoltage
<Current (A)><Current (A)>
<Voltage (V)><Voltage (V)>
<SOC (%)>
2
Conn2
1
Conn1
speedpulses
Vector Control1
v+-
Vab1
z
1
A B C
Three-Phase
Series RLC Load
Signal 1
Signal Builder
Scope
Reference
speed
selection
(rad/s)
L1
m
A
B
C
Tm
Induction Motor
215 HP / 400 V
g
A
B
C
+
-
IGBT Inverter
Iabc
Speed
450
Constant
torque2
157
Constant
torque1
C
<Rotor speed (wm)>
<Rotor speed (wm)>
Iabc (A)
Iabc (A)
Vab (V)
<Electromagnetic torque Te (N*m)>
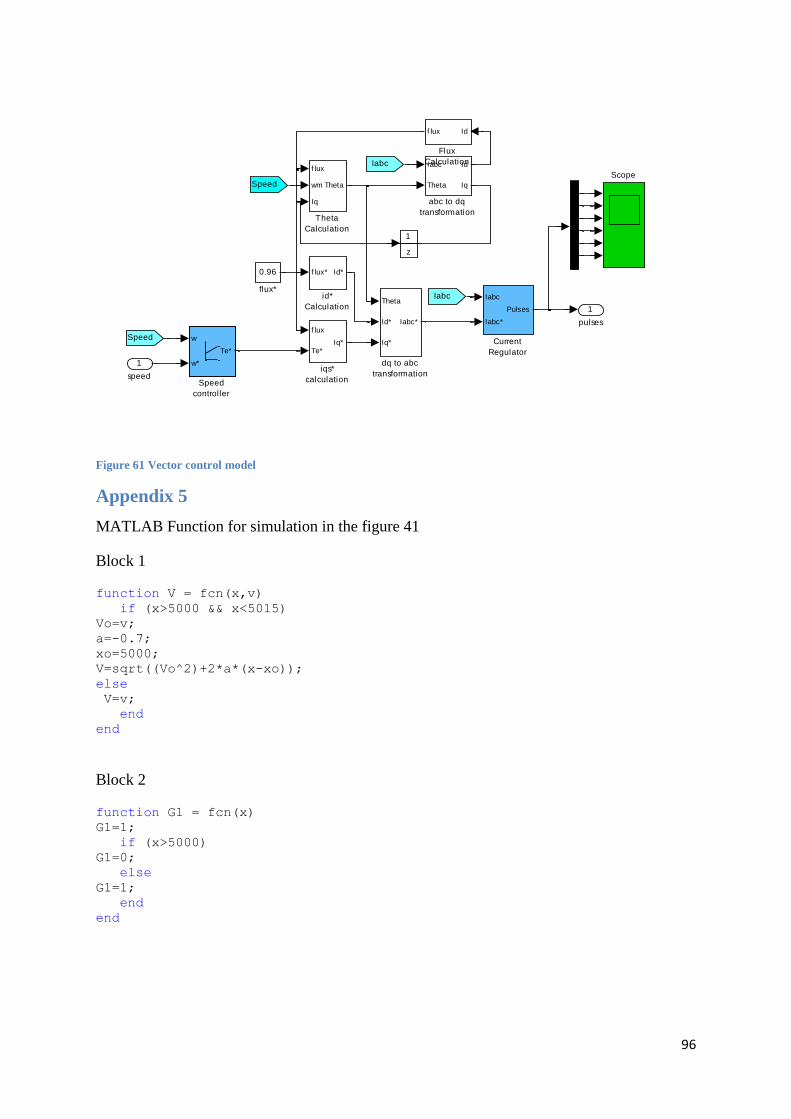
96
Figure 61 Vector control model
Appendix 5
MATLAB Function for simulation in the figure 41
Block 1
function V = fcn(x,v) if (x>5000 && x<5015) Vo=v; a=-0.7; xo=5000; V=sqrt((Vo^2)+2*a*(x-xo)); else V=v; end end
Block 2
function G1 = fcn(x) G1=1; if (x>5000) G1=0; else G1=1; end end
1
pulsesf lux
Te*Iq*
iqs*
calculation
f lux* Id*
id*
Calculation
0.96
flux*
Theta
Id*
Iq*
Iabc*
dq to abc
transformation
Iabc
Theta
Id
Iq
abc to dq
transformation
z
1
f lux
wm
Iq
Theta
Theta
Calculation
w
w*
Te*
Speed
controller
Scope
Iabc
Iabc
Speed
Speed
Idf lux
Flux
Calculation
Iabc
Iabc*
Pulses
Current
Regulator
1
speed

97
Block 3
function G2 = fcn(x) G2=0; if (x>5015) G2=1; else G2=0; end end