energy storage systems program report for fy96 · sand97-1136 unlimited release printed may 1997...
TRANSCRIPT

SANDIA REPORTSAND97–1136 . UC-1350Unlimited ReleasePrinted April 1997
Energy Storage Systems Program Reportfor FY96
Paul C. Butler
Prepared bySandia National LaboratoriesAlbuquerque, New Mexico 87185 and Livermore, California 94550
.,,
Sandia is a multiprograrn laboratory operated by Sandia Corporation,a Lockheed Martin Company, for the United States Department ofEnergy under Contract DE-AC04-94AL85000.
,~..;’~.,,.y,.>:,Approved for public release.;.d@t?&ti~&$$@?){:d.. . .,:“**;I

Issued by Sandia National Laboratories, operated for the United StatesDepartment of Energy by Sandia Corporation.
NOTICE: This report was prepared as an account of work sponsored by anagency of the United States Government. Neither the United States Govern-ment nor any agency thereof, nor any of their employees, nor any of theircontractors, subcontractors, or their employees, makes any warranty,express or implied, or assumes any legal liability or responsibility for theaccuracy, completeness, or usefulness of any information, apparatus, prod-uct, or process disclosed, or represents that its use would not infringe pri-vately owned rights. Reference herein to any specific commercial product,process, or service by trade name, trademark, manufacturer, or otherwise, doesnot necessarily constitute or imply its endorsement, recommendation,or favoring by the United States Government, any agency thereof, or any oftheir contractors or subcontractors. The views and opinions expressedherein do not necessarily state or reflect those of the Unjted States Govern-ment, any agency thereof, or any of their contractors.
Printed in the United States of America. This report has been reproduceddirectly ii-em the best available copy.
Available to DOE and DOE contractors fromOffice of Scientific and Technical InformationP.O. BOX 62Oak Ridge, TN 37831
Prices available horn (615) 576-8401, FTS 626-8401
Available to the public hornNational Technical Information ServiceU.S. Department of Commerce5285 Port Royal RdSpringfield, VA 22161
NTIS price codesPrinted copy: A05Microfiche copy: AO1
SAND97-1136
Unlimited Release
Printed May 1997
Distribution
Category UC-1350
Energy Storage Systems
Program Report for FY96
Paul C. Butler, Manager
Energy Storage Systems Department
Sandia National LaboratoriesP.O. BOX5800
Albuquerque, New Mexico 87185-0613
Abstract
Sandia National Laboratories, New Mexico, conducts the Energy StorageSystems program, which is sponsored by the U.S. Department of Energy’s
Office of Utility Technologies. The goal of this program is to assist industryin developing cost-effective energy storage systems as a resource option by2000. Sandia is responsible for the engineering analyses, contracted devel-
opment, and testing of energy storage systems for stationary applications.This report details the technical achievements realized during fiscal year
1996.

Contributors
DOE/Albuquerque Field Office:
G. Buckingham
Sandia National Laboratories:
A. Akhil, Analysis
R. Armijo, Component Research and Development, Sodium/Sulfur Applied Research
E. Binasiewicz, Subsystems Engineering, Evaluation
N. Clark, Subsystems Engineering, Zinc/Bromine
G. Corey, Integration and Implementation
J. Freese, Subsystems Engineering, Evaluation
R. Jungst, Subsystems Engineering, Lead-Acid, and System Field Evaluation
D. Rovang, Analysis, Mid-Voltage Power Quality Devices
T. Unkelhaeuser, Subsystems Engineering, Evaluation
Contractors/Subcontractors:
M. Anderson, University of Missouri – Rolls
J. Cooley, Chugach Electric Association
P. Eidler, ZBB Technologies, Inc.
B. Flernming, AC Battery Corporation
A. Koenig, Silent Power, Inc.
H. Meyer, Omnion Power Corporation
J. Rasmussen, Silent Power, Inc.
L. Charles, Energetic, Inc.
S. Swaminathan, Sentech, Inc.
J. Szymborski, GNB Industrial Battery Co.
P. Taylor, Energetic, Inc.
R. Winter, PG&E
H. Zaininger, Zeco Engineering

Issued by Sandia. National Laboratories, operated for the United States Department of Energy by Sandia
Corporation.
NOTICE: This report was prepared as an account of work sponsored by an agency of the United States Gov-
ernment. Neither the United States Government nor any agency thereof, nor any of their employees, nor any
of the contractor:;, subcontractors, or their employees, makes any warrant y, express or implied, or assumes
any legal liability or responsibility for the accuracy, completeness, or usefulness of any information, appara-tus, product, or process disclosed, or represents that its use would not infringe privately owned rights. Ref-erence herein to any specific commercial product, process, or service by trade name, trademark,manufacturer, or otherwise, does not necessarily constitute or imply its endorsement, recommendation, orfavoring by the United States Government, any agency thereof, or any of their contractors or subcontractors.The views and o]pinions expressed herein do not necessarily state or reflect those of the United States Gov-
ernment, any agency thereof, or any of their contractors or subcontractors.
Printed in the United States of America
Available fromNational Technical Information Service
U.S. Department of Commerce
5285 Port Royal RoadSpringfield, VA 22161
NTIS price codes
Printed copy: A09
Microfiche copy: AO1
ContentsPage
Acronyms am~dAbbreviations ........................................................................................................................v
1. Executive Summary .................................................................................................................................... 1-1
Introduction .......................................................................................................................................... 1-1
Highlights ..... ....................................................................................... .......................................... ..... 1-2
CNerview ................................................................................................................................. 1-2
Pmalysis ................................................................................... ................................................ 1-2
Component Research and Development ....................... ........................................................... 1-3
Integration and Implementation ............................................... ................................................ 1-5
Information Exchange ........................... .................................. ................................................ 1-6
2. Amdysis ....................................................................................................... ................................................ 2-1
Introduction ..................................................................................................................................... ..... 2-1
System Studies ..................................................................................................................................... 2-1Quantification of Utility Cost Savings from Using Batteries - UMR ..................................... 2-1Mid-Voltage Power Quality Device Project ............................................................................ 2-5
Chugach and SMUD Feasibility Studies ................................................................................. 2-7
Market Feasibility Study .......................................................................................................... 2-7
Storage System Cost Study ..............................................................................!.....................2.llpv Batteg ad ch~ge con~ollerM~ket and Applications Survey .................................... 2-13
Top-Down Market Analysis ................................................................................................... 2-16
Incorporation of BES into NEMS .......................................................................................... 2-17
3. Component Research and Development- Zinc/Bromine Battery Development ................................. 3-1
Introduction ....................................................................................................................................... ... 3-1
Status ............................................................................................................................................... ..... 3-1
;100-kWh Deliverable Battery Design ..................................... ................................................ 3-1
13attery Controller Softwme ............................................................................................"...... 3-4
:100-kWh Battery Characterization ......................................... ........... ...................................... 3-5
4. Component Research and Development- Technology EvaluatiordApplied Researeh at SOL ........... 4-1
Introduction .......................................................................................................................................... 4-1
VRLA imd Lead-Acid SLI Evaluation at SNL .................................................................................... 4-1
PV Battery Cycle-Life Evaluation at SNL ..............................................................................4.l
(GNB ABSOLYTE II and IIP and Yuasa-Exide Testing ........................................................... 4-2“VRLA Reliability Improvement Project ................................................................................ 4-15
Sodium/Sulfur Applied Research at S~ .............................................................................. 4-17
5. Integration and Implementation .............................................................................................................. -
Introduction ................................................................................................................................""."..'.."z..
Factory-Integrated Modular Storage (FIMS) Systems ......................................................................... 5-1AC Battery System Contract Wrap.Up ..................................................................................... 5-1
Transportable Battery Energy Storage System (TBESS) ........................................................ 5-1
Advanced Battery Energy Storage System (MESS) ............ .................................................. 5-3
System Field Evaluation ...................................................................................................................... 5-3
AC Battery PM250 Prototype Renovation Project with AC Elattery Corporation ...................5-4AC Battery PM250 Field Evaluation at PG&E ....................................................................... 5-4
Field Test of PQ2000 ........... .................................................................................................... 5-5
Field Test of Final VRLA Battery Deliverable .. ...................................................................... 5-7
PV/Hybrid Evaluation Project ............................................................................................... 5-14
CONTENTS i
-—
Contents (Continued)
Page
6. Information Exchange ............................................................................................................................... 6-1
Introduction ............................................. ............................................................................................. 6-1
U13G/ESA L%pport ............................................................................ ................................................... 6-1
Status ........................................ ............................................................................... ................. 6-1
Executive Briefings ................................. ............................................................................................. 6-1
Status .................................................................. ......................... ............................................. 6-3
Trade Shows, Conferences, and Meetings ........................................................................................... 6-4
DA/DSM ’96 Conference, January 15-17, 1996 ................................................. ................................ 6-4
UPVG and Soltech Annual Meeting, March 12-15, 1996 ................................................................... 6-4
ii CONTENTS

2-1
2-2
2-3
2-4
2-5
2-6
2-7
2-8
3-1
3-2
3-3
4-1
4-2
4-3
4-4
4-5
4-6
4-7
4-8
4-9
4-1o
5-1
5-2
5-3
5-4
5-5
5-6
5-7
5-8
5-9
5-1o
5-11
5-12
5-13
FiguresPage
BESS Used. for Spinning Reserve Only (1995) ....................................................................................... 2-3
BESS Usedlfor Load Leveling Only (1995) ............................................................................................ 2-3
BESS Used for Load Leveling Only (1996) ............................................................................................ 2-4
BESS Usedlfor Load Leveling, Including Spinning Reserve (1995) ...................................................... 2-4BESS Used for Load Frequency Control ................................................. ............................................. 2-5BES: Value-Added Applications (30 Companies), 1996 ........................ ............................................. 2-1oStructure of the Electricity Market Module ............................................. .............................................. 2-20
Constructicm of the Load Duration Cme ................................................ .............................................. 2-21Zinc/Bromine Battery Stack, 2500 cm2, 60 Cells .................................... ................................................ 3-2Hazmat Building Containing 100-kWh Deliverable ................................................................................ 3-2
Depiction of a 33-kWh Battery Module .................................................................................................. 3-3
GNB 12-5000X Boost Charge ................................................................................................................. 4-2Voltage, Current, and Power Responses of the ABSOLYTE IIP for Three Consecutive
Frequency Regulation Sessions of a UES Cycle (Cycle 141) .................................................................. 4-4
ABSOLYTE IIP Discharge Capacity Loss Rate for a Specific Renewable Application Recharge
Regime: 1125-W Constant Power to 2.35 vpc, Followed by 2-hr Clamp at 2.35 vpc ............................ 4-6Plot of Ah Removed (AhOut) and Ah Returned (AhIn) for Cycles 171-203 for ABSOLYTE IMP.......... 4-9
Peukert Plot of ABSOLYTE II Constant-Current Discharges ............................................................... 4-12
Peukert Plot of Yuasa-Exide Dynacell Battery Constant-Current Discharges ....................................... 4-14
Life-Cycle Capacity Plot at C/8 Discharge Rate for Yuasa-Exide Dynacell Battery ............................. 4-16
Fusing Test Results in Argon on an Alloy Fuse with a 5-mm Gap Between the Leads ......................... 4-18
Fusing Test Results in Air on an Alloy Fuse with a 5-mm Gap Between the Leads .............................. 4-19
Fusing Test Results in Air on an Alloy Fuse with a 10-mm Gap Between the Leads ............................ 4-20
Initial Conceptual Design for the TBESS ............................................... ................................................. 5-3
Voltage Interruption on One Phase of the Utility and Load Pickup by the PQ2000 ................................ 5-6
Synchronous Transfer Back to the Utili~ ................................................................................................ 5-6Battery Cycle Life Plotted as a Function of DOD ................................................................................... 5-7
Discharge Voltage and Current for Battery Strings Measured at 3-rnin Intervals during aNominal 1500-kW Discharge .................... .............................................................................................. 5-9Power Consumption at GNB’s Vernon Lead Recycling Center during an Average April Week ............ 5-10
Battery Lc}ad on May 29, 1996, While Operating under the First Block-Loading Scenario .................5-1 1
Vernon Lead Recycling Center Electricity Utility Demand While the BESS is On Line for B1ock
Loading ..... .. ..................................................................................................................................... ...... 5-11
Plant and BESS Operation for a Typical Weekday and Weekend Day daring a Block-Loading Test ... 5-13
Four Daily BESS Cycles in July Using the Modified Load Peak-Shaving Profile ................................ 5-14
Operation of the BESS during the Second Half of September Using the Modified Load Peak-Shaving Scenario .................................................................................... ................................................ 5-15
Closed Cabinet for the HPPCS showing the Junction Boxes for DC Input Sources
for the System ........................................................................................................................................ 5-16HPPCS Control and Power Electronics Layout ..................................................................................... 5-16
6-1 View of the GNB Battery from the PCS Room ....................................................................................... 6-2
CONTENTS...111

Tables
Page
2-1
2-2
2-32-4
2-5
2-6
2-7
2-82-9
3-1
3-23-34-1
4-2
4-3
4-4
4-5
4-6
4-74-8
4-9
4-1o
4-11
6-1
BESS Parameters .............. ................................ ....................................................................................... 2-2
BES: Value-Added Applications (30 Companies), 1996 ................................................... ..................... 2-9
BES Market: Penetration Statistics Among Electricity Providers (U.S.), 2000,2005, and 2010.........2-10
BES Market: Penetration Statistics Among Electricity End Users (U.S.), 2000,2005, and 2010........2-11
Cost of Projects and Products—Energy Storage Systems .......................................... ........................... 2-14
Cost of Projects and Products—Power Quality Systems ......................................... ......................... ..... 2-15
Totals for All Batteries .............................................................. ............................... .... .......................... 2-18Worldwide Top-Down PV Battery Market Estimates ................................................................ ............ 2-18
U.S. Top-Down PV Battery Market Estimates ............................................................ ........................... 2-19100-kWh Battery Specifications ........................?..................................................................................... 3-4
Fault and Shutdown Conditions for 100-kWh Batte~ ................................ ............................................. 3-5
Fault and Shutdown Responses for 100-kWh Battery ........................... .................................................. 3-6
Summary of Frequency Regulation Data of a UES Cycle on the ABSOLYTE 11P (Cycle 141) ....... ......4-5
Regimes Used for Recharging the ABSOLYTE II and IW ...................................... ................................ 4-5
ABSOLYTE IIP Discharge Capacity Measurements for a Specific Renewable Application
Recharge Regime ................................................................................ ..................................................... 4-7
Comparison of ABSOLYTE II and IIP C/2 (425-A) Discharge Capacities when Using
Normal Overcharge (E) Recharge Regime ............................................................................................ 4-10
Comparison of ABSOLYTE II and HP C/8 (150-A) Discharge Capacities when UsingNormal Overcharge (E) Recharge Regime ............................................................................................ 4-10Comparison of ABSOLYTE II and IIP C/20 (68-A) Discharge Capacities when UsingNormal Overcharge (E) Recharge Regime ........................... ................................................................. 4-11Effect of Various Constant-Voltage Float Levels on the ABSOLYTE II ................. .............................. 4-12
Standard Charge Regimes ........................................................................................ .............................. 4-15
Community Batteries Tested by SM .................................................................................................... . 4-16Two-Step Formation Charge Amp-Hours .............................................................................................. 4-16
PV Cycling Regime for Community Power Batteries ............................................................ ............... 4-17
Utility Executive Meetings with DOE Program Tem ............................................................................. 6-3
iv CONTENTS

Acronyms and Abbreviations
ABESS
ACBC
ACE
ACU
ALABCALoAPsAPT
ASU
BES
BESS
BEWAG
CEC
CPD
CREDA
DOD
DOE
DSM
ECP
EMM
EPRI
ESA
ESD
ESS
FEs
FIMsFSEC
GE
GNB
HELCO
HPPCS
IEEE
ILZRO
IOUS
IPALCO
IPP
Advanced Battery Energy Storage System
AC Battery Corporation
area control error
Adaptive Control Unit
Advanced Lead-Acid Battery Consortium
Albuquerque Operations Office
Arizona Public Service Company
Alternative Power Technologies
Arizona State University
battery energy storage
battery energy storage system
Berlin Power and Light
California Energy Commission
constant-power discharge
El Carnino Real Engineering
Distribution Automation
depth of discharge
Department of Energy
demand-side management
Electricity Capacity Planning
electric market module
Electric Power Research Institute
Energy Storage Association
electronic sensor device
Energy Storage System
flywheel energy storage
factory-integrated modular
factory-integrated modular storage
Flo:rida Solar Energy Center
General Electric
GNB Technologies, Inc.
Hawaii Electric Light Company
Hybrid Power Processor and Control System
Institute of Electrical and Electronics Engineers
International Lead Zinc Research Organization, Inc.
investor-owned utilities
Idaho Power & Light Co.
independent power producer
ACRONYMS AND ABBREVIATIONS v

KCPL
LANL
LDSM
LVD
MDL
MGTF
MOU
NEMS
NERC
NEST
NMsu
NRECA
NSP
Oc
O&M
Pc
PCP
Pcs
PEPCO
PG&E
PLC
PNM
PREPA
Pv
PVDF
R&D
RFQ
RMSEL
RT
SCE
SDG&E
S1
SLI
SMES
SMUD
SNL
Soc
SOH
Kansas City Power and Light Co.
Los Alamos National Laboratory
Load and Demand-Side Management
low-voltage disconnect
Microelectronics Development Laboratory
Modular Generation Test Facility
memorandum of understanding
National Energy Modeling System
North American Electric Reliability Council
National Energy Storage Test
New Mexico State University
National Rural Electric Cooperative Association
Northern States Power
open circuit
operations and maintenance
personal computer
power control pair
power conditioning system
Potomac Electric Power Co.
Pacific Gas & Electric
programmable logic controller
Public Service Company of New Mexico
Puerto Rico Electric Power Authority
photovoltaic
polyvinylidene difluoride
research and development
Renewable Fuels Module
request for proposal
request for quotation
Robotics Manufacturing Science and Engineering Laboratory
recharge time
Southern California Edison
San Diego Gas & Elecrnc
Superconductivity, Inc.
starting, lighting, and ignition
superconducting magnetic energy storage
Sacramento Municipal Utility District
Sandia National Laboratories
state of charge
state of health
vi ACRONYMS AND ABBREVIATIONS
sowSPI
SPL
SR
SRP
ST~
T&D
TBESS
TBs
UBG
UBS
UEs
UMR
UPs
UPVG
VAR
VRLA
ZBB
statement of work
Silent Power, Inc.
Silent Power, Ltd.
spinning reserve
Salt River Project
Solar Test and Research
transmission and distribution
Transportable Battery Energy Storage System
Transportable Battery System
Utility Battery Group
Utility Battery Storage
utiliqy energy storage
University of Missouri-Rolls
unintemuptible power supply
UtiIity Photovoltaic Group
volt-amp reactive
valve-regulated lead-acid
ZBB Technologies, Inc.
ACRONYMS AND A13BREVIATIONS vii

...Vul ACRONYMS AND ABBREVIATIONS

1. Executive Summary
Introduction
The U.S. electric utility industry is undergoing
revolutionary change as a result of ( 1) impending dereg-ulation and competition, (2) limitations on installingnew conventional generation and transmission and dis-
tribution (T&D) equ~pment, and (3) greatly reducedresources for research and development (R&D). TheUnited States Department of Energy (DOE), through theEnergy Storage Systems (ESS) Program, continues towork cooperatively with the utility industry and the
manufacturing sector todevelop energy storage systems
that will play a vital rclle during and after this transition
period. In doing so, the ESS Program is tiuthering the
goals of the DOE by developing technology that can be
used by industry to (’1) strengthen the nation’s energy
security in terms of electricity supply, (2) reduce the
environmental impact of electricity generation, trans-
mission, and disrnbution, and (3) increase the globaleconomic competitiveness of U.S. industry with morereliable, higher quality, and cheaper electricity.
Like the utility industry, the ESS Program itself is
undergoing changes, During the first quarter of FY96,
the program reso-ttcttured its previous five program ele-
ments into four, was renamed ESS, and redefined theprogram focus to include the full range of energy stor-
age products. The ESS Program is conducting focusedresearch and development, leveraged by U.S. industry,
to stimulate the widespread use of energy storage sys-tems for renewable generation and other electric systemapplications. In resjponse to the changing needs of
industry and the status of developing technology, theprogram has expanded to include a portfolio of storage
technologies such as advanced batteries, flywheels, and
superconducting magnetic energy storage (SMES) andhas the goal of developing new energy storage systemswith superior perfom~ance and higher energy densitiesat competitive prices.
The ESS Program balances the research and devel-
opment of promising new technologies and equipmentwith focused analytical and educational tasks. The pri-
mary emphasis of ESS hardware development projectsin FY96 was on the development of the Transportable
Battery Energy Storage System (TBESS) and on thecontinuation of utility field experiments such as theGNB Technologies, l[nc. (GNB) Vernon and MetlakatlaIndian Community storage projects. Program initiativesin FY96 included the Advanced Battery System Devel-
opment project and the mid-voltage storage system
project. The N96 program plan included a broad spec-
trum of landmark analytical activities such as estimating
the market for battery energy storage (BES) in utility
applications.
The ESS Program consists of four interrelated ele-ments:
● Analysis
“ System StudiesQ Feasibility Studies
. Opportunities Analysis
“ Component Research and Development
“ Zinc/Bromine Battery Technology Develop-
mento Technology Evaluation/Applied Research at
Sandia National Laboratories (SNL)“ Valve-Regulated Lead-Acid (VRLA) Battery
Reliability Improvement
● Integration and Implementation
“ Factory-Integrated Modular Storage (FIMS)
Development
“ System Field Evaluation
● Information Exchange“ Energy Storage Association (ESA)
. Executive Briefings
This report summarizes each element’s projects
and tasks and describes the progress made on theprojects in FY96.
Current analysis studies, which focus on quantifica-
tion of application benefits, have allowed utilities to
define the usefulness of storage and to make informed
decisions regarding its suitability to their applications.Widespread acceptance of this technology by the utilityindustry will eventually make it possible for utility plan-ners to routinely include energy storage in their planningscenarios.
Work in the Component Research and Developmentelement focuses on improving the subsystems that makeup energy storage systems: improvements are devel-
oped and evaluated in the primary components of the
energy storage system, including the storage device(e.g., the battery) and the electrical equipment (powerconversion and control). The ESS Program is develop-ing storage components that cost less, have higher per-
1. EXECUTIVE SUi14MARY I-1

fonnance, and are better integrated with other parts of
the system than those currently available.
Activities in the Integration and Implementationelement involve pursuing a strategy that will reduce
inefficient, one-of-a-kind system engineering histori-
cally required when an energy storage system is
designed and built. A “modular” system approach hasbeen adopted as the preferred method to achieve systemflexibility and the lowest possible cost. The major sub-
system components are designed as separate modules so
that integration can occur either at the factory or the util-
ity site. From a cost perspective, the modular approach
permits more efficient engineering, design, and manu-
facturing processes. Performance and service-life quali-
fication of hardware incorporating prototype designs isalso performed. This activity involves the detailed char-
acterization of performance, maintenance requirements,and reliability (service life) of integrated systems at rele-vant utility sites. The qualification of hardware incorpo-rating prototype designs and associated manufacturing
methods represents the final step of engineering devel-
opment.
Work in the Information Exchange element concen-
trates on focused communication to promote interest inenergy storage and to provide forums in which ideas areshared, information is exchanged, and cooperative
projects are initiated. Between March and September of1996, ESS Program management visited 15 organiza-tions. The selected organizations all have technologiesor business goals that may play a significant role in the
eventual adoption of energy storage systems into the
electric utility industry.
Highlights
Overview
Many projects initiated late in FY95 and duringFY96 have been advanced significantly. A contract wasplaced with Frost & Sullivan to perform a market feasi-
bility study that will provide a preliminary estimate ofthe market for BES in certain utility applications overthe next 15 years. The first PQ2000 system has under-gone a successful shakedown test and will now enter acomprehensive field test program. The final VRLAdeliverable from GNB was placed in service, and fieldtesting has begun. ESS Program staff completed the
Executive Briefing presentation package and held 15
meetings with utility executives.
This year’s Soltech Conference, held in Palm
Springs, California, was the first to bring together repre-
sentatives from both the electric utility industry and the
solar energy companies. The program’s presence at theconference emphasized the benefits to be gained by
including storage in renewable energy projects.
Analysis
Quantification of Utility Cost Savings fromUsing Batteries-University of Missouri-Rolls
The University of Missouri-Rolls (UMR) is con-
tinuing to use the DYNASTORE computer program tocalculate utility operating cost savings that can be real-
ized with BES. Analysis of a grid-connected utility sys-tem at Kansas City Power& Light Co. (KCPL) has beencompleted for three battery applications: load leveling,spinning reserve, and frequency regulation. Frequency
regulation provided the greatest predicted operating costsavings in this case, amounting to about $4M in 1996
for a 1OO-MW battery energy storage system (BESS).
The revised final report for the KCPL study was submit-
ted to SNL at the end of June.
Mid-Voltage Power Quality Device Project
SNL has been working with the Public Service
Company of New Mexico (PNM), Los Alarnos NationalLaboratory (LANL), and El Camino Real Engineering
(CRE) to develop a storage system that can solve powerquality problems at the substation level, i.e., 15 kV.
SNL has proposed testing the first-of-its-kind system at
Substation 41 (at SNL) because industry members are
reluctant to test and prove the technology at their pro-duction facilities.
Market Feasibility Study
To better orient BES development and commercial-ization efforts to the needs of the marketplace, SNLbegan developing the request for proposal (RFP) for a
market study in 1995. Frost & Sullivan was retained in
May 1996 to conduct the study. Frost& Sullivan beganby identifying a pool of contacts that would receive aquestionnaire and participate in a survey. The poolincluded contacts from utilities, including investor-owned utilities (IOUS), independent power producers(IPPs), and cooperatives. Frost & Sullivan also identi-fied contacts in the battery system supplier industry,consultants, and regulatory bodies such as state regula-
tory commissions and other similar agencies.
1-2 1. EXECUTIVE SUMMARY

Conclusions drawn from the study indicate thatBES and SMES are more competitive for power qualityapplications for two primary reasons. First, the powerquality problems experienced by industry are very simi-lar in nature; hence, a uniform product line can be devel-
oped and marketed, achieving economies of scale. Sec-
ond, because of the large economic losses caused by
power supply perturbations, industries are willing to
invest substantial amounts in equipment to shield them
from these perturbations. The increasing sensitivity of
customer machinery to these disturbances presents agrowing market for protection systems. Cost projec-tions indicate a 10-20% cost reduction for BES and a30-40% cost reduction for SMES systems in this appli-cation. Cost reductions through technology improve-
ment and volume manufacturing are essential for the
competitiveness of all the technologies (SMES, FES and
BES) and system components addressed in the study.
More of the survey findings can be found in Section 2 of
this report.
Cost Analysis of Energy Storage Systems
Early in FY96, SNL placed a contract with Sentech,Inc., to conduct a cost analysis of energy storagesystems for electric u{ility applications. The study esti-
mated the current cc~st breakdown of energy storage
systems using three of the most promising storage tech-
nologies: batteries, advanced flywheel energy storage
(FES), and SMES. After extensive discussions with sys-
tem and component suppliers, project engineers were
able to identify the potential for cost reductions in keycomponents. Preliminary results verify that energy
systems potentially have widespread applications withinthe electric utility industry. The three technologies ana-
lyzed each meet some of the performance requirementsof the 13 utility applications identified in Battery Energy
Storage for Utility Applications: Phase I - Opportuni-
ties Analysis, a report on a study conducted by SNL.
These preliminary results, along with tables summariz-
ing the cost of projects and storage system products, arepresented in Section 2 of this document. The complete
study will be published as a SAND report early in FY97.
Confidential and prc)prietary information will be pro-tected and will not be disclosed in the final report.
PV/Battery Charg(e Controller Market and Appli-cations Survey
The contract to conduct a Photovoltaic (PV)/Battery
and Charge Controller market and application surveywas placed with Arizona State University (ASU) in Juneof 1995. This survey provided (1) quantification andcharacterization of batteries and charge controllers usedin PV systems; (2) characterization of the operating
environment in which batteries and charge controllers
are used; and (3) feedback from PV system integrators,battery manufacturers, and charge controller manufac-
turers defining what information each needs to optimizePV energy storage systems.
Preliminary results from survey respondents identi-
fied areas of focus by each of the three industries (PVsystem integrators, battery manufacturers, and charge
controller manufacturers) in which they would like
SNL’S assistance. The high-priority areas identified
were (1) assisting in the development of applicationguides or notes, (2) assisting in the characterization ofbatteries for PV data sheet values, (3) providing techni-cal liaison between the PV and battery industries, and(4) performing surveys to define the market.
Under the contract, results from the survey werescheduled for publication by June 30, 1996. However,
an inordinate amount of the time was required to elimi-nate conflicts in data reported, which resulted in a con-
tract extension to December 31, 1996. The final reportwill be published and distributed as a SAND documentduring the tirst quarter of FY97.
Incorporation of BES into the National EnergyModeling System
In July 1996, Sentech, Inc., completed a study
addressing how BES can be incorporated into the Elec-
tric Market Module (EMM) of the NationaI Energy
Modeling System (NEMS). The purpose of the studywas to assess the feasibility of, and to make recommen-
dations for, developing methodologies to incorporatestorage in stand-alone dispatchable units. Also, storage
with renewable generation as an integrated unit wasmodeled.
The study concluded that three possible avenuesexist for including storage technologies within the
EMM. However, the study recommended that analytical
work be carried out only on integrating storage withrenewable technologies and that a thorough assessment
be made of the potential benefits storage can bring to therenewable generation technologies.
Component Research andDevelopment
Zinc/Bromine Battery Development
The zinc/bromine battery development project isbeing completed through an in-kind cost-sharing con-tract with ZBB Technologies, Inc. (ZBB). ZBB recentlycompleted a move into a 13,000-sq.-ft facility in Wau-
1. EXECUTIVE SUMMARY 1-3

watosa, Wisconsin. Facilities were prepared at this
installation for the manufacturing and testing of zincl
bromine batteries.
Unexplained shutdowns of the inverter were identi-
fied and a new controller board is scheduled to beinstalled in December 1998. Safety prequalification
testing was completed, Optimization of battery perfor-
mance will commence once the new controller board isinstalled.
Methods were developed to electrically isolate thevoltage so that the programmable logic controllers
(PLCS) would be able to consistently read battery volt-ages without being affected by noise from the powerconditioning system (PCS). Also, calibration of thevoltage and current sensors for the modules and the finallogic and data acquisition software were completed.
The electronics and software to run the battery weretested. Testing was initiated on a three-battery configu-
ration. These stacks were some of the first few built and
did not meet quality specifications. However, they did
perform very consistently during the 18 cycles for which
they were tested, with the final cycle giving coulombic
efficiency of 79.6qo, voltaic eiliciency of 87.7910, andenergy efficiency of 69.970.
Minor changes were made in the software and lad-der logic to enable the battery to run unmanned cycles.Strip resistors have been added to the system to allow
unmanned stripping of the battery. Once the new con-troller board is installed in December 1998 (with new
software), a major portion of the stripping function will
be performed by the PCS.
PV Battery Testing
PV battery cycle-life tests are being conducted onthe GNB 12-5000X 12-V batteries. A dozen batterieswere received in April 1996; two of the twelve batterieswere put on test immediately. The remainder of the bat-teries were left on the shelf in a fully charged condition.
After 6 mo it was discovered that the batteries had lost
up to 3090 of their capacity due to self-discharge effects.
VRLA Evaluation at SNL
ABSOLYTE // and 11PTesting
Testing of the GNB ABSOLYTE II 18-V batterycontinued during FY96. This battery was subjected toseveral series of constant-current discharge tests. These
were done to characterize the battery at the C12, C/8,and C/20 rates to 100% depth of discharge (DOD) and
also to compare the performance of the ABSOLYTE II
design with that of the enhanced ABSOLYTE 11P design
at the same discharge rates. During the third quarter, a
study was initiated to determine the effect on dischargecapacity of float charging at specific constant voltage
levels. The purpose of this study was to provide guid-
ance to New Mexico State University (NMSU) in the
setup of renewable systems for the U.S. Coast Guard,which uses ABSOLYTE technologies for energy stor-
age.
VRLA Reliability Improvement
VRLA battery reliability has been questioned
recently, particularly by users of standby power systems.
Because SNL believes that this battery technologyoffers significant advantages for utility and renewableenergy applications, a VRLA reliability improvementproject is being formulated. Yuasa-Exide, Inc., was vis-ited to obtain a manufacturer’s perspective on VRLA
reliability issues. VRLA failure modes were discussed,
and PCS requirements were identified as an area that
needs to be standardized. Interest was also expressed in
obtaining independent test data on utility battery prod-
ucts. Possible areas for i%ture collaboration are beingdefined. Internal discussions are continuing on ways to
structure a general reliability study that would attractstrong support horn the VRLA battery manufacturingcommunity. No conclusions have been reached at thispoint about how this effort should be organized,although teaming with other organizations that sponsor
research in the VRLA battery field may be a worthwhile
approach.
Sodium/Sulfur Applied Research at SNL
SNL is concluding an effort to develop thermalfuses as a safety device for sodiurnlsulfur batteries. Fus-ing tests have been carried out on several different pro-totype cast metal fuses that contain a variety of gapwidths between their electrical leads. The objective was
to evaluate several alloy formulations that melt in the
desired temperature range to determine which drop
cleanly from the fuse at the smallest gap width. It was
found that all of the candidate materials perfolmed bet-ter when the fuses were tested in an inert atmosphere toprevent the metals from oxidizing. Increasing the gapwidth between the leads from 5 mm to 10 mm alsohelped most of the u-ial fuses to open more reproduciblyin air. The most promising fuse material has a meltingpoint of approximately 460”C. Data reduction is com-plete and work on a summary report of all of the fusestudies has begun.
1-4 1. EXECUTZVE SUMMARY

Integration and Implementation
Factory-integrated lModuiar Systems (FIMS)
AC Battery Development Contract Wrap-Up
A draft final report on the PM250, Final Report on
the Development of a l!50-kW Modulac Factory-Assem-
bled Battery Energy Storage System, was received fromOmnion Power Engineering Corporation. Followingreview and markup, the PM250 final report will be pub-
lished as a SAND report for distribution early in FY97.The PM250 Prototype Production Cost Estimate Report
was also received in late FY96, and will be incorporated
into the development report.
Transportable Batte/y Energy Storage System(TBESS)
On August 1, 1996, negotiations were completedand the TBESS contract was awarded to AC BatteryCorporation (ACBC) in East Troy, Wisconsin. Thisproject is part of a ccdlaborative activity known as the
Transportable Battery System (TBS) Program, which is
an initiative of DOE and the Electric Power Research
Institute (EPRI). A contract was to be placed for the
design, fabrication, and testing of a utility-scale trans-
portable battery system to be evaluated at multiple sites
in partnership with a ~selected utility. SNL collaborated
with EPRI on the development of the statement of work
(SOW) for this project, and a similar project was initi-ated by EPRI. An REP was issued by SNL in late FY95.The goal of the project was to further the deploymentand evaluation of prc)totype battery systems built withcommercially available and advanced components in
typical utility operating environments.
Advanced Battery Energy Storage System(ABESS)
The request for quotation (RFQ) for the Advanced
Battery Energy Storage System (ABESS) project wasreleased by SNL in mid-January of FY96. The deadlinefor quotes was March 1996. Several proposals were
received; however, ac~ditional information was needed inorder to adequately evaluate the proposals. A letter
requesting additional, specific information from the pro-
posers was sent out and the deadline for submission
extended to July 199(6.
Analysis of the proposals resulted in two companiesreceiving high ratings. Currently negotiations are underway with both corrrpanies to see if a contract can beplaced with one or both of them.
System Field Evaluation
AC Battery P/W250 Prototype Renovation Projectwith AC Battery Corporation
During FY96, the ACBC prototype PM250 con-
tainer underwent complete refurbishment and checkout
at the AC Battery Corporation (ACBC) facilities in EastTroy, Wisconsin. Initial evaluation of the container atACBC indicated that multiple problems had occurred
during the long period that the container spent sittingidle on the Modular Generation Test Facility (MGTF)
test pad while the modules were being retrofitted with
new batteries at Delphi Energy Systems. During thethird quarter of FY96, the eight PM250 modules, com-
plete with new AES 2010 batteries, were thoroughly
checked out while they were at Delphi Energy Systems
in Indianapolis, Indiana. The modules were shipped to
ACBC during the fourth quarter of FY96. The system-
atic checkout performed by the ACBC engineers and
technicians resulted in the elimination of many prob-lems. Startup is expected in early October when all ofthe modules are mated with the container for full-powertesting.
Field Test of PQ2000
The first PQ2000, which was designed and fabri-cated under a program jointly sponsored by Pacific Gas
& Electric (PG&E), ACBC, Omnion Power Engineering
Corporation, the state of Wisconsin, and the U.S. DOE,was shipped from ACBC to the PG&E MGTF in mid-April of FY96. Following a successful shakedown test,the PQ2000 entered a comprehensive field test program.
Field Test of Finai VRLA Deliverable
An approximately 250-kW/500-kWh VRLA battery
deliverable was furnished by GNB for a field test at the
conclusion of its development program, The siteselected for this 4-yr test was the GNB lead recyclingcenter in Vernon, California, where a larger battery was
being assembled to support critical plant loads duringpower outages. The ESS Program deliverable wasincorporated into this larger 3.5-MW system and makesup about 10% of the battery cells.
A successful test was carried out in November 1995
that demonstrated the ability of the BESS to take over
from the local electric utility, support the recycling plant
load, and then synchronize with the utility feeder toreturn the load to the utility. Other data were collectedduring these trials to verify the plant load shed algo-rithm, to determine plant harmonics and the responsetime of the battery system, and to verify various BESS
1. EXECUTIVE SUMMARY I-5

operator and display panels, battery state-of-charge
(SOC) algorithms, and data screens.
PV/Hybrid Evaluation Project
Following a year-long search for an appropriate
utility test site for the Hybrid Power Processor and Con-
trol System (HPPCS), the Arizona Public Service Com-
pany (APS) has agreed to sponsor a 1- to 3-yr test pro-gram for the HPPCS at the APS Solru Test and Research
(STAR) Center. The HPPCS was developed by Omnion
Power Engineering under a program sponsored jointly
by SNL’S Energy Storage Systems Department and its
PV System Applications Department. Also included inthe APS field test program will be the evaluation of afuzzy-logic-based Adaptive Control Unit (ACU) devel-oped by Raydec under a contract administered by thePV System Applications Department.
Information Exchange
Work in the Information Exchange element concen-
trates on focused communication to promote interest in
energy storage and to provide forums in which ideas areshared, information is exchanged, and cooperativeprojects are initiated. Between March and September of
1996, the DOE Program team (the DOE ESS Program
Manager, the ESS program Manager at SNL, and anindustry expert) met with representatives of diverse divi-
sions of various organizations throughout the U.S. Alto-
gether, 15 meetings were held.
Many companies are very interested in power qual-ity as an application for storage in the next few years.Because of drastically reduced R&D budgets, manycompanies were interested in obtaining assistance fromthe DOE or from other organizations that deal in new
ways to approach these projects. Several companies
expressed interest in co-funding research projects with
the ESS Program, with the intent of collaborating on
possible projects in FY97.
1-6 1. EXECUT7VE SUMMARY

2. Analysis
Introduction
The purpose of the Analysis element is to identify
high-value benefits of energy storage in a wide variety
of utility applications. The activities in this element
have enabled utilities to quantify the usefulness of bat-tery storage and to make informed decisions regardingits suitability to their applications. Widespread accep-
tance of this technology by the utility industry will even-tually make it possible for utility planners to routinely
include energy storage in their planning scenarios. Such
acceptance is necessary for the eventual commercializa-
tion of this technology. There are three subelements in
the Analysis program element (1) system studies,
(2) feasibility studies, and (3) opportunities analysis.
The “system stucly” is an initial screening study
performed in collaboration with a host utility to identifyand evaluate the potential benefits of energy storage to
that utility. This screening-level study establishes arough estimate of the benefit-to-cost ratio of storage
using a limited examination of utility-specific operating
and financial data as a basis.
A follow-on “feasibility study” firmly establishes
the quantitative value of energy storage to a higher levelof confidence by examining detailed forecasts of utility
operating costs and other operational parameters for theentire operational life of the storage system. A site-specific conceptual design is included in the feasibility
study to determine the cost of the storage system neededto generate these benefits.
Using the findings of the system and feasibility
studies, the “opportunities analysis” (1) estimates the
benefits of bat~ry stcrage on a national level by identi-
fying the market size, specific applications, and timing
of the market and (2) defines the application require-ments at the system level and matches each battery tech-nology with application requirements that fit thebattery’s characteristics.
The Analysis ele~ment is based on the findings and
results of earlier Gateway and Opportunities Analysisstudies. The current studies focus on a need for further
quantification of application benefits and assessment ofthe penetration of battery storage systems into the utilitymarket. The overall. objective is to continue pursuingnew information in all of these areas to advance the pro-grammatic goals of the ESS Program. Most of the infor-
mation from these studies is also valuable to the indus-
trial partners of the ESS Program and supports their
entry into the emerging commercial market. As such,
these studies will be performed either with direct collab-
oration or with substantial input from one or more
industrial partners.
System Studies
Quantification of Utility Cost Savingsfrom Using Batteries - UMR
This task was activated during FY94 by placing a
contract with UMR to use EPRI’s DYNASTORE com-puter program to perform calculations of utility operat-ing costs with and without BES on the system. Operat-
ing cost savings are one important component of the
battery system costhenefit picture, along with thesystem capital cost and other projected utility benefits.
In this initial study, UMR calculated generating costs for
a medium-sized utility system that was not intercon-
nected with other utilities. The results of this work
showed that significant production cost savings could be
obtained by using a battery system for spinning reserve.
In FY95, a new contract was placed with UMR fora follow-on study to perform a similar operating cost
analysis for a grid-connected utility system. KCPL,which was selected as the subject for this new study, is a
typical Midwestern electric utility with many intercon-
nections and a mix of generating plants. The approach
was again to run a unit commitment program on energy
storage units along with generating units and calculate
operating costs with and without energy storage, so thatsavings could be quantified. In this case, a spreadsheetwas programmed to add fixed costs to the fuel and othervariable costs calculated by DYNASTORE. This wasdone to allow the utility to more easily check the calcu-lated costs against their actual operating costs for a base
case that did not include energy storage. These checkswere completed toward the end of FY95 with the con-
clusion that the agreement was close enough to considerthe model to be valid. Work therefore proceeded on
estimating the operating cost savings from the load-leveling, spinning-reseme, and frequency regulation
BES applications using DYNASTORE.
2. ANALYSIS 2-1

Status
Work on this project was completed during the third
quarter. A draft final report of the results was submitted
to SNL by UMR prior to a review meeting that was held
on June 12, 1996. Changes to the final report were
made by UMR in response to comments made at the
review, and a revision was submitted before the end ofJune. The results in the revised final report are summa-rized below.
The BESS parameters used for this study are listedin Table 2-1. The same charge and discharge capacities
were used; these ranged from 40 to 300 MW to include
the spinning-reserve requirement. BESS energy capac-
ity ranged from 1 to 8 hr in duration to cover the time
width of most load peaks.
As in earlier analyses of isolated utility systems,
annual operating cost savings were calculated for two
different years, in this case 1995 and 1996. The BESS
applications studied were spinning reserve, load leveling
only, load leveling with spinning reserve, and frequencycontrol. For all except the spinning-reserve application,
the production cost savings were found to increase
almost linearly for the range of BESS sizes considered.
The study demonstrated that a BESS can providesavings in operating costs for a typical Midwestern util-ity (summer-peaking). The following is a breakout of
how each application performed
1. For spinning reserve only, savings increased
with MW capacity up to the spinning-reserve
requirement of 6~o, which is approximately
180 MW for the KCPL system. The savings
then leveled off and decreased slightly as BESScapacity was increased to 300 MW (see Figure2-l). It was assumed for this study, based onexperience with other utility applications, thata BESS of 1-hr duration is sufficient for
spinning reserve. It follows that a BESS dura-
tion of 4 or 8 hr affords no more savings than
the l-hr duration, i.e., the smaller-durationBESS provides more savings per dollar cost
than do larger-duration (larger energy capacity)
systems.
2. For load leveling only, the savings were not
significant for a short-duration BESS of 1 hr orless even if the BESS size is increased from 40
to 300 MW, the savings were not very large
(Figures 2-2 and 2-3). Conversely, as BESS
energy is increased from 1 hr to 8 hr in dura-
tion, savings do increase significantly, because
the BESS is able to shave peaks of longer time
duration; therefore, the BESS is committed to
more peak-shaving time by the DYNASTORE
unit commitment algorithm.
3. For load leveling with spinning reserve, the
curves for savings are flatter than for load
leveling only, with generally small increases in
savings for longer durations (see Figure 2-4).A small-capacity BESS tends to be more valu-
able for spinning reserve, whereas a large-
capacity BESS tends to be more valuable for
load leveling. The saturation of spinning-reserve savings for a BESS size above200 MW is consistent with the 6% spinning-
reserve requirement (177 MW for a KCPLsystem peak of 2947 MW).
4. Of all the BESS applications, frequency regula-
tion yields the greatest savings for this utility(Figure 2-5). The savings increase withincreases in BESS MW size up to approxi-mately 300 MW. For frequency regulation, al-hr BESS is adequate because of the NorthAmerican Elecrnc Reliability Council (NERC)
Table 2-1. BESS Parameters
Discharge Capacity Variable: 40 MW-300 MW
Charge Capacity Variable 40 MW-300 MW
Variable O&M Cost 0$/MWh
Efficiency (AC-DC-AC) 7570
Energy Storage Duration Variable: 1-8 hr
,,
2-2 2. ANALYSIS

(nm
~
Simulation Method; Deterministic
3800% 20 OMli
3600[ ‘n 1-
300MWJ
34003200
t3000
2200*~1800 ~------+ 40MW
I2345678
Duration (hours)
Figure 2-1. BESS Used for Spinning Reserve Only (1995).
I Sbd-iOXA Mo=hod: Do~ticI&al Diapa%a& opira120zz I
4500-)300MW
4000-”“ 1
3500-! /3000-” /
I2500--
2000”4 1
15ilo”-
5CICI
1 234
Duration5678
(hours)
Figure 2-2. BESS Used for Load Leveling Only (1995).
.
2. ANALYSIS 2-3

Sinznia&orLt@dLoa: De~%ic
Idael QispaS=h operation
4000
3500 ‘
3000
2500
2000
15tlo
1000-
-.1234
Duration6 7 8.
(h%rs)
Figure 2-3. BESS Used for Load Leveling Only (1996).
Sixndation Method: Deterministic
Ideai Dispatch operation
60005500 300MW
J
50004500 200MW
I
4000--3500- 100MW
13000 j
2000 ‘1500 L1000 ! i i I I 1 I I
1 234567 8
Duration (hours)
Figure 2-4. BESS Used for Load Leveliig, Including Spinning Reserve (1995).
2-4 2. ANALYSIS

8000
f~ ‘
1996
- 7000 1995g~ 60(30
.= 5000.
$ 4000F
.
~ 3000
& 20C)(’J
1000$-50
I1(k 150 Ao
i I250 300
BESS Size (MVV)
Figure 2-5. BESS Used for Load Frequency Control.
requirement that area control error (ACE) becontrolled to zero every 10 min. Results showthat the greatest savings are for the frequency
regulation application, amounting to
$4M in 1996 for a 1OO-MW BESS.
Mid-Voltage Power Quality DeviceProject
The purpose of this project is to develop a
about
power
quality device capable of protecting large power-qual-ity-sensitive facilities from the adverse effects of utility
power system disturbances. Mid-voltage power quality
devices are a means of preventing disturbances on theupstream utility grid or downstream feeders from affect-ing the bus voltage by isolating the bus from the distur-
bance. A Demonstration-Unit Siting Study was con-
ducted in FY95 that identified Substation 41 at SNL asthe ideal location for testing the device.
As part of the long-range vision for the ESS Pro-gram, the demonstration site for the mid-voltage powerquality device has evolved into the concept of the
National Energy Storage Test (NEST) Center. As envi-sioned, the mission of the NEST Center would be toevaluate the suitability of storage technologies including
batteries, capacitors, and flywheels as energy sources forthe mid-voltage power quality device concept.
Work in FY96 focused on incorporating the mid-
voltage power quality device concept into the design of
Substation 41 and on further conceptual development of
the NEST Center.
The project team established the work program for
1996 using as a basis the following lessons learned ffomthe projech
There is a market need for a medium-voltage,
utility-substation-level power quality device.Market demand, however, is dependent on awell-thought-out, well-publicized, and success-
ful demonstration of the system.
Market demand is also highly dependent on
cost, and reducing cost is as important as suc-cessfully demonstrating the technology.
Potential user industries, such as the semicon-
ductor manufacturing industry, are unwilling totest a prototype device at their facilities.
Finding funding and support from governmentand industry for a $ 17M demonstration project
2. ANALYSIS 2-5
.— —

to build a first-of-its-kind SMES-PACTWnid-
voltage power quality device is impossible given
the economic realities of the day. This estimatewas for a 20-MW device with a 40-to-50-MJ
SMES.
These findings led the project team to focus on
developing a proposal for a demonstration project that is
meaningful yet supportable. It was determined that the
following attributes represented a meaningful and sup-
portable demonstration of the technology:
“ The device must be demonstrated at a voltage(15-kV class) and power (10-12 MW) that make
it unique from the products available on the mar-ket today. Although it was initially desirable todemonstrate something in the 20-MW class, by
reducing the power to 10-12 MW the cost can be
reduced while still maintaining a size larger than
that of currently available products.
● The device should be applied on the utility sideof a medium-voltage substation. This differenti-
ates the device from the customer-based powerquality products that are available in the market-place today.
● The device should be demonstrated at a site that
serves facilities that are sensitive to power qual-
ity problems and disturbances and emulates the
power quality needs of high-tech industrial facil-
ities.
“ The total cost of the project should be on theorder of $5-6 M (or less if possible) amortizedover 2-3 yr. Although this cost ceiling was
arrived at somewhat arbitrarily, it is a target thatseems necessary given the funding consider-ations and cost requirements of the market.
● The project should be cost-shared by gover-
nment and industry.
● The storage technology is not sacrosanct (i.e., itdoes not have to be SMES). It was determined
that the project team would choose the mostappropriate storage technology with primaryconsideration given to minimizing the cost andrisk. Demonstrating a medium-voltage powerquality device at a reasonable cost was more
important to the project’s success than that a
particular storage technology be chosen.
The DOE has verbally approved the baselinechange request for the construction of Substation 41 at
SNL/NM. This substation is scheduled for completionin March 1998. An initial meeting with SNL Facilities
personnel has been held. The purpose of the meetingwas to explore the possibility of demonstrating the pro-posed power quality device on Substation 41. During
that meeting, the following criteria were developedjointly by the power quality project team and facilitiespersonnel:
During startup of the device, only those facilities
that have agreed to accept the risk (and potential
benefit) of such a device should be fed fromSubstation 41. It was agreed that the power
quality project team approach representatives
from the Microelectronics Development Labora-tory (MDL) and the Robotics ManufacturingScience and Engineering Laboratory (RMSEL)as potential user facilities.
The system will need to be designed in such a
way that the power quality device can be by-
passed.
Facilities retains the right to bypass the powerquality device at any time and return the substa-
tion to “normal” operations in the event that theyneed the capacity to meet their load require-
ments.
The other significant development is that the project
team members, LANL, PNM, CRE, and SNL, have
identified at least one manufacturer who is interested in
and appears capable of developing a medium-voltage,
substation-level power quality device and demonstrating
it at SNL. Initial discussions with this manufactureralso indicate that the project constraints outlined above(COSU $5-6 million; and schedule: installation to coin-cide with the completion of Substation 41 in March1998) are not unreasonable. The project team’s objec-tive over the next several months will be to develop aspecific project proposal for designing, building and
testing a medium-voltage, utility-substation-level
power quality device. Work will also continue on devel-
oping a plan for testing the device on Substation 41 at
SNL.
Status
PNM has taken the lead role in exploring and evalu-
ating potential collaborators and investors. PNM and
CRE are also now reviewing the economic viability andcommercialization potential of the mid-voltage power
quality device concept. Indications at this point are thatPNM will aggressively continue pursuing the project;PNM has asked SNL to step up its efforts in determiningwhether PNM will be chosen as the host site for the
demonstration project and what its interesw and rolewill be as a major stakeholder.
2-6 2. ANALYSIS

As a result of the increased interest by PNM, SNLhas initiated upper-level discussions (Director and VP
levels) with the major internal stakeholders that would
be involved with the project and is now assessing their
interest in and requirements for participation in theproject. The internal stakeholders who have been con-
tacted include representatives from Facilities, the MDL,and the RMSEL and the Vice President of the Energy
and Environment sectcr. All preliminary indications arethat SNL is willing to continue exploring the possibili-ties; SNL plans to formulate a special task team to quan-
tify stakeholder issues and begin the negotiation process
with PNM.
In parallel with tlhese efforts, ESS personnel have
initiated more detailed discussions with representatives
from SNL Facilities about the requirements for integrat-
ing a Mid-Voltage Polwer Quality Device Facility intoSubstation 41. Facilities representatives are now re-viewing the draft SOW submitted by ESS personnel.
Chugach and SIMUD Feasibility Studies
Work on both the Chugach and Sacramento Munic-
ipal Utility District @MUD) Feasibility Studies was
completed in 1995. Most of the Chugach study is sup-
ported by EPRI through collaboration with Chugach and
by ESS funding, which supports a smaller portion of thetotal work. The EPR1[ funding includes funds for evalu-ating the benefits and economics of BES systems as wellas those of SMES. This work compares the costs and
benefits of both technologies for the same applications.
The results of the studies will be available only to the
subscribing members of EPRI. The ESS funding is used
to support only the battery storage portion, and the
results for this portion will be publicly available. Con-
sequently, the final report will be divided and issued intwo separate volumes, each covering the respective
scopes. Because of the narrow focus of the ESS fund-ing, the report ,$hatwill be delivered to the ESS Programwill be a shortened version of the full EPRI report.
However, in order to preserve continuity and coherence,there will be appropriate text to explain the link betweenthe two efforts, and the results will be cross-referencedas much as possible. The intent is to make each report
as self-contained as possible.
Status
Chugach issued a draft final report for review by
both the ESS Program and EPRI staff. It is expectedthat the reviews will be completed in late 1996 and afinal report for the ESS Program portion will be releasedin Spring 1997.
The SMUD report was completed and sent to
SMUD in April 1995 for review and comment.
Market Feasibility Study
The Market Feasibility Study is based on the results
of the Opportunities Analysis performed earlier. Thisstudy was designed specifically to quantify the expectedenergy storage penetration into the utility market. The
Opportunities Analysis, which was completed duringFY95, characterized the opportunities for batteries to
provide electric utility energy storage (uES) options.
The study indicated that the implementation of BES sys-
tems on both sides of the utility meter could result in
benefits of $57 billion bemveen 1995 and 2010 for U.S.
utilities and the nation. However, the potential benefits
described in this analysis are more than an order ofmagnitude greater than those that can be realized by themarket as it exists today, thus raising the question ofwhether there is indeed a significant market for BESsystems. A Market Feasibility Study was performed in
FY96 to determine if enough potential markets exist to
motivate BES businesses to make the investment neces-
sary to develop viable products.
status
Frost & Sullivan conducted the survey throughrespondents in several “pools” comprised of elecrncityproviders, BESS vendors, regulatorslconsultants, andother technology advocates. The electricity providerpool broadly includes IOUS, IPPs, and cooperatives.
About 65 contacts were identified and participated in
this survey.
The perceptions of the present and future roles of
BES differ significantly depending on the group or orga-nization. The electricity provider’s perspective can be
best categorized as cautiously optimistic. On the whole,electricity providers see roles for BES, especially in dis-tributed generation and power quality, but theyexpressed significant concerns about BES costs, lifespan, maintenance, and energy density.
Electricity providers expect to increase their use of
BES in the future, but they would like to see the short-
comings of the technology addressed and believe this isnecessary to make widespread deployment of BESpossible. As a result of concerns about the technology’s
shortcomings, BES is not currently viewed as beingcompetitive with most generation technologies. In par-ticukw, electricity providers expect combustion turbinesto provide better functionality over time than BES.However, interest in fuel cells was high, and batteriesreceived considerable support because of their modular-
2. ANALYSIS 2-7

ity, responsiveness, and especially their environmental
friendliness.
During the course of the survey, respondents werequestioned four times on the potential applications for
which they might use BES. Table 2-2 and Figure 2-6
illustrate some of the responses to this question and
show that power quality and reliability were the most
commonly cited applications for BES.
Currently, BES products in the marketplace are
based on either flooded lead-acid or VRLA battery tech-nologies. In the near future, through 2000, most BES
suppliers do not expect to move to different battery tech-nologies, although they expect to further refine theirpower conversion technologies.
Perceptions of BES technology also varied widely
between those that felt that existing BES technology
was adequate and those that felt it was inadequate. As
expected, those that supported existing BES technology
tended to be organizations that were not aggressively
developing advanced batteries and power conditioning
equipment. Most respondents agreed that further
advances in power conditioning and utility connectionequipment could be made.
Surveyed regulatory agencies and industry groups
provided the other industry perspectives in this study.
Input from both types of organizations provides impor-
tant supporting information for the conclusions reached
in this study.
The responses received from regulatory agenciesindicate that they do not have an established position onBES. Regulatory agencies receive little information orfeedback from utilities, BES suppliers, or other organi-zations and do not view BES as a major issue. Whenthey do receive information, it is primarily about com-
bustion turbine and renewable technologies. Regulatorsconcluded that market-based solutions focusing on eco-
nomic costs and benefits will likely prevail, and theprospects for regulatory agencies using their influence to
champion BES deployment are minimal.
The other industry groups that Frost & Sullivancontacted during this study were various organizationswith an interest in the electric power industry and theuse of BES. Examples of such organizations are theNational Rural Electric Cooperative Association(NRECA), the Environmental Defense Fund, and theNational Association of Utility Regulatory Commission-
ers. These industry groups had more specific percep-tions of BES than the regulatory agencies.
Many of the groups viewed BES as an importantenabling technology to facilitate the use of renewable
energy or to solve power quality and asset utilization
issues. These groups tended to be more focused on BESand maintained personnel that attempted to keep track
of developments in BES markets and technologies.
BES Market Opportunities and Forecasts
The responses from the 21 utilities were compiled
and extrapolated to the U.S. industry as a whole. The
extrapolation used a formula based on each utility’s per-
centage share of industry output and capacity. A similar
method was used to extrapolate the electricity end-userBES demand estimates that Frost& Sullivan made usingthe responses of contacted BES suppliers and consult-ants. These figures are presented with the electricityprovider estimates (Tables 2-3 and 2-4) to give a clearer
picture of the entire BES market in a given year.
BES Market Penetration Estimates
Table 2-3 shows the estimated penetration of BESinto the electricity provider industry. Sales are projected
to climb from about $24 million in 2000 to about $287million in 2010.
Table 2-4 shows the estimated penetration of BESfor electricity end users. These results are based on pro-
jections given to Frost & Sullivan by BES suppliers.
BES revenues in this segment are forecast to be about
$372 million in 2000 and about $434 million in 2010.
Primary Market Drivers
Power quality was already identified by respondents
as the major application for BES. This application willprobably become even more important as electronics areincreasingly used in businesses and global competition
places a greater emphasis on avoiding downtime. BESis already used in this application in the form of existinguninterruptible power supply (UPS) systems and serial
power systems.
Distributed generation is another driver of the BES
market. BES’S modularity makes it more appropriate fordeployment in distributed sites. Although not many dis-tributed generation projects are currently being con-ducted, the number of these projects should increase inthe future.
BES is a technology that does not produce noise orharmful emissions. It can be used in settings and envi-ronments where current generation technologies would
be difficult or impossible to site. Electricity providerscited these benefits as some of the major advantages ofBES.
2-8 2. ANALYSIS

.
Table 2-2. BES: Value-Added Applications (30 Companies), 1996.
Times ApplicationApplication Mentioned
Area/Frequency Control 3
Black Start 1
Customer Demand Peak Reduction 5
Distribution Facility Deferral 6
Emergency Shutdown Power 1
Frequency Control 1
Frequency Regulation 2
Generation Capacity Deferral 5
Generation Dispatching 4
Load Conditioning 1
Load Following 1
Load Leveling 10
Out of Step Prevention 1
Peak Reduction 2
Power Quality 14
Reliability 12
Renewable 5
Spining Reserve 8
Transmission Facility Deferral 5
Transmission Line Stability 2
Transmission Stability Enhancement 2
Transmission VAR Support 2
UPS 10
Voltage Regulation 7
Another advanm,ge of BES cited by electricity pro-
viders is the elimination of fuel supply issues associatedwith generation technologies. This is because BES, by
definition, does not require fuel.
Growth in the use of renewable energy should also
drive the BES market, BES can be used in conjunctionwith renewable energy sources to “firm” electric power
delivery from these sources. For example, BES could
store power generated from solar generation to maintaina constant power output even at night.
BES Cost Improvements Desired
The first and foremost conclusion of this study is
that an overwhelming consensus exists among the elec-rncity providers surveyed that significant improvementsin BES cost profiles are needed.
2. ANALYSIS 2-9

Times Application Mentioned
Ars@Frequency Control
Black StattCustomer Demand Peak Reduction
Disbibution Facility DeferralEmergensy Shutdown Power
Frequency ControlFrequency Regulation
Generation Capacify DeferralGeneration Dispatching
Load ConditioningLoad FollowingLoad Leveling
Out of Step Prevention
Peak ReductionPower Quality
ReliabiliiRenewable
Spinning ReserveTransmission Facilii Defemal
Transmission Stability Enhancement
Transmission Line StabiliiTransmission VAR Suppon
Unintetmpiible Power Supply (UPS)Voltage Regulation
o 2 4 6 8 10 12 14
Figure 2-6. BES: Value-Added Applications (30 Companies), 1996.
Table 2-3. BES Market: Penetration Statistics Among Electricity Providers (US.),2000,2005, and 2010
Year MW ($MiIIion)
2000 27 24
2005 215 129
2010 573 287
In particular, issues pertaining to the capital cost ofBES are considered paramount. Currently available per-
kilowatt BES costs run two to three times the per-kilo-watt cost of combustion turbines. Maintenance costs arealso of interest to electricity providers. These costsinclude not only the actual costs of maintaining a BES
but the perceived costs as well. These perceived costscan best be thought of as the “headaches” that respon-dents expect from a BES system. For example, several
electricity providers stated in their responses that even
though their organizations had no direct experience withBES, they had heard that the maintenance issues associ-ated with the batteries in a BESS made the cost prohibi-tive.
The results of the survey also show that electricityproviders desire improvements in BES energy density,maintenance characteristics, and life span. These tech-nical issues are secondary to BES cost issues, although
they are important in their own right. Energy densityaffects capital cost and the use of BES in some applica-tions and sites. Maintenance issues center on improve-
ments in BES battery technology. To better offset highcapital costs and be more competitive with other distrib-
uted generation technologies, current expected BES life
spans of 6 to 10 yr must be improved.
The Puerto Rico Electric Power Authority (PREPA)system was cited as a success. The PREPA system wasactually chosen over combustion turbines, which seems
2-1o 2. ANALYSIS

Table 2-4. BES Market: Penetration Statistics Among ElectricityEnd Users (U.S.), 2000,2005, and 2010
Year MW ($Million)
2000 496 372
2005 805 443
2010 965 434
to be the greatest threat to BES’S success. However,
even in the PREPA case, the utility itself had to perform
the project integration, using equipment from several
manufacturers, including some that will not offer thoseproducts in the future.
The result is a successful system, but one that no
BES supplier is likely to provide to customers. Because
nobody but PREPA has “ownership” of the product in
use at PREPA, no organization is marketing it. This is
the case even though the PREPA frequency regulatiotdspinning-reserve application is one that many utilities in
the United States need and might be interested in.
The BES market is currently developmental and theindustry faces significant challenges. Nonetheless, theresults of this study indicate that a market for BES at the
electricity provider level does exist. This market is cur-rently self-perpetuating at the nationaI level, but at a
lower than desired level of activity.
Projects such as those currently planned in Puerto
Rico and Alaska should continue into the foreseeable
future. With the development of better BES technolo-
gies and the resolution of concerns and issues, the BESmarket has the potential to be significantly larger.
Storage System Cost Study
The purpose of the original contract, which wasplaced with Sentech, Inc., was to conduct a cost analysis
of energy storage systems for electric utilities that would
document the cost of battery storage systems built and
installed to date. As the battery storage systems portionof the study was completed, the scope of the study wasredefined to require alcost comparison and projection onall storage technologies, including batteries, FES, andSMES. To accomplish this task, a survey questionnairewas designed to obltain all relevant cost information
from a select cross section of industry leaders in theareas of batteries, flywheels, and SMES.
For existing battery storage systems, such as those
of the Chino substation and PREPA, the distribution of
subsystem costs is not well understood. This made it
difficult to compare project costs on a uniform basis,The Opportunities Analysis study acknowledged this
difficulty and recommended a standardized cost struc-ture that would make it easier to conduct uniform
project cost comparisons. Due to the age of some of the
earlier battery demonstration projects, such as those at
Chino and Crescent, the corporate history that reports
the true system costs is rapidly disappeting. The Stor-
age System Cost Study was initiated with three objec-
tives:
1.
2.
3.
Gather the most reliable cost estimates for allthe existing battery projects in the U.S.
Estimate the current capital cost for storage
systems using all three storage technologies:
batteries, flywheels, and SMES.
Estimate the system cost reduction that may be
realized through future reductions in subsystem
costs.
Status
Utilities and suppliers were contacted to ascertain
the costs of projects according to the detailed categoriessuggested by the Opportunities Analysis study. Theexpectation was that this standardized format could be
used for future storage projects, and that it could provide
a basis for comparison of different storage technologies.
In order to maintain supplier confidentiality,detailed costs were aggregated into three categories: thestorage subsystem, the power conversion subsystem,and the balance of plant. Some of the data collectedprovides cost breakdown in a percentage form. BESproject cost information was obtained for the followingprojects:
2. ANALYSIS 2-11
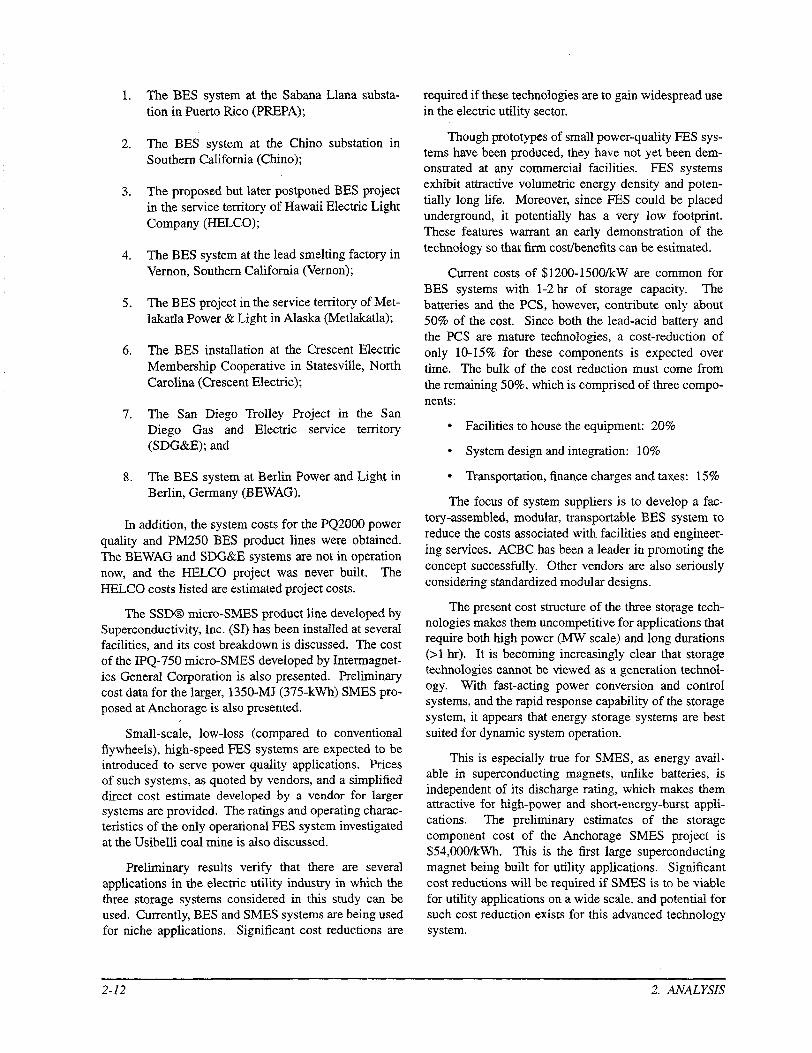
1.
2.
3.
4.
5.
6.
7.
8.
The BES system at the Sabana Llana substa-
tion in Puerto Rico (PREPA);
The BES system at the Chino substation inSouthern California (Chino);
The proposed but later postponed BES project
in the service territory of Hawaii Electric Light
Company (HELCO);
The BES system at the lead smelting factory inVernon, Southern California (Vernon);
The BES project in the service territory of Met-
Iakatla Power& Light in Alaska (Metlakatla);
The BES installation at the Crescent Electric
Membership Cooperative in Statesville, North
Carolina (Crescent Electric);
The San Diego Trolley Project in the San
Diego Gas and Electric service territory(SDG&E); and
The BES system at Berlin Power and Light inBerlin, Germany (BEWAG).
In addition, the system costs for the PQ2000 power
quality and PM250 BES product lines were obtained.
The BEWAG and SDG&E systems are not in operation
now, and the HELCO project was never built. The
HELCO costs listed are estimated project costs.
The SSD@ micro-SMES product line developed bySuperconductivity, Inc. (S1) has been installed at severalfacilities, and its cost breakdown is discussed. The cost
of the IPQ-750 micro-SMES developed by Intermagnet-
ics General Corporation is also presented. Preliminarycost data for the larger, 1350-MJ (375 -kWh) SMES pro-posed at Anchorage is also presented.
Small-scale, low-loss (compared to conventionalflywheels), high-speed FES systems are expected to beintroduced to serve power quality applications. Pricesof such systems, as quoted by vendors, and a simplified
direct cost estimate developed by a vendor for largersystems are provided. The ratings and operating charac-teristics of the only operational FES system investigatedat the Usibelli coal mine is also discussed.
Preliminary results verify that there are several
applications in the electric utility industry in which the
three storage systems considered in this study can beused. Currently, BES and SMES systems are being usedfor niche applications. Significant cost reductions are
required if these technologies are to gain widespread use
in the electric utility sector.
Though prototypes of small power-quality FES sys-tems have been produced, they have not yet been dem-onstrated at any commercial facilities. FES systemsexhibit attractive volumetric energy density and poten-
tially long life. Moreover, since FES could be placed
underground, it potentially has a very low footprint.
These features warrant an early demonstration of the
technology so that firm costfbenefits can be estimated.
Current costs of $1200- 1500/kW are common forBES systems with 1-2 hr of storage capacity. The
batteries and the PCS, however, contribute only about
5070 of the cost. Since both the lead-acid battery andthe PCS are mature technologies, a cost-reduction of
only 10-1570 for these components is expected over
time. The bulk of the cost reduction must come from
the remaining 50’%0,which is comprised of three compo-
nents:
“ Facilities to house the equipment: 20%
● System design and integration: 10%
* Transportation, finance charges and taxes: 15%
The focus of system suppliers is to develop a fac-
tory-assembled, modular, transportable BES system toreduce the costs associated with facilities and engineer-
ing services. ACBC has been a leader in promoting the
concept successfully. Other vendors are also seriously
considering standardized modular designs.
The present cost structure of the three storage tech-nologies makes them uncompetitive for applications thatrequire both high power (MW scale) and long durations
(>1 hr). It is becoming increasingly clear that storagetechnologies cannot be viewed as a generation technol-ogy. With fast-acting power conversion and control
systems, and the rapid response capability of the storagesystem, it appears that energy storage systems are best
suited for dynamic system operation.
This is especially true for SMES, as energy avail-able in superconducting magnets, unlike batteries, is
independent of its discharge rating, which makes themattractive for high-power and short-energy-burst appli-cations. The preliminary estimates of the storage
component cost of the Anchorage SMES project is
$54,000/kWh. This is the first large superconductingmagnet being built for utility applications. Significantcost reductions will be required if SMES is to be viable
for utility applications on a wide scale, and potential forsuch cost reduction exists for this advanced technologysystem.
2-12 2. ANALYSIS

BES and SMES are more competitive for power
quality applications fcmtwo primary reasons. First, the
power quality problems experienced by industry arevery similar in nature, and therefore a uniform product
line can be developec[ and marketed, achieving econo-mies of scale. Second, because of the large economic
losses caused by power supply perturbations, industries
are willing to invest substantial amounts in equipment to
shield them from these perturbations. The increasing
sensitivity of customer machinery to these disturbancespresents a growing market for protection systems. Costprojections indicate a 10-20% cost reduction for BES,
and a 30-40~o reduction for SMES systems in this appli-
cation. Cost reductions through technology improve-ment and volume manufacture are essential for the com-
petitiveness of all the technologies and system
components.
The power conditioning system (PCS) presentlycosts -$300/kW in energy storage systems and is not
projected by industry to drop by more than 10%. On theother hand, the power quality application market expectsthe price to drop by 25 to 40Y0. The concept of the mod-
ular PCS is now being promulgated as a way to drivePCS cost down. A m[odular PCS ii composed of many
small converters that are networked in parallel (using
software) to achieve the same power rating of a single
large converter, but benefits through the economies ofmass production. The individual units, if designed to
operate with a sufficient degree of autonomy, can beresealed dynamically. This offers the advantage of
redundancy and on-line maintenance. High efficiencycan be maintained at low-power throughputs, because
only the minimum required number of power converters
need to be energized. Hence modular PCSS are
expected to provide solutions at a lower cost with better
redundancy, reliabili~y, and efficiency.
Note that when comparing the three technologiesfor customer-end power quality applications, the energy
storage capacity is specified in megajoules, while kilo-
watt-hours were usedl for all other applications. Tables
2-5 and 2-6 summarize the costs of the projects that arecurrently using these three technologies, as well as thestorage system products.
PV Battery and Charge ControllerMarket and Applications Survey
This study is being conducted using a survey
designed and implemented under a contract with ASU.The survey is being sent to industry representatives whodesign and integrate stand-alone PV systems. It willattempt to determine what types of and how manybatteries are currently used in the stand-alone PV mar-
ket. The survey also polls system integrators on their
method of specifying batteries and charge controllers forthe systems they design. ASU performed a similar,
related survey in 1992 for SNL’S PV group.
Status
The contract to conduct a PV battery and charge
controller market and applications survey was placedwith ASU in June of 1995. The purpose of the survey
was to:
.
●
●
.
.
Quantify the market for batteries shipped with
(or for) PV systems in 1995, and estimate the
PV battery market through the year 2000.
Quantify the PV market segments by battery
type and application for PV batteries, and estab-
lish present and future battery-use patterns.
Characterize and quantify the charge controllersused in PV systems and find out what the con-troller industry’s perception is of their rolewithin the PV and battery subsystem industries,
and what their contribution to large and small
PV battery systems might be.
Characterize the operating environment for
energy storage components in PV systems.
Provide an information base that bridges thecommunication gap that currently exists
between battery manufacturers, PV systemdesignerslusers, and charge controller manufac-turers.
To meet the stated purpose of the survey, the con-
tract SOW directed ASU to develop a survey to solicit
industry perspectives, responses from which would be
compiled in an electronic database and used as a mend
analysis tool. SNL also provided the following criteriadefining the size and number of design companies andmanufacturers to be surveyed:
● Survey up to 30 PV system designers. A broadresponse from PV system designers, represent-ing all areas of the electrical energy industry thatuse storage and PV as subsystems, was antici-pated and received. The following criteria were
applied in the selection of PV system design
participants:
. Twenty small system integrators (SoloPower
size)
“ Seven+ (7 min-10 max) large system integra-tors (Photocomm size).
2. ANALYSIS 2-13
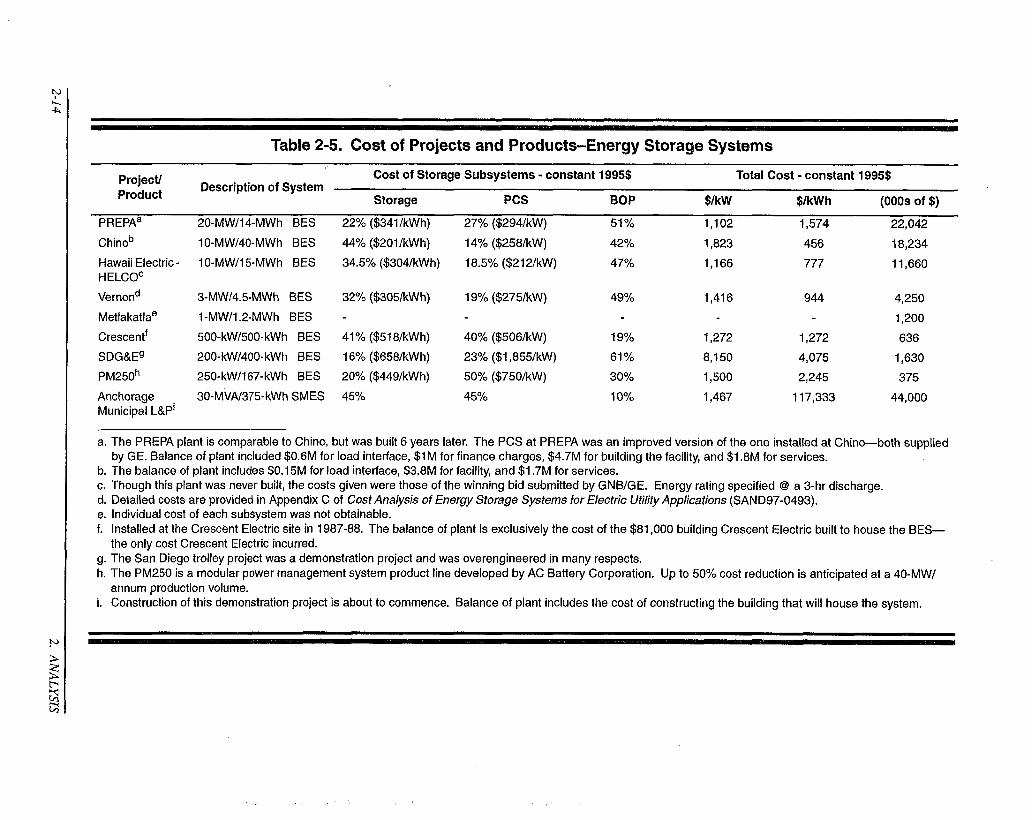
Table 2-5. Cost of Projects and Products-Energy Storage Systems
Project/ Cost of Storage Subsystems - constant 1995$ Total Cost - constant 1995$
ProductDescription of System
Storage Pcs BOP $lkW $lkWh (000s of $)
PREPAa 20-MW/14-MWh BES 22% ($341 /kWh) 27% ($294/kW) sly. 1,102 1,574 22,042
Chinob 10-MW/40-MWh BES 44% ($201 /kWh) 14% ($258/kW) 42°/0 1,823 456 18,234
Hawaii Electric - 10-MW/l 5-MWh BES 34.5% ($304/kWh) 18.5% ($212/kW) 4770HELCOC
1,166 777 11,660
Vernond 3-MW/4.5-MWh BES 32% ($305/kWh) 19% ($275/kW) 49% 1,416 944 4,250
Metlakatlae 1-MW/l .2-MWh BES - 1,200
Crescentf 500-kW/500-kWh BES 41% ($51 8/kWh) 40% ($506/kW) 19% 1,272 1,272 636
SDG&E9 200-kW/400-kWh BES 16% ($658/kWh) 23% ($1 ,855/kW) 61% 8,150 4,075
PM250h
1,630
250-kW/l 67-kWh BES 20% ($449/kWh) 50% ($750/kW) 30% 1,500 2,245 375
Anchorage 30-MVAf375-kWh SMES 450/0 450/0 1070 1,467 117,333 44,000Municipal L&Pi
a.
b.c.d.
;“
9.h.
i.
The PREPA plant is comparable to Chino, but was built 6 years later. The PCS at PREPA was an improved version of the one installed at Chino—both suppliedby GE. Balance of plant included $0,6M for load interface, $1 M for finance charges, $4.7M for building the facility, and $1 .8M for services.The balance of plant includes $0.15M for load interface, $3,8M for facility, and $1 .7M for services.Though this plant was never built, the costs given were those of the winning bid submitted by GNB/GE. Energy rating specified @ a 3-hr discharge.Detailed costs are provided in Appendix C of Cost Ana/ysis of Energy Storage Systems for Electric Uti/ity App/icatiorrs (SAND97-0493).Individual cost of each subsystem was not obtainable.Installed at the Crescent Electric site in 1987-88. The balance of plant is exclusively the cost of the $81,000 building Crescent Electric built to house the BES—the only cost Crescent Electric incurred.The San Diego trolley project was a demonstration project and was overengineered in many respects.The PM250 is a modular power management system product line developed by AC Battery Corporation. Up to 507!. cost reduction is anticipated at a 40-MW/annum production volume.Construction of this demonstration project is about to commence. Balance of plant includes the cost of constructing the building that will house the system.
..
N&Q1
Table 2-6. Cost of Projects and Products-Power Quality Systems
Power QualityCost of Storage Subsystems - constant 1995$ Total Cost - constant 1995$
ProductsDescription of System
Storage Pcs BOP $lkW $IMJ (000s of $)
PQ200@ 2-MW/l O-see Power Quality BES 9% 65% ($31 6/kW) 26% 495 49,450 899
SSD@ 8-MJ Power Quality SMES s~~o SO% Br)% 300- 600f 300,000 2,400
lPQ-750@c 750-kVA16-MJ SMES . . . . .- 1,300 170,000 1,000
20CI oomd 1-kW/7.2-MJ FES 2,000 278 29
WFCe 1.5-kW/0.36-MJ FES .. . . -. 6,666 27,778 10h
20-kW/l 0.8-MJ FES .. . . . . 2,650 4,907 53h
a, The PQ2000 was built by AC Battery Corporation. A high discharge rate distorts battery costs when specified in $/kWh. The PCS cost includes the converterand the static switch. Balance of plant includes cost of delivery, installation and startup. The energy stored in the 2-MW system for 10 sec is equivalent to 20 MJfor purposes of comparison with SMES power quality systems.
b. The SSD units were developed by Superconductivity, Inc. Because the duration of operation is limited by the energy stored in the superconducting magnet, an8-MJ system can have multiple ratings.
c. Intermagnetics General Corporation product cost projections. Estimated annual operating cost $55,000. Like most other SMES products, this unit has a range ofoperating characteristics. Compared to the S1 system, the IPQ-750 has a smaller converter.
d. A product developed by SatCon Technology Corporation. The 1-kW/2-kWh flywheel rotor is being developed by SatCon for telecommunication applications.e. The World Flywheel Consortium product line.f. Assuming an 8-MW rating for 1 sec of protection and a 4-MW rating for 2 sec of protection.g. Targeted cost for production volumes in the lower thousands, additional cost of $500-$1,000 expected to be incurred for installation.h. The price for a single product. Lower costs are anticipated for volume purchase.
s Survey 10 battery manufacturers, representing
flooded lead-acid (calcium and antimony chem-istries) and VRLA technologies. Manufacturers
of other rechargeable technologies may also beconsidered for the survey.
● Survey 10 charge controller manufacturers (5large, 5 small) representing a cross section of
typical charge controllers currently in use for PV
applications.
During the first quarter of FY96, the surveys were
defined and assembled by a team of ASU and SNL bat-
tery and PV engineers. During that time, a list of partic-ipants was identified. The survey was to cover calendaryear 1995, which required that they be sent out to theselected participants early in the second quarter of
FY96. The surveys were sent out and returned in thesecond quarter of FY96.
In the same quarter, a meeting was held at ASUwhere the initial responses from the survey were
reviewed. Of the 29 PV system integrators who were
polled in the survey, over 70% returned their surveys. Inaddition, 9 of 10 battery manufacturers and 8 of 10charge controller manufacturers responded, indicating a
high level of interest in the information that was beingcollected in the survey. During the second quarter, the
data was posted to a PC database where it was used todetermine the statistics for the survey. It was also corre-lated with data from a 1992 survey to develop trend data
that could be extrapolated to predict growth in battery
sales in the PV marketplace.
Initial review of the information provided by charge
controller manufacturers indicated that, in general, oldattitudes about batteries being “just batteries,” to beregarded much like automotive batteries, were changing.The new evidence indicates that the charge controller
manufacturers are envisioning batteries in cycling appli-cations where charge control is essential to maintaining
a good state ofhealth (SOH) for PV batteries. New con-trol schemes were being implemented to more precisely
control the charge process for the various lead-acid tech-
nologies and chemistries. The new attitude exemplified
by these changes is expected to result in an overallimprovement in battery performance in PV systems.
Under the contract, results from the survey werescheduled for publication by June 30, 1996. However,
an inordinate amount of time was required to eliminateconflicts in data reported, resulting in an initial contractextension to September 6, 1996. A no-cost second
extension was issued in early September to the end of
the first quarter of FY97 to allow for the final verifica-tion of data that appeared to be inconsistent. Several
new tasks aimed at refining the data for reporting pur-poses were also included in the initial extension. A top-
down analysis was requested to indicate the actual num-
ber of batteries in use worldwide for PV applications.
The final report, which will be published and dis-
tributed as a SAND document, will serve as an informa-tion exchange tool among the three elements of PVenergy storage systems: PV system integrators, battery
manufacturers, and charge controller manufacturers.Names, companies, and phonelfax numbers identified inthe report will enable direct communications among key
participants in each of the three industries.
Respondents to the survey indicated a need for con-
tinued support by SNL in the collection and dissemina-
tion of information related to PV system energy man-
agement. Information exchange and information
dissemination is most effective when done on a regular
basis. There is a significant benefit to SNL’S continuingto serve as the focal point for PV energy system infor-
mation generation, collection, and distribution by
(1) expanding the contact list developed in the course ofthe survey to all interested individuals; (2) advancing
Internet access to existing battery storage information asa means for industry to ask questions and contribute
information, and (3) disseminating quarterly and annual
information regarding PV industry initiatives.
Top-Down Market Analysis
Until the Top-Down Market Analysis was per-formed, there was no way of knowing how many batter-
ies were being sold for PV applications.
The following summary of the market analysis to alarge extent represents a worldwide market and there-
fore can be extrapolated. However, the data does not
provide a means to estimate total PV battery sales foreither the U.S.or the worldwide market. The analysisprovides an estimate of total PV battery sales worldwideand in the U.S. by all purchasers of PV batteries, not justsystem integrators. 1
1 The21 systemintegratorsthat respondedto this surveyrepresentonlya fraction(14~o)of the U.S.PV batterymarketand a muchsmalterfrac-tion of the worldwidePV batterymarket (1.6%). One reasonwhy the 21 system integratorshave a small share of the total U.S. market isbecausethe PV batterymarketis fragmentedwithmanyend userspurchasingfromlocalbatterydktributors. The end usermaybe, for exam-ple,anelectricor gasutitity,a telecommunicationscompany,theDepartmentof Defense,a recreationalvehicleowner,or a remotehomeowner.
2-16 2. ANALYSIS

The top-down analysis is based on a rule of thumbthat provides an estimate of the number of batteries usedfor each 50 W (peak) of modules used.2 Since the ntnn-
ber of PV watts shipped each year (both U.S. and world-
wide) is well known and published by recognized PV
marketing experts, it is a straightforward process to esti-
mate the total number of batteries installed in PV
systems each year.
Worldwide PV module shipments in 1995 were
approximately 78 MVV,3with about 67 MW being used
in stand-alone applications (about 11 MW were used ingrid-connected and (consumer applications).4 Waterpumping, a segment of the stand-alone market, oftendoes not use batteries, so the 67 MW will be adjusted
downward to 64 MW, which represents PV module sales
in systems that inclucled batteries. As a rule of thumb,
on average, one 12-V 100-Ah battery (i.e., 1.2 kwh) is
used for each 50 W of PV modules.
● The total worldwide sales of PV batteries in
1995 Was (64 MW/50 W) X 1.2 kwh =
1,536,000 kWh.
Additional batteries were sold during 1995 toreplace batteries that reached end of life in existing
PV systems. Assuming a typical battery life of 5 yrand that all PV system batteries installed in 1990,
1985, and 1980 were replaced (934,000 +29 1,000 +
200,000 kwh), then a total of 1,425,000 kwh of batter-ies were replaced in 1995.
The total of new-system batteries in 1995
(1,536,000 kwh) !plus the replacement batteries(1,425,000 kwh) equals 2,961,000 kwh of PV systembattery sales. As indicated in Table 2-7, the average costfor a kilowatt-hour in 1995 was $102 per kwh (whole-
sale).
● The worldwide wholesale value for PV batteries
shipped in 1995 was $302M.
The approximate values that went into this calcula-tion will limit the accuracy to about t25%, so that anappropriate range for wholesale dollar value would be
$226M to $378M.
It is estimated that about 11.5% of the total 64 MWof stand-alone PV were installed in the U.S. in 1995.5Therefore, total PV battery sales in the U.S. were
11.570 x 2,961,000 kwh or 340,515 kwh (or about11.5% X $302M = $34.7M).
● This indicates that the 21 system integrators
control about $4.76M6/$34.7M = 1470 of the
U.S. PV battery market (in terms of dollar
sales).
Using the same methodology to calculate the newlyinstalled capacity each year (not counting replacementbatteries), it is estimated that:
● Approximately 10,519,000 kwh of batteries are
currently installed in PV systems worldwide.
Table 2-8 provides a summary of the worldwide
top-down market data for 1995, while Table 2-9 pro-
vides a similar summary for the U.S. market. Data for
the years 1991 and 2000 are also included in these tables
for comparison.
Incorporation of BES into NEMS
Sentech, Inc., published a study addressing howBES can be incorporated into the EMM of the NEMS in
July 1996. The purpose of the study was to assess the
feasibility of, and to make recommendations for, devel-
oping methodologies to incorporate storage in stand-alone dispatchable units.
Status
The study concluded that three possible avenuesexist for including storage technologies within the
EMM. The first is to add storage technology as a peakgeneration candidate in the Electricity Capacity Plan-
ning (ECP) submodule of EMM. This option, which
has been considered previously, was eliminated due to
overwhelming evidence indicating that the difference inthe marginal cost of production between peak and off-peak periods is not large enough to warrant investmentin BES systems. The second method considers storagetechnologies as the demand-side management (DSM)
2
3
4
5
6
—
Thewidelyacceptedrule of thumbis thatfor every50W (peak)of PVmodulesusedin a PV system,approximately1.2kwh of battery isused(e.g.,one 12-V,100-Ah~battery). Thisruleof thumbis sometimesusedto estimatethequantityofbatteriesfor a “typicat”PV system. It is esti-matedthat the uncertaintyof this rule is H070.Basedon averagesof data fromconversationswithBobJohnsonof StrategiesUnlimited(May1996)and PaulMaycockof PV News (February1996). JohnsonandMaycockare twoof the leadbrgPVindustryexpertsandhaveprovidedtechnologyandmmketreports(includlnghistoricaland forecasted PV sates data) for about two decades.
Consumerapplications:small“expendable”productssuchas soku-poweredcalculators,toys,andwalklights(c5 W peak).Basedon estimatesof 12.8%by PautMaycock(PV New$) and 10.6’%by Bob Johnson(StrategiesUnlimited)duringtelephoneconversationsNovember1, 1996.SeeTable2-7.
2. ANALYSIS 2-17
—-
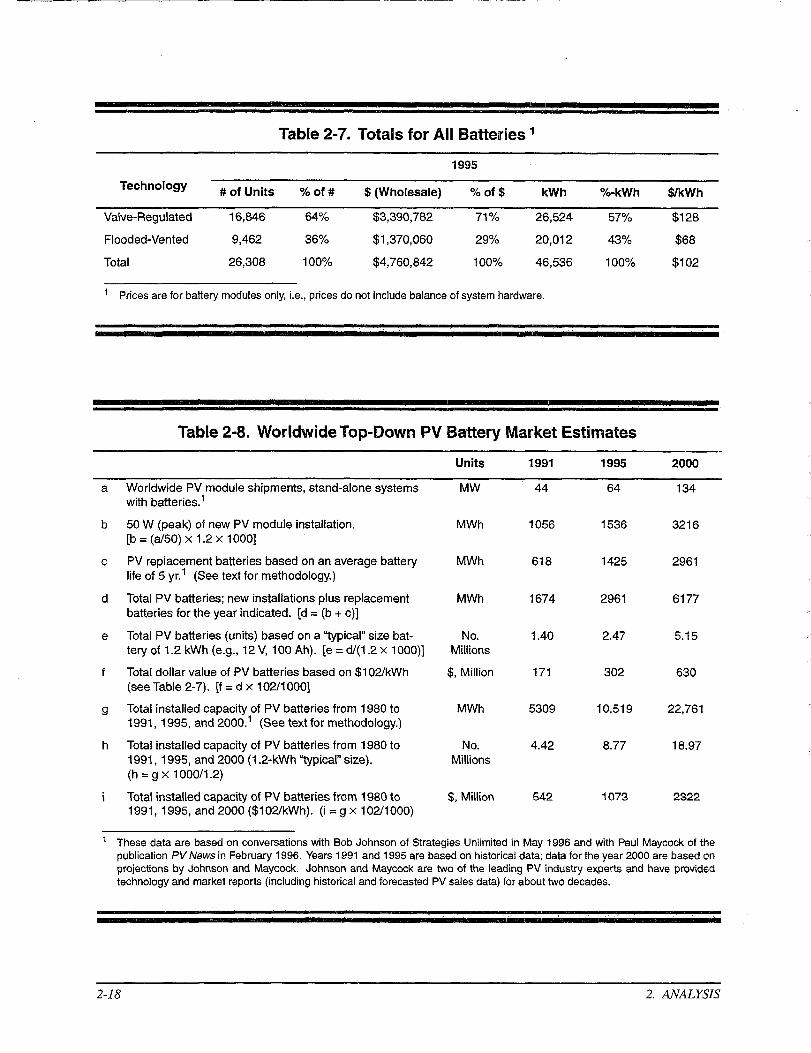
Table 2-7. Totals for All Batteries’
1995
Technology# of Units %of# $ (Wholesale) 70 of $ kWh %-kWh $fkWh
Valve-Regulated 16,846 64% $3,390,782 71 0/0 26,524 57~o $128
Flooded-Vented 9,462 36% $1,370,060 29~o 20,012 43?!0 $68
Total 26,308 10070 $4,760,842 100% 46,536 100% $102
‘ Prices are for battery modules only, i.e., prices do not include balance of system hardware.
Table 2-8. Worldwide Top-Down PV Battery Market Estimates
Units 1991 1995 2000
a
b
c
d
e
f
9
h
i
Worldwide PV module shipments, stand-alone systemswith batteries.’
50 W (peak) of new PV module installation.[b= (a/50) X 1.2X 1000]
PV replacement batteries based on an average batterylife of 5 yr.’ (See text for methodology.)
Total PV batteries; new installations plus replacementbatteries for the year indicated. [d= (b+ c)]
Total PV batteries (units) based on a “typical” size bat-tery of 1.2 kWh (e.g., 12 V, 100 Ah). [e= d/(1.2x 1000)]
Total dollar value of PV batteries basedon$102/kWh(see Table 2-7). [f= d x 102/1000]
Total installed capacity of PV batteries from 1980 to1991, 1995, and 2000.’ (See text for methodology.)
Total installed capacity of PV batteries from 1980 to1991, 1995, and 2000 (1 .2-kWh “typical” size).(h= g X 1000/1.2)
Total installed capacity of PV batteries from 1980 to1991, 1995, and 2000 ($1 02/kWh). (i= g x 102/1000)
MW
MWh
MWh
MWh
No.Millions
$, Million
MWh
No.MWions
$, Million
44
1056
618
1674
1.40
171
5309
4.42
542
64
1536
1425
2961
2.47
302
10,519
8.77
1073
134
3216
2961
6177
5.15
630
22,761
18.97
2322
‘ These data are based on conversations with Bob Johnson of Strategies Unlimited in Mav 1996 and with Paul Mavcock of thepublication W News in February 1996. Years 1991 and 1995 are ba~ed on historical dat~; data for the year 2000 ire based onprojections by Johnson and Maycock. Johnson and Maycock are two of the leading PV industry experts and have providedtechnology and market reports (including historical and forecasted PV sales data) for about two decades.
2-18 2. ANALYSIS

T’able 2-9. U.S. Top-Down PVBattery Market Estimates
Units 1991 1995 2000
a U.S. PV module shipments, stand-alone systems with MW 5.06 7.36 15.41—
b MWh 121 177 370
c
d
e
f
9
h
i
—
batteries.1 [a=.115x (aof Table 2-8)]
PV batteries shipped, based on 1.2 kWh of batteries pereach 50 W (peak) of new PV module installation.[b= (s/50) X 1.2X 1000]
PV replacement batteries based on an average batterylife of 5 yr.’ (See text for methodology.)
Total PV batteries; new installations plus replacementbatteries for the year indicated. [d= (b+ c)]
Total PV batteries (units) based on a “typical” size bat-tery of 1.2 kWh (e.g., 12 V, 100 Ah). [e= cf/(1.2 x 1000)]
Total dollar value of PV batteries based on $102/kWh(see Table 2-7). [f= d x 102/1 000]
Total installed capacity of PV batteries from 1980 to1991, 1995, and 2000.’ (See text for methodology.)
Total installed capacity of PV batteries from 1980 to1991, 1995, and 2000 (1.2-kWh “typical” size).(h= g X 1000/1.2)
Total installed capacity of PV batteries from 1980 to1991, 1995, and 2000 ($1 02/kWh). (i= 9 X 1021000)
MWh
No.Millions
$, Million
No.
71
193
0.16
20
611
0.51
164
341
0.28
35
1210
1.01
341
710
0.59
72
2618
2.18
$, Million 62 123 267
1 These date are based on conversations with Bob Johnson of Strategies Unlimited in May 1996 and with Paul Maycock of thepublication F’V News in February 1996. Years 1991 and 1995 are based on historical dat% data for the year 2000 are based onprojections by Johnson and Maycock. Johnson and Maycock are two of the leading PV industry experts and have providedtechnology and market reports (including historical and forecasted PV sales data) for about two decades.
option within the Load and Demand-Side Management
(LDSM) submodule and allows storage to compete with.other DSM technologies. Unfortunately, this study indi-
cates that the LDSM :submodule must be further refined
prior to considering how to incorporate it into BESsystems. The interaction between EMM and the
remainder of NEMS is illustrated in Figure 2-7. TheECP submodule evaluates generation technologyoptions that are needed to meet future demand for elec-tricity and comply with environmental regulations.
These options include investments in new utility and
nonutility plants (excluding cogenerators), demand-side
management programs, and pollution control equip-
ment.
The third possibility is to integrate storage withrenewable technologies in order to make them more reli-able from a system operations perspective and to com-mand better prices for the energy they generate. The
study recommends the analytical work be carried out forthis third option of integrating storage with renewable
technologies and that a thorough assessment be made of
the potential benefits storage can bring to renewable
generation technologies. Formulation of costs associ-ated with the integrated plant and an assessment of ben-
efits that could be recognized within the existing NEMSframework will have to be undertaken to evaluate the netgain.
If the additional cost of integrating storage with
renewable generation technologies is lower than the
additional benefits it can bring about, the competitive-ness and penetration of renewable technologies will be
increased. NEMS can model an integrated renewableunit as another renewable technology with an increasedcapital and operations and maintenance (O&M). If theadditional benefit stream is not accounted for, this inte-
grated unit, when competing against other renewable
2. ANALYSIS 2-19
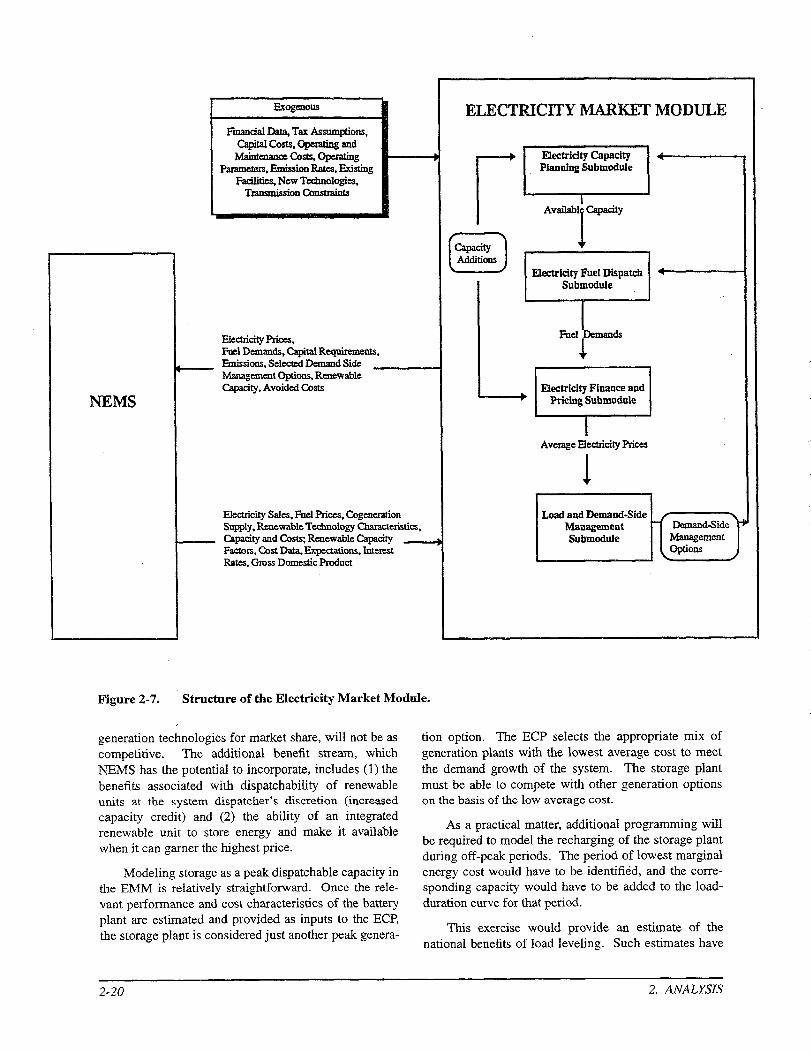
NEMS
Exogalous
Fmeid Da@ Tax/hlttl@iOIL$,Ca@taiCosts,GpemtiugeadMaheaane Cat& Gpemdag
Parametws,EmisshnRate9,ExistingFaeititiesjNewTedmologiea,
TransmissionCoastmints
Eiectriatv Prices.Fad Deakads, titatllequimems,
_ l%oissions,Sel= --d SideMaaasemeatGotions.RenewableQa&y,Avoi&dC&S
ElectricitySates,FuelRices. CogenesationSoppiy,Rmewaiie Tedaology Cbamcteristies,Cspaeiq’aad CostqRenewableCspcity _Faetoss,~st Da@=~C@tiOSSS, Iatesest
Rates, GrossDomesticProduet
s-
ELECTRKTI’Y MARKET MODULE
yF4
2
C.spaatyAdditioas
P
EktrIdty Fuel Dispateb ~
L
Submoduie
Fuel Demands
1
P
Eketricity Finance andPricing Submoduie
AverageEketriaty Paces
&
DszasndS1&MaaagesnerstO@io.
Figure 2-7. Structure of the Electricity Market Module.
generation technologies for market share, will not be as
competitive. The additional benefit stream, which
NEMS has the potential to incorporate, includes (1) the
benefits associated with dispatchability of renewableunits at the system dispatcher’s discretion (increased
capacity credit) and (2) the ability of an integratedrenewable unit to store energy and make it available
when it can garner the highest price.
Modeling storage as a peak dispatchable capacity inthe EMM is relatively straightforward. Once the rele-
vant performance and cost characteristics of the battery
plant are estimated and provided as inputs to the ECP,the storage plant is considered just another peak genera-
tion option. The ECP selects the appropriate mix of
generation plants with the lowest average cost to meet
the demand growth of the system. The storage plant
must be able to compete with other generation optionson the basis of the low average cost.
As a practical matter, additional programming will
be required to model the recharging of the storage plantduring off-peak periods. The period of lowest marginalenergy cost would have to be identified, and the corre-sponding capacity would have to be added to the load-
duration curve for that period.
This exercise would provide an estimate of the
national benefits of load leveling. Such estimates have
2-20 2. ANALYSIS

.
already been made, and it is generally accepted that the
load-leveling benefits of energy storage are not that]mge. The EMM does not provide the necessary frame-
work to evaluate other T&D-related benefits associated
with storage technologies, such as provision of spinning
reserve and frequency regulation.
Storage potentially adds value to renewable energy
systems by making them more dispatchable. NEMS,with modifications, cm estimate the value that energy
storage adds to renewable energy systems and projectthe penetration such integrated systems could achieve.
Storage provides the flexibility to introduce a timeshift between renewable energy generation and con-
sumption. The marginal cost of electricity generation tomeet demand is different for each of the 11 load seg-
ments of the load duration curve (see Figure 2-8), withsegments with higher demand requiring high-cost peak-
ing units. Enabling renewable generation to shift from
low-demand to high-demand periods allows renewable
to demand higher prices, increasing the value of renew-
able generation. The cost differential between high- and
low-demand periods within NEMS varies by a factor of
2. Proper analysis of this differential must be carried
out in order to quantify this benefit.
Another benefit associated with integration of stor-age is the ability of the integrated unit to supply reliablepower on demand. The ability of generating units to
supply electricity on demand is crucial for the reliable
operation of the power system. Storage provides themeans by which an intermittent resource can be stored
and made available on request with certainty. Atpresent, some of the wind turbines within the Rerlew-
able Fuels Module (RFM) are assigned capacity factorsthat are as high as 37.5’% of the nameplate power rating
of the turbine generator. However, it is customary forutilities to assign lower capacity credits ( 15-20Yo) to
wind turbines for operational purposes. Storage will
provide the means by which to increase the capacity
credit to 100% of the generator’s nameplate power rat-
ing.
~DemarKLby region (GW)
- Two Peak Segments, top 2% of demandin Summerand W- in a givenyear.
1 2 3 4 5 6 7 8 9
Tme (hours of the year)
Figure 2-8. Construction of the Load Duration Curve.
2. ANALYSIS 2-21
_– _.— ———

2-22 2. ANALYSIS
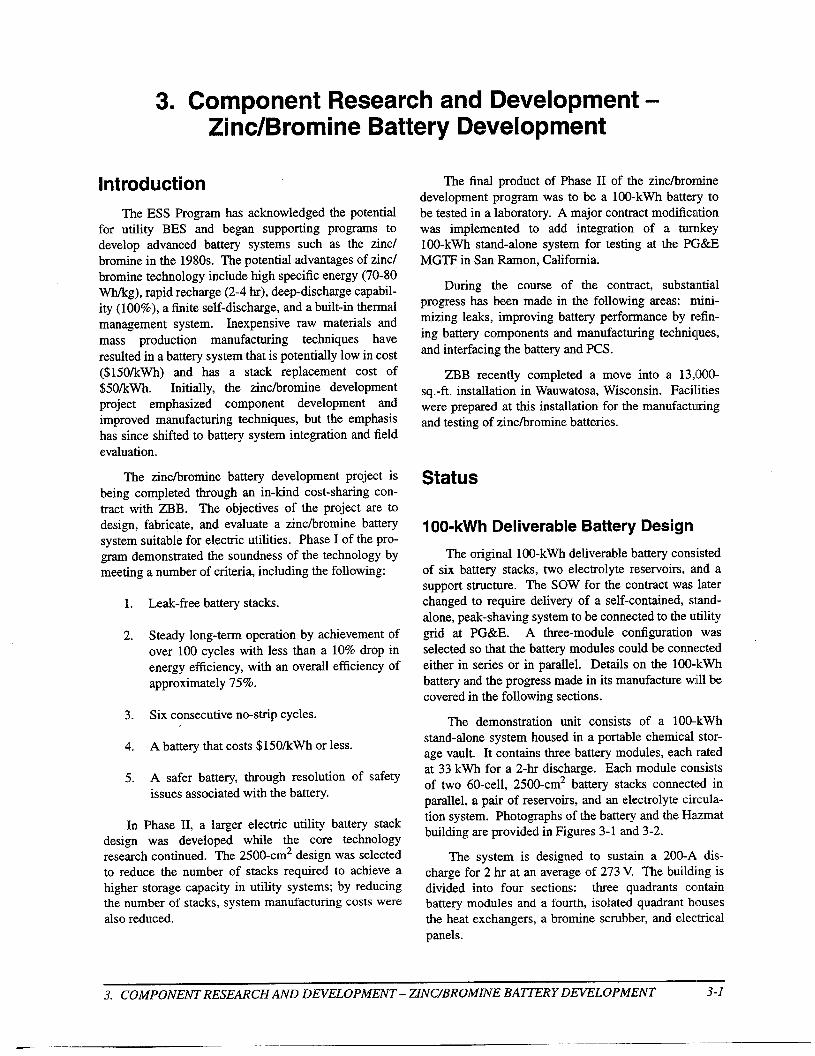
3. Component Research and Development -Zinc/Bromine Battery Development
Introduction
The ESS Program has acknowledged the potential
for utility BES and began supporting programs todevelop advanced battery systems such as the zinc/
bromine in the 1980s. The potential advantages of zinc/
bromine technology include high specific energy (70-80
Wb/kg), rapid recharge (2-4 hr), deep-discharge capabil-ity (100%), a finite self-discharge, and a built-in thermalmanagement system. Inexpensive raw materials and
mass production manufacturing techniques have
resulted in a battery system that is potentially low in cost
($150/kWh) and has a stack replacement cost of$501kwh. Initially, the zinc/bromine developmentproject emphasized component development and
improved manufacturing techniques, but the emphasis
has since shifted to battery system integration and field
evaluation.
The zinc/bromine battery development project is
being completed through an in-kind cost-sharing con-
tract with ZBB. The objectives of the project are to
design, fabricate, and evaluate a zincfbromine batterysystem suitable for electric utilities. Phase I of the pro-
gram demonstrated the soundness of the technology bymeeting a number of criteria, including the following:
1. Leak-free battery stacks.
2. Steady long-term operation by achievement of
over 100 cycles with less than a 10% drop in
energy efficiency, with an overall efficiency of
approximately 75’%0.
3. Six consecutive no-stip cycles.
4. A battery that costs $150/kWh or less.
5. A safer battery, through resolution of safety
issues associated with the battew.
In Phase II, a larger electric utility battery stackdesign was developed while the core technologyresearch continued. The 2500-cm2 design was selectedto reduce the number of stacks required to achieve ahigher storage capacity in utility systems; by reducingthe number of stacks, system manufacturing costs werealso reduced.
The final product of Phase 11 of the zinc/bromine
development program was to be a 100-kWh battery to
be tested in a laboratory. A major contract modificationwas implemented to add integration of a turnkey100-kWh stand-alone system for testing at the PG&E
MGTF in San Ramon, California.
During the course of the contract, substantial
progress has been made in the following areas: mini-
mizing leaks, improving battery performance by refin-
ing battery components and manufacturing techniques,
and interfacing the battery and PCS.
ZBB recently completed a move into a 13,000-
sq.-ft. installation in Wauwatosa, Wisconsin. Facilitieswere prepared at this installation for the manufacturing
and testing of zincfbromine batteries.
Status
100-kWh Deliverable Battery Design
The original 100-kWh deliverable battery consisted
of six battery stacks, two electrolyte reservoirs, and asupport structure. The SOW for the contract was later
changed to require delivery of a self-contained, standa-
lone, peak-shaving system to be connected to the utilitygrid at PG&E. A three-module configuration was
selected so that the battery modules could be connectedeither in series or in parallel. Details on the 100-kWh
battery and the progress made in its manufacture will becovered in the following sections.
The demonstration unit consists of a 100-kWhstand-alone system housed in a portable chemical stor-
age vault. It contains three battery modules, each ratedat 33 kwh for a 2-hr discharge. Each module consists
of two 60-cell, 2500-cm2 battery stacks connected inparallel, a pair of reservoirs, and an electrolyte circula-tion system. Photographs of the battery and the Ha.zmat
building are provided in Figures 3-1 and 3-2.
The system is designed to sustain a 200-A dis-
charge for 2 hr at an average of 273 V. The building is
divided into four sections: three quadrants containbattery modules and a fourth, isolated quadrant housesthe heat exchangers, a bromine scrubber, and electrical
panels.
3. COMPONENT RESEARCH AND DEVELOPMENT– ZINCBROMINE BA7TERYDEVELOPMENT 7

Figure 3-1. ZincJBroxuine Battery Stack, 2500 cm2, 60 Cells.
Figure 3-2. Hazmat Building Containing 100-kWh Deliverable.
3-2 3. COMPONENT RESEARCH AND DEVELOPMENT- ZINCYBROMINE BATTERYDEVELOPA4ENT

The building has a spill containment sump in addi-
tion to the sumps for the individual modules. Additional
safety devices include bromine and hydrogen sensors
and an accelerometer for earthquake detection.
The battery system is designed to comply with
Zone 4 earthquake requirements. Compliance withthese requirements is accomplished by using an epoxy-coated steel frame to support each module; the reser-voirs are inserted into the structure of the frame with the
two battery stacks located between the reservoirs. The
stacks are attached to the frame by plastic-coated steel
cords to restrain the stacks in the x, y and z directions in
case of an earthquake (see Figure 3-3).
Each reservoir accommodates a recessed sump area
in the cover where the pumps are located. The anolyte
reservoir uses one pump, while two other pumps areused to circulate both the aqueous catholyte and com-
plexed bromine phases. Brushless DC motors run cen-trifugal pumps that are mounted vertically inside the
recessed area in the reservoir covers. The inlets to thepumps are located below the liquid level in the reser-
voirs, which eliminates the need to prime the pumps.
The majority of the plumbing consists of fused polyvi-
nylidene fluoride (PVDF) that is located inside the reser-
voir to minimize leakage from the system. Any minor
leaks from this plumbing would be contained inside the
reservoirs.
The plumbing from the reservoirs to the stacks is
reinforced viton, which was chosen because of its t3exi-
bility. The entire module is located inside a larger spill
containment tray.
Liquid-level sensors are located at the top of eachreservoir. These analog sensors are accurate to 0.2!5 in.and supply data to the batte~ controller. The data is
used to maintain constant electrolyte levels in each res-ervoir by adjusting pump speeds. Leak sensors are
located in the module spill tray and in each reservoir
sump area.
The module is designed so that stacks can be elec-
trically connected in either parallel or series configura-tions. Each module has an open-circuit voltage of
109 V. The battery system specifications for three mod-ules connected electrically in series are provided in
Table 3-1.
An extensive data collection system has been dt:vel-
oped to verify the need for battery subsystems. Parasitic
losses from the pumps, heat exchanger, and control
system will be quantified, and a paging system, which
automatically activates in the case of a potentially haz-
Catholyte
‘“”’= /:$aseBatteryStacks ~
Reservoir
Figure 3-3. Depiction of a 33-kWh Battery Module.
3. COMPONENT RESEARCH AND DEVELOPMENT– ZINC7BROMINE BA2’TERYDEVELOPMENT 7

Table 3-1. 100-kWh Battery Specifications
Typical Maximum
Charge Voltage 360 V (378 V)
Charge Current 100A (150 A)
Open-Circuit Voltage 328 V
Discharge Current lOOA (200 A)
Low-Voltage Cutoff 180V
Strip-Current Cutoff 0.5 A
ardous condition, has been installed, An internal loadmanagement system has been integrated into the system
by running all of the auxiliary equipment, such as the
heater, scrubber, etc., off a 30-A circuit. Therefore, ifthe scrubber needs to be activated, the heater will beautomatically disconnected from the circuit to maintain
the 30-A load.
An Ansul-certified fire-suppression system was
installed in the Hazmat building. The fire-suppressionsystem consists of a dry chemical and a propellant that
distributes the chemical to each of the four quadrants in
the building and can be activated automatically by
excessive heat in any of the quadrants or manually acti-vated from outside the building. A heater and heatexchanger have also been installed so that the system
can be operated in cold or hot weather.
Battery Controller Software
A separate programmable logic controller (PLC)
monitors and controls each batte~ module. Each PLChas 2 K of user memory and is capable of data acquisi-tion through a full-duplex RS232C serial port. DuringFY96, calibration of the voltage and current sensors for
the modules and the final logic and data acquisition soft-ware were completed. The PLCS will monitor modulevoltage, stack current, pump motor currents, and elec-
trolyte levels in the module reservoirs. The PLCS willcompare the measured parameters with preset limits to
determine if the battery modules are performing prop-erly. If the measured parameters fall outside the presetnorrrs, the PLCS will adjust variables, e.g., pump speed,to compensate. If the measured parameters cannot bemodified, the PLCS will generate either a “FAULT” or a“SHUTDOWN” condition and proceed to tum off the
system. A ‘*FAULT” condition causes the battery to be
disconnected from the PCS. A “SHUTDOWN” condi-
tion gives the same result as the “FAULT” condition, but
the entire system, including pumps, will be shut down.
An additional PLC will coordinate the overall oper-ation and safety of the system. This controller will mon-itor system parameters such as electrolyte temperatures,
bromine and hydrogen concentrations inside the build-ing, buildlng temperature, ambient temperature, periph-
eral current, and seismic activity. If a condition that is
potentially hazardous to the system or to its surround-
ings is sensed by the monitoring system, the controllerwill completely shut down the system. Conditions that
would result in a complete shutdown of the system
include an electrolyte or coolant leak, an earthquake, orhigh levels of bromine.
The performance of the system is monitored by a
computer system with software running under the
Microsoft Windows environment. The PLCS monitoringthe battery system send the data over RS232C seriallines to the computer. Various screens display the infor-mation collected by the monitoring PLCS. The informa-tion includes parameters such as module and systemvoltage and current, electrolyte pump speeds, tempera-
tures, seismic activity, hydrogen and bromine gas con-centrations, and parasitic load conditions. The informa-
tion is saved for retrieval at a later time and can bepresented in either tabular or graphical format.
The system software is programmed to allow the
operator to manually change the speed of the variouspumps as well as to generate a “MANUAL SHUT-DOWN” of the system. If the system is shut down orhalted either manually or by the PLCS, the software willnotify key personnel via personal pagers contacted
through a modem connected to the computer.
3-4 3. COMPONENTRESEARCHAND DEVELOPMENT– ZINC2BROMINE BA2’TERY DEVELOPMENT

.
.
.
100-kWh Battery Characterization
Interference caused by noise from the PCS had pre-
viously made voltage readings by the personal computer
inconsistent. During FY96, methods were developed to
electrically isolate the battery. The PLCS are now ableto consistently read battery voltages without being
affected by the noise from the PCS.
Erratic currents through individual battery stackshave caused some problems. These currents appeared tobe caused by the inability to strip the batteries following
discharge. Because of this, the batteries were not all at
the same state of charge (SOC) at the beginning of each
cycle, and individual stack currents became more incon-
sistent on each subsequent cycle. Strip resistors for each
of the three battery modules, along with electrical con-
tractors to switch from the PCS to the resistor banks,
have been installed inside the 100-kWh building to
address this problem.
Safety-protection features have been incorporatedinto the system. The gas-sensor monitor has been cali-
brated and is operational.
The fault and shutdown conditions listed in
Table 3-2 have been used to verify that the protection
features of the zinc/bromine battery are functioning.Each event is documented in a computer-generatedreport and is also backed up on the hard disk of the Bat-
tery Monitoring personal computer (PC). Confirmation
of the protective functions is complete.
Reaching low-voltage cutoff was originally consid-
ered a fault condition. Now, rather than treating low-voltage cutoff as a fault condition, the response is to
open the DC contactor and connect the batteries to resis-
tor banks so that the batteries can be stripped. Before
the batteries are stripped, all battery modules must be
within a specified voltage window.
Table 3-3 lists the response sequences that result
from fault and shutdown conditions. The fault response
sequence occurs after minor faults and the shutdown
response sequence after critical faults.
The shutdown response for a fire within the build-ing has also been modified. If there is afire, all power isremoved from the system and a warning bell is acti-vated.
The final ladder logic has been completed. Data are
being entered into the PC, and amp-hours, watt-hours
and SOCS are being calculated. Progressively longer
cycles are being performed on the battery system to
verify SOC calculations. The electrolyte flow rates that
will give optimized battery performance are being
examined.
During FY96, unexplained shutdowns of theinverter were identified, and a new controller board is
scheduled to be installed in December 1998. Safetyprequalification testing of the new controller board was
completed. Optimization of battery performance will
commence once the new controller board is installed.
Also during FY96, the electronics and software torun the battery were tested. Testing was initiated on athree-battery configuration. These stacks were some ofthe first few built and did not meet quality specifica-
tions. However, they did perform very consistently dur-
ing the 18 cycles for which they were tested, with the
final cycle giving coulombic efficiency of 79.6%, vchiicefficiency of 87.7’%0,and energy efficiency of 69.9%.
Table 3-2. Fault and Shutdown Conditions for 100-kWh Battery
Fault Conditions Shutdown Conditions
Overvoltage in Charge LOSSof 120-V, 30-A Sllpply
Overcurrent in Charge Bromine Detection
Door Open Accelerometer Activation
Hydrogen Detection Leak Detection
Above Maximum Temperature Level Sensors Off
Below Minimum Temperature Fire
3. COMPONENTRESEARCHAND DEVELOPMENT– ZINC~ROMINE BATTERY DEVELOPMENT G

Table 3-3. Fault and Shutdown Responses for 100-kWh Battery
Fault Response Shutdown Response
1
2
3
4
5
6
7
8
9
10
11
Pump motors remain on.
DC contactor opens.
Alarm light turns on.
The MGTF Test Manager is paged.
Fault indicator to PCS opens.
Alarm screen appears on the battery-monitoringPc.
Alarm horn on the battery-monitoring PCsounds.
Event is recorded to the battery-monitoring PC hard disk.
Event is sent to the printer.
All subsequent operator actions are recorded tothe battery-monitoring PC hard disk.
All subsequent operator actions are sent to theprinter.
1
2
3
4
5
6
7
8
9
10
11
12
13
14
15
16
Pump motors are turned off.
Horn sounds.
Alarm light turns on.
Both louvers close.
Scrubber turns on.
The MGTF Test Manager is paged.
DC contactor opens.
Fault indicator to PCS opens.
Fault indicator to PG&E opens.
Alarm screen appears on the battery-monitoringPc.
Alarm horn on the battery-monitoring PCsounds.
Event is recorded to the battery-monitoring PChard disk.
Event is sent to the printer.
All subsequent operator actions are recorded tothe battery-monitoring PC hard disk.
All subsequent operator actions are sent to theprinter.
Heat exchanger turns off.
Minor changes were made in the software and controller board is installed in December 1998 (with
ladder logic to enable the battery to run unmanned new software), a major portion of stripping function will
cycles. Strip resistors have been added to the system to be performed by the PCS.
allow unmanned stripping of the battery. Once the new
3-6 3. COMPONENT RESEARCH AND DEVELOPMENT– ZINCYBROMINE BAiTERY DEVELOPMENT

4. Component Research andTechnology Evaluation/Applied
Introduction
As part of its technical mission in support of the
ESS Program, SNL performs in-house applied research
and battery evaluation tasks. These tasks are performedby utilizing specialized and unique facilities and capa-
bilities established at SNL over the many years of pro-gram activities in all battexy technologies.
Evaluation of VRLA and advanced batteries is
being performed in the extensive battery testing labs at
SNL. These independent, objective tests using
computer-controlled testers capable of simulating appli-
cation-specific test regimes provide critical data for the
assessment of the status and probable success of thesetechnologies. Current tasks include conclusion of the
development of a safety fuse for sodiurnhulfhr and otherhigh-temperature batteries. This development of patent-
able fuse materials builds on SNL’s extensive technical
capabilities in high-temperature cells and materials.
VRLA and Lead-Acid SLIEvaluation at SNL
PV Battery Cycle-Life Evaluation at SNL
The ESS Program has been working in coordinationwith the Sandia Photovokaic System Components
Department at SNL to characterize the life and perfor-
mance of commercially available batteries for use in
renewable systems. Several battery types are being
evaluated including starting, lighting, and ignition(SLI); deep-cycling flooded; and types using VRLAtechnologies. To ensure that the batteries under test rep-
resented components that are available to PV systemsintegrators, most of the batteries under test were pur-chased by Sandia through the same distribution systemthat provides batteries to PV systems integrators. Other
batteries, such as the SLI battery and new VRLA geltechnology batteries, were acquired from off-shore fac-
tories or direct from U.S. manufacturers because these
batteries are unique and not generally available to PVsystems integrators.
The purpose of the testing being conducted by thePhotovoltaic System Components Department at the PVbattery test facility (with consulting support provided by
Development -Research at SNL
the ESS Program) is to determine potential PV applica-
tions that may be serviced with ‘the GNB 12-jOOOX
12-V battery, which is ABSOLYTE IIP technology.
Extensive testing of the GNB 12-5000X battery is alsounder way at the Florida Solar Energy Center (FSEC).The tests are intended to characterize the operation of
the battery under abusive conditions to determine therange of operations that this battery can tolerate and still
perform satisfactorily. Testing at FSEC is being per-
formed under a contract managed by the Photovoltaic
System Applications Department.
GNB 12-5000X 12-V Testing
PV battery cycle-life tests are being conducted on
GNB 12-5000X 12-V batteries. A dozen batteries werereceived in April 1996; two of the twelve batteries were
put on test immediately. The capacities of these batter-ies at this time were 99 and 106 Ah at a C/35 (2.86-A)
rate. After 5 mo of sitting at room temperature, battery
capacity on four other batteries was measured at 69 to
74 Ah at a C/20 rate (5 A). All initial battery capacity
measurements were made after a 12-hr boost charge at
14.1 V. The battery capacity test results after 5 mo ofstorage indicated that a 26 to 30% stand loss had
occurred.
Preliminary test results showed that the initial boostcharge for 12 hr at 14.1 V left the battery at a 30% defi-cit charge condition. Also, if the boost-charge amp-hours are subtracted from the initial capacity measure-
ment, the capacity of the battery after 5 mo of storage
would only be 51 Yo of its initial capacity as measured
when the batteries were fist received. The boost charge
to the as-received batteries added 8 Ah.
The following recovery procedure was initiated:
1. Boost charge the batteries at 2.35 vpc until thecharge current levels out for 3 hr.
2. Boost charge the batteries for another 12 hr at
2.35 VpC.
A recharge to 14.1 V and a 36-hr boostlfloat charge
at 14.1 V was sufficient to recover battery capacity asdefined in Steps 1 and 2 above. After 36 hr, the currenthad just begun to level out at 0.51A (C/400), whichindicated that another 12 hr of charge would berequired. The additional 12 hr of charge was not imple-
4. COMPONENT RESEARCH AND DEVELOPMENT-
TECHNOLOGY EVALUATION/APPLIED RESEARCH ATSNL 4-1
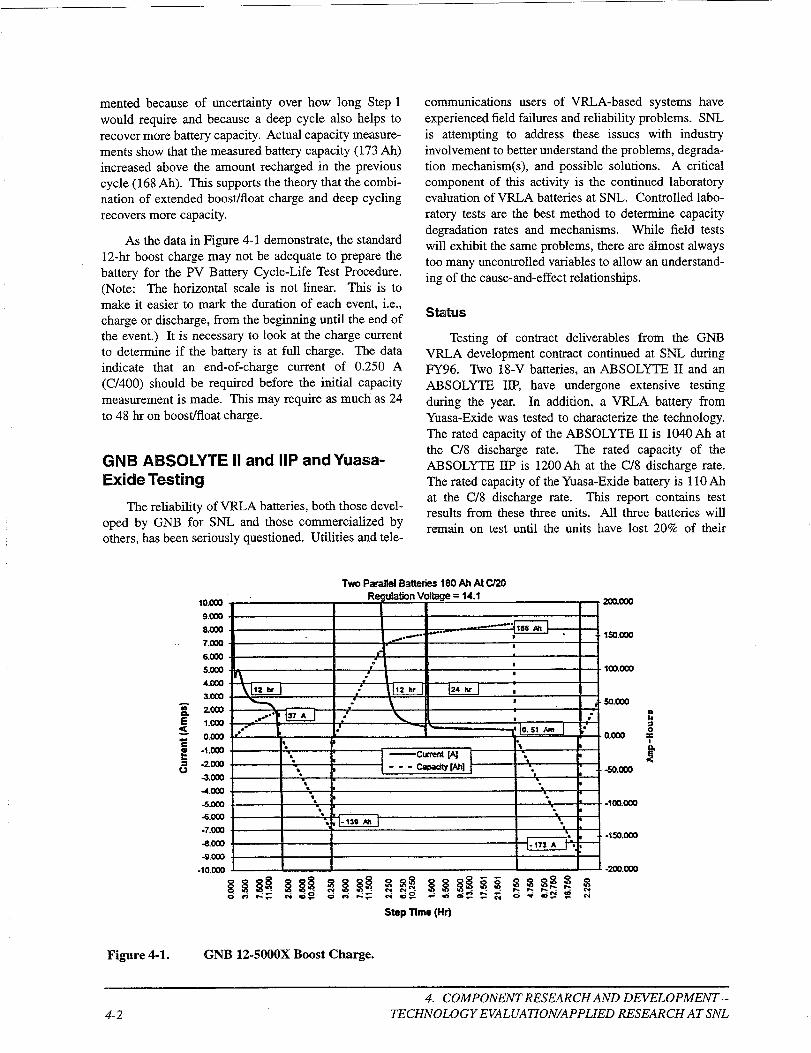
mented because of uncertainty over how long Step 1
would require and because a deep cycle also helps to
recover more battery capacity. Actual capacity measure-
ments show that the measured battery capacity (173 Ah)
increased above the amount recharged in the previouscycle (168 Ah). This supports the theory that the combi-nation of extended boostifloat charge and deep cycling
recovers more capacity.
As the data in Figure 4-1 demonstrate, the standard
12-hr boost charge may not be adequate to prepare the
battery for the PV Battery Cycle-Life Test Procedure.
(Note: The horizontal scale is not linear. This is to
make it easier to mark the duration of each event, i.e.,
charge or discharge, from the beginning until the end ofthe event.) It is necessary to look at the charge currentto determine if the battery is at full charge. The data
indicate that an end-of-charge current of 0.250 A(C/400) should be required before the initial capacity
measurement is made. This may require as much as 24
to 48 hr on boostlfloat charge.
GNB ABSOLYTE II and 11Pand Yuasa-Exide Testing
The reliability of VRLA batteries, both those devel-
oped by GNB for SNL and those commercialized by
others, has been seriously questioned. Utilities and tele-
communications users of VRLA-based systems have
experienced field failures and reliability problems. SNL
is attempting to address these issues with industry
involvement to better understand the problems, degrada-
tion mechanism(s), and possible solutions. A criticalcomponent of this activity is the continued laboratory
evaluation of VRLA batteries at SNL. Controlled labo-
ratory tests are the best method to determine capacity
degradation rates and mechanisms. While field tests
will exhibit the same problems, there are almost always
too many uncontrolled variables to allow an understand-
ing of the cause-and-effect relationships.
status
Testing of contract deliverables from the GNBVRLA development contract continued at SNL during
FY96. Two 18-V batteries, an ABSOLYTE II and an
ABSOLYTE 11P, have undergone extensive testing
during the year. In addition, a VRLA battery from
Yuasa-Exide was tested to characterize the technology.
The rated capacity of the ABSOLYTE II is 1040 Ah atthe C/8 discharge rate. The rated capacity of the
ABSOLYTE HP is 1200 Ah at the C/8 discharge rate.
The rated capacity of the Yuasa-Exide battery is 110 Ahat the C/8 discharge rate. This report contains testresults from these three units. All three batteries willremain on test until the units have lost 20?%0of their
Io.mo9.MO8.OM
7.MO
6.(XM
5.CM
4.000
3.MO= 2W
$ fl.mo
O.moz
:-lam
G-2.033
am
-am
-lima
Two ParallelBatteries180 Ah At Ci20
I
Zm.mo
l!m.mo
103.CC+3
60.000
-W.000
-tm.om-mm .-7.000 .
.%
●
-a.mo . I. . -150.MO
-ln A I’*,
-9.m3 + I I 1 rI
Stapmm (Hr)
Figme 4-1. GNB 12-5000X Boost Charge.
4. COMPONENT RESEARCH AND DEVELOPMENT–
4-2 TECHNOLOGY EVALUATION/APPLIED RESEARCH ATSNL
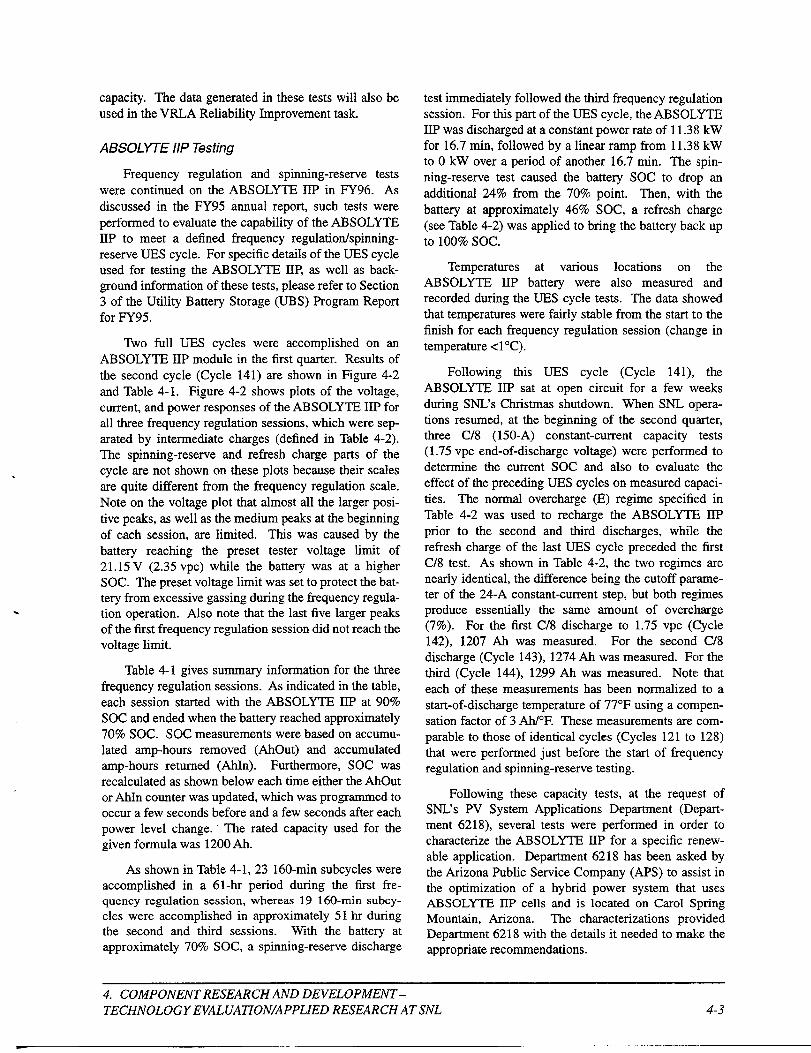
capacity. The data generated in these tests will also be
used in the VRLA Reliability Improvement task.
ABSOLYTE 11PTesting
Frequency regulation and spinning-reserve tests
were continued on the ABSOLYTE HP in FY96. As
discussed in the FY95 annual report, such tests were
performed to evaluate the capability of the ABSOLYTE
HP to meet a defined frequency regulationkpinning-reserve UES cycle. For specific details of the UES cycle
used for testing the ABSOLYTE HP, as well as back-ground information of these tests, please refer to Section
3 of the Utility Battery Storage (UBS) Program Reportfor FY95.
Two full UES cycles were accomplished on an
ABSOLYTE 11P module in the first quarter. Results of
the second cycle (Cycle 141) are shown in Figure 4-2
and Table 4-1. Figure 4-2 shows plots of the voltage,
current, and power responses of the ABSOLYTE 11P forall three frequency regulation sessions, which were sep-
arated by intermediate charges (defined in Table 4-2).The spinning-reserve and refresh charge parts of the
cycle are not shown on these plots because their scales
are quite different from the frequency regulation scale.
Note on the voltage plot that almost all the larger posi-
tive peaks, as well as the medium peaks at the beginning
of each session, are limited. This was caused by the
battery reaching the preset tester voltage limit of21.15 V (2.35 vpc) while the battery was at a higherSOC. The preset voltage limit was set to protect the bat-tery from excessive gassing during the frequency regula-tion operation. Also note that the last five larger peaksof the first frequency regulation session did not reach thevoltage limit.
Table 4-1 gives summary information for the three
frequency regulation sessions. As indicated in the table,
each session started with the ABSOLYTE IIP at 90%
SOC and ended when the battery reached approximately
70% SOC. SOC measurements were based on accumu-
lated amp-hours removed (AhOut) and accumulatedamp-hours returned (AhIn). Furthermore, SOC was
recalculated as shown below each time either the AhOutor AhIn counter was updated, which was programmed tooccur a few seconds before and a few seconds after eachpower level change. The rated capacity used for the
given formula was 1200 Ah.
As shown in Table 4-1, 23 160-min subcycles wereaccomplished in a 6 l-hr period during the first fre-quency regulation session, whereas 19 160-min subcy -cles were accomplished in approximately 51 hr duringthe second and third sessions. With the battery at
approximately 70% SOC, a spinning-reserve discharge
test immediately followed the third frequency regulation
session. For this part of the UES cycle, the ABSOLYTE
IIP was discharged at a constant power rate of 11 .3[1kWfor 16.7 rein, followed by a linear ramp from 11.38 kW
to O kW over a period of another 16.7 min. The spin-
ning-reserve test caused the battery SOC to drop an
additional 24% from the 70% point. Then, with the
battery at approximately 46% SOC, a refresh charge
(see Table 4-2) was applied to bring the battery backupto 100%Sot.
Temperatures at various locations on theABSOLYTE 11P battery were also measured andrecorded during the UES cycle tests. The data showed
that temperatures were fairly stable from the start to the
finish for each frequency regulation session (change in
temperature <l”C).
Following this UES cycle (Cycle 141), the
ABSOLYTE IIP sat at open circuit for a few weeks
during SNL’S Christmas shutdown. When SNL operat-ions resumed, at the beginning of the second quarter,
three C/8 (150-A) constant-current capacity tests(1.75 vpc end-of-discharge voltage) were performed todetermine the current SOC and also to evaluate the
effect of the preceding UES cycles on measured capaci-
ties. The normal overcharge (E) regime specified in
Table 4-2 was used to recharge the ABSOLYTE IIP
prior to the second and third discharges, while the
refresh charge of the last UES cycle preceded the first
C/8 test. As shown in Table 4-2, the two regimes arenearly identical, the difference being the cutoff paramet-
er of the 24-A constant-current step, but both regimesproduce essentially the same amount of overcharge(7%). For the first C/8 discharge to 1.75 vpc (Cycle
142), 1207 Ah was measured. For the second C/8
discharge (Cycle 143), 1274 Ah was measured. Fc}r the
third (Cycle 144), 1299 Ah was measured. Note thateach of these measurements has been normalized to a
start-of-discharge temperature of 77°F using a compens-ation factor of 3 Ah/°F. These measurements are com-
parable to those of identical cycles (Cycles 121 to 128)
that were perfonmed just before the start of frequencyregulation and spinning-reserve testing.
Following these capacity tests, at the request of
SNL’S PV System Applications Department (Depart-ment 6218), several tests were performed in order tocharacterize the ABSOLYTE IIP for a specific renew-
able application. Department 6218 has been asked by
the Arizona Public Service Company (APS) to assist inthe optimization of a hybrid power system that usesABSOLYTE IIP cells and is located on Carol SpringMountain, Arizona. The characterizations providedDepartment 6218 with the details it needed to make theappropriate recommendations.
4. COMPONENT RESEARCH AND DEVELOPMENT–
TECHNOLOGY EVALUATION/APPLIED RESEARCH ATSNL 4-3
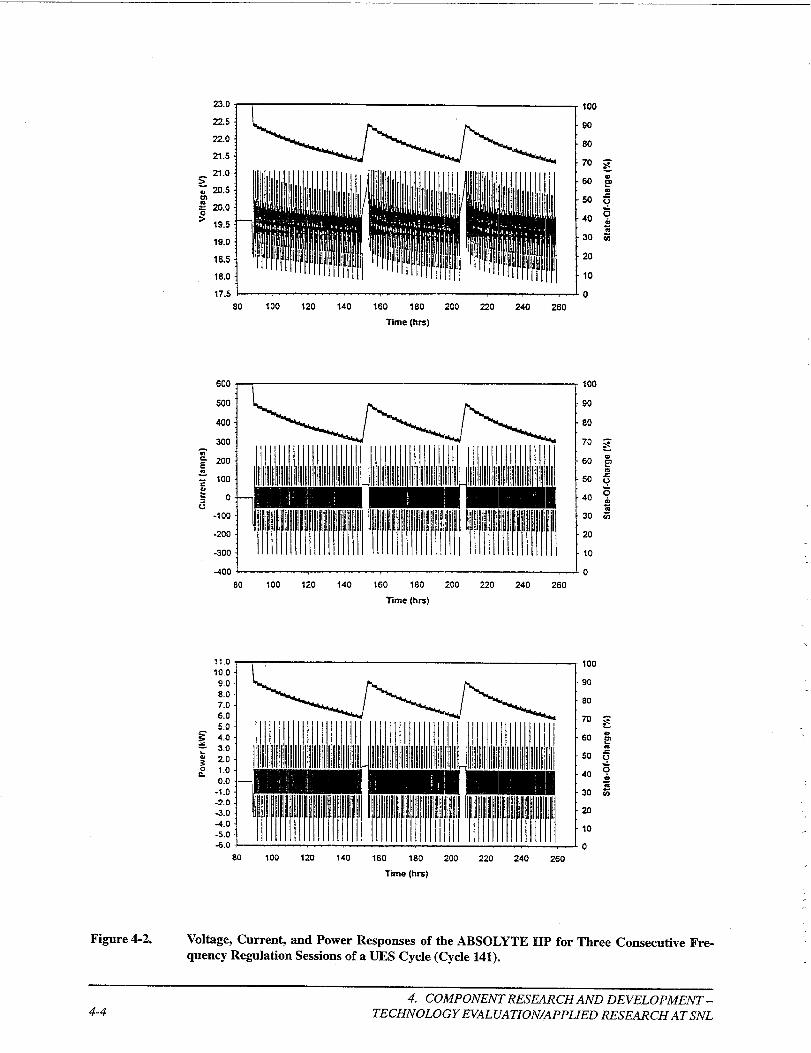
23.0 ~I I 100
Figure 4-2.
s21.0
~ 20.5
g 20.0
‘ 19.5
19.0
18.5
18.01(J
80 100 120 140 160 180 200 220 240 260
lime (hm)
600 y , i 100
-100
-200
-3001
400 I
11.010.09.08.07.06.0
5.04.03.0
2.01.00.0
-1.0
-2.0-3.04.0-5.0-6.0
80 100 120 140 160 180 200 220 240 260
Time (hrs)
80 100 120 140 160 180 200 220 240 260
Time (hre)
100
90
80
70 g
20
10
0
Voltage, Current, and Power Responses of the ABSOLYTE HP for Three Consecutive Fre-quency Regulation Sessions of a UES Cycle (Cycle 141).
4. COMPONENT RESEARCH AND DEVELOPMEiVT-4-4 TECHNOLOGY EVALUATION/APPLIED RESEARCH ATSNL

Table 4-1. Summary of Frequency Regulation Data of a UESCycle on the ABSOLWE 11P(Cycle 141)
Accumulated AccumulatedSOC at No. of Length of Ah Removed Ah Returned Soc
Session Start of Subcycles Session During Session During Session at End of# Session (%) Completed (hr) (AhOut) (Ahln) Session (Y.)
1 90.0 23 60.9 2740 2496 69.5 —
2 90.0 19 50.9 2294 2053 69.8
3 90.0 19 50.2 2260 2017 69.6
SOC = state of charge
Table 4-2. Regimes Used for Recharging the ABSOLYTE II and 11P
Required Time to CompleteRegime from Fully Dischargecl
(C/8) Condition
Regime Name Regime Specifications ABSOLYTE H ABSOLYTE II-
Normal Overcharge (E) Cl (300A) until 2.40 vpc, CV (2.40 vpc) 7 hr 16hr —until 24A, Cl (24A) until 7% overcharge,OC for 8 hr
Boost Charge (B) Cl (300A) until 2.35 vpc, CV (2.35 vpc) 64 hr 64 hruntil 20.8 A, Cl (20.8A) for 8 hr, CV (2.35vpc) for 48 hr
Intermediate Charge (B) Cl (72A) until 2.35 vpc, CV (2.35 vpc) until . .
9070 SOC, OC for 5 min
Refresh Charge Cl (300A) until 2.40 vpc, CV (2.40 vpc) -.
until 24A, Cl (24A) for 2 hr, OC for 8 hr
3.4 hr
16.5 hr
Cl = constant current CV = constant voltage OC = open circuitvpc = volts per cell SOC = state of charge
Each specified test is described below. Specifically, ●
the APS system uses a series string of 96 Type 1OOA-51
cells. Since the SNL test battery uses nine Type
1OOA-25 cells, the power levels of each test were scaled
down. The 281-W discharge rate was scaled down froma system load of 6 kW, while the 1125-W charge rate
.
was scaled down from a charge rate of 24 kW. The testregimes follow:
Constant-Power Discharge (CPD) Test: Dis-charge at the 281-W rate from a full SOC to an
end-of-discharge voltage of 1.75 vpc (100%
DOD).
Recharge Time (RT) Test: Following a constant-
power discharge at the 281-W rate to an encl-of-discharge voltage of 2.03 vpc, recharge at the1125-W constant-power rate to 2.35 vpc, and
4. COMPONENTRESEARCHAND DEVELOPMENT–TECHNOLOGY EVALUATION/APPLIED RESEARCH ATSNL 4-5

then clamp at the 2.35-vpc level until 7% over-
charge is reached.
● Cycling Test: Beginning at full SOC, repeti-
tiously discharge at the 281-W rate to an end-of-
discharge voltage of 2.03 vpc, and then rechargeat the 1125-W rate to 2.35 vpc and clamp at the
2.35-vpc level for 2 hr.
● Discharge Capacity Test: Discharge the battery
at the same rate as the cycling tests (281-W con-
stant power) to 100% DOD (1.75 vpc), and then
recharge at the 1125-W rate to 2.35 vpc. Clamp
at the 2.35-vpc level for 2 hr for the first test,then run a second test and clamp for 12 hr.
The objective of the first test, the CPD test, was to
determine the SOC of the ABSOLYTE 11P at the 2.03-vpc level. The 2.03-vpc level was the set point at which
the generators would turn on in order to recharge thehybrid system’s battery. The concern was whether an
appropriate amount of the battery capacity was being
used when the system was at this set point. At the 281-
W constant-power rate, the ABSOLYTE 11P yielded1625 Ah of total available capacity and took approxi-
mately 105 hr to fully discharge. The battery reachedthe 2.03-vpc level 52.5 hr from the start of the dis-
charge, at which point 785 Ah were removed. Thisequates to 48.3 ?ZOremoval of the total available capacity.
One other piece of information that was of particu-
lar interest from this first test was the drop in voltage at
the start of discharge for the 28 1-W rate (open-circuit to
closed-circuit). The open-circuit voltage just prior tothe start of discharge was measured at 2.18 vpc. The
closed-circuit voltage just after the start of discharge
was measured at 2.13 vpc. Therefore, the voltage dropwas 0.05 vpc.
The objective of the second test, the RT test, was to
determine the length of time required to recharge the
battery at the 1125-W rate to a charge voltage of2.35 vpc and also to an overcharge of 7% from an end-
of-discharge voltage of 2.03 vpc (281-W discharge
rate). Results of this test showed that it took 11.1 hr forthe ABSOLYTE 11P battery to reach the 2.35-vpc charge
voltage from the SOC. At this point 82.7% of the capac-
ity removed during the prior discharge was put back intothe battery. Two hours later, 94.1 Yo was returned.
Finally, after an additional 7.1 hr at the 2.35-vpc chargevoltage level, 7% overcharge was reached. Therefore,
the total required time to reach 7% overcharge (full
SOC) was 20.2 hr from the state of charge.
The objective of the cycling tests was to determinethe discharge capacity stability of the ABSOLYTE 11Pwhen repetitiously cycled as specified in the description
of a cycling test given above. Results of this study areshown in Figure 4-3 and Table 4-3. Figure 4-3 shows a
550
h--d D@arge Rate: 281 W mn.stant powerD-arrje Cut-off Voltage: 2.03 vpc
,,, ,,, ,,, , ,, ,. ,,
Figure 4-3. ABSOLYTE IIP Discharge Capacity Loss Rate for a Specific Renewable ApplicationRecharge Regime: 1125-W Constant Power to 2.35 vpc, Followed by 2-hr Clamp at 2.35 vpc.
4. COMPONENT RESEARCH AND DEVELOPMENT –4-6 TECHNOLOGY EVALUATION/APPLIED RESEARCH ATSNL
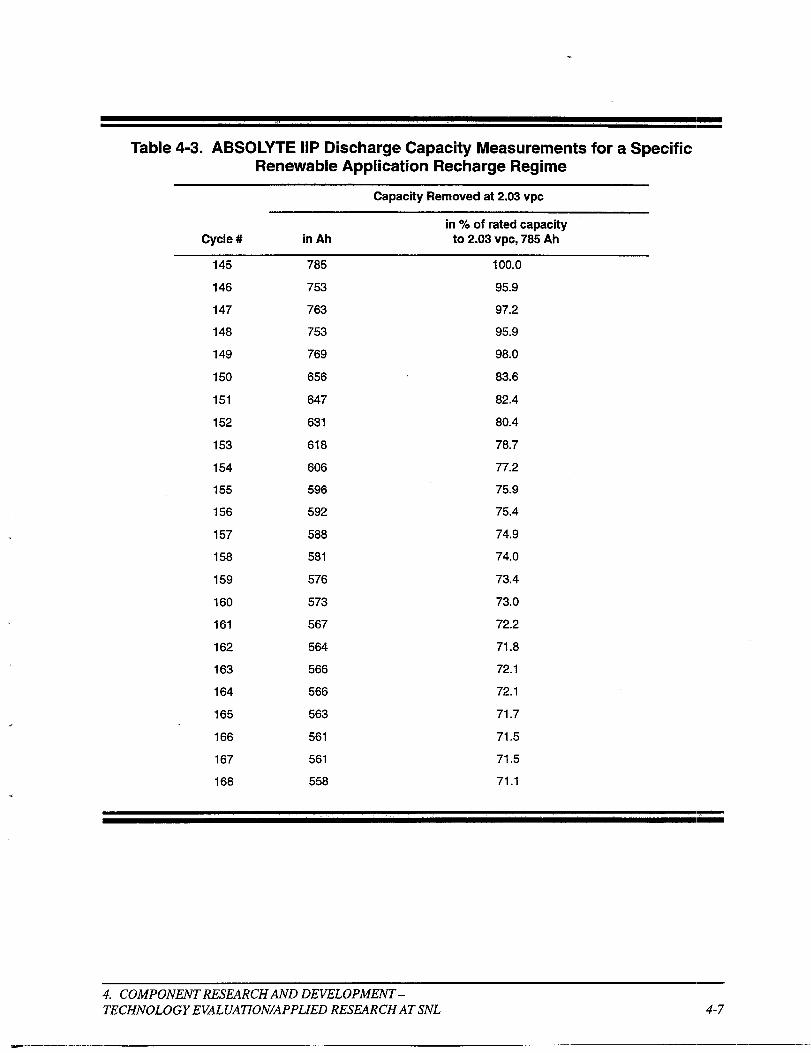
Table 4-3. ABSOLWE 11PDischarge Capacity Measurements for a SpecificRenewable Application Recharge Regime
Capacity Removed at 2.03 vpc
in 70 of rated capacityCycle # in Ah to 2.03 VfJC, 785 Ah
145
146
147
148
149
150
151
152
153
154
155
156
157
158
159
160
161
162
163
164
165
166
167
168
785
753
763
753
769
656
647
631
618
606
596
592
588
581
576
573
567
564
566
566
563
561
561
558
100.0
95.9
97.2
95.9
98.0
83.6
82.4
80.4
78.7
77.2
75.9
75.4
74.9
74.0
73.4
73.0
72.2
71.8
72.1
72.1
71.7
71.5
71.5
71.1
4. COMPONENTRESEARCHAND DEVELOPMENT–
TECHNOLOGY EVALUATION/APPLIED RESEARCH AT SNL 4-7
plot of all measured discharge capacities to the 2.03-vpc
cutoff, while Table 4-3 gives the same information for
the individual cycles, but in tabular form for reference.
It should be noted that for Cycles 145 through 148 the
recharge regime used was not the same as that specifiedabove for cycling tests, but was instead a regime
designed to accomplish fill recharge (7% overcharge).
Measured discharge capacities from these cycles wereincluded to show a representative baseline of typicalperformance for a battery recharged using the manufac-turer’s specifications, which are shown in Table 4-2 as
the normal overcharge (E) regime. Table 4-3 also shows
each measured capacity divided by the rated capacity,
785 Ah, indicating inefficiency of recharge for the
successive cycles.
The larger decrease from Cycle 149 to 150, seen inFigure 4-3, undoubtedly results from the change fromone recharge profile to the other, and represents the
degree of undercharging caused by the partial recharge
regime. However, the gradual decrease from Cycle 150forward was attributed by GNB to a continual buildup of
sulfation on the plates. Because the prior recharge wasnot enough to completely clear the plates, each time the
battery was discharged more sulfation accumulated.
Accumulation of lead sulfate in conjunction with the
loss of sulfate ions from the electrolyte caused an
increase in internal resistance and consequently a loss ofbattery rechargeability.
The objective of the first discharge capacity test
(Cycle 169) with the 2-hr clamp was to determine thedischarge capacity following the cycling test with the2-hr clamp at 2.35 vpc. In order to determine the dis-
charge capacity following this regime, the battery was
discharged at the same rate as during the cycling tests(281-W constant power), but the discharge was to 100%DOD (1.75 vpc). The comparison of this capacity to thecycling test capacity indicates how close the cycling testactually gets the battery to a full SOC. The measuredcapacity for this test was 1384 Ah, which is 8690 of theavailable capacity when the battery starts at a full SOC.
As mentioned previously, the ABSOLYTE HP yielded
1625 Ah for the 28 1-W constant-power rate.
The purpose of the second discharge capacity test(Cycle 170) was to determine the total available capac-ity of the battery following the same charge regime, butinstead of clamping for 2 hr, the charge voltage wasclamped for 12 hr. The result was that the availablecapacity is more than that for the first discharge capacitytest, since the clamp was 10 hr longer. The measuredcapacity was 1538 Ah, which is 95% of the 1625-Ah
measurement.
Upon completion of the four sets of tests performed
for SNL’S PV System Applications Department, the
battery was placed on a life-cycle testing regime. By the
end of FY96, a total of 33 life cycles at the C/8
discharge rate had been performed (Cycles 171-203).
Figure 4-4 is a plot of Ah removed and Ah returned for
these cycles. The charge regime used on Cycle 171 wasthe normal overcharge (E) shown in Table 4-2. Duringthe next 21 cycles (Cycles 172-192), the chargingregime was modified to improve compatibility between
the tester and battery and to try to improve the charge
acceptance of the battery. Charge 1 was changed to
return the Ah that were removed during discharge. Also,
a 5-rein wait period between Charge 1 and Charge 2 was
added. This was later replaced with a cool-down period
to allow the battery temperature to cool to less than
40”C. A third wait period was added before Charge 3,which finished putting in the 7% overcharge. The final
charge regime used for Cycles 193-203 is called the nor-
mal overcharge (F) and is discussed below.
● 5-rnin wait period after discharge.
. CI (300 A) until 21.6 V (2.40 vpc) or Ah
removed are returned.
0 Wait period to allow battery to cool to <40”C.
● CV (21.6 V12.40 vpc) until 24 A or 7’% over-charge.
● 3-rnin wait period.
● CI (24A) until (23,85 V/2.65 vpc) or 770 over-
charge.
As can be seen in Figure 4-4, there was an improve-
ment in battery capacity from Cycle 171 to Cycle 180,but from Cycle 180 to Cycle 203 a gradual decline wasmeasured. Life-cycle testing will continue, and attemptswill be made to identify the cause of the decline incapacity.
ABSOLYTE II Testing
Testing of the ABSOLYTE II deliverable continued
to be performed after the start of testing of the
ABSOLYTE HP. During the first quarter, theABSOLYTE II was subjected to several series of con-stant-current discharge tests. These were done to char-acterize the battery at the C/2, C/8, and C/20 rates to100% DOD, and also to compare performance of theABSOLYTE II design with that of the enhancedABSOLYTE 11Pdesign at the same discharge rates, As
discussed in the UBS Program Report for FY95, the
objective of the performance comparison was to evalu-
4. COMPONENT RESEARCH AND DEVELOPMENT–
4-8 TECHNOLOGY EVALUATION/APPLIED RESEARCH AT SNL

-1350
-1300
-1250
-12002
z-1150
-1100
-1050
-1000
Figure 4-4.
170 175 180 185 190 195 200 205
Cycle
1350
1300
1250
1200
1150
1100
1050
1000
Plot of Ah Removed (AhOut) and Ah Returned (AhIn) for Cycles 171-203 for ABSOLYTEHP.
ate improvements in performance using the ABSOLYTEIIP design over that using the ABSOLYTE II design.
Before beginning these series of constant-current
discharge tests, the ABSOLYTE II was given, as part of
Cycle 52, a boost charge (B) as defined in Table 4-2.
This was to ensure that the plates were cleared of sulfa-
tion and that the battery was completely charged prior tofurther testing. The boost charge (B) regime was the
. same as that used for the ABSOLYTE IIP (described inTable 4-3 of the UBS Program Report for FY95), except
that the constant-current level was scaled down from the24A used for. the ABSOLYTE 11P to 20.8 A. Note inTable 4-2 that both regimes required the same amount of
time to accomplish, 64 hr..
Table 4-4 shows measured capacity results from the. C/2 (425 A) constant-current discharge tests of the
ABSOLYTE II battery. The cutoff voltage was
1.75 vpc. The normal overcharge (E) regime was usedfor recharging prior to each discharge. Also shown inTable 4-4 are results of identical tests performed on theABSOLYTE IIP, also using the normal overcharge (E)
regime for recharging. Capacity measurements for eachbattery have been averaged to make comparison easier.At the C/2 rate, the ABSOLYTE HP delivered 3.6%higher capacity.
Table 4-5 shows a similar comparison of measure-
ments from the C/8 (150-A) discharge tests. The cutoffvoltage for these tests was also 1.75 vpc. As shown in
the table, at this rate each battery delivered about the
same capacity.
Table 4-6 gives the same comparison for the IC/20
(68-A) tests. Again, the cutoff voltage for these testswas 1.75 vpc. Each battery again delivered approxi-mately the same capacity.
These tests show some improvement in capacity athigher discharge rates from one design to the other. Inaddition, evidence of increasing capacity for the
ABSOLYTE IIP design did begin to appear after it
underwent approximately 10 deep-discharge cycles
immediately following a boost charge (Cycle 120).Starting at Cycle 121, which was a C/8 constant-cument
discharge test to an end-of-discharge voltage of1.75 vpc, followed by a normal overcharge (E) recharge,capacity measurements jumped from 1066 Ah (prior to
the boost charge) to 1238 Ah. On the third additionalcycle conducted as stated above, Cycle 124, the mea-
sured capacity peaked at approximately 1300 Ah, Fur-thermore, following the UES cycle testing that was dis-cussed earlier in this report, more of the same C/8discharge/normal overcharge (E) tests were performed
4. COMPONENTRESEARCHAND DEVELOPMENT–
TECHNOLOGY EVALUATION/APPLIED RESEARCH ATSNL 4-9
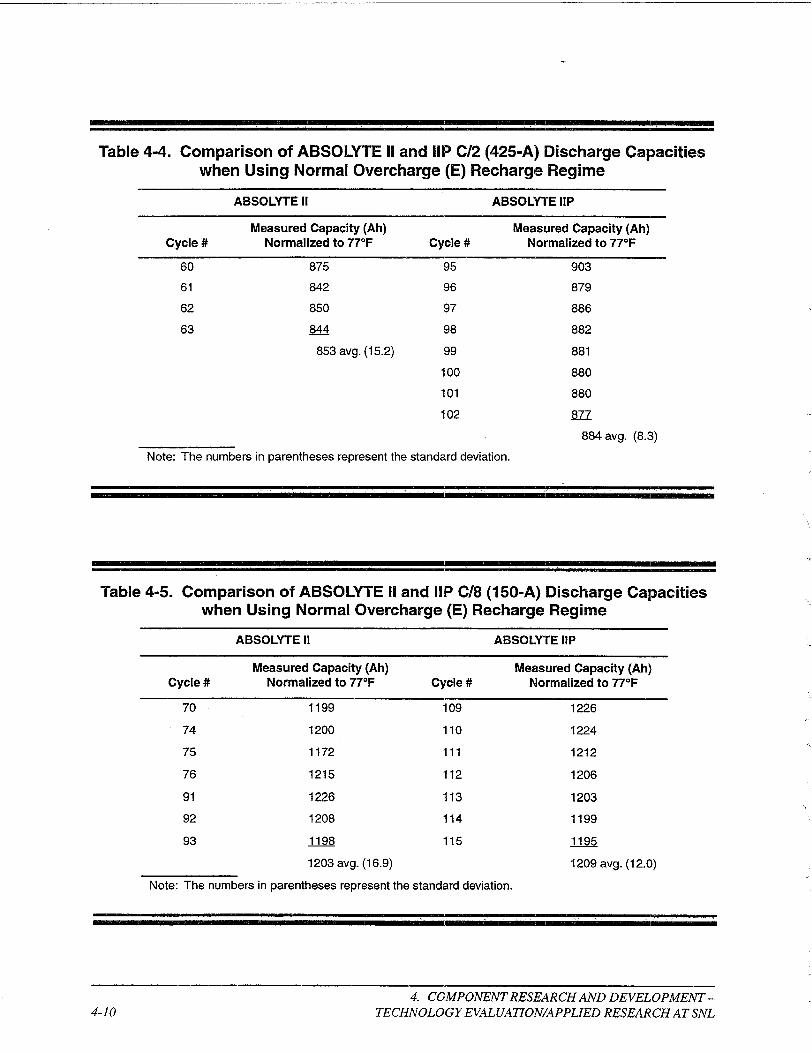
Table 4-4. Comparison of ABSOLWE II and 11PC/2 (425-A) Discharge Capacitieswhen Using Normal Overcharge (E) Recharge Regime
ABSOLYTE II ABSOLYTE 11P
Measured Capacity (Ah) Measured Capacity (Ah)
Cycle # Normalized to 77°F Cycle # Normalized to 77°F
60 875 95
61 842 96
62 850 97
63 m 98
853 avg. (15.2) 99
100
101
102
903
879
886
882
881
880
880
m
884 avg. (8.3)
Note: The numbers in parentheses represent the standard deviation.
..
Table 4-5. Comparison of ABSOLYTE II and 11PC/8 (150-A) Discharge Capacitieswhen Using Normal Overcharge (E) Recharge Regime
ABSOLYTE H ABSOLYTE HP
Measured Capacity (Ah) Measured Capacity (Ah)Cycle # Normalized to 77°F Cycle # Normalized to 77°F
70 1199 109 1226
74 1200 110 1224
75 1172 111 1212
76 1215 112 1206
91 1226 113 1203
92 1208 114 1199
93 11.X3 115 11.95
1203 avg. (16.9) 1209 avg. (12.0)
Note: The numbers in parentheses represent the standard deviation.
4. COA4PONENTRESEARCH AND DEVELOPMENT–
4-10 TECHNOLOGY EVALUATION/APPLIED RESEARCH ATSNL

Table 4-6. Comparison of ABSOLYTE II and 11PC/20 (68-A) Discharge Capacitieswhen Using Normal Overcharge (E) Recharge Regime
ABSOLYTE II ABSOLWE 11P
Measured Capacity (Ah) Measured Capacity (Ah)Cycle # Normalized to 77°F Cycle # Normalized to 77°F
65 1454 104 1452
66 1449 105 1420
67 1447 106 1451
1438 avg. (25.0) 1435 avg. (19.1)
Note: The numbers in parentheses represent the standard deviation.
(Cycles 142 to 144). The measured capacity again
peaked at approximately 1300 Ah. Assuming that avail-
able capacity of the ABSOLYTE II does not increasefrom 1200 Ah further along in its life, the ABSOLYTE
HP now appears to be providing an 8.3% improvementin capacity at the 8-hr constant-current rate.
GNB later explained that the density and weight ofthe positive active material paste of the ABSOLYTE IIPdesign were increased from their levels in the
ABSOLYTE II design. Although it is logical to assume
that this would provide an increase in capacity, initially
this was not the case because the increased density
restricted diffusion of electrolyte. However, as the bat-
tery was cycled, the active material became somewhatmore porous, allowing for better diffusion of the electro-lyte and resulting in the increased capacity measure-ments. Additionally, longer life under cyclic conditionscan be expected. Unfortunately, it takes approximately
125 deep cycles to access the extra available capacity ofthe ABSOLYTE HP. Also, during this period the
required time to fully recharge the ABSOLYTE 11Pusing the GNB-prescribed normal overcharge (E)
regime is approximately 9 hr longer than that for theABSOLYTE II, as is shown in Table 4-2.
All measured capacities of the ABSOLYTE IIcycles shown in Tables 4-4, 4-5, and 4-6 have been plot-
ted on the Peukert Plot of Figure 4-5. Note that allcapacity values for each rate are overlapped to illustratecapacity stability.
Testing of the ABSOLYTE II continued into the
second quarter of this fiscal year. During the second
quarter, a special study was initiated to determine the
effect on discharge capacity of the ABSOLYTE II afterfloat charging at specific constant-voltage levels. The
purpose of the study was to provide guidance to NMSUin the setup of renewable systems for the U.S. CoastGuard that utilize the ABSOLYTE technology for
energy storage.
Specifically, each test consisted of a float charge at
either 2.15 VPC,2.18 vpc, or 2.21 vpc, followed by a C/8
(150-A) constant-current discharge to an end-of-dis-
charge voltage of 1.75 vpc. Float charges for eaclh test
were accomplished by first applying an in-rush currentof 100A to the battery until the desired float voltage was
reached, at which time the voltage was clamped for theremainder of a 72-hr period. However, some clf thecycles were interrupted before the 72-hr mark. The2.15-vpc test was repeated six times, while each of the2.18-vpc and 2.21-vpc tests was repeated three times.
Results of all 12 tests are summarized in Table 4-7.
Included in the table are the exact times that the
ABSOLYTE II spent at each of the two recharge steps
for each cycle, as well as the measured capacity fcdlow-ing each float charge. The inefficiency of float chargingat each of the three levels is represented in the lastcolumn as percentage of nominally measured capacity(at 1200 Ah) for each discharge capacity measurement.
In summary, the average available capacity of theABSOLYTE II after float charging at the 2. 15-vpc level
4. COMPONENT RESEARCH AND DEVELOPMENT–
TECHNOLOGY EVALUATION/APPLIED RESEARCH ATSNL 4-11

100
1
10 100 1000
Log Discharge Rate (Amps)
Figure 4-5. Peukert Plot of ABSOLYTE II Constant-Current Discharges.
Table 4-7. Effect of Various Constant-Voltage Float Levels on the ABSOL~E II
Charge Required Length of Affected PercentageVoltage Time to Reach Time Charge Affected Discharge
Chargeof Nominal
Level Charge Voltage was Discharge Capacity (Ah), Capacity toCycle # (Vpc) Voltage (hr) Held (hr) Cycle # Normalized to 770F 1.75 Vpc (%)
79 2.15 2.7 64.2 80 861 71.8
80 2.15 2.7 69.3 81 877 73.1
81 2.15 2.9 69.1 82 862 71.8
82 2.15 2.5 69.5 83 856 71.3
83 2.15 2.5 69.5 84 865 72.1
84 2.15 2.5 68.2 85 876 73.0
76 2.18 4.7 19.3 77 966 80.5
77 2.18 4.8 67.2 78 1022 85.2
78 2.18 3.9 68.1 79 1018 84.8
85 2.21 5.4 66.6 86 1123 93.6
86 2.21 5.1 66.9 87 1106 92.2
87 2.21 5.4 66.6 88 1041 86.8
4. COA4PONENTRESEARCH AND DEVELOPMENT -
4-12 TECHNOLOGY EVALUATION/APPLIED RESEARCH ATSNL
is approximately 72$Z0. The average available capacity
after float charging at the 2. 18-vpc level is approxi-
mately 849Z0. The average available capacity after float
charging at the 2.2 l-vpc level is approximately 91 Yo.
This trend suggests that float charging at the next
0.03-vpc increment (2.25-wc) would provide for
approximately 100’ZOrecharging, and 2.25 vpc is thelowest recommended float voltage specified in the oper-ating manual for the ABSOLYTE II.
During the fourth quarter of FY96, major software
changes were made on the tester to enable life-cycletesting to continue on the ABSOLYTE II. In addition, a
problem with the data transfer from the tester to the data
base was encountered. Because of these issues, testing
of this battery was temporarily suspended. However,
life-cycle testing will continue in FY97.
Yuasa-Exide Dynacell DD Modules (Type DD-35-7)
In March 1995, Yuasa-Exide provided SNL with 10
Dynacell DD modules (Type DD-35-7). Seven of these
modules were forwarded to PG&E for testing at their
new Battery Test Lab, while the remaining three mod-
ules were retained by SNL for evaluation. The modules
kept by SNL were configured into a series string. Each
module consists of four VRLA cells, except for the third
module of the string. This module has only three cells
because one cell was removed due to a low open-circuitvoltage of 0.5 V when received by SNL. Below are thedeveloper’s specifications and test limitations for thisunit:
Phvsical Parameters
Weight: 767.34 kghnit or 255.8 kg/module
Volume: 150 L/unit or 46 L/module
Dimensions: 42.9 cm (1) x 37.95 cm (d) x
92.33 cm (h)/unit or 13.03 cm (1)x37.95 cm (d) x 92.33 cm (h)/mod-
ule
A “module” is 4 interconnected cells.
A “unit” is 3 interconnected modules.
Unit Ratinw
Nominal string voltage open circuit (OC):23.3 V @(11 cells)
Nominal individual cell voltage (OC):
full Soc
2.12 v @ full Soc
Capacity: 110 Ah @ 8-hr rate to 10.25 V
(1.75 vpc) cutoff (13.5A for 8 hr)
Energy: 2.5 kwh @ 8-hr rate to 19.25 V
(1.75 Vpc) cutoff
Char8e/Dischar~e Termination Conditions
Charge:
Maximum Charge Voltage: 26.4 V (2.4 VpC)
Maximum Charge Return: 15070
Maximum Temperature During Charge:43°C(110”F)
Discharge:
Minimum Discharge Cutoff Voltage:11.OV (1.0 Vpc)
Maximum Discharge Starting Temperature:29°C (85”F)
Test Objectives
A test plan was developed by SNL, and the c}bjec-
tives of testing are as follows:
1. Confirm the electrical performance rating,.
2. Evaluate the battery’s capability to meetrequirements for renewable energy applica-tions.
3. Determine the service life of the battery.
Testing of the battery started in July 1995. The first
cycle performed on the battery was a C/8 (13.5-A) dis-
charge followed by an equalizing charge. The chargecurrent started at 44 A and was allowed to taper until thevoltage reached 25.85 V or 37 hr had passed. Dluring
the next 18 cycles (Cycles 2 through 19), the batteryperformed C/8 discharges to 19.25 V. For these cycles,
the battery was charged at a constant current of 30 A to
25.3 V or an 8% overcharge, whichever came first. For
the next 20 cycles (Cycles 20 through 39), the batterywas discharged at different rates including C/3 (36.2 A),
C/12 (9.3 A), and CJ8. A Peukert plot, based cm theresults of these cycle,s, is shown in Figure 4-6. Thecharge regime for these cycles was the same as that forCycles 2 through 19. Capacity tests at a C/8 dischargerate were performed for Cycles 45 through 53; however,the charge regime was modified slightly. A two-stepcharge was started. The first charge (a standar[i “D’charge) (see Table 4-8) was at 44 A to 25.85 V or 5%
overcharge followed by a 3-A charge to 26.95 V. Cycles
4. COMPONENT RESEARCH AND DEVELOPMENT–
TECHNOLOGY EVALUATION/APPLIED RESEARCH AT SNL 4-13

—
100
1
SNL 634Peukert Plot at C13, C18, and C/l 2
I t
I Ii +
II I I I I I I I I I I I I I I I I
I
r I I
cII 2 Rate (9.3 amps)
IdC/8 Rate (13 K =-=),,
II I 1 ,,, ,,
I I I I
“.” !A!, cpQ, # I
aI I I I I I
I I I I I I I I I I
1 1 1
C/3 Rate (36.2 amps)
u
‘1 10 100
Log Discharge Rate (Amps)
Figure 4-6. Peukert Plot of Yuasa-Exide Dynacell Battery Constant-Current Discharges.
54 through 62 were also discharged at a C18 rate, but
additional changes were made to the charge regime. A
5-rein wait period was added between Charge 1 and
Charge 2 (a standard “E’ charge). This was done to easethe transition from 44A to 3A. Cycles 63 through 100were also performed at the C/8 discharge rate, but thecharge regime was again changed. For these cycles, thetime duration of Charge 2 was increased to 8 hr to
increase Ah and to stabilize the capacity. This cycle
regime is identified as a standard “F’ charge. Figure 4-7
is a plot of Ah removed and Ah returned during the 50
plus cycles performed in FY96. Once the final charging
regime was selected, the testing results appeared to
become more stable. Life-cycle testing will continueuntil the battery has lost 20% of its rated capacity.
Lead-Acid SLI Battery Testing
Community Power, a U.S. company, contacted SNLfor testing assistance on batteries slated for use in PV
systems in Indonesia. Although this battery is not par-
ticularly suited for PV applications, restrictive Indone-
sian import rules that prohibit the import of lead-acidbatteries required that Community Power and theirIndonesian customers use locally produced PafectaYuasa lead-acid SLI batteries, as there are no deep-cycling batteries manufactured in Indonesia.
The batteries (Table 4-9) arrived in September
1996, dry charged, which meant electrolyte that was
prepared by SNL personnel in accordance with the man-ufacturer’s specifications had to be added to the batter-
ies.
After electrolyte was added, a two-step formation
charge was performed (Table 4-10). Step 1 entailed a
constant-cument charge at the C/20 rate for 20-24 hr.
Step 2 was performed using a constant-current charge at
the C/6 rate for 5-6 hr. Following the formation charge,a capacity verification cycle was performed. Discharg-
ing was done at the C/5 rate and recharge also at the C15
rate to 120’%0of discharge capacity.
The goals of this test are defined as follows:
1. Obtain a maximum number of daily PV batterycycles.
2. Establish a reliable battery low-voltage discon-nect (LVD) level for the electronic PV system
controller.
3. Assess battery performance in an application
not normally suitable for lead-acid SLI batter-ies.
4. COMPONENT RESEARCH AND DEVELOPMENT–4-14 TECHNOLOGY EVALUATION/APPLIED RESEARCH AT SNL

Table 4-8. Standard Charge Regimes
“A” Charge “B” Charge “C Charge “D” Charge “E” Charge “F” Charge
Charge at 30 A Charge at 30 A Charge at 44 A Charge at 44 A Charge at 44 A Charge at 44 Ato a 8% over- to an 870 over- to a 5’% over- to a 5’% over- to a 5% over- to a 5% over-charge or cutoff charge or cutoff charge or cutoff charge or cutoff charge or cutoff charge or cutoffat 25.3 V at 25.85 V at 26.4 V at 25.85 V at 25.85 V at 25.85 V
5-rein rest 5-rein rest Charge for 2 hr Charge for 2 hr 5-rein rest 5-rein restat 2 A or cutoff at 3 A or cutoffat 26.95 V at 26.95 V
Wait until one Wait until one 5-rein rest 5-rein rest Charge for 2 hr Charge for 8 hror more thermo- or more thermo- at 3 A or cutoff at 3 A or cutoffcouples show couples show at 26.95 V at 26.95 Vtemperature temperaturebelow 29°C below 29°C
Wait until one Wait until one 5-rein rest 5-rein restor more thermo- or more thermo-couples show couples showtemperature temperaturebelow 29°C below 29°C
Wait until one Wait until oneor more thermo- or more thermoc-ouples show couples showtemperature temperaturebelow 29°C below 29°C
Note: All cycles start with a C/8 (13.5A) discharge to 19.25 V followed by a 5-rein rest.
4. Provide consultations on the operational set
points and chaging strategy for the proposed
Alternative Power Technologies (APT) charge
controller for the Community Power system.
PV cycling (Table 4- 11) will consist of shallow dis-
charging of the battery followed by a partial recharge,thus simulating a PV day. This process is repeated
several times until the batte~ reaches the LVD, roughlyequal to a 50% battery SOC. At this point the battery is
then fully recharged to 120% of its discharged capacityand PV cycling is resumed. This process is repeateduntil the battery is unable to provide an adequate num-
ber of PV cycles.
VRLA Reliability Improvement Project
VRLA batteries have been commercially availablefor more than 10 yr and have been enthusiasticallyembraced by users of UPSS because of the anticipated
reduction in maintenance costs and smaller footprint
available with this technology. As field experience has
accumulated, it is becoming more widely appreciated
that VRLA batteries are more sensitive to their operating
conditions than flooded lead-acid batteries. This is par-
ticularly true under conditions such as elevated tern[pera-tures or overcharging, which promote battery dryout instarved-electrolyte designs, thereby shortening batterylife compared to what users are accustomed to in a float-
type application. Much anecdotal evidence has circu-
lated over the past few years concerning premature lossof capacity or thermal runaway incidents invc)lvingVRLA batteries. Although the majority of recent VRLAfailures can be attributed to abusive environments or
improper float-charging conditions, there is a lack of
confidence among current users that all of the potentialVRLA problems have been identified. All of this infor-mation has made potential utility battery customersmore reluctant to adopt BES technology, particularly ifVRLA designs are being proposed.
Because SNL believes that the VRLA battery tech-
nology does offer real advantages in utility and renew-
4. COMPONENT RESEARCH AND DEVELOPMENT–
TECHNOLOGY EVALUATION/APPLIED RESEARCH ATSNL 4-15

-160.0
-140.0
-120.0
50 .100.0”
2
-80.0
-60.0
-40.0
I I I■
Cycles45-53--Standard “D charge ❑ AhOut
II ❑ Ahln
Cycles 54-62--Standard “E” charge■ Ahln depends on overcharge of AhOuL
decreasing capacity due to decreasingrecharge. Vicious cycle.
1 ,, 1 I , 1
‘&3 ❑CICID ❑ODqya uu u~m mrmn ❑nmwxm
Open circuit for 29 ~ours between’Cycle 75 and Cycle 76.
I I ICycles 63:153 --Standa;d “F chargeIncreasing CHARGE2 time to 8 hours soboth AhOut and Ahln are stabilized.
5U.O
40.0
20.0
0.0
0.0
0.0
40 50 60 70 80 90 100 110
Cycle
Figure 4-7. Life-Cycle Capacity Plot at C/8 Diecharge Rate for Yuasa-Exide Dynacell Battery.
Table 4-9. Community Power Batteries Tested by SNL
Model Number N-40 NS-70 N-1 00
Capacity, Ah’ 40 65 100
Voltage 12 12 12
*At C/20 rate.
Table 4-10. Two-Step Formation Charge Amp-Hours
Model Number N-40 NS-70 N-1 00
Amp-Hours of Charge 39.11 62.85 98.52
4. COMPONENT RESEARCH AND DEVELOPMENT–
4-16 TECHNOLOGY EVALUATION/APPLIED RESEARCH ATSNL

Table 4-11. PV Cycling Regime for Community Power Batteries
Model Number Daily Load Daily Recharge Recharge after LVD
N-4o 9.7 Ah @ 2.85A 8.7 Ah@ 2.34 A 120% charge @ 2.34A
NS-70 14.9 Ah 62 4.42A 13.4 Ah @ 3.55A 120% charge @ 3.55A
N-100 19.6 Ah @ 5.54A 17.6 Ah@ 4.73 A 120% charge @ 4.73A
able energy applications, a VRLA reliability improve-ment project is being planned. The primary objective of
this project is to determine whether VRLA designs are
capable of a reasonable cycle and calendar life under
typical utility battery operating conditions and use
modes. The sensitivity of YRLA designs to their envi-
ronment and charging conditions could also be investi-
gated in such a program through independent testing
that would more thoroughly define the limits at whichbattery life is affected. If battery performance underexpeeted utility operating conditions is not satisfactory,
or if previously unrecognized failure modes are discov-
ered, then design or material changes could be sug-
gested to address those needs. SNL anticipates thatheavy involvement and cost sharing by the VRLA
battery manufacturing industry would be necessary for
this project to succeed. During FY96, SNL presented
these issues to many stakeholders, obtained feedback onindustry concerns and interest in participating in such a
project, and strove to determine how a group could beformed to validate the reliability of the core VRLA tech-nology in utility applications.
status
During the second quarter, personnel from SNL and
EndIcon visited Yuasa-Exide, Inc., to discuss recentdevelopments in the ESS Program and to obtain the
Yuasa-Exide perspective on the utility battery market.VRLA battery reliability perceptions and needs werealso covered as part of this meeting. Several causes forVRLA failures were discussed, including dryout, plategrowth, and improper charge control. Yuasa-Exide feels
that a major disconnect still exists between customer
expectations and actual battery life in many applications
of VRLAS. It was suggested that it would be beneficialto establish a consistent set of requirements for equip-.ment such as PCSS that must interface with the batteryin utility or standby power systems. SNL may be able tohelp develop such a set of requirements. This issue is
related to reliability because of the importance of charge
control as a major factor that affects battery perfor-
mance and life. Interest was also expressed in indepen-dent testing of Yuasa-Exide products that are inteuded
for the utility battery market.
Further discussions were held on generating a pro-
posal for collaboration on VRLA battery perfomiimce
and reliability evaluations. Ways to structure a prog~amthat would encourage participation by a wide cross sec-tion of battery manufacturers need to be found. Thk
will likely be difficult because of the potential sensitiv-ity of some of the test data that could be generated.
Informal contacts with other manufacturers indicate at
least a general interest in pursuing discussions aboutwhat the reliability issues are. Yuasa-Exide has also
continued to express interest in collaborating with SNL
on testing of some of its specific sealed-battery prod-
ucts. This work could be done as a separate project or
might possibly be incorporated as part of a huger reli-ability study. SNL has not responded to Yuasa-Exide at
this point because the content of a more general reliabili-ty study that could be supported by a group of manufac-
turers has not been clearly established. A planning
meeting among the interested participants will likely benecessary to reach a consensus on the goals and content
of this more generic program. Teaming with other orga-nizations that have existing programs in related areas,
e.g., the Advanced Lead-Acid Battery Consortium
(ALABC) program of the International Lead ZincResearch Organization, Inc. (ILZRO), is also beingexplored as a way to include a wider range of partici-pants and leverage some of the costs.
Sodium/Sulfur Applied Research atSNL
SNL is concluding an effort to develop prototypethermal fuses for sodiun-dsulfur batteries. Thermal fus-ing addresses a concern that individual cell failures gen-erating electrical shorts could lead to catastrophic failure
4. COA4PONENTRESEARCH AND DEVELOPMENT–
TECHNOLOGY EVALUATIONIAPPLIED RESEARCH ATSNL 4-17
—

of a battery. The objective of this task is to demonstrate
the feasibility of a fuse concept for use in the sodiuml
sulfur battery technology. Cast metal fuses appear to be
able to satisfy many of the requirements on an initial listobtained from Silent Power, Ltd. (SPL), a sodium/sulfur
battery developer.
The only pure material with a melting temperaturenear the desired fusing point for a sodiumlsulfur battery
is zinc, with a melting point of 419.5°C. However, this
is still below the 450°C fusing point that would be con-
sidered iderd. Zinc also has the disadvantage of oxidiz-
ing very rapidly, particularly at its fusing temperature.
The oxide shell that forms on the surface of the moltenzinc seems to hinder the fall of the drop off the electricalleads to the fuse, and the circuit often remains unbroken.
Although it has been shown that the operation of the
zinc fuse can be made more reliable by increasing the
gap between the electrical leads, some effort wasexpended to identify alternative fuse materials with both
higher melting points and less tendency to oxidize.
Status
A series of high-temperature solder alloys was eval-uated for use in the thermal fuse. Functional testing was
completed on trial fuses cast from four different binary
alloy compositions. Electrical continuity was measured
while these samples were heated in air and also, in some
cases, in an inert atmosphere where oxidation should not
be a factor. An improved carbon mold has been used forcasting trial fuses with different gap widths between the
leads. This mold allows gaps of up to 20 mm to be cre-ated for evaluation of whether the various candidate fuse
materials differ in their ability to drop cleanly from theleads during a fusing test. Prior to casting the trial fuses,
the alloy formulations were characterized by differential
scanning calorimetry. Their melting points were as
expected, which indicates that the formulations were
correct and that no impurities had been inadvertently
introduced. Onset temperatures for the melting endo-
therm ranged from 427°C to 5 IO”C, depending on thecomposition.
In an inert atmosphere of argon, most of the trial
alloy fuses with a 5-mm gap between the Ieads did open(see Figure 4-8), although in a few cases this did not
occur until well above the alloy melting point. The mol-ten drop still tended to hang in place for the more vis-
cous of these materials. In air, the test results were lesspromising at a 5-mm gap, with most samples failing to
open. Figure 4-9 shows a typical set of results. These
alloys appear to also be oxidizing to some extent, simi-lar to the case with zinc. When the gap width was
&xl
I
FURNACETEMPERATURE
01
O.co
0,08
0.07
z006 E
.cgw
00s ga1-%
o~ ~
u
0.03
0.02
0.01
0
0 0.5 1 1.5 2 2.5
TIME (hours)
Figure 4-8. Fusing Test Results in Argon on au Alloy Fuse with a 5-mm Gap Between the Leads.
4. COMPONENT RESEARCH AND DEVELOPMENT –
4-18 TECHNOLOGY EVALUATION/APPLIED RESEARCH ATSNL

Soo, , 0.025
Ml
400
200
tm
FUSE AND FURNACE
‘EMp’”T”RE\L7
=--+’..Opened furnacedoor to observefuse.
/
/ ‘ RESISTANCE
/
No[e: Three thermocouples were used.One was placed on the fuse body itself, theother was placed on the Ni lead and thethird was the furnace temperature.
0.02
0,W5
JfJo 0.5 1 1.5 2 2.5
TIME (hours]
Figure 4-9. Fusing Test Results in Air on an Alloy Fuse with a 5-mm Gap Between the Leads.
increased to 10 mm, most of the alloy fuses did fimction The most promising candidate for the fuse material
successfully in air. Data from a successful fusing test was an alloy that melts at about 460°C on the differen-
are shown in Figure 4-10. Increasing the gap width is tial scanning calorimeter. Trial fuses made with this
the simplest way to obtain a workable fuse design with material opened in air at temperatures of 470”’C orthe alloys. A 1O-MM gap width would not increase the below when the gap width in the fuse was set at 10IMM.overall size of the fuse too much for it to fit into most All of the experimental data from the fusing tests and
sodiumkulfur battery modules. other material characterization experiments have nowbeen reduced. The collection of this information into asummary report is well under way and a draft will becirculated for review shortly.
4. COMPONENT RESEARCH AND DEVELOPMENT–
TECHNOLOGY EVALUATION/APPLIED RESEARCH AT SNL 4-19

ml
4%
402
350
G_ 300
w
5
$ ‘w
n.zW’cab
la
10C
%
o
FUSETEMPERATURE_
1
+— FURNACETEMPERATURE
o 0.2 0.4 0.6 0.8 1 1,2 1.4
TIME (hours)
Figure 4-10. Fusing Test Results in Air on an Alloy Fuse with a 10-mm Gap Between the Leads.
0.1
0.09
0.0s
0.07
GO.w g
~UJ
OS6 g$g
0.04 ~u
0.03
0.02
0.01
0
4. COMPONENT RESEARCH AND DEVELOPMENT –
4-20 TECHNOLOGY EVALUATION/APPLIED RESEARCH ATSNL

5. Integration
Introduction
Activities in the Integration and Implementation
element involve pursuing a strategy that will reduce the
inefficient, one-of-a-kind system engineering histori-
cally required when an energy storage system is
designed and built. A “modular battery” system
approach has been adopted as the prefemed method to
achieve system flexibility and the lowest possible cost.
Under this approach, the major subsystem components
(battery and electrical) are designed as separate modulesso that integration can occur either at the factory or theutility site. From a cost perspective, the modular
approach permits more efficient engineering, design,
and manufacturing processes. Performance and service-
life qualification of hardware incorporating prototype
designs will also be performed. This activity involves
the detailed characterization of performance, mainte-
nance requirements, and reliability (service life) of inte-
grated systems at relevant utility sites. The qualification
of hardware incorporating prototype designs and associ-ated manufacturing methods represents the final step ofengineering development.
Factory-Integrated ModularStorage (FIMS) Systems
One of the prefemed system-integration strategiesinvolves factory assembly and testing of modules that
each contain a storage subsystem, PCS, and controller.The motivation for producing these “factory-integratedmodular” (FIM) systems is to save the 30-to-50% costburden typic~y associated with custom engineeringdesigns, on-site installation labor, and startup times.
A number of FIM technology designs progressed
under the ESS Program during FY96, several using the
ACBC lead-acid-based battery and the zinc/bromine
battery developed under the ZBB contract. The devel-opment associated with the near-term ACBC technology
is at the production-engineering phase (precommercial-ization). The ACBC tasks will be completed with FY96funding. This situation contrasts with the preliminary
battery development that is being completed this yearfor the two advanced batteries (sodium/sulfur and zinclbromine). During FY96, work on the zinc/brominebattery system will involve prototype engineering andsubsequent field demonstration.
and Implementation
AC Battery Development ContractWrap-Up
Several important tasks were not completed follow-
ing delivery of the AC Battery PM250 prototype
because of funding limitations in the original contract.
Several contracts were placed with Omnion Power Engi-
neering to complete these tasks. One contract was
placed to support maintenance requirements of the
PM250 during field testing. The purpose of this contractis to provide field engineering support and repair materi-als for hardware failures and maintenance during thecharacterization and life testing of the PM250 prototype.
A second contract was placed to complete the finalreport and cost projections for the AC Battery prototype
development program. The purpose of this secondcontract is to complete the documentation for the AC
Battery project.
Ststus
A draft final report on the PM250, Final Report on
the Development of a 250-kW Modulac Factory-Assem-bled Battery Energy Storage System, was receivecl for
review in early June. Following review and markup, thePM250 final report will be published as a SAND report
for distribution early in FW97. The PM250 Prototype
Production Cost Estimate Report is also expected to be
completed and published in early FY97.
Transportable Battery Energy StoragleSystem (TBESS)
The goal of this project is to further the deploymentand evaluation of prototype battery systems built with
commercially available and advanced components intypical utility operating environments. The projectcovers the design, fabrication, siting, installation, test-
ing, and reporting on the system. The system will bedesigned such that it can be moved to a new location (on
the same or on a different utility grid), installed, andtested. During these projects, the systems that are devel-
oped will be used by one or more utilities over a multi-year period to obtain field data at more than one site toprove the reliability, functionality, and cost-effectivenessof the system and to determine the benefits of BE,S inelectric utility systems. Current plans are for the entireproject to span a five-year period. A significant cost-share (about 50%) is required for this project.
5. ZNZEGRATIONAND IMPLEMENTATION 5-1
—

TBESS Development
This project is part of a collaborative activityknown as the Transportable Battery System (TBS) Pro-
gram, which is an initiative of DOE and EPRI. A con-
tract was to be placed for the design, fabrication, and
testing of a utility-scale transportable battery system to
be evaluated at multiple sites in partnership with a
selected utility. SNL collaborated with EPRI on the
development of the SOW for this project, and a similarproject was initiated by EPRI. An RFP was issued bySNL in late FY95. The goal of the project was to furtherthe deployment and evaluation of prototype batterysystems built with commercially available and advancedcomponents in typical utility operating environments.
Status
On August 5, 1996, negotiations were completedand the ESS TBESS contract was awarded to AC Bat-tery Corporation, a subsidiary of GM based in East
Troy, Wisconsin. Under the terms of the contract,ACBC will design, integrate, and test an AC BatteryPQ2000 on a fully mobile low-boy trailer. During the
first quarter of FY96, early in the request for quotation
(RFQ) phase of the TBESS project, the DOE Program
Manager suggested that the project focus on solving
high-visibility power-quality problems. Consequently,modifications to the final RFQ required that the TBESS
be operated in a power-quality mode at a power level of
2 MW for 15 sec. Terms of the contract also requiredsubstantial cost sharing in which SNIJDOE would payfor the design and development phases of the activity
and the successful bidder and utility partner would cover
all costs for system hardware and field testing.
The first deliverable on the contract, received on
August 28, 1996, consisted of a conceptual design draw-
ing, a detailed project schedule, and a detailed systemsite plan. The initial schedule indicated that the TBESSwould be delivered to the first test site and remain therefor a period of 6 mo. Terms of the contract require thatthe TBESS be moved to a second site, set up, and oper-ated for a period of 6 mo. The final report for the project
is due April 30, 1999.
Figure 5-1 shows the initial conceptual design for
mounting a PQ2000 system, consisting of the PQ2000
battery container, the electronic selector switch, and thesystem output transformer on a standard-length low-boy
trailer. The only interconnection required at the host sitewill be to the 480-VAC service entrance at the utility testsite, which will minimize setup time at the customer’sfacility.
Because of internal conflicts within the original
utility partner’s business sector, the utility partner with-
drew from participation on the TBESS contract in late
September, causing major concern among the project
participants. ACBC immediately began negotiationswith other utilities who had expressed early interest in
1 373
240.5~
I
~ See Detail ‘B” (SNLOOO03)
\ Liquid Tight FlexibleSteel Conduit (Sealtite)
Figure 5-1. Initial Conceptual Design for the TBESS.
5-2 5. INTEGRATION AND IMPLEMENTATION
the TBESS project. It is anticipated that ACBC will
identify a new utility partner early in FY97.
Advanced Battery Energy StorageSystem (ABESS)
ABESS Development
The Preliminary Opportunities Analysis performed
during FY94 showed that advanced batteries have a
clear and important role in BES. ‘l%e VRLA technology
has the potential to satisfy most UES applications.
However, its primary deficiency is with those applica-
tions that place importance on footprint and portability
and where higher energy capacity is required (durationof more than 1 hr). Relevant large-volume applicationsinclude T&D facility deferral, renewable, and cus-tomer/transit system peak reduction. Advanced batter-
ies (e.g., sodiundsulfur and zinc/bromine) may fill thisvoid.
During the 1980s, the DOE-sponsored development
of the UES sodiumlsulfiu and zinc/bromine technolo-
gies permitted their conceptual feasibili~ to be vali-
dated and set the stage for focused subsystem develop-
ment. In the recently completed contracts with SilentPower, Inc. (SPI) and ZBB, an iteration of componentengineering has been performed to resolve specificutility-battery feasibility issues. Also, preliminary
battery engineering is now being completed that will
identify any remaining long-term development require-
ments and, importantly, provide the basis for enteringthe relatively expensive battery-level engineering devel-
opment and demonstration phase. Concurrently, devel-
opment of other candidate advanced batteries with thedesirable characteristics of higher energy/power ratio
and relatively low footprint has also been proceedingwith both private and public funding. The focus of these
latter efforts is typically on portable consumer or elec-
tric vehicle applications. Nevertheless, some compati-
bility between the capabilities of these batteries and
UES requirements may exist.
The establishment of a meaningful role foradvanced batteries in UES applications combined withtheir progressing development status warrants a new and
dedicated effort to ensure that viable advanced batterysystems will be available by the turn of the century.
This task will address the need described above,and a contract will be initiated during FY96. Becausethe identification of customers for this technology is thecritical element to the final, production-engineering
phase of development, the focus or end product of this
task is to be a field demonstration at a utility or customer
site. This prototype integrated system (battery, PCS,
controls) is to perform one or several UES ap@ica-
tions. As such, the active participation of an advanced
battery developer, a utility customer, and a PCS manu-
facturer will be required. In addition, targeted applica-tions must be selected that are consistent with the needsidentified in the Opportunities Analysis and hat ci~not
optimally be satisfied with lead-acid technology. Lead-acid battery technologies are precluded from consider-
ation. Finally, a significant factor in the contractor
selection process is that a high probability for project
success must be demonstrated. If funding is available,more than one award may be made.
The SOW will, in general, cover the following
tasks:
●
*
.
●
●
●
.
.
ABESS specifications and field-test plan
Engineering design
ABESS fabrication
Acceptance testing
Documentation and training for field testing
Preparation for testing
Field testing
Decommissioning
The principal activities to be performed during
FY96 will involve the initiation of a contract. This willinclude (1) formulation of an SOW and evaluation crite-
ria, (2) release of an RFQ to all qualified domestic sup-
pliers, (3) evaluation of the proposals and contractorselection, (4) contract placement, and (5) initiation of
the SOW.
Status
The RFQ for this project was released by SNL in
mid-January 1996. The deadline for quotes was March
1996. Several proposals were received; however, addi-
tional information was needed in order to adequi]tely
evaluate the proposals. A letter requesting additional,
specific information from the proposers was sent outand the deadline for submission extended to July 1996.
System Field Evaluation
Qualification of hardware that incorporates proto-type designs will also be performed in this element of
the program. This activity involves the detailed charac-
terization of the performance, maintenance require-
5, INTEGRATION AND IMPLEMENTATION 5-3
—
ments, and reliability (service life) of an integrated sys-
tem at relevant utility sites. Once the usefulness of these
designs is proven (qualified), private industry will takeresponsibility for completing the final “commercial
product” phase of engineering development.
AC Battery PM250 PrototypeRenovation Project with AC BatteryCorporation
After completion of the AC Battery PM250 fabric-ation and testing effort conducted by Omnion Power
Engineering Corporation, a contract was placed with ACBattery Corporation (ACBC) for the maintenance and
upkeep of the AC Battery PM250 prototype while it was
being prepared for resumption of testing following the
retrofit of the system battery complement. The ACBC
prototype container had to be renovated before testing of
the system could resume because the container had sat
idle for over a year while the modules were being retro-fitted at Delphi Energy Systems. Also requiring atten-tion were deficiencies in the module’s PCS printedcircuit boards that resulted from field engineering modi-fications made while the initial test program was under
way and errors in the system software that were discov-
ered during initial field testing.
Status
Final testing and qualification of the AC Delco AES
2010 battery was completed by the Delphi Energy teamearly in the first quarter of FY96. Preliminary results ofthe tests on the first preproduction batch of batteriesindicated that a revised design had substantially
enhanced battery cycle life. A full production run for
the complete battery set was completed in early Decem-ber 1995. SNL requires that a random sample of six bat-teries be selected and shipped to SNL for the purpose ofcycle testing the batteries at the SNL battery labora-
tory. Delphi shipped six batteries to SNL in mid-Janu-ary 1996.
After removal of the PM250 container from thePG&E MGTF test pad during the second quarter ofFY96, the PM250 container underwent complete refur-bishment and checkout at the AC Battery facilities in
East Troy, Wisconsin. Initial evaluation of the container
at AC Battery indicated that multiple problems had
occurred during the long period that the container satidle on the MGTF test pad while the modules werebeing retrofitted with new batteries at Delphi EnergySystems. During the third quarter of FY96, the eightPM250 modules, complete with new AES 2010 batter-ies, were thoroughly checked out in the Delphi Energy
Systems container in Indianapolis, Indiana. The mod-
ules were shipped to AC Battery during the fourth quar-
ter of FY96. The systematic checkout of the containerelectronics and module PCSS performed by the AC
Battery engineers and technicians resulted in the elimin-
ation of most problems, and startup is expected in early
November 1996, when all of the modules are scheduled
to be mated with the container for full-power testing,
Cosmetic cleanup of the container shell resulted in alike-new appearance for the PM250 container, all evi-dence of weather and shipping wear and tear havingbeen eliminated.
AC Battery PM250 Field Evaluation atPG&E
The AC Battery PM250 prototype testing program
was idle throughout FY95 while new batteries were
being evaluated for the retrofit of the entire battery com-plement. Information obtained from the initial field test-
ing program at PG&E indicated that the batteriesselected for the prototype were inadequate to supportthe AC Battery operational requirements. To acquire avolume production battery with the capabilities to
support all AC Battery applications, a comprehensive
evaluation program was undertaken by Delphi Energy
Systems of Indianapolis, Indiana, a division of General
Motors. Delphi Energy Systems is funding the battery
selection and replacement activity. Testing of the new
batteries in the renovated AC Battery prototype is sched-uled to resume at PG&E in FY96 following the comple-tion of the PG&E testing program for the PQ2000.
Status
Testing of the AC Battery PM250 prototype at thePG&E MGTF remained on hold throughout FY96 as the
PM250 modules underwent retrofitting with new DelcoAES 2010 batteries at Delphi Energy Systems in India-napolis, Indiana. During the retrofit period, the emptyPM250 container rested on the test pad at the MGTF.
To make room for PQ2000 test activities at theMGTF, the empty PM250 container and utility isolationtransformer were removed from the MGTF test site andshipped to AC Battery early in the second quarter ofFY96. While at AC Battery, the PM250 container is
scheduled to undergo a complete checkout and refur-
bishment in preparation for its return to field life-cycletesting. The modules were scheduled to be installedduring the first quarter of FY97, after which complete
system testing will be conducted. The factory accep-tance test of the PM250 is scheduled for the first quarterof FY97.
5-4 5. INTEGRATION AND IMPLEMENTATION

Field Test of PQ2000
Following the completion of the DOE Cooperative
Agreement for the PQ2000 design, fabrication, and fac-
tory testing activity, the PQ2000 will be transported tothe PG&E MGTF for field acceptance testing. SNL has
responsibility for providing technical consulting ser-vices to the DOE Albuquerque Operations Office (ALO)
Cooperative Agreement manager.
status
The first PQ2000, which was designed and fabri-
cated under a program jointly sponsored by PG&E, AC
Battery, Omnion Power Engineering Corporation, and
the U.S. DOE, was shipped from ACBC to the PG&E
MGTF in mid-April. Following a successful shakedown
test, the PQ2000 entered a comprehensive field test pro-
gram. During the quarter, control strategies were evalu-
ated to determine an optimum “sense and switch” algo-
rithm that would minimize the number of battery useevents triggered by small voltage excursions above
minimum power quality specifications. The original
switch strategy was based on a feeder switching concept
that did not take into account the number of times a
switching event took place as it determined whichfeeder was providing power of the best relative quality.In a battery source system, it is essential that a battery-
supported event be initiated only when the primaryfeeder falls below minimum quality specifications. Theimplementation of the new algorithm resulted in a sig-
nificant drop in switching events while allowing the
PQ2000 to meet all minimum power quality specifica-
tions at the load.
During the test program, several iterations of the“reconnect strategy” were evaluated to establish appro-
priate criteria to meet when reconnecting the utility tothe customer load at the end of a maximum battery dis-charge period, typically 10 sec. The original specifica-tion required that the PQ2000 restore connection of the
customer load to the utility at the end of the maximum10-sec discharge period irrespective of the condition of
the utility. Based on experience gathered during field
testing, it was determined that the utility would not be
reconnected unless it met minimum quality standards.
This condition was implemented when it was discoveredthat single phasing of three-phase motors resulted intheir destruction when the utility was restored with oneor two phases present. Implementation of this field
engineering modification resulted in several months’
delay in the testing program.
Preliminary test results demonstrate that the
PQ2000 has the ability to effectively detect and elimin-ate voltage sags, voltage swells, and momentary out-
ages. As utility service voltage exceeds a devii~tion
threshold limit, the system’s electronic selector device
(ESD) executes the transfer to battery power. As Figure
5-2 illustrates, the PQ2000 is capable of switching to
stored batte~ energy in approximately 1/4 of a cycle.The top waveform displays the recorded voltage andmomentary outage that occurred on the utility supply
line. The time required to get the output load voltage upto the expected utility supply voltage was measured at1.6 ms, which makes the total event 5.4 ms in duration
or l/240th of a second.
Figure 5-3 illustrates the transfer back to utility
power after the disturbance has cleared and the system
has synchronized phase with the utility. A 2-see delay
before switching back to the utility service has beenincorporated into the system’s control program to pre-
vent excessive transfer oscillation between utility and
battery power. If the disturbance has not cleared after
10 see, the system will shut down or execute a transferof the critical load to a standby engine generator, if that
option has been specified.
The current system has-been validated for 10 sec of
continuous or cumulative cycle runtime without a com-
plementary recharge. Calculations and testing show thata 10-second discharge of the battery at the full ratedl out-
put of the PQ2000 consumes less than 490 of its charge.The high-power, short-duration discharge capability ofthe Delco 1150 battery makes it highly suitable fcr the
PQ2000 application.
Figure 5-4 shows estimated battery cycle life as a
function of DOD. The Delco 1150 is expected to pro-
vide in excess of 3000 cycles over an expected life of
more than 5 yr, given the application, duration, and fre-quency of voltage sags and momentary outages. Limit-ing discharge times to 10 sec balances DOD with cyclelife expectations and thermal load limits of the system.The 10-sec limit more than matches the applicationrequirements while substantially improving the battery
cycle life and discharge performance.
A battery recharge cycle is initiated immediately
after a discharge event. Battery modules are simultan-eously but independently recharged using the propri-
etary algorithm designed specifically to maximize
charge cycle efficiency of the Delco 1150. Laboratorytests conducted on individual batteries have shown that
battery cycle life nearly doubled as a result of using thealgorithm and contributed substantially to eliminatingelectrolyte stratification.
A major factor governing battery recharge time isDOD. Each second of discharge at 720 A requires 2-1/4
minutes of recharge to restore the battery to 90’% of its
5. INTEGRATION AND IMPLEMENTATION %

1’”: “’:” ‘:’’.’”’’T’?”:’,.
cti4 zoom: 6.2X I@ .OX Hoti ””: ! ;: ;.:::.,. . .
t:::: 1:1 : : : : j
Ch3 2.S0 V m 2.SOV
A-B 48o VACLOADVOLTAGE
B-C 480 VACLOAD VOLTAGE
A-B 48o VACUTILITY VOLTAGE
B-C 480 VACUTILITY VOLTAGE
Figure 5-2. Voltage Interruption on One Phase of the Utility and Load Picknp by the PQ2000.
Figure 5-3. Synchronous Transfer Back to the Utility.
predischarge potential. Up to one additional hour is scale power quality system. As a result, many field
needed to restore the remaining 10% of the battery’s engineering modifications were made to the control
potential for a continuous, full- 10-see discharge. strategies to meet PG&E engineering change requests;
Recharging may, however, be interrupted to service these modifications were based on practical operational
another disturbance. requirements discovered during field testing activities.
Overall, the PG&E test program for the firstTesting continued throughout ‘the year wi~ sporadic
PQ2000 yielded new and unanticipated information oninterruptions while engineering fixes were implemented.
the functional and operational requirements of a utility-The completion of the testing of the first PQ2000 isscheduled for late in the first quarter of FY97.
5-6 5. INZEGRATIONAND IMPLEMENTATION

Figure 5-4.
10000
8000
6000
4000
2000
0 I I I I I1 , , I0246810
‘%0Depth of Discharge (DOD)
Battery Cycle Life Plotted as a Function of DOD.
Field Test of Final VRLA BatteryDeliverable
As the final deliverable from the VRLA battery
development contract, GNB furnished a 250-kW,500-kWh battery for a field test. The site selected for
this test was the GNB lead recycling center in Vernon,
California, and a new contract was placed with GNB atthe beginning of FY96 to carry out the field testing.
GNB has installed a battery system at the recycling cen-ter to support critical plant loads during utility power
outages so that no violations of air emission standardscan occur. This system is capable of providing 3.5 MW
of power to the plant for 1 hr and a peak power of 5 MWfor 10 sec. The battery consists of two parallel strings of
GNB 100A99 ABSOLYTE 11PVRLA cells. Each stringcontains 378 cells operating at a nominal 756 V. Battery
energy is converted to plant AC voltage by three General
Electric (GE) power conversion units, each rated at
1.25 MW.
The battery is also available for periodic block load-ing to reduce plant peak loads and demand charges.
Operation of this system provides an opportunity toevaluate the performance of a large VRLA battery whileit is used in axi actual field application. Approximately10% of the battery cells at Vernon were supplied by the
ESS Program.
A remote communications link has been established
between the Vernon site and GNB’s engineering labora-tories in Lombard, Illinois, which makes it possible tomonitor all status screens of the control system, includ-ing those for battery status, plant power requirements,status of the power conditioning equipment, and alarmconditions from the remote terminal. The data pre-
sented by the battery monitor screens include batteryvoltage, battery current, battery temperature, and ambi-ent temperature. Through a password-protected screen,
it is also possible to operate the BESS from this remote
terminal, either turning on the battery at specific power
levels for plant support or carrying out battery testing.
Status
During the first quarter, trials were carried out todemonstrate the capability of the BESS to take cwer
from the utility grid and provide power to support theoperation of the recycling plant. In November, the fol-
lowing procedures were successfully completed as part
of these trials:
●
✎
●
✎
●
✎
✎
The plant was taken over three times from the
utility at an “ON BESS” loading of 2377 kW,
The battery system carried the “ON BESS” loadfor a cumulative period of 30 min (for three con-
secutive tests).
The BESS was successfully synchronized with
the utility feeder to return the plant load to the
utility.
The plant load shed algorithm that is used toshut down noncritical loads during “ON BESS”
operation was verified.
A 1OO-HP motor was successfully started whilethe plant was “ON BESS.”
Data were collected during these trials on plant
harmonics and the response time of the battery
and power conditioning equipment using a high-speed strip chart recorder.
The operation of the BESS operator and displaypanels was verified, the battery SOC and dis-
charge time remaining algorithms were tested,
and the operation of data screens during chargeand discharge was demonstrated.
5. INTEGRATION AND IMPLEMENTATION 5-7

● Volt-amp reactive (VAR) compensation during
recharge of the battery was added, and groundfault alarms during battery recharge were tested.
Two training sessions for Vernon plant personnel
responsible for operation and maintenance of the BESSfacility were also held. At the completion of system
testing, the battery will be turned over to the plant andwill be operated like any other piece of plant equipment.
GNB will retain an engineering role and will monitor
the battery for proper operation to ensure optimized
battery life. GNB will also verify life projections bytesting and examining the battery.
Following the system trials in November, a list of
action items was developed for correcting minor issues
relating to the inverters, battery, and remote data acqui-
sition. Most of these were directed at GE, which has
primary responsibility for the power conversion equip-ment and the system electronics. All these action itemswere resolved by early in the second quarter. One of
these issues was related to erroneous converter alarms
during the system trials. The source of these alarms was
traced by GE to a specific control board, which wasreplaced after a redesign of the circuitry. Discussionswere also held between GE and GNB regarding limita-
tions that have been identified in retrieving data from the
BESS. These limitations prevent direct importing of
data to a remote spreadsheet program. Specific data
fields that GNB wouId be interested in retrieving foranalysis were identified, and GE will provide a transla-tor program that will allow this to be done. This willalso allow absolute parameter values to be displayed,which is preferred over the percentage (O-1007o) of arange that was initially displayed by the system.
During December 1995, the battery was tested and
inspected. The battery delivered 98% of its rated capac-ity when discharged. Following this discharge, the
battery was recharged and then given an equalization
charge to force cells to vent. After the equalizationcharge, all ground faults resulting from the cells ventingwere located and neutralized. The battery was consid-
ered ready for normal system operation with the com-
pletion of these conditioning steps and was placed onopen circuit awaiting completion of the electronics mod-ifications.
GE continued to modify the system control soft-ware during the second quarter to eliminate certain con-
trol issues that were uncovered during the initial systemtrials conducted in the first quarter of FY96. This soft-ware modification work was carried out at the GE facili-
ties in Schenectady, New York. The battery was alsochecked early in the second quarter to remove a fewremaining ground faults that were discovered following
the equalization recharge. GNB’s field service techni-
cians removed cells showing a ground fault condition,cleaned and neutralized the battery racks and cells with
ammonia solution, and replaced the cleaned cells intheir original positions. The battery was then returned
to float charge so that it would be available to provide
uninterrupted power to the Vernon facility in the event
of a local power failure.
GNB also completed the collection of the baseline
characteristics and performance capabilities of the
battery installed at the Vernon BES facility. The follow-ing were among the data collected:
1.
2.
3.
Impedance values of 156 sample cells were
measured using the Elcor Model IM1801
impedance measurement meter. Average inter-nal resistance of these cells was 0.22 mohm;
the 3-sigma value was 0.05 mohm.
The float-charge voltage was measured for 312
battery cells. Average float-charge voltage was
2.250 v the 3-sigma value was 0.023 V.
The discharge voltage and current for both bat-
tery strings was measured at 3-rein intervals
during a nominal 1500-kW discharge. A plot
showing these data is provided in Figure 5-5.
Additional data from this baseline dischargewere transferred to an Excel spreadsheet file so
they could be summarized in a statisticalformat.
While the BES system was in the standby mode,occasional instances were noted where the power con-trol pair (PCP) inverters faulted. These faults were char-
acterized by a sudden dip in battery string voltage for no
apparent reason. This information, along with the PCPaku-dfault codes triggered during these periods, was
forwarded to GE for analysis and corrective action, ifrequired. There was no indication that the battery wasdischarged during these periods. It was also observed
during battery baseline tests that estimated battery SOCdeviated significantly from actual battery SOC during
the early portion of a discharge. GE felt that changes tothe algorithm that corrects for discharge rate and battery
temperature would improve accuracy, and GNBrequested a cost estimate to do this.
During the early morning hours of February 20,1996, the plant did experience a utility outage, and theBES system did take over the full load of the plant.Although the utility power outage only lasted a few min-utes, the battery system was configured for a “manual”reconnect to the utility, which never occurred. As a
5-8 5. INTEGRATION AND IMPLEMENTATION

Vernon Bess Dischsrge
~;m
Figure 5-5. Discharge Voltage and Current for Battery Strings Measured at 3-rein Intervals during aNominal 1500-kW Discharge.
result, the battery was allowed to support the entire plant
for over 2 hr, which completely discharged the battery.When the battery gave a low voltage alarm, the plantwas finally manually transferred to the utility. The
system has since been reconfigured for “automatic” res-toration and reconnection to the utility once the utility’s
power feed has been restored. During the remainder of
the second quarter, no further utility failures occurred
and the battery essentially remained in a float-chargemode for the entire period, except for demonstrations
during facility visits.
A test plan for the Vernon BES system was devel-
oped in accordance with the SOW requirements of the
SNL contract. The plan covers the balance of the firstyear of this contract, through approximately October1996. After establishing baseline characteristics for
selected sample cells from the battery, three block-load-ing operational scenarios will be developed to collect
battery trending and efficiency information. The plan isto operate the battery for a minimum of 1 mo at each ofthe operational scenarios. Information on the Vernon
smelter’s operating loads was collected daily to providea basis for selecting the three block-loading scenarios.
GNB hosted visits to the BES facility by represen-tatives of Metlakatla Power and Light and SNL in Feb-
ruary 1996. During each visit, it was demonstrated how
the BESS could take over part of the plant’s load fromthe utility by increasing the BES contribution tc) theplant in steps from 0.5 MW up to 1.5 MW. Both local
and remote control, as well as return of the plant to the
utility and battery recharge, were also demonstrated.The facility tour included the battery, converters, switch-
yard, and control computer. A project review meetingwas also held with SNL to discuss the test plan and
schedule for all activities planned for the first year clf thefield demonstration.
It was proposed by GNB that organized visits to theVernon facility be conducted in conjunction with the
ESA meeting in May and the Institute of Electrical andElectronics Engineers (IEEE) T&D Show in the fall of1996, since both will be in the Los Angeles area. Thefirst of the seminars/workshops required by the contractmight also be held to coincide with the IEEE T&D
Show in order to take advantage of the good audiencethe show will attract, as long as no logistics problemsare identified.
The battery was operated only in a “float” chargemode during the first part of the third quarter ancl wasavailable for any power outage that might occur at the
facility. While it was operating in this mode, further
5. INTEGRATION AND IMPLEMENTATION 5-9
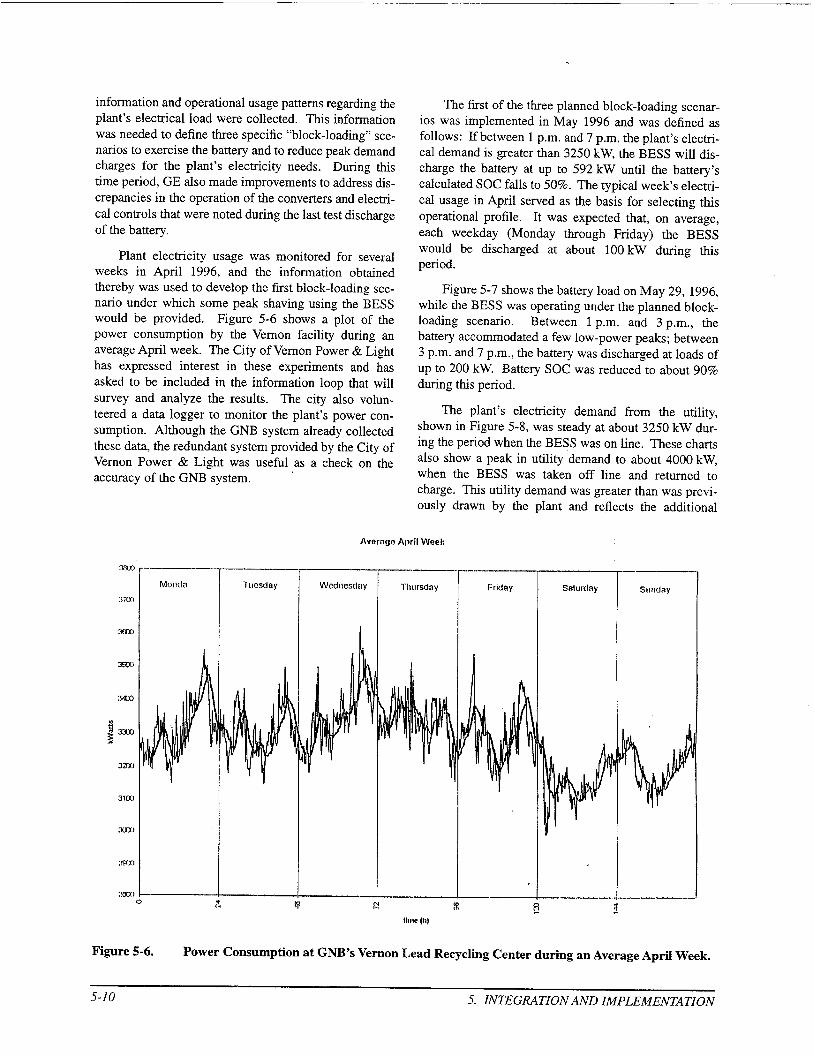
information and operational usage patterns regarding theplant’s electrical load were collected. This information
was needed to define three specific “block-loading” see.narios to exercise the battery and to reduce peak demand
charges for the plant’s electricity needs. During thistime period, GE also made improvements to address dis-
crepancies in the operation of the converters and electri-
cal controls that were noted during the last test discharge
of the battery.
Plant electricity usage was monitored for severalweeks in April 1996, and the information obtainedthereby was used to develop the first block-loading sce-nario under which some peak shaving using the BESS
would be provided. Figure 5-6 shows a plot of thepower consumption by the Vernon facility during anaverage April week. The City of Vernon Power& Light
has expressed interest in these experiments and has
asked to be included in the information loop that will
survey and analyze the results. The city also volun-teered a data logger to monitor the plant’s power con-
sumption. Although the GNB system already collected
these data, the redundant system provided by the City ofVernon Power & Light was useful as a check on the
accuracy of the GNB system. ‘
:W.U
:3T.r)
XIX)
xxx)
34X)
J :)~
x
:Im)
:Ilal
XIX
m-x]
xxx)
The first of the three planned block-loading scenar-ios was implemented in May 1996 and was defined asfollows: If between 1 p.m. and 7 p.m. the plant’s electri-
cal demand is greater than 3250 kW, the BESS will dis-charge the battery at up to 592 kW until the battery’s
calculated SOC falls to 50Y0. The typical week’s electri-
cal usage in April served as the basis for selecting this
operational profile. It was expected that, on average,
each weekday (Monday through Friday) the BESS
would be discharged at about 100 kW during this
period.
Figure 5-7 shows the battery load on May 29, 1996,while the BESS was operating under the planned block-
loading scenario. Between 1 p.m. and 3 p.m., thebattery accommodated a few low-power peaks; between
3 p.m. and 7 p.m., the battery was discharged at loads ofup to 200 kW. Battery SOC was reduced to about 9070
during this period.
The plant’s electricity demand from the utility,shown in Figure 5-8, was steady at about 3250 kW dur-
ing the period when the BESS was on line. These chartsalso show a peak in utility “demand to about 4000 kW,when the BESS was taken off line and returned to
charge. This utility demand was greater than was previ-
ously drawn by the plant and reflects the additional
Avernge April Week
I F[idny
I
Simlldriy Sllrlrhy
Figure 5-6. Power Consumption at GNB’s Vernon Lead Recycling Center during an Average April Week.
5-1o 5. INTEGRATION AND IMPLEMENTATION
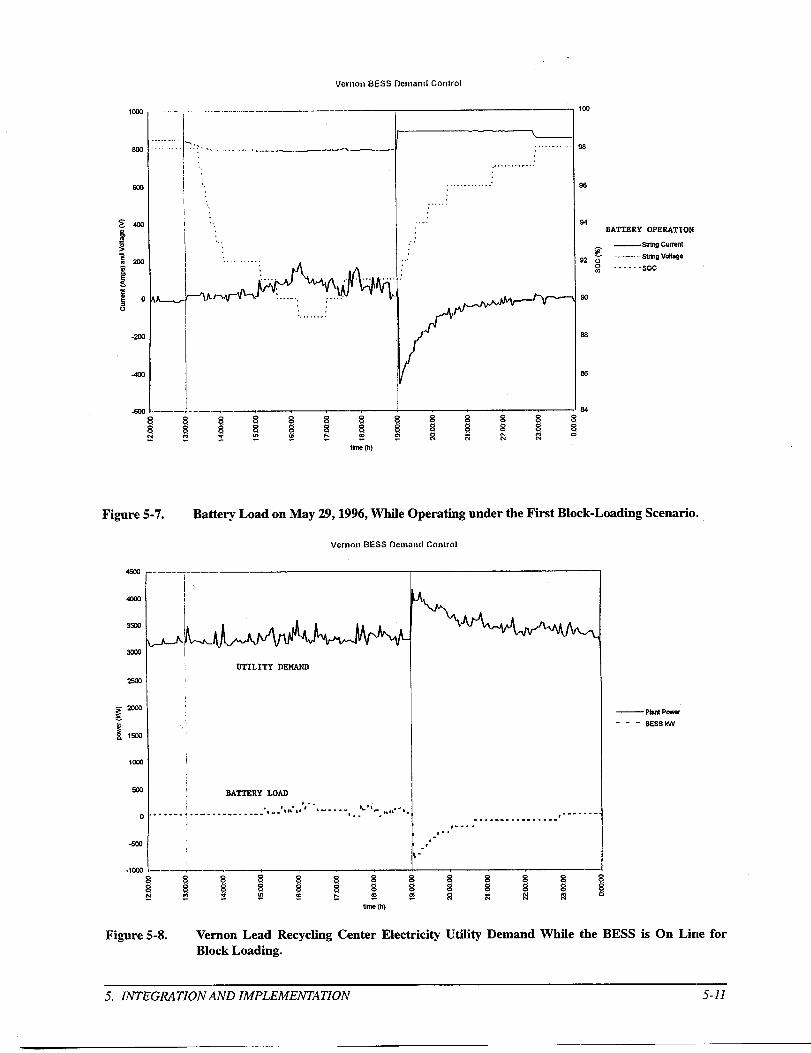
Vernrn) BESS Demand Control
Ima
ml
-m
40C
. .
.. ..
&
-.—-
,>... . .. \._. .-_+_-.. -..—----
!.
.
......&hhq ...?An \.’....... ..,:,......,.-
\.
.......... ..
. ....
.
,.. .
.’
9s
56
94BATTERY OPESATION
—string currentg
92 u -- .–- - String V.aiia9eg . . . ..SOC
so
Ss
e6
S4
UIW (h)
Figure 5-7. Battery Load on May 29,1996, While Operating under the First Block-Loading Scenario.
Vernon BESS Ilenmnd Crmlrnl
4s03
.lcm
Ssm
sow
.25ca
g-
i law
m%
xc
(
-sol
-lox
I1’
IITILITYDEMAND
,i
!
BATTSRY LOAD. . .
. . . . . . . ..- . . ..-- . . . . . ..-.’’’.’” ,. ’.-’’--,,,,. -,,,- . . . .
I
1-
....----........,----,..
-.”$-
,. . . . . .
—Planr POwer-.. BESSkW
Figure 5-8. Vernon LeadBlock Loading.
Recycling Center Electricity Utility Demand While the BESS is On Limle for
5. INTEGRATION AND IMPLEMENTATION z

power required by the battery for recharge. GNB engi-
neers attempted to reduce this peak by extending thewindow during which the battery was operational, thus
pushing the recharge period for the battery out to a timewhen there was less base load demand by the plant (i.e.,
the early morning hours of each day). This was not an
unexpected requirement for optimization of power con-
sumption as part of the overall operation of the BESS.
Using an extended operational load profile (1 p.m.
to midnight), the battery was operated for approximately
1 mo, functioning both during weekdays and over week-
ends. On a typical weekday, the battery output was on
average approximately 100 kW, on weekends, the aver-age BESS discharge was approximately 70 kW. Underthis profile, the battery’s DOD on weekdays was
approximately 13Yo,whereas on the weekends the aver-
age DOD was only 9%, Charts of the plant utility draw
and BESS output for a typical weekday and a typical
weekend day are shown in Figure 5-9. Because of the
relatively low DODS, a second operational scenario wasplanned that would allow the BESS to pick up loadsabove a 3000-kW plant demand. The goal was to exer-cise the battery more and achieve a greater reduction of
the utility load during peak periods.
In May 1996, the Vernon BESS was the tour site for
representatives from the ESA (formerly the Utility
Battery Group (UBG)). Representatives from GNB and
GE gave presentations to about 60 visitors at various
locations in the Vernon BESS. Development of plans
for the first of the project seminars required by the field
testing contract was begun. Presentation topics thatwould be most beneficial to the audience attending such
a seminar were discussed so that appropriate speakerscould be suggested.
During June 1996, 2.5-MW discharges were con-ducted on each of the two parallel battery strings at Ver-
non. The purpose of these tests was to determine theheat generation at the individual cell terminal posts dur-ing this high-rate usage. Engineers monitored thermo-
couples that were placed at cell terminal posts, intercellconnector bars, and interstack connector bars during the
tests. All temperature values remained below the critical
temperature criterion of 2 12°F. The greatest amount ofheat was generated at the inter-stack connector.
In July, the Vernon BESS load peak-shaving profilewas modified to increase the battery’s DOD in this mode
of operation. The new operating scenario had thefollowing characteristics:
● The BESS is available for peak shaving between1 p.m. and midnight.
● The BESS supplies plant demand greater than2900 kW.
● Maximum discharge rate in a peak-shavingmode for the BESS is set at 592 kW.
Compared with the initial load peak-shaving sce-
nario, which supplied plant demand greater than
3250 kW, this modified scenario discharged the battery
to a greater depth with each daily cycle. Using the pre-
vious scenario, the nominal DOD was approximately
15%; the modified scenario discharged the battery to
approximately a 50% DOD. A chart showing thebattery SOC and the BESS output for a typical series ofdaily BESS cycles is provided in Figure 5-10.
GNB also learned during July 1996 from the City ofVernon (the electric utility provider) that certain timing
constraints must be observed for the BESS operation to
reduce GNB’s electric bill. The monthly price of power
at the Vernon facility is based on the highest peak
reached between the hours of 1 p.m. and 7 p.m. from thefirst of each month onward. An appropriate time of dayto operate the BESS had been selected, but the start ofeach operating scenario had to be timed so that it would
be in effect on the first of the month for the impact onelectricity cost to be determined. GNB planned to ini-
tiate an operational scenario sometime prior to the first
of the month and then operate it through at least oneweek beyond the first of the next month to allow opera-
tion of the BESS to be fully reflected in the monthly
utility bill.
The BESS system automatically alarmed due todetection of a ground fault during July 1996. Before thecell that exhibited the ground fault could be replaced,
utility power was lost and a filter fault occurred due to a
voltage spike. This took the system out of operation
temportily. Although the ground-faulted cell wasreplaced and the system placed back “on line” in a
standby mode, some additional cells showing high-
resistance ground faults also had to be replaced beforeimplementation of the modified load peak-shaving sce-
nario for a full billing month. The BESS system wasdown for a good portion of the month of August 1996while this and other maintenance was carried out on the
battery and inverter. Seventeen individual cells thatwere questionable due to either a potential ground faultor low voltage at the end of the periodic discharges werereplaced. The torque of all of the intercell connectionsin the battery was checked at the same time, and GE per-
sonnel visited the site to perform routine inspections ofthe inverter equipment while the system was off-line.
The BESS was restarted on September 10, 1996,using the modified load peak-shaving scenario describedearlier, which provides power when plant demand is in
5-12 5. INTEGRATIONAND IMPLEMENTATION

Average waek day BESS output
2702
2s0
2t02
lsm
2mo
m
zlm
Km
1701
mm
.9,*
R.—..——. . ..__. _.__._, h..4...—.— - —
,8 \.*.,.-.-.-+\.81
##
. . ------- -—----- ---------- I —..-.#
. I. I
!—
8
1<
98——-.—- .-. —.. -.. -—- .—. --—— .— —.- ..— —. .— .——. . . . , . -.,
18mJ
u’ ,* .
Average weekend day BESS output
.-. .—.- . . . . . . . .. .—— . ..-. ... . . . ..——.—.--. —\ ●✌✎✍✎✎✍✎�✍�✍✎ ✎✎✿✿✎✍✎✿,m
#- “.-s .8-----% ● . **-..* ,. .s
.---
~q. .. . .— —.—. ! ~ (J
,.-[
9
.-c 1 I
#9 .,-
1~: 4,‘ ;
1 #
——-..—. .—— . ..- .—. -. —.-— .——-. .— – -m $,# W
g, #—— .- . - .. . .-...—— -- . . —-- -- -— — r,’— -=0
‘,%
-————— m
—.. —.— ——— —-...- ——. . -m
b..—PI&l U@Omv
_eEssWlpl#:--
Figure 5-9. Plant and BESS Operation for a TypicaI Weekday and Weekend Day during a Block-LoadingTest.
5. INTEGRATION AND IMPLEMENTATION !i-13

Vernon BESS, July Scenario
m r ..—.,---
, -— I. I :
i
?
i-r
r
I ‘f!II1/ II \J’il
)1/ ‘11/ IN L
Ko
m
4’33
m
0
all
-s02
-1C03
-120)
.14X
The (h)
Figure 5-10. Four Daily BESS Cycles in July Using the Modified Load Peak-Shaving Profile.
excess of 2900 kW. This operational scenario was run
for the balance of September and was scheduled to con-
tinue throughout the month of October in order to coin-
cide with the City of Vernon’s billing cycle. A chartshowing the operation of the BESS for the period Sep-tember 16-30, 1996, is shown in Figure 5-11. TheBESS provided approximately 500 kW of the plant’sload during each weekday and about 300 kW on week-ends. The nominal plant load was 3300 kW. Battery
SOC ranged between 100 and 50%, and the system hadjust enough time to recharge overnight before being dis-
charged again.
During September, the BESS experienced twounusual incidents: (1) The City of Vernon’s utility
power failed at about 4 a.m. on September 3, 1996, forapproximately 1 min. The BESS picked up the plantload as designed. (2) The BESS tripped off-line due to aPCP (inverter) fault on September 16, 1996. Theinverter was reset and the system resumed its opera-
tional profile. No explanation has been found for thePCP fault.
The BESS facility was visited by several tour
groups made up of attendees at the IEEE T&D Showthat was held in Los Angeles in September 1996. Two
open tours for general attendees at the show were con-
ducted on September 17 and 19. A total of 36 people,
most of them from utility companies, were in these gen-
eral tour groups. Private tours were also conducted forrepresentatives from HELCO, Golden Valley, PowerEngineering, and GE’s Field Engineering Service
Group. Follow-up with all visitors to the BESS site willbe pursued.
PV/Hybrid Evaluation Project
The evaluation of the Omnion PV/13attery hybrid
controller at SNL’S PV Test Facility was successfully
completed in FY95. Present plans call for the installa-
tion of the prototype control unit in an industry facility
in combination with a PV array. A multiyear opera-tional test is planned. For the no-cost loan of the con-troller, data on performance, reliability, and mainte-nance will be provided to SNL for analysis andpublication. Negotiations are in progress to formalizethis task.
Status
Following a year-long search for an appropriateutility test site for the Hybrid Power Processor and Con-trol System (HPPCS), the Arizona Public Service Com-
5-14 5. INTEGRATION AND IMPLEMENTATION

Vernon BESS load leveling (9/16/96 to 9/30/96)
9XQ
4
#x
m
Ssm
Scm
g 25(XJ
mm
Ism
tom
mo
0<
time (h)
i
so
im
Figure 5-11.
r]—Planl Pmr
-o- BESS WV
+Soc—.—..—.
Operation of the BESS during the Second Half of September Using the Modified Load l?eak-Shaving Scenario.
pany (APS) agreed late in the fourth quarter of FY96 to
sponsor a 1- to 3-yr test program for the HPPCS. The
HPPCS was developed by Omnion Power Engineering
Corporation under a program sponsored jointly bySNL’S Battery Analysis and Evaluation Department andPV System Applications Department. Figure 5-12shows the closed cabinet for the HPPCS that will be
tested at APS. Also included in the APS field test pro-gram will be the evaluation of a fuzzy-logic-based ACU
developed by Raydec under a contract administered by
the PV System Applications Department.
The HPPCS was specifically designed to operate
under the control of an external intelligent battery con-
troller such as the Raydec ACU. The HPPCS and ACUare designed to operate in a fully automated environ-ment requiring no operator intervention to perform allsystem functions. The following functions are just a fewof the system’s automated capabilities:
● Can determine the most efficient power sourceavailable and activate the source.
● Can provide for the seamless transfer of loads to
a selected power source.
● Can determine when battery charging or equal-ization is needed.
● Can provide supplemental power from storagewhen adequate power is not available from the
genset.
Figure 5-13 shows the internal layout of the controland power processor electronics for the HPPCS.
Under the tentative terms of a draft APS Memoran-dum of Understanding (MOU) with SNL and the IDOE,
APS has agreed to build and operate a test facility to
house the HPPCS and ACU units at the APS Solar Testand Research (STAR) Center in Tempe, Arizona. APS
also agreed to acquire a lmge battery on the orcler of200 kwh to support the test effort and to supply a
30-kW genset and a 15-kW PV array to complete thehardware complement required to operate a t!ypicalhybrid system. The hybrid system is designed to pro-vide all the power necessary to operate the STAR facil-ity throughout the test period. In addition, the completehybrid system will be fully instrumented with a colmpre-hensive data acquisition system provided under an SNL
PV System Applications Department contract with the
Southwest Technology Development Institute, which isoperated by NMSU.
Final approval of the APS/DOE/SNL MC)U isexpected in the second quarter of FY97. The system
should be fully integrated, tested, and activated at theAPS STAR Center during the third quarter of FY97.
5. INTEGRATION AND IMPLEMENTATION G

Figure 5-12. Closed Cabinet for the HPPCS showing the Junction Boxes for DC Input Sources for theSystem.
Figure 5-13. HPPCS Control and Power Electronics Layout.
5-16 5. INTEGRATION AND IMPLEMENTATION

6. Information Exchange
Introduction
Work in the Information Exchange element concen-trates on focused communication to promote interest in
energy storage and to provide fomms in which ideas are
shared, information is exchanged, and cooperative
projects are initiated.
UBG/ESA Support
Status
The eleventh (and last) meeting of the UBG was
held on May 15-16, 1996, following a two-day Steering
Committee meeting at City of Industry, California. A
series of decisions marked a major turning point in theevolution of this utili~/industry group. First, the group
was incorporated and Jon Hurwitch, Switch Technolo-
gies, was selected as the Executive Director. Mr. Hur-witch will assume the operational responsibilities of the
group’s affairs. Second, the general membership votedto adopt fundamental changes in both the mission and
name of the UBG. The group voted to change its name
from the UBG to the ESA and to amend the charter to
expand the organization’s scope and mission to encom-
pass not only batteries but also other storage technolo-gies. The meeting included tours both of the new bat-tery system installed by GNB at the Vernon batteryrecycling plant and of the Southern California Edison
(SCE) Chino battery. Registered members of the UBGalso obtained a copy of the UBG Index, a software data-
base of more than 800 organizations and individualsinterested in batteries and energy storage.
The changes adopted by the former UBG at this
meeting are aligned with the ESS program objectives of
guiding the group towards self-sufficiency and eliminat-ing its reliance on DOE support. The changes imple-mented during this meeting signal a transition towardsthat end. These changes will also modify the way inwhich the ESS Program interacts with the group in thefuture. With a highly reduced reliance on fundingsupport horn the ESS Program, the relationship between
the UBG and the ESS that existed until this point willchange. The ESS participated first as an advisor in theinitial conception and formation of the UBG, contribut-ing to the writing of its charter and the bylaws governing
its early operation. Next, the ESS staff served in a non-voting, advisory capacity to the Steering Committee. In
this role, the ESS Program played an important role indefining the purpose, identity, and direction of the
group, even though it acted strictly in an advisory capac-
ity. The overall goal of ESS participation in this prc~cesswas to ensure that the group would eventually grow into
a strong, industry-supported advocacy group with little
or no reliance on DOE support for its ongoing opera-tions. The steps taken during this meeting show that the
organization has largely met that goal. Now the role ofthe ESS and its purpose for participating in the new 123Awill be to (1) seek industry partnerships to achieve pro-
grammatic goals, (2) use the ESA channels for industry
outreach, and (3) create a storage technology assistance
center under the ESA umbrella.
Another highlight of the eleventh meeting was a
tour of the recently completed 3.5-MWh GNB Battery
System at GNB’s battery recycling center in Vernon,, Inaddition to providing backup to critical air handlingequipment, this battery system can reduce the plant’speak demand by as much as 500 kW. The battery
system is the first implementation of the design thatevolved from the GNB alliance with GE. The Vernonproject was primarily internally funded by GNB to dem-
onstrate GNB’s ABSOLYTE technology and showcase
this type of storage application. Approximately 10% of
the cells at the Vernon battery facility were providedunder ESS Program funding as afield test. GNB intendsto use the system as a marketing tool for the standard-ized battery system design, which uses GNB batteriesand inverters/controls supplied by GE. Figure 6-1 is a
view of the battery room looking through the PCS room.
The first meeting of the ESA is scheduled for early
November near Oglethorpe Power Corporation’sPQ2000 demonstration site in the vicinity of Jackson-
ville, Florida.
Executive Briefings
In response to changes in the electricity industry,
the DOE has redirected the ESS Program focus frompurely battery-based energy storage systems to systemsthat employ one or more of the following storage tech-nologies: batteries (lead-acid and advanced), flywheels,
superconducting magnets, and supercapacitors. ‘To
ensure that the direction of the program was responsive
6. INFORMATION EXCHANGE 6-1

Figure 6-1. View of the GNB Battery from the PCS Room.
to the changing needs of the nation’s electricity industry,the DOE sponsored a series of meetings with industryexecutives in which ESS Program management solicited
input regarding expected changes in the utility industryand thelong-termR&D that would be most appropriate
for the emerging business environment.
The Executive Meeting Project had three goals:(1) to communicate to industry the scope and rationaleof ESS Program activities relative to DOE understand-ing of the electric utility industry, (2) to solicit energystakeholders’ perspectives on the changes in the electricutility industry and the likely federal R&D needs that
will stem from those changes, and (3) to recruit ongoing
industry participation in an Industry Users Group thathelps the Program remain focused on the activities that
meet the nation’s energy needs.
The information exchange was expected (1) tobroaden the ESS Program focus from that of a BESprogram to one that includes a portfolio of energy stor-
age technologies and (2) to provide a better understand-ing by both the DOE and industry of each others’requirements and to identify well-defined areas andmechanisms through which the DOE and industry couldcollaborate on specific development and deploymentprojects.
6-2 6. INFORMATION EXCHANGE

Status
Program representatives contacted selected organi-zations to arrange a 2-hr meeting of the DOE Program
team (the DOE ESS Program Manager, the ESS Pro-
gram Manager at SNL, and an industry expert) as wellas representatives from diverse divisions of the organi-zation visited. The ESS program met with organiza-
tions around the U.S. between March and September1996. The attendance at the meetings ranged from 5 to
30 persons. Each of the meetings contributed to theoverall goals of the project. Table 6-1 lists the organiza-
tions visited.
The Executive Meetings Project has providednumerous benefits to the ESS program and to industry
by providing an opportunity for industry involvement in
energy storage technology development and demonstra-
tion. These benefits, summarized below, representaccomplishment of the goals and objectives that wereidentified for the industry outreach project.
1. Increased industry awareness of the ESS Pro-
gram, especially on the part of several organi-zations visited that were not then involved inthe ESS Program. Even the organizations
2.
3.
visited that were previously involved in the
ESS program learned more about ESS Prcgmrnactivities because senior business and technical
managers who were not directly involved in thecompany’s storage activities were informed.
By spreading awareness to the senior level,
there is a potential for greater institutional
support of the program as well.
Increased the DOE’s awareness of industry’sinterests and needs relative to the ESS Pro-
gram’s activities. Insights were gained into the
interests and needs of different industry sectors
through one-on-one meetings. These insightswere analyzed and are being incorporated into
ESS Program planning.
Identified areas of mutual technology interest.
Some participants identified distinctive capa-bilities that could be applied to the ESS Pro-
grams research efforts.
The informal meeting format encouraged the indus-
try participants to do most of the talking and permittedopen and unencumbered discussions. The DOE tJene-fited from the executive meetings and will benefit from
Table 6-1. Utility Executive Meetings with DOE Program Team
Organization Visited—
Type of Organization Date of Meeting
AES, Arlington, VA IPP September 1996 —
Central & Southwest, Tulsa, OK Iou August 1996
Indiana Power & Light Co. (IPALCO), Indianapolis, IN Iou May 1996
Northern States Power (NSP), Minneapolis, MN Iou April 1996
Potomac Electric Power Co. (PEPCO), Alexandria, VA Iou @ril 1996PNM, Albuquerque, NM Iou August 1996
SCE, Los Angeles, CA Iou May 1996
The Southern Company, Atlanta, GA Iou September 1996
Allegheny Power, Harrisburg, PA Co-op August 1996
NRECA, Arlington, VA Co-op September 1996
Oglethorpe, Atlanta, GA Co-op September 1996
Salt River Project (SRP), Phoenix, AZ Co-op August 1996
GNB, Chicago, IL Manufacturer May 1996
Kennetech, San Francisco, CA Manufacturer/lPP May 1996
S1, Madison, WI Manufacturer March 1996
6. INFORMATION EXCHANGE z

the Industry Users Group as well. Industry gained
insight into the program and access to research that
could lead to a competitive advantage in the marketplaceas energy storage technologies emerge as commercialproducts. The dialogue that has been advanced by a
project like the executive meetings is important for
future cooperation between industry and the ESS Pro-
gram, and crucial for developing the road map to define
mutual objectives.
Trade Shows, Conferences, andMeetings
ESS Program staff attended and participated in var-
ious trade shows, conferences, and meetings. At the
trade shows, the ESS Program booth is designed to
encourage questions and discussion by highlighting the
Program’s history, achievements, and industrial partner-
ships. In addition, informal discussions are held, ques-tions are answered, ESS literature is handed out, and
requests for additional information are taken. DuringFY96, ESS Program staff attended two major utility
trade shows and held a meeting at the California EnergyCommission (CEC) offices.
DA/DSM ’96 Conference, January15-17,1996
Members of the ESS Program staffed a display
booth at the 1996 Distribution Automation/Demand-Side Management (DA/DSM) Conference in Tampa,
Florida. This conference and exhibition, attended bymore than 3200 people, was predominantly a forum for
the exchange of information by people in the electricutility industry. The Program’s emphasis at DA/DSM’96 was the success of the first fully commercial BES
system installed at the Sabana Llana substation at
PREPA. The immediate effect of the 20-MW BES
system was to significantly reduce power interruptions
to the manufacturing sector in the area served by this
substation. The reduction in line stoppages has had a
positive effect on Puerto Rico’s productivity and com-
petitiveness. PREPA continues to plan for an additional
80 MW of BES system capability. Requests for infor-mation on the PREPA project continue to be received bythe ESS Program.
UPVG and Soltech AnnualMeeting, March 12-15,1996
The annual Utility Photovoltaic Group (UPVG)
Meeting was combined with Soltech and held in PalmSprings, California, on March 12-15, 1996. The meet-ing was organized by the UPVG and the Solar EnergyIndustries Association. More than 550 members werepreregistered. This was the first-ever conference bring-
ing together representatives from both the electric utility
industry and the solar energy companies to explore the
challenges of their changing industries and the mutualbenefits of cooperation. ESS Program staff set up an
exhibit displaying posters summarizing the features ofBES in renewable energy and utility applications. Dis-cussions that were initiated at this conference with util-
ity and solar engineers and consultants have continued.
6-4 6. INFORMATION EXCHANGE

Appendix: Presentations and Publications
Presentations
A.A. Akhil, “Utility Battery Storage Systems: Applica-
tions and Current Status,” Presented to the TexasPublic Utility Commission, Austin, TX, January
1996.
G.P. Corey and G.A. Buckingham, “A 2-MW, 10-Sec-
ond Battery Solution for Short-Duration PowerQuality problems~’ Tenth International Power Qual-
ity Conference and Exhibition, Bremen, Germany,
November 7-9, 1995.
G.P. Corey, “Battery Energy Storage Solutions for Pre-mium Power,” The Eleventh Annual Batte~ Con-ference on Applications and Advances, Long
Beach, CA, January 9-12, 1996.
G.P. Corey and W.J. Nerbun, “A Utility Scale BatteryEnergy Storage Power Quality Solution;’ Power
Quality Symposium, Sacramento, CA, April 4-5,
1996.
J.W. Stevens and G.P. Corey, “A Study of Lead-AcidBattery Efficiency Near Top-of-Charge and the
Impact on PV System Design;’ 25th IEEE Photo-voltaic Specialists Conference, Washington, DC,
May 13-17, 1996.
Publications
P. Butler, P. Taylor, and W. Nerbun, Lead-Acid Batteries
in Systems to Improve Power Quality, Fifth lEuro-pean Lead Battery Conference, Barcelona, Spain,
October 2-4, 1996.
G.P. Corey, Energy Storage Solutions for Premium
Power, in IEEE Aerospace and Electronics Systems,
vol. 11, pp. 41-44, June 1996.
R.G. Jungst and M.D. Anderson, DYNASTORE Operat-
ing Cost Analysis of Energy Storage for a Midwest
Utility. Sandia National Laboratories reportSAND96-2238C. Proceedings of the Twenty NinthAnnual Frontiers of Power Conference, Stillwater,OK, October 28-29, 1996.
R.G. Jungst, M.D. Anderson, and J.T. Ak, Assessment
of Utility Side Cost Savings from Battery Energy
Storage. Sandia National Laboratories report
SAND95-1545. Proceedings of the 1996 IEEE
Power Engineering Society Winter Meeting, Balti-
more, MD, January 21-26, 1996.
PRESENTATIONS AND PUBLICATIONS A-1

A-2 PRESENTATIONS AND PUBLICATIONS

ABB Power T&D Co., Inc.
Attn: P. Danfors
16250 West Glendale Drive
New Berlin, WI 53151
AC Battery Corporation
Attn: R. Fleming2080 Energy DriveP.O. BOX 325East Troy, WI 53120
Argonne National Laboratories (2)
Attn: W. DeLuca
G. Henriksen
CTD, Building 2059700 South Cass AvenueArgonne, IL 60439
Arizona Public Service (2)
Attn: R. HobbsHerb Hayden
P.O. Box 5399Phoenix, AZ 85072
American Electric Power Service Corp. Lucent TechnologiesAttn: C. Shih Attn: K. Bullock .1 Riverside Plaza 3000 Skyline DriveColumbus, OH 43215 Mesquite, TX 75149
Anchorage Municipal Light & PowerAttn: M. Askm1200 East 1‘tAvenueAnchorage, AK 99501
BechtelAttn: W. StolteP.O. BOX 193965San Francisco, CA 94119-3965
AVO InternationalAttn: Gary Markle510 Township Line Rd.Blue Bell, PA 19422
Babcock & WilcoxAttn: Glenn CampbellP.O. BOX785
Lynchburg, VA 24505

Berliner Kraft und Licht (BEWAG) California State Air Resources Board
Attn: K. Kramer Attn: J. Holmes
Stauffenbergstrasse 26 Research Division
1000 Berlin 30 P.O. BOX2815
GERMANY Sacramento, CA 95812
Business Management ConsultingAttn: S. Jabbour24704 Voorhees Drive
Los Altos Hills, CA 94022
C&D Charter Power Systems, Inc. (2)Attn: Dr. Sudhan S. Misra ‘
Attn: Dr. L.Holden
Washington & Cherry Sts.Conshohocken, PA 19428
Delphi Energy and Engine
Management Systems (2)
Attn: J. Michael HingaR. Rider
P.O. BOX 502650Indianapolis, IN 46250
International Energy Systems, Ltd.Attn: G. BarkerChester High RoadNestor, South WirralL64 UE UKUNITED KINGDOM
Calpine Corp.Attn: R. Boucher
50 W. San Fernando, Ste. 550San Jose, CA 95113
Chugach Electric Association, Inc. (2)
Attn: T. Lovas
J. Cooley
P.O. Box 196300Anchorage, AK 99519-6300
Consolidated Edison (2)
Attn: M. LebowN. Tai
4 Irving Place
New York, NY 10003
Corn Belt Electric CooperativeAttn: R. StackP. O. BOX816Bloomington, IL 61702
EA Technology, Ltd.
Attn: J. Baker
Chester CH1 6ESCapenhurst, England
UNITED KINGDOM
Eagle-Picher IndustriesAttn: J. DeGrusonC & Porter Street
Joplin, MO 64802
Electrosources
Attn: Michael DodgeP.O. Box7115
Loveland, CO 80537
Eltech Research Corporation
Attn: Dr. E. Rudd
625 East StreetFairport Harbor, OH 44077
Energetic, Inc. (4)Attn: J. Badin
H. LowittP. TaylorL. Charles
7164 Columbia Gateway DriveColumbia, MD 21046
East Penn Manufacturing Co., Inc.Attn: M. Stanton
Deka Road
Lyon Station, PA 19536
Electric Power Research Institute (3)Attn: S. Chapel
S. EckroadR. Schainker
P. O. BOX 10412
Palo Alto, CA 94303-0813
Electrochemical Engineering Consultants, Inc.Attn: P. Symons
1295 Kelly Park CircleMorgan Hill, CA 95037
Electrochemical Energy Storage Systems, Inc.Attn: D. Feder35 Ridgedale AvenueMadison, NJ 07940
Energy Systems ConsultingAttn: A. Pivec41 Springbrook RoadLivingston, NJ 07039

Energetic, Inc. (2) Firing Circuits, Inc.
Attn: M. Farber Attn: J. Mills
R. Scheer P.O. BOX2007
501 School St. SW, Suite 501 Norwalk, CT 06852-2007
Washington, DC 20024
Energy and Environmental Economics, Inc.Attn: Greg J. Ball353 Sacramento St., Suite 1540San Francisco, CA 94111
GE Industrial& Power ServicesAttn: Bob Zrebiec640 Freedom Business CenterKing of Prussia, PA 19046
Giner, Inc.Attn: A. LaConti14 Spring Street
Waltham, MA 02254-9147
Golden Valley Electric Association, Inc.Attn: S. HaagensenBOX71249758 Illinois StreetFairbanks, AK 99701
General Electric CompanyAttn: N. MillerBuilding 2, Room 6051 River Road
Schenectady, NY 12345
General Electric Drive SystemsAttn: .D. Daly1501 Roanoke Blvd.Salem, VA 24153
GNB TechnologiesWorld Headquarters
Attn: S. Deshpande’
375 Northridge RoadAtlanta, GA 30350
Hawaii Electric Light Co.Attn: C. NagataP.O. BOX 1027Hilo, HI 96720
GNB Technologies (3)Industrial Battery Company
Attn: G. Hunt
J. SzymborskiR. Maresca
Woodlake Corporate Park
829 Parkview Blvd.Lombard, IL 60148-3249
Kenetech/Wind Power (2)Attn: Michael Behnke
W. Erdman6952 Preston AvenueLivermore, CA 94550
Lawrence Berkeley Laboratory (3)
Attn: E. CairnsK. KinoshitaF, McLarnon
University of CaliforniaOne Cyclotron Road
Berkeley, CA 94720
Longitude 122 WestAttn: S. Schoenung1241 Hobart St.Menlo Park, CA 94025
Lucas Controls, Inc.
Attn: Donald J. Lucas10925 Miller Rd., Ste. ADallas, TX 75355-1848
ILZRO (3) -
Attn: J. ColeP. MoseleyC. Parker
P.O. BOX 12036Research Triangle Park, NC 27709
Imperial Oil Resources, Ltd.Attn: R. Myers
3535 Research Rd NWCalgary, AlbertaCANADA T2L 2K8
Innovative Power SourcesAttn: Ken Belfer1419 Via Jon Jose RoadAlamo, CA 94507
J. MeglenP.O. BOX3232Oakton, VA 22124
Metlakatla Power& Light
Attn: H. AchenbachP.O. Box 359Metlakatl~ AK 99926

National Renewable Energy Laboratory (5) Micron Corporation
Attn: R. McConnell Attn: D. Nowack
L. Flowers 158 Orchard Lane
J. Green Winchester, TN 37398
S. HockR. DeBlasio
1617 Cole Blvd.Golden, CO 80401-3393
New York Power AuthorityAttn: B. Chezar
1633 Broadway
New York, NY 10019
Northern States Power
Attn: D. Zurn414 Nicollet MallMinneapolis, MN 55401
NPA TechnologyAttn: Jack BrownSuite 700, Two University PlaceDurham, NC 27707
Oak Ridge National Laboratory (3)Attn: B. Hawsey, Bldg. 3025, MS-6040
J. Stoval, Bldg. 3147, MS-6070J. VanCoevering, Bldg. 3147, MS-6070
P.O. BOX2008
Oak Ridge, TN 37831
ZBB, LTD.Attn: Robert J. Parry
P.O. Box 1410, West PerthWestern Australia 6872
Oglethorpe Power Company
Attn: C. Ward
2100 E. Exchange PlaceP.O. Box 1349Tucker, GA 30085-1349
Omnion Power Engineering CorporationAttn: H. Meyer2010 Energy DriveP.O. BOX879East Troy, WI 53120
Orion Energy Corp.Attn: Doug Danley18131 Metz Dr.Germantown, MD 20874

PEPCOAttn: John Young1900 Pennsylvania NW, Room 842Washington, DC 20068
Power Engineers, Inc. (2)Attn: Timothy Ostermeter
S. SostromP.O. Box 1066Hailey, ID 83333
Power Technologies, Inc.Attn: P. Prabhakara1482 Erie Blvd.P.O. BOX 1058Schenectady, NY 12301
Power Technologies, Inc.
Attn: H. Clark775 Sunrise Ave.
Suite 210Roseville, CA 95661
Powercell CorporationAttn: Reznor I. OrrOne Memorial DriveCambridge, MA 02142
Endecon EngineeringAttn: Rick WinterResearch Engineer2500 Old Crow Canyon Rd., Suite 220
San Ramon, CA 94583
Pacific Gas & Electric
Attn: B. Norris2303 Carnino Ramon, Suite 200
San Ramon, CA 94583
Pacific Northwest Laboratory (2)Attn: J. DeSteese, K5-02
D. BrownBattelle Blvd.Richland, WA 99352
Puerto Rico Electric Power AuthorityAttn: W. TorresG.P.O. BOX4267San Juan, Puerto Rico 00936-426
Raytheon Engineers and ConstructorsAttn: A. Randall700 South Ash St.P.O. BOX5888Denver, CO 80217

Public Utility Commission of Texas R&D Associates
Attn: D. Jaussaud Attn: J. Thompson
7800 Shoal Creek Blvd. 2100 Washington Blvd.
Austin, TX 78757 Arlington, VA 22204-5706
RMS CompanyAttn: K. Ferris87 Martling Ave.Pleasantville, NY 10570
Sacramento Municipal Utility DistrictAttn: Robert P. WichertP.O. BOX15830Sacramento, CA 95817
SAFT Research& Dev. Ctr.Attn: Guy Chagnon
107 Beaver CourtCockeysville, MD 21030
Salt River Project (2)Attn: H. Lundstrom
G.E. “Ernie” Palomino, P.E.MS PAB 357, BOX 52025Phoenix, AZ 85072-2025
Sentech, Inc. (3)Attn: R. Sen
S. SwaminathanK. Klunder
4733 Bethesda Avenue, Suite 608
Bethesda, MD 20814
Sentech, Inc.Attn: Robert Reeves9 Eaton RoadTroy, NY 12180
Santa Clara UniversityAttn: Charles Feinstein, Ph.D.Department of Decision and Information SciencesLeavey School of Business and Administration
Santa Clara, CA 95053
SEIA (2)Attn: S. Sklar
Clay Aldrich122 C Street NW4’hFloorWashington, DC 20001-2104
State of Alaska
Dept. of Community& Regional AffairsAttn: Afzal H. Khan
333 W. 4th Avenue, Suite 220Anchorage, AK 99501-2341
Sofl Switching TechnologiesAttn: D. Divan2224 Evergreen Rd., Ste. 6Middleton, WI 53562
SolarexAttn: G. Braun630 Solarex CourtFrederick, MD 21701
Southern California Edison (3)Attn: R. N. Schweinberg
J. LeeperN. Pinsky
6070 N. Irwindale Ave., Suite IIrwindale, CA 91702
U.S. Department of EnergyAttn: A. LandgrebeOffice of Transportation TechnologiesEE-32 FORSTLWashington, DC 20585
SRI International
Attn: C. Seitz
333 Ravenswood Ave.Menlo Park, CA 94025
Stored Energy EngineeringAttn: George Zink7601 E 88’hPlaceIndianapolis, IN 46256
Stuart Kuritzky347 Madison AvenueNew York, NY 10017
Superconductivity, Inc. (2)Attn: Jennifer Billman
Michael GravelyP.O. BOX56074Madison, WI 53705-4374
Switch TechnologiesAttn: J. Hurwitch4733 Bethesda Ave., Ste. 608Bethesda, MD 20814

TU Electric U.S. Department of Energy
R&D Programs Attn: P. N. Overholt
Attn: James Fangue EE-141 FORSTL
1601 Bryan St., Rm 19030 Washkgton, DC 20585
Dallas, TX 75201
University of Missouri - RollsAttn: M. Anderson
112 Electrical Engineering BuildingRolls, MO 65401-0249
U.S. Department of Energy
Attn: R. Eynon
Nuclear and Electrical Analysis BranchEI-821 FORSTLWashington, DC 20585
U.S. Department of EnergyAttn: A. HoffmanOffice of Utility TechnologiesEE-1 OFORSTLWashington, DC 20585
U.S. Department of EnergyAttn: R. Eaton IIIGolden Field Office1617 Cole Blvd.
Building 17Golden, CO 80401
U.S. Department of EnergyAttn: D. A. Sanchez
Kirtland Area OfficeP. O. Box 5400
Albuquerque, NM 87185-5400
U.S. Department of Energy
Attn.: D. Eckelkamp-BakerAlbuquerque Operations OfficeEnergy Technologies Division, P.O. Box 5400Albuquerque, NM 87115
Virginia Power
Attn: Gary VemoInnsbrook Technical Center5000 Dominion BoulevardGlen Ellen, VA 23233
Walt Disney World Design and Eng’g.Attn: Randy BevinP.O. Box 10,000Lake Buena Vista, FL 32830-1000

U.S. Department of Energy
Attn: R. Brewer
Office of Energy ManagementEE-12 FORSTL
Washington, DC 20585
U.S. Department of Energy
Attn: N. Rossmeissl
Office of Energy ManagementEE-12 FORSTLWashington, DC 20585
U.S. Department of EnergyAttn: J. P. ArchibaldEE FORSTLWashington, DC 20585
U.S. Department of EnergyAttn: M. B. GinsbergEE FORSTLWashington, DC 20585
U.S. Department of Energy,I\
Attn.: G. BuckinghamAlbuquerque Operations Office
I Energy Technologies Division, P.O. Box 5400! Albuquerque, NM 87115
U.S. Department of EnergyAttn: P. Patil
Office of Transportation Technologies
EE-32 FORSTLWashington, DC 20585
U.S. Department of Energy
Attn: T. Duong
OffIce of Transportation TechnologiesEE-32 FORSTLWashington, DC 20585
U.S. Department of EnergyAttn: J. Daley
Office of Energy ManagementEE-12 FORSTLWashington, DC 20585
U.S. Department of EnergyAttn: A. JelacicOffice of Energy ManagementEE-12 FORSTLWashington, DC 20585
U.S. Department of EnergyAttn: A. G. CrawleyEE FORSTLWashington, DC 20585
U.S. Department of EnergyAttn: C. PlattOffice of Energy ManagementEE-12 FORSTLWashington, DC 20585
WestinghouseAttn: Tom MattyP.O. BOX 17230Baltimore, MD 21023
Westinghouse STCAttn.: H. Saunders1310 Beulah RoadPittsburgh, PA 15235
W. R. Grace & Company
Attn.: S. Strzempko
62 Whittemore Avenue
Cambridge, MA 02140
Yuasa-Exide, Inc.Attn: W. Baurnann32 Allen LaneMt. Kisco, NY 10549
R. Weaver777 Wildwood LanePalo Alto, CA 94303
Yuasa-Exide, Inc. (3)Attn: N. Magnani
F. Tarantino
G. Cook
2400 Bernville Road
Reading, PA 19605
The Technology Group, Inc.Attn: Tom Anyos63 Linden Ave.
Atherton, CA 94027-2161
Zaininger Engineering Co., Inc.Attn.: H. Zaininger
1590 Oakland Road, Suite B2111
San Jose, CA 95131
ZBB Battery Technologies, Inc.
Attn: P. Eidler11607 West DearbornWauwatosa, WI 53226-3961

Crescent EMC
Attn: R. B. Sloan
Executive Vice President
P.O. BOX 1831
Statesville, NC 28687
HL&P Energy ServicesAttn: George H. Nolin, CEM, P.E.Product Manager Premium Power ServicesP.O. Box 4300Houston, TX 77210-4300
UFTOAttn: Edward Beardsworth
951 Lincoln Ave.Palo Alto CA 94301-3041
Distributed Utilities AssociatesAttn: Joseph Ianucci3470 Crow Canyon Suite 140San Ramon, CA 94583
SAFT America Inc.Attn: Ole VigerstolNational Sales Manager711 Industrial Blvd.Valdosta, GA 13601
Public Utility Commission of TexasAttn: Danielle Jaussaud
Competitive Issues Division7800 Shoal Creek BoulevardAustin, TX 78757
ECG Consulting Group Inc.Attn: Daniel R. Bruck
Senior Associate55-6 Woodlake RoadAlbany, NY 12203
Westinghouse Electric Corporation
Attn: Gerald J. KeaneManager, Venture Development
Energy Management Division4400 Alafaya Trail
Orlando, FL 32826-2399
The Brattle GroupAttn: Thomas J. Jenkin44 Brattle StreetCambridge, MA 02138-3736
Exide ElectronicsAttn: John BreckenridgeDirector, Federal Systems Division8609 Six Forks RoadRaleigh, NC 27615
American Superconductor Corporation Northern States Power Company
Attn: S. Amanda Chiu, P.E. Attn: Gary G. Karn, P.E.
Manager, Strategic Marketing Consultant Electric Services
Two Technology Drive 1518 Chestnut Avenue NorthWestborough,MA0158 1 Minneapolis, MN 55403
University of Texas at AustinAttn: John H. Price
Research AssociateCenter for ElectromechanicsJ. J. Pickel Research CampusMail Code R7000Austin, TX 78712
U.S. Department of EnergyAttn: J. E. RannelsPhotovoltaic DivisionEE- 11 FORSTLWashington, DC 20585
U.S. Department of EnergyAttn: W. ButlerPA-3 FORSTLWashington, DC 20585
U.S. Department of EnergyAttn: J. A. MazerPhotovoltaic DivisionEE-11 FORSTL
Washington, DC 20585
Frost & Sullivan (2)
Attn: Steven KraftDave Coleman
2525 Charleston RoadMountain View, CA 94043
C&D PowercomAttn: Larry S. MeisnerManager Product Marketing1400 Union Meeting RoadP.O. Box 3053
Blue Bell, PA 19422-0858
Tampa Electric CompanyAttn: Terri Hensley, EngineerP.O. Box 111Tampa, FL 33601-0111
U.S. Department of EnergyAttn: R. J. KingPhotovoltaic DivisionEE-11 FORSTLWashington, DC 20585

VEDCO Energy
Attn: Rick Ub~di
12 Agatha Lane
Wayne, New Jersey 07470
Intercon Limited (2)Attn: David Warar6865 Lincoln AvenueLincolnwood, IL 60646
U.S. Department of EnergyAttn: A. O. BulawkaPhotovoltaic Division
EE-11 FORSTLWashington, DC 20585
U.S. Department of EnergyAttn: D. T. TonPhotovoltaic DivisionEE-11 FORSTL
Washington, DC 20585

MS0212 A. Phillips, (10230) MS0613 G. Corey (1525)
MS0614 J.R. Arrnijo (1523) MS0614 G.P. Rodriguez (1523) MS0708
MS0752
MS0753MS0340 J. Braithwaite (1832)
MS0343 W. Cieslak (1832)
MS0513 R. Eagan (1000)
MS0521 J. T. Cutchen (1501)
MS0613 D. Doughty (1521)
MS0613 A. Akhil (1525)
MS0614 Terry Crow (1523)
H. Dodd (6214)
M. Tatro (6219)
W. Bower (6218)
MS0613 I. Francis (1525) MS0753 R. Bonn (6218)
MS0614 T. Unkelhaeuser (1523) MS0753 C. Cameron (6218)
MS0613 N. Clark (1525) MS0753 T. Hund (621 8)
MS0613 R. Jungst (1521) MS0953 W. Alzheimer (1500)
MS0614 D. Mitchell (1522)
MS0614 E.Binasiewicz(1522) MS0614 K. Grothaus (1523)
MS0613 P. Butler (1525) (20) MS0702 D. Arvizu (6200)
MS1193 D. Rovang (1231)
MS0704 P. Klimas (6201)
MS9018 Central Technical Files
(8940-2)

MS0899 Technical Library (4414)(5) MS0619 Review &Approval For
DOE/OSTI (126900) (2)