energy supply security 2014 - international energy · pdf fileit would do this by drawing on...
TRANSCRIPT
Part 2The following member country profile is an excerpt from Chapter 4 of the publication Energy Supply Security 2014 and is not intended as a stand-alone publication.
ENERGY SUPPLY SECURITY 2014
CHAPTER 4: Emergency response systems of individual IEA countries
The ability of the International Energy Agency (IEA) to co-ordinate a swift and effective international response to an oil supply disruption stems from the strategic efforts of member countries to maintain a state of preparedness at the national level. Energy security is more than just oil, as the role of natural gas continues to increase in the energy balances of IEA countries. The most recently completed cycle of Emergency Response Reviews (ERRs) reflected this change by assessing, for the first time, the member countries’ exposure to gas disruptions and their ability to respond to such crises. This chapter provides general profiles of the oil and natural gas infrastructure and emergency response mechanisms for 29 IEA member countries.
Each country profile is set out in the following sequence:
Key dataKey oil data, 1990-2018Key natural gas data, 1990-2018Total primary energy source (TPES) trend, 1973-2012
Infrastructure map
Country overview
OILMarket features and key issuesDomestic oil productionOil demandImports/exports and import dependencyOil company operations
Oil supply infrastructureRefiningPorts and pipelinesStorage capacity
Decision-making structure
StocksStockholding structureCrude or productsLocation and availabilityMonitoring and non-complianceStock drawdown and timeframeFinancing and fees
Other measuresDemand restraintFuel switchingOther
GASMarket features and key issuesGas production and reservesGas demandGas import dependencyGas company operations
Gas supply infrastructurePorts and pipelinesStorage
Emergency policyEmergency response measures
EnERgy SuPPly SECuRITy 2014 14 0 © O
ECD/
IEA
2014
Denmark
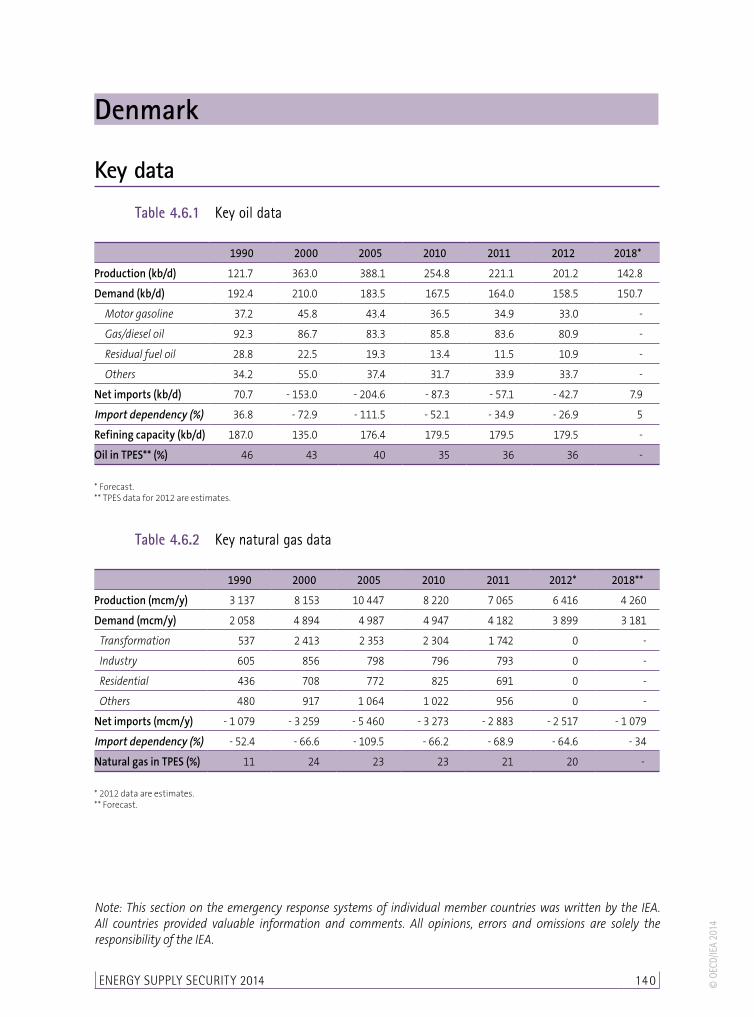
Key data
Table 4.6.1 Key oil data
1990 2000 2005 2010 2011 2012 2018*
Production (kb/d) 121.7 363.0 388.1 254.8 221.1 201.2 142.8
Demand (kb/d) 192.4 210.0 183.5 167.5 164.0 158.5 150.7
Motor gasoline 37.2 45.8 43.4 36.5 34.9 33.0 -
Gas/diesel oil 92.3 86.7 83.3 85.8 83.6 80.9 -
Residual fuel oil 28.8 22.5 19.3 13.4 11.5 10.9 -
Others 34.2 55.0 37.4 31.7 33.9 33.7 -
Net imports (kb/d) 70.7 - 153.0 - 204.6 - 87.3 - 57.1 - 42.7 7.9
Import dependency (%) 36.8 - 72.9 - 111.5 - 52.1 - 34.9 - 26.9 5
Refining capacity (kb/d) 187.0 135.0 176.4 179.5 179.5 179.5 -
Oil in TPES** (%) 46 43 40 35 36 36 -
* Forecast. ** TPES data for 2012 are estimates.
Table 4.6.2 Key natural gas data
1990 2000 2005 2010 2011 2012* 2018**
Production (mcm/y) 3 137 8 153 10 447 8 220 7 065 6 416 4 260
Demand (mcm/y) 2 058 4 894 4 987 4 947 4 182 3 899 3 181
Transformation 537 2 413 2 353 2 304 1 742 0 -
Industry 605 856 798 796 793 0 -
Residential 436 708 772 825 691 0 -
Others 480 917 1 064 1 022 956 0 -
Net imports (mcm/y) - 1 079 - 3 259 - 5 460 - 3 273 - 2 883 - 2 517 - 1 079
Import dependency (%) - 52.4 - 66.6 - 109.5 - 66.2 - 68.9 - 64.6 - 34
Natural gas in TPES (%) 11 24 23 23 21 20 -
* 2012 data are estimates. ** Forecast.
Note: This section on the emergency response systems of individual member countries was written by the IEA. All countries provided valuable information and comments. All opinions, errors and omissions are solely the responsibility of the IEA.

CHAPTER 4 Emergency response systems of individual IEA countries Denmark 141© O
ECD/
IEA
2014
Figure 4.6.1 Total primary energy source (TPES) trend, 1973-2012
0
5 000
10 000
15 000
20 000
25 000
1973 1975 1977 1979 1981 1983 1985 1987 1989 1991 1993 1995 1997 1999 2001 2003 2005 2007 2009 2011
ktoe
Hydro/renewables/other
Nuclear
Natural gas
Oil
Coal
EnERgy SuPPly SECuRITy 2014 142 © O
ECD/
IEA
2014
Map
4.6
.1
Oil i
nfra
stru
ctur
e of
Den
mar
k
Tyra
Årh
us
Ålb
org
Cop
en
ha
gen
Born
holm
Refinery
Cru
de
oil
pip
eline
Oil
stora
ge
site
Oil
rig
Nyk
øbin
gF.
Lyngsb
aek
oil
pie
r
Hedehuse
ne
Fre
deri
ksh
avn
Str
uer
Stigsn
æs/
Gulfhavn
Aabenra
a
Esb
jerg
NEPS
NEPS
NEPS
Oil
pro
duct
spip
eline
This
map
isw
ithout
pre
judic
eto
the
statu
sofor
sove
reig
nty
ove
rany
terr
itory
,to
the
del
imita
tion
ofin
tern
atio
nalf
ront
iers
and
boun
daries
and
toth
ena
me
ofany
terr
itory
,ci
tyor
are
a.
CHAPTER 4 Emergency response systems of individual IEA countries Denmark 143© O
ECD/
IEA
2014
M
ap 4
.6.2
Ga
s in
frast
ruct
ure
of D
enm
ark
Transm
issi
on
pip
elines
Dis
trib
ution
pip
elines
Franpipe
Zeepipe
Europip
eI
EuropipeII
Nogat
Norpip
e
F3
Syd
Arn
e
Germ
any
Sw
eden
Norw
ay
Hara
ld
Trym
(Norw
ay) Tyra
Gas
exp
ort
pla
tform
s
Gas
treatm
ent
Gas
stora
ge
50
100
0K
m
40”
40”
24”
42”
36”
Under
const
.pip
elines
Dra
gor
Malm
ö
Ll.To
rup
Contr
olce
ntr
e
Nyb
ro
This
map
isw
ithoutpre
judic
eto
the
statu
sofor
sove
reig
nty
ove
rany
terr
itory
,to
the
delim
itation
ofin
tern
ationalfr
ontiers
and
boundari
es
and
toth
enam
eofany
terr
itory
,ci
tyor
are
a.
EnERgy SuPPly SECuRITy 2014 14 4 © O
ECD/
IEA
2014
Country overviewOil represented 36% of Denmark’s total primary energy supply (TPES) in 2012, while gas represented 20% in the same year. The combined share of the two fuels in the supply mix has remained relatively stable over the past three decades, at around 60% of TPES, although oil’s share has been reduced dramatically from the nearly 90% it represented in the early 1970s. At the same time, Denmark has one of the lowest energy intensities in the world, and while its economy has grown by 78% since 1980, its energy use has remained almost unchanged over the same period. Denmark is now considering the introduction of a long-term target to become fully independent of fossil fuels by 2050.
Total oil demand, nearly 160 thousand barrels per day (kb/d), is expected to decline in the coming years, reaching an estimated 150.7 kb/d in 2018. Demand for natural gas, just under 4 billion cubic metres (bcm) in 2012, is expected to decline in the coming years largely because of a shift towards renewable energy in the power sector.
Denmark is a net exporter of oil and natural gas. This is however expected to change in the case of oil in the very near future: in 2018 the demand for oil is already expected to overtake the country’s indigenous production by 7.9 kb/d (resulting in an import dependency of 5%). Denmark will still remain self-sufficient in natural gas at least until 2020. Extending self-sufficiency beyond these dates will for the most part depend on future technological developments upstream, but even once the country becomes a net importer, this would likely only be marginal in the period prior to 2035.
As a net exporter, Denmark has no stockholding obligation to the International Energy Agency (IEA). As a member of the European Union, Denmark has a stockholding obligation of 61 days of consumption calculated on the basis of the EU Directive 2009/119 which came into force as of 31 December 2012. The government goes well beyond this, setting a compulsory stockholding obligation on industry of 73.2 days of consumption. Some 70% of this is covered by the Danish stockholding agency, FDO, largely in the form of refined products.
The Danish Energy Agency is, on behalf of the Minister for Climate and Energy, responsible for energy matters including the security of oil and gas. The DEA also has the over-all responsibility for the handling of a crisis.
With respect to security of natural gas, the transmission system operator (TSO), Energinet.dk is responsible for operational matters and preparing an annual plan for assuring security of supply. In a crisis, within the framework of the DEA’s crisis management, Energinet.dk would take over the role of gas supplier to the Danish market, with an obligation to ensure supplies of gas to the non-interruptible Danish end-users. It would do this by drawing on measures only available to Energinet.dk in emergency supply situations, i.e. deliveries from the two underground storage sites in Denmark, re-routing of natural gas supply from the North Sea via the Syd Arne pipeline and limiting supplies to interruptible end-users.
Oil
Market features and key issues
Domestic oil productionOil production in Denmark began in 1972 and rose steadily until reaching a peak in 2004, when it averaged nearly 390 kb/d. Production has since declined steeply and in
CHAPTER 4 Emergency response systems of individual IEA countries Denmark 145© O
ECD/
IEA
2014
2012 it averaged some 201 kb/d. Danish oil production comes exclusively from offshore installations in the Danish North Sea, where there are 19 producing fields. The main crude stream, Danish Crude Blend, is a medium-light sweet quality that has a high middle distillate yield. Oil production is expected to continue to decline in the coming years.
Denmark’s period of self-sufficiency in oil can potentially be prolonged with additional production coming from technological developments and new discoveries. However the estimates for these resources, unlike the expected production profile, are subject to a high level of uncertainty. If realised, these would be expected to contribute substantially over the period from 2020 to 2035 and decline thereafter. Such a scenario would likely result in Denmark, alternating between being a net exporter and a (marginal) net importer of oil over this period, having oil import dependency that is growing steadily in the years after 2035.
The estimate of technological resources by the Danish Energy Agency (DEA) is based on increasing the average oil recovery rate by 5%. Currently the recovery rate (the ratio of ultimate oil recovery to total oil originally in place) of Danish oil production is relatively low, averaging around 24%. The 5% increase is expected to derive primarily from new techniques used for CO
2 injection. Government initiatives for enhanced oil recovery
include an independent assessment – prepared by the North Sea Fund, the DEA and Maersk Oil and Gas – of the existing worldwide experience with different methods used to recover more oil from the fields.
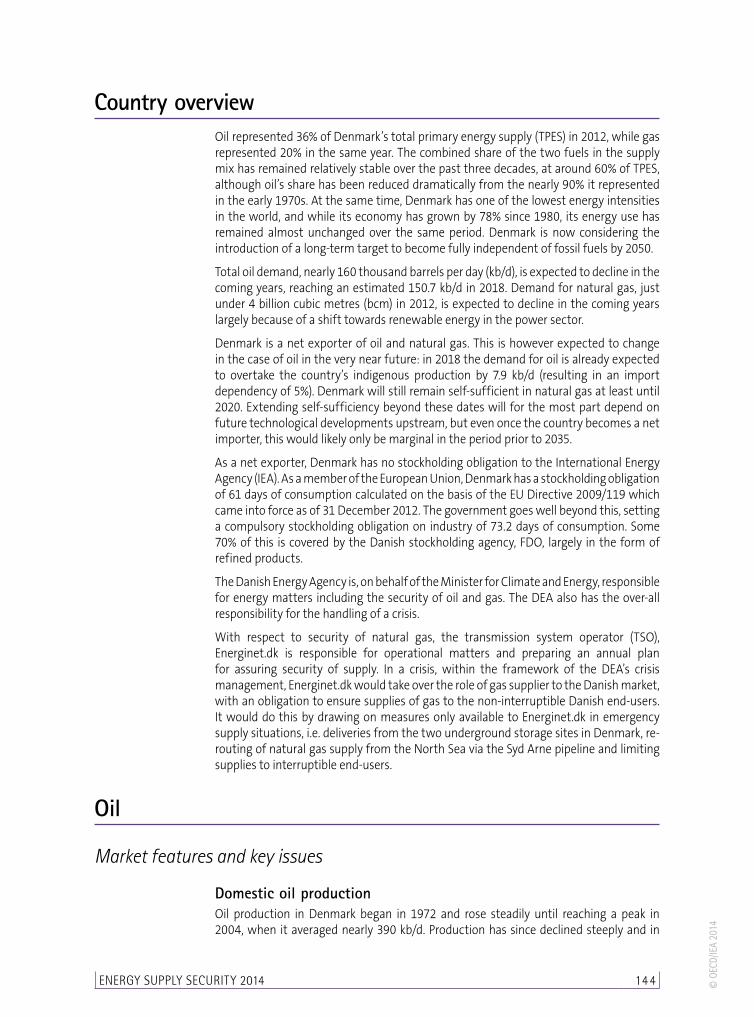
Oil demandOil product demand in Denmark totalled some 7 million tonnes (Mt) in 2012, or an average of 158.5 kb/d. This represents a decline in total oil use at an average annual rate of 2.7% since 2001. During this period, demand for oil use in the transformation and residential sectors declined substantially. The use of fuel oil in power generation is declining and the use of heating oil is subsiding because of the increased connection of homes to district heating which is primarily fuelled by renewable energy or natural gas. At the same time, demand for transport diesel continued to grow at an average 2.5% annually in the period from 2001 to 2012.
Figure 4.6.2 Oil demand by product, 1998-2012
0
50
100
150
200
250
1998 2000 2002 2004 2006 2008 2010 2012
kb/d
Other products
Residual fuels
Other gasoil
Diesel
Jet and kerosene
Motor gas
Naphtha
LPG and ethane
EnERgy SuPPly SECuRITy 2014 146 © O
ECD/
IEA
2014
The transport sector accounts for two-thirds of all oil used in Denmark. Diesel is the single largest component in the mix of oil products used and in 2012 it represented 40% of the oil products consumed in the country. Automotive diesel has a price advantage for consumers as it has a lower tax rate than gasoline.
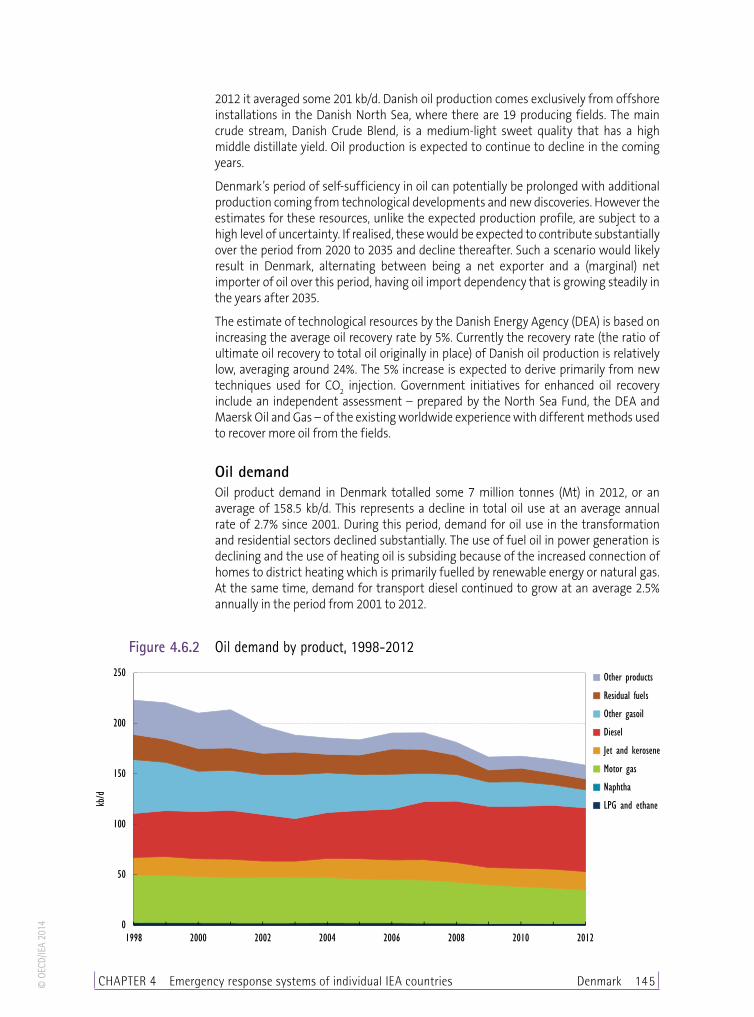
Figure 4.6.3 Oil consumption by sector, 1973-2011
0%
10%
20%
30%
40%
50%
60%
70%
80%
90%
100%
1973 1975 1977 1979 1981 1983 1985 1987 1989 1991 1993 1995 1997 1999 2001 2003 2005 2007 2009 2011
Commercial/agriculture/other
Residential
Industry
Transport
Transformation
Total oil demand is not expected to change significantly in the coming years. The DEA’s projection for oil demand, which is the basis for forecasting the country’s oil self-sufficiency (see section above on domestic oil production), assumes oil consumption will grow moderately, averaging 0.4% annually to 2030. However, the Danish Oil Industry Association (EOF) as well as the independent public stockholding agency, FDO, expect total oil consumption to decrease gradually in the coming decade (-0.5% annually).
Imports/exports and import dependencyDenmark’s total net exports of oil, including both crude and refined product, amounted to 42.7 kb/d in 2012.
Denmark has been a net exporter of crude oil since the mid-1990s. In 2012, roughly 143 kb/d of the 201 kb/d of domestic production was exported. In the same year Denmark imported 74.6 kb/d of crude oil for domestic refining, primarily from Norway.
In terms of refined products, Denmark is a marginal net exporter (less than 1 kb/d in 2012) – a change from previous years, when Denmark was a marginal net importer. Generally, Denmark is a net exporter of gasoline and fuel oil and a net importer of middle distillates.
CHAPTER 4 Emergency response systems of individual IEA countries Denmark 147© O
ECD/
IEA
2014
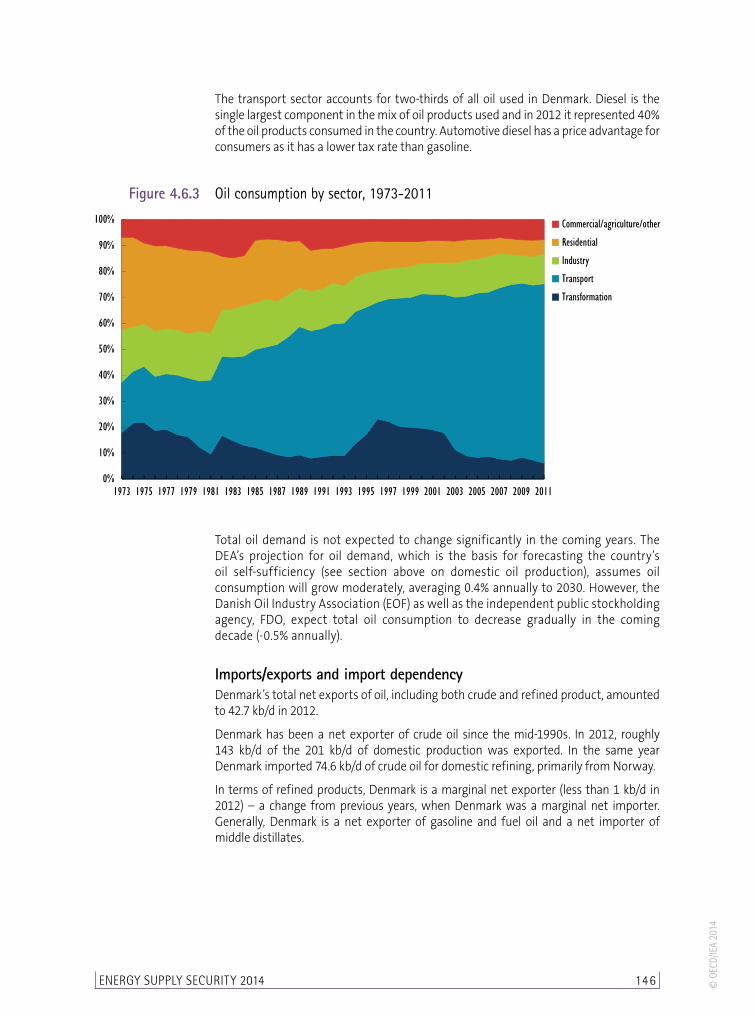
Figure 4.6.4 Oil product imports by origin, 2012
Sweden20%
Norway17%
United Kingdom11%Poland
10%
Finland5%
Other37%
Oil company operationsOil production on the Danish continental shelf is dominated by three groups of companies with the following operators: Maersk (the operator of 15 fields), DONG (3 fields) and Hess (one field).
In the downstream oil sector, approximately 90% of the market is represented by five companies: Statoil, Shell, Kuwait Petroleum, Uno-X and OK. All are members of the EOF. Consolidation in the Danish oil industry has continued over the past decade, with many smaller companies being purchased by the larger companies. The acquisition by Statoil of Conoco/Jet is one of the more significant examples of this consolidation in recent years. Statoil has also announced that it will put its retail and industry sales organisation into a separate, publicly traded company.
Oil supply infrastructure
RefiningIn 2012, Danish refineries processed about 7.4 million tonnes (Mt) of crude oil, or just under 156 kb/d.
Denmark has two refineries, one in Kalundborg and the other in Fredericia, with a combined total crude distillation capacity of 180 kb/d in 2012. The Kalundborg refinery (110 kb/d), owned by Statoil, primarily processes Norwegian crude, but is flexible to run condensates and other crudes (e.g. Danish crude). All crude oil, including condensates, is supplied by ship. The Fredericia refinery (70 kb/d), owned by Shell, processes mostly Danish North Sea crude oil supplied by pipeline from Danish offshore production.
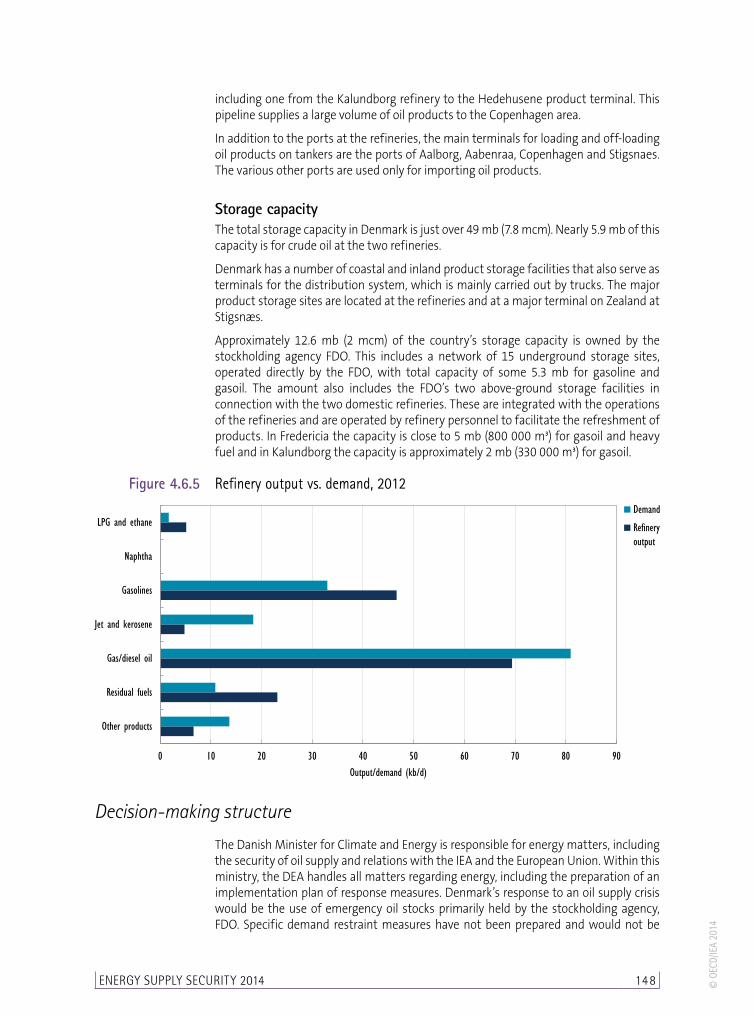
In comparison to Danish oil demand, the domestic refineries produce a surplus of gasoline and residual fuel oil, but do not meet the demand for middle distillates. Trade in refined products is thus necessary to balance domestic supply and demand.
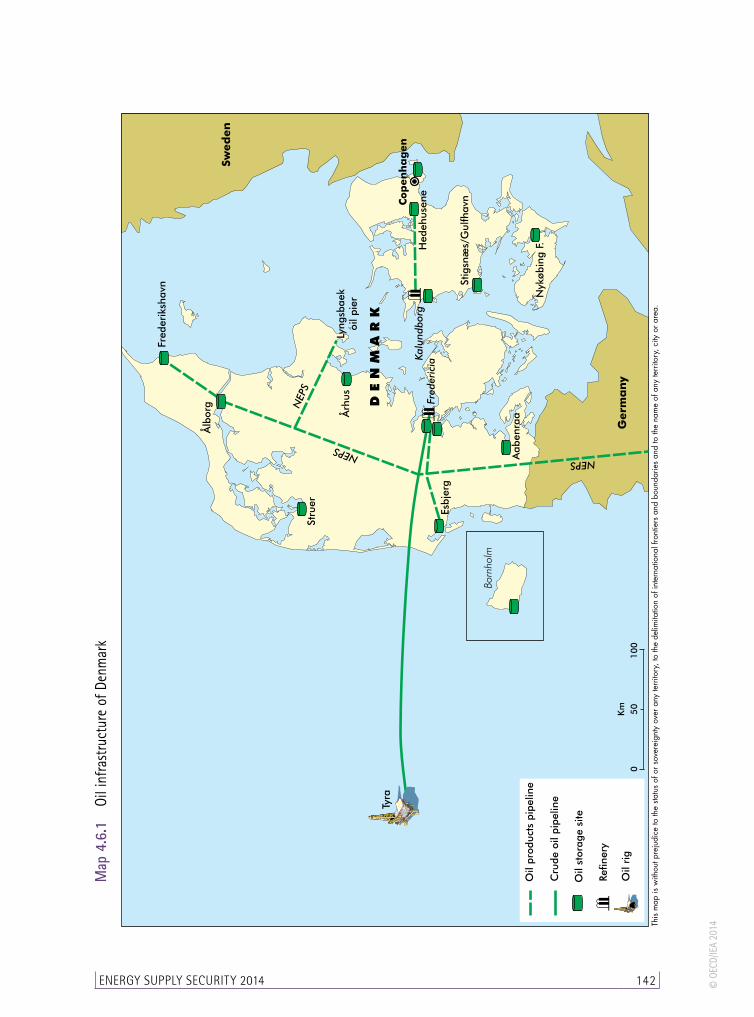
Ports and pipelinesDenmark has one crude oil pipeline connecting most of its offshore production to the Shell refinery and the crude export terminal, both at Fredericia. Owned and operated by DONG Oil Pipe A/S, the pipeline is 330 km long and has a capacity of 360 kb/d.
The Northern European Pipeline System (NEPS), extends from Heide in Germany to North Jutland and is owned and operated by the Danish military forces. In addition, the FDO owns and operates a number of product pipelines in Jutland and in Zealand,
EnERgy SuPPly SECuRITy 2014 14 8 © O
ECD/
IEA
2014
including one from the Kalundborg refinery to the Hedehusene product terminal. This pipeline supplies a large volume of oil products to the Copenhagen area.
In addition to the ports at the refineries, the main terminals for loading and off-loading oil products on tankers are the ports of Aalborg, Aabenraa, Copenhagen and Stigsnaes. The various other ports are used only for importing oil products.
Storage capacityThe total storage capacity in Denmark is just over 49 mb (7.8 mcm). Nearly 5.9 mb of this capacity is for crude oil at the two refineries.
Denmark has a number of coastal and inland product storage facilities that also serve as terminals for the distribution system, which is mainly carried out by trucks. The major product storage sites are located at the refineries and at a major terminal on Zealand at Stigsnæs.
Approximately 12.6 mb (2 mcm) of the country’s storage capacity is owned by the stockholding agency FDO. This includes a network of 15 underground storage sites, operated directly by the FDO, with total capacity of some 5.3 mb for gasoline and gasoil. The amount also includes the FDO’s two above-ground storage facilities in connection with the two domestic refineries. These are integrated with the operations of the refineries and are operated by refinery personnel to facilitate the refreshment of products. In Fredericia the capacity is close to 5 mb (800 000 m³) for gasoil and heavy fuel and in Kalundborg the capacity is approximately 2 mb (330 000 m³) for gasoil.
Figure 4.6.5 Refinery output vs. demand, 2012
0 10 20 30 40 50 60 70 80 90
Other products
Residual fuels
Gas/diesel oil
Jet and kerosene
Gasolines
Naphtha
LPG and ethane
Output/demand (kb/d)
Demand
Re�neryoutput
Decision-making structure
The Danish Minister for Climate and Energy is responsible for energy matters, including the security of oil supply and relations with the IEA and the European Union. Within this ministry, the DEA handles all matters regarding energy, including the preparation of an implementation plan of response measures. Denmark’s response to an oil supply crisis would be the use of emergency oil stocks primarily held by the stockholding agency, FDO. Specific demand restraint measures have not been prepared and would not be
CHAPTER 4 Emergency response systems of individual IEA countries Denmark 149© O
ECD/
IEA
2014
a part of an initial response. However, in a severe and long-lasting crisis light-handed measures would likely be considered to supplement the use of emergency stocks.
As an integrated part of the DEA, the Danish national emergency strategy organisation (NESO) consists of an emergency unit and data unit, each staffed with two part-time employees, and is the core body to co-ordinate issues among all stakeholders such as the press officer of the DEA and various ad hoc groups that could be established in the case of an oil crisis. The emergency unit handles all matters regarding the compulsory stockholding obligation (CSO), tasks related to the FDO and dialogue with the companies regarding their CSO.
In a crisis, the NESO would be expanded, as necessary, with other DEA staff in order to implement emergency measures in co-operation with other energy sector operations. It would convene meetings of the Danish Oil Advisory Board in order to create an opportunity for relevant authorities – including the oil industry – to assess the crisis, evaluate response options and define implementation measures.
In a crisis, the DEA would propose emergency response measures to the Minister for Climate and Energy through the ministry. In preparing such a proposal, assuming that this only consists of release of emergency stocks, the DEA would communicate with the FDO. If a decision is needed quickly, it would not be necessary to have a meeting of the Danish Oil Advisory Board prior to a decision, but such a meeting would then be held afterwards. The minister would, in connection with the decision on the response measure, inform the Danish parliament’s energy committee about the situation.
Stocks
Stockholding structureBecause of its status as a net exporter, Denmark currently has no stockholding obligation to the IEA. According to EU Directive 2009/119 which was implemented as of 31 December 2012 Denmark has an obligation to hold 61 days of consumption. However, Denmark has decided to hold emergency stocks at a level of 73.2 days of consumption.
The private sector covers the entire stockholding obligation, with the bulk of this covered by the non-governmental stockholding association (established by the private sector in 1964). The FDO is managed and financed by oil companies and operates the stockholding on their behalf.
Crude or productsThe FDO holds about 70% of the Danish CSO, mostly as finished products. Individual companies hold the remaining 30% in their commercial tanks. At the end of 2012, the FDO oil stocks totalled some 7.6 million barrels. This figure includes about 0.8 mb (110 000 m3) of crude oil stored at the refinery in Kalundborg. It also includes 0.9 mb (135 000 m3) of feedstock (straight run fuel) held at the Fredericia refinery which is in a solid form and requires a heating process before being ready for release (within six weeks).
Location and availabilityIn accordance with a bilateral agreement, Danish regulations stipulate that compulsory stocks must be stored in Denmark or in another EU member state under a bilateral agreement. Without this being stipulated in the regulations, it has been common practice that companies will not fulfil more than 10% of their obligation through stocks held abroad.
EnERgy SuPPly SECuRITy 2014 150 © O
ECD/
IEA
2014
The FDO-owned storage capacity (12.6 mb in total) includes a network of 15 underground storage sites with a total storage capacity of 5.3 mb for gasoline and gasoil.
Monitoring and non-complianceThe DEA is responsible for monitoring compulsory stocks. All companies, including the FDO, report monthly data on their stocks to the DEA, which calculates the yearly stockholding obligation for each company according to the compiled figures.
If the stockholding companies do not hold the required stocks, the DEA may report the company to the police.
Stock drawdown and timeframe The government of Denmark has statutory powers to draw down stocks, including those held by the FDO on behalf of the companies in order to participate in an IEA co-ordinated response.
When the need arises for a compulsory stockdraw, the DEA submits a proposal for the measures that are to be used to the Minister for Climate and Energy. The DEA also co-ordinates with the FDO. Ministerial decisions on the required stockdraw are expected to be taken within 24 hours. They are then communicated to the DEA, which ensures implementation in co-operation with the FDO.
Regardless of whether the released stocks are FDO stocks or company stocks such release will necessitate a temporary reduction of the companies’ CSO.
Trucks can be loaded directly at the depots of most of the FDO underground storage sites and the FDO is also able to pump oil products to bigger terminals for loading. Pumping rates vary between 18 and 90 kb/d (120 and 600 m³/h).
Financing and feesAll Danish stocks are held and financed by private parties; there is no financial support from the government for the industry’s stockholding obligations. The costs of holding compulsory stocks are included in the companies’ price calculations and may eventually be borne by consumers.
Other measures
Demand restraintIn a severe and long-lasting oil supply disruption, Denmark would consider light-handed demand restraint measures as supplementary measures to the use of compulsory stocks. The first demand restraint measures that would be considered are likely to be guidance and appeals to the public through the media for voluntary measures. More systematic information campaigns could be implemented (e.g. about eco-driving, the promotion of public transportation and carpooling), potentially combined with measures to make alternative forms of transportation more attractive. Subsequently, compulsory measures may be considered, likely to be first directed at public authorities, and thereafter directed at the general population or selected parts of the population.
The legal framework for enacting any demand restraint measures is the Consolidated Act No. 88 of 26 February 1986 on Supply Measures. Under this act the minister may, in the event of an internationally-induced crisis, stipulate provisions about the use, distribution, price equalisation and location of stocks of commodities.
CHAPTER 4 Emergency response systems of individual IEA countries Denmark 151© O
ECD/
IEA
2014
Fuel switchingThe Danish potential for fuel switching – from oil to coal or natural gas – in power and heating plants is limited. The price structures for oil, coal and other fuels have already resulted in most of this potential being realised. The large central power plants are not oil-fired apart from peak and reserve capacity which cannot be switched to other fuels. Likewise, some heating plants are oil-fired, but cannot be switched to other fuels.
OtherThere is no legislation which covers the issue of surge production. Danish oil production in the North Sea is normally operated at full capacity and possibilities for surge production have not been identified.
Gas
Market features and key issues
Gas production and reserves In 1984 Denmark began producing natural gas from the North Sea and has been a net exporter of natural gas ever since. Production comes primarily from the Tyra, Halfdan, Dan and Tyra Southeast Fields, which account for three-quarters of total Danish gas production. Approximately 10% of total production is used in the field as fuel, for injection or is flared. The proportion of natural gas used as lift gas in wells with increasing water production could grow significantly in the coming years as oil extraction becomes increasingly difficult from ageing fields.
Production peaked in 2005, with a total of 10.4 bcm produced. Total production has declined steeply since and was some 6.4 bcm in 2012.
While Danish gas production is expected to continue to decline sharply in the immediate short term, it will increase substantially in 2014 and 2015 because of the development of new and existing fields. Based on the DEA’s expected production profile, Denmark is expected to remain a net exporter of gas up to and including 2020. The gas consumption forecast associated with this estimate is for a decline in gas demand, averaging roughly 1.3% annually to 2030.
As with oil production, there is the potential for prolonging the period of self-sufficiency in gas supplies. When including technological and prospective resources, the DEA estimates that Denmark will be a net exporter of gas beyond 2030.
Gas demandDemand for natural gas in 2011 was 4.2 bcm. In that year, the bulk of gas consumption (42%) was used for power generation in the transformation sector. Industry made up the second largest group, representing 19% of gas use, while the energy sector, where gas is used for oil extraction, represented another 16%.
Daily gas consumption in Denmark normally ranges from a level of around 4 million cubic metres per day (mcm/d) in the summer to 20 mcm/d in the winter. The expected maximum daily consumption when temperatures reach -13°C is about 25.3 mcm/d.
Future Danish gas consumption is expected to decrease by 1.3% annually from 2010 to 2030. This would infer a gas demand of some 4 bcm in 2015 and 3.8 bcm in 2020. The reason for the forecast decline is greater energy efficiency, a decrease in gas use at
EnERgy SuPPly SECuRITy 2014 152 © O
ECD/
IEA
2014
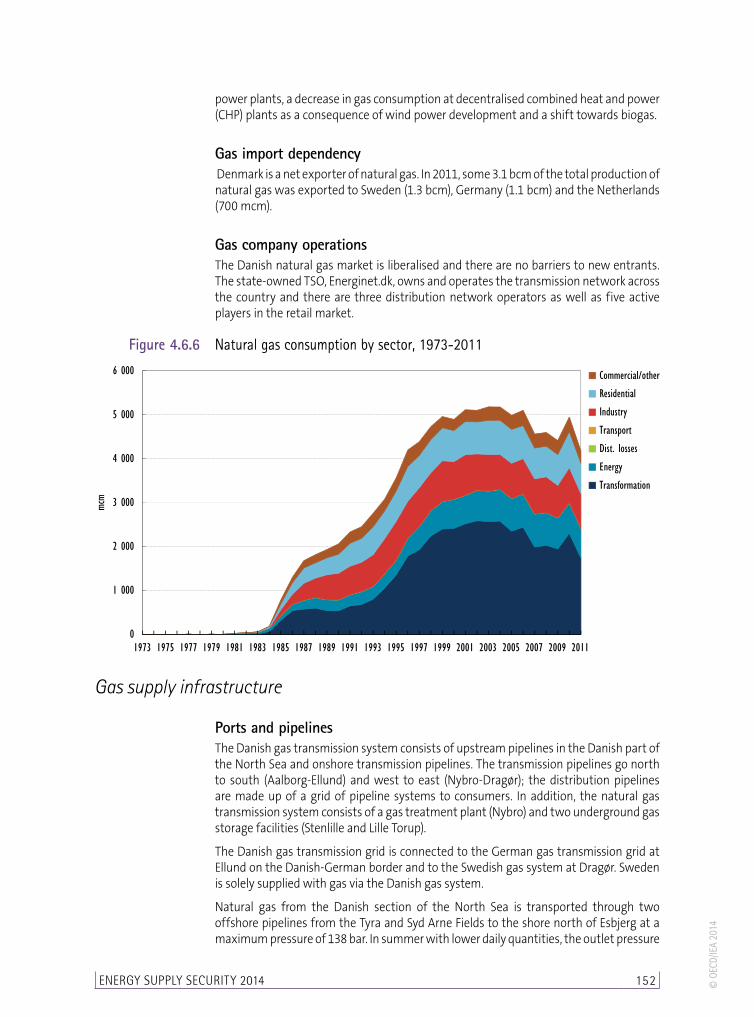
power plants, a decrease in gas consumption at decentralised combined heat and power (CHP) plants as a consequence of wind power development and a shift towards biogas.
Gas import dependency Denmark is a net exporter of natural gas. In 2011, some 3.1 bcm of the total production of natural gas was exported to Sweden (1.3 bcm), Germany (1.1 bcm) and the Netherlands (700 mcm).
Gas company operations The Danish natural gas market is liberalised and there are no barriers to new entrants. The state-owned TSO, Energinet.dk, owns and operates the transmission network across the country and there are three distribution network operators as well as five active players in the retail market.
Figure 4.6.6 Natural gas consumption by sector, 1973-2011
0
1 000
2 000
3 000
4 000
5 000
6 000
1973 1975 1977 1979 1981 1983 1985 1987 1989 1991 1993 1995 1997 1999 2001 2003 2005 2007 2009 2011
mcm
Commercial/other
Residential
Industry
Transport
Dist. losses
Energy
Transformation
Gas supply infrastructure
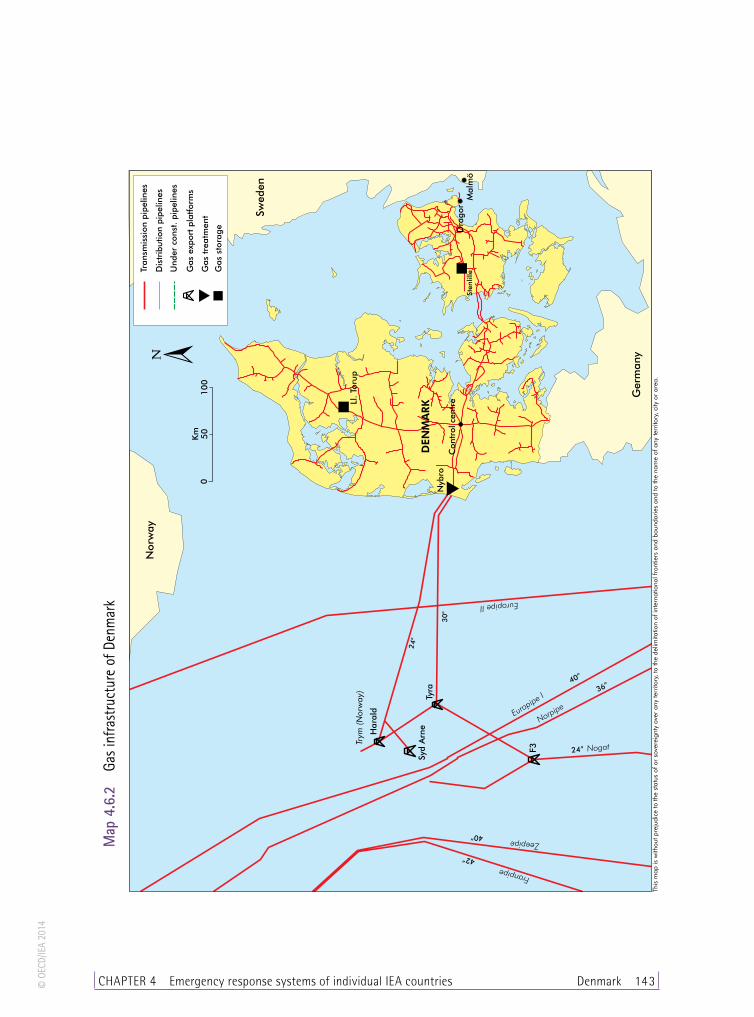
Ports and pipelinesThe Danish gas transmission system consists of upstream pipelines in the Danish part of the North Sea and onshore transmission pipelines. The transmission pipelines go north to south (Aalborg-Ellund) and west to east (Nybro-Dragør); the distribution pipelines are made up of a grid of pipeline systems to consumers. In addition, the natural gas transmission system consists of a gas treatment plant (Nybro) and two underground gas storage facilities (Stenlille and Lille Torup).
The Danish gas transmission grid is connected to the German gas transmission grid at Ellund on the Danish-German border and to the Swedish gas system at Dragør. Sweden is solely supplied with gas via the Danish gas system.
Natural gas from the Danish section of the North Sea is transported through two offshore pipelines from the Tyra and Syd Arne Fields to the shore north of Esbjerg at a maximum pressure of 138 bar. In summer with lower daily quantities, the outlet pressure

CHAPTER 4 Emergency response systems of individual IEA countries Denmark 153© O
ECD/
IEA
2014
is reduced to minimise the energy consumption for compression. In winter, the pressure is increased to also ensure large volumes of line pack (i.e. the gas volume naturally stored in the actual gas pipelines) for use in the event of disruptions and emergency situations. The Tyra-Nybro pipeline has a capacity of approximately 28.5 mcm/d (27 million Nm³/day); the Syd Arne-Nybro pipeline capacity is 13.7 mcm/d (13 million Nm³/day).
On shore, the natural gas passes through a gas treatment plant in Nybro. Here, the quality of the gas is checked and measured, and pressure is reduced to the maximum pressure for land pipelines of 80 bar. The plant can also reduce the content of impurities such as heavy hydrocarbons, and remove any hydrogen sulphide if necessary for the gas to comply with the agreed specifications. If the gas is to be cleaned, only reduced volumes can be supplied (about 50%).
The security of supply was improved with the Syd Arne pipeline, constructed in 1999 which made it possible to redirect gas production from the Tyra facilities to the Syd Arne pipeline. In addition, a new pipeline was commissioned in 2004, connecting the Tyra facilities to the F/3 platform in the Dutch sector. The pipeline allows the transport of gas through the existing Northern Offshore Gas Transport (NOGAT) pipeline to the Netherlands for the purpose of selling gas to the Dutch market. It is not currently possible to import gas into Denmark via this pipeline.
StorageThere are two natural gas storage facilities in Denmark with a total capacity of 1 bcm of working gas. These storage facilities are primarily used to even out seasonal fluctuations, as the daily demand for natural gas during the winter can reach levels six to seven times that of summer. The storage can also be used as emergency storage facilities in case of interruptions to gas deliveries. The TSO, Energinet.dk, has access to a volume of this gas as part of the available emergency response measures.
The storage facility in Lille Torup (northern part of Jutland) is owned by Energinet.dk Gas Storage and comprises seven salt caverns with a total firm working volume of 420 mcm. Firm injection capacity is 3.6 mcm/d and firm withdrawal capacity is physically 14 mcm/d. However, owing to restrictions in the transmission system, only 8 mcm/d can be withdrawn. Energinet.dk Gas Storage has decided to begin re-leaching a cavern which will result in more working volume capacity.
The storage facility in Stenlille (western part of Zealand) is an aquifer storage owned by DONG Energy. The storage has a total firm working volume of 588 mcm. Firm injection capacity is 4.8 mcm/d and firm withdrawal capacity is physically 11 mcm/d. However, because of restrictions in the transmission system the storage is only able to offer 9.5 mcm/day. The Stenlille Gas Storage Facility can be relatively easily expanded to a working volume of up to 750 mcm.
Emergency policyThe responsibility for Denmark’s security of supply lies with the Danish Energy Agency on behalf of the Minister for Climate Change and Energy. Within this framework the Danish TSO, Energinet.dk, has responsibilities for operational matters. This consists of observing minimum standards and preparing an annual plan for the security of gas supplies. The plan must describe how security of supply is ensured during the period under review and how it will be ensured in the coming year and next ten years. In addition, the plan must account for the means used to maintain security of supply in emergency supply situations.

EnERgy SuPPly SECuRITy 2014 154 © O
ECD/
IEA
2014
Security of supply has been determined by the administration on the basis of an objective which stipulates that, in the event of full or partial interruption of gas supply to the Danish market, the supply of uninterruptible consumers must, at a minimum, be maintained for 3 days during particularly cold periods (defined as a daily mean temperature of -13 °C), which, on average, occur every 20 years, and for 60 days during a normal-temperature winter (corresponding to the expected repair time needed after the breakdown of an offshore pipeline).
Based on historical data, a daily mean temperature of -13 °C is expected to result in Danish gas consumption of approximately 25.3 mcm/d (24.0 million Nm3/day). In an emergency supply situation Energinet.dk would take over the supplies to the Danish gas market from the market players. To this end, Energinet.dk purchases alternative transport capacity in the Syd Arne pipeline, reserves capacity in the storage facilities and enters into agreements on interruptibility with a number of major consumers. In order to fulfil the security objective (3 days of extreme winter, 60 days of normal winter), every year Energinet.dk determines the gas volumes to be covered by each of these emergency measures.
In a worst-case-disruption scenario, supplies would be disrupted on the largest source of supply (supplies via the Tyra-Nybro pipeline). In such a case, Energinet.dk can maintain the supply of gas to Denmark using supplies from storage, emergency supply from Tyra via Harald through the Syd Arne-Nybro pipeline, and interruption of the largest natural gas consumers based on interruptible contracts.
Emergency response measuresEnerginet.dk has access to a total of approximately 215 mcm of strategic storage capacity filled with gas. This includes amounts reserved directly by Energinet.dk (the amount is determined each year) and volumes made available from shippers’ storage filling requirements. The majority of the capacity in Stenlille and Lille Torup has been sold under filling requirements such that the storage customers commit themselves to maintaining a certain stock volume during the year against a discount. Energinet.dk compensates the two storage companies for this and thus has additional stock volume for emergency situations at its disposal. Each year on 1 March 12% of the shippers’ storage capacity must be left in storage.
Energinet.dk has agreements with approximately 40 of Denmark’s largest gas consumers concerning the interruption of supplies during an emergency situation.
Approximately 20% of the total Danish gas consumption during winter (January and February) can be interrupted through these agreements. The terms of agreement can cover either an interruption of gas delivery after three hours or after three days, or a combination of these. Some consumers have agreed to a 100% interruption of their consumption while others reduce their consumption only partly. Thus, most of the CHPs, in such situations, plan to temporarily stop their electricity production and reduce their gas consumption to cover heat production only. In general, the interruptible end-users plan to reduce their consumption by as much as 75% in case of such an emergency supply situation.
Some of the interruptible customers have a degree of fuel switching ability. This is the case for the three large power stations (Avedøre II, H.C. Ørsted Power Station and Skærbæk Power Station) which are directly connected to the transmission grid. All three plants have the ability to use oil as a backup supply source.