energy systems,sustainability and chemistryrb/professional activities/energychemf15.pdf ·...
TRANSCRIPT

Energy Systems,Sustainability and Chemistry
Rangan BanerjeeDepartment of Energy Science and Engineering
IIT Bombay
National Conference on 'Chemistry- Environment and Sustainability 20th February 2015

Historical Trend in Energy use
2Source : Smil (2010)

3
ENERGY FLOW DIAGRAMPRIMARY ENERGY
ENERGY CONVERSION FACILITY
SECONDARY ENERGY
TRANSMISSION & DISTRN. SYSTEM
FINAL ENERGY
ENERGY UTILISATION EQUIPMENT & SYSTEMS
USEFUL ENERGY
END USE ACTIVITIES
(ENERGY SERVICES)
COAL, OIL, SOLAR, GASPOWER PLANT, REFINERIESREFINED OIL, ELECTRICITY
RAILWAYS, TRUCKS, PIPELINESWHAT CONSUMERS BUY DELIVERED ENERGYAUTOMOBILE, LAMP, MOTOR, STOVEMOTIVE POWER RADIANT ENERGYDISTANCE TRAVELLED, ILLUMINATION,COOKED FOOD etc..

4
India and World (Selected Indicators for 2012)
Population 1237million 7037 million
GDP (PPP) 5567 Billion 2005 US$(4500 $/person)
82901 Billion 2005 US$(11780 $/person)
Primary Energy 33 EJ 559 EJ
Energy/person 26.6 GJ/person/year 84.4 GJ/person/year
Electricity/person 760 kWh/capita/year 2972 kWh/capita/year
CO2 emissions
Per person
Per GDP
1626 Million tonnes 31734 Million tonnes
1.58 tonnes /capita/year 4.51 tonnes /capita/year
0.35 kg /US$ ppp 0.38 kg /US$ ppp
Source: IEA, Key World Energy Statistics 2014

5
Global Primary Energy mix
Source: IIASA- WEC Study
//www.iiasa.ac.at

India-Primary Energy mix 2012
2007 24 EJ
2010 29 EJ
2012 33 EJ
Coal42%
Oil27%
NatGas6%
Biomass22%
Hydro1%
Solar/Wind1%
Nuclear1%

7

Primary Energy Mix
8
Renewables and Nuclear
Coal Oil and Gas
20%
40
%
60
%
80
%
100%
TIFAC, 2013

Long term global temperature record
9Rockstrom et al, Nature, 2009

10Rockstrom et al, Nature 2009

Carbon Dioxide Concentrations
11http://cdiac.ornl.gov/trends/co2/graphics/lawdome.gif

12
Carbon Dioxide Concentrations

Carbon Footprint
13
blog.beliefnet.com http://www.iea.org/statistics/
16.94
16.28
15.37
9.28
7.27
7.06
5.92
2.07
1.41
0.28
0.13
0 1 2 3 4 5 6 7 8 9 10 11 12 13 14 15 16 17 18
USA
Saudi Arabia
Canada
Japan
South Africa
UK
China
Brazil
India
Kenya
Nepal
GHG Emissions Tonnes CO2/capita - 2011
World Average

Carbon footprint calculator
14Source: http://www.icicibank.com/html/en/go-green/Index.html

What is sustainable Development?
15
Development that meets the needs of the present without compromising the ability of future generations to meet their own needs.Brundtlant Report WCED 1987Development without cheatingour children

Historical Household Electrification Rates
GEA, Chapter 19 16

17
Energy Issues Energy system – predominantly based on fossil fuel
(~80% +) 2 billion people – No access to modern energy services Link between energy service and quality of life Significant disparity in per capita energy use Depletion of fossil fuels (peak oil?) Adverse environmental impact- local, regional, global –
GHG – Climate change Renewables, Energy Efficiency, Carbon Capture and
Storage

Green Technologies?
18
http://www.dilbert.com/

Renewable Energy Options
Wind Solar Small
Hydro Biomass
Tidal Energy
Wave Energy Ocean Thermal Energy
Solar Thermal
Solar Photovoltaic
Geothermal*
19

20
Power Density and Area
Source : Smil (2010)

Cost of Electricity ($/MWh)
21
3 R
s./k
Wh
6 R
s./k
Wh
9 R
s./k
Wh
Bloomberg, 2014

1 MW Solar Plant – IIT Bombay
22http://www.indiaprwire.com/pressrelease/education/20140128287038.htm

National Solar Thermal Power Facility – Consortium supported by MNRE and led by IIT Bombay
23
Thermal Storage
Solar Field
Expansion Vessel
Heat Exchanger
Generator
Condenser
Turbine
Pump
Pump
Cooling Water Circuit
Water/ Steam Loop
Thermic Oil Loop
CLFR Direct Steam
Schematic of 1 MW Solar Power Plant
Simulator snapshot
Parabolic Trough Solar Field Linear Fresnel Reflector Solar Field at Gwalpahari site
Consortium Members
KIE Solatherm

24

25

TEAM SHUNYASOLAR DECATHLON EUROPE 2014
26

House in Versailles – 26th June, 2014
Team Shunya
70 students 13 disciplines 12 faculty

28
Goals for New Materials
Dematerialisation Energy Efficiency Reduced emissions ‘Sustainable’, renewable materials Cost Effectiveness Net Energy Analysis

29
Nanotechnology
Processing Structure Properties Performance
•Macroscopic behaviour –often different from
nanoscale/ quantum behaviour
•Synthesis of Materials with desired quantum
behaviour

30
Smart MaterialsElectrochromic windows -
Active Material – Tungsten
oxide
Reversibly darken – Voltage
applied by nanostructured
electrodes – Normally Indium
Tin Oxide – Substitution by
nanostructured ZnO
Photochromic windowsMicrostructured glazing
Glass characteristics
Source: EU Nanotech report, 2003

31
Fuel Cells Nanoscale catalysts for
PEM – reduce costs of metal
Nanocrystalline zirconia films- electrolyte for SOFC
Ceramic nanopowders for SOFC (ItN Nanovation, Nextechmaterials)
SONY- fullerenes –electrodes for DMFC
Alkaline fuel cell
Carbon supported metal catalyst
Source: EU Nanotech report, 2003

32
Electrosynthesis Synthesis of chemical compounds in an
electrochemical cell Ambient pressure electrosynthesis of
Ammonia(Marnellos and Stoukides. 1998), Kordali et al (2000)Conventional Haber process – 480° C, 100 atm, energy intensive
Solid Polymer Electrolytes Electrocatalysts Nanotechnology – to engineer catalyst,
electrolyte combinations – for viable conversion processes

33
Thermoelectrics Thermoelectric generators
and coolers Figure of merit ZT=S2T/k Bi2Te3, (Bi Sb)2Te3 (ZT 1-2) Silicon nanowires 50 nm ZT
0.6 room temp Berkeley,7nm Bi wires- ZT 6 Michigan
Smart clothes – powered by body heatSources: Hochbaum et al (2008),
Lauterbach et al (Infineon) 2002

Algal Biofuel Schematic
34Source: Georgianna and Mayfield, 2012

35
Efficient Lighting
Blue LED
• Quantum Caged Atoms (QCA) –
efficient Solid State Lighting (few nm) –
GE, Phillips, Siemens
• QCA based nanophospors- five times
as efficient as conventional – FTL (UV
to white)
• Kopin – nanopockets – blue LED
• Night vision systems based on
quantum dotsQ- dot based device

36
Energy Materials

Sustainability Analysis
Inventory (process energy and material) to produce one unit of output
Classification of total primary energy into non-renewable and renewable energy
Non-renewable energy useGHG emissions
Total primary energy required to produce required process energy and materials
Cost of different equipment and material required, discount rate, life of the equipment
Life cycle cost
Materials and other resources such as water, land etc required to produce 1 kg of hydrogen
Resource constraint
Amount of material and other resources required to meet the current demand
Process flow charts
Sizing of different equipment required
Total GHG emissions in producing process energy and materials (using emission factors)

Resource constraint
Resource constraint
Material supply constraint
Area
Material constraint
Other constraint
Annual requirement/Reserve
Area required/Available land area
Annual requirement/Reserve
No constraint
Technical constraint, water for biomass based systems etc.

Material Choice
39Allwood et al, 2011

Material Choice
40Allwood et al, 2011

Choice of materials for transport fuels
41Source: Wallington et al 2012

Energy density and specific energy
42Source: Wallington et al 2012

Comparison of fuels and energy storage
43Source: Wallington et al 2012

Hydrogen pathways
Photo chemical
Solar Energy Nuclear Energy Bio-Energy
Electricity
Wind
Thermal
ElectrolysisThermo chemical
Fossil-Fuel
Photo biological
Hydrogen
Gasification Fermentation
Cracking + Shift Reaction

Renewable Hydrogen
Current methods of hydrogen production Steam methane reforming (SMR) Coal gasification Electrolysis
Based on fossil fuels, Not sustainable Need for hydrogen production from
renewable energy sources like wind, solar, biomass etc.

Net energy analysis
Functional unit – 1 kg hydrogen at 25oC temperature and 1 atm pressure.
Base case – steam methane reforming Criteria Net energy ratio (output/non-renewable energy
input) NER> 1 Greenhouse gases (GHG) emissions (kg CO2
eq / kg H2) Energy Efficiency
LCA software SimaPro 6

Biological methods of hydrogen production
Operates at ambient temperature and pressure – expected to be less energy intensive.
Variety of feedstocks as carbon source like sugars, lignocellulosic material, wastewater etc.
Several reactions – substrate, bacteria
C6H12O6 + 2H2O 4H2 + 2CO2 + 2CH3COOH
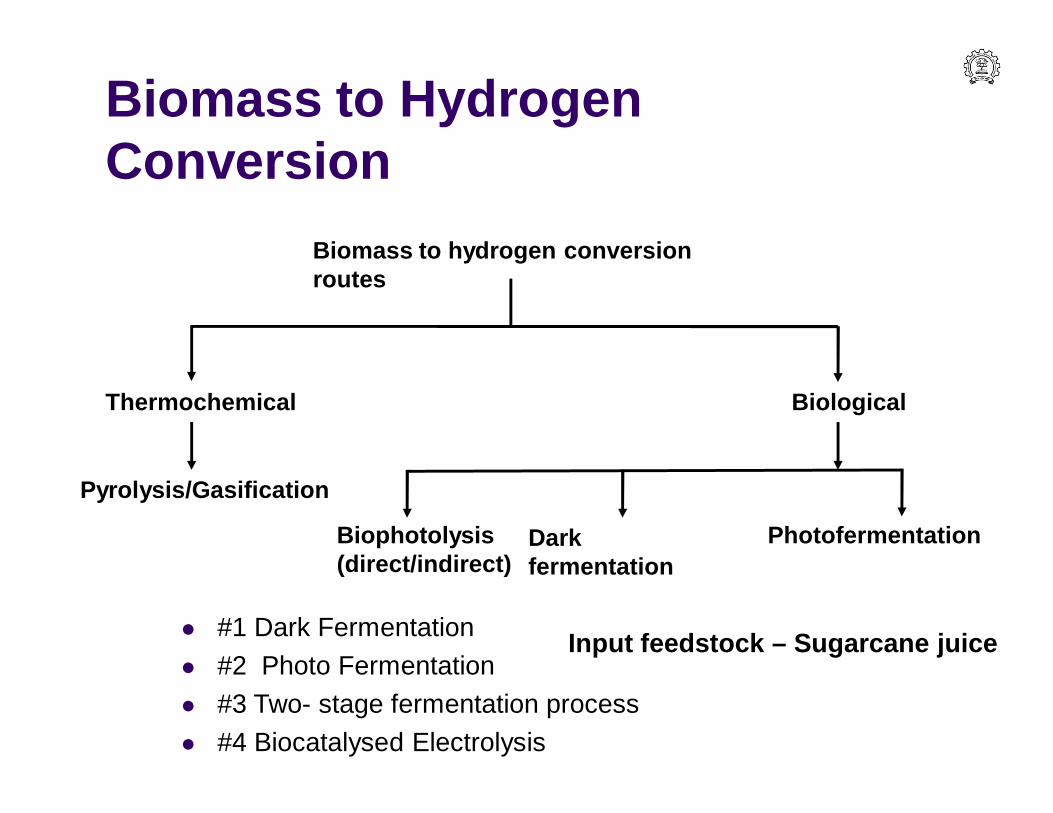
Biomass to Hydrogen Conversion
Biomass to hydrogen conversion routes
Thermochemical Biological
Biophotolysis(direct/indirect)
Pyrolysis/Gasification
Dark fermentation
Photofermentation
#1 Dark Fermentation #2 Photo Fermentation #3 Two- stage fermentation process #4 Biocatalysed Electrolysis
Input feedstock – Sugarcane juice

Steam methane reformingParameter Value Unit (/kg H2)Resource consumptionNatural gas (in ground), input 3.64 kgCoal (in ground), input 159.2 gIron (Fe, ore), input 10.3 gIron scrap, input 11.2 gLimestone (CaCO3, in ground) 16.0 gOil (in ground) 16.4 gAverage air emissionsBenzene 1.4 gCarbon dioxide 10.62 kgCarbon monoxide 5.7 gMethane 59.8 gNitrogen oxides (as NO2) 12.3 gNitrous oxide (N2O) 0.04 gNon-methane hydrocarbons (NMHCs) 16.8 gParticulates 2.0 gSulfur oxides (as SO2) 9.5 g

Results (without by product use)
Process Case 1: Without by-products
GHG (kg CO2)
Non-renewable energy use (MJ)
Energy efficiency (%)
Steam methane reforming 12.8 188 64
Dark-fermentation 5.5 61.7 9.6
Photo-fermentation 3.5 40.1 25.6
Two-stage process 3.4 39.3 27.2
Biocatalyzed electrolysis 5.3 64.8 25.7

51
Life cycle Approach NER = Eout/EinIf NER > 1, Replacement viableNER < 1, Replacement not viable CRF (d, n)=[d *(1+d)^n]/[(1+d)^n-1] ALCC = AC + C0*CRF (d, n) NER (Net Energy Ratio) ALCC (Annualized cost) CRF (Cash recovery factor)
Methodology for analysis
Secondary EnergyPrimary EnergyRenewable Energy
Fossil diesel, electricity
Agricultural Cultivation stage
Fertilizer, herbicide, fossil
IrrigationJatropha/Karanja Seeds
Seed bed preparation,
Sowing, diesel
Cracking
Pressing
Filtration
Trans-esterificationJatropha/karanja Bio-diesel (NER, MJ/km vehicle driven, cost (Rs/kg),
Renewable Energy
Vehicle operation with fuel combustion stageFossil diesel
Transportation and conversion stage
Fossil diesel, MeOH, NaOH
PE PE
PE
PE

52
0
1
2
3
4
5
6
7
0 2 4 6
NE
R
Jatropha, Different yield levels (tonnes/ha)
NER (without co-product)
NER (with co-product)
Not viable
0123456789
10
0 5 10 15N
ER
Karanja, Different yield levels (tonnes/ha)
NER (without co-product)
NER (with co-product)
Viable
Jatropha and Karanja Analysis results
Rs. 33-36/kg 2007 values Rs. 21-25/kg

Energy Analysis Of Buildings
0.00
1000.00
2000.00
3000.00
4000.00
5000.00
6000.00
7000.00
8000.00
Ener
gy (k
Wh/
year
)
Lifecycle energy analysis of an air-conditioned residential building
Heating
Appliances
Cooling
Embodied Energy
Daylighting Simulation

54
Batteries
Li-ion, Ni-MetalHydride
Nanoparticle fillersAl2O3, TiO2 to
polyethyleneOxide (electrolyte) Metal intercalcated
electrodes Supercapacitors-High
power, long cycle life – Nanostructured carbon
Source: Tarascon and Armand (2001); Arico et al (2005)

Energy input for Batteries
55Source: Larcher and Tarascon, 2015

Sustainable Materials for Batteries
56
Source: Larcher and Tarascon, 2015

Sodium ion based battery electrode materials
57
Source: Larcher and Tarascon, 2015

Materials for Batteries
Low Temperature Synthesis processes-Ionothermal synthesis, microwave assisted processes etc 200 C
Bioinspired synthesis of inorganic compounds
Recycling Na ion technology
58

59
Summing Up Energy – shortages,disparity, fossil fuel depletion Climate change- GHG – ‘Unsustainable’ Linkage material use and energy Nanotechnology –potential to modify/ obtain desired
material properties Challenges – new materials, new processes Life cycle analysis, Net Energy Analysis – Initial
screening of options Designer materials, new chemistries Bio-inspired materials
Thank you

60
References Smil (2010): V Smil, Science, energy, ethics, and civilization, Visions of Discovery: New Light on Physics, Cosmology,
and Consciousness, ed. R.Y. Chiao, M.L. Cohen, A.J. Leggett, W.D. Phillips, and C.L. Harper, Jr. Published by Cambridge University Press. © Cambridge University Press 2010
IEA, Key World Energy Statistics 2014, http://www.iea.org/publications/freepublications/publication/KeyWorld2014.pdf TIFAC, 2013: TIFAC Energy Technology Vision 2035 – draft in progress Rockstrom et al, Nature, 2009 http://cdiac.ornl.gov/trends/co2/graphics/lawdome.gif International Energy Agency-Statistics, http://www.iea.org/statistics blog.beliefnet.com Bloomberg, 2014: GLOBAL TRENDS IN RENEWABLE ENERGY INVESTMENT 2014, UNEP and Bloomberg New
Energy Finance . GEA Chapter 19: Pachauri, S., A. et al, 2012: Chapter 19 - Energy Access for Development. In Global Energy
Assessment - Toward a Sustainable Future, Cambridge University Press, Cambridge, UK and New York, NY, USA and the International Institute for Applied Systems Analysis, Laxenburg, Austria, pp. 1401-1458.
Larcher and Tarascon, 2015: Towards greener and more sustainable batteries for electrical energy storage, D. Larcherand J-M. Tarascon, NATURE CHEMISTRY, VOL 7, JANUARY 2015.
Wallington et al 2012: Sustainable Mobility, Future Fuels, and the Periodic Table, Journal of Chemical Education, American Chemical Society and Division of Chemical Education, Inc. December 2012.
Georgianna and Mayfield, 2012: Exploiting diversity and synthetic biology for the production of algal biofuels-REVIEW, Nature, 488, 329–335 (16 August 2012).
EU Nanotech report, 2003 Graetzel (2001): M.Graetzel, Nature, Vol 414, p 338—344 Hochbaum et al (2008) Lauterbach et al (Infineon) 2002 Slapbach and Zuttel, 2001, Nature, Vol 414, p 353-358 J.M.Tarascon, M.Armand,2001, Nature, Vol 414, p 359-367 Arico et al, Nature Materials, Vol 4, May 2005, p 366 -377 Allwood, JM and Ashby, MF and Gutowski, TG and Worrell, E (2011) Material efficiency: A white paper. RESOUR
CONSERV RECY, 55. pp. 362-381. ISSN 0921-3449