enersis s.a. ( enersis ) - enelamericas.com · ampla ampla energia e serviços s.a. brazilian...
TRANSCRIPT

ENERSIS S.A. ( ENERSIS )
20−FAnnual and transition report of foreign private issuers pursuant to sections 13or 15(d)Filed on 4/5/2012 Filed Period 12/31/2011

Table of Contents
SECURITIES AND EXCHANGE COMMISSIONWASHINGTON, D.C. 20549
FORM 20−Fo REGISTRATION STATEMENT PURSUANT TO SECTION 12(b) OR 12(g) OF THE SECURITIES EXCHANGE
ACT OF 1934
OR
x ANNUAL REPORT PURSUANT TO SECTION 13 OR 15(d) OF THE SECURITIES EXCHANGE ACT OF 1934For the fiscal year ended December 31, 2011
OR
o TRANSITION REPORT PURSUANT TO SECTION 13 OR 15(d) OF THE SECURITIES EXCHANGE ACT OF1934
OR
o SHELL COMPANY REPORT PURSUANT TO SECTION 23 OR 15(d) OF THE SECURITIES EXCHANGEACT OF 1934
Date of event requiring this shell company report
For the transition period from to
Commission file number: 001−12440
ENERSIS S.A.(Exact name of Registrant as specified in its charter)
ENERSIS S.A.(Translation of Registrant’s name into English)
CHILE(Jurisdiction of incorporation or organization)
SANTA ROSA 76, SANTIAGO, CHILE(Address of principal executive offices)
Nicolás Billikopf, phone: (56−2) 353−4639, fax: (56−2) 378−4789, [email protected], Santa Rosa 76, Piso 15, Santiago, Chile(Name, Telephone, E−mail and/or Facsimile number and Address of Company Contact Person)
Securities registered or to be registered pursuant to Section 12(b) of the Act:
Title of Each Class Name of Each Exchange on Which RegisteredAmerican Depositary Shares representing Common Stock New York Stock Exchange
Common Stock, no par value * New York Stock Exchange$ 249,734,000 7.40% Notes due December 1, 2016 New York Stock Exchange
$ 858,000 6.60% Notes due December 1, 2026 New York Stock Exchange
*Listed, not for trading, but only in connection with the registration of American Depositary Shares, pursuant to the requirements of the Securities andExchange Commission.
Securities registered or to be registered pursuant to Section 12(g) of the Act: None

Table of Contents
Securities for which there is a reporting obligation pursuant to Section 15(d) of the Act:
$ 350,000,000 7.375% Notes due January 15, 2014
Indicate the number of outstanding shares of each of the issuer’s classes of capital or common stock as of the close of the period covered by the annualreport:
Shares of Common Stock: 32,651,166,465
Indicate by check mark if the registrant is a well−known seasoned issuer, as defined in Rule 405 of the Securities Act:x Yes o No
If this report is an annual or transition report, indicate by check mark if the registrant is not required to file reports pursuant to Section 13 or 15(d) of theSecurities Exchange Act of 1934:
o Yes x No
Indicate by check mark whether the registrant (1) has filed all reports required to be filed by Section 13 or 15(d) of the Securities Exchange Act of 1934during the preceding 12 months (or for such shorter period that the registrant was required to file such reports), and (2) has been subject to such filingrequirements for the past 90 days:
x Yes o No
Indicate by check mark whether the registrant has submitted electronically and posted on its corporate Web site, if any, every Interactive Data File requiredto be submitted and posted pursuant to Rule 405 of Regulation S−T (§232.405 of this chapter) during the preceding 12 months (or for such shorter periodthat the registrant was required to submit and post such files).
o Yes o No
Indicate by check mark whether the registrant is a large accelerated filer, an accelerated filer, or a non−accelerated filer. See definition of “accelerated filerand large accelerated filer” in Rule 12b−2 of the Exchange Act:
Large accelerated filerx Accelerated filero Non−accelerated filero
Indicate by check mark which basis of accounting the registrant has used to prepare the financial statements included in this filing:
U.S. GAAPo International Financial Reporting Standards as issuedby the International Accounting Standards Boardx
Othero
Indicate by check mark which financial statement item the registrant has elected to follow:o Item 17 x Item 18
If this is an annual report, indicate by check mark whether the registrant is a shell company (as defined in Rule 12b−2 of the Exchange Act):o Yes x No

Table of Contents
“Enersis’ Simplified Organizational Structure” (1)As of December 31, 2011
(1) Only principal operating subsidiaries are presented here. The percentages listed for each of our subsidiaries represents Enersis’ economic interest in suchsubsidiary.

2
Table of Contents
TABLE OF CONTENTS
Page
GLOSSARY 4INTRODUCTION 8
Financial Information 8Technical Terms 9Calculation of Economic Interest 9Forward−Looking Statements 9
PART I 10Item 1. Identity of Directors, Senior Management and Advisers 10Item 2. Offer Statistics and Expected Timetable 10Item 3. Key Information 10Item 4. Information on the Company 22Item 4A. Unresolved Staff Comments 96Item 5. Operating and Financial Review and Prospects 97Item 6. Directors, Senior Management and Employees 126Item 7. Major Shareholders and Related Party Transactions 135Item 8. Financial Information 137Item 9. The Offer and Listing 139Item 10. Additional Information 141Item 11. Quantitative and Qualitative Disclosures about Market Risk 154Item 12 Description of Securities Other Than Equity Securities 158
PART II 159Item 13. Defaults, Dividend Arrearages and Delinquencies 159Item 14. Material Modifications to the Rights of Security Holders and Use of Proceeds 159Item 15. Controls and Procedures 159Item 16A. Audit Committee Financial Expert 160Item 16B. Code of Ethics 160Item 16C. Principal Accountant Fees and Services 161Item 16D. Exemptions from Listing Requirements for Audit Committees 162Item 16E. Purchases of Equity Securities by the Issuer and Affiliated Purchasers 162Item 16F. Change in Registrant's Certifying Accountants 162Item 16G. Corporate Governance 162
PART III 163Item 17. Financial Statements 163Item 18. Financial Statements 163Item 19. Exhibits 163
3

Table of Contents
GLOSSARY
Acciona Acciona, S.A. Spanish construction holding company. Together with Enel,Acciona held a controlling interest in Endesa Spain until June 25,2009.
AFP Administradora de Fondos de Pensiones A legal entity that manages a Chilean pension fund.
Ampla Ampla Energia e Serviços S.A. Brazilian distribution company operating in Rio de Janeiro,owned by Endesa Brasil, a subsidiary of Enersis.
ANEEL Agéncia Nacional de Energia Elétrica Brazilian governmental agency for electric energy.
Betania Central Hidroeléctrica de Betania S.A. E.S.P. A former Endesa Chile’s Colombian subsidiary which mergedwith Emgesa, another Endesa Chile subsidiary, in 2007.
Cachoeira Dourada Centrais Elétricas Cachoeira Dourada S.A. Brazilian generation company owned by Endesa Brasil, asubsidiary of Enersis.
CAM Compañía Americana de Multiservicios Ltda. A former Enersis’ subsidiary engaged in the electrical partsprocurement business.
CAMMESA Compañía Administradora del Mercado MayoristaEléctrico S.A.
Argentine autonomous entity in charge of the operation of theMercado Eléctrico Mayorista (Wholesale Electricity Market), orMEM. CAMMESA’s stockholders are generation, transmissionand distribution companies, large users and the Secretariat ofEnergy.
CDEC Centro de Despacho Económico de Carga Autonomous entity in two Chilean electric systems in charge ofcoordinating the efficient operation and dispatch of generationunits to satisfy demand.
Celta Compañía Eléctrica Tarapacá S.A. Endesa Chile’s subsidiary that operates in the SING with thermalplants.
Cemsa Endesa Cemsa S.A. Energy trading company with operations in Argentina, asubsidiary of Endesa Chile.
Chilectra Chilectra S.A. Chilean electricity distribution company operating in the Santiagometropolitan area, a subsidiary of Enersis.
CIEN Companhia de Interconexão Energética S.A. Brazilian transmission company, wholly−owned byEndesa Brasil, a subsidiary of Enersis.
CNE Comisión Nacional de Energía Chilean National Energy Commission, governmental entity withresponsibilities under the Chilean regulatory framework.
Codensa Codensa S.A. E.S.P. Colombian distribution company that operates mainly in Bogotá,and is a subsidiary of Enersis.
Coelce Companhia Energética do Ceará S.A. Brazilian distribution company operating in the state of Ceará.Coelce is controlled by Endesa Brasil, a subsidiary of Enersis.
4

Table of Contents
COES Comité de Operación Económica del Sistema Peruvian entity in charge of coordinating the efficient operationand dispatch of generation units to satisfy demand.
CREG Comisión de Regulación de Energía y Gas Colombian Commission for the Regulation of Energy and Gas.
CTM Compañía de Transmisión del Mercosur S.A. Endesa Brasil’s subsidiary transmission company with operationsin Argentina.
DECSA Distribuidora Eléctrica de Cundinamarca S.A. Colombian distribution company, subsidiary of Codensa.
Edegel Edegel S.A.A. Peruvian generation company, subsidiary of Endesa Chile.
Edelnor Empresa de Distribución Eléctrica de Lima NorteS.A.A.
Peruvian distribution company with a concession area in thenorthern part of Lima, and a subsidiary of Enersis.
Edesur Empresa Distribuidora Sur S.A. Argentine distribution company with concession area in the southof the Buenos Aires greater metropolitan area, and a subsidiary ofEnersis.
EEB Empresa de Energía de Bogotá S.A. Colombian stated−owned financial and energy holding company,with investments in the electricity generation, transmission,trading and distribution sectors; and in the natural gastransmission, distribution and trading sectors.
EEC Empresa de Energía de Cundinamarca S.A. Colombian electricity distribution company, subsidiary ofDECSA.
El Chocón Hidroeléctrica El Chocón S.A. Endesa Chile’s Argentine generation subsidiary with twohydroelectric plants, El Chocón and Arroyito, both located in theLimay River, Argentina.
Elesur Elesur S.A. A former Chilean subsidiary of Enersis that absorbed Chilectra,and later changed its name to Chilectra.
Emgesa Emgesa S.A. E.S.P. Colombian generation company controlled by Endesa Chile.
Endesa Brasil Endesa Brasil S.A. Brazilian holding company, a subsidiary of Enersis.
Endesa Chile Empresa Nacional de Electricidad S.A. Our generation subsidiary with consolidated operations in fourcountries in South America.
Endesa Costanera Endesa Costanera S.A. Argentine generation company controlled by Endesa Chile.
Endesa Eco Endesa Eco S.A. Chilean electricity company, owner of Central Eólica Canela S.A.and Ojos de Agua mini hydro plant. Endesa Eco is anEndesa Chile subsidiary.
Endesa Fortaleza Central Geradora Termelétrica Fortaleza S.A. Operates a combined cycle generating plant, located in the state ofCeará. Endesa Fortaleza is wholly−owned by our subsidiaryEndesa Brasil.
Endesa Latinoamérica Endesa Latinoamérica, S.A.U. A subsidiary of Endesa Spain and our direct controller, formerlyknown as Endesa Internacional, S.A.U.
5

Table of Contents
Endesa Spain Endesa, S.A. A Spanish electricity generation and distribution company with a60.6% beneficial interest in Enersis.
Enel Enel S.p.A. Italian power company, with a 92.1% controlling ownership ofEndesa Spain.
Enersis Enersis S.A. Our company, a publicly held limited liability stock companyincorporated under the laws of the Republic of Chile, withsubsidiaries engaged primarily in the generation, transmission anddistribution of electricity in Chile, Argentina, Brazil, Colombiaand Peru. Registrant of this Report.
ENRE Ente Nacional Regulador de la Electricidad Argentine national regulatory authority for the energy sector.
ESM Extraordinary Shareholders Meeting Extraordinary Shareholders Meeting
Etevensa Empresa de Generación Termoeléctrica VentanillaS.A.
Peruvian generation company that merged with Edegel in 2006.
FONINVEMEM Fondo para Inversiones Necesarias que permitanIncrementar la Oferta de Energía Eléctrica en elMercado Eléctrico Mayorista
Argentine fund created to increase electricity supply in the MEM.
GasAtacama GasAtacama S.A. Company involved in gas transportation and electricity generationin northern Chile that is 50% owned by Endesa Chile.
Gener AES Gener S.A. Chilean generation company that competes with the Company inChile, Argentina and Colombia.
GNLQ GNL Quintero S.A. Company created to develop, build, finance, own and operate aLNG regasification facility at Quintero Bay (Chile) in which LNGis unloaded, stored and regasified.
IDR Issuer Default Rating Reflects the relative vulnerability of an entity to default on itsfinancial obligations.
IFRS International Financial Reporting Standards Accounting standards adopted by the Company on January 1,2009.
IMV Inmobiliaria Manso de Velasco Ltda. Enersis’ wholly−owned subsidiary engaged in the real estatebusiness.
LNG Liquefied Natural Gas. Liquefied natural gas.
MEM Mercado Eléctrico Mayorista Wholesale Electricity Market in Argentina.
MME Ministério de Minas e Energia Brazilian Ministry of Mines and Energy.
NCRE Non Conventional Renewable Energy Energy sources which are continuously replenished by naturalprocesses, such as wind, biomass, mini−hydro, geothermal, waveor tidal energy.
NIS Sistema Interconectado Nacional National interconnected electric system. There are such systemsin Chile, Argentina, Brazil and Colombia.
6

Table of Contents
ONS Operador Nacional do Sistema Elétrico Electric System National Operator. Brazilian non−profit privateentity responsible for the planning and coordination of operationsin interconnected systems.
Osinergmin Organismo Supervisor de la Inversión en Energía yMinería
Energy and Mining Investment Supervisor Authority, thePeruvian regulatory electricity authority.
OSM Ordinary Shareholders Meeting Ordinary Shareholders Meeting
Pangue Empresa Eléctrica Pangue S.A. Chilean electricity company, owner of the Pangue power station.Pangue is an Endesa Chile subsidiary.
Pehuenche Empresa Eléctrica Pehuenche S.A. Chilean electricity company, owner of three power stations in theMaule River basin. Pehuenche is an Endesa Chile subsidiary.
San Isidro Compañía Eléctrica San Isidro S.A. Chilean electricity company, owner of a thermal power station. San Isidro is wholly−owned by Endesa Chile.
SEF Superintendencia de Electricidad y Combustible Chilean Superintendency of Electricity and Fuels, a Governmentalentity in charge of supervising the Chilean electricity industry.
SEIN Sistema Eléctrico Interconectado Nacional Peruvian interconnected electric system.
SIC Sistema Interconectado Central Chilean central interconnected electric system covering all ofChile except the north and the extreme south.
SING Sistema Interconectado del Norte Grande Electric interconnected system operating in northern Chile.
SVS Superintendencia de Valores y Seguros Chilean authority in charge of supervising public companies,securities and the insurance business.
TESA Transportadora del Energía de Mercosur S.A. Endesa Brasil’s transmission company subsidiary with operationsin Argentina.
UF Unidad de Fomento Chilean inflation−indexed, peso−denominated monetary unit.
UTA Unidad Tributaria Anual Chilean annual tax unit. One UTA equals 12 UTM.
UTM Unidad Tributaria Mensual Chilean inflation−indexed monthly tax unit used to define fines,among other purposes.
VAD Valor Agregado de Distribución Value added from distribution of electricity.
VNR Valor Nuevo de Reemplazo The net replacement value of electricity assets.
7

Table of Contents
INTRODUCTION
As used in this Report on Form 20−F, first person personal pronouns such as “we,” “us” or “our” refer to Enersis S.A. (Enersis or the Company)and our consolidated subsidiaries unless the context indicates otherwise. Unless otherwise noted, our interest in our principal subsidiaries, jointly—controlled entities and associates is expressed in terms of our economic interest as of December 31, 2011.
We are a Chilean company engaged through our subsidiaries and jointly−controlled entities in the electricity generation, transmission and distributionbusinesses in Chile, Argentina, Brazil, Colombia and Peru. As of the date of this Report, we own 60.0% of Empresa Nacional de Electricidad S.A.(Endesa Chile, a Chilean electricity generation company) and 99.1% of Chilectra S.A. (Chilectra, a Chilean electricity distribution company). As of thesame date, Endesa, S.A. (Endesa Spain), a Spanish electricity generation and distribution company, owns 60.6% of Enersis. Enel S.p.A. (Enel), an Italiangeneration and distribution company, owns 92.1% of Endesa Spain through a wholly−owned subsidiary.
Financial Information
In this Report on Form 20−F, unless otherwise specified, references to “dollars” or “$,” are to dollars of the United States of America; references to“pesos” or “Ch$” are to Chilean pesos, the legal currency of Chile; references to “Ar$” or “Argentine pesos” are to the legal currency of Argentina;references to “R$” or “reais” are to Brazilian reals, the legal currency of Brazil; references to “soles” are to Peruvian Nuevo Sol, the legal currency of Peru;references to “CPs” or “Colombian pesos” are to the legal currency of Colombia; references to “€” or “Euros” are to the legal currency of the EuropeanUnion; and references to “UF” are to Unidades de Fomento.
The Unidad de Fomento is a Chilean inflation−indexed, peso−denominated monetary unit. The UF rate is set daily in advance based on changes in theprevious month’s inflation rate. As of December 31, 2011, UF 1 was equivalent to Ch$ 22,294.03. The dollar equivalent of UF 1 was $ 42.94 as ofDecember 31, 2011, using the Observed Exchange Rate reported by the Banco Central de Chile (the “Chilean Central Bank,” or the “Central Bank”) as ofDecember 31, 2011 of Ch$ 519.20 per $ 1.00. As of March 31, 2012, UF 1 was equivalent to Ch$ 22,533.51. The dollar equivalent of UF 1 was $ 46.01 atMarch 31, 2012, using the observed Exchange Rate reported by the Central Bank as of such date of Ch$ 489.76 per $ 1.00.
Our Consolidated Financial Statements and, unless otherwise indicated, other financial information concerning Enersis included in this Report arepresented in pesos. Until the year ended December 31, 2008, Enersis prepared its financial statements in accordance with generally accepted accountingprinciples in Chile (Chilean GAAP). Since January 1, 2009, Enersis has prepared its financial statements in accordance with International FinancialReporting Standards (IFRS), as issued by the International Accounting Standard Board (IASB).
The subsidiaries are consolidated and all their assets, liabilities, income, expenses and cash flows are included in the consolidated financial statementsafter making the adjustments and eliminations related to intra−Group transactions.
Jointly−controlled entities, which are those that do not have a controlling shareholder but are governed by a joint management agreement, areconsolidated by the proportional consolidation method. Enersis recognizes, line by line, its share of the assets, liabilities, income, expenses and cash flow ofsuch entities, subject to accounting eliminations.
Investments in associates in which the Company has significant influence, are recorded in our Consolidated Financial Statements under the equitymethod.
For detailed information regarding subsidiaries, jointly−controlled entities and associates, see Appendix No. 1 and No. 3 to the Consolidated FinancialStatements.
For the convenience of the reader, this Report contains translations of certain peso amounts into dollars at specified rates. Unless otherwise indicated,the dollar equivalent for information in pesos is based on the Observed Exchange Rate as of December 31, 2011, as defined in “Item 3. Key Information —A. Selected Financial Data — Exchange Rates” The Federal Reserve Bank of New York does not report a noon buying rate for pesos. No representation ismade that the peso or dollar amounts shown in this Report could have been or could be converted into dollars or pesos, as the case may be, at such rate or atany other rate (See “Item 3. Key Information — A. Selected Financial Data — Exchange Rates”).
8

Table of Contents
Technical Terms
References to “GW” and “GWh” are to gigawatts and gigawatt hours, respectively; references to “MW” and “MWh” are to megawatts and megawatthours, respectively; references to “kW” and “kWh” are to kilowatts and kilowatt hours, respectively; references to “kV” are to kilovolts, and references to“MVA” are to megavolt amperes. Unless otherwise indicated, statistics provided in this Report with respect to the installed capacity of electricitygeneration facilities are expressed in MW. One TW = 1,000 GW, one GW = 1,000 MW, and one MW = 1,000 kW.
Statistics relating to aggregate annual electricity production are expressed in GWh and based on a year of 8,760 hours, except for leap years (such as2008), which are based on 8,784 hours. Statistics relating to installed capacity and production of the electricity industry do not include electricity ofself−generators. Statistics relating to our production do not include electricity consumed by us by our own generation units.
Energy losses experienced by generation companies during transmission are calculated by subtracting the number of GWh of energy sold from thenumber of GWh of energy generated (excluding its own energy consumption and losses on the part of the power plant), within a given period. Losses areexpressed as a percentage of total energy generated.
Energy losses during distribution are calculated as the difference between total energy purchased (GWh of physical demand, including own generation)and the energy sold (also measured in GWh), within a given period. Losses are expressed as a percentage of total energy purchased. Losses in distributionarise from illegally tapped energy as well as technical losses.
Calculation of Economic Interest
References are made in this Report to the “economic interest” of Enersis in its related companies. In circumstances where we do not directly own aninterest in a related company, our economic interest in such ultimate related company is calculated by multiplying the percentage of economic interest in adirectly held related company by the percentage of economic interest of any entity in the ownership chain of such related company. For example, if we own60% of a directly held subsidiary and that subsidiary owns 40% of an associate, our economic interest in such associate would be 60% times 40%, or 24%.
Forward−Looking Statements
This Report contains statements that are or may constitute forward−looking statements within the meaning of Section 27A of the Securities Act of1933, as amended, and Section 21E of the Securities Exchange Act of 1934, as amended. These statements appear throughout this Report and includestatements regarding our intent, belief or current expectations, including but not limited to any statements concerning:
• our capital investment program;
• trends affecting our financial condition or results from operations;
• our dividend policy;
• the future impact of competition and regulation;
• political and economic conditions in the countries in which we or our related companies operate or may operate in the future;
• any statements preceded by, followed by or that include the words “believes,” “expects,” “predicts,” “anticipates,” “intends,” “estimates,” “should,”“may” or similar expressions; and
• other statements contained or incorporated by reference in this Report regarding matters that are not historical facts.
Because such statements are subject to risks and uncertainties, actual results may differ materially from those expressed or implied by suchforward−looking statements. Factors that could cause actual results to differ materially include, but are not limited to:
• changes in the regulatory framework of the electricity industry in one or more of the countries in which we operate;
• our ability to implement proposed capital expenditures, including our ability to arrange financing where required;
9

Table of Contents
• the nature and extent of future competition in our principal markets;
• political, economic and demographic developments in the emerging market countries of South America where we conduct our business; and
• the factors discussed below under “Risk Factors.”
You should not place undue reliance on such statements, which speak only as of the date that they were made. Our independent public accountantshave not examined or compiled the forward−looking statements, and, accordingly, do not provide any assurance with respect to such statements. Youshould consider these cautionary statements together with any written or oral forward−looking statements that we may issue in the future. We do notundertake any obligation to release publicly any revisions to forward−looking statements contained in this Report to reflect later events or circumstances orto reflect the occurrence of unanticipated events.
For all these forward−looking statements, we claim the protection of the safe harbor for forward−looking statements contained in the Private SecuritiesLitigation Reform Act of 1995.
PART I
Item 1. Identity of Directors, Senior Management and Advisers
Not applicable.
Item 2. Offer Statistics and Expected Timetable
Not applicable.
Item 3. Key Information
A. Selected Financial Data
The following summary of consolidated financial data should be read in conjunction with our audited Consolidated Financial Statements, included inthis Report. Our audited Consolidated Financial Statements as of and for the years ended December 31, 2011, 2010 and 2009 are prepared in accordancewith International Financial Reporting Standards (IFRS), as issued by the IASB. The financial data as of and for each of the four years ended December 31,2011 in the table below are presented in pesos.
Amounts are expressed in millions except for ratios, operating data, shares and ADS (American Depositary Shares) data. For the convenience of thereader, all data presented in dollars in the following summary, as of and for the year ended December 31, 2011, are translated at the Observed ExchangeRate for that date of Ch$ 519.20 per $ 1.00. No representation is made that the peso or dollar amounts shown in this Report could have been or could beconverted into dollars or pesos, at such rate or at any other rate. For more information concerning historical exchange rates, see “Exchange Rates” below.
10

Table of Contents
The following tables set forth the selected consolidated financial data of Enersis in accordance with IFRS for the periods indicated and the operatingdata of subsidiaries:
As of and for the year ended December 31,2008 2009 2010 2011 2011 (1)
Ch$ Million Million of $Consolidated Income Statement Data
Revenues 6,579,945 6,472,056 6,563,581 6,534,880 12,586Operating Expense (2) (4,716,294) (4,544,611) (4,859,280) (4,968,569) (9,570)
Operating Income 1,863,651 1,927,445 1,704,301 1,566,311 3,016Financial Income (Expense), Net (419,366) (309,256) (270,605) (236,585) (456)Total gain (loss) on sale of non−current assets not held for
sale 2,503 50,502 11,711 (5,853) (11)Other non−operating income 3,297 2,374 1,288 9,504 18
Net Income Before Tax 1,450,085 1,671,065 1,446,695 1,333,377 2,567Income tax (415,903) (359,737) (346,007) (460,837) (888)
Net Income 1,034,182 1,311,328 1,100,688 872,540 1,679Net income attributable to: Owners of parent 507,590 660,231 486,227 375,471 723
Net income attributable to: Non−controlling interests 526,592 651,097 614,461 497,069 957
Net Income (loss) from continuing operations per Share(Ch$ / $) 15.55 20.22 14.89 11.50 0.0222
Net Income (loss) from continuing operations per ADS(Ch$ / $) 777.29 1,011.04 744.58 574.97 1.1074
Net income (loss) per Share (Ch$/$ per share) 15.55 20.22 14.89 11.50 0.0222Net income (loss) per ADS (Ch$/$ per ADS) 777.29 1,011.04 744.58 574.97 1.1074Cash Dividends per Share (Ch$/$ per share) 4.95 7.02 4.64 7.45 0.0143Cash Dividends per ADS (Ch$/$ per ADS) 247.50 351.00 232.00 372.50 0.7174Capital Stock 2,824,883 2,824,883 2,824,883 2,824,883 5,441Number of shares of common stock (thousands) 32,651,166 32,651,166 32,651,166 32,651,166 32,651,166Number of ADS (thousands) 71,267 81,303 82,320 82,456 82,456
Consolidated Balance Sheet DataTotal Assets 13,781,176 13,210,140 13,005,845 13,733,871 26,452Non−Current Liabilities 5,049,265 4,637,749 4,084,540 4,377,183 8,431Equity Attributable to Owners of parent 3,091,315 3,518,480 3,735,545 3,895,729 7,503Equity Attributable to Non−controlling interests 2,937,816 2,858,524 2,778,483 3,000,425 5,779Capital Stock (3) 2,983,642 2,983,642 2,983,642 2,983,642 5,747
Other Consolidated Financial DataCapital Expenditures (Capex)(4) 781,542 736,474 701,341 686,006 1,321Depreciation, amortization and impairment losses 438,064 539,655 557,391 561,057 1,081
(1) Solely for the convenience of the reader, peso amounts have been translated into dollars at the exchange rate of Ch$ 519.20 per dollar, the ObservedExchange Rate as of December 31, 2011.(2) Operating Expense include Selling and Administration Expense.
(3) Includes share premium.(4) Capex figures represent actual payments for each year. These figures do not coincide with those presented in “Item 4A.— Investments, Capital
Expenditures and Divestitures,” where accrued investments for each year are presented.
11

Table of Contents
As of and for the year ended December 31,2007 2008 2009 2010 2011
OPERATING DATA OF SUBSIDIARIES
Chilectra (Chile)Electricity Sold (GWh) 12,923 12,535 12,585 13,098 13,697Number of Customers (thousands) 1,483 1,534 1,579 1,610 1,638Total Energy Losses (%)(1) 5.9% 5.9% 6.1% 5.8% 5.5%
Edesur (Argentina)Electricity Sold (GWh) 15,833 16,160 16,026 16,759 17,233Number of Customers (thousands) 2,228 2,262 2,305 2,353 2,389Total Energy Losses (%)(1) 10.7% 10.6% 10.5% 10.5% 10.5%
Ampla (Brazil)Electricity Sold (GWh) 8,985 9,119 9,394 9,927 10,223Number of Customers (thousands) 2,379 2,466 2,522 2,571 2,643Total Energy Losses (%)(1) 21.4% 20.2% 21.2% 20.5% 19.7%
Coelce (Brazil)Electricity Sold (GWh) 7,227 7,571 7,860 8,850 8,970Number of Customers (thousands) 2,689 2,842 2,965 3,095 3,224Total Energy Losses (%)(1) 12.5% 11.7% 11.6% 12.1% 11.9%
Codensa (Colombia)(2)Electricity Sold (GWh) 11,441 11,822 11,837 12,141 12,552Number of Customers (thousands) 2,209 2,285 2,361 2,429 2,495Total Energy Losses (%)(1) 8.7% 8.1% 8.2% 8.2% 7.8%
EEC (Colombia) (3)Electricity Sold (GWh) n.a. n.a. 277 373 305Number of Customers (thousands) n.a. n.a. 115 117 121Total Energy Losses (%)(1) n.a. n.a. 15.2% 17.7% 20.2%
Edelnor (Peru)Electricity Sold (GWh) 5,201 5,599 5,716 6,126 6,572Number of Customers (thousands) 986 1,028 1,061 1,098 1,144Total Energy Losses (%)(1) 8.1% 8.2% 8.1% 8.3% 8.2%
Endesa ChileInstalled capacity in Chile (MW) 4,779 5,283 5,650 5,611 5,611Installed capacity in Argentina (MW) 3,644 3,652 3,652 3,652 3,652Installed capacity in Colombia (MW) 2,829 2,895 2,895 2,914 2,914Installed capacity in Peru (MW) 1,468 1,467 1,667 1,668 1,668Production in Chile (GWh)(4) 18,773 21,267 22,239 20,914 20,722Production in Argentina (GWh)(4) 12,117 10,480 11,955 10,940 10,801Production in Colombia (GWh)(4) 11,942 12,905 12,674 11,283 12,090Production in Peru (GWh)(4) 7,654 8,102 8,163 8,466 9,153
Endesa BrasilInstalled capacity in Brazil (MW) 987 987 987 987 987Production in Brazil (GWh)(4) 3,954 3,379 3,319 5,095 4,155
(1) Energy losses are calculated as the difference between total energy purchased (GWh of physical demand, including own generation) and the energy sold(GWh), within a given period. Losses are expressed as a percentage of total energy purchased. Losses in distribution arise from illegally tapped energy aswell as technical failures.
(2) In February 2009, Codensa, our Colombian distribution subsidiary, acquired approximately 49% of DECSA. On March 13, 2009, DECSA acquired82.3% of EEC. Beginning in 2010, we started separately presenting the information concerning EEC, a jointly−controlled company of Codensa.
(3) The results for 2009 include the period of April through December.(4) Energy production is defined as total generation minus energy consumption and technical losses within our own power plants.
Exchange Rates
Fluctuations in the exchange rate between the peso and the dollar will affect the dollar equivalent of the peso price of our shares of common stock,without par value (the Shares or the Common Stock), on the Bolsa de Comercio de Santiago (the Santiago Stock Exchange), the Bolsa Electrónica de Chile(the Chilean Electronic Exchange) and the Bolsa de Corredores de Valparaíso (the Valparaíso Stock Exchange) (collectively, the Chilean Exchanges). These exchange rate fluctuations will likely affect the price of the Company’s ADS and the conversion of cash dividends relating to the Shares representedby ADS from pesos to dollars. In addition, to the extent that significant financial liabilities of the Company are denominated in foreign currencies,exchange rate fluctuations may have a significant impact on earnings.
The Ley Orgánica del Banco Central de Chile 18,840 (the Central Bank Act), provides that the Central Bank may require that certain purchases andsales of foreign currency be carried out in the Mercado Cambiario Formal (the Formal Exchange Market), a market comprised of banks and other entitiesexplicitly authorized by the Central Bank. Purchases and sales of foreign currency,
12

Table of Contents
which can take place outside the Formal Exchange Market, can be carried out in the Mercado Cambiario Informal (the Informal Exchange Market), whichis a recognized currency market in Chile. Free market forces drive both the Formal and Informal Exchange Markets. Foreign currency for payments anddistributions with respect to the ADS may be purchased in either the Formal or the Informal Exchange Market, but such payments and distributions must beremitted through the Formal Exchange Market. The Central Bank publishes the dólar observado (the Observed Exchange Rate) daily, and it is computed bytaking the weighted average of the previous business day’s transactions in the Formal Exchange Market.
Unless otherwise indicated in this Report, amounts translated to dollars have been calculated based on the exchange rates prevailing as ofDecember 31, 2011.
The following table sets forth, for the periods and dates indicated, certain information concerning the Observed Exchange Rate reported by the CentralBank.
Observed Exchange Rate(Ch$ per $)
Year Low High Average(1)Period−
end2007 493.14 548.67 521.06 496.892008 431.22 676.75 530.48 636.452009 491.09 643.87 554.22 507.102010 468.01 549.17 510.38 468.012011 455.91 533.74 483.45 519.20
Monthly Observed Exchange Rate(1)(Ch$ per $)
Last six months Low High Average (1)Period−
end2011October 490.29 533.74 — 490.29November 494.08 526.83 — 517.37December 508.67 522.62 — 519.202012January 485.35 518.20 — 488.75February 475.29 487.73 — 476.27March 480.62 491.57 — 487.44
Source: Chilean Central Bank.(1) The average of the exchange rates on the last day of each month during the yearly period. This is not applicable to monthly data.
Calculation of the appreciation or devaluation of the Chilean peso against the U.S. dollar in any given period is made by determining the percentchange between the reciprocals of the Chilean peso equivalent of $1.00 at the end of the preceding period and the end of the period for which the calculationis being made. For example, to calculate the devaluation of the year−end Chilean peso in 2011, one determines the percent change between the reciprocalof Ch$ 468.01 (the value of one dollar as of December 31, 2010) and the reciprocal of Ch$ 519.20 (the value of one dollar as of December 31, 2011). Inthis example, the percentage change between 0.002137 (the reciprocal of468.01) and 0.001926 (the reciprocal of519.20) is (9.9)%, which represents the2011 year−end devaluation of the Chilean peso against the 2010 year−end dollar. A positive percentage change means that the Chilean peso appreciatedagainst the dollar, while a negative percentage change means that the peso devaluated against the dollar.
The following table sets forth the period−end rates for U.S. dollars for the years ended December 31, 2007 through December 31, 2011 and through thedate indicated in the table below, based on information published by the Chilean Central Bank.
13

Table of Contents
Period
EndAppreciation
(Devaluation) (1)
Chilean Peso Equivalent of $ 1Year Ended:December 31, 2007 496.89 7.1%December 31, 2008 636.45 (21.9)%December 31, 2009 507.10 25.5%December 31, 2010 468.01 8.4%December 31, 2011 519.20 (9.9)%
Source: Chilean Central Bank.(1) Calculated based on the variation of period−end exchange rates.
B. Capitalization and Indebtedness.
Not applicable.
C. Reasons for the Offer and Use of Proceeds.
Not applicable.
D. Risk Factors.
A financial crisis in any region worldwide can have a significant impact in the countries in which we operate, and consequently, may adversely affectour operations, as well as our liquidity.
The five countries in which we operate are vulnerable to external shocks, which could cause significant economic difficulties and affect their growth.In case any of these economies experience a lower economic growth or a recession, it is likely that our customers will demand less electricity, which couldaffect our results of operations and financial condition adversely. Furthermore, some of our customers may experience difficulties in paying their electricitybills, and an increase in uncollectible accounts would also affect our results adversely.
In addition, a financial crisis and its disruptive effect on the financial industry can have an adverse impact on our ability to obtain new bank loansunder normal terms and conditions. Our ability to tap the capital markets in the five countries where we operate, as well as the international capital marketsfor other sources of liquidity, may also be diminished, or such financing may be available only at higher interest levels. Reduced liquidity could, in turn,affect our capital expenditures, our long−term investments and acquisitions, our growth prospects, and our dividend payout policy.
A financial crisis in the European Community or a European sovereign debt crisis may have an adverse effect on our liquidity.
At the time of filing this Report, the crisis in the euro zone is threatening a recession in Europe and defaults by certain governments. There is also arisk of a run on deposits of banks short of cash, a significant increase in the yields of European governments’ bonds, a corporate credit crunch, tighter fiscalpolicies, and a significant decrease in investor confidence in the euro zone. Among the countries that are particularly at risk are Spain and Italy, home ofour parent companies, Endesa Spain and Enel, respectively.
We carry out a significant portion of our bank financings and derivative hedges with European banks. Our European counterparty risk takes intoaccount loans and derivatives accounted for either in the parent bank entities headquartered in Europe or in any of their subsidiaries or agencies outsideEurope. In general terms, European banks who act through their foreign subsidiaries, agencies and representative offices also take an aggregated group riskto counterparty exposure, both theirs and ours. If any of the European banks with which we have significant relationships were to encounter severefinancial difficulties, our access to bank loans would be significantly curtailed, and would probably lead to an increase in our interest expense.
As of December 31, 2011, $ 560 million of our outstanding bank debt and $ 1,550 million of the notional amount of our derivative hedges are withbank groups whose parent companies are headquartered in Europe. The derivative hedges deal with both currency swaps and interest rates swaps, thoughthe most significant component is the currency hedge for the inflation−indexed Chilean peso (the UF) against the dollar. As of December 31, 2011, thesederivative hedges had a mark to market value of $ 358 million against us, but there is always the possibility that the position could be in our favor in thefuture. Of the amounts mentioned here, 97% of our bank debt and 74% of the notional amount of our derivatives have been contracted with Spanish banks. A severe
14

Table of Contents
financial disruption affecting these Spanish banks could therefore have an adverse effect on us, especially regarding our bank lenders. (See “Item 5.Operating and Financial Review and Prospects. — B. Liquidity & Capital Resources” and “Item 11. Quantitative and Qualitative Disclosures about MarketRisk.”)
South American economic fluctuations are likely to affect our results from operations and financial condition, as well as the value of oursecurities.
All of our operations are located in five South American countries. Accordingly, our consolidated revenues are sensitive to the performance of SouthAmerican economies as a whole. If local, regional or worldwide economic trends adversely affect the economy of any of the five countries in which wehave investments or operations, our financial condition and results from operations could be adversely affected. Moreover, we have investments inrelatively risky countries such as Argentina. Generation and distribution of cash from subsidiaries located in Argentina have been lower than expected.
A substantial portion of our operations are located in Chile and Brazil and more than 70% of our operating revenues in 2011 were derived from ouroperations in these countries, making our financial condition and results of operations particularly dependent on the performance of Chile and Brazil. In2011, Chilean GDP increased by 6.2% compared to a 5.2% increase in 2010. The latest estimate from the Chilean Central Bank forecasts growth for 2012in the 3.75%−4.75% range. In 2011, Brazilian GDP increased by 3.8% compared to a 7.5% increase in 2010. The consensus forecast according to theBrazilian Central Bank is a growth of 4.5% in 2012. However, such growth may not be achieved and the growth trend may not be sustainable in the futurein one or both of these countries. Future developments in the Chilean and Brazilian economies may impair our ability to proceed with our strategic plansand adversely impact our financial condition or results of operations.
In addition, the South American financial and securities markets are, to varying degrees, influenced by economic and market conditions in othercountries. Although economic conditions are different in each country, investor reaction to developments in one country may have a significant contagioneffect on the securities of issuers in other countries, including Chile and Brazil. Chilean and Brazilian financial and securities markets may be adverselyaffected by events in other countries and such effects may affect the value of our securities.
Certain South American economies have been characterized by frequent and occasionally drastic intervention by governmental authorities, whichmay adversely affect our business and financial results.
Governmental authorities have changed monetary, credit, tariff, tax and other policies to influence the course of the economies of Argentina, Brazil,Colombia and Peru. To a lesser extent, the Chilean government has also exercised and continues to exercise a substantial influence over many aspects ofthe private sector, which may result in changes to economic or other policies. These governmental actions, intended to control inflation and affect otherpolicies, have often involved wage, price and tariff rate controls as well as other interventionist measures. For example, Argentina froze bank accounts andimposed capital restrictions in 2001, nationalized the private sector pension funds in 2008, used Central Bank reserves of the Argentine Treasury in order topay down indebtedness maturing in 2010, and according to a survey by Torcuato di Tella University, the government has intervened the national statisticsoffice since 2007 in order to underreport inflation. In 2010, Colombia imposed an equity tax to finance the reconstruction to repair damages caused bysevere flooding, which resulted in an accrual booked in January 2011 for tax payable in 2011−2014. For additional information please see “Item 5.Operating and Financial Review and Prospects — A. Operating Results — 2. Enersis’ Results from Operations for the Years ended December 31, 2010 andDecember 31, 2011 — Operating Costs”).
Changes in the policies of these governmental authorities with respect to tariff rates, exchange controls, regulations and taxation could adversely affectour business and financial results, reducing our profitability, as could inflation, devaluation, social instability and other political, economic or diplomaticdevelopments, including the response by governments in the region to these circumstances.
Our electricity business is subject to risks arising from natural disasters, catastrophic accidents and acts of terrorism, which could adversely affectour operations, earnings and cash flow.
Our primary facilities include power plants, transmission and distribution assets, pipelines, LNG terminals and re−gasification plants, storage andchartered LNG tankers. Our facilities may be damaged by earthquakes, flooding, fires, other catastrophic disasters arising from natural or accidental humancauses, as well as acts of terrorism. We could experience severe business disruptions, significant decreases in revenues based on lower demand arising fromcatastrophic events, or significant additional costs to us not otherwise covered by business interruption insurance clauses. There may be an important timelag between a major accident or catastrophic event and the final reimbursement from our insurance policies, which typically carry non−recoverabledeductible amounts, and in any event are subject to caps per event. For further detail, please see “Item 4 D. Property, Plants and Equipment.”
15

Table of Contents
As an example, on February 27, 2010, Chile experienced a major earthquake, with a magnitude of 8.8 on the Richter scale, in the Bío−Bío Region,followed by a tsunami. Our thermal generation plants Bocamina and Bocamina II, which are located near the epicenter, sustained damages as a result of theearthquake.
A material breach of penal law by our senior management or employees may lead to adverse consequences.
In each of the countries where we operate, our senior management or employees could become involved in fraudulent practices such as intentionalmanipulation of financial statements, misappropriation of assets, inappropriate traffic of influence, insider trading, bribery, kickbacks, receipt of gratuities,unauthorized intercompany transactions, deliberate release of misleading information or rumors, and other forms of corruption or breach of penal law. Depending on the materiality of such fraudulent acts, we could be exposed to regulatory fines, litigation, loss of operating licenses or concessions, and eveninsolvency or bankruptcy. For further discussion, please see “Item 6 Directors, Senior Management and Employees — c. Board Practices” and “Item 16.BCode of Ethics.”
We are subject to financing risks, such as those associated with funding our new projects and capital expenditures, risk related to refinancing ourmaturing debt and we are also subject to debt covenant compliance, all of which could adversely affect our liquidity.
As of December 31, 2011, the principal amount of our outstanding debt in financial terms was $ 7,330 million while, for accounting purposes, ittotaled $ 7,581 million. These amounts differ since financial debt, unlike accounting debt, does not include accrued interest.
Our financial debt had the following maturity timetable:
• $ 1,099 million in 2012;• $ 910 million in 2013;• $ 2,755 million in the 2014−2016 period; and• $ 2,566 million thereafter.
Set forth below is a breakdown by country for financial debt maturing in 2012:
• $ 109 million — Chile;• $ 171 million — Argentina;• $ 529 million — Brazil;• $ 174 million — Colombia; and• $ 116 million — Peru.
Some of our debt agreements are subject to financial covenants. They also contain affirmative and negative covenants, events of default or mandatoryprepayments for contractual breaches, including certain changes of control, and for material mergers and divestments, among other provisions. Asignificant portion of our financial indebtedness is subject to cross default provisions, with different definitions, criteria, materiality thresholds, andapplicability as to the subsidiaries that could give rise to such a cross default.
In the event that we or our subsidiaries breach any of these material contractual provisions, our creditors and bond holders may demand immediaterepayment, and a significant portion of our indebtedness could become due and payable.
We may be unable to refinance our indebtedness or obtain such refinancing on terms acceptable to us. In the absence of such refinancing, we could beforced to dispose of assets in order to make up for any shortfall in the payments due on our indebtedness under circumstances that might not be favorable toobtaining the best price for such assets. Furthermore, assets may not be sold quickly enough, or for amounts sufficient to enable us to make such payments.
We may also be unable to raise funds required to finish our projects under development or under construction. Market conditions prevailing at themoment we require these funds or other unforeseen project costs can compromise our ability to finance these projects and expenditures.
As of the date of this Report, Argentina continues to be the country with the highest refinancing risk. As of December 31, 2011, the third−partyfinancial debt of our Argentine subsidiaries amounted to $ 389 million. As a matter of policy for all of our Argentine subsidiaries as long as fundamentalissues concerning the electricity sector remain unresolved, we intend to roll over our outstanding Argentine debt to the extent we are able to do so. If ourcreditors do not continue to accept rolling over debt when it becomes due, and we are unable to refinance such obligations, we may default on suchindebtedness. Our Argentine subsidiary, Endesa Costanera, did not make an installment payment due on March 30, 2012 of $ 17.6 million (which includes$ 4.3 million in interest expense) under the terms of a supplier credit agreement with Mitsubishi Corporation (“MC”) originally entered into in 1996. Theaggregate amount accrued under the supplier credit agreement as of March 30, 2012, including capitalized interest, was $ 141 million. Endesa Costanerahas experienced difficulties in making timely payments under its agreement with MC on a recurring basis since the Argentine crisis of 2002, but has in thepast received waivers expressing the willingness to renegotiate payments. Such missed payments have been carried out on mutually agreed terms. As ofthe date of this Report, Endesa Costanera has not received a waiver for the payment past due. The relevant terms of the supplier credit provide for a180−day grace period for payment. There can be no assurance that Endesa Costanera will receive a waiver or payment extension prior to the expiration ofthe 180−day grace period for payment. (See “Item 4. Information on the Company. B. Business Overview. Electricity Industry Regulatory Framework. Argentina. Regulatory Developments: the industry after the Public Emergency Law” and “Item 5. Operating and Financial Review and Prospects − B. Liquidity and Capital Resources”). For more information on covenants, cross default
16

Table of Contents
and relevant provisions of our credit facilities, see “Item 5. Operating and Financial Review and Prospects — B. Liquidity and Capital Resources.”
Since our generation business depends heavily on hydrological conditions, drought conditions may hurt our profitability.
Approximately 58% of our consolidated installed generation capacity in 2011 was hydroelectric. Accordingly, extreme hydrological conditions mayaffect our business and may have an adverse effect on our results. In the last few years, regional hydrology has been affected by two climactic phenomena— El Niño and La Niña — that influence rainfall regularity and may lead to droughts. The effects of El Niño or La Niña can unevenly affect the hydrologyof the countries where we operate.
During periods of drought, thermal plants, such as ours that use natural gas, fuel oil or coal as a fuel, are dispatched more frequently. Operating costsof thermal plants might be considerably higher than those of hydroelectric plants. Our operating expenses increase during these periods, and depending onour commercial obligations, we may have to buy electricity from the spot market in order to comply with our contractual supply obligations. The cost ofthese electricity purchases may exceed the price at which we sell contracted electricity, thus producing losses from those contracts. For further informationon hydrology please refer to “Item 5. Operating and Financial Review and Prospects — A. Operating Results — 1. Discussion of Main Factors AffectingOperating Results — a. Hydrological Conditions: Generation Business.”
Governmental regulations may adversely affect our business and have already done so in Argentina.
We are subject to extensive regulation of tariffs and other aspects of our business in the five countries in which we operate, and these regulations mayadversely affect our profitability. For example, the Chilean government can impose electricity rationing during drought conditions or prolonged failures inpower facilities. If, during rationing, we are unable to generate enough electricity to comply with our contractual obligations, we may be forced to buyelectricity in the pool market at the spot price, since even a severe drought does not constitute a force majeure event. The spot price may be significantlyhigher than our costs to generate the electricity and can be as high as the “cost of failure” set by the National Energy Commission, or the CNE. This “costof failure,” which is updated semiannually by the CNE, is a measurement of how much final users would pay for one extra MWh under rationingconditions. If we are unable to buy enough electricity in the pool market to comply with all of our contractual obligations, then we would have tocompensate our regulated customers for the electricity we failed to provide at the rationed price. If material rationing policies are imposed by regulatoryauthorities in any of the countries in which we operate, our business, financial condition and results from operations may be affected adversely in a materialway. Rationing periods may occur in the future, and consequently our generation subsidiaries may be required to pay regulatory penalties if suchsubsidiaries fail to provide adequate service under such conditions.
Governmental authorities may also delay the distribution tariff review process, or tariff adjustments determined by governmental authorities may notbe sufficient to pass through our costs (as has been the case with Edesur, our Argentine distribution subsidiary). Similarly, the regulatory framework for theelectricity sector in a jurisdiction may affect the ability of our generation companies (such as Endesa Costanera, our electricity generation company) tocollect revenues sufficient to offset our costs.
The inability of any company in the Enersis Group to collect revenues sufficient to cover operating costs may affect the ability of the affected companyto operate as a going concern and may otherwise have an adverse effect on our business, assets, financial results and operations. For additional informationon Edesur and Endesa Costanera, see “Item 5. Operating and Financial Review and Prospects — A. Operating Results — 2. Enersis’ Results fromOperations for the Years ended December 31, 2010 and December 31, 2011.”
In addition, changes in the regulatory framework, including changes that if adopted would significantly affect our operations, are often submitted tothe legislators and administrative authorities in the countries in which we operate and, if approved, could have a material adverse impact on our business. For instance, in 2005 there was a change in the water rights’ law in Chile that requires us to pay for unused water rights. (See “Item 4. Information on theCompany. — B. Business Overview. — Electricity Industry Regulatory Framework. — Chile — Water Rights).”
Regulatory authorities may impose fines on our subsidiaries.
Our electricity businesses may be subject to regulatory fines for any breach of current regulations, including energy supply failure, in the five countriesin which we operate. In Chile, such fines may range from 1 Unidad Tributaria Mensual (UTM), or $ 75, to 10,000 Unidades Tributarias Anuales (UTA),or $ 9.0 million, in each case using the UTM, UTA and foreign exchange rate as of December 31, 2011. In Peru, fines can reach a maximum of1,300 Unidad Impositiva Tributaria (UIT) or $ 1.7 million as of December 31, 2011; in Colombia fines may range from $ 2,900 to $ 0.6 million; inArgentina, there is no maximum limit for the fines and in Brazil fines may be imposed for up to 2.0% of the concessionaire’s revenues.
17

Table of Contents
Our electricity subsidiaries, supervised by their local regulatory entities, may be subject to these fines in cases where, in the opinion of the regulatoryentity, operational failures that affect the regular energy supply to the system are the fault of the company; for instance, when the agents are not coordinatedwith the system operation. Also, our subsidiaries may be required to pay fines or to compensate customers if those subsidiaries are unable to deliverelectricity to them even if such failure is due to forces outside of our control.
For example, in January 2011, ENRE imposed fines on Edesur in the amount of $ 16.2 million due to a blackout that occurred in Buenos Aires duringthe last days of December 2010, including the compensation to end users with respect to the blackout. In September 2011 SEF imposed fines totaling2,782 UTA, or $ 2.5 million, on Endesa Chile, Pehuenche and Chilectra due to a blackout that occurred in the Metropolitan Region in March 2010. Forfurther information on fines please refer to “Item 4. Information on the Company. — B. Business Overview. — Electricity Industry RegulatoryFramework.”
We depend in part on payments from our subsidiaries, jointly−controlled entities and associates to meet our payment obligations.
We have no significant assets other than the stock of our subsidiaries. Our ability to pay our obligations depends on cash from dividends, loans,interest payments, capital reductions and other distributions from our subsidiaries and equity affiliates. The ability of our subsidiaries and equity affiliatesto pay dividends, interest payments, loans and other distributions to us is subject to legal constraints such as dividend restrictions, fiduciary duties,contractual limitations and foreign exchange controls that may be imposed in any of the five countries where they operate.
Historically, we have been able to access the cash flows of our Chilean subsidiaries, but we have not been similarly able to access at all times the cashflows of our non−Chilean operating subsidiaries due to government regulations, strategic considerations, economic conditions and credit restrictions.
Our future results from operations outside Chile may continue to be subject to greater economic and political uncertainties than what we haveexperienced in Chile, thereby reducing the likelihood that we will be able to rely on cash flows from operations in those entities to repay our debt.
Dividend Limits and Other Legal Restrictions. Some of our non−Chilean subsidiaries are subject to legal reserve requirements and other restrictionson dividend payments. Also, other legal restrictions, such as foreign currency controls, may limit the ability of our non−Chilean subsidiaries and equityaffiliates to pay dividends and make loan payments or other distributions to us. In addition, the ability of any of our subsidiaries which are notwholly−owned to distribute cash to us may be limited by the fiduciary duties of the directors of such subsidiaries to their minority shareholders. Furthermore, some of our subsidiaries may be forced by local authorities, according to applicable regulation, to diminish or eliminate dividend payments,such as restrictions for distributing dividends faced by our Argentine subsidiary, Edesur, since 2009. As a consequence of such restrictions, our subsidiariescould, under certain circumstances, be prevented from distributing cash to us.
Contractual Constraints. Distribution restrictions included in some credit agreements of our subsidiaries Endesa Costanera, El Chocón, CIEN andEndesa Fortaleza may prevent dividend distributions and other distributions to shareholders if they are not in compliance with certain financial ratios. Generally, companies are not allowed to make any kind of distribution in case of default on credit agreements.
Operating Results of Our Subsidiaries. The ability of our subsidiaries and equity affiliates to pay dividends or make loan payments or otherdistributions to us is limited by their operating results. To the extent that the cash requirements at any of our subsidiaries exceed available cash, suchsubsidiary will not be able to make cash available to us. For further discussion see “Item 5. Operating and Financial Review and Prospects — B. Liquidityand Capital Resources” and Note 24.4 of our Consolidated Financial Statements.
Foreign exchange risks may adversely affect our results, and the dollar value of dividends payable to ADS holders.
Most South American currencies in which we and our subsidiaries operate have been subject to large devaluations and appreciations against the dollarand may be subject to significant fluctuations in the future.
Historically, a significant portion of our consolidated indebtedness has been denominated in dollars and, although a substantial portion of our operatingcash flows are linked to dollars, we generally have been and will continue to be materially exposed to fluctuations of our local currencies against the dollarbecause of time lags and other limitations to peg our tariffs to the dollar.
18

Table of Contents
Because of this exposure, the cash generated by our subsidiaries can decrease substantially when local currencies devalue against the dollar. Futurevolatility in the exchange rate of the currencies in which we receive revenues or incur expenditures may affect our financial condition and results fromoperations. For more information on the risks associated with foreign exchange rates, see “Item 11. Quantitative and Qualitative Disclosures About MarketRisk.”
As of December 31, 2011, using financial rather than accounting conventions, the principal amount of Enersis’ total consolidated financial debt was$ 7,330 million (net of currency hedging instruments). Of this amount, $ 2,153 million, or 29.4%, was denominated in dollars and $ 1,422 million in pesos. In addition to the dollar and the peso, our foreign currency denominated consolidated indebtedness included the equivalent of:
• $ 1,682 million in Colombian pesos;• $ 1,450 million in reais;• $ 426 million in soles; and• $ 197 million in Argentine pesos.
This totals an aggregate of $ 3,755 million in currencies other than dollars or pesos. For more information on the risks associated with foreignexchange rates, see “Item 11. Quantitative and Qualitative Disclosures About Market Risk.”
For the twelve−month period ended December 31, 2011, our operating cash flows amounted to $ 6,268 million (before consolidation adjustments) ofwhich:
• $ 1,839 million, or 29.3%, were generated in reais;• $ 1,761 million, or 28.1%, in dollars;• $ 1,325 million, or 21.1%, in Colombian pesos;• $ 620 million, or 9.9%, in Chilean pesos;• $ 439 million, or 7.0%, in Argentine pesos; and• $ 284 million, or 4.5%, in soles.
Although we generate revenues and incur debt in these same currencies, we believe that we are subject to risk in terms of our foreign exchangeexposure to these four currencies. The most material case is that of our Argentine generation companies, where most of our debt is denominated in dollarswhile our revenues are mostly in Argentine pesos. For further discussion please see “Item 5 Operating and Financial Review and Prospects — A. OperatingResults — Local Currency Exchange Rate.”
Furthermore, trading of our common stock underlying ADS is conducted in pesos. Our depositary bank will receive cash distributions that we makewith respect to the shares underlying the ADS in pesos. The depositary bank will convert such pesos to dollars at the then−prevailing exchange rate to makedividend and other distribution payments in respect of ADS. If the peso depreciates against the dollar, the value of the ADS and any dollar distributionsADS holders receive from the depositary bank will decrease. For further disclosure please refer to “Item 3. Key Information — A. Selected Financial Data— Exchange Rates.”
We are involved in litigation proceedings.
We are currently involved in various litigation proceedings, which could result in unfavorable decisions or financial penalties against us, and we willcontinue to be subject to future litigation proceedings, which could have material adverse consequences to our business.
Our financial condition or results from operations could be adversely affected if certain material claims are resolved against us. For a discussion ofpending lawsuits against us see Note 22.2 “Lawsuits and arbitration proceedings” of our Consolidated Financial Statements.
The values of our generation subsidiaries’ long−term energy supply contracts are subject to fluctuations in the market prices of certaincommodities.
We have economic exposure to fluctuations in the market prices of certain commodities as a result of the long−term energy sales contracts we haveentered into. We and our subsidiaries have material obligations as selling parties under long−term fixed−price electricity sales contracts. Prices in thesecontracts are indexed according to different commodities, exchange rate, inflation and the market price of electricity. For further discussion, please refer to“Item 5.F. Tabular Disclosures of Contractual Obligations — Contractual Operational Obligations” and “Item 11. Quantitative and Qualitative Disclosuresabout Market Risk — Commodity Price Risk.”
19

Table of Contents
Our controlling shareholders may have conflicts of interest relating to our business.
Enel beneficially owns 92.1% of Endesa Spain, which in turn owns 60.6% of Enersis’ share capital. Our controlling shareholders have the power todetermine the outcome of most material matters that require shareholders’ votes, such as the election of the majority of our board members and, subject tocontractual and legal restrictions, the distribution of dividends. Our controlling shareholders also can exercise influence over our operations and businessstrategy. Their interests may in some cases differ from those of our other shareholders. Enel and Endesa Spain conduct their business in South Americathrough us as well as through entities in which we do not have an equity interest. For further information of our controlling shareholders, please refer to“Item 7. Major Shareholders and Related Party Transactions — A. Major Shareholders.”
Environmental regulations in the countries in which we operate and other factors may cause delays or impede the development of new projects, aswell as increase of our costs of operations and capital expenditures.
Our operating subsidiaries are subject to environmental regulations which, among other things, require us to perform environmental impact studies forfuture projects and obtain permits from both local and national regulators. Approval of these environmental impact studies may take longer than originallyplanned, and also, may be withheld by governmental authorities. Local communities, ethnic and environmental activists, among others, may interveneduring the approval process in order to delay or prevent the project’s development. They may also seek injunctive or other relief, with negative implicationsfor us if they should succeed with their claims. For example, our HidroAysén project in Chile was submitted for approval by the environmental authoritieson February 27, 2009, and received approval more than two years later, on May 9, 2011. Environmental approval for the transmission side of the project isstill pending as of the date of this Report. This project is not feasible without such transmission authorization.
In addition to environmental matters, there are other factors that may adversely affect our ability to build new facilities or to complete projectscurrently under development on time, including delays in obtaining regulatory approvals, shortages or increases in the price of equipment, materials orlabor, strikes, adverse weather conditions, natural disasters, accidents or other unforeseen events.
Delays or modifications to any proposed project and laws or regulations may change or be interpreted in a manner that could adversely affect ouroperations or our plans for companies in which we hold investments. See “Item 4. Information on the Company — B. Business Overview — ElectricityIndustry Regulatory Framework.”
Our power plant projects may encounter significant opposition from groups who may ultimately damage our reputation and could result inimpairment of goodwill.
Our reputation is the foundation of our relationship with key stakeholders and other constituencies. If we are unable to effectively manage real orperceived issues, which could negatively impact sentiments toward us, our ability to operate could be impaired and our financial results could suffer.
The development of new power plants may face opposition from several stakeholders, such as ethnic groups, environmental groups, local communitiesand political parties, among others, all of whom may affect the company’s reputation and goodwill. For example, the environmental approval for theconstruction of our Ralco hydro power plant in southern Chile faced significant opposition in 2002 from indigenous inhabitants who lived in areas that hadto be flooded. Currently, our HidroAysén project, whose study is being undertaken jointly together with Colbún, has also encountered substantialopposition by environmental activists. Such groups are sometimes financed internationally, and as such may receive global attention. The operation of ourcurrent thermal power plants may also affect our goodwill, due to emissions such as particulate matter, sulfur dioxide and nitrogen oxides, which couldadversely affect the environment.
Damage to our reputation may exert considerable pressure on regulators, creditors, and other stakeholders, and ultimately lead to projects andoperations which may not be optimal, as well as to lower stock prices, and failure to attract or retain valuable employees, all of which could result in animpairment of goodwill. For more information regarding our projects under development please see “Item 4 D. Property, Plants and Equipment — Projectsunder Development.”
20

Table of Contents
Our business may experience adverse consequences if we are unable to reach satisfactory collective bargaining agreements with our unionizedemployees.
Several of our employees are members of unions and have collective bargaining agreements which expire from time to time, and need to be renewedon a regular basis. Our business, financial condition and results of operations could be adversely affected by a failure to reach agreement with any laborunion representing such employees, or by an agreement with a labor union that contains terms that are not in line with our expectations. For example,Edesur’s operating costs increased by Ch$ 10,563 million during the first half of 2011 due to higher personnel expenses as a result of wage increases undercollective agreements.
Certain employees have highly specialized skills. As a consequence, certain actions by these employees, such as strikes, walk−outs or stoppages,could negatively impact our operating and financial performance, as well as our reputation. For more information of collective bargaining agreements andunionized employees please see “Item 6. Directors, Senior Management and Employees — D. Employees.”
Interruption or failure of our information technology and communications systems and external attacks or invasions of our IT systems could havean adverse effect on our operations and results.
We depend on information and communication systems to operate our businesses, the failure of which could adversely affect our financial conditionand results of operations.
Information technology, communication and processing systems (collectively, “IT”) are all vital to our generation subsidiaries’ ability to monitor ourpower plants’ operations, maintain generation and network performance, adequately generate invoices to customers, achieve operating efficiencies and meetour service targets and standards. Our distribution subsidiaries could also be affected adversely since they rely heavily on IT systems to monitor their grids,billing processes to millions of clients, and customer service platforms, among others. Temporary or long−lasting operational failures of any of these ITsystems could have a material adverse effect on our results of operations.
In the last few years, global cyber attacks on security systems and IT have intensified. We are exposed to cyber−terrorist attacks aimed at damagingour assets through computer networks, cyber−spying involving strategic information that may be beneficial for third parties, and cyber−robbery ofproprietary and confidential information, including information on our clients. In early 2012, a cyber attack was organized by Anonymous Operation GreenRights to protest against our potential future construction of hydroelectric power plants in the Chilean Patagonia. More violent attacks may have an adverseeffect on our operations, results and image.
We rely on electricity transmission facilities that we do not own or control. If these facilities do not provide us with an adequate transmissionservice, we may not be able to deliver the power we sell to our final customers.
We depend on transmission facilities owned and operated by other unaffiliated power companies to deliver the electricity we sell. This dependenceexposes us to several risks. If transmission is disrupted, or transmission capacity is inadequate, we may be unable to sell and deliver our electricity. If aregion’s power transmission infrastructure is inadequate, our recovery of sales costs and profits may be insufficient. If restrictive transmission priceregulation is imposed, transmission companies upon whom we rely may not have sufficient incentives to invest in expansion of their transmissioninfrastructure, which could adversely affect our operations and financial results. On February 27, 2010, due to the 8.8 magnitude earthquake on the Richterscale in Chile, Transelec, a transmission company unrelated to us, experienced damages to its high voltage transmission line which prevented us fromselling and distributing our electricity to final consumers.
On September 24, 2011, nearly 10 million people located in central Chile experienced a blackout (affecting more than half of Chile’s 17 millioninhabitants), due to the failure of Transelec’s 220 kV Ancoa substation, which led to the disruption of two 500 kV transmission lines in the SIC (the ChileanCentral Interconnected System), and the subsequent failure of the remote recovery computer software used by CDEC to operate the grid. This blackout,which lasted two hours, highlighted the fragility of the transmission grid and demonstrated the need to increase investments in network expansion and intechnological improvements that enhance the reliability of the transmission grid.
21

Table of Contents
The relative illiquidity and volatility of Chilean securities markets could adversely affect the price of our common stock and ADS.
Chilean securities markets are substantially smaller and less liquid than the major securities markets in the United States. In addition, Chileansecurities markets may be affected materially by developments in other emerging markets. The low liquidity of the Chilean market may impair the abilityof holders of ADS to sell shares of our common stock withdrawn from the ADS program into the Chilean market in the amount and at the price and timethey wish to do so. As of the date of this Report, average trading of our ADS in the NYSE accounts for a volume substantially higher than the trading of theunderlying stock in Chile. For further discussion please see “Item 9.A. Offer and Listing Details. Market Price and Volume Information”
Lawsuits against us brought outside of the South American countries in which we operate, or complaints against us based on foreign legalconcepts may be unsuccessful.
All of our assets are located outside of the United States. All of our directors and all of our officers reside outside of the United States and most oftheir assets are located outside the United States as well. If any shareholder were to bring a lawsuit against our directors, officers or experts in the UnitedStates, it may be difficult for them to effect service of legal process within the United States upon these persons or to enforce against them, in United Statesor Chilean courts, judgments obtained in United States courts based upon the civil liability provisions of the federal securities laws of the United States. Inaddition, there is doubt as to whether an action could be brought successfully in Chile on the basis of liability based solely upon the civil liability provisionsof the United States federal securities laws.
New share issuances might not have the rights granted by former Chapter XXVI.
The Chilean Central Bank Decision 1333−01−070510 adopted on May 10, 2007 extended the effects of the former Chapter XXVI to capital increasesapproved after April 18, 2001. Under the former Chapter XXVI and the Foreign Investment Contracts, the Chilean Central Bank agreed to grant access tothe formal exchange market to convert pesos into dollars (see “Item 10. Additional Information. D — Exchange Rate Controls” for further detail).
Enersis formally requested permission from the Central Bank to enter into a new Foreign Investment Contract to include its capital increase approvedby Enersis’ shareholders’ meeting held on March 31, 2003, which was granted by the Central Bank on September 7, 2007, subject to the execution anddelivery of a new Foreign Investment Contract, dated September 24, 2008. Nevertheless, the Central Bank’s approval, aimed at extending the effects of theformer Chapter XXVI to the capital increase approved in March 31, 2003, is subject to the condition that Enersis informs the Central Bank with respect tothe measures adopted in connection with the issuance of new shares prior to such future capital increase in order to differentiate new shares from the sharesissued previously under the former Chapter XXVI and enable shareholders to obtain relevant information about such differences. If Enersis does notcomply with this condition, the Central Bank could revoke its approval and the benefits granted to the shares issued in the last capital increase of Enersis bythe former Chapter XXVI. It is not certain that additional Chilean restrictions applicable to the holders of ADRs, the disposition of underlying shares ofcommon stock or the repatriation of the proceeds from such disposition will not be imposed in the future, nor can there be any assessment of the duration orimpact of such restrictions if imposed.
Item 4. Information on the Company
A. History and Development of the Company.
History
Enersis S.A. (Enersis) is a publicly held limited liability stock company organized under the laws of the Republic of Chile. The existence of ourcompany under its current name dates back to August 1, 1988.
Street address: Santa Rosa 76, Santiago, Código Postal 8330099, Chile.Telephone: (562) 353−4639Fax: (562) 378−4789Web Site: www.enersis.cl
The Company’s authorized representative in the United States of America is Puglisi & Associates, whose contact information is:
Street address: 850 Library Avenue, Suite 204, Newark, Delaware 19711Telephone: 1 (302) 738−6680
22

Table of Contents
We are an electric utility company engaged, through our subsidiaries and affiliates, in the generation, transmission and distribution of electricitybusinesses in Chile, Argentina, Brazil, Colombia and Peru.
We are one of the largest publicly listed companies in the electricity sector in South America. We trace our origins to Compañía Chilena deElectricidad Ltda., or CCE, which was formed in 1921 as a result of the merger of Chilean Electric Tramway and Light Co., founded in 1889, andCompañía Nacional de Fuerza Eléctrica, with operations dating back to 1919. In 1970, the Chilean government nationalized CCE. In 1981, CCE’soperations were divided into one generation company, the current AES Gener S.A. (Gener), a currently unrelated company, and two distribution companies,one with a concession in the Valparaíso Region, the current Chilquinta S.A., a currently unrelated company, and the other with a concession in the Santiagometropolitan region, Compañía Chilena Metropolitana de Distribución Eléctrica S.A. From 1982 to 1987, the Chilean electric utility sector went through aprocess of re−privatization. In August 1988, Compañía Chilena Metropolitana de Distribución Eléctrica S.A. changed its name to Enersis S.A. and becamethe new parent company of Distribuidora Chilectra Metropolitana S.A., later renamed Chilectra S.A. In the 1990s, we diversified into electricity generationand transmission through our increasing equity stakes in Endesa Chile.
We began our international operations in 1992 with our investment in Edesur, an Argentine electricity distribution company. That same year, EndesaChile, which at that time was not our subsidiary, also started its international operations with its investment in Endesa Costanera, an electricity generationcompany. We then expanded primarily into electricity generation, transmission and distribution businesses in four South American countries: Argentina,Brazil, Colombia and Peru. We remain focused on the electricity sector, although we have small operations in other businesses that represent less than 1.0%of our consolidated assets, in the aggregate.
In 2005, Endesa Brasil was formed as a company to manage all generation, transmission and distribution assets that Endesa Latinoamérica, S.A.U., or“Endesa Latinoamérica,” (formerly known as Endesa Internacional), a subsidiary of Endesa Spain, Enersis, Endesa Chile and Chilectra held in Brazil;namely, through Ampla, Endesa Fortaleza, CIEN, Cachoeira Dourada and Coelce. Enersis began consolidating Endesa Brasil in October 2005. As ofDecember 31, 2011, Enersis directly and indirectly controlled 54.3% of Endesa Brasil’s share capital.
In order to optimize taxes, simplify the organizational structure and reduce corporate costs, on April 2006, Enersis decided to merge Elesur S.A.(Elesur) and Chilectra in Chile. As a consequence of this merger, Elesur absorbed Chilectra; the surviving company retained the Chilectra name.
In order to achieve synergies in Peru, in 2006, we merged Edegel and Etevensa (60% owned by Endesa Spain), a 457 MW thermoelectric generationcompany.
In September 2007, we merged our generation subsidiaries in Colombia, Emgesa and Betania, resulting in a new company which retained the nameEmgesa. Following the merger, as of December 31, 2011, Enersis indirectly controlled 16.1% of Emgesa’s share capital. Pursuant to the terms of ashareholders’ agreement with Endesa Latinoamérica, we control and therefore consolidate Emgesa through Endesa Chile.
In February 2009, Codensa, our Colombian distribution subsidiary, acquired approximately 49% of DECSA, an investment vehicle, for Ch$ 23.7billion. The remaining 51% was acquired by Empresa de Energía de Bogotá (EEB). Codensa and EEB jointly control DECSA. In March 2009, DECSAacquired 82.3% of Empresa de Energía de Cundinamarca S.A. (EEC), a formerly state−owned company that was privatized that year for Ch$ 48.5 billion. EEC is a Colombian company primarily engaged in trading of electricity in Cundinamarca Department.
In March 2007, Spanish company Acciona, S.A. (Acciona) and Enel S.p.A. (Enel) executed an agreement for the joint management of Spanishcompany, Endesa Spain. The latter, through Endesa Latinoamérica, holds 60.6% of the share capital of Enersis. In February 2009, Acciona and Enelreached an agreement whereby Acciona would transfer directly and indirectly to Enel Energy Europe S.L.U., wholly−owned by Enel, its 25.0%shareholding in Endesa Spain. In June 2009, the transaction was completed, making Enel the ultimate controller of Enersis by virtue of its 92.1%shareholding in Endesa Spain.
Enel is a publicly−traded company headquartered in Italy, primarily engaged in the energy sector, with presence in 40 countries worldwide, and hasover 97,000 MW of net installed capacity. It provides service to more than 61 million clients through its electricity and gas businesses.
In October 2009, Endesa Chile purchased an additional 29.4% of Edegel from Generalima, a Peruvian indirect subsidiary of Endesa Spain. With thistransaction, Endesa Chile increased its economic interest in Edegel from 33.1% to 62.5% and in turn, our economic interest at the Enersis level increased to37.5%. In the same month, we acquired an additional 24.0% of the share capital of our Peruvian subsidiary, Edelnor, increasing our direct and indirectownership stake in Edelnor from 33.5% to 57.5%.
23

Table of Contents
In December, 2010, we agreed to sell our wholly−owned subsidiary Compañía Americana de Multiservicios Limitada (CAM) and its subsidiaries for $20 million, as well as our wholly−owned subsidiary Synapsis Soluciones y Servicios Limitada (Synapsis) and its subsidiaries for $ 52 million.
In October, 2011, Endesa Latinoamérica purchased an additional 7.7% equity stake in the Brazilian distributor Ampla from Energias de Portugal(EDP). After the transaction, Endesa Latinoamérica has 99.6% of Ampla’s voting rights.
As of December 31, 2011, we had 14,833 MW of installed capacity with 195 power units in the five countries in which we operate, 13.7 milliondistribution customers covering approximately 50 million inhabitants, consolidated assets of Ch$ 13,734 billion and operating revenues of Ch$ 6,535 billionfor the year then ended.
Investments, Capital Expenditures and Divestitures
We coordinate the overall financing strategy, including terms and conditions of borrowings by, and intercompany advances to, our subsidiaries tooptimize debt and liquidity management. For the most part, our operating subsidiaries independently plan capital expenditure financed by internallygenerated funds or direct financings. One of our goals is to focus on investments that will provide long−term benefits, such as energy loss reductionprojects. Additionally, by focusing on Enersis as a whole and seeking to provide services across the group of companies, we aim to reduce investments atthe individual subsidiary level in items such as procurement, telecommunication and information systems. Although we have considered how theseinvestments will be financed as part of the Company’s budget process, we have not committed to any particular financing structure, and investments willdepend on the market conditions prevailing at the time the cash flows are needed.
Our investment plan is flexible enough so as to adapt to changing circumstances by giving different priorities to each project in accordance withprofitability and strategic fit. Investment priorities are currently focused on developing the capacity plan in Chile and Colombia, to guarantee adequatelevels of quality of supply and due concern for environmental issues.
For the 2012−2016 period, we expect to make capital expenditures of Ch$ 3,324 billion in our controlled subsidiaries, related to investments currentlyin progress, maintenance of our distribution network and in our other businesses, and maintenance of existing generation plants and in the studies requiredto develop other potential generation projects. For further detail regarding these projects, please see “Item 4 D. Property, Plants and Equipment−Projectsunder Development.”
The table below sets forth the capital expenditures incurred by our subsidiaries in 2009, 2010 and 2011 and the expected capital expenditures for the2012−2016 period:
Capital Expenditure (1)2009 2010 2011 2012−2016
(in million of Ch$)Chile 370,761 157,164 187,749 623,742Abroad 430,553 482,196 535,172 2,700,730Total 801,314 639,360 722,921 3,324,472
(1) Capex figures represent accrued investments for each year, except for future projections. These figures do not match with those presentedin “Item 3A.— Selected Financial Data”, where effective payments for each year are presented.
Capital Expenditures 2009, 2010 and 2011
Our investments in 2011 and 2010 related principally to the 370 MW Bocamina II project in Chile and the 400 MW El Quimbo project in Colombia,both of which are still in progress, as well as to investments to expand distribution service in response to increasing demand for energy, investments toimprove quality of service and safety and investments to prevent energy losses. Our investments in 2009 related principally to the Bocamina II project,Canela II wind farm and Quintero thermal plant projects in Chile; the Santa Rosa plant in Peru; maintenance of existing installed capacity, mainly inArgentina and Peru; and expenditures in the distribution sector to meet demand and reduce energy losses in Chile and abroad.
Investments currently in progress
Our material plans in progress include completion of the Bocamina II project, which is expected during the second half of 2012 to add 370 MW ofcapacity to our Chilean operations in response to increased demand in that market; completion of the El Quimbo project, which is expected byDecember 2014 to add 400 MW of capacity to our Colombian operations in response to increased demand in that market; and continuation of our plans inChile and abroad to expand distribution service and reduce energy losses to
24

Table of Contents
improve efficiency and profitability of our distribution operations. In general terms, projects in progress are expected to be financed with resources to beprovided by external financing as well as internally generated funds for each of the companies described.
B. Business Overview.
We are a publicly held limited liability stock company with consolidated operations in Chile, Argentina, Brazil, Colombia and Peru. Our core businesssegments are electricity generation, transmission, and distribution. We also participate in other activities which are not part of our core business. Sincethese non−core activities represent less than 0.5% of our 2011 operating income, we do not report them as a separate business segment for purposes of thisdiscussion, or under IFRS.
Revenues by Business Segment
Year ended December 31,2009 2010 2011 % Change
(in million of Ch$)Generation and Transmission Business SegmentEndesa Chile and Chilean subsidiaries 1,373,231 1,345,371 1,257,995 (6.5)%Emgesa (Colombia) 500,964 507,516 498,569 (1.8)%Endesa Costanera (Argentina) 231,421 295,231 341,824 15.8%Edegel (Peru) 213,625 211,263 239,842 13.5%Endesa Fortaleza (Brazil) 138,595 150,371 129,485 (13.9)%Cachoeira Dourada (Brazil) 88,300 115,663 126,646 9.5%CIEN (Brazil) 97,961 98,909 59,918 (39.4)%El Chocón (Argentina) 65,298 57,173 48,341 (15.4)%Less: Intercompany Transactions (1,037) (904) (2,594) 186.9%Total 2,708,358 2,780,593 2,700,026 (2.9)%
Distribution Business SegmentAmpla (Brazil) 1,012,342 1,046,387 1,117,269 6.8%Chilectra and subsidiaries (Chile) 1,089,515 1,016,997 1,046,191 2.9%Coelce (Brazil) 767,993 940,654 859,446 (8.6)%Codensa (Colombia) 741,168 785,890 815,487 3.8%Edelnor (Peru) 302,295 307,159 329,309 7.2%Edesur (Argentina) 327,088 295,539 279,725 (5.4)%Total 4,240,401 4,392,626 4,447,427 1.2%
Less: Consolidation Adjustments and OtherBusinesses (476,703) (609,638) (612,573) 0.5%
Total 6,472,056 6,563,581 6,534,880 (0.4)%
For further information related to operating revenues and total income by business segment, see “Item 5. Operating and Financial Review andProspects — A. Operating Results” and note 33.2 to our Consolidated Financial Statements.
Electricity Generation Business Segment
As of December 31, 2011, electricity generation represented 41% of our operating revenues and 63% of our operating income, in both cases beforeconsolidation adjustments.
Our consolidated physical sales for 2011 were 64,840 GWh and our production was 56,921 GWh, 2.2% and 0.4% higher than in 2010, respectively. Our total installed capacity in 2011 and 2010 was 14,832 MW.
Our electricity generation business is conducted primarily through Endesa Chile, which has consolidated operations in Chile, Argentina, Brazil,Colombia and Peru.
25

Table of Contents
The following tables summarize the information relating to Enersis’ electricity generation:
PHYSICAL DATA PER COUNTRY
As of December 31, each year2009 2010 2011
ChileNumber of generating facilities (1)(2) 29 28 28Installed capacity (MW) (3) (2) 5,650 5,611 5,611Energy generated (GWh) (4) 22,239 20,914 20,722Energy sales (GWh) 22,327 21,847 22,070ArgentinaNumber of generating facilities (1) 5 5 5Installed capacity (MW) (3) 3,652 3,652 3,652Energy generated (GWh) (4) 11,955 10,940 10,801Energy sales (GWh) 12,405 11,378 11,381BrazilNumber of generating facilities (1) 2 2 2Installed capacity (MW) (3) 987 987 987Energy generated (GWh) (4) 3,319 5,095 4,155Energy sales (GWh) 6,869 6,790 6,828ColombiaNumber of generating facilities (1) 11 12 12Installed capacity (MW) (3) 2,895 2,914 2,914Energy generated (GWh) (4) 12,674 11,283 12,090Energy sales (GWh) 16,806 14,817 15,112PeruNumber of generating facilities (1) (2) 9 9 9Installed capacity (MW) (3) (2) 1,667 1,668 1,668Energy generated (GWh) (4) 8,163 8,466 9,153Energy sales (GWh) 8,321 8,598 9,450TotalNumber of generating facilities (1) 56 56 56Installed capacity (MW) (3) 14,851 14,833 14,833Energy generated (GWh) (4) 58,349 56,699 56,921Energy sales (GWh) 66,728 63,431 64,840
(1) For details on generation facilities, see “Item 4D. Property Plants and Equipment”(2) Quintero and Canela II generation in Chile have been consolidated since July and December 2009, respectively; Santa Rosa TG8’s generation in Peru
since November 2009; and San Antonio mini hydro plant in Colombia since May 2010.(3) Total installed capacity is defined as the maximum MW capacity in generation units, under specific technical conditions and characteristics, in most
cases confirmed by satisfaction guarantee tests performed by equipment suppliers. Figures may differ from installed capacity declared to governmentalauthorities and customers in each country, according to criteria defined by such authorities and relevant contracts.
(4) Energy generated defined as total generation minus own power plant consumption and technical energy losses.
In the electricity industry, it is common to segment the business into hydroelectric and thermoelectric generation, because each type of generation hassignificantly different variable costs. Thermoelectric generation requires the purchase of fuel, thereby leading to high variable costs as compared with hydrogeneration from reservoirs or rivers with no marginal costs. Of our total consolidated generation in 2011, 59% was from hydroelectric sources, 41% camefrom thermal sources, and wind energy represented less than 1%.
26

Table of Contents
The following table summarizes Enersis’ consolidated generation by type of energy:
Year ended December 31,2009 2010 2011
(GWh) % (GWh) % GWh %Hydroelectric 37,730 64.7 33,689 59.4 33,676 59.2Thermal 20,563 35.2 22,867 40.3 23,112 40.6Other generation (1) 56 0.1 143 0.3 132 0.2Total generation 58,349 100.0 56,699 100.0 56,921 100.0
(1) Other generation refers to the generation from the wind farm Canela and Canela II.
In the countries in which we operate, the potential for contracting electricity is generally related to electricity demand. Customers identified as smallvolume regulated customers, such as residential customers subject to government regulated electricity tariffs, must purchase electricity directly from adistribution company. These distribution companies, which purchase large amounts of electricity for small volume residential customers, generally enterinto contractual agreements with generators at a regulated tariff price. Those identified as large volume industrial customers also enter into contractualagreements with energy suppliers. However, such large volume industrial customers are not subject to the regulated tariff price. Instead, these customersare allowed to negotiate the price of energy with generators based on the characteristics of the service required. Finally, the pool market, where energy isnormally sold at the spot price, is not carried out through contracted pricing.
The following table contains information regarding Enersis’ consolidated sales of electricity by type of customer for each of the periods indicated:
ENERSIS CONSOLIDATED PHYSICAL SALES BY TYPE OF CUSTOMER (GWh)
Year ended December 31,2009 2010 2011
Sales(GWh)
% of SalesVolume
Sales(GWh)
% of SalesVolume
Sales(GWh)
% of SalesVolume
Regulated customers 29,600 44.4 31,530 49.7 31,007 47.8Unregulated customers 16,526 24.8 15,535 24.5 16,563 25.5Electricity pool market sales 20,602 30.9 16,366 25.8 17,270 26.6Total electricity sales 66,728 100.0 63,431 100.0 64,840 100.0
The specific energy consumption limit (measured in GWh) for regulated and unregulated customers is country specific. Moreover, regulatory frameworksoften require that regulated distribution companies have contracts to support their commitments to small volume customers and also determine whichcustomers can purchase energy in electricity pool markets.
The following table contains information regarding Enersis physical sales of electricity per customer segment:
ENERSIS CONSOLIDATED PHYSICAL SALES PER CUSTOMER PRICE SEGMENT (GWh) (1)
Year ended December 31,2009 2010 2011
Sales(GWh)
% ofSales
VolumeSales
(GWh)
% ofSales
VolumeSales
(GWh)
% ofSales
VolumeContracted sales 46,126 69.1 47,065 74.2 47,570 73.4Non−contracted sales 20,602 30.9 16,366 25.8 17,270 26.6Total electricity sales 66,728 100.0 63,431 100.0 64,840 100.0
(1) Includes sales to distribution companies not backed by contracts in Chile and Peru.
Operations in Chile
We own and operate a total of 28 generation facilities in Chile directly and through our subsidiaries Pehuenche, Pangue, San Isidro, Celta, Endesa Ecoand our jointly controlled company GasAtacama. Of these generation facilities, 16 are hydroelectric, with a total installed capacity of 3,465 MW. Thisrepresents 61.7% of our total installed capacity in Chile. There are ten thermal facilities that operate with gas, coal or oil with a total installed capacity of2,068 MW, representing 36.9% of our total installed capacity in Chile. There are two wind power facilities with 78 MW in the aggregate, representing 1.4%of our total installed capacity in Chile. All of our generation facilities are connected to the country’s central interconnected electricity systems, SistemaInterconectado
27

Table of Contents
Central (SIC), except for three thermoelectric facilities (GasAtacama and two Celta units) which are connected to the Sistema Interconectado del NorteGrande (SING) in the north.
The following table sets forth the installed generation capacity for each of the Company’s Chilean subsidiaries:
INSTALLED CAPACITY PER SUBSIDIARY IN CHILE (MW)
As of December 31,2009 2010 2011
Endesa 3,446 3,407 3,407Pehuenche 699 699 699Pangue 467 467 467GasAtacama (1) 390 390 390San Isidro 379 379 379Celta 182 182 182Endesa Eco 87 87 87Total 5,650 5,611 5,611
(1) We include 50% of GasAtacama’s installed capacity, our jointly−controlled company.
Our total electricity generation in Chile (including the SIC and the SING) accounted for 33.4% of total electricity production in Chile during 2011.
The following table sets forth the electricity generation for each of our Chilean subsidiaries:
ELECTRICITY GENERATION IN CHILE (GWh)
Year ended December 31,2009 2010 2011
Endesa 12,265 11,539 11,458Pehuenche 3,613 2,970 2,983Pangue 2,113 1,615 1,713San Isidro 1,616 2,157 2,460Celta 981 995 908GasAtacama 1,558 1,445 1,026Endesa Eco 94 192 173Total 22,239 20,914 20,722
Hydroelectric generation in 2011 was 5.6% lower than in 2010. At December 31, 2011 Chilean reservoir levels contained 285 GWh more than atDecember 31, 2010; an increase of 8%. The main increases were in Endesa Chile’s Invernada and Ralco Reservoirs, where higher reservoir levels resultedin 481 GWh of higher potential energy, in an aggregate sum.
The following table shows the potential energy in Chilean reservoirs:
Year ended December 31,2009 2010 2011 % Change
(GWh) (GWh) (GWh) 2011 vs. 2010Reservoir (company)Laja (Endesa Chile) 3,045 1,923 1,801 (6)Maule (Colbún and Endesa Chile) 957 789 502 (36)Colbún (Colbún) 485 471 441 (6)Melado (Endesa Chile) 13 6 9 50Chapo (Colbún) 372 93 294 216Ralco (Endesa Chile) 484 207 429 107Invernada (Endesa Chile) 314 33 292 785Pangue (Endesa Chile) 10 10 10 (6)Rapel (Endesa Chile) 76 28 67 139Total 5,757 3,559 3,844 8
28

Table of Contents
Generation by type in Chile is shown in the following table:
GENERATION BY TYPE IN CHILE (GWh)
Year ended December 31,2009 2010 2011
Generation(GWh) %
Generation(GWh) %
Generation(GWh) %
Hydroelectric generation 14,864 66.8 12,625 60.4 11,916 57.5Thermal generation 7,319 32.9 8,146 38.9 8,674 41.9Other generation (1) 56 0.3 143 0.7 132 0.6Total generation 22,239 100.0 20,914 100.0 20,722 100.0
(1) Other generation refers to the generation of the Canela and Canela II wind farms.
Our thermal electric generation facilities are either natural gas, LNG, coal or oil−fired. In order to satisfy our natural gas and transportationrequirements, we enter into long−term gas contracts with suppliers who establish maximum supply amounts and prices and long−term gas transportationagreements with the pipeline companies, which are currently Gas Andes and Electrogas (an Endesa Chile related company). Since March 2008, all ofEndesa Chile’s natural gas units can operate with natural gas or diesel and since December 2009, San Isidro, San Isidro 2 and Quintero can operate withLNG.
Because of the lack of Argentine natural gas since 2006, Endesa Chile has used coal and diesel intensively, and more recently LNG has replaced ourprior dependence on Argentine natural gas. Diesel consumption in 2009, 2010 and 2011 was 430,000 tons, 51,000 tons and 32,722 tons, respectively. Onthe other hand, coal consumption was 760,000 tons, 486,000 tons and 600,000 tons, in 2009, 2010 and 2011, respectively. In 2010, Endesa Chile signed acoal supply contract for 2010 and 2011 with Carboex, a fuel−purchasing company and a subsidiary of Endesa Spain.
In May 2007, as part of a consortium with Empresa Nacional del Petróleo S.A. (ENAP), Metrogas and British Gas, in which Endesa Chile’sparticipation is 20%, we agreed to the construction of the LNG re−gasification facility in Quintero Bay, in order to deal with the lack of Argentine naturalgas. Partial commercial operations began in September 2009. In October 2010 the construction of the facilities was finished, and full commercialoperations started on January 1, 2011.
Thermal Unit Quintero began partial commercial operations in July 2009 and full commercial operations in September 2009 using diesel fuel. Partialcommercial operations burning LNG began in November 2009 and full commercial operations began in December 2009.
During 2011, the supply of LNG for Endesa Chile’s plants connected to the SIC was fundamental for maintaining relatively low thermal generationcosts in a context of dry hydrology and delays in the operation of the Bocamina II plant.
In 2011, the Quintero terminal received 36 shipments containing a total of 3,124 million m3 of natural gas, of which Endesa Chile bought1,103 million m3. This resulted in cost savings of over $ 300 million relative to what Endesa Chile would have spent on oil sufficient to generate the sameamount of electricity.
The purchases of LNG in 2011 were essentially within the terms of the current long−term LNG supply contract with British Gas. However, inOctober 2011, Endesa Chile purchased an additional shipment supplied by Carboex, which was a landmark in the business because it was the first shipmentby a supplier other than British Gas at the Quintero terminal. This broadens the possibilities of continuing to make further new purchases of shipments fromdifferent suppliers to guarantee access to additional LNG on competitive market conditions, as well as contributing to diversify supply sources.
Our entry into LNG was a consequence of the 2004 Argentine fuel crisis, which led to the interruption of cross border supply of natural gas fromArgentina. The substitution of LNG for natural gas enabled Endesa Chile to have access to a supply of safe, stable, clean and competitive fuel. Weobtained significant savings in the cost of producing LNG through our interest in the Valparaíso Region plant, as compared to the alternative cost of dieseloil, while at the same time reducing generation emissions. During 2011, we were also able to achieve better technical efficiency and operational safety inthe plants where we replaced oil with LNG, the principal design fuel.
The main effects in our generation due to the incorporation of this terminal are as follows: i) San Isidro 2 increased its installed capacity from 353 MWto 399 MW; ii) San Isidro, San Isidro 2 and Quintero may generate with LNG, reducing operating costs and adverse environmental impacts due to thereplacement of diesel fuel by LNG.
29

Table of Contents
Electricity sales countrywide in Chile, including sales other than ours, increased 5.9% during 2011, with sales in the SIC increasing by 6.7% and in theSING by 3.5%, as detailed in the following table:
ELECTRICITY SALES PER SYSTEM IN CHILE (GWh)
Year ended December 31,2009 2010 2011Sales
(GWh)Sales
(GWh)Sales
(GWh)Electricity sales in the SIC 39,401 41,061 43,805Electricity sales in the SING 13,657 13,792 14,272Total electricity sales 53,057 54,854 58,078
Our physical energy sales in Chile reached 21,847 GWh in 2010 and 22,070 GWh in 2011, which represent a 39.8% and 38.0% market share,respectively. The percentage of the energy purchases to satisfy our contractual obligations to third parties has increased from 6.0% in 2010 to 7.9% in 2011as a result of the decrease in our generation.
The following table sets forth our electricity purchases and production in Chile:
PHYSICAL GENERATION AND PURCHASES IN CHILE (GWh)
Year ended December 31,2009 2010 2011
(GWh)%
of Volume (GWh)%
of Volume (GWh)%
of VolumeElectricity generation 22,239 97.7 20,914 94.0 20,722 92.1Electricity purchases 532 2.3 1,344 6.0 1,777 7.9Total (1) 22,772 100 22,257 100 22,498 100.0
(1) Electricity generation plus electricity purchases differ from electricity sales due to transmission losses, as power plant consumption and technicalenergy losses have already been deducted.
We supply electricity to the major regulated electricity distribution companies, large unregulated industrial firms (primarily in the mining, pulp andsteel sectors) and the pool market. Commercial relationships with our customers are usually governed by contracts. Supply contracts with distributioncompanies must be auctioned, are generally standardized and have an average term of ten years.
Supply contracts with unregulated customers (large industrial customers) are specific to the needs of each client and the conditions are agreed betweenboth parties, reflecting competitive market conditions.
In 2009, 2010 and 2011, Endesa Chile (including GasAtacama) had 44, 59 and 53 customers, respectively. In 2011, our customers included 25distribution companies in the SIC and three minor commercial customers in the SING. The following table sets forth information regarding our sales ofelectricity in Chile by type of customer:
PHYSICAL SALES PER CUSTOMER PRICE SEGMENTIN CHILE (GWh)
Year ended December 31,2009 2010 2011
Sales(GWh)
% ofSales
VolumeSales
(GWh)
% ofSales
VolumeSales
(GWh)
% ofSales
VolumeRegulated customers 11,966 53.6 13,840 63.3 13,481 61.1Unregulated customers 6,177 27.7 6,456 29.6 6,772 30.7Electricity pool market sales 4,183 18.7 1,551 7.1 1,817 8.2Total electricity sales 22,327 100.0 21,847 100.0 22,070 100.0
Our most significant supply contracts with regulated customers are with our subsidiary Chilectra S.A. (Chilectra) and with Compañía General deElectricidad S.A. (CGE), an unrelated company, which are the two largest distribution companies in Chile in terms of sales.
In March 2008, Chilectra and other distributors allocated the third long−term energy bid for 1,800 GWh for the period 2011−2021 and 1,500 GWh forthe period 2022−2023, in both cases to Gener. In January 2009, Chilquinta, Sociedad Austral de Electricidad S.A. (Saesa) and CGE allocated the bid for8,010 GWh, divided in four blocks (BB1, BB2, BB3 and BB4) to be delivered starting in
30
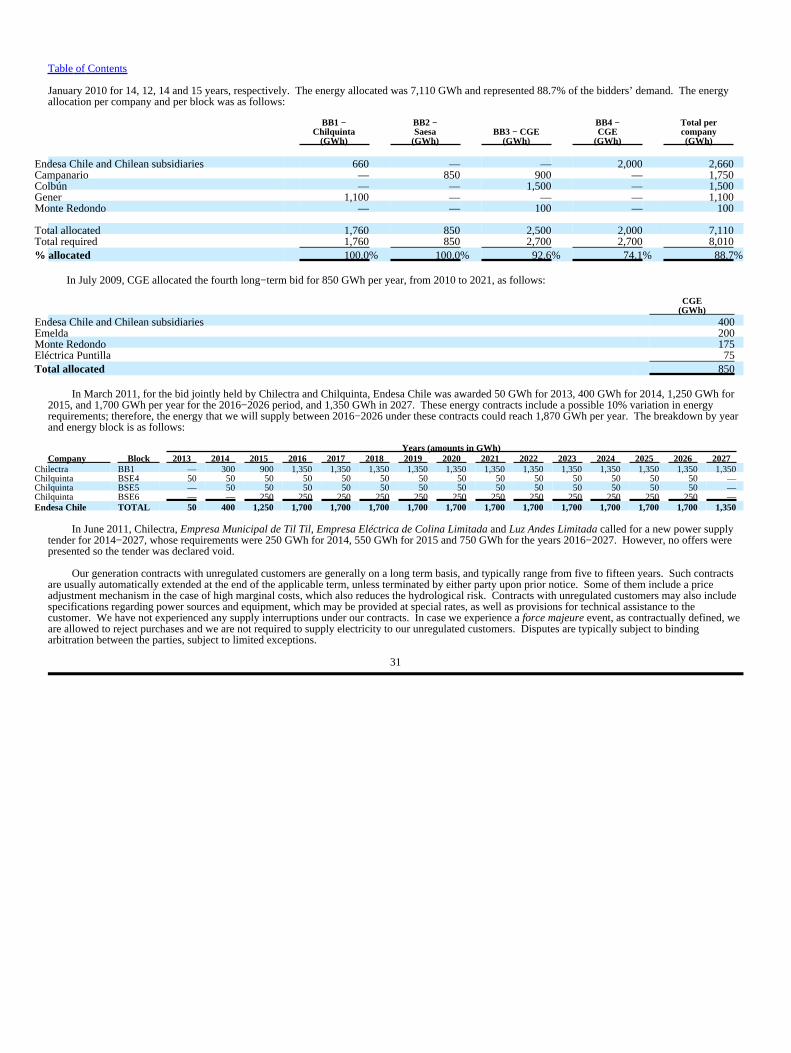
Table of Contents
January 2010 for 14, 12, 14 and 15 years, respectively. The energy allocated was 7,110 GWh and represented 88.7% of the bidders’ demand. The energyallocation per company and per block was as follows:
BB1 −Chilquinta
(GWh)
BB2 −Saesa
(GWh)BB3 − CGE
(GWh)
BB4 −CGE
(GWh)
Total percompany(GWh)
Endesa Chile and Chilean subsidiaries 660 — — 2,000 2,660Campanario — 850 900 — 1,750Colbún — — 1,500 — 1,500Gener 1,100 — — — 1,100Monte Redondo — — 100 — 100
Total allocated 1,760 850 2,500 2,000 7,110Total required 1,760 850 2,700 2,700 8,010% allocated 100.0% 100.0% 92.6% 74.1% 88.7%
In July 2009, CGE allocated the fourth long−term bid for 850 GWh per year, from 2010 to 2021, as follows:
CGE(GWh)
Endesa Chile and Chilean subsidiaries 400Emelda 200Monte Redondo 175Eléctrica Puntilla 75Total allocated 850
In March 2011, for the bid jointly held by Chilectra and Chilquinta, Endesa Chile was awarded 50 GWh for 2013, 400 GWh for 2014, 1,250 GWh for2015, and 1,700 GWh per year for the 2016−2026 period, and 1,350 GWh in 2027. These energy contracts include a possible 10% variation in energyrequirements; therefore, the energy that we will supply between 2016−2026 under these contracts could reach 1,870 GWh per year. The breakdown by yearand energy block is as follows:
Years (amounts in GWh)Company Block 2013 2014 2015 2016 2017 2018 2019 2020 2021 2022 2023 2024 2025 2026 2027
Chilectra BB1 — 300 900 1,350 1,350 1,350 1,350 1,350 1,350 1,350 1,350 1,350 1,350 1,350 1,350Chilquinta BSE4 50 50 50 50 50 50 50 50 50 50 50 50 50 50 —Chilquinta BSE5 — 50 50 50 50 50 50 50 50 50 50 50 50 50 —Chilquinta BSE6 — — 250 250 250 250 250 250 250 250 250 250 250 250 —Endesa Chile TOTAL 50 400 1,250 1,700 1,700 1,700 1,700 1,700 1,700 1,700 1,700 1,700 1,700 1,700 1,350
In June 2011, Chilectra, Empresa Municipal de Til Til, Empresa Eléctrica de Colina Limitada and Luz Andes Limitada called for a new power supplytender for 2014−2027, whose requirements were 250 GWh for 2014, 550 GWh for 2015 and 750 GWh for the years 2016−2027. However, no offers werepresented so the tender was declared void.
Our generation contracts with unregulated customers are generally on a long term basis, and typically range from five to fifteen years. Such contractsare usually automatically extended at the end of the applicable term, unless terminated by either party upon prior notice. Some of them include a priceadjustment mechanism in the case of high marginal costs, which also reduces the hydrological risk. Contracts with unregulated customers may also includespecifications regarding power sources and equipment, which may be provided at special rates, as well as provisions for technical assistance to thecustomer. We have not experienced any supply interruptions under our contracts. In case we experience a force majeure event, as contractually defined, weare allowed to reject purchases and we are not required to supply electricity to our unregulated customers. Disputes are typically subject to bindingarbitration between the parties, subject to limited exceptions.
31

Table of Contents
The following table sets forth our sales by volume to our six largest distribution and unregulated customers in Chile for each of the periods indicated:
MAIN CUSTOMERS IN CHILE (GWh)
Year ended December 31,2009 2010 2011
Sales(GWh)
% of totalSales
Sales(GWh)
% of totalSales
Sales(GWh)
% of totalSales
Distribution companies:Chilectra 3,731 16.7 5,929 27.1 4,679 21.2CGE 4,727 21.2 3,541 16.2 3,887 17.6Grupo Emel (1) 868 3.9 1,816 8.3 1,802 8.2Chilquinta — — 895 4.1 1,332 6.0Saesa (2) 669 3.0 779 3.6 773 3.5Frontel (3) 1 0.0 282 1.3 293 1.3
Total sales to the largest distribution companies 9,997 44.8 13,242 60.6 12,765 57.8Unregulated customers:Cía. Minera Los Pelambres 926 4.1 1,113 5.1 1,155 5.2Cía. Minera Collahuasi (4) 1,099 4.9 1,114 5.1 1,093 5.0Grupo CAP−CMP (5) 937 4.2 918 4.2 1,076 4.9CMPC 912 4.1 773 3.5 683 3.1Cía. Minera Escondida 692 3.1 638 2.9 563 2.6Codelco 540 2.4 545 2.5 557 2.5
Total sales to the largest unregulated customers 5,104 22.9 5,101 23.3 5,127 23.2
(1) The values of the Emel Group for 2009, 2010 and 2011 include 50% of the consumption of the distributors Empresa Eléctrica de Arica S.A.(Emelari),Empresa Eléctrica de Iquique S.A.(Eliqsa) and Empresa Eléctrica de Antofagasta (Elecda), clients of GasAtacama, and the consumption of Empresaeléctrica de Melipilla, Colchagua y Maule (Emelectric), Empresa Eléctrica de Talca (Emetal) and Empresa Eléctrica de Atacama (Emelat), clients ofEndesa Chile. The Emel Group is a subsidiary of the CGE Group.
(2) During 2009 we did not have a contract with Saesa. Sales during this year were the result of government Resolution 88 that forces generators of theCDEC−SIC system to supply energy to distribution companies without contracts.
(3) Empresa Eléctrica de la Frontera S.A (Frontel) is a subsidiary of Saesa.(4) Consumption of Cía. Minera Collahuasi includes the 50% of the contract of GasAtacama with this client and the contracts with Celta.(5) Consumption of Group CAP−Compañía Minera del Pacífico S.A. (CMP) includes the contracts with CAP Huachipato, CMP Algarrobo, CMP Hierro
Atacama, CMP Los Colorados, CMP Pellets and CMP Romeral.
We compete in the SIC primarily with two generation companies, AES Gener S.A. (Gener) and Colbún S.A. (Colbún). According to the CDEC−SICin 2011, Gener and its subsidiaries in the SIC had an installed capacity of 2,355 MW, of which 88.5% was thermoelectric, and Colbún of 2,610 MW, ofwhich 51.7% was thermoelectric. In addition to these two large competitors, there are a number of smaller entities with an aggregate installed capacity of2,752 MW that generate electricity in the SIC.
Our primary competitors in the SING are E−CL (GDF Suez Group) and Gener, which have 2,135 MW and 1,465 MW of installed capacity,respectively. Our direct participation in the SING includes our 182 MW Tarapacá thermal plant, owned by our subsidiary Celta, and our participationthrough our jointly controlled company, GasAtacama, with 781 MW of installed capacity. In this Report, the convention is to refer to our capacity of390 MW (50% of the actual amount) in connection with GasAtacama in proportion to Endesa Chile’s 50% stake. See “Item 4 C. Organizational Structure”for details on related companies.
Electricity generation companies compete largely on the basis of price, technical experience and reliability. In addition, because 61.7% of our installedcapacity in the SIC comes from hydroelectric power plants, we have lower marginal production costs than companies generating electricity through thermalplants. Our thermal installed capacity benefits from the LNG terminal. During periods of extended droughts, however, we may be forced to buy moreexpensive electricity from thermoelectric generators at spot prices in order to satisfy our contractual obligations.
32

Table of Contents
Directly and through our subsidiaries Pehuenche, Pangue, San Isidro and Endesa Eco, we are the principal operators in the SIC, with 39.5% of the totalinstalled capacity and 44.1% of the physical energy sales of this system in 2011.
In the SING, our subsidiary Celta, and our jointly controlled company GasAtacama, account for 12.5% of the total installed capacity in 2011. Celta,our subsidiary, has a two−turbine 182 MW thermal power plant connected to the SING which represents 4.0% of the total capacity of the SING. ForEndesa Chile, GasAtacama represents a total of 390 MW or 8.5% of the total capacity in the SING. For further information regarding to our generationcapacity in Chile as of December 31, 2011, please see “— D. Property, Plants and Equipment”.
Operations in Argentina
We participate in electricity generation in Argentina through our subsidiaries Endesa Costanera and El Chocón, with a total of five power plants. ElChocón owns two hydroelectric power plants, with total installed capacity of 1,328 MW and Endesa Costanera owns three thermal plants, with a totalinstalled capacity of 2,324 MW. Our hydro and thermal generation plants in Argentina represented 12.0% of the Sistema Interconectado Nacional (theArgentine NIS) installed capacity in 2011.
Our Argentine subsidiaries participate in three new companies, Manuel Belgrano, San Martín and Central Vuelta de Obligado S.A. These companieswere formed to undertake the construction of three new generation facilities for FONINVEMEM. The first two plants started operations using gas turbinesin 2008, with 1,125 MW of aggregate capacity, and as combined cycles as of March 2010, with an additional 572 MW. The total aggregate capacity ofthese units is 1,697 MW (848 MW for Manuel Belgrano and 849 MW for San Martín). We expect that the third plant will start open cycle operations in mid2013 with an installed capacity of 550 MW, and in combined cycle in mid 2014 with a total installed capacity of 800 MW.
Since 2002, government intervention and energy industry authority actions, including limiting the spot price of electricity by considering the variablecost of generating electricity with natural gas and without considering the hydrological conditions of rivers and reservoirs or the use of more expensivefuels, have led to the lack of investment in the electric power sector. (See “Item 4 B. Business Overview — Electricity Industry Regulatory Framework” forfurther detail).
As of December 31, 2011, Endesa Costanera’s installed capacity accounted for 7.9% of the total installed capacity in the Argentine NIS. Endesa Costanera’s second combined−cycle plant can operate with either natural gas or diesel. Our 1,138 MW steam turbine power plant also can operatewith either natural gas or fuel oil.
El Chocón accounted for 4.5% of the installed capacity in the Argentine NIS as of December 31, 2011. El Chocón has a 30−year concession, endingin 2023, for two hydroelectric generation facilities with an aggregate of 1,328 MW of installed capacity. The larger of the two facilities for whichEl Chocón has a concession of 1,200 MW in installed capacity is the primary flood control installation on the Limay River. The facility’s large reservoir,Ezequiel Ramos Mejía, enables El Chocón to be one of the Argentine NIS major peak suppliers. Variations in El Chocón’s water discharge are moderatedby El Chocón’s Arroyito facility, a downstream dam with 128 MW of installed capacity. In November 2008, we finished construction work on the Arroyitodam, and increased the elevation of the reservoir water level, that allows releasing water at an additional 1,150 m3/sec, for a total of 3,750 m3/sec. Theadditional energy (69 GWh/year) was sold on the spot market until April 2009 and under “Energy Plus” program thereafter. Energy Plus program is theoffer of new electricity capacity to supply the electricity demand growth, on top of the demand level for electricity in 2005. (For details on Energy Plus, see“Item 4B − Electricity Industry Regulatory Framework”).
The following table sets forth the installed capacity of our Argentine subsidiaries:
INSTALLED CAPACITY PER SUBSIDIARY IN ARGENTINA (MW)
As of December 31,2009 2010 2011
Endesa CostaneraEndesa Costanera (steam turbines) 1,138 1,138 1,138Endesa Costanera (combined cycle II) 859 859 859Central Termoeléctrica Buenos Aires (combined cycle I) 327 327 327El ChocónEl Chócon (reservoir) 1,200 1,200 1,200Arroyito (pass−through) 128 128 128Total 3,652 3,652 3,652
33

Table of Contents
Our total generation in Argentina reached 10,801 GWh in 2011. Our generation market share was approximately 8.9% of total electricity productionin Argentina during 2011.
The following table sets forth the electricity generation of our Argentine subsidiaries:
ELECTRICITY GENERATION PER SUBSIDIARY IN ARGENTINA (GWh)
Year Ended December 31,2009 2010 2011
Endesa Costanera 8,172 7,965 8,397El Chocón 3,783 2,975 2,404Total 11,955 10,940 10,801
Hydroelectric generation in Argentina accounted for nearly 22.3% of total generation in 2011, 18.0% lower than in 2010. This was due to therestrictions of the operation of El Chocón that were imposed by CAMMESA and the drought conditions presented during the year in the Limay River and inthe Collón Curá River, the main tributaries of El Chocón. The monthly flow of the rivers during 2011 and the monthly average is shown in the followingtable:
Jan Feb Mar Apr May Jun Jul Aug Sep Oct Nov Dec2011 227 156 106 102 129 176 204 264 290 344 303 218
Limay m3/s Average 250 178 125 113 167 290 355 362 346 341 359 329% 91% 88% 85% 90% 77% 61% 57% 73% 84% 101% 84% 66%
2011 202 107 76 129 161 269 282 466 538 646 507 224Collón Curá m3/s Average 217 122 88 104 266 571 640 581 572 630 649 452
% 93% 88% 86% 124% 61% 47% 44% 80% 94% 103% 78% 50%
The volumes and percentages of hydroelectric and thermal generation are shown in the following table:
GENERATION BY TYPE IN ARGENTINA (GWh) (1)
Year ended December 31,2009 2010 2011
(GWh) % (GWh) % (GWh) %Hydroelectric generation 3,783 31.6 2,975 27.2 2,404 22.3Thermal generation 8,172 68.4 7,965 72.8 8,397 77.7Total generation 11,955 100.0 10,940 100.0 10,801 100.0
(1) Generation minus our own power plant consumption and technical losses.
The amount of energy generated and purchased in the last three years is shown in the following table:
PHYSICAL GENERATION AND PURCHASES IN ARGENTINA (GWh)
2009 2010 2011(GWh) % (GWh) % (GWh) %
Electricity generation 11,955 95.8 10,940 95.5 10,801 94.2Electricity purchases 528 4.2 517 4.5 668 5.8Total (1) 12,483 100.0 11,457 100.0 11,469 100.0
(1) Energy generation plus energy purchases differ from electricity sales due to own power plant consumption of electricity.
34

Table of Contents
The distribution of physical sales in Argentina, in terms of customer segment and per subsidiary, is shown in the following tables:
PHYSICAL SALES PER CUSTOMER SEGMENT IN ARGENTINA (GWh)
Year Ended December 31,2009 2010 2011
(GWh)
% ofSales
Volume (GWh)% of Sales
Volume (GWh)% of Sales
VolumeContracted sales 2,128 17.2 2,142 18.8 2,145 18.8Non−contracted sales 10,278 82.8 9,236 81.2 9,236 81.2Total electricity sales 12,405 100.0 11,378 100.0 11,381 100.0
PHYSICAL SALES PER SUBSIDIARY IN ARGENTINA (GWh)
Year Ended December 31,2009 2010 2011
Endesa Costanera 8,284 8,018 8,493El Chocón 4,122 3,361 2,888Total 12,405 11,378 11,381
During 2011, Endesa Costanera served an average of 66 unregulated customers. Endesa Costanera has no contract with distribution companies. Giventhe regulatory measures adopted since 2003, the current Argentine electricity industry price scenario makes sales to distribution companies less attractivethan sales to the wholesale market.
The following table sets forth Endesa Costanera’s sales to its largest unregulated customers for each of the periods indicated:
ENDESA COSTANERA’S MAIN CUSTOMERS (GWh)
Year ended December 31,2009 2010 2011
ContractedSales
(GWh)
% ofcontracted
Sales
ContractedSales
(GWh)
% ofcontracted
Sales
ContractedSales
(GWh)
% ofcontracted
SalesYPF 122 15.8 188 25.7 152 20.6Cencosud 71 9.2 70 9.6 73 9.9Transclor 58 7.5 60 8.2 61 8.3Peugeot 48 6.2 59 8.0 31 4.2Rasic Hnos 40 5.5 39 5.3 39 5.3Solvay (1) 96 12.4 22 3.1 23 3.1Total sales to our largest unregulated
customers 435 56.6 438 59.9 379 51.4
(1) Since September 2009, the contract with Solvay started to decline, because Solvay started to supply part of their consumption with a cogenerationplant.
Sales to the pool market amounted to 7,756 GWh in 2011. During 2011, as in prior years, Endesa Costanera, acting through our affiliate Endesa Cemsa(Cemsa), negotiated with a number of suppliers (producers and traders), which allowed Endesa Costanera to maintain its natural gas needs diversified, withan average available daily volume of 3.17 million m3.
35

Table of Contents
During 2011, El Chocón served an average of 21 unregulated customers. El Chocón has no contract with distribution companies. The following tablesets forth sales by volume to El Chocón’s largest unregulated customers for each of the periods indicated:
EL CHOCON’S MAIN CUSTOMERS (GWh)
Year ended December 31,2009 2010 2011
ContractedSales
(GWh)
% ofcontracted
Sales
ContractedSales
(GWh)
% ofcontracted
Sales
ContractedSales
(GWh)
% ofcontracted
SaleMinera Alumbrera 542 40.0 505 35.8 500 35.5Air Liquide 122 9.0 131 9.3 161 11.4Profertil (Cemsa) (1) 115 8.5 112 7.9 113 8.0Praxair 80 5.9 87 6.2 91 6.4Chevron 120 8.8 91 6.4 83 5.9Acindar (Cemsa) (1) 75 5.5 80 5.7 80 5.7Total sales to our largest unregulated
customers 1,054 77.7 1,006 71.3 1,028 72.9
(1) Profertil and Acindar do not have contracts with El Chocón, but are served through Cemsa, Enersis’ affiliate.
El Chocón does not have the right to terminate the operating agreement, unless we fail to perform our obligations under the agreement. Under theterms of the operating agreement, we are entitled to a fee payable in dollars based on El Chocón’s annual gross revenues, payable in monthly installments. The management fee for 2009, 2010 and 2011 was $ 2.4 million, $ 2.3 million and $ 2.1 million, respectively.
Electricity demand in the Argentine NIS increased 5.1% during 2011. Total electricity demand was 104,592 GWh in 2009, 110,767 GWh in 2010 and116,418 GWh in 2011. Our Argentine subsidiaries compete with all the major power plants connected to the Argentine NIS. According to the installedcapacity reported by CAMMESA in the monthly report for December 2011, our major competitors in Argentina are the state−controlled company Enarsa(with an installed capacity of 989 MW), nuclear units −NASA− (1,005 MW) and the binational hydroelectric units Yacyretá and Salto Grande (3,675 MWin total). The main private competitors are: AES Group, Sociedad Argentina de Energía S.A. (Sadesa), and Pampa Energía. The AES Group has ninepower plants connected to the Argentine NIS with a total capacity of 2,754 MW (44% of which is hydro) and one plant that is not connected to theArgentine NIS that delivers energy to the Chilean SING, Termo Andes, with a total capacity of 411 MW. Sadesa owns a total of approximately 3,813 MW,the most important of which are Piedra del Águila (hydro, 1,400 MW) and Central Puerto (thermal, 1,777 MW), while Pampa Energía, with 2,181 GWh,competes with us with five power plants, Diamante and Nihuiles (both hydro, 630 MW in total), and Güemes, Loma de la Lata and Piedra Buena (thermal,1,551 MW in total).
Generation in Brazil
Endesa Brasil consolidates operations of Endesa Fortaleza and Cachoeira Dourada, two generation companies; CIEN, which transmits electricity fromtwo transmission lines between Argentina and Brazil; CTM and TESA, subsidiaries of CIEN, which are owners of the Argentine side of the lines; Ampla,the second largest electricity distribution company in the State of Rio de Janeiro; and Coelce, which is the sole electricity distributor in the State of Ceará.
As of December 2011, we had a total installed capacity of 987 MW in Brazil. Of this amount, 665 MW corresponds to Cachoeira Dourada and322 MW to Endesa Fortaleza.
36

Table of Contents
The following table sets forth information relating to Enersis’ installed capacity in Brazil:
INSTALLED CAPACITY IN BRAZIL (MW) (1)
(MW)2009 2010 2011
Cachoeira Dourada (hydro) 665 665 665Endesa Fortaleza (thermal) 322 322 322Total 987 987 987
(1) Total installed capacity is defined as the maximum MW capacity of generation units under specific technical conditions and characteristics.
The following table sets forth the physical energy production of Cachoeira Dourada and Endesa Fortaleza:
OUR PHYSICAL PRODUCTION IN BRAZIL (GWh)
Year ended December 31,2009 2010 2011
(GWh) % (GWh) % (GWh) %Cachoeira Dourada 2,820 85.0 3,430 67.3 3,121 75.1Endesa Fortaleza 499 15.0 1,665 32.7 1,033 24.9Total 3,319 100.0 5,095 100.0 4,155 100.0
The following table sets forth the levels of electricity production and purchases for our Brazilian subsidiaries for the past three years:
PHYSICAL PRODUCTION AND PURCHASES IN BRAZIL (GWh)
Year ended December 31,2009 2010 2011
(GWh) % (GWh) % (GWh) %Electricity production 3,319 47.0 5,095 74.5 4,155 60.6Electricity purchases 3,742 53.0 1,746 25.5 2,699 39.4Total (1) 7,061 100.0 6,841 100.0 6,854 100.0
(1) Electricity generation plus electricity purchases differ from electricity sales due to transmission losses, as power plant consumption and technicallosses have already been deducted.
Cachoeira Dourada is a hydroelectric company with an installed capacity of 665 MW located in southern Brazil. It has long−term contracts with 34distribution companies due to the bids carried out for regulated consumers by the Contratos de Comercialização de Energia no Ambiente Regulado(CCEAR). The contract sales with regulated clients were for 1,159 GWh. Additionally, during 2011, Cachoeira had medium−term contracts with 17unregulated clients with an average duration of three years and short term contracts with 22 unregulated clients. Cachoeira’s sales to unregulated clientswere 2,149 GWh.
The following table sets forth certain statistical information regarding Cachoeira Dourada’s electricity sales:
Year ended December 31,2009 2010 2011
(GWh)
% ofSales
Volume (GWh)
% ofSales
Volume (GWh)
% ofSales
VolumeContracted sales 3,411 88.3 3,440 89.8 3,307 83.0Non−contracted sales 451 11.7 392 10.2 679 17.0Total electricity sales 3,862 100.0 3,833 100.0 3,986 100.0
Endesa Fortaleza is wholly−owned by Endesa Brasil. Endesa Fortaleza owns a combined−cycle plant which uses natural gas. The plant is located 50kilometers from the capital of the Brazilian state of Ceará, and it began commercial operations in 2003. Since January 2010 Endesa Fortaleza has hadavailability of natural gas from the Pecem regasification terminal.
37

Table of Contents
The following table sets forth certain statistical information regarding Endesa Fortaleza’s electricity sales:
Year ended December 31,2009 2010 2011
Electricity sales (GWh) 3,007 2,957 2,842
Endesa Fortaleza’s market share is 0.3% of the total installed capacity of the Brazilian system and 1.0% of the thermoelectric generators.
Fortaleza has a long−term contract with Coelce which expires in 2023. The following table sets forth certain statistical information regardingEndesa Fortaleza’s electricity sales:
Year ended December 31,2009 2010 2011
(GWh)
% ofSales
Volume (GWh)
% ofSales
Volume (GWh)
% ofSales
VolumeContracted sales 2,918 97.1 2,690 91.0 2,690 94.7Non−contracted sales 88 2.9 267 9.0 152 5.3Total electricity sales 3,007 100.0 2,957 100.0 2,842 100.0
Operations in Colombia
Until August 2007, our generation operations in Colombia were carried out through Betania and Emgesa. These companies were merged into Betania,which then changed its name to Emgesa S.A. E.S.P., or Emgesa. We hold a 16.1% stake in Emgesa as of December 31, 2011, which we control andconsolidate through Endesa Chile pursuant to a shareholder’s agreement with an Endesa Spain subsidiary, who owns 21.6%.
As of December 31, 2011, our Colombian subsidiary operated 12 generation facilities in Colombia, with a total installed capacity of 2,914 MW. Emgesa has 2,470 MW in hydroelectric plants and 444 MW in thermoelectric plants. Our hydroelectric and thermal generation plants in Colombiarepresent 20.2% of the country’s total electricity generation capacity as of December 2011.
The following table sets forth the installed generation capacity of our Colombian subsidiaries for the last three years:
INSTALLED CAPACITY IN COLOMBIA (MW) (1)
Year ended December 31,2009 2010 2011
(MW)EmgesaGuavio (reservoir) 1,213 1,213 1,213Cadena Nueva (reservoir/pass−through) (2) 601 601 601Betania (reservoir) 541 541 541Termozipa (steam turbine/coal) 236 236 236Cartagena (steam turbine/natural gas + diesel oil) 208 208 208Minor Plants (pass−through) (3) 96 116 116Total 2,895 2,914 2,914
(1) The figure includes the capacity used for power plant consumption.(2) Includes two power plants named La Guaca and Paraíso.(3) As of December 31, 2011 Emgesa owned and operated six minor plants: Charquito, El Limonar, La Tinta, Tequendama, La Junca and San Antonio, which
started operations in May 2010.
Approximately 85% of our installed capacity in Colombia is hydroelectric. As a result, our physical generation depends on the reservoir levels andrainfalls. Our generation market share in Colombia was 22.6% in 2009, 19.8% in 2010 and 20.6% in 2011. In addition to hydrological conditions, theamount of generation depends on our commercial strategy. Companies are free to offer their electricity at prices driven by market conditions and aredispatched by a centralized operating entity to generate according to the prices offered, as opposed to being dispatched according to the operating costs, asin other countries in which we operate.
During 2011, thermal generation represented 3.9% of total generation and hydroelectric generation represented the remaining 96.1% of our generationin Colombia. During 2011, hydrological conditions were favorable in Colombia, with around 134% of
38

Table of Contents
historic average rainfalls. For Emgesa, the flows in the Guavio River Basin were a little below average (96%) while those of the Magdalena River(Betania) and Bogotá River (Cadena Nueva) were more favorable, as the following table shows:
Jan Feb Mar Apr May Jun Jul Aug Sep Oct Nov Dec Average2011 19 16 59 113 121 110 77 54 66 70 69 46 68
Guavio River m3/s Average 18 20 30 66 105 137 142 108 75 64 53 31 71% 102% 82% 195% 170% 115% 80% 54% 50% 89% 110% 131% 145% 96%
2011 266 305 432 703 799 655 692 318 377 366 566 841 527Magdalena River Average 285 299 352 459 513 583 617 474 351 379 443 394 429
m3/s % 93% 102% 123% 153% 156% 112% 112% 67% 108% 97% 128% 213% 123%
2011 32 40 65 107 138 88 48 48 40 69 103 108 74Bogotá River Average 22 22 25 33 40 37 35 30 26 35 43 33 32
m3/s % 149% 182% 261% 322% 343% 235% 138% 161% 150% 198% 237% 325% 232%
The volumes and percentages of hydroelectric and thermal generation are shown in the following table:
GENERATION BY TYPE IN COLOMBIA (GWh) (1)
Year ended December 31,2009 2010 2011
(GWh) % (GWh) % (GWh) %Hydroelectric generation 11,700 92.3 10,253 90.9 11,620 96.1Thermal generation 974 7.7 1,030 9.1 470 3.9Total generation 12,674 100.0 11,283 100.0 12,090 100.0
(1) Generation minus power plant own consumption and technical losses.
Regarding fuel supplies, Emgesa has signed medium−term contracts with various local coal suppliers and a contract for special fuel oil with Petróleosdel Milenio C. I. S.A. (Petromil). These contracts allow compliance with the thermal plants requirements in order to receive the charge for reliability.
The following table sets forth the levels of electricity production and purchases for our Colombian subsidiaries for the past three years:
PHYSICAL PRODUCTION AND PURCHASES IN COLOMBIA (GWh)
Year ended December 31,2009 2010 2011
(GWh) % (GWh) % (GWh) %Electricity production 12,674 74.7 11,283 75.4 12,090 79.3Electricity purchases 4,284 25.3 3,678 24.6 3,163 20.7Total (1) 16,958 100.0 14,961 100.0 15,254 100.0
(1) Electricity generation plus electricity purchases differ from electricity sales due to transmission losses, as power plant consumption and technicallosses have already been deducted.
The only interconnected electricity system in Colombia is the Sistema Interconectado Nacional the “Colombian NIS.” Electricity demand in theColombian NIS increased 1.8% during 2011. Total electricity consumption was: 54,679 GWh in 2009, 56,148 GWh in 2010 and 57,150 GWh in 2011.
The generation in Colombia’s electricity market has been affected by the agreement on International Energy Transactions governing theinterconnection with Ecuador’s electricity system, which began operations in 2003. During 2011 physical sales to Ecuador were 1,295 GWh, 497 GWhmore than the 798 GWh sold in 2010. Energy imports from Ecuador to Colombia were 10 GWh in 2010 and 8 GWh in 2011.
In addition, Colombia has some interconnection links with Venezuela which operate under exceptional circumstances as required by either of the twocountries. In early April 2011, Colombia and Venezuela signed an agreement to supply energy to Venezuela as part of the normalization of commercialrelations as agreed by presidents Juan Manuel Santos and Hugo Chávez. The agreement also includes the import of gasoline and diesel from Venezuela. Theenergy exported was sold under a contract that expired in January 2012. The total energy exported was 249 GWh in 2011, compared to none in 2010.
39

Table of Contents
The distribution of our physical sales in Colombia, in terms of customer segment, is shown in the following table:
PHYSICAL SALES PER CUSTOMER SEGMENT IN COLOMBIA (GWh)
Year ended December 31,2009 2010 2011
Sales(GWh)
% ofSales
VolumeSales
(GWh)
% ofSales
VolumeSales
(GWh)% of Sales
VolumeContracted sales 11,960 71.2 10,946 73.9 10,544 69.8Non−contracted sales 4,847 28.8 3,871 26.1 4,568 30.2Total electricity sales 16,806 100.0 14,817 100.0 15,112 100.0
During 2011, Emgesa served an average of 820 contracts with 382 unregulated customers and 14 distribution and trading companies. Emgesa’s salesto our distribution company, Codensa, accounted for 47.8% of our total contracted sales in 2011. Physical sales to the five largest unregulated customersrepresented 5.8% of total contracted sales.
The following table sets forth our sales by volume to our largest distribution customers in Colombia for the last three years:
MAIN DISTRIBUTION AND TRADING CUSTOMERS IN COLOMBIA (GWh)
Year ended December 31,2009 2010 2011
ContractedSales
(GWh)
% ofcontracted
Sales
ContractedSales
(GWh)
% ofcontracted
Sales
ContractedSales
(GWh)
% ofcontracted
Sales
Codensa 4,697 39.3 4,296 39.2 5,035 47.8Cía. Energética del Tolima (Enertolima) 471 3.9 501 4.6 — —Electrificadora de la Costa (Electrocosta) 517 4.3 555 5.1 — —Electrificadora del Caribe (Electrocaribe) 954 8.0 352 3.2 360 3.4Empresas Públicas de Medellín (EPM) 720 6.0 1,716 15.7 760 7.2Electrificadora del Meta (Meta) 163 1.4 175 1.6 82 0.8Electrificadora del Huila 223 1.9 236 2.2 416 3.9Total sales to our largest distribution customers 7,746 64.8 7,831 71.5 6,653 63.1
Our most important competitors in Colombia include the following state−owned companies: Empresas Públicas de Medellín (with an installedcapacity of 3,252 MW) and Isagen (with an installed capacity of 2,102 MW). We also compete with the following private sector companies in Colombia:Chivor (1,000 MW), which is owned by Gener; Colinversiones, with an installed capacity of 1,941 MW, which includes Termoflores and Epsa; and Gecelcawith an installed capacity of 1,208 MW.
Operations in Peru
Through our subsidiary Edegel, we operate a total of nine generation facilities in Peru, with a total installed capacity of 1,668 MW, as ofDecember 2011. Edegel owns seven hydroelectric power plants, with a total installed capacity of 746 MW, two of which are located 280 kilometers fromLima and five of which are located approximately 50 kilometers from Lima. The company has two thermal plants, which represent the remaining 922 MWof total installed capacity. Our hydroelectric and thermal generation plants in Peru represent 26.0% of the country’s total electricity generation capacityaccording to the information reported in December 2011 by the Organismo Supervisor de la Inversión en Energía y Minería, Supervisory Entity of theInvestment on Energy and Mining (Osinergmin).
40

Table of Contents
The following chart sets forth Edegel’s installed capacity, which has remained virtually unchanged in 2009−2011:
INSTALLED CAPACITY IN PERU (MW)
Year Ended December 31,2009 2010 2011
Edegel S.A.Ventanilla (thermal) 493 493 493Santa Rosa (thermal) 430 429 429Huinco (hydroelectric) 247 247 247Chimay (hydroelectric) 151 151 151Matucana (hydroelectric) 129 129 129Callahuanca (hydroelectric) 80 80 80Moyopampa (hydroelectric) 65 66 66Yanango (hydroelectric) 43 43 43Huampaní (hydroelectric) 30 30 30Total 1,668 1,668 1,668
Our generation market share was 26.0% of total electricity production in Peru in 2011.
HYDRO/THERMAL GENERATION IN PERU (GWh)(1)
Year ended December 31,2009 2010 2011
(GWh) % (GWh) % (GWh) %Hydroelectric generation 4,564 55.9 4,405 52.0 4,615 50.4Thermal generation 3,599 44.1 4,061 48.0 4,538 49.6Total generation 8,163 100.0 8,466 100.0 9,153 100.0
(1) Generation minus power plant own consumption and technical losses.
Hydrological generation represented 50.4% of Edegel’s total production in 2011. For Edegel, all hydrological contributions were above their historicalaverage in 2011: in the Rimac River Basin (Huinco, Matucana, Callahuanca, Moyopampa, Huampaní) hydrological contributions were 126%; in theTulumayo River (Yanango) hydrological contributions were 108% and in the Tarma River (Chimay) hydrological contributions were 114%, as detailedbelow in relation to an average year:
Jan Feb Mar Apr May Jun Jul Aug Sep Oct Nov Dec Average2011 69 81 64 59 28 18 14 12 13 13 18 41 36
Rimac River m3/s Average 42 58 60 40 21 15 12 10 11 13 17 27 27% 165% 140% 107% 145% 132% 121% 114% 115% 121% 95% 106% 152% 126%
2011 153 249 184 136 67 38 36 25 36 67 72 125 99Tulumayo River Average 128 155 152 108 59 43 41 39 46 63 72 94 83
m3/s % 120% 160% 121% 125% 112% 88% 87% 65% 78% 106% 99% 134% 108%
2011 30 58 53 43 21 13 12 9 9 15 13 26 25Tarma River Average 34 43 42 29 15 11 10 9 10 13 16 22 21
m3/s % 90% 134% 124% 148% 141% 121% 122% 95% 88% 110% 81% 115% 114%
The portion of electricity supplied by Edegel’s own generation was 95.1% of total physical sales, requiring only a small amount of purchases to satisfycontractual obligations to customers.
Edegel has gas supply, transportation and distribution contracts for its Ventanilla and Santa Rosa facilities. During 2007, the gas pipelineCamisea−Lima, owned by Transportadora del Gas del Perú S.A. (TGP), reached its full capacity. However, in May 2008, TGP started implementingrestrictions on the gas transfer through the pipeline. In order to guarantee the transportation capacity for its natural gas demand, Edegel modified itsagreements during 2007 and 2008, shifting from interruptible to firm mode, with a capacity of 1.5 million m3/d (from August 2008 to July 2009) and2.7 million m3/d (from August 2009 to July 2019). Going forward, Edegel expects that it will count on sufficient natural gas capacity for the combinedcycle Ventanilla plant and part of Santa Rosa. In addition, in 2009 Edegel extended the contract for transportation and distribution from August 2019 to2025 at a level of 2.1 million m3/d.
41

Table of Contents
In August 2010, TGP awarded 0.5 million m3/d in firm transport capacity to Edegel from August 2010 until the end of 2019, in the TGP 14th openseason.
In August 2010, the authority published regulation that enables the secondary market for transport and supply of natural gas.
PHYSICAL GENERATION AND PURCHASES IN PERU (GWh) (1)
Year ended December 31,2009 2010 2011
(GWh) % (GWh) % (GWh) %Electricity generation 8,163 96.0 8,466 96.5 9,153 95.1Electricity purchases 337 4.0 305 3.5 469 4.9Total(1) 8,499 100.0 8,771 100.0 9,622 100.0
(1) Electricity generation plus electricity purchases differ from electricity sales due to transmission losses, as power plant consumption and technicallosses have already been deducted.
The Sistema Eléctrico Interconectado Nacional (SEIN in its Spanish acronym), is the only interconnected system in Peru. Electricity sales in theSEIN increased 7.5% during 2011 compared to 2010, reaching total annual sales of 31,775 GWh.
The distribution of Edegel’s physical sales, in terms of customer segment, is shown in the following table:
PHYSICAL SALES PER CUSTOMER SEGMENT IN PERU (GWh)
Year ended December 31,2009 2010 2011
Sales(GWh)
% ofSales
VolumeSales
(GWh)
% ofSales
VolumeSales
(GWh)
% ofSales
VolumeContracted sales (1) 7,565 90.9 7,550 87.8 8,632 91.3Non−contracted sales 755 9.1 1,049 12.2 818 8.7Total electricity sales 8,321 100.0 8,598 100.0 9,450 100.0
(1) Includes sales to distributors without contracts.
During 2011, Edegel had five regulated customers. Edegel has had contracts since 1997 with Luz del Sur and Edelnor, our distribution company. Edegel also won the bids launched by other distributors during 2006 and 2007. The company has eleven unregulated customers. Sales to unregulatedcustomers represented 30.0% of Edegel’s total contracted sales in 2011.
During 2011, only one long−term tender was called in Peru by the distributor Luz del Sur. The distributors participating in the process were Luz delSur, Edelnor and Edecañete. The period tendered was 2018−2027, with an energy requirement of approximately 2,500 GWh/year. An amount of 2,245GWh were granted to Cerro del Águila, Celepsa, Egesur, Enersur and Fenix. The remaining 255 GWh were declared void.
42

Table of Contents
The following table sets forth our sales by volume to our largest customers in Peru for each of the periods indicated:
MAIN CUSTOMERS IN PERU (GWh)
Year ended December 31,2009 2010 2011
ContractedSales
(GWh)
% ofcontracted
Sales
ContractedSales
(GWh)
% ofcontracted
Sales
ContractedSales
(GWh)
% ofcontracted
SalesDistribution companies:Edelnor (Regulated) (1) 2,663 35.2 4,072 53.9 4,173 48.3Luz del Sur (Regulated) (1) 949 12.5 917 12.1 1,539 17.8ElectroSurMedio 128 1.7 112 1.5 150 1.7SEAL 56 0.7 169 2.2 99 1.1Total sales to our largest distribution
companies 3,795 50.2 5,270 69.8 5,960 69.1
Unregulated customers:ElectroPerú (2) 1,821 24.1 — — — —Refinería Cajamarquilla 614 8.1 974 12.9 1,320 15.3Antamina 652 8.6 668 8.9 708 8.2Siderúrgica del Perú 253 3.3 263 3.5 288 3.3Creditex — — 5 0.1 78 0.9Total sales to our largest unregulated
companies 3,339 44.1 1,910 25.3 2,394 27.7Total sales to our largest customers 7,135 94.4 7,180 95.1 8,354 96.8
(1) The figures for Edelnor and Luz del Sur represent sales under bilateral contracts with Edegel only, and not withdrawals of these companies assigned toEdegel for non contract−related consumption. The energy sold to these distributors includes the amount granted to Edegel in the bids realized since 2006.
(2) Since 2006, ElectroPerú has been a customer of Edegel due to a merger with Etevensa. The contract with ElectroPerú expired in September 2009.
Our most important competitors in Peru are Enersur (GDF−Suez group, with an installed capacity of 1,011 MW); ElectroPerú (state−ownedcompetitor, with an installed capacity of 964 MW); Egenor (Duke Energy Group, with an installed capacity of 635 MW); and Kallpa (Inkia Energy group,with an installed capacity of 578 MW).
Electricity Transmission Business Segment
CIEN
CIEN is wholly−owned by Endesa Brasil, and we hold a 54.3% economic interest in CIEN. CIEN consolidates CTM and TESA, which operate theArgentine side of the interconnection line between Argentina and Brazil. CIEN represented 0.9% of our 2011 operating revenues and 1.0% of our operatingincome, both before consolidation adjustments. Since April 2011, CIEN has been recognized by the local authority as a “regulatory asset,” and therefore aparticipant in the basic Brazilian grid. Therefore, it will receive fixed payments called Permitted Annual Compensation (RAP in its Brazilian acronym).
CIEN allows for the energy integration of Mercosur and the import and export of electricity between Argentina, Uruguay and Brazil. It has twotransmission lines covering a distance of 500 kilometers between Rincón in Argentina and the Santa Catarina substation in Brazil, and a total installedcapacity of 2,100 MW.
Electricity Distribution Business Segment
Our electricity distribution business is conducted in Chile through Chilectra, in Argentina through Edesur, in Brazil through Ampla and Coelce, inColombia through Codensa and EEC, and in Peru through Edelnor. For the year ended December 31, 2011, our distribution subsidiaries sold 69,552 GWhof electricity. For more information on energy sales by our distribution subsidiaries for the past five fiscal years, see “Item 3. Key Information — A.Selected Financial Data.” Currently, Chilectra is the technical operator of Edesur, Edelnor, Ampla and Coelce, but does not receive operator fees.
43

Table of Contents
Chilectra
Chilectra is one of the largest electricity distribution companies in Chile in terms of the number of the regulated clients, distribution assets and energysales. Chilectra had consolidated operating income of Ch$ 120 billion for the year ended December 31, 2011. Our interest in Chilectra is 99.1%. Chilectraoperates in a concession area of 2,118 square kilometers. Chilectra transmits and distributes electricity in 33 municipalities of the Metropolitan Region. Itsservice area is defined primarily as a high density area under the Chilean tariff regulations governing electricity distribution companies and includes allresidential, commercial, industrial, governmental, and toll customers. The Metropolitan Region, where the capital city of Santiago is located, is Chile’smost densely populated area and has the highest concentration of industries, industrial parks and office facilities in the country. As of December 31, 2011,Chilectra distributed electricity to approximately 1.6 million customers. Chilectra also has direct equity stakes in foreign distribution subsidiaries controlledby us. Chilectra’s energy losses were 5.5% in 2011, compared to 5.8% in 2010. This decrease in energy losses is due to the effectiveness of energy lossplans focused on technical inspections and loss management, among others.
For the fiscal year ended December 31, 2011, residential, commercial, industrial and other customers, who are primarily public and municipal,represented 26%, 27%, 23% and 25%, respectively, of Chilectra’s total energy sales of 13,697 GWh, an increase of 4.6% in comparison with 2010. For theyear ended December 31, 2011, revenues from electricity sales were Ch$ 936 billion. Total energy purchases reached Ch$ 728 billion, of which Ch$ 191billion were from Endesa Chile, a decrease in comparison with 2010, when Ch$ 306 billion were purchased from Endesa Chile.
Edesur
Edesur is the second largest electricity distribution company in Argentina in terms of energy purchases after Edenor, an unrelated company. Oureconomic interest in Edesur is 65.4%. Edesur operates in a concession area of 3,309 square kilometers. Edesur distributes electricity in the south−centralpart of the greater Buenos Aires metropolitan area. Its service area comprises the major business district of Buenos Aires and several residential areas of thesouthern part of Buenos Aires. As of December 31, 2011, Edesur distributed electricity to 2.4 million customers. Residential, commercial, industrial andother customers, primarily public and municipal, represented 42%, 26%, 8% and 24%, respectively, of Edesur’s total energy sales. It had energy losses of10.5% in 2011, the same as in 2010. For the year ended December 31, 2011, revenues from electricity sales amounted to Ch$ 252 billion. In 2011,Edesur’s physical energy sales amounted to 17,233 GWh. Total energy purchases were Ch$ 141 billion.
Ampla
Ampla is the second largest electricity distribution company in the State of Rio de Janeiro, Brazil in terms of the number of clients and annual energysales. As of December 31, 2011, we owned a 70.2% economic interest in Ampla. Ampla is engaged mainly in the distribution of electricity to 66municipalities of the State of Rio de Janeiro and serves 2.6 million customers in a concession area of 32,615 square kilometers, with an estimated populationof 8.0 million. As of December 31, 2011, residential, commercial, industrial and other customers represented 38%, 18%, 12% and 32%, respectively, ofAmpla’s total sales of 10,223 GWh. For the year ended December 31, 2011, revenues from electricity sales amounted to Ch$ 901 billion. As ofDecember 31, 2011, Ampla’s energy losses were 19.7%, compared to 20.5% in 2010. Total energy purchases were Ch$ 368 billion.
Coelce
We hold a 35.3% economic interest in Coelce, the sole electricity distributor in the State of Ceará, in northeastern Brazil. As of December 31, 2011,Coelce served over 3.2 million customers within a concession area of 148,825 square kilometers. During 2011, Coelce had annual sales of 8,970 GWh, anincrease of 1.4% in comparison with 2010. Revenues from electricity sales represented Ch$ 760 billion.
As of December 31, 2011, residential, commercial, industrial and other customers represented 34%, 19%, 14% and 33%, respectively, of Coelce’s totalenergy sales. As of such date, Coelce’s energy losses were 11.9%, compared to 12.1% in 2010. Total energy purchases were Ch$ 336 billion, 37% of whichwere purchased from Endesa Fortaleza and the other 63% from CCEARs.
Codensa
We hold a 21.7% economic interest in Codensa, and due to a transfer of rights from another Endesa Spain subsidiary we appoint the majority of theBoard members and control this company. Codensa is an electricity distribution company that serves a concession area of 14,087 square kilometers inBogotá and 96 other municipalities in the Department of Cundinamarca, Tolima and Boyacá. More than 9.6 million people live in Codensa’s service area,where it serves approximately 2.5 million customers. For the year ended December 31, 2011, revenues from electricity sales amounted to Ch$ 645 billion. During 2011, Codensa’s annual sales reached
44

Table of Contents
12,552 GWh, an increase of 3.4% in comparison with 2010. Of these sales, residential, commercial, industrial and other customers represented 35%, 16%,7% and 42%, respectively.
Since 2001, Codensa only services regulated clients. The unregulated market is serviced directly by our generation company, Emgesa, with theexception of the public lighting in Bogotá. In 2011, Codensa had energy losses of 7.8%, versus 8.2% in 2010. Total energy purchases were Ch$ 327billion, 32.9% of which were purchased from Emgesa and 67.1% from other suppliers.
EEC
In 2009, the Colombian government awarded DECSA an 82% shareholding in EEC. Codensa owns 49% of DECSA. EEC is an electricity distributioncompany that serves a concession area of 5,186 square kilometers in the Department of Cundinamarca. It serves approximately 121 thousand customers. For the year ended December 31, 2011, revenues from electricity sales amounted to Ch$ 32 billion. EEC’s annual sales reached 305 GWh, an 18.2%decrease compared to 2010, and energy losses reached 20.2%, compared to 17.7% in 2010. Total energy purchases were Ch$ 11 billion.
Edelnor
As of December 31, 2011, we owned a 57.5% economic interest in Edelnor, our Peruvian electricity distribution company. Edelnor operates in aconcession area of 2,440 square kilometers. For the year ended December 31, 2011, the company had revenues from electricity sales of Ch$ 303 billion. Edelnor has an exclusive concession to distribute electricity in the northern part of the Lima metropolitan area, some provinces of the Lima department,such as Huaral, Huaura, Barranca and Oyón, and in the adjacent province of Callao. As of December 31, 2011, Edelnor distributed electricity toapproximately 1.1 million customers, an increase of 4.2% from December 31, 2010. For the year ended December 31, 2011, Edelnor had total energy salesof 6,572 GWh, an increase of 7.3% over 2010. Edelnor had energy losses of 8.2% in 2011, compared to 8.3% in 2010. Total energy purchases reachedCh$ 173 billion, of which Ch$ 116 billion was from the related parties Edegel and EEPSA.
Non−Electricity Businesses
Inmobiliaria Manso de Velasco (IMV)
IMV, a wholly−owned subsidiary, develops real estate projects in Chile and represents less than 0.2% of our 2011 operating revenues beforeconsolidation adjustments.
ELECTRICITY INDUSTRY REGULATORY FRAMEWORK
Chile
Industry Overview
Industry Structure
The Chilean electricity industry is divided into three business segments: generation, transmission and distribution. These business segments arecarried out by publicly−owned private sector companies. The state’s role is circumscribed to regulation, supervision and indicative investment planningthrough non−binding recommendations in the case of the generation and transmission businesses.
45

Table of Contents
The following chart shows the relationships among the various actors in the Chilean market:
The generation segment comprises a group of electricity companies who own generating plants, which energy is transmitted and distributed to endconsumers. This segment is characterized by being a competitive market which operates under market−driven conditions. They sell their production todistribution companies, unregulated customers, other generation companies, and their surpluses on the spot market.
The transmission system comprises a combination of lines, substations and equipment for the transmission of electricity from the production points(generators) to the centers of consumption or distribution. Transmission in Chile is defined as lines or substations with a voltage or tension higher than23 kV. The transmission system is open access and transmission companies may impose rights of way over the available transmission capacity through thepayment of tolls.
The distribution segment is defined for regulatory purposes as all electricity supplies to end users at a voltage no higher than 23 kV. Distributioncompanies operate under a distribution public utility concession regime, with service obligation and regulated tariffs for supplying regulated customers.
The distribution companies supply both regulated customers, whose demand is less than 500 kW, a segment for which the price and supply conditionsare the result of tender processes regulated by the government’s National Energy Commission, and unregulated customers, with bilateral agreements withthe generators, whose conditions are freely negotiated and agreed.
Consumers are classified according to the size of demand, as follows: i) unregulated customers, those with a connected capacity over 2,000 kW;ii) regulated customers, whose connected capacity is no more than 2,000 kW; and iii) customers that opt for either a regulated−tariff or an unregulatedregime, for a minimum period of four years in each regime, available to consumers whose connected capacity falls in the range of 500 kW−2,000 kW.
In Chile, there are four separate interconnected electricity systems. The main systems that cover the most populated Chilean areas are the SIC, whichservices the central and south central part of the territory, where 93% of the Chilean population lives, and the SING, which operates in the northern part ofthe country, where most of the mining industry is located, and where 6% of the Chilean population lives. In addition to the SIC and the SING, there are twoisolated systems in southern Chile that provide electricity in remote areas, where 1% of the population lives.
The operation of electricity generation companies in each of the two major interconnected electricity systems is coordinated by their respectivedispatch center, or CDEC, an autonomous entity that involves generators, transmission companies and large customers. A CDEC coordinates the operationof its system with an efficiency criterion in which the lowest marginal cost producer is usually required to satisfy demand at any moment in time. As aresult, at any specific level of demand, the appropriate supply will be provided at the lowest possible production cost available in the system. The marginalcost used is the price at which generators trade energy on an hourly basis, involving both their injections into the system and their withdrawals or purchasesfor supplying their customers.
46

Table of Contents
Principal Regulatory Authorities
The Ministry of Energy develops and coordinates plans, policies and standards for the proper operation of the sector, approves tariffs and node pricesset by the CNE, and regulates the granting of concessions to electricity generation, transmission and distribution companies.
The Chilean National Energy Commission (CNE in its Spanish acronym) is the technical entity in charge of defining prices, technical standards andregulatory requirements.
The Superintendency of Electricity and Fuels (SEF) monitors the proper operation of electricity, gas and fuel sectors in compliance with the law interms of safety, quality, and technical standards.
The Ministry of the Environment is responsible for the development and application of regulatory and policy instruments that allow the protection ofnatural resources, the promotion of environmental education and the control of pollution, among other matters. It is also responsible for administering theenvironmental impact assessment system at the national level, coordinating the preparation of environmental standards and establishing the programs forcompliance with the standards.
The Anti−Trust Entities are responsible for preventing, investigating and correcting any threats to free market competition and any anti−competitivepractices by companies in a monopoly position. These entities include:
• Free−Market Competition Tribunal (TDLC in its Spanish acronym). This is a special and independent jurisdictional entity, subject to the directive,correctional and economic authority of the Supreme Court, whose function is to prevent, correct and sanction threats to free−market competition.
• National Economic Attorney (FNE in its Spanish acronym). This is the attorney general in economic matters and is responsible for investigating andprosecuting all anti−trust conduct before the Resolutory Commission and other tribunals.
• The Panel of Experts acts as a tribunal in electricity matters arising from disputes between participants in the electricity market and the authority incertain tariff processes. It issues enforceable resolutions and comprises experts in industry matters, five engineers or economists and two lawyers, all ofwhom are elected every six years by the Free−Market Competition Tribunal.
• There are also other entities related to the energy sector: the Chilean Nuclear Energy Committee in charge of research, development, use and controlof nuclear energy, and the Chilean Energy Efficiency Agency, in charge of promoting energy efficiency.
The Electricity Law
General
Since its inception, the Chilean electricity industry has been developed by private sector companies. Nationalization was carried out during the period1970−73. During the 1980s, the sector was reorganized through the Electricity Law or Decree with Force of Law #1 (DFL 1), allowing participation ofprivate capital in the electricity sector. By the end of the 1990s, foreign companies had a majority participation in the Chilean electricity system.
The goal of the Chilean Electricity Law is to provide incentives to maximize efficiency and to provide a simplified regulatory scheme andtariff−setting process which limits the discretionary role of the government by establishing objective criteria for setting prices. The expected result is aneconomically efficient allocation of resources. The regulatory system is designed to provide a competitive rate of return on investment to stimulate privateinvestment, while ensuring the availability of electricity to all who request it.
DFL 1 was published in 1982 and has had only two important changes. The first one took place in 2004 to encourage investments in transmissionlines. The second one was in 2005 to create long−term contracts between generation and distribution companies as part of a bid process.
The present text of the law was restated in DFL No 4 of 2006, which is complemented with a series of regulations and standards.
47

Table of Contents
Limits and Restrictions
The owners of the main transmission system must be constituted as limited liability stock companies and cannot take part in the electricity generationor distribution businesses.
Individual participation in the main transmission system (“STT”) by companies operating in another electricity or unregulated customer segmentcannot exceed, directly or indirectly, 8% of the total investment of the STT. The combined participation of such agents in the STT must never exceed 40%of the investment value.
The water utility services law also sets restrictions on overlapping in electricity distribution company concession areas with those of water distributionand sewage services.
There are no special or specific restrictions on generating activity in terms of market concentration.
Regulation of Generation Companies
Concessions
The law permits generation activity without a concession. However, companies may apply for a concession to facilitate access to third−partyproperties. Third−party property owners are entitled to compensation, which may be agreed to by the parties or, if there is no agreement, it may bedetermined by an administrative proceeding that may be appealed in the Chilean courts.
Dispatch and Pricing
In each transmission system, the pertinent CDEC coordinates the operations of generation companies, in order to minimize the operating costs in theelectricity system and monitor the quality of service provided by the generation and transmission companies. Generation companies satisfy their contractualsales requirements with dispatched electricity, whether produced by them or purchased from other generation companies in the spot market.
Sales by Generation Companies to Unregulated Customers
Sales by generation companies may be made to final unregulated customers or to other generation companies under freely negotiated contracts. Tobalance their contractual obligations with their dispatch, generators have to trade deficit and surplus electricity at the spot market price, which is set hourlyby each CDEC, based on the marginal cost of production of the next kWh to be dispatched.
Sales to Distribution Companies and Certain Regulated Customers
Prior to 2005, sales to distribution companies for resale to regulated customers were made through contracts at regulated prices set by CNE (nodeprices) in effect at the relevant locations (or nodes) on the interconnected system through which such electricity was supplied. Since 2005, all new contractsbetween generation and distribution companies for the electricity supply to regulated customers must arise from international bids which have a maximumoffer energy price based on the average price paid by the unregulated customers at the time that the bid takes place, which is calculated twice a year by theCNE. If a first bid is unsuccessful, authorities may increase this maximum price by an additional 15%. The bids are awarded on a minimum price basis. The average prices associated with these bids are transferred directly to end users, replacing the regulated node price regime. During the term of thecontracts, the energy and capacity prices are indexed according to formulas set forth in the bid documentation and linked to fuel, investment and other costsof energy generation. Under the bid system, all distribution companies have separate electricity contracts for their regulated and unregulated customerssince 2010.
Sales of Capacity to Other Generation Companies
Each CDEC determines a firm capacity for each power plant on an annual basis. Firm capacity is the highest capacity which a generator may supplyto the system at certain peak hours, taking into consideration statistical information regarding the time that it is out of service for maintenance and extremelydry conditions for the operation of hydroelectric plants.
A generation company may be required to purchase or sell capacity in the spot market, depending upon its contractual requirements in relation to theamount of electricity to be dispatched from such company and to its firm capacity.
48

Table of Contents
Regulatory Charges
Chilean laws have not established any specific charge for the electric system. Nevertheless, if the tariff for residential customers increases by morethan 5% in a six−month period the government can establish a subsidy for low−income families. The last subsidy was granted by the government in 2009.
Incentives and Penalties
If a rationing decree is enacted in response to prolonged periods of electricity shortages, strict penalties may be imposed on generation companies thatcontravene the decree. A severe drought is not considered a force majeure event.
Generation companies may also be required to pay fines to the regulatory authorities, related to system blackouts due to any generator’s operationalmistake, including failures related to the coordination duties of all system agents, as well as to make compensatory payments to electricity consumersaffected by shortages of electricity. If generation companies cannot satisfy their contractual commitments to deliver electricity during periods when arationing decree is in effect and there is no energy available to purchase in the system, the generation company must compensate the customers at the failurecost determined by the authority in each tariff setting. This failure cost, which is updated semiannually by the CNE, is a measurement of how much finalusers would pay for one extra MWh under rationing conditions.
Regulation of Distribution Companies
Concessions
Distribution service concessions give the right to use public areas for building distribution lines. The concessions are given by the Ministry of Energyfor an undefined period. Distribution companies have the obligation to serve and connect the customers that make the requirement in the concession area. The Chilean President can declare a concession expired if the quality of service does not meet certain minimum standards.
Energy Purchases
The first international auction for the supply to distribution companies’ regulated customers took place in 2006. Chilectra submitted bids inNovember 2006, July 2007 and March 2008, allocating 100% of the power requirements tendered for the 2010−2025 period. Prices obtained by Chilectraas part of these tenders are consistent with the system’s long−term expansion technology and prices are indexed to the CPI, the price of coal and LNG.
During 2010, Chilectra submitted bids for the power requirements tendered for the 2014 — 2029 period, allocating 90% of them. A new biddingprocess during 2012 is under assessment for the remaining power requirements. With the 2012 bid, Chilectra is expected to meet the demand of itsregulated customers through 2016.
Distribution Tariffs to Final Customers
The tariffs charged by distribution companies to final customers are determined by the sum of the cost of electricity purchased by the distributioncompany, a transmission charge and the value added from distribution of electricity (“VAD”), which allows distribution companies to recover theiroperating costs and includes a return on investment. The price for both generation and distribution capacity sold to customers includes a factor whichreflects the simultaneous contribution of each customer to peak capacity demand of the system as a whole. The transmission charge reflects the cost paidfor electricity transmission and transformation.
The VAD is based on a “model company” and includes the following: selling, general and administrative distribution costs; maintenance and operatingcosts of distribution assets; cost of efficient energy losses; and an expected return on investment, before taxes, of 10% per year in real terms based on thereplacement cost of assets used for the distribution business.
Toward this end, the CNE selects a real distribution company, to which it applies efficiency guidelines which result in a cost structure for ahypothetical “model company” for each Typical Distribution Area (“TDA”,) as described below. The rate is not based on actual costs incurred by any givendistribution company, but on investment, operating, maintenance and general administrative standards and overall efficiency of operations for the modelcompany.
49

Table of Contents
Distribution Tariff−Setting Process
The VAD is set every four years. The CNE classifies companies into groups, according to the TDA, based on economic factors that group companieswith similar distribution costs due to population density, which determines equipment requirements in the network.
The real return on investment for a distribution company depends on its actual performance relative to the standards chosen by the CNE for the modelcompany. The tariff system allows for a greater return to distribution companies that are more efficient than the model company. Tariff studies areperformed by the CNE and distribution companies. Preliminary tariffs are calculated as a weighted average of the results of the CNE−commissioned studyand the companies’ study, with the results of the CNE’s study bearing twice the weight of the companies’ study. Preliminary tariffs are then tested to ensurethat they provide an average actual annual internal rate of return between 6% and 14% of the replacement cost of electricity−related distribution assets forthe entire business sector.
The last tariff−setting process for distribution companies was held in 2008 and will be in effect until November 3, 2012.
Associated electrical services
Along with the VAD rate process for 2008, the CNE published a report on ancillary electrical services, which includes items such as meter rental anddisconnection and reconnection of electricity to the final customer. Final rates were published on December 4, 2009 after receiving comments from agents,generation, transmission and distribution companies. A new study will be held in 2012.
Incentives and Penalties
Distribution companies may be required to compensate final customers if there are shortages of electricity that exceed the authorized standards. Thesecompensatory payments shall be at an amount equal to double the non−supplied energy at a value equivalent to the failure cost.
Regulation in Transmission
The main transmission system consists of 220 kV or higher voltage lines that are used by generators and consumers. Every four years a study is doneto evaluate the existing system and to define the expansion plan. On December 31, 2010 the last study was delivered to the CNE. In November 2011 theCNE promulgated Decree 61 that defines the current value of the existing lines to be remunerated in the 2011−2014 period. The main transmission systemis paid by generators and customers.
According to the modifications to the General Electricity Services Law incorporated in Law 19,940 of March 2004, the transportation of electricity bymain transmission systems and sub−transmission systems is carried out by a public electricity utility. Therefore, the transmitter has a service obligation, andis responsible for investment in new lines and their expansion.
Regulation in Subtransmission
Subtransmission systems are defined as voltage lines exceeding 23 kV. There are seven subtransmission systems defined by decree. Thesubtransmission systems are paid mainly by customers according to the values fixed by decree of the Ministry of Energy. Generators and unregulatedcustomers pay only for the lines they use in each system. The study to define the current value of the existing lines to be remunerated in the 2011−2014period has been done, however, as of the date of this Report, the CNE has not promulgated the corresponding decree.
Environmental Regulation
The Chilean Constitution grants citizens the right to live in a pollution−free environment. It further provides that certain other constitutional rightsmay be limited in order to protect the environment. Chile has numerous laws, regulations, decrees and municipal ordinances that address environmentalconsiderations. Among them are regulations relating to waste disposal (including the discharge of liquid industrial wastes), the establishment of industriesin areas in which they may affect public health, and the protection of water for human consumption.
Environmental Law No. 19,300 was enacted in 1994 and implemented by several rules, such as the Environmental Impact Assessment SystemRule issued in 1997 and modified in 2001. This law requires companies to conduct an environmental impact study and a declaration of any futuregeneration or transmission projects.
50

Table of Contents
In January 2010, Law No. 19,300 was modified by Law No. 20,417, which introduced changes in the environmental assessment process and in thepublic institutions involved, principally creating the Ministry of the Environment. Consequently, the environmental assessment process is coordinated bythis entity and the Environmental Assessment Service.
On April 1, 2008, Law No. 20,257 was enacted, and amended the General Services Law. The purpose of the amendment is to promote the use ofNon−Conventional Renewable Energy (NCRE). This law defines the different types of technologies considered as NCRE, and establishes the obligation forgenerators, between 2010 and 2014, to supply at least 5% of the total energy contracted as of August 31, 2007, to be of such type, and to progressivelyincrease this percentage 0.5 percentage points annually up to at least 10% as of 2024. Currently, our power plants recognized as NCRE generators are thePalmucho and Canela wind farms and Ojos de Agua. Additionally, the law sets forth fines for the generators that do not comply with this obligation. Enersis fully complied with this obligation during 2011. The additional cost of generating with NCRE is being charged as a pass−through in the newcontracts, thus eliminating an impact to our revenues.
In January 2011, Decree 13 of the Ministry of the Environment was published in the Diario Oficial, a governmental publication, defining emissionstandards for thermoelectric plants applicable to generation units of at least 50 MW. The object of this regulation is to control atmospheric emissions ofparticulate matter (MP), nitrogen oxides (NOx), sulfur dioxide (SO2) and mercury (Hg), in order to prevent and protect the health of the population andprotect the environment. Existing emission sources will have to meet emission limits for MP as established in the regulation within two and a half yearsfrom the date of publication of this decree (i.e. July 2013); for SO2 and NOx emissions, the term is four years in highly polluted areas and five yearselsewhere.
Water Rights
Our subsidiary Endesa Chile owns unconditional, absolute and perpetual property water rights granted by the Chilean Water Authority. Companies inChile must pay an annual fee for unused water rights. License fees already paid may be recovered through monthly tax credits commencing on the start−update of the project associated with the water right considered. The maximum license fees to be recovered are those paid during the eight years before thestart−up date. As of the date of this Report, Enersis’ subsidiaries have not recovered any license fees already paid. During 2011, we paid Ch$ 2,870 millionfor 2010 unused water rights located in the SIC area. This amount may vary in the future according to the actual water rights we may hold each year. Enersis’ subsidiaries continuously analyze which water rights it will maintain, disregard or acquire. We estimate that in 2012 we will pay fees for anaggregate of Ch$ 5,737 million. The increase in 2012 is due to the water rights law, which requires a doubling of the annual fee starting as of 2011. Afterthat, the fees remain flat for five years, at which point they double again. In the case of water rights located in the extreme south of Chile, outside the areacomprised by the SIC, the license fees will be paid starting as of January 1, 2012. In this area, Endesa Chile owns water rights over the Futaleufú River.
Argentina
Industry Overview
Industry Structure
In theWholesale Electricity Market (MEM in its Spanish acronym) there are four categories of local agents (generators, transmitters, distributors andlarge customers) and foreign agents (traders of generation and traders of demand) who are allowed to buy and sell electricity as well as related products.
51

Table of Contents
The following chart shows the relationships among the various actors in the MEM:
The generation sector is organized on a competitive basis, with independent generators selling their output on the MEM’s spot market or throughprivate contracts to purchasers on the MEM’s contract market or to CAMMESA through special transactions like contracts under Resolutions SE 220/2007and 724/2008.
Transmission functions under monopoly conditions and is comprised of several companies to whom the Federal Government grants concessions. Oneconcessionaire operates and maintains the highest voltage facilities and eight concessionaires operate and maintain high and medium voltage facilities, towhich generation plants, distribution systems and large customers are connected. The international interconnected transmission systems also requireconcessions granted by the Secretariat of Energy. Transmission companies are authorized to charge different tolls for their services.
Distribution is a public service that functions under monopoly conditions and is provided by companies who have also been granted concessions. Distribution companies have the obligation to make electricity available to end customers within a specific concession area, regardless of whether thecustomer has a contract with the distributor or directly with a generator. Accordingly, these companies have regulated tariffs and are subject to qualityservice specifications. Distribution companies may obtain electricity either in the MEM’s spot market, at a price called “seasonal price,” or in the MEM’sterm market through private contracts with generators. The “seasonal price,” defined by the Secretariat of Energy, is the cap for the costs of electricitybought by distributors and passed through to regulated customers.
There are three electricity distribution areas subject to federal concessions. The concessionaires are Edelap, Edesur and Edenor which are located inthe cities of La Plata (Edelap, an unrelated company) and Buenos Aires and Greater Buenos Aires area (Edesur, which is controlled by us, and Edenor,which is not). The local distribution areas are subject to concessions granted by the provincial or municipal authorities. However, all distributioncompanies acting in the MEM must operate under its rules.
Regulated customers are supplied by distributors at regulated tariffs, unless they have a minimum capacity demand of 30 kW, in which case they canchoose to contract their supply directly from generators in the MEM’s spot market, becoming “Large Customers” who may freely negotiate their prices withgenerating companies.
“Large Customers” are classified into three categories: Major Large Customers, Minor Large Customers and Particular Large Customers. Each ofthese categories of users has different requirements with respect to purchases of their energy demand. For example, Major Large Customers are required topurchase 50% of their demand through supply contracts and the remainder in the spot market, while Major Large Customers and Particular Large Customersare required to purchase all of their demand through supply contracts. Large customers participate in CAMMESA by appointing two acting and twoalternate directors through the Asociación de Grandes Usuarios de Energía Eléctrica de la República Argentina (Argentine Association of Electric PowerLarge Customers, or AGUEERA in its Spanish acronym).
52

Table of Contents
There is one interconnected system, the Argentine SADI, and smaller systems that provide electricity to specific areas. According to the ArgentineNational Institute of Statistics and Census (INDEC), 97.7% of the population received electricity through the public network in 2010, 1.1% from their owngeneration and 1.2% had no access to electricity.
Principal Regulatory Authorities
The Ministry of Federal Planning, Public Investment and Services, through the Secretariat of Energy, is primarily responsible forstudying andanalyzing the behavior of energy markets, preparing the strategic planning with respect to electricity, hydrocarbons and other fuels, promoting policies ofcompetition and efficiency in the assignment of resources, leading actions for applying the sector policy, orienting the adoption process of the new operatorsto the general interest, respecting the rational exploitation of the resources and the preservation of the environment.
The Electricity National Regulatory Agency (ENRE in its Spanish acronym) carries out the measures necessary for meeting national policy objectiveswith respect to the supply, transmission and distribution of electricity. Its principal objectives are to adequately protect the rights of users, promotecompetitiveness in production and encourage investments that assure long−term supply, promote free access, non−discrimination and the generalized use ofthe transmission and distribution services, and regulate transmission and distribution services to ensure fair and reasonable tariffs, encourage privateinvestment in production, transmission and distribution, ensuring the competitiveness of the markets where possible.
The Administrative Company for the Wholesale Electricity Market (CAMMESA in its Spanish acronym) has as its principal functions thecoordination of dispatch operations, the responsibility for the establishment of wholesale prices and the administration of economic transactions madethrough the SIN. It is the entity responsible for executing the economic dispatch to contribute economic considerations and rationality in the administrationof the energy resource, for coordinating the centralized operation of the SIN to guarantee security and quality, and administer the MEM, ensuringtransparency through the participation of all the players involved and with respect to the respective regulations.
The Federal Electricity Council has as its principal functions the following: i) administer specific funds for the electricity sector and ii) advise thenational executive authority and the provincial governments with respect to the electricity industry, the priorities in performing studies and works,concessions and authorizations, and prices and tariffs in the electricity sector. It advises regarding modifications resulting from legislation referring to theelectricity industry.
The Electricity Law
General
The Argentine electricity industry was originally developed by private companies. Starting in the 1950s and as a result of service problems, thegovernment intervened the sector and a nationalization process was begun. Law 15,336/60 was passed to organize the sector and establish the federal legalframework for the start of major transmission and generation works. Various state companies were created within this framework in order to carry outvarious hydroelectric and nuclear projects.
As a result of the supply crisis of 1989, the following laws were passed starting in 1990: Law 23,696 (State Reform), Law 23,697 (EconomicEmergency) and Law 24,065 (Electricity Framework).
The objective of the change introduced was essentially to replace a model based on the vertically−integrated and centrally−planned state monopolywith a competitive system based on the market and indicative planning.
Regulatory Developments: the industry after the Public Emergency Law
Law 25,561, the Public Emergency Law, was enacted in 2002 to manage the public crisis which began that year. It forced the renegotiation of publicservice contracts (such as electricity transmission and distribution concession contracts) and imposed the conversion of dollar denominated obligations intoArgentine pesos at a pegged rate of Ar$ 1 per $ 1. The mandatory conversion of transmission and distribution tariffs from dollars to Argentine pesos at thispegged rate, when the market exchange rate had been approximately Ar$ 3 per $ 1, and the regulatory measures to cap and reduce the spot and seasonalprices, hindered the pass−through of generation variable costs into the tariffs to end customers.
The Public Emergency Law also empowered the Federal Government to implement additional monetary, financial and exchange measures to overcomethe economic crisis in the medium term. These measures have been periodically extended. Law 26,563, enacted in December 2009, extended the measuresuntil December 31, 2011.
53

Table of Contents
The Secretariat of Energy introduced several regulatory measures aimed at correcting the effects of the devaluation into the MEM’s costs and pricesand to reduce the price to be paid by the end customers.
Resolution SE 240/2003 changed the way to fix spot prices, decoupling such prices from the marginal cost of operation. Until this resolution, spotprices on the MEM were typically fixed by units operating with natural gas during the warm season (from September through April) and units operatingwith fuel/diesel in the winter (May−August). Then, due to restrictions on natural gas supply, winter prices were higher, and related to imported fuels pricedin dollars. Resolution SE 240/2003 seeks to avoid the pegged price indexation to the dollar and, although generation dispatch is still based on actual fuelsused, the calculation of the spot price under the resolution is defined as if all dispatched generation units did not have the existing restrictions on natural gassupply. Water value is not considered if its opportunity cost is higher than the cost of generating with natural gas. The resolution also set a cap on the spotprice at Ar$ 120/MWh, which was still valid during 2011. The real variable costs of thermal units burning liquid fuels were paid by CAMMESA throughthe Transitory Additional Dispatch Cost (Sobrecosto transitorio de despacho, or STD in its Spanish acronym) plus a margin of Ar$ 2.5/MWh, according tothe Notes SE 6,866 of 2009 and 6,169 of 2010, valid from May 2010 until December 2011.
The government avoided the increase in electricity tariffs to end customers and seasonal prices were maintained substantially fixed in Argentine pesos,although gas producers received price revisions by the authority, recovering part of the value that they lost with the 2002 devaluation.
In this scenario, CAMMESA sells energy to distributors who pay seasonal prices, and buys energy from generators at spot prices that recognize risinggas prices at a contractual price defined by the instructions of the Secretariat of Energy. To overcome this imbalance, the authority — through ResolutionSE 406/2003 — only allows payments to generators for amounts collected from the purchasers in the spot market. This resolution set a priority of paymentfor different services: capacity payment, fuel cost and energy sales margin, among others. CAMMESA accumulates debt with generators, and the systemgives a misleading price signal to the agents by not encouraging savings in electricity consumption or investments to satisfy the growth in electricitydemand, including investments in transmission capacity. Additionally, generators suffer a reduction of estimated income from contract prices because theyare reduced as a consequence of the spot price level.
This decision to freeze tariffs is being reversed gradually by the government. During 2011, the formal commencement of the elimination of electricityand natural gas subsidies was authorized through various resolutions. For further details, see “Sales to Distribution Companies and Certain RegulatedCustomers.”
In order to enhance the energy supply, the Secretariat of Energy created different schemes to sell “more reliable energy.” Resolution 1,281/2006created the Energy Plus Service, which is the offer of new electricity capacity to supply the growth in electricity demand, over the “Base Demand,” whichwas the demand for electricity in 2005.
Resolutions SE 220/2007 and 724/2008 give thermal generators the opportunity to reduce some of the adverse effects of Resolution SE 406/2003 byentering into MEM Supply Commitment Contract, or “CCAM” in its Spanish acronym. Generators can perform maintenance or repowering investments toimprove their unit’s availability and add additional capacity to the system. After authorization, the generator can sign a CCAM at prices that permit therecovery of capital expenditures. Additionally, energy sales through a CCAM receive payment priority compared with spot energy sales (Res 406/2003). Generators with a CCAM can supply energy to CAMMESA for up to 36 months, renewable only for an additional period of six months.
During 2009, Resolution SE 762 created the Hydroelectric National Program to promote the construction of new hydro plants. The program enablesauthorized generators to subscribe energy supply contracts with CAMMESA for up to fifteen years at prices that allow for an investment payback.
The Federal Government has adopted several other measures to encourage new investments, including the following: auctions to expand the capacityof natural gas transportation and of electricity transmission; the implementation of certain projects for the construction of power plants; the creation offiduciary funds to finance these expansions; and the awarding of contracts with renewable energy, called “GENREN program”. For more details, refer to“Environmental Regulation” below. Law 26,095/2006 created specific charges that must be paid by end customers to finance new electricity and gasinfrastructure projects. The Federal Government has also enacted some regulations to encourage the rational and efficient use of electricity.
54
Table of Contents
Agreement For Managing And Operating Projects
On November 25, 2010, the Secretariat of Energy signed an agreement with some generation companies, including Enersis’ subsidiaries, in order to:i) increase thermoelectric unit availability, increase energy and capacity prices and ii) develop new generation units through the contribution of outstandingdebts of CAMMESA owed to the generation companies.
This agreement seeks to accomplish the following: i) continue the adaptation process of the MEM; ii) enable the incorporation of new generation tomeet the increased demand for energy and power in the MEM (within this agreement, Endesa Chile’s subsidiaries, together with the SADESA group andDuke, formed the company to develop the combined−cycle project of approximately 800 MW at the Vuelta de Obligado thermal plant); iii) determine amechanism to pay the generators’ sales settlements with maturity dates to be determined, which represent generators’ claims spanning the period fromJanuary 1, 2008 to December 31, 2011; and iv) define how to recognize the total remuneration due to generators.
FONINVEMEM
Resolution SE 712/2004 created FONINVEMEM, a fund whose purpose is to increase electricity capacity/generation within the MEM. Pursuant toResolution SE 406/2003, the Secretariat of Energy decided to pay generators for the spot prices up to the amount available at a stabilization fund, aftercollecting the funds from the purchasers in the spot market at seasonal prices, which were lower than spot prices for the same period. FONINVEMEMwould receive the differences between spot prices and payments to sellers, according to Resolution SE 406/2003, from January 1, 2004 to December 31,2006. CAMMESA was appointed to manage the FONINVEMEM.
Pursuant to Resolution SE 1,193/2005, all private generators in the MEM were called upon to participate in the construction, operation andmaintenance of the electric energy generation plants to be built with the FONINVEMEM, consisting of two combined cycle generation plants ofapproximately 850 MW each, which were finished during 2010 as combined cycle plants. These power plants are powered by natural gas or alternativefuels.
Because of the insufficient resources to conclude the plants, Resolution SE 564/2007 gathered all of the MEM’s private sector generators to commit toFONINVEMEM by including the differences between spot prices and payments made pursuant to Resolution SE 406/2003 for an additional period endingDecember 31, 2007.
The Energy Plus Program
In September 2006, the Secretariat of Energy issued Resolution 1,281/06 in an effort to respond to the sustained increase in energy demand followingArgentina’s economic recovery after the crisis. This resolution seeks to create incentives for energy generation plants in order to meet increasing energyneeds. The resolution’s principal objective is to ensure that energy available in the market is used primarily to service residential customers and industrialand commercial users whose energy demand is at or below 300 kW and who do not have access to other viable energy alternatives.
The resolution also established the price large customers are required to pay for excess demand, if not previously contracted under Energía Plus, whichis equal to the marginal cost of operations. This marginal cost is equal to the generation cost of the last generation unit dispatched to supply the incrementaldemand for electricity at any given time.
Limits and Restrictions
To preserve competition in the electricity market, participants in the electricity sector are subject to vertical and horizontal restrictions, depending onthe market segment in which they operate.
55

Table of Contents
Vertical Restrictions
The vertical restrictions apply to companies that intend to participate simultaneously in different sub−sectors of the electricity market. These verticalrestrictions were imposed by Law 24,065, and apply differently depending on each sub−sector as follows:
Generators
• Neither a generation company, nor any of its controlled companies or its controlling company, can be an owner or a majority shareholder of a transmittercompany or the controlling entity of a transmission company; and
• Since a distribution company cannot own generation units, a holder of generation units cannot own distribution concessions. However, the shareholdersof the electricity generator may own an entity that holds distribution units, either by themselves or through any other entity created with the purpose ofowning or controlling distribution units.
Transmitters
• Neither a transmission company nor any of its controlled companies or its controlling entity, can be owner or majority shareholder or the controllingcompany of a generation company;
• Neither a transmission company nor any of its controlled companies nor its controlling company, can be owner or majority shareholder or thecontrolling company of a distribution company; and
• Transmission companies cannot buy or sell electric energy.
Distributors
• Neither a distribution company, nor any of its controlled companies or its controlling company, can be owner or majority shareholder or the controllingcompany of a transmission company; and
• A distribution company cannot own generation units. However, the shareholders of the electricity distributor may own generation units, either bythemselves or through any other entity created with the purpose of owning or controlling generation units.
Horizontal Restrictions
In addition to the vertical restrictions described above, distribution and transmission companies are subject to horizontal restrictions, as describedbelow.
Transmitters
• Two or more transmission companies can merge or be part of a same economic group only if they obtain an express approval from the ENRE. Suchapproval is also necessary when a transmission company intends to acquire shares of another transmission company. Pursuant to the concession agreementsthat govern the services rendered by private companies operating transmission lines above 132 kW and below 140 kW, the service is rendered by theconcessionaire on an exclusive basis over certain areas indicated in the concession agreement; and pursuant to the concession agreements that govern theservices rendered by the private company operating the high−tension transmission services equal to or higher than 220 kW, the company must render theservice on an exclusive basis and is entitled to render the service throughout the entire country, without territorial limitations.
Distributors
• Two or more distribution companies can merge or be part of a same economic group only if they obtain an express approval from the ENRE. Such approvalis necessary when a distribution company intends to acquire shares of another transmission or distribution company; and
• Pursuant to the concession agreements that govern the services rendered by private companies operating distribution networks, the service is rendered by theconcessionaire on an exclusive basis over certain areas indicated in the concession agreement.
56

Table of Contents
Generation Regulation
Concessions
Generators which have to obtain a concession to use sources of hydroelectric energy from public water courses will be those whose normal capacityexceeds 500 kW and may be granted for a fixed or an indefinite term.
Concession−holders of hydroelectric energy sources under national jurisdiction shall have the following rights: i) to occupy within the perimeterdefined by the act of concession the private properties necessary for the works of water retention or reservoirs, and for the necessary underground or aboveground supply−line and release channels, in accordance with general laws and local regulations, ii) flood land for the necessary raising of water levels,iii) request the authorities to make use of the powers conferred in article 10, when the definitive occupation of third−party titles is necessary, if this had notbeen foreseen in the act of constitution of the concession and it was not possible to reach agreement between the parties.
Dispatch and Pricing
CAMMESA controls the coordination of dispatch operations, the spot price calculations and the administration of the MEM’s economic transactions. CAMMESA is also required to comply with special instructions given by the Secretariat of Energy in order to enter into transactions with certain generatorsin order to buy electricity. All generators that are MEM agents have to be connected to the Argentine Interconnected System (Argentine NIS) and areobliged to comply with the dispatch order to generate and deliver energy to the Argentine NIS, in order to be sold in the spot market or in the term market. Distribution companies, traders and large customers that have entered into private supply contracts with generation companies, pay the contractual pricedirectly to the generator and also pay a toll to the transmission and/or distribution company for the use of their systems.
The emergency regulations enacted after the Argentine crisis in 2001 had a significant impact on energy prices. Among the measures implementedpursuant to the emergency regulations were the pesification of prices in the wholesale electricity market, known as the spot market, and the requirement thatall spot prices be calculated based on the price of natural gas, even in circumstances where alternative fuel such as diesel is purchased to meet demand dueto the lack of supply of natural gas.
In addition to energy payments for actual output at the prevailing spot market prices, generators would receive compensation for capacity placed at thedisposal of the spot market, including stand−by capacity, additional stand−by capacity (for system capacity shortages) and ancillary services (such asfrequency regulation and voltage control). Capacity payments were originally established and set in U.S. dollars to allow generators to cover theirforeign−denominated costs that were not covered by the spot price. However, in 2002, the Argentine government set capacity payments in reference to theArgentine Peso, thereby limiting the purpose for which capacity payments were established.
The regulatory framework governing payment for generation capacity continued to be the same that governed in 2002, with generators receivingcompensation for available capacity at Ar$ 12 per MW until December 2010. On November 25, 2010, the Secretariat of Energy entered into an agreementwith all private generators in order to increase the installed capacity during 2011. The agreement provides that the government will recognize Ar$ 35 perMW−hrp (hrp stands for hours in which capacity is being paid) for available capacity of units greater than 100 MW and Ar$ 42 per MW−hrp of unitssmaller than 100 MW, to generators that present projects to increase capacity and can provide capacity with adequate availability, as defined in theagreement. Furthermore, the remuneration to cover operation and maintenance costs will also increase from Ar$ 7.96 per MWh to Ar$ 11.96 per MWh fornatural gas generation and from Ar$ 12.96 per MWh to Ar$ 20.96 per MWh for alternative fuel generation. In addition, all hydroelectric units with aninstalled capacity greater than 250 MW will receive 100% of their energy spot market sales.
Seasonal prices
The emergency regulations also made significant changes to the seasonal prices charged to distributors in the MEM, including the implementation of acap (which varies depending on the category of customer) on the cost of electricity charged by CAMMESA to distributors at a price significantly below thespot price charged by generators. These prices have not changed since January 2005.
Within the framework of the elimination of subsidies announced by the government, the MEM’s seasonal reference prices for non−subsidizedelectricity (Resolution SE 1,301/2011) were published in November 2011. This resolution also states that i) non−residential users shall not have subsidizedtariffs according to their payment capacity and economic activity; ii) a Register of Exceptions to Resolution 1301/2011 is created, which will include thoseusers who justify and accredit not being able to bear the seasonal reference prices for non−subsidized electricity; and iii) CAMMESA should make thesubsidy corresponding to each level of demand over which they have been applied explicit, to be identified as the National State Subsidy. Distributorsshould notify
57

Table of Contents
residential customers that will be affected by the elimination of subsidies, whether voluntary or mandatory, according to the regulation.
Stabilization fund
The stabilization fund, managed by CAMMESA, was created to absorb the difference between purchases by distributors at seasonal prices andpayments to generators for energy sales at the spot price. When the spot price was lower than the seasonal price, the stabilization fund increased, and whenthe spot price was higher than the seasonal price, the stabilization fund decreased. The outstanding balance of this fund at any given time reflected theaccumulation of differences between the seasonal price and the hourly energy price in the spot market. The stabilization fund was required to maintain aminimum amount to cover payments to generators if prices in the spot market during the quarter exceeded the seasonal price.
The stabilization fund was adversely affected as a result of the modifications to the spot price and the seasonal price made by the emergencyregulations, pursuant to which seasonal prices were set below spot prices resulting in large deficits in the stabilization fund. These deficits have beenfinanced by the Argentine government through loans to CAMMESA and with FONINVEMEM funds, but these continue to be insufficient to cover thedifferences between the spot price and the seasonal price.
Negotiated prices
Generators may also enter into agreements in the term market to supply energy and capacity to distributors and large customers. Distributors are ableto purchase energy through agreements in the term market instead of purchasing energy in the spot market. Term agreements typically stipulate a pricebased on the spot price plus a margin. Prices in the term market have at times been lower than the seasonal price that distributors are required to pay in thespot market. However, as a result of the emergency regulations, prices in the term market are currently higher than seasonal prices, particularly with respectto residential tariffs, making it unattractive to distributors to purchase energy under term contracts while prices remain at their current levels.
Sales by Generation Companies to Unregulated Customers
Generators may also enter into agreements in the term market to supply energy and capacity to distributors and large customers. Distributors are ableto purchase energy through agreements in the term market instead of purchasing energy in the spot market. Term agreements typically stipulate a pricebased on the spot price plus a margin.
As a result of the emergency regulations, prices in the term market are currently higher than seasonal prices, particularly with respect to residentialtariffs, making it unattractive to distributors to purchase energy under term contracts while prices remain at their current levels.
Additionally, since September 2006, the Secretariat of Energy issued Resolution 1281/06 the principal objective of which is to ensure that energyavailable in the market is used primarily to service residential customers and industrial and commercial users whose energy demand is at or below 300 kWand who do not have access to other viable energy alternatives.
Sales to Distribution Companies and Regulated Customers
In order to stabilize the prices for distribution tariffs, the market has a seasonal price as the energy price to be paid by distributors for their purchases ofelectricity traded in the spot market. It is a fixed price determined every six months by the Secretariat of Energy after CAMMESA recommends theseasonal price level for the next period according to its estimated spot price, which is based on its evaluation of the expected supply, demand and availablecapacity, as well as other factors. The seasonal price is maintained for at least 90 days. Since 2002, the Secretariat of Energy has been approving seasonalprices lower than those recommended by CAMMESA.
At the end of 2011, the government began a process of reducing subsidies to gas, electricity and water tariffs in different sectors. Various resolutionswere issued that state among other things that i) the seasonal programming of regulated tariffs for the November 2011 — April 2012 period was approved,ii) a new non−subsidized seasonal price was established, rising from Ar$ 243/MWh to Ar$ 320/MWh, iii) the economic activities that are covered by thesereductions in subsidies were informed, iv) a register was created to deal with exceptions to the reduction, v) the new tariffs should be applied toconsumption recorded from January 1, 2012, and vi) the option is incorporated to renounce voluntarily the electricity, water and gas subsidies, which can bedone through an online system.
58

Table of Contents
Specific Regulatory Charges for Electricity Companies
The authorities in Argentina are administratively divided between the nation, the provinces and the municipalities. The tax charge varies according towhere the user lives.
Incentives and Penalties
The Energy Plus Service is supplied by generators that install new capacity or that offer existing generation capacity not connected to the ArgentineNIS before. All “large customers” that, as of November 1, 2006, had a higher demand than their Base Demand, had to contract excess demand with theEnergy Plus Service. The consumption that exceeded the Base Demand without a supply contract should pay additional amounts for the surplus energy. The price of the contracts for Energy Plus Service has to be approved by the relevant authorities. Consumption of unregulated customers that could not besecured by an Energy Plus Service contract could request CAMMESA to conduct an auction to satisfy their demand.
Regulation of Distribution Companies
Concessions
Distributors are companies holding a concession to distribute electricity to consumers. Distributors are required to supply any and all demand ofelectricity in their exclusive areas of concession, at prices (tariffs) and conditions set in regulation. Penalties for non−supply are included in the concessionagreements. Concessions were issued for distribution and retail sale, with specific terms for the concessionaire stated in the contract. The concessionperiods are divided into “management periods” that allow the concessionaire to give up the concession at certain intervals.
Energy Purchases
By its Resolution 1,301/11, the Secretariat of Energy established the reduction of the state subsidy on the MEM for the periodNovember 2011−April 2012. This modification has been applied gradually to different segments of residential customers, in order to avoid abrupt changesin the final billing.
Distribution Tariff−Setting Process
Distribution and transmission companies have been renegotiating contracts since 2005 and although tariffs were partially and temporarily established,definitive tariffs are still pending. As a result, although the terms to define energy prices pursuant to the Argentine Electricity Act are still in force, theirimplementation reflects the measures taken by the authorities that reduce compensation for all electricity companies.
During 2006, our subsidiary Edesur entered into an “Agreement for Renegotiation of Concession Contract.” This Agreement established amongseveral conditions, a transitional tariff regime for the quality of service, and an Integral Rate Revision Process (RTI in its Spanish acronym) to beimplemented by ENRE according to Law 25,561. This would set conditions for a new tariff regime for a five−year period. Under the framework of the RTIprocess, Edesur presented to ENRE in December 2009 its tariff proposal, as well as the support studies, according to requirements established by theregulator in Res. ENRE 467/08. The aforementioned presentation only included the income requirements without the rate proposals, which were laterpresented to ENRE in May 2010. As of the date of this Report, ENRE has not defined new tariffs and maintains in force the transitional tariff regime.
Resolution 45/2010 of the Secretary of Energy determined bonus payments to residential customers under the Energy Efficiency Program (Puree),particularly those whose demand is less than 1,000 kWh every two months. Puree was created in 2004 and established bonuses and penalties to customersdepending on the level of energy savings; the net difference between the bonuses and penalties was originally deposited in the Stabilization Fund, but thiswas subsequently modified at the request of Edesur and Edenor, which were authorized by the Secretary of Energy to use 100% of these resources tocompensate for cost variations that were not transferred to the tariffs paid by regulated customers. ENRE monitors these distribution costs with amechanism called MCC (monitoring cost mechanism).
59

Table of Contents
Incentives and Penalties
ENRE Resolution 525/2010 of September 22 and ENRE Resolution 551/2010 of October 6, 2010, suspended the 2009 Edesur dividend distributionprocedure contemplated in the Concession Agreement. Resolution 525/2010 postponed the dividend distribution initially for 180 days andResolution 551/2010 postponed it indefinitely. ENRE based this decision on alleged non−compliance of the Edesur investment plan and deterioration of theconditions of service provided. ENRE determined that the 2010 Investment Plan should amount to at least Ar$ 414 million in order to improve quality ofservice, especially in the municipalities of the greater Buenos Aires area.
Edesur also had to submit an Operative Regularization Program including an individualized works schedule, concrete action courses, personnelaffected and other measures. Compliance with these two mandates is to be followed up by a committee composed of the concession area municipalities.
Transmission Regulation
Transmission was shaped on the basis of the general conception and principles established in Law 24,065 for the transmission business, adapting theiractivity to the general criteria contained in the concession granted to TRANSENER S.A. by Decree 2,743/92. This transmission business, for technologicalreasons, is related to economies of scale which do not allow for competition, is therefore a monopoly and is subject to considerable regulation.
Natural gas market
Since the economic emergency measures of 2002, the lack of investment in natural gas production forced the system to burn increasing amounts ofliquid fuels.
To improve the natural gas supply, the government has adopted different measures. Since 2004, local gas producers and the government have enteredinto various agreements to guarantee gas supply at rising prices. In July 2009, the last agreement was signed, establishing a 30% increase in the natural gastariff to power producers until December 2009. Additionally in 2006, Argentina and Bolivia entered into a 20−year agreement under which Argentina hasthe right to receive up to 28 million cubic meters daily of natural gas.
An additional measure related to natural gas in recent years was the creation of the Electronic Gas Market (MEG). Through the MEG, the regulatoryauthorities increased the transparency of physical and commercial operations in the spot market.
Electricity Exports and Imports
In order to give priority to the internal market supply, the Secretariat of Energy adopted additional measures that restricted electricity and gas exports. Resolution SE 949/2004 established measures that allowed agents to export and import electricity under very restricted conditions. These measuresprevented generators from satisfying their export commitments.
The Secretariat of Energy published Disposition 27/2004, together with related resolutions and decrees, which created a plan to ration natural gasexports and the use of transport capacity. These norms implied the beginning of restrictions for gas delivery to Chile and Brazil. These restrictions areexpected to continue, especially considering Resolution Enargas 1,410, which modified the procedures for gas dispatch as of October 2010. According tothat resolution, gas dispatch is as follows, from highest to lowest priority: i) residential and commercial users, ii) the Compressed Natural Gas market,iii) large customers, iv) thermal units, and as a least priority resort, v) exports.
Environmental Regulation
Electricity facilities are subject to federal and local environmental laws and regulations, including Law 24,051, or the Hazardous Waste Law, and itsancillary regulations.
Certain reporting and monitoring obligations and emission standards are imposed on the electricity sector. Failure to satisfy these requirements entitlesthe government to impose penalties, such as suspension of operations which, in case of public services, could result in the cancellation of concessions.
Law 26,190, enacted in 2007, defined the use of non conventional renewable energy for electricity production as a national interest and set as a target8% market share for generation from renewable energies within a term of 10 years. During 2009, the government took actions to reach this objective,launching an international auction to promote the installation of up to 1,000 MW of
60

Table of Contents
renewable capacity, publishing Resolution 712/2009. This resolution created a mechanism to sell renewable energy through fifteen−year contracts withCAMMESA under special price conditions through ENARSA. In June 2010, the “GENREN program” awarded a total of 895 MW, distributed as follows:754 MW of wind power, 110 MW of bio−fuels, 11 MW of mini−hydro, and 20 MW of solar units. The prices awarded vary from $ 150/MWh (formini−hydro units) to $ 598/MWh (for solar units). In 2011, the Secretariat of Energy issued Resolution 108/11 which allows CAMMESA to sign contractsdirectly with generators of renewable energy on similar conditions to Resolution 712/09.
Brazil
Industry Overview
Industry Structure
Brazil’s electricity industry is organized into one large interconnected electricity system, the Brazilian NIS), which comprises most of the regions ofBrazil, and several other small, isolated systems.
The following chart shows the relationships among the various actors in the Brazilian NIS:
Generation, transmission, distribution and trading are legally separated activities in Brazil.
The generation sector is organized on a competitive basis, with independent generators selling their output through private contracts with distributors,traders or unregulated customers. Differences are sold on the short−term market or spot market at theSettlement Price for the Differences (PLD in itsPortuguese acronym) and there is also a special mechanism between generators that seeks to reallocate hydrological risk by offsetting differences betweengenerators’ assured energy and that which is actually produced, called the “Electricity Reallocation Mechanism” (MRE in its Portuguese acronym).
The Brazilian Constitution was amended in 1995 to authorize foreign investment in power generation. Before, all generation concessions were heldeither by Brazilian individuals or entities controlled by Brazilian individuals or the Brazilian government.
Transmission works under monopoly conditions. Revenues from the transmission companies are fixed by the Brazilian government. This applies toall electricity companies with transmission operations in Brazil. The transmission revenue fee is fixed and, therefore, transmission revenues do not dependon the amount of electricity transmitted.
Distribution is a public service that works under monopoly conditions and is provided by companies who have also been granted concessions. Distributors in the Brazilian NIS are not permitted to: (i) develop activities related to the generation or transmission of electricity; (ii) sell electricity tounregulated consumers, except for those in their concession area and under the same conditions and tariffs maintained with respect to captive customers inthe Regulated Market; (iii) hold, directly or indirectly, any interest in any other company, corporation or partnership; or (iv) develop activities that areunrelated to their respective concessions, except for those
61

Table of Contents
permitted by law or in the relevant concession agreement. Generators are not allowed to hold equity interests in excess of 10.0% in distributors.
The selling of electricity is governed by Law 10,848/2004, Decrees 5,163/2004 and 5,177/2004 of the Electricity Trading Chamber or Clearing House(CCEE in its Portuguese acronym), and ANEEL Resolution 109/2004, which introduced the Electricity Trading Convention. Two possible situations wereintroduced by these regulations for the execution of energy sales agreements: the regulated contracting environment, in which energy generation anddistribution agents participate, and the free market contracting environment, in which energy generation, trading, importing and exporting agents, andunregulated consumers, participate.
Commercial relations between the agents participating in the CCEE are governed mainly by energy sales agreements. All the agreements between theagents in the Brazilian NIS should be registered in the CCEE. The register includes the amounts of energy and the term. The energy prices agreed are notregistered in the CCEE, but instead are specified by the parties involved in their agreements.
The CCEE books the differences between energy produced or consumed and the contracted amount. The positive or negative differences are settled inthe short−term market and priced at the Differences Settlement Price, determined weekly for each level of load and for each sub−market, based on thesystem’s marginal operating cost, within a minimum and maximum price range.
The unregulated market includes the sale of electricity between generation concessionaires, independent producers, self−producers, sellers ofelectricity, importers of electricity, unregulated, and special consumers. It also includes contracts in place between generators and distributors until theirexpiration, at which point new contracts may be entered into under the terms of the new regulatory framework. According to the specifications set forth inLaw No. 9,427/96, unregulated consumers in Brazil are currently those customers who: (i) demand a capacity of at least 3,000 kW and choose to contractthe energy supply directly with generators or retailers; or (ii) demand capacity in the range of 500−3,000 kW and choose to contract the energy supplydirectly with alternative generators or traders.
The Brazilian NIS is coordinated by the Brazilian Electricity System Operator (ONS in its Portuguese acronym) and is divided into four electricsub−systems: South−East/Center−West, South, North−East and North. In addition to the Brazilian NIS, there are also the isolated systems, i.e., thosesystems that are not part of the Brazilian NIS and are generally located in the Northern and North−Eastern regions of Brazil, and have as sole sources ofenergy the electricity generated by coal−fired and oil−fuelled thermal plants. According to the Brazilian Electricity System Operator, 97% of the populationreceived electricity through the public network in 2010.
Principal Regulatory Authorities
The Ministry of Mines and Energy (MME in its Portuguese acronym) regulates the electricity industry and its primary role is to establish the policies,guidelines and regulations for the sector.
The National Energy Policy Council (CNPE in its Portuguese acronym) is in charge of developing the national electricity policy. Among its roles areto guide the President in the formulation of energy policies and guidelines, promote the rational supply of the country’s energy resources, ensure the energysupply to the most distant places of the country, establish directives for specific programs, such as the use of natural gas, alcohol, biomass, coal andthermonuclear energy, and establish directives for the import and export of energy.
The Energy Research Company (EPE in its Portuguese acronym) is an entity under the Ministry of Mines and Energy. Its purpose is to provideservices in the area of studies and research to support the energy sector planning.
The Brazilian Governmental Agency for Electric Energy (ANEEL in its Portuguese acronym) is the entity that implements the regulatory policies, andits main responsibilities include, among others: (i) supervision of the concessions for electricity sale, generation, transmission and distribution ;(ii) enactment of regulations for the electricity sector; (iii) implementation and regulation of the exploitation of electricity resources, including the use ofhydroelectricity; (iv) promotion of a bidding process for new concessions; (v) resolution of administrative disputes between electricity sector agents; and(vi) setting the criteria and methodology for determining distribution and transmission tariffs, as well as the approval of all the electricity tariffs, ensuringthat consumers pay a fair price for energy supplied and, at the same time, preserving the economic−financial balance of the distribution companies, so thatthey can provide the service to agreed quality and continuity.
The Energy Sector Monitoring Committee (CMSE in its Portuguese acronym) is an entity created under the scope of the Ministry of Mines andEnergy, under its direct coordination, with the role of evaluating the continuity and security of the energy supply across the country. Among its functionsare the mandate to follow the development of the energy generation, transmission, distribution, trading, import and export activities; the assessment of thesupply and customer service as well as the analysis of the security of the
62

Table of Contents
system; the identification of difficulties and obstacles that affect the supply security and regularity; and the elaboration of proposals for preventive actionsthat can help restore the supply security and service.
The Electricity Trading Board (CCEE in its Portuguese acronym) is a non−profit company subject to authorization, inspection and regulation byANEEL and whose main purpose is to carry out the wholesale transactions and trading of electric power within the Brazilian NIS by registering theagreements resulting from market adjustments and whose agents are gathered into four categories: generation, distribution, trading and consumers.
The Brazilian Electricity System Operator (ONS in its Portuguese acronym) is comprised of generation, transmission and distribution companies, andindependent consumers, and is responsible for the coordination and control of the generation and transmission operations of the Brazilian NIS, subject to theANEEL’s regulation and supervision.
The Electricity Law
General
Before 1993, in the old model of the Brazilian Electric Sector, the power tariff was the same throughout Brazil. The dealers were entitled to aguaranteed return because the regulatory regime for the cost of service was adopted. Concession areas that obtained a higher return than the one guaranteeddeposited the surplus in a fund from which the distributors with less than the guaranteed return withdrew the difference.
In 1993, there was the reformulation of the Brazilian Electric Sector through Law 8,631/93, which abolished the equalization of electricity tariffssystem.
The Concessions Law 8,987 and the Power Sector Law 9,074, both enacted in 1995, intended to promote competition and attract private capital intothe electricity sector. Since then, several assets owned by the Brazilian Federal Government and/or state governments have been privatized.
The Power Sector Law also introduced the concept of independent power producers, or IPPs, in order to open the electricity sector to private sectorinvestment. IPPs are single agents, or agents acting in a consortium, who receive a concession, permit or authorization from the Brazilian government toproduce electricity for sale for their own account.
Law 9,648/98 created the wholesale energy market, composed by the generation and distribution companies. According to this market regulation, thepurchase and sale of electricity are freely negotiated.
The spot price is used to value the purchase and sale of electric power in the short term market. According to law, the CCEE is responsible for settingelectricity prices in the spot market. These prices are calculated on a marginal costs basis, modeling future operation conditions and setting a merit ordercurve with variable costs for thermal units and opportunity cost for hydroelectric plants, resulting in one price for each subsystem set for the weeksubsequent to the determination.
Pursuant to Law 10,433/02, the wholesale energy market structure came to be closely regulated and monitored by ANEEL, which is also responsiblefor setting wholesale energy market governance rules including measures to stimulate permanent external investment.
During 2003 and 2004, the federal government launched the bases of a new model for the Brazilian electricity sector, based on Laws 10,847 and10,848 of March 15, 2004, and Decree 5,163 of July 30, 2004, whose principal objectives were to (i) guarantee the security of the electricity supply,(ii) promote the reasonability of tariffs, and (iii) promote social integration in the Brazilian electricity sector, particularly through programs for makingservice available to everyone.
The model contemplates a combination of measures to be followed by the agents, like the obligation to contract all the demand of the distributors andunregulated consumers. The model also defines a new methodology for calculating the physical guarantee for sale of generation, contracting hydroelectricand thermal generating plants in proportions that ensure the best balance between guarantee and supply cost, plus the constant monitoring of the continuityand security of supply, seeking to detect occasional imbalances between supply and demand.
In terms of the tariffs’ reasonability, the model contemplates the purchase of electricity by distributors in a regulated environment through tenders inwhich the criterion of lowest tariff is observed, permitting a reduction in the cost of acquiring electricity to be passed on to captive consumers.
63
Table of Contents
The new model creates conditions for the benefits of electricity made available to consumers who do not yet have this service and for guaranteeing asubsidy for low−income consumers.
Limits and Restrictions
Regulatory Resolution 299/2008 repeals certain sections of ANEEL Resolution 278/2000, which established the limits and conditions for theparticipation of electricity distributors and traders. The section of Resolution 278 relating to limits to generation remains in effect and establishes that (i) anentity cannot have more than a 20% participation in the installed capacity, (ii) an entity may not have more than a 25% participation in the installed capacityof the electricity system of the South, South East and Center West regions, and (iii) an entity may not have more than a 35% participation in the installedcapacity in the North and North East regions.
Section 7 of Resolution 278/2000, which defines that a distribution−concession company may only buy up to 30% of the energy required to meet theircaptive demand from related companies, is also retained.
Regulation of Generation Companies
Concessions
The Concessions Law also provides that, upon receiving a concession, IPPs, self−producers, suppliers and consumers will have access to thedistribution and transmission systems owned by other concessionaires, provided that they are reimbursed for their costs as determined by ANEEL.
Companies or consortia that intend to build or operate hydroelectric generation facilities with a capacity exceeding 30 MW or transmission networks inBrazil have to resort to a public tender process. Concessions granted to the holder give the right to generate, transmit or distribute electricity, as the casemay be, in a given concession area for a certain period of time.
Concessions are limited to 35 years for new generation concessions and to 30 years for new transmission or distribution concessions. Existingconcessions may be renewed at the Brazilian government’s discretion for a period equal to their initial term.
Dispatch and Pricing
Settlement Price for the Differences
The Spot Price, or Settlement Price for the Differences, is used to value the purchase and the sale of electric power in the short term market. Theprice−setting process of the electric power traded in the short−term market is accomplished by using the data employed by the Brazilian Electricity SystemOperator to optimize the operation of the Brazilian NIS.
Based on the strength of the preponderance of hydro−electric plants within the Brazilian power generation grid, mathematical models are used tocompute the Settlement Price for the Differences. The purpose is to find an optimal equilibrium solution between the current benefit obtained from the useof the water and the future benefit resulting from its storage, measured in terms of the savings from the use of fuels for thermal plants.
Based on the hydrological conditions, the demand for electric power, the prices of fuel, the cost of the deficit, the entry of new projects into operationand the availability of equipment used for generation and transmission, the model used to set prices achieves an optimal result for the period being studied,defining both the hydraulic and thermal power generation for each submarket. As result of this process, the Marginal Operational Costs are obtained foreach load level and submarket.
The Settlement Price for the Differences is an amount computed on a weekly basis for each load level based on the Marginal Operational Cost, whichin turn is limited by a maximum and minimum price in effect for each period and submarket. The intervals set for the duration of each level are determinedby the Brazilian Electricity System Operator for each month and reported to the CCEE to be included into the accounting and settlement system.
The calculation of the price is based on the “ex−ante” dispatch that is determined based on estimated information existing prior to the actual operationof the system, taking into account the declared availability amounts regarding both the generation and the consumption envisaged for each submarket. Thecomplete process for the calculation of the Spot Price consists in the use of the computational models NEWAVE and DECOMP, the result whereof is theMarginal Operational Cost for each submarket, computed respectively on a monthly and on a weekly basis.
64

Table of Contents
Electricity Reallocation Mechanism (MRE in its Portuguese acronym)
The Electricity Reallocation Mechanism provides financial protection against hydrological risks for hydro−generators according to energy tradingrules in effect, to mitigate the shared hydrological risks that affect generators and assure the optimal use of the hydroelectric resources of the interconnectedpower system.
The mechanism guarantees that all the generators that participate in the Electricity Reallocation Mechanism will be able to sell the amount ofelectricity which they have contracted to sell under long−term contracts as determined by ANEEL, which we refer to as “assured energy”, irrespective oftheir actual electricity production, provided that the power plants participating in the mechanism, as a whole, have generated sufficient electricity. In otherwords, the mechanism reallocates electricity, transferring surplus electricity from those generators whose generation was in excess of their assuredelectricity to those whose generation was less than assured electricity. The effective generation dispatch is determined by the National Electricity SystemOperator, which takes into account nationwide electricity demand, the hydrological conditions of the interconnected power system and transmissionlimitations.
Reimbursement of the generation costs of the relocated electricity is provided to compensate generators that relocate electricity to the system in excessof their assured electricity. Generators are reimbursed for their variable operational costs (except fuel) and costs for the use of water. The total costs of therelocated electricity (from all generators that provided electricity to the energy reallocation mechanism) are then combined and paid by the generators thatreceive electricity from the mechanism.
The mechanism includes all hydroelectric power plants subject to the centralized dispatching of the National Electricity System Operator, smallhydroelectric stations that opt to participate in the mechanism and thermal power plants with centralized dispatching, included in the Initial SupplyContracts and whose fuel costs are subsidized by the Fuel Consumption Account. Since 2003, the Fuel Consumption Account power plants only partiallyparticipated in the mechanism, due to the gradual reduction of the subsidy.
The Optimum Energy Tariff (TEO), the tariff used for trading energy in the Electricity Reallocation Mechanism, was set as R$ 9.58/MWh for 2012. This is calculated as the tariff that covers the incremental costs of operation and maintenance of hydroelectric plants and the payment of financialcompensation.
Sales between the agents of the market
The new model for the electric sector states that the trading of electric power is accomplished in two market environments: the Regulated ContractingEnvironment (ACR in its Portuguese acronym) and the Free−Market Contracting Environment (ACL in its Portuguese acronym).
Contracting in the ACR is formalized by means of regulated, bilateral agreements, called Electric Power Trading Agreements within the RegulatedEnvironment (CCEAR in its Portuguese acronym) entered into between Selling Agents (sellers, generators, independent producers or self−producers) andPurchasing Agents (distributors) who participate in electric power purchase and sale auctions.
In the ACL environment, on the other hand, the negotiation among the Generating Agents, Trading Agents, Free−Market Consumers, Importers andExporters of electric power is accomplished freely, whereby the agreements for the purchase and sale of electric power are entered into through bilateralagreements.
Generating Agents, whether public generation concessionaires, IPPs or self−producers, as well as Trading Agents, are allowed to sell electric powerwithin the two environments, maintaining competitive nature of the overall market and all agreements, irrespectively of having been entered in the ACR orin the ACL, are registered in the CCEE, and they serve as a basis for the accounting posting and the settlement of the differences in the short term market.
Sales by Generation Companies to Unregulated Customers
In the unregulated contracting environment, the conditions for purchasing energy are negotiable between suppliers and their customers. As for theregulated environment, where distribution companies operate, the purchase of energy must be conducted pursuant to a bidding process coordinated byANEEL.
65

Table of Contents
Sales by Distribution Companies and Regulated Customers
Pursuant to the market regulations, 100% of the energy demand from distributors must be satisfied through long−term contracts in advance of theexpiration of current contracts in the regulated environment.
Tenders for the regulated environment are denominated according to the year of commencement of the electricity supply acquired by the distributoragents after the tender date, and are: i) Tenders A−5, corresponding to tenders for energy purchases from new generation sources to be supplied five yearsfollowing the tender; ii) Tenders A−3, for the acquisition of energy from new generation sources; iii) Tenders A− 1, for the acquisition of energy fromexisting generation sources; and iv) adjustment tenders, for supplementing the energy load necessary for servicing consumers in the distribution concessionmarket, with a limit of 1% of such load. Reserve tenders are also carried out for increasing the security of the system.
Various energy tenders were held during 2011, including Tender A−3 and reserve tender completed in August, and Tender A−5 in December.
In the A−3 process for the supply of 2014, 2,744.6 MW of new capacity was assigned, to be generated by 51 plants. Of the total contracted, 62% wasfrom renewable sources (hydroelectric, wind and biomass) and the remaining 38% from fossil fuels (natural gas).
The tender for reserve energy in August 2011 assigned 1,218.1 MW from wind farm, thermal and biomass projects, with a total of 41 generatingplants. The sale of energy was negotiated at an average price of R$ 99.61/MWh.
For the new A−5 energy process carried out in December 2011, 42 projects were sold with a capacity of 1,211.5 MW, at an average price ofR$ 102.18/MWh.
A Tender A−3 and a Tender A−5 are to be carried out in June and August, 2012, respectively.
Sales of Capacity to Other Generation Companies
Generators can sell their energy to other generators through direct negotiation, at freely−agreed prices and conditions.
Incentives and Penalties
Another change imposed on the electricity sector is the separation of the bidding process for “existing power” and “new power project.” Thegovernment believes that a “new power project” needs more favorable contractual conditions such as long term power purchase agreements (15 years forthermal and 30 years for hydro) and certain price levels for each technology. These agreements promote investment for the required expansion. On theother hand, “existing power”, which includes depreciated power plants, can sell their energy at lower prices in shorter term contracts.
Law 10,438/02 created certain incentive programs for the use of alternative sources in the generation of electricity (Proinfa). It assures the purchase ofthe electricity generated by Eletrobras for a period of 20 years and financial support from the Banco Nacional do Desenvolvimento, or BNDES, astate−owned development bank. Other programs include a discount of up to 50% on the distribution or transmission tariffs and a special exception for theconsumers with electricity demand in the range of 500−3,000 kW who decide to migrate to an unregulated environment, provided that such consumerspurchase electricity from generating companies using non−conventional sources of electricity.
Selling agents are responsible for payments to the buying agent if they are unable to satisfy their delivery obligations. ANEEL regulations set forth thefines applicable to electricity agents based on the nature and the materiality of the violation (including warnings, fines, temporary suspension of the right toparticipate in bids for new concessions, licenses or authorizations and forfeiture). For each violation, fines may be imposed for up to 2% of theconcessionaire’s revenues arising from the sale of electricity and services provided (net of taxes) in the 12−month period immediately preceding anyassessment notice.
ANEEL may also impose restrictions on the terms and conditions of agreements between related parties and, under extreme circumstances, terminatesuch agreements.
Decree 5,163/2004 establishes that the selling agents must assure 100% physical coverage for their energy and power contracts. This coverage mustbe made up of physical guarantees from its own power plants or someone else’s; in the latter case through the purchase of energy or power contracts.
66

Table of Contents
Among other aspects, ANEEL’s Normative Resolution 109/2004 specifies that when these limits are not met, the Agents (generation companies andtraders) are subject to financial penalties. The determination of penalties is predicated on a 12−month period and the revenues obtained from the levying ofthe penalties are reverted to tariff modality within the ACR.
When the limits of contracting and physical coverage defined in Trading Rules fail to be accomplished, the Agents (generation companies and traders)are notified by the Superintendence of CCEE. Pursuant to the specific Trading Procedure, CCEE’s Agents are allowed to file a Rebuttal to be evaluated byCCEE’s Board of Directors who then decides whether to levy or to cancel the financial penalty.
Generation Agents may sell their produced power through contracts signed within the ACR or the ACL (Free Contracting Environment). PublicService Generators and IPPs must provide a physical coverage from their own power generation for 100% of their sales contracts. Self−producers generateenergy for their own exclusive use, and by getting ANEEL’s authorization they may sell excess power through contracts. In both cases, the verification ofphysical coverage is accomplished on a monthly basis, predicated on generation data and on sales contracts for the last 12 months. The failure to providephysical coverage exposes the generating agent to the payment of penalties.
Regulation of Distribution Companies
Energy Purchases
In the regulated market, electricity distribution companies buy the electricity through bids that are regulated by ANEEL and organized by CCEE. Distributors must buy electricity at public bids.
There are three types of regulated bids: new energy bids, existing energy bids and adjustment bids. The government also has the right to call specialbids for renewable electricity (biomass, mini−hydro, solar and wind power). ANEEL and CCEE hold the bids annually. The contracting system ismultilateral, with generating companies entering into contracts with all distributors who call for bids.
Distribution Tariffs to Final Customers
Distribution tariff rates to final customers are subject to review by ANEEL, which has the authority to adjust and review these tariffs in response tochanges in energy purchase costs and market conditions.
Distribution Tariff−Setting Process
When adjusting distribution tariffs, ANEEL divides the Annual Reference Value, the costs of distribution companies, into: (i) costs that are beyond thecontrol of the distributor (“Parcel A costs”), and (ii) costs that are under control of distributors (“Parcel B costs”), the Value−Added Distribution. Eachdistribution company’s concession agreement provides for an annual adjustment.
The Concessions Law establishes three kinds of reviews for final consumer tariffs: annual tariff resetting, and both ordinary and extraordinary tariffreviews.
Distribution companies’ pricing aims to maintain constant concessionaire operating margins by allowing for tariff gains due to Parcel A costs and bypermitting the concessionaire to retain any efficiency gains achieved for defined periods of time. Tariffs to end users are also adjusted according to thevariation of costs incurred in purchasing electricity.
Ordinary tariff reviews take into account the entire tariff−setting structure for the company, including the costs of providing services and purchasingenergy, as well as a return for the investor. Under their concessions, Coelce and Ampla are subject to tariff reviews every four and five years, respectively. The asset base for calculating an allowed return for the investor is the market replacement value depreciated during its accounting useful life, and the rate ofreturn allowed for those assets is based on the weighted average cost of capital, or WACC, for a “model company”. The operating and maintenance costsreflected in the tariff are calculated based on the model company, which considers the special characteristics of each distribution concession area.
The law guarantees an economic and financial equilibrium for a company in the event that there is a substantial change in its operating costs. In theevent that the Parcel A cost components, such as energy purchases and taxes, increases significantly within the period between two annual tariffadjustments, the concessionaire may request from ANEEL a pass−through of those costs to the final customers.
67
Table of Contents
Currently, the electricity distribution sector is going through a new regulatory framework: the definition of a new methodology for calculating theOrdinary Tariff Reviews (third revision cycle).
In November 2011, ANEEL approved the trials methodology relating to the rules for the third cycle of periodic tariff revisions for electricity tariffs,effective from 2011 to 2014. In the proposal, there are significant changes with respect to the previous methodology:
• For operating costs, the model company is no longer used. The values defined in the previous cycle are adjusted by the variation in the number ofconsumers, consumption and networks, discounting the productivity gains achieved by the distributors;
• The WACC rate of return was reduced to reflect the lower risk of investing;• The sharing of other revenues with the consumer was expanded;• A new methodology to estimate the distribution of productivity gains and to maintain the economic and financial balance over the tariff cycle was
adopted;• A new incentive mechanism for improving the quality of service was introduced.
An annual tariff adjustment applicable to Ampla was introduced on March 15, 2011, with an average 10.9% price increase for all consumers and a10.5% increase for low−voltage customers (households, commerce and rural customers). The tariffs were affected primarily by an 11.3% inflation increase,which updates the Parcel B costs controlled by distributors.
Ordinary tariff reviews should have been introduced for Coelce in 2011. However, their rates were kept unchanged due to the uncertainty, inApril 2011, of the new methodology to be applied. With the publication of the new methodology, Coelce will have, in April 2012, in addition to the annualadjustment, a tariff review retroactive to April 2011.
On January 31, 2012 ANEEL opened the Public Hearing to receive input on the third cycle of tariff review of Coelce, beginning on February 2 andending on March 2, when the session took place in Fortaleza.
Social Tariff for Electricity − New Regulation: ANEEL’s Resolution 414/2010 modified the Social Tariff regime for low−income customers, whichrepresent 30% and 60% of the base of customers for Ampla and Coelce, respectively. The new regulation reduced the amount of the low−income customersin 70% and 30% for Ampla and Coelce, respectively, until November 2011, as well as an effect on customer satisfaction and possible increases in energytheft and delays in payments of electricity bills. The modifications of the Social Tariff scheme include the requirement that low−income beneficiaries of theSocial Tariff must be registered in the federal social database programs and must have a family income lower than the half equivalent of the minimum legalwage, which is currently R$ 545/month.
Transmission Regulation
Transmission lines in Brazil are usually very long, since most hydroelectric plants are usually located away from the large centers of powerconsumption. Today, the country’s system is almost entirely interconnected. Only the states of Amazonas, Roraima, Acre, Amapá, Rondônia and a part ofPará are still not linked up to the Interconnected power system. In these states, supply is carried out by small thermal plants or hydroelectric plants locatedclose to their respective capital cities.
The interconnected power system provides for the exchange of power among the different regions when any region faces problems generatinghydroelectric power due to a drop in its reservoir levels. As the rainy seasons are different in the south, southeast, north and northeast of Brazil, the highervoltage transmission lines (500 kV or 750 kV) make it possible for locations with insufficient power output to be supplied by generating centers that are in amore favorable location.
Any electric power market agent that produces or consumes power is entitled to use the Basic Network. Free−market consumers also have this right,provided that they comply with certain technical and legal requirements. This is called free access and is guaranteed by law and by ANEEL.
The operation and management of the Basic Network is the responsibility of ONS, which is also responsible for managing energy dispatched fromplants in optimized conditions, involving use of the interconnected power system hydroelectric reservoirs and thermal plants’ fuel.
68
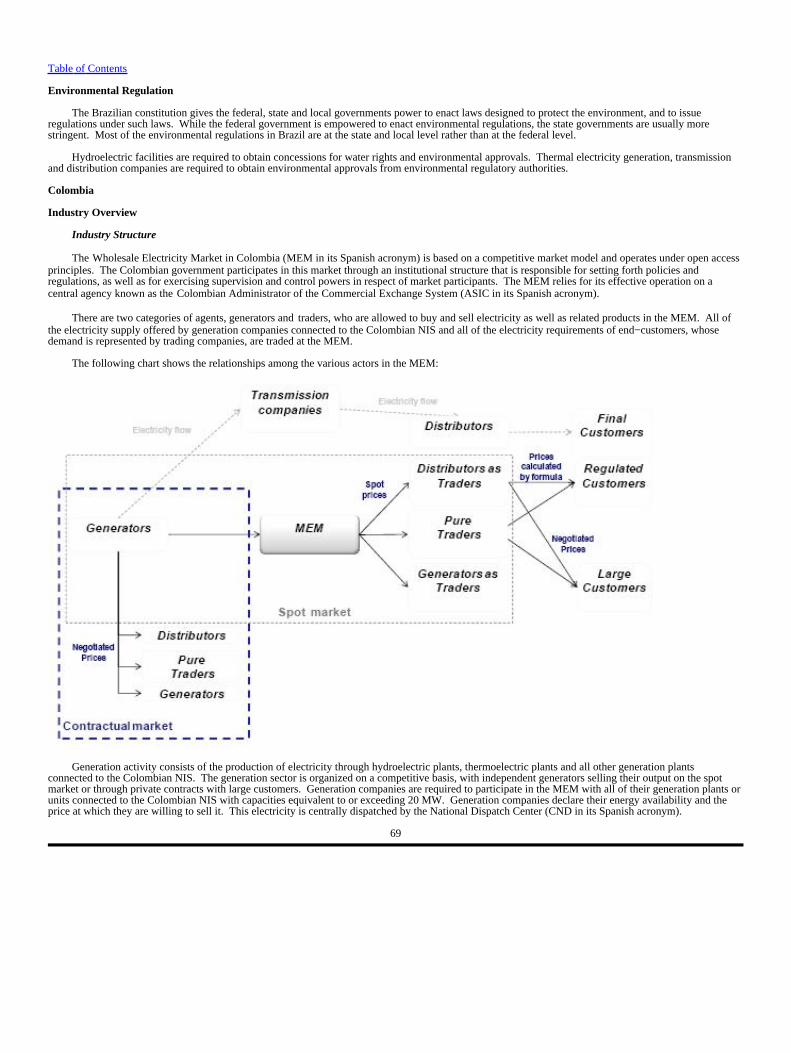
Table of Contents
Environmental Regulation
The Brazilian constitution gives the federal, state and local governments power to enact laws designed to protect the environment, and to issueregulations under such laws. While the federal government is empowered to enact environmental regulations, the state governments are usually morestringent. Most of the environmental regulations in Brazil are at the state and local level rather than at the federal level.
Hydroelectric facilities are required to obtain concessions for water rights and environmental approvals. Thermal electricity generation, transmissionand distribution companies are required to obtain environmental approvals from environmental regulatory authorities.
Colombia
Industry Overview
Industry Structure
The Wholesale Electricity Market in Colombia (MEM in its Spanish acronym) is based on a competitive market model and operates under open accessprinciples. The Colombian government participates in this market through an institutional structure that is responsible for setting forth policies andregulations, as well as for exercising supervision and control powers in respect of market participants. The MEM relies for its effective operation on acentral agency known as theColombian Administrator of the Commercial Exchange System (ASIC in its Spanish acronym).
There are two categories of agents, generators andtraders, who are allowed to buy and sell electricity as well as related products in the MEM. All ofthe electricity supply offered by generation companies connected to the Colombian NIS and all of the electricity requirements of end−customers, whosedemand is represented by trading companies, are traded at the MEM.
The following chart shows the relationships among the various actors in the MEM:
Generation activity consists of the production of electricity through hydroelectric plants, thermoelectric plants and all other generation plantsconnected to the Colombian NIS. The generation sector is organized on a competitive basis, with independent generators selling their output on the spotmarket or through private contracts with large customers. Generation companies are required to participate in the MEM with all of their generation plants orunits connected to the Colombian NIS with capacities equivalent to or exceeding 20 MW. Generation companies declare their energy availability and theprice at which they are willing to sell it. This electricity is centrally dispatched by the National Dispatch Center (CND in its Spanish acronym).
69

Table of Contents
Trading consists of intermediation between the players that provide electricity generation, transmission and distribution services and the users of theseservices, whether or not that activity is carried out together with other electricity−sector activities.
Electricity transactions in the MEM are carried out under the three following modes:
1. Energy spot market: short term daily market2. Bilateral contracts: long term market; and3. “Firm Energy.”
“Firm Energy” refers to the maximum electric energy that a generation plant is able to deliver on a continual basis during a year, in extreme conditionsof hydro inflows. The generator who acquires a Firm Energy Commitment (OEF in its Spanish acronym) will receive a fixed remuneration during thecommitment period of the OEF, whether the fulfillment of this obligation is required or not. The price for each kilowatt hour of the OEF corresponds to theclearing price in the auction in which the generator sold its firm energy. This price is denominated as Reliability Charge. When this firm energy isrequired, which happens when the Spot Price surpasses the Scarcity Price, aside from the Reliability Charge the generator also receives the Scarcity Pricefor each kilowatt hour generated associated with its OEF. In case the energy generated is more than the obligation specified in the OEF, this additionalenergy will be paid or rewarded at the Spot Price. All generation companies in the MEM can freely enter into any or all of these transactions.
Transmission works under monopoly conditions and with a guaranteed annual fixed income that is determined by the new replacement value of thenetworks and equipment and by the resulting value of bidding processes awarding new projects for the expansion of the National Transmission System(NTS in its Spanish acronym). This value is allocated among the traders of the NTS in proportion to their energy demand.
Distribution is defined as the operation of local networks below 220 kV. Any customer may have access to a distribution network for which it pays aconnection charge.
There is one interconnected system, the Colombian NIS, and several isolated regional and smaller systems that provide electricity to specific areas. According to the Colombian National Institute of Statistics (DANE), 97.7% of the Colombian population in 2010 received electricity through the publicnetwork, including 99.6% in urban and 90.7% in rural areas.
Principal Regulatory Authorities
The Ministry of Mines and Energy (MMEin its Spanish acronym) is responsible for the policy−making of the electricity sector, which aims for abetter use of the mining and energy resources available in Colombia, and in turn contributes to the country’s social and economic development.
The Mining and Energy Planning Agency (UPME in its Spanish acronym) is in charge of planning the expansion of the generation and transmissionnetworks.
The National Planning Department (DNP in its Spanish acronym) performs the functions of Executive Secretariat of the CONPES and is therefore theentity responsible for coordinating and presenting the documents for discussion at meetings.
The National Council for Economic and Social Policy (CONPES in its Spanish acronym) is the maximum national planning authority and works as anadvisory entity to the government in all aspects related to the Colombia’s economic and social development. It coordinates and directs the entitiesresponsible for economic and social direction, through the study and approval of documents on policy development.
The Energy and Gas Regulatory Commission (CREG in its Spanish acronym) implements the legal principles of the industry set out by TheColombian Electricity Act. This commission is constituted by five experts named by the Colombian President, the MME, the Ministry of Public Credit andthe director of the DNP or their delegates. Such legal principles are: efficiency (the correct allocation and use of resources and the supply of electricity atminimum cost); quality (compliance with technical requirements); continuity (continuous electricity supply without unjustified interruptions); adaptability(the incorporation of modern technology and administrative systems to promote quality and efficiency); neutrality (impartial treatment of all electricityconsumers); solidarity (the provision of funds by high−income consumers to subsidize the subsistence consumption of low−income consumers); andfairness (an adequate and nondiscriminatory supply of electricity to all regions and sectors of the country).
CREG is empowered to issue regulations that govern technical and commercial operations and to set charges for regulated activities. CREG’s mainfunctions are to establish conditions for gradual deregulation of the electricity sector toward an open and
70

Table of Contents
competitive market, approve charges for transmission and distribution networks and for regulated customers, establish the methodology for calculatingmaximum tariffs for supplying the regulated market, regulations for planning and coordination of operations of the Colombian NIS, technical requirementsfor quality, reliability and security of supply, and protection of customers’ rights.
The National Operation Council (CNO in its Spanish acronym) is responsible for establishing technical standards to facilitate the efficient integrationand operation of the Colombian NIS. It is a consultative entity composed by the CND’s Director and generation, transmission and distribution companyrepresentatives.
The Commercialization Advisory Committee (CAC in its Spanish acronym) is an advisory entity which assists CREG with the commercial aspects ofthe MEM.
The Superintendence of Industry and Commerce investigates, corrects and sanctions restrictive commercial competition practices, such as antitrustbehavior. It also oversees mergers of companies operating in the same productive activities to prevent excessive concentration or monopoly of certainindustries.
The Superintendence of Domestic Public Services (SSPD in its Spanish acronym) is responsible for overseeing all public utility services companies. The SSPD monitors the efficiency of all utility companies and the quality of services. The SSPD can also assume control over utility companies when theavailability of utility services or the viability of such companies is at risk. Other duties include (i) enforcing regulations, imposing penalties and generallyoverseeing the financial and administrative performance of public utility companies, (ii) providing accounting norms and rules for public service companies,and (iii) in general, organizing information networks and databases pertaining to public utilities.
The Electricity Law
General
In 1994, the Colombian Congress passed significant reforms affecting the public utilities industry. These reforms, contained in Law 142, known as thePublic Utility Services Law (LSPD in its Spanish acronym), and Law 143, were the result of constitutional amendments made in 1991. They created thebasic legal framework that currently governs the electricity sector in Colombia. The most significant reforms included the opening of the electricityindustry to private sector participation, the functional segregation of the electricity sector into four distinct activities (generation, transmission, distributionand trading), the creation of an open and competitive wholesale electricity market, the regulation of transmission and distribution activities as regulatedmonopolies, and the adoption of universal access principles applicable to transmission and distribution networks.
The Colombian Electricity Act regulates electricity generation, trading, transmission, and distribution (collectively, the “Activities”). Under the law,any company existing before 1994, domestic or foreign, may undertake any of the Activities. Companies established subsequent so such date can engageexclusively in just one of such Activities. Trading, however, can be combined with either generation or distribution.
Limits and Restrictions
The market share for generators and traders is limited. The limit for generators is 25% of the Colombian system Firm Energy. The principal marketshare metric used by CREG to regulate the generation market is the percentage of Firm Energy that a market participant holds.
Additionally, if an electricity generation company’s share of Colombia’s total Firm Energy ranges from 25% to 30% and the market’s HerfindahlHirschman Index (“IHH”), a measure of market concentration, is at least 1,800, such company becomes subject to monitoring by the SSPD. If an electricitygeneration company share of Colombia’s total Firm Energy exceeds 30%, the company may be required to sell electricity exceeding the threshold.
Similarly, a trader may not account for more than 25% of the trading activity in the Colombian NIS. Limitations for traders take into accountinternational energy sales. Market share is calculated on a monthly basis according to the company’s commercial demand and traders have up to six monthsto reduce their market share when the limit is exceeded.
Such limits are applied to economic groups, including companies that are controlled by, or under common control with, other companies. In addition,generators may not own more than a 25% interest in a distributor, and vice versa. However, this limitation only applies to individual companies and doesnot preclude cross−ownership by companies of the same corporate group.
71

Table of Contents
A distribution company can have more than 25% of an integrated company’s equity if the market share of the latter company is less than 2% of thenational generation business. A company created before the enactment of Law 143 is prohibited from merging with another company created after Law 143came into effect.
A generator, distributor, trader or an integrated company (i.e., a firm combining generation, transmission and distribution activities), cannot own morethan 15% of the equity in a transmission company if the latter represents more than 2% of the national transmission business in terms of revenues.
Generation Regulation
Concessions
The Colombian electricity sector was reformed structurally by Laws 142 and 143 of 1994. Under this new legal structure, economic activities relatedto the provision of the electricity service are governed by the constitutional principles of free market economic activity, free market private initiative,freedom to enter and leave, corporate freedom, free market competition and private property, with regulation and inspection, surveillance and control by thestate.
According to Law 143 of 1994, these constitutional principles of freedom are the general rule in the electricity sector business, while the concession isthe exception. Different economic, public, private or mixed agents may participate in the sector’s activities, which agents shall enjoy the freedom todevelop their functions in a context of free market competition. In order to operate or start up projects, they must obtain from the competent authorities therespective environmental, sanitation and water−right permits and those of a municipal nature that are required. The construction of generation plants andtheir respective connection lines to the interconnection and transmission networks, is permitted for all economic agents.
It is not contemplated that the Colombian state can legally participate in the execution and exploitation of generation projects. As a general rule, thecarrying out of such projects is made by the private sector. The nation is only authorized to sign concession agreements relating to generation when there isno entity prepared to assume these activities on comparable conditions.
Dispatch and Pricing
The purchase and sale of electricity can take place between generators, distributors acting in their capacity as traders, traders (who do not generate ordistribute electricity) and unregulated customers. There are no restrictions for new entrants into the market as long as the participants comply with theapplicable laws and regulations.
The wholesale market facilitates the sale of excess energy that has not been committed under contracts. In the wholesale market, an hourly spot pricefor all dispatched units is established based on the offer price of the highest priced energy dispatched unit for that period. The CND receives price bids eachday from all the generators participating in the wholesale market. These bids indicate prices and the hourly available capacity for the following day. Basedon this information, the CND, guided by an “optimal dispatch” principle (which assumes an infinite transmission capacity through the network), ranks thedispatch optimized during the 24−hour period, taking into account initial operating conditions, and determining which generators will be dispatched thefollowing day in order to satisfy expected demand. The price for all generators is set as the most expensive generator dispatched in each hourly periodunder the optimal dispatch. This price−ranking system is intended to ensure that national demand, increased by the total amount of energy exported to othercountries, will be satisfied at the lowest cost combination of available generating units in the country.
Additionally, the CND plans for the dispatch, which takes into account the limitations of the network, as well as other conditions necessary to satisfythe energy demand expected for the following day in a safe, reliable and cost−efficient manner. The cost differences between the “planned dispatch” andthe “optimal dispatch” are called “restriction costs.” The net value of such restriction costs is assigned proportionally to all the traders within the ColombianNIS, according to their energy demand, and these costs are passed through to the end customers. Some generators have initiated legal proceedings againstthe government arguing that recognized prices do not fully cover the costs associated with these restrictions on the grounds that current regulations do nottake into account all the costs incurred under safely reliable generation.
72

Table of Contents
Sales by Generation Companies to Unregulated Customers
In the unregulated market, generation companies and unregulated customers sign contracts in which terms and prices are freely agreed. Typically,these agreements establish that the customer pays the energy that it consumes each month without a cap or a floor. The prices are fixed in Colombian pesosindexed monthly to the Colombian PPI. According to resolution CREG 131 of 1998, to be considered “unregulated,” customers are required to have anaverage monthly power demand for six months of at least 0.1 MW, or a minimum of 55 MWh in monthly average energy demand over the prior six months.
Sales by Distribution Companies to Regulated Customers
The regulated market is serviced by traders and by distributors acting as traders, who bill all service costs, with prices regulated by CREG. Thescheme allows distributors to pass through the average purchase price of all the market transactions that affect the regulated market into the clients’ tariff,thereby mitigating spot price volatility and providing an efficiency signal to the market. Additionally, CREG established the formula that allows for thetransfer of transmission, distribution and marketing costs, and the cost of physical losses, to the regulated market.
Sales by Generation Companies to Traders for the Regulated market
Traders in the regulated market should buy energy through procedures that ensure free market competition. For evaluating the bids, the buyer takesinto account price factors as well as other technical conditions and commercial objectives to be defined before the contracting process. These agreementscan be signed with different terms, such as: “Pay amount contracted,” “Pay amount demanded with or without a limit,” “Pay the percentage actuallyconsumed,” etc. Prices are denominated in Colombian pesos indexed monthly to the Colombian CPI.
Sales to Other Generation Companies
Generators can sell their energy to other generators through direct negotiation, at freely negotiated prices and conditions.
Regulatory Charges
Contribution by generation per Law 99 of 1993:Generation companies are obliged to pay monthly payments based on their generation to the regionalautonomous corporations for environmental protection in areas where the plants are located and to the municipalities where the generation plants aresituated. For more information, see “Environmental Regulation.”
Generation contribution to the Financial Support Fund for Energy for Unconnected Zones (FAZNI): Law 633 of 2000 (tax reform) states thatgenerators should make a contribution of CP 1 to the FAZNI for every kilowatt dispatched on the Wholesale Energy Exchange. Initially, this contributionwas effective until December 31, 2007, but it was extended to 2014 by Law 2,099 of November 2006.
Incentives and Penalties
Generators connected to the Colombian NIS can also receive “reliability payments” which are a result of the Firm Energy Obligation that they provideto the system. The Firm Energy Obligation (OEF) is a commitment on the part of generation companies backed by its physical resource capable ofproducing firm energy during scarcity periods. The generator that acquires an OEF will receive a fixed compensation during the commitment period,whether or not the fulfillment of its obligation is required. To receive reliability payments, generators have to participate in firm energy bids by declaringand certifying such firm energy. Until November 2012, the transition period, the firm energy supply for reliability purposes will be assigned proportionallyto the declared firm energy of each generator. Beyond the transition period, the additional firm energy required by the system is allocated by bids.
During 2011, CREG published resolutions for the assignment of OEF for the periods December 2014−November 2015 andDecember 2015−November 2016. For the first of these periods, the OEF assigned this pro rata to the existing generators while, for the second, it carried outa second tender for the electricity sector on December 27, 2011. The new resolutions include incentives for thermal plants that back up their OEF withimported natural gas to guarantee its OEF for 10 years, from December 2014.
The tender for firm energy for the period November 2015−December 2016 was made on December 27, 2011. Seven companies participated with atotal of eight projects of which five were assigned at a price of $ 15.7/MWh. The new projects are Río Ambeima (hydro, 45 MW), Carlos Lleras Restrepo(hydro, 78 MW), San Miguel (hydro, 42 MW), Gecelca 32 (thermal, 250 MW) and Tasajero 2 (thermal, 160 MW). The new assignments were made for aperiod of twenty years as of December 1, 2015.
73
Table of Contents
In addition, on January 26, 2012, the auction was concluded for projects with long construction periods (GPPS in its Spanish acronym) which assignedObligations of Firm Energy (OEF in its Spanish acronym) for a period of twenty years to three hydroelectric projects and one thermal project. Of these, twocorrespond to new plants (Termonorte, 88 MW, as of 2017 and the Porvenir II hydroelectric power plant (352 MW as of 2018) and the other two correspondto increases in OEF for plants already under construction, and had available firm energy following the GPPS process carried out in 2008 (Sogamoso andPescadero−Ituango hydroelectric plants). The process ended with assignment prices below the maximum defined for the auction in December($ 15.7/MWh), and were in connection with Termonorte ($ 14.9/MWh); Porvenir II ($ 11.7/MWh); Sogamoso and Pescadero−Ituango ($ 15.7/MWh).
Electricity Exports and Imports
Decision CAN 536 of 2002, CAN 720 of 2009, and CAN 757 of 2011, signed by the countries that participate in the Andean Nations Community(CAN in its Spanish acronym), Colombia, Ecuador, Bolivia and Peru, established the general framework for the interconnection of electrical systems thatcreated a coordinated economic dispatch for the countries involved in the interconnections. In this context, in March 2003, the interconnection systembetween Colombia and Ecuador was inaugurated and through CAN 757 adopted a transitional regime, while adopting common standards that make theinternational transactions viable.
Apart from the interconnection with Ecuador, Colombia is also interconnected with Venezuela by three links, the most important being theCuestecitas−Cuatricentenario line. During 2011, there were some transfers of energy made from Colombia to Venezuela, due to shortages in Venezuela,over this line under agreements between the presidents of both nations.
It is expected that the Colombia−Panama interconnection company will open a tender process in the first quarter of 2012, considering the advances inthe Colombian regulation to facilitate this interconnection carried out in 2011.
Distribution Regulation
Distributors (or network operators) are responsible for planning, investing, operating and maintaining electricity networks below 220 kV (regionaltransmission systems (STR) and local distribution systems (SDL). Any user has access to the distribution network by paying a connection fee. In thisscheme, the distributor is a passive agent who does not buy energy and is only responsible for transporting it and controlling the technical energy losses.
Distribution Tariff−Setting Process
CREG regulates distribution prices that should permit distribution companies to recover costs, including operating, maintenance and capital costsunder efficient operations. Distribution charges are set by CREG for each company based on the replacement cost of the existing distribution assets, thecost of capital, as well as operational and maintenance costs that depend on the voltage level.
The methodology for remunerating the distribution business segment was defined by CREG in 2008. The WACC was set at 13.9% before taxes forassets operating at above 57.5 kV and 13.0% before taxes for assets operating under this threshold. CREG also defined a methodology for the calculation ofdistribution charges by defining an incentive scheme for administrative, operating and maintenance costs, service quality and energy losses. During 2009,after auditing the information reported by the companies, CREG defined the distribution charges applicable until 2013.
The distribution charges are defined for four different voltage levels which are applied depending on the user’s connection point as follows:
Level 1: less than 1 kV;Level 2: at least 1 kV but less than 30 kV;Level 3: at least 30 kV but less than 57.5 kV; andLevel 4: at least 57.5 kV but less than 220 kV.
Charges are set for a five−year period, and are updated monthly according to the PPI.
74

Table of Contents
Incentives and Penalties
The distribution business has tariff incentives depending on the service’s quality. The distributor also has to make compensatory payments to userswhen the service is not provided within the established continuity criteria.
In December 2011 CREG defined a coverage mechanism, so retailers have to guarantee distributors the payment of the STR and SDL tariffs. CREGestablished that retailers must use one of the following instruments, in order to provide security of payment to distributors: bank guarantees, stand−by lettersof credit letters (either domestic or international) and monthly prepayments.
At the same time, CREG defined new regulation related to non technical lossses. It defined that the companies that face higher losses than thoseapproved in current regulation should design a plan to reduce them. The cost of the plan will be approved by CREG and is going to be paid by consumers. Also, it established that companies that face lower losses than those currently approved must send to the Commission a new loss trend that will be includedin the tariff. Finally, CREG established that non technical losses must be assumed by both distributors and retailers, according to their demand.
Transmission Regulation
Transmission companies which operate at no less than 220 kV constitute the National Transmission System, or NTS. They are required to provideaccess to third parties on equal conditions and are authorized to collect a tariff for their services. The transmission tariff includes a connection charge thatcovers the cost of operating the facilities, and a usage charge, which applies only to traders.
CREG guarantees an annual fixed income to transmission companies. Income is determined by the new replacement value of the network andequipment and by the resulting value of bidding processes awarding new projects for the expansion of the NTS. This value is allocated among the traders ofthe NTS in proportion to their energy demand.
The expansion of the NTS is conducted according to model expansion plans designed by the Mining and Energy Planning Agency and pursuant tobidding processes opened to existing and new transmission companies, which are handled by the MME in accordance with the guidelines set by CREG. The construction, operation and maintenance of new projects is awarded to the company that offers the lowest present value of future cash flows needed forcarrying out the project.
Trading Regulation
The retail market is divided into regulated and unregulated customers. Customers in the unregulated market may freely contract for electricity supplydirectly from a generator or a distributor, acting as traders, or from a pure trader. The unregulated customer market, which for 2011 represented about 33%of the market, consists of customers with a peak demand in excess of 0.1 MW or a minimum monthly energy consumption of 55 MWh.
Trading is the resale to end customers of electricity purchased in the wholesale market. It may be conducted by generators, distributors or independentagents, which comply with certain requirements. Parties freely agree upon trading prices for unregulated customers.
Trading on behalf of regulated customers is subject to the “regulated freedom regime” under which tariffs are set by each trader using a combination ofgeneral cost formulas given by CREG and individual trading costs approved by CREG for each trader. Since CREG approves limits on costs, traders in theregulated market may set lower tariffs for economic reasons. Tariffs include, among other things, energy procurement costs, transmission charges,distribution charges and a trading margin.
The trading tariff formula became effective on February 1, 2008. The main changes to this formula were the establishment of a fixed monthly chargeand the introduction of reduction costs of non−technical energy losses in the trading charges. In addition, CREG allows traders in the regulated market tochoose tariff options to manage tariff increments.
In order to improve wholesale price formation, CREG is designing a new energy procurement scheme based on long term energy bids, known asOrganized Market (MOR in its Spanish acronym). The final rules for this new system are not available, but CREG has this issue on its 2012 agenda.
In May 2009, a company called Derivex was created so as to incorporate an energy derivatives market. In October 2010, Derivex began its operationwith the first electricity forward derivative contract.
75

Table of Contents
In December 2011, CREG issued the Retailing Code, which includes specific rules that improve retailers’ relations with other electricity marketmembers. It establishes new regulations about energy measurement, non technical losses, the retailers’ connection to the wholesale electricity market, andthe retailers’ credit risks, among other considerations.
Tariffs to Final Customers
The energy trader is responsible for charging the electricity costs to end customers and to transfer their payments to the industry’s agents. The tariffsapplied to regulated users are defined by a formula established by CREG. This formula reflects the costs of the industry: generation, transmission,distribution (depending on the user’s connection level), trading losses, constraints, administrative costs, and market operating costs.
In addition, the final costs of the service are affected by subsidies and / or contributions that are applied according to the socio−economic level of eachuser. When subsidies exceed contributions, the government covers the difference.
Another factor that affects the final tariff is the Distribution Area(ADD in its Spanish acronym), which established a single tariff for the distributioncompanies in adjacent geographic zones.
Environmental Regulation
The environmental framework in Colombia was established in Law 99/1993, which also established the Ministry of the Environment as the authorityfor determining environmental policies. The Ministry defines, issues and executes policies and regulations that focus on the recovery, conservation,protection, organization, administration and use of renewable resources. Therefore, the use of natural resources or any impact to them as a result of anyactivity or project will require the issuance of permits and environmental licenses and the establishment of environmental management plans.
Any entity planning to develop projects or activities relating to generation, interconnection, transmission or distribution of electricity that may result inenvironmental deterioration must first obtain an environmental license.
According to Law 99, generation plants that have a total installed nominal capacity above 10 MW are required to contribute to the conservation of theenvironment through a payment for their activities at a regulated tariff. Hydroelectric power plants must pay 6% of their generation and thermoelectricplants must pay 4% of their generation, with a tariff that is annually determined. This payment is made monthly to the municipalities and environmentalcorporations where these facilities are located.
Law 1450 of 2011 issued the National Development Plan 2010−2014. The plan establishes that between 2010 and 2014, the government must developstrategies on environmental sustainability and risk prevention such as the national plan for adaptation to climate change, the environmental licensing processand environmental impact studies.
In 2011, Institutional Decree 3,570 established the new structure of the environmental sector, creating the Ministry of Environment and SustainableDevelopment (previously, the functions of the Ministry of Environment were established in conjunction with functions of the Ministry of Housing). Themain objectives will be environmental and renewable natural resources policy formulation and management and environment and renewable naturalresources management.
In the last few years, the environmental regulation for the electricity sector has been focused on regulating aspects regarding power plant emissions,hydro policies (including water discharges and basin organizations), and environmental licensing and penalties.
Peru
Industry Overview
Industry Structure
In theWholesale Electricity Market (MEM) there are four categories of local agents: generators, transmitters, distributors and large customers.
76

Table of Contents
The following chart shows the relationships among the various actors in the SEIN:
The generation segment is composed of companies which own generation plants. This segment is noted for being a competitive market in whichprices tend to reflect the marginal cost of production.
Electricity generators, as energy producers, have capacity and energy sale commitments with their contracted customers. Generators may sell thiscapacity and energy to both distributors and unregulated customers.
The energy received by a generator’s unregulated and regulated customers do not necessarily coincide with the energy produced by that supplier sincethe generation plants’ production is allocated by the Committee of Economic Operation of the System (COES), the system operator, through a centralizeddispatch. The transfer cost is minimized through a consideration of the variable production costs of each power plant, regardless of their contractualcommitments. Therefore, there is a short−term market also managed by the COES, where an economic balance is made between the energy produced andthe consumption required by the generators’ customers.
The generation plants’ production and the customers’ energy consumption at the nodal short−term marginal cost are valued, and the deficit generatorspay for the energy purchased from surplus generators. The balance made in connection with energy sales is also carried out with respect to capacity, inwhich case the price of the capacity corresponds to a price regulated by Osinergmin.
The settlements made by the COES also include payments and/or collections for complementary services such as frequency and tension regulation. They also consider compensation for operating cost overruns, such as the operation at minimum load, random operational tests, etc.
Regulation DS 027−2011−EM of June 2011 establishes that as of January 2014, several actors may also participate as buyers in the short−term market,in addition to the generators. These other actors include distributors (in order to meet the demand of their unregulated users), large users with demand over10 MW, and a group of unregulated customers whose aggregate demand exceeds 10 MW.
The transmission system is made up of transmission lines, substations and equipment for the transmission of electricity from the production points(generators) to the consumption centers or distribution points. Transmission in Peru is defined as all lines or substations with a tension higher than 60 kV. Some generation and distribution companies also operate sub−transmission systems at the transmission level.
Electricity distribution is an activity carried out in the concession areas granted to different distribution companies.
Customers with a capacity demand lower than 200 kW are considered regulated customers, and their energy supply is considered a public service. Customers whose capacity demand is within the range of 200−2,500 kW are free to choose to be considered regulated or unregulated customers.
77

Table of Contents
There is only one interconnected system, the SEIN, and several isolated regional and smaller systems that provide electricity to specific areas. According to the National Institute of Statistics of Peru (INEI), 88.1% of the population obtained electricity through the public network in 2010, including98.2% in urban and 58.6% in rural areas.
Principal Regulatory Authorities
The Ministry of Energy and Mining (MINEM in its Spanish acronym) defines energy policies applicable nationwide, regulates environmental mattersapplicable to the energy sector and oversees the granting, supervision, maturity and termination of licenses, authorizations and concessions for generation,transmission, and distribution activities.
The Agency for the Promotion of Private Investment (PROINVERSIÓN in its Spanish acronym) is a public entity responsible for attracting privateinvestment in public utilities and infrastructure works. It also advises regarding the difficulties faced by investors in making their investments.
The Supervising Entity on Investment in Energy and Mining (Osinergmin in its Spanish acronym) is an autonomous public regulatory entity thatcontrols and enforces compliance with legal and technical regulations related to electrical and hydrocarbon activities, controls and enforces compliance withthe obligations stated in the concession contracts, and is responsible for the preservation of the environment in connection with the development of theseactivities. Osinergmin’s Tariff Regulatory Bureau has the authority to publish the regulated tariffs. Osinergmin also controls and supervises the biddingprocesses required by distribution companies to purchase energy from generators.
The Committee of Economic Operation of the System (COES) coordinates the SEIN’s short, medium− and long−term operations at minimum cost,maintaining the security of the system and optimizing energy resources. It also plans for the SEIN’s transmission development and manages the short−termmarket.
The National Institute for Defense of Competition and Intellectual Property (INDECOPI in its Spanish acronym) is responsible for promotingcompetition, protecting consumer rights and safeguarding all forms of intellectual property.
The General Electricity Authority (DGE in its Spanish acronym) is the regulatory technical entity responsible for evaluating the electricity sector, andproposes the necessary regulations for the development of the electricity generation, transmission and distribution activities.
The Ministry of Environment (MINAM in its Spanish acronym) defines environmental policies applicable nationwide and is the head of the nationalenvironmental management system, which includes the National Environmental Impact Assessment System, the National Environmental InformationSystem, the Protected Natural Areas System, as well as the management of natural resources in its area of competence, biodiversity and climate change,among others.
The Electricity Law
General
The general legal framework applicable to the Peruvian electricity industry includes: the Law of Electricity Concessions (Decree Law 25,844/1992)and its ancillary regulations, the Law to Secure the Efficient Development of Electricity Generation (Law 28,832/2006), the Technical Regulation on theQuality of the Electricity Supply (Supreme Decree 020/1997), the Electricity Import and Export Regulation (Supreme Decree 049/2005), the Antitrust Lawfor the Electricity Sector (Law 26,876/1997), and the law that regulates the activity of the Supervising Entity on Investments in Energy and Mining(Law 26,734/1996, together with Law 27,699/2002).
Some of the characteristics of the regulatory framework are (i) the separation of the three main activities: generation, transmission and distribution;(ii) freely−determined prices for the supply of energy in competitive market conditions; (iii) a system of regulated prices based on the principle of efficiencytogether with a bidding regime; and (iv) private operation of the interconnected electricity systems subject to the principles of efficiency and quality ofservice.
78

Table of Contents
Limits and Restrictions
Since the enactment of the Law of Electricity Concessions, vertical integration is restricted, and thus activities in the generation, transmission anddistribution segments must be developed by different companies. The Antitrust Law for the Electricity Sector regulates the cases in which vertical andhorizontal integration is admissible.
An authorization is compulsory for those electricity companies that hold more than 5% of another business segment, either before or as a result of amerger or integration. On the other hand, an authorization is also required for the horizontal integration of either generation, transmission and distributionactivities which result in a market share of 15% or higher of any business segment, either before or as a result of any operation.
Such authorizations are granted by the Institute for Defense of the Consumer and Intellectual Property, using the market share information provided byOsinergmin.
Generation Regulation
Concessions
Generation companies that own or operate a power plant with an installed capacity greater than 500 kW require a concession granted by the MINEM. A concession for electricity generation activity is an agreement between the generator and MINEM, while an authorization is merely a unilateral permitgranted by said public entity. Authorizations are granted by the MINEM for an unlimited period of time, although their termination is subject to the sameconsiderations and requirements as the termination of concessions under the procedures set forth in the Law of Electricity Concessions, and its relatedregulations.
In order to receive a concession, the applicant must first request for a temporary concession of two years, and must subsequently apply for a definitiveconcession.
In order to receive an authorization, the applicant must file a petition before the MINEM. If the petition is admitted and no opposition is presented, theMINEM grants the authorization to develop generation activities for unlimited time, subject to compliance with applicable regulations.
Dispatch and Pricing
The coordination of electricity dispatch operations, the setting of spot prices and the control and management of economic transactions that take placein the SEIN are controlled by COES. Generators can sell energy directly to large customers and buy the deficit or transfer the surplus between contractedenergy and actual production in the pool at the spot price.
Sales by Generation Companies to Unregulated Customers
Sales to unregulated customers are carried out at mutually agreed prices and conditions, which include tolls and compensation for the use oftransmission systems and, if necessary, to distribution companies for the use of their network.
Sales to Distribution Companies and Certain Regulated Customers
Sales to distributors can be under bilateral contracts at a price no greater than the regulated price in the case of regulated customers, or at an agreedprice in the case of unregulated customers. Besides the bilateral method allowed under the Law of Electricity Concessions, Law 28,832 has now alsoestablished the possibility that distributors may meet their unregulated or regulated customers’ demand under contracts signed following a capacity andenergy supply tender process.
Sales of Capacity of Other Generation Companies
Contracts between generators and distributors and/or unregulated customers relate generally to purchases and sales of capacity and the energyassociated with consumption of capacity.
The purchase/sale of capacity between generators occurs in the short−term market as a consequence of an economic balance between the valuation ofthe remunerated firm capacity of a generator made at the regulated capacity price (the guaranteed capacity revenue), and the valuation of distributioncustomers’ capacity needs, valued at the regulated capacity price and/or unregulated customers’ needs valued at the mutually agreed price (the capacitypurchase expenses).
79

Table of Contents
As the contracting of capacity of a generator and its valuation do not necessarily coincide with the guaranteed capacity revenue, there can be trading ofcapacity between generators.
The guaranteed capacity revenue of each generator is the sum of the guaranteed revenues of its generation units. The remunerated firm capacity ofeach generation unit results from considering all the units that, ordered by their variable costs and considering the effect of the transmission network, aretaken into account for a theoretical dispatch to meet the demand of the system during the monthly peak demand at the lowest optimal cost.
The direct sale of firm capacity is also possible between generators, under free negotiations.
Regulatory Charges
In addition to taxes applicable to all industries (mainly an income tax and a value added tax), the electricity industry operators are subject to a specialregulation contribution that compensates the costs incurred by the state in connection with the regulation, supervision and monitoring of the electricityindustry. The applicable rate for this contribution is up to 1% of the annual billing of each company and the funds levied are distributed proportionally tothe MINEM and Osinergmin.
Generators that also have hydroelectric plants pay a water royalty as a function of the hydroelectric energy produced and the regulated energy tariff atpeak hours.
Incentives and Penalties
During 2009, MINEM carried out several studies which concluded that, in the near future, SEIN would not tolerate any unavailability of large powerplants due to the lack of power generation capacity in the system. MINEM recommended the construction of new power plants that would serve as backup(“Cold Reserve”) in order to guarantee the flow of electricity to the system and avoid blackouts. As a result, PROINVERSIÓN carried out a public bid inAugust 2010, seeking to secure investments for an additional 800 MW in the system, divided into three projects located in Talara, Trujillo and Ilo. Nevertheless, the bid resulted with only two of the projects being awarded: Talara (200 MW, for EEPSA, a subsidiary of Endesa Latinoamérica) and Ilo(400 MW, for Enersur, an unrelated company). These plants will receive regular payments for being permanently available to operate and provide energy tothe SEIN whenever the COES calls on them and will also be reimbursed for the fuel costs incurred in generating electricity. The Trujillo generation facilitywas later substituted by the Eten generation facility, and awarded to Planta de Reserva Fría de Generación de Eten S.A. (200 MW).
Services provided by generation, transmission and distribution companies have to comply with technical standards stated in the Technical Regulationson the Quality of the Electric Supply. Failure to do so might result in the imposition of fines by Osinergmin.
In 2008, due to gas transport and electricity transmission problems, Osinergmin defined a new rule to calculate spot prices through December 2013. Decree 049/2008 established two models, one which represented a theoretical dispatch without considering any restrictions and another that considered realdispatch with restrictions. The spot price is obtained from the theoretical dispatch, and the additional operating costs resulting from system restrictions arepaid to the affected generators through a mechanism established by the authority.
Generators receive a capacity payment whose main component is the product of an annual calculation that considers firm power of every power plantconnected to the system. Every year, Osinergmin sets the power price that shall be assigned and paid to each generator pursuant to this concept.
Electricity Exports and Imports
A 220 kV transmission line has been implemented for the interconnection with Ecuador, with a limited capacity of 160 MW. However, the line hasnot operated continuously because of regulatory issues. During June and August 2011, energy imports were made from Ecuador due to the lack ofgeneration in northern Peru and transmission problems to that zone in the SEIN.
In addition to the interconnection with Ecuador, the governments of Peru and Brazil in 2010 signed the “Agreement between the Republic of Peru andthe Federal Republic of Brazil for the supply of electricity to Peru and export of surpluses to Brazil”, whose main purpose is the exploitation of Peruvianhydroelectric resources in the Amazon basin. In January 2012, Peru created a commission for handling the aspects contemplated in that agreement. Thegeneral framework establishes that the accumulated capacity of the generation plants that can be committed to export to Brazil is a maximum of 7,200 MWand dispatch will have the following order of priority: (1) the Peruvian regulated market, (2) the Peruvian unregulated market, and lastly, (3) the Brazilianmarket.
80

Table of Contents
The governments of Peru and Chile have established a bilateral working group to discuss energy matters, whose purpose is to identify and takeadvantage of the potential for existing energy complementarity between the two countries. The first few meetings of this group took place in 2011. At therequest of the presidents of both nations, the working group is expected to propose a framework for an agreement in connection with both countries’electricity integration that would establish the general rules for energy exchanges between them.
Distribution Regulation
Bids for Supplying Regulated Customers
The Law to Secure the Efficient Development of Electricity Generation established a bidding regime for the acquisition of energy and capacity bydistributors through a mechanism to determine prices during the life of a contract. The approval of this mechanism is important to generators, because itsets a mechanism for determining a price for the duration of a contract that is not fixed by the regulator.
The new contracts to sell energy to distribution companies for resale to regulated customers must be made at fixed prices determined by public bids. Only a small part of the electricity purchased by distribution companies (included in old contracts) is still maintained at node prices. These are set annuallyby Osinergmin and are the maximum prices for electricity purchased by distribution companies that can be transferred to regulated customers in thosecontracts.
Distribution Tariffs to Final Customers
The electricity tariff for regulated customers includes charges for capacity and energy for generation and transmission and for the VAD whichconsiders a regulated return on investments, operating and maintenance fixed charges and a standard percent for energy distribution losses.
Distribution Tariff−Setting Process
The VAD is set every four years. Osinergmin classifies companies into groups, according to “typical distribution areas,” based on economic factorsthat group companies with similar distribution costs due to population density, which determines equipment requirements in the network.
Actual return on investment for a distribution company depends on its performance relative to the standards chosen by the Osinergmin for a theoreticalmodel company. The tariff system allows for a greater return to distribution companies that are more efficient than the model company. Tariff studies areperformed by the Osinergmin and distribution companies. Preliminary tariffs are calculated as a weighted average of the results of the Osinergmincommissioned study and the companies’ study, with the results of the Osinergmin’s study bearing twice the weight of the companies’ study. Preliminarytariffs are then tested to ensure that they provide an average actual annual internal rate of return between 8% and 16% on the replacement cost ofelectricity−related distribution assets.
The last process for setting distribution tariffs was held in November 2009 and will be in effect until November 2013.
Regulatory Charges
The regulatory charges applied to the energy sales in distribution activities are:
• The contribution to regulatory authorities (Osinergmin, MINEM), which represents 1% of total sales.
• The Electrical Social Compensation Fund (FOSE), created to promote permanent access to the public electricity service for low−income residentialcustomers. This Fund established a cross subsidy system among consumers that benefits users with monthly consumption below 100 kWh through fixedand proportional discounts.
• The rural electrification charge is a contribution for promoting the efficient and sustainable electrification development in rural, isolated or frontier areasof the country. The contribution of the electricity users is of 0.002 UIT (a tax unit) per MWh billed, with the exception of those which are not served by theNational Interconnected System.
81

Table of Contents
Incentives and Penalties
Law 28,832 and DS 052−2007−EM (General Regulations of the Supply Auctions) affecting energy purchases state that if auctions are called for withan anticipation of over three years, distributors will receive a payment incentive which will be added to the generator price of the auctions, and then passedthrough to consumers. This incentive cannot be higher than 3% of the tariffs applied.
The distribution concessionaire may lose its concession if it does not provide evidence of a guaranteed supply for the following 24 months, at aminimum, unless it has called for public auctions according to the current norm and has not received offers sufficient to comply with its total requirementsfor the established period.
Transmission Regulation
Transmission activities are divided in two categories: “principal,” which are for common use and allow the flow of energy through the national grid;and “secondary,” which are those lines that connect a power plant with the national grid that connects principal transmission with the distribution networkor that connect directly to certain final consumers. Law 28,832 also defined “guaranteed transmission systems” and “complementary transmissionsystems,” applicable to projects commissioned after the enactment of that law. Guaranteed system lines are the result of a public bid and complementarysystem lines are freely constructed and exploited as private projects. Principal and guaranteed system lines are accessible to all generators and allowelectricity to be delivered to all customers. Transmission concessionaires receive an annual fixed income, as well as variable tariff revenues and connectiontolls per kW. The secondary and complementary system lines are accessible to all generators but are used to serve only certain customers who areresponsible for making payments related to their use of the system.
Environmental Regulation
The environmental legal framework applicable to energy related activities in Peru is set forth in the Environmental Law (Law 28,611/2005) and in theRegulation for Environmental Protection regarding Electricity Activities (Supreme Decree 029−94−EM). The MINEM dictates the specific environmentallegal dispositions applicable to electricity activities, and Osinergmin is in charge of supervising certain aspects of their application and implementation. According to the Environmental Law, the Ministry of Environment is in charge, as principal duties, of (i) designing the general environmental policies toevery productive activity; and (ii) establishing the main guidelines of the different government authorities for their specific environmental sectorregulations. During 2010, most supervision functions regarding the application and implementation of the Environmental Law’s dispositions weretransferred from Osinergmin to the Ministry of the Environment.
Renewable Energy Resources (RER) for electricity generation are considered to be from biomass, wind, solar, geothermal and tidal sources, plushydroelectric plants whose installed capacity does not exceed 20 MW.
In 2008, the authority issued regulations to promote the use of RER. The principal investment incentives established by these regulations are i) anobjective percentage of national electricity consumption, set every five years, to be covered by RER−based electricity generation, not includinghydroelectric plants (for the first five−year period, this percentage is 5%); ii) through tenders of energy to be covered by RER, the winning investor isguaranteed a firm price for the energy injected into the system during the supply contract period of up to 20 years; and iii) priority in the dispatch of loadand access to transmission and distribution networks.
The second RER tender was made in August 2011. From 1,300 GWh/year required from non−hydroelectric sources, 473 GWh were awarded in threeprojects out of 21 initiatives proposed.
In addition, other regulations establish tax incentives, including i) accelerated depreciation of assets for income tax purposes, and ii) the advancedrecovery of the sales tax. In 2011, the permanent congressional commission approved Law 29,764 extending these tax benefits through 2020.
Raw Materials
For information regarding Enersis’ raw materials, please see “Item 11(a) and 11(b). Quantitative and Qualitative Disclosures About Market Risk —Commodity Price Risk.”
82

Table of Contents
C. Organizational Structure.
Principal Subsidiaries and Affiliates
We are part of a group led by the Italian company, Enel. Enel owns 92.1% of Endesa Spain, and the latter owns 60.6% of the share capital of Enersisthrough its Spanish subsidiary Endesa Latinoamérica.
Enel is a publicly−traded company primarily engaged in the energy sector, with presence in 40 countries worldwide, and over 97,000 MW of netinstalled capacity. It provides service to more than 61 million clients through its electricity and gas businesses.
83

Table of Contents
The following chart shows the relative position of Enersis in the Enel Group, as well as our most important operating subsidiaries andjointly−controlled companies:
Enersis’ Simplified Organizational Structureas of December 31, 2011
The companies listed in the following table were consolidated by us as of December 31, 2011. In the case of subsidiaries, our economic interest iscalculated by multiplying our percentage economic interest in a directly held subsidiary by the percentage economic interest of any entity in the chain ofownership of such ultimate subsidiary.
84

Table of Contents
% EconomicOwnership of Consolidated Operating Income
Main Subsidiary Assets of Each of Each MainPrincipal Subsidiaries and Country of Operations by Enersis Main Subsidiary Subsidiary
(in billions of Ch$ except percentages)Electricity GenerationEndesa Chile (Chile) (1) 60.0% 6,562.0 973.9Endesa Fortaleza (Brazil) 54.3% 248.2 57.3Cachoeira Dourada (Brazil) 54.1% 263.1 93.8Electricity TransmissionCIEN (Brazil) 54.3% 361.0 68.8Electricity DistributionChilectra (Chile) 99.1% 1,310.2 119.7Ampla (Brazil) 70.2% 1,318.0 173.7Edesur (Argentina) 65.4% 357.0 (137.2)Edelnor (Peru) 57.5% 507.3 69.9Coelce (Brazil) 35.3% 1,101.3 181.0Codensa (Colombia) 21.7% 1,200.2 185.5Other non−electricity businessesIMV (Chile) 100.0% 66.8 5.7
(1) Endesa Chile consolidated all generation facilities in Chile, Argentina, Colombia and Peru.
Endesa Chile (Chile)
Endesa Chile is a publicly traded electricity generation company in Chile. On a stand−alone basis, excluding direct subsidiaries in Chile (describedbelow), Endesa Chile has a total installed capacity of 3,407 MW as of December 31, 2011, with 17 generation facilities. Of the total capacity, 67% comesfrom hydroelectric power plants, including Ralco with 690 MW, El Toro with 450 MW, Rapel with 377 MW, and Antuco with 320 MW, among others. Regarding our thermoelectric facilities, nearly 89% are gas/fuel oil power plants, and the rest are coal−steam power plants. Our economic interest in EndesaChile is 60.0%.
Celta (Chile)
Celta was formed in 1995 to build and operate two thermoelectric plants in the SING: a coal−fired plant with an installed capacity of 158 MW and agas/fuel oil power plant with 24 MW of installed capacity. Celta is wholly−owned by Endesa Chile. Our economic interest in Celta is 60.0%.
Endesa Eco (Chile)
In April, 2005, Endesa Chile created Endesa Eco S.A., whose objectives are the promotion and development of renewable energy projects such asmini−hydro, wind, geo−thermal, solar and biomass power plants and to act as the depositary and trader of emission reduction certificates obtained by theseprojects. As of December 31, 2011, Endesa Eco’s installed capacity was 87 MW. Endesa Eco is a wholly−owned subsidiary of Endesa Chile. Oureconomic interest in Endesa Eco is 60.0%.
San Isidro (Chile)
San Isidro, a company wholly−owned by Endesa Chile, was incorporated in Chile in 1996 to build and operate a 379 MW combined−cycle thermalplant in Quillota, in the Valparaíso Region. The plant began commercial operations in 1998. A 220 kV transmission line of 9 kilometers was built toconnect this thermal plant to the SIC. This transmission system is owned by Transmisora Eléctrica de Quillota Ltda. (Transquillota), in which San Isidrohas a 50% interest. Our economic interest in San Isidro is 60.0%.
Pangue (Chile)
Pangue was incorporated with the objective to build and operate a 467 MW installed capacity hydroelectric power station on the Bío−Bío River. Thefirst unit started operations in 1996 and the second unit started operations in 1997. Endesa Chile holds 95% of Pangue’s share capital. Our economicinterest in Pangue is 57.0%.
85
Table of Contents
Pehuenche (Chile)
Pehuenche, a generation company connected to the SIC, owns three hydroelectric facilities south of Santiago in the high rainfall hydrological basin ofthe Maule River, with a total installed capacity of 699 MW. The 570 MW Pehuenche plant started operations in 1991, the 89 MW Curillinque plant startedoperations in 1993, and the 40 MW Loma Alta plant started operating in 1997. Endesa Chile holds 92.7% of Pehuenche. Our economic interest inPehuenche is 55.6%.
El Chocón (Argentina)
El Chocón is an electricity generation company, incorporated in Argentina, located between the Neuquén and Río Negro provinces, in theComahue Basin in southern Argentina. It has two hydroelectric power stations with an aggregate installed capacity of 1,328 MW. A 30−year concession,which expires in 2023, was granted by the Argentine government to our subsidiary, Hidroinvest S.A., which bought 59.0% of the shares in July 1993 duringthe privatization process. Endesa Chile operates El Chocón for a fee pursuant to an operating agreement with a term equal to the duration of the concession. Endesa Chile increased its beneficially owns 65.4% of El Chocón.
Endesa Costanera (Argentina)
Endesa Costanera is a publicly traded electricity generation company in Argentina, with 2,324 MW of total installed capacity in Buenos Aires,including six steam turbines with an aggregate capacity of 1,138 MW which burn oil and gas, and two natural gas combined−cycle facilities with a totalcapacity of 1,186 MW. The company was acquired from the Argentine government after the privatization of Servicios Eléctricos del Gran BuenosAires S.A. Endesa Chile owns 69.8% of Endesa Costanera.
Edegel (Peru)
Edegel, an electricity generation company, was acquired by Endesa Chile in 1995. It currently owns seven hydroelectric plants and two thermal plants,with a combined installed capacity of 1,668 MW. In October 2009, Endesa Chile purchased an additional 29.4% stake in Edegel from Generalima, asubsidiary of Endesa Latinoamérica. Thus, Endesa Chile increased its beneficial ownership in Edegel from 33.1% to 62.5% in 2009.
Edegel contributed equity for the subsidiary Chinango S.A.C. in March 2008. Edegel holds an 80% share of Chinango, and Peruana deEnergía S.A.A. owns the remaining 20% share.
Emgesa (Colombia)
Emgesa has a total installed generating capacity of 2,914 MW of which 85% corresponds to hydroelectric power plants and the remaining tothermoelectric power plants. In September, 2007 Central Hidroeléctrica Betania S.A. E.S.P. and Emgesa S.A. E.S.P. were merged into Betania, which thenadopted the name of Emgesa S.A. E.S.P.
In September 1997, Central Hidroeléctrica Betania, through its former subsidiary Inversiones Betania S.A. and in association with EndesaDesarrollo, S.A. of Spain, was awarded control of Emgesa through Capital de EnergíaS.A. (CESA), with 48.5% of the shares. In January 2006, due to acompany restructuring, CESA ceased to exist. In March 2006, Emgesa purchased the assets of Termocartagena (208 MW) through a public tender process.Empresa de Energía de BogotáS.A. has a direct 51.5% equity interest in Emgesa. Endesa Chile’s beneficial ownership in Emgesa is 26.9%; however, ithas 31.3% of the voting rights, and due to a transfer of rights from another subsidiary of Endesa Spain, Endesa Chile has the right to appoint the majority ofthe Board members and, therefore, controls Emgesa.
Endesa Brasil (Brazil)
In 2005, Endesa Brasil was formed as a company to manage all generation, transmission and distribution assets that Endesa Latinoamérica, asubsidiary of Endesa Spain, held together with Enersis, Endesa Chile and Chilectra in Brazil; namely, through Ampla, Endesa Fortaleza, CIEN,Cachoeira Dourada and Coelce. Enersis has a beneficial interest of 54.3% in Endesa Brasil.
Endesa Fortaleza (Brazil)
Located in the municipality of Caucaia, 50 kilometers from the capital of the State of Ceará, Endesa Fortaleza is a combined−cycle power plant of322 MW fueled by natural gas, with a capacity to generate a third of the electricity requirements of Ceará, with a population of 8.2 million people. Fortaleza is wholly−owned by Endesa Brasil. We hold a 54.3% economic interest in Endesa Fortaleza.
86

Table of Contents
Cachoeira Dourada (Brazil)
Located in the State of Goias, 240 kilometers south of Goiania, Cachoeira Dourada (Cachoeira) is a hydro run−of−the−river plant using the flows fromthe Paranaiba River, with ten generating units totaling 665 MW of installed capacity. Cachoeira started operations in 1997. Net generation for 2011 was3,121 GWh, while sales amounted to 3,986 GWh. Endesa Brasil has a 99.6% ownership interest in Cachoeira and our economic interest is 54.1%.
CIEN (Brazil)
CIEN, a Brazilian transmission company wholly−owned by Endesa Brasil, transmits electricity through two transmission lines between Argentina andBrazil covering a distance of 500 kilometers, with a total interconnection capacity of 2,100 MW. CIEN consolidates CTM and TESA, which operate theArgentine side of the interconnection line with Brazil. Our economic interest in CIEN is 54.3%.
Ampla (Brazil)
Ampla is the second largest electricity distribution company in the State of Rio de Janeiro, Brazil as measured by the number of clients and annualenergy sales. Ampla is engaged mainly in the distribution of electricity to 66 municipalities of the State of Rio de Janeiro and serves 2.6 million customersin a concession area of 32,615 square kilometers. As of December 31, 2011, we had a 70.2% economic interest in Ampla.
Coelce (Brazil)
Coelce is the sole electricity distributor in the State of Ceará, in northeastern Brazil. As of December 31, 2011, Coelce served over 3.2 millioncustomers within a concession area of 148,825 square kilometers. We hold a 35.3% economic interest in Coelce.
Chilectra (Chile)
Chilectra is one of the largest electricity distribution companies in Chile as measured by the number of regulated clients, distribution assets and energysales. Chilectra operates in a concession area of 2,118 square kilometers in the Santiago metropolitan area serving approximately 1.6 million customers. Our economic interest in Chilectra is 99.1%.
Edesur (Argentina)
Edesur is the second largest electricity distribution company in Argentina measured by energy purchases. Edesur operates in a concession area of3,309 square kilometers in the south−central part of the greater Buenos Aires metropolitan area serving approximately 2.4 million customers. Our economicinterest in Edesur is 65.4%
Codensa (Colombia)
Codensa, an electricity distribution company that serves a concession area of 18,217 square kilometers in Bogotá and 96 other municipalities in theDepartment of Cundinamarca, Tolima and Boyacá, serves approximately 2.6 million customers. We hold a 21.7% economic interest in Codensa, and due toa transfer of rights from another Endesa Spain subsidiary, we appoint the majority of the Board members and, therefore, control this company.
Edelnor (Peru)
Edelnor, a Peruvian electricity distribution company, operates in a concession area of 2,440 square kilometers. It has an exclusive concession todistribute electricity in the northern part of the Lima metropolitan area, some provinces of the Lima department such as Huaral, Huaura, Barranca and Oyón,and in the adjacent province of Callao. As of December 31, 2011, Edelnor distributed electricity to approximately 1.1 million customers. We hold 57.5%of the economic interest in Edelnor.
Inmobiliaria Manso de Velasco (Chile)
Inmobiliaria Manso de Velasco, a wholly−owned subsidiary, develops real estate projects in Chile and represents less than 0.2% of our 2011 operatingrevenues before consolidation adjustments.
87

Table of Contents
Selected Related and Jointly−Controlled Companies
Electrogas (Chile)
Electrogas, constituted in 1996, offers natural gas transportation services to the Valparaíso Region in Chile, especially to the San Isidro and Nehuencocombined−cycle plants at Quillota. Endesa Chile has a beneficial interest of 42.5% share in this company. The other shareholders are ColbúnS.A. andEmpresa Nacional del Petróleo S.A. (ENAP, in its Spanish acronym). Our economic interest is 25.5%.
Endesa Cemsa (Argentina)
Cemsa is responsible for trading electricity. As of the date of this Report, Endesa Chile has an indirect ownership holding in Cemsa of 45% andEndesa Spain’s Endesa Latinoamérica owns the remaining 55%. Our economic interest is 27%.
GNL Quintero (Chile)
GNL Quintero was incorporated in March, 2007. Endesa Chile has a 20% ownership interest and the remaining interest is owned by British Gas(40%), ENAP (20%) and Metrogas (20%). This company operates a LNG regasification facility located in Quintero Bay whereby LNG is unloaded, storedand regasified.
This project was built by Chicago Bridge & Iron and currently has a regasification capacity of 9.6 million m3 per day and two 160,000 m3 LNGcontainment tanks. Our economic interest is 12.0%.
GasAtacama (Chile)
Endesa Chile has a 50% beneficial interest in GasAtacama, located in the northern Region of Chile. Since 2007, Southern Cross Latin AmericaPrivate Equity Fund III, L.P. owns the remaining 50% beneficial interest. Subsidiaries of this holding company were Gasoducto Atacama Chile S.A.,Gasoducto Atacama Argentina S.A. and GasAtacama Generación S.A., which are involved in electricity generation and natural gas transportation. InNovember, 2008, GasAtacama Generación S.A. and Gasoducto Atacama Chile S.A. merged into GasAtacama Generación S.A., which changed its name toGasAtacama Chile S.A. Our economic interest is 30.0%.
HidroAysén (Chile)
HidroAysén was incorporated in March 2007. Endesa Chile has a 51% ownership interest and Colbún S.A. the remaining 49%. The company wascreated to develop and exploit a hydroelectric project located in the Aysén Region, in the southern region of Chile. Our economic interest is 30.6%.
Transquillota (Chile)
Transquillota was incorporated in June 1997, as part of an agreement between San Isidro and Colbún, for the joint development of a 220 kVtransmission line for dispatching the energy produced and connecting San Isidro and Nehuenco (subsidiary of Colbún) plants to the Central InterconnectedElectric System (SIC). The 220 kV transmission line is 8 kilometers long. The property is equally divided among San Isidro and Nehuenco. Endesa Chile’s economic interest is 30.3%.
For additional information of all Endesa Chile’s subsidiaries and jointly−controlled companies, please refer to Appendix 1 of our ConsolidatedFinancial Statements.
D. Property, Plants and Equipment.
Our Property, Plant and Equipment are concentrated primarily on electricity generation, distribution and transmission assets in the five countriesin which we operate.
Property, Plants and Equipment of Generating Companies
We conduct our generation and transmission businesses through our subsidiaries, Endesa Chile and Endesa Brasil. In Chile, Endesa Chile owns 24generation power plants and consolidates revenues from four others, for a total of 28 plants. Endesa Chile also consolidates revenues from other nonwholly−owned generation companies in Argentina, Colombia and Peru, which involve an additional 26 generation power plants. Finally, throughEndesa Brasil, through whom we conduct our Brazilian operations, we
88

Table of Contents
consolidate revenues from two other generation power plants, thereby aggregating a total of 56 power plants in South America. Through Endesa Brasil, wealso own and a transmission system consisting of two 2,100 MW transmission lines 500 kilometers long, linking Rincón de Santa María in Argentina withItá in the State of Santa Catarina in Brazil.
A substantial portion of our generating subsidiaries’ cash flow and net income is derived from the sale of electricity produced by its electricitygeneration facilities. Significant damage to one or more of their main electricity generation facilities or interruption in the production of electricity, whetheras a result of an earthquake, flood, volcanic activity or any other such cause, could have a material adverse effect on their operations. Our generatingsubsidiaries insure all electricity generation facilities against damage due to earthquakes, fires, floods, other Acts of God (but not for prolonged droughts,which is a risk not covered by insurance companies) and from damage due to third−party actions, based on the appraised value of the facilities asdetermined from time to time by an independent appraiser. Based on geological, hydrological and engineering studies, management believes that the risk ofan event with a material adverse effect is remote. Claims under our generating subsidiaries’ insurance policies are subject to customary deductibles andother conditions. We also maintain business interruption insurance providing for coverage for failure of any of our facilities for a period of up to 24 months,including the deductible period.
The insurance coverage taken for non−Chilean property is approved by each company’s management, taking into account the quality of the insurancecompanies and the needs, conditions and risk evaluations of each generating facility, and is based on general corporate guidelines.
All insurance policies are purchased from reputable international insurers. We continuously monitor and meet with the insurance companies in orderto obtain what we believe is the most commercially reasonable insurance coverage.
The following table identifies the power plants that we own, at the end of each year, and their basic characteristics:
Installed CapacityCountry/Company Power Plant Name Power Plant Type (1) 2009 2010 2011
MW
ArgentinaEndesa Costanera Total 2,324 2,324 2,324
Endesa Costanera Steam TurbineSteam Turbine/Natural Gas+ Fuel Oil 1,138 1,138 1,138Endesa Costanera Combined Cycle IICombined Cycle/Natural Gas+Diesel
Oil 859 859 859Central Buenos Aires Combined
Cycle ICombined Cycle/Natural Gas
327 327 327
El Chocón Total 1,328 1,328 1,328Chocón Reservoir 1,200 1,200 1,200Arroyito Pass−through 128 128 128
Total Capacity in Argentina 3,652 3,652 3,652
BrazilCachoeira Dourada Cachoeira Dourada Pass−through 665 665 665Endesa Fortaleza Endesa Fortaleza Combined Cycle/Gas 322 322 322Total Capacity in Brazil 987 987 987
ChileEndesa Chile Total 3,446 3,407 3,407
Total Hydroelectric 2,290 2,290 2,290Rapel Reservoir 377 377 377Cipreses Reservoir 106 106 106El Toro Reservoir 450 450 450Los Molles Pass−through 18 18 18Sauzal Pass−through 77 77 77Sauzalito Pass−through 12 12 12Isla Pass−through 70 70 70
89

Table of Contents
Antuco Pass−through 320 320 320Abanico Pass−through 136 136 136Ralco Reservoir 690 690 690Palmucho Pass−through 34 34 34Total Thermal 1,156 1,117 1,117Huasco (2) Steam Turbine/Coal 16 0 0Bocamina Steam Turbine/Coal 128 128 128Diego de Almagro (3) Gas Turbine/ Diesel Oil 47 24 24Huasco Gas Turbine/IFO 180 Oil 64 64 64Taltal Gas Turbine/Natural Gas+Diesel Oil 245 245 245San Isidro 2 Combined Cycle /Natural Gas+Diesel
Oil 399 399 399Quintero Gas Turbine/Natural Gas+Diesel Oil 257 257 257
Pehuenche Total 699 699 699Pehuenche Reservoir 570 570 570Curillinque Pass−through 89 89 89Loma Alta Pass−through 40 40 40
Pangue Pangue Reservoir 467 467 467San Isidro San Isidro Combined Cycle /Natural Gas+Diesel
Oil 379 379 379Celta Total 182 182 182
Tarapacá Steam Turbine/Coal 158 158 158Tarapacá Gas Turbine/Diesel Oil 24 24 24
Endesa Eco Total 87 87 87Canela Wind Farm 18 18 18Canela II Wind Farm 60 60 60Ojos de Agua Pass−through 9 9 9
GasAtacama Atacama Combined Cycle /Natural Gas+DieselOil 390 390 390
Total Capacity in Chile 5,650 5,611 5,611
ColombiaEmgesa Total 2,895 2,914 2,914
Guavio Reservoir 1,213 1,213 1,213Paraíso Reservoir 276 276 276La Guaca Pass−through 325 325 325Termozipa Steam Turbine/Coal 236 236 236Cartagena Steam Turbine/ Natural Gas + Diesel
Oil 208 208 208Minor plants (4) Pass−through 96 116 116Betania Reservoir 541 541 541
Total Capacity in Colombia 2,895 2,914 2,914PeruEdegel Total 1,473 1,474 1,474
Huinco Pass−through 247 247 247Matucana Pass−through 129 129 129Callahuanca Pass−through 80 80 80Moyopampa Pass−through 65 66 66Huampani Pass−through 30 30 30Yanango (5) Pass−through — — —Chimay (5) Pass−through — — —Santa Rosa Gas Turbine/Diesel Oil 430 429 429Ventanilla Combined Cycle/Natural Gas 493 493 493
Chinango Total 194 194 194Yanango Pass−through 43 43 43
90
Table of Contents
Chimay Pass−through 151 151 151Total Capacity in Peru 1,667 1,668 1,668Total Endesa Chile 14,851 14,833 14,833
(1) Reservoir and pass−through refer to a hydroelectric plant that uses the force of a dam or a river, respectively, to move the turbines which generateelectricity.“Steam” refers to the technology of a thermal power plant that uses natural gas, coal, diesel or fuel oil, to produce steam that moves the turbines togenerate electricity.“Gas Turbine” (GT) or “Open Cycle” refers to the technology of a thermal power plant that uses either diesel or natural gas to produce gas thatmoves the turbines to generate electricity.“Combined Cycle” refers to the technology of a thermal power plant that uses natural gas, diesel oil or fuel oil to generate gas that first moves theturbines to generate electricity and then recovers the gas that escapes from that process to generate steam to move another turbine.“Wind Farm” refers to the technology that transforms the kinetic energy of wind into electricity.
(2) The commercial operation of Huasco’s steam/coal turbine ended on July 31, 2010.(3) Until March 2010, the information includes one additional unit of Diego de Almagro (23 MW), which Endesa Chile had rented from Codelco since
2001.(4) Minor plants are registered with a total capacity of 116 MW. As of December 31, 2011 Emgesa owned and operated six minor plants: Charquito, El
Limonar, La Tinta, Tequendama, La Junca and San Antonio.(5) In May 2009, the Yanango and Chimay power plants were transferred to Chinango, Edegel’s subsidiary.
As of December 31, 2011, the Company had received the international standard ISO 14,001 certification of 100% of its installed capacity in SouthAmerica, which included 56 out of 56 generation facilities that produced 100% of the total annual generation according to the ISO 14,001 standard.
Investment Projects Completed during 2011
Not applicable.
Projects under Construction
Chile. Bocamina Power Plant Expansion, Second Unit
Located in the district of Coronel, Bío−Bío Region, the project benefits from the existing harbor services, as well as some ancillary facilities of the firstunit, built for coal storing and ashes disposal. This second unit will use pulverized coal and technology for emissions reduction. Its installed capacity isestimated at 370 MW. As a result of the February 27, 2010 earthquake, which severely affected the Bío−Bío Region, the start−up date, originally expectedfor December 2010, has been postponed. In the transmission−system connection project, the hanging of the last 1.7 km section (Lagunillas—Hualpén) wascompleted on December 2, 2011. The start−up of this project is expected during the second half of 2012. This project is being financed with internallygenerated funds.
Colombia. El Quimbo Hydroelectric Project
El Quimbo hydroelectric project is located in the department of Huila, on the Magdalena River, upstream of the Betania power plant. Its installedcapacity will be 400 MW through two generation units. We expect the project to start operations by December 2014. This project will be financed mainlywith external sources, and to a lesser extent, with Emgesa’s internally generated funds. In January 2011, Emgesa issued bonds in the international marketsfor the equivalent of $ 400 million. In 2009, the Ministry of the Environment approved the environmental license and building permission. As a result ofthe awarding process, Emgesa assumed a Firm Energy Obligation for El Quimbo starting in December 2014.
The principal contracts, corresponding to the civil works and the manufacture, supply and assembly of the equipment, were awarded to theImpregilo−OHL consortium and the Alstom — Schrader Camargo consortium. On July 30, 2011, the Impregilo−OHL Consortium completed theconnection of the underground excavation fronts for Ventana 1 and Ventana 2, at the vault level. The deviation of the Magdalena River was successfullyachieved in March 2012.
91

Table of Contents
Argentina. Vuelta de Obligado Power Plant Project
The project is developed by a consortium consisting of SADESA ( 56%), Hidroeléctrica El Chocón S.A. (33%), Central Dock Sud S.A. (10%) andEndesa Costanera (1%), as a result of the agreement between the Argentine government and the electricity generation companies with which the state hasdebts for energy sales since 2008. The project consists of the construction of a natural gas combined−cycle plant of approximately 800 MW located atTimbúes, Santa Fe province, adjacent to FONINVEMEM’s San Martín thermal plant. The future energy production of this plant will be used to coverincreases in demand on the National Grid System under a 10−year supply contract.
An international tender was called during 2011 for the turnkey construction of the plant under an EPC contract and for maintenance under a 10−yearlong−term supply agreement (LTSA). The bids received are currently being evaluated. The start−up of the first machine is estimated for the last quarter of2013. The commercial start−up of the combined cycle is expected for the first quarter of 2015.
Projects under Development
The estimated investments disclosed in this section aggregate the funds that the Company expects to spend in dollars each year. Budgeted amountsinclude connecting lines that could eventually be owned by third parties and paid as tolls. In general terms, projects are expected to be financed withresources to be provided by external financing as well as internally generated funds for each of the companies described.
We continuously analyze different growth opportunities in the countries in which we participate. Thus, the expected start−up for each project iscontinuously assessed and will be defined based on the commercial opportunities and the financing capacity of the Company to fund these projects. Themost relevant projects in the pipeline are as follows:
Chile. Los Cóndores Project
The Los Cóndores project will be located in the Maule Region. It consists of the construction of a pass−through hydroelectric plant of 150 MWinstalled capacity, which will use the waters from the Maule lake reservoir through an adduction system 12 kilometers long. The power plant will beconnected to the SIC at the Ancoa substation through a 220 kV transmission line.
The feasibility study has been completed, considering the tunnel construction using TBM technology (tunnel machinery) which involves higherefficiencies, safety standards and a lower environmental impact. The environmental permit for this generation power plant was obtained in 2011. At theend of 2011, the basic engineering was completed. The environmental approval process for the transmission line began in October 2010 and is still inprocess.
Chile. Neltume Hydroelectric Project
The Neltume project is located in Los Ríos Region, on the upper part of the Valdivia River basin. The Neltume project consists of a 490 MW installedcapacity pass−through hydro plant. The power plant will be connected to the SIC through a 220 kV transmission line from Neltume to Loncoche, viaPullinque.
The Neltume power generation project has been under the environmental permission process since December 2010. During 2011, the basic engineeringstudies began and complementary studies for environmental process were developed. During 2012 and 2013, we expect to complete the basic engineeringstudies and to obtain the environmental authority permissions.
Chile. HidroAysén Project
The HidroAysén hydroelectric project consists of five hydroelectric power stations, with an aggregate installed capacity of 2,750 MW, two of which arein the Baker River (660 MW and 360 MW) and the other three are in the Pascua River (770 MW, 500 MW and 460 MW). Connection to the SIC consistsof a 500 kV high−voltage direct current (HVDC) transmission line whose length depends on whether the injection of energy is made in the central zone ofthe SIC (1,912 km further north) or at the SIC’s southernmost point (1,000 km further north).
On May 9, 2011, the environmental authority approved the Environmental Impact Assessment presented for the HidroAysén project. However,HidroAysén presented an appeal against the environmental qualification resolution issued, requesting the revision of certain demands. This has to beanalyzed and resolved, together with those presented by other parties, by a committee of public
92

Table of Contents
cabinet members. In addition, work was carried out in 2011 on the preparation of the environmental impact assessment for the direct current transmissionline, which is intended to be submitted for processing in 2012.
Chile. Punta Alcalde Power Plant
The project consists of the construction of a thermoelectric plant with two steam−coal units, with a total installed capacity of 740 MW, located in theAtacama Region. The plant will be connected to the SIC at the Maitencillo substation through a 220 kV transmission line.
In 2011 the power plant generation feasibility study and on−site studies were carried out. In 2012, we expect to obtain the environmental authoritypermissions. The environmental study for the transmission line is expected to be submitted in the first half of 2012.
Peru. Curibamba Hydroelectric Project
This relates to a pass−through power plant with an effective capacity of 188 MW to produce 1,010 GWh/year. This would be located upstream fromthe intake of the Chimay hydroelectric power plant in the department of Junín and would use the waters of the Comas and Uchubamba Rivers through an8.1 km pressure tunnel.
The geo−technical prospection works were finished on September 23, 2011 and the exploration gallery works completed on December 29, 2011, whilework has continued on the engineering and basic design. The plant’s environmental impact assessment (EIA) continues its normal process. We receivedthe third round of questions from the authorities on December 26, 2011.
On November 25, 2011, the transmission line’s environmental impact assessment and the executive summary corresponding to the General Directorate ofEnergy Environmental Matters (DGAAE) were submitted. The environmental approval is foreseen for 2012, both for the plant and for the transmissionline, in addition to the definitive concession. The basic design for the plant and the transmission line will be completed before calling for the respectivetenders for the construction contracts.
Property, Plants and Equipment of Transmission and Distribution Companies
We also have significant interests or investments in electricity distribution. The description for each distribution company is included in this “Item 4. Information on the Company.” The table set forth below describes our main equipment used for our distribution business, such as transmission lines,substations, distribution networks and transformers.
We are insured against damage to substations, transformers that are within the substations, the distribution network that is not farther than 1 kilometerfrom the substations and administrative buildings. Risks covered include losses caused by fires, explosions, earthquakes, floods, lightning, damage tomachinery and other such events. Insurance policies include liability clauses, which protect our companies from complaints made by third parties.
Transmission lines and the equipment attached to them do not qualify as insurable assets for property damage, although they have insurance policiesincluding civil liability clauses for damages against third parties caused by these transmission installations. This criterion applies in the case of theArgentina−Brazil interconnection line, our main transmission asset, for which there is insurance coverage for damage to the assets and civil liability for theGarabí conversion station, the Argentina/Brazil connection substations and up to 1 km of lines from the substations. Only third−party liability coverage isapplicable for the rest of the transmission lines.
93

Table of Contents
TABLE OF DISTRIBUTION FACILITIES
General Characteristics
Concession AreaTransmissionLines (km) (1)
Location (km2) 2009 2010 2011Chilectra Chile 2,118 355 355 355
Edesur Argentina 3,309 1,162 1,162 1,139Edelnor Peru 2,440 436 449 464Ampla Brazil 32,615 2,333 2,339 2,339Coelce Brazil 148,825 4,312 4,351 4,504Codensa Colombia 14,087 1,240 1,240 1,246EEC (2) Colombia 5,186 34 35 35Total 208,580 9,872 9,932 10,082
(1) The transmission lines consist of circuits with voltages in the 27−220 kV range.(2) We include 49% of EEC.
Power and Interconnection Substations and Transformers (1)
2009 2010 2011Number of
SubstationsNumber of
Transformers
Capacity
(MVA)
Number of
SubstationsNumber of
Transformers
Capacity
(MVA)
Number of
SubstationsNumber of
Transformers
Capacity
(MVA)
Chilectra 53 149 6,729 53 152 6,904 53 155 7,023Edesur 67 173 11,481 67 173 11,481 66 171 11,547Edelnor 29 64 2,572 29 67 2,757 30 69 2,883Ampla 117 226 4,434 116 222 4,386 116 221 4,452Coelce 97 154 2,211 98 156 2,273 99 160 2,406Codensa 62 208 7,524 62 211 7,665 63 225 8,619EEC (2) 23 32 161 23 31 170 23 33 174Total 448 1,006 35,112 448 1,012 35,636 450 1,034 37,104
(1) Voltage of these transformers is in the range of 500 kV (high voltage) and 7 kV (medium voltage).(2) We include 49% of EEC.
Distribution Network − Medium and Low Voltage Lines (1)
2009 2010 2011Medium Voltage
(km)Low Voltage
(km)
Medium Voltage
(km)Low Voltage
(km)
Medium Voltage
(km)Low Voltage
(km)
Chilectra 4,822 9,964 4,945 10,285 4,993 10,476Edesur 7,223 15,870 7,318 15,937 7,347 15,985Edelnor 3,597 18,708 3,694 19,234 3,854 19,826Ampla 32,052 17,146 32,562 17,278 33,078 17,459Coelce 74,829 44,297 78,578 45,684 79,759 46,115Codensa 18,881 22,202 19,104 22,579 19,276 23,586EEC (2) 3,606 5,430 3,624 5,608 3,724 5,474Total 145,011 133,618 149,824 136,605 152,031 138,921
(1) Medium voltage lines: 7 kV—34.5 kV; low voltage lines: 380−110 V.(2) We include 49% of EEC.
94

Table of Contents
Transformers for Distribution (1)
2009 2010 2011Number of
TransformersCapacity(MVA)
Number of
TransformersCapacity(MVA)
Number of
TransformersCapacity(MVA)
Chilectra 28,057 6,256 28,362 6,500 28,384 6,782Edesur 23,474 5,339 23,583 5,508 23,520 5,651Edelnor 9,540 1,304 9,665 1,347 9,878 1,443Ampla 105,308 3,701 107,663 3,882 110,473 4,115Coelce 124,800 3,944 128,836 4,411 134,132 4,508Codensa 64,792 7,821 65,836 8,055 66,570 8,301EEC (2) 6,628 321 6,687 304 6,808 312Total 362,599 28,686 370,632 30,007 379,765 31,112
(1) Voltage of these transformers is in the range of 34.5 kV (medium voltage) and 110 V (low voltage).(2) We include 49% of EEC.
Major Encumbrances
Endesa Costanera’s supplier debt with Mitsubishi Corporation corresponds to the remaining payments in the purchase of equipment. As ofDecember 31, 2011, the value of the assets pledged as liens on this debt was Ch$ 42 billion. Additionally, Endesa Costanera has executed liens for Ch$ 11billion as of December 31, 2011 in favor of Credit Suisse First Boston in order to guarantee a loan.
Edegel executed a debt arising from the financing of the Ventanilla power plant. As of December 31, 2011, the value of the assets pledged as liens forthis debt was Ch$ 100 billion.
In addition, Fortaleza executed a loan agreement with the International Finance Corporation (IFC) to finance the construction of this power plant inBrazil. Fortaleza granted liens for the IFC that include a mortgage and a pledge on assets which, as of December 31, 2011 were valued at Ch$ 175 billion. For further information, see Note 34 of our audited Consolidated Financial Statements.
Climate Change
In recent years, the country and the region have seen a growing development related to non−conventional renewable energy and strategies to faceclimate change. This has led both the public and private sectors to conduct suitable strategies for adapting themselves to the new requirements, evidencedby legal obligations at the local level, commitments assumed by countries at the international level and the demanding requirements of the internationalmarkets in these matters.
Non−conventional renewable energies (NCRE) provide energy with minimal environmental impact and without CO2 emissions. They are thereforeconsidered as technological options that strengthen sustainable energy development as they supplement the production of traditional generators.
During 2011, Enersis and its subsidiaries, in particular Endesa Chile’s subsidiary Endesa Eco, carried out several activities and held working meetingswith different public, academic and private entities, in order to learn and share experiences concerning the technical and regulatory developments inconnection with NCRE and climate change at both the local and international levels, analyze and establish strategic alliances, develop social and privateprojects and strengthen the leadership position achieved by the company in Chile.
The Canela wind farm (18 MW, in operation since late 2007), Ojos de Agua mini−hydroelectric plant (9 MW, in operation since 2008) and Canela IIwind farm (60 MW, in operations since late 2009) are the NCRE facilities owned by the company, which have contributed with clean and renewable energyto the national grid.
Regarding the development of CO2 emission reduction mechanisms, during 2011, the projects in the Clean Development Mechanism (CDM) circuitwere as follows:
Ojos de Agua Mini−Hydroelectric Plant: In 2009, the verification of the greenhouse gas emissions (CO2) avoided by the Ojos de Aguamini−hydroelectric plant during the previous period were begun, so as to certify and trade these emission reductions under the CDM. As a result of theverification process, during 2010 and 2011 the company has been analyzing administrative and technical modifications to the monitoring procedures, inorder to meet the requirements of the United Nations Framework Convention on Climate Change (UNFCCC) for CDM projects. As of the date of thisReport, the company is working on these administrative and
95

Table of Contents
technical changes. Since its start−up in 2008, the installation has avoided the emission of some 63,000 tons of CO2, which can be traded once they areverified.
Canela Wind Farm:On April 3, 2009, the UNFCCC approved the registration of the Canela project in the CDM circuit as a CDM project, whichrecognizes that this wind farm may verify and trade the greenhouse gas emissions it will avoid during its useful life. During 2011 the company had to studyand evaluate some adjustment and modifications to the CDM monitoring plan, in order to meet the requirements of the UNFCCC. As of the date of thisReport, the company is working on these activities. Since its start−up in 2009, the installation has avoided the emission of about 65,000 tons of CO2, whichwill be able to be traded on the CDM circuit as soon as they are verified.
Canela II Wind Farm: As part of the validation process of the Canela II wind farm as a CDM project, the Designated Operational Entity (DOE)requested in 2011 some clarifications and new information to prepare the application for registration. The validation report was issued on June 22, 2011,and the registration submission to the UNFCCC was requested on July 20, 2011. As of the date of this Report, the registration process has not finished. According to the base−line analysis presented in the Project Design Document (PDD), we estimate that the facility will avoid the emission of 89,608 tons ofCO2 annually.
Detail of CDM projects processed in 2011 by Endesa Eco
CDM project Company/country Position as of December 31, 2011
Emission factor
(tons CO2e/MWh)
Approximateemissions avoided
(tons CO2e/year)Ojos de Aguamini−hydroelectric plant
Endesa Eco (Chile) Registered with the ExecutiveAuthority of the UNFCCC sinceApril 2007. The reduction in emissionsof 2008 and 2009 periods are currentlybeen verified.
0.4348 63,000(CER still not verified) (1)
Canela wind farm Central Eólica CanelaS.A. (Chile)
Registered with the ExecutiveAuthority of the UNFCCC sinceApril 2009.
0.5713 65,000(CER still not verified)
Canela II wind farm Central Eólica CanelaS.A. (Chile)
Validation report issued, registrationsubmission on July 20, 2011.Preparing the answer to the UNFCCCrequirements.
0.6541 89,608(CER still not verified)
(1) CER: Certified Emission Reductions.
The greenhouse gas emissions of the Company for the last three years, including our 50% stake in GasAtacama, were 12.4 million tons in 2009, 11.8million tons in 2010 and 13.3 million tons in 2011.
Item 4A. Unresolved Staff Comments
None
96

Table of Contents
Item 5. Operating and Financial Review and Prospects
A. Operating Results.
General
The following discussion should be read in conjunction with our Consolidated Financial Statements and the notes thereto, included in Item 18 in thisannual Report, and “Selected Financial Data,” included in Item 3 herein. Our Consolidated Financial Statements as of December 31, 2009, 2010 and 2011have been prepared in accordance with IFRS as issued by IASB. Effective January 1, 2009, we adopted IFRS as issued by the IASB, in replacement of theprevious accounting principles, which were under Chilean GAAP.
1. Discussion of Main Factors Affecting Operating Results and Financial Condition of the Company
We are an electricity investment company that owns and operates electric power generation, transmission, and distribution companies in Chile,Argentina, Brazil, Colombia and Peru. Most of our revenues, income and cash flows come from the operations of our subsidiaries, jointly−controlledcompanies and associates in these five countries.
Factors such as hydrological conditions, fuel prices, regulatory developments, extraordinary actions adopted by government authorities, and economicconditions in each country in which we operate, are important in determining our financial results. In addition, the results from operations and financialcondition are affected by variations in exchange rates between the peso and the currencies of the other four countries in which we operate. These exchangevariations may have an important impact in the consolidation of the results of our companies outside Chile. Lastly, we have certain critical accountingpolicies that affect our consolidated operating results.
Our portfolio strategy allows the impact of significant changes in one country to be sometimes offset by opposing changes in other countries, or withinour two segments, leading to no significant impacts on consolidated figures. The impact of these factors on us, for the years covered by this Report, isdiscussed below.
a. Hydrological Conditions: Generation Business
A substantial part of our generation business depends on hydrological conditions prevailing in the countries where we operate, although only extremehydrological conditions materially affect the Company’s operating results and financial condition. In terms of installed capacity for the three years endedDecember 31, 2011, our consolidated installed capacity has been 58% hydroelectric. Consolidated hydroelectric capacity was 8,654 MW, 8,675 MW, and8,675 MW as of December 31, 2009, 2010, and 2011, respectively. (See “Item 4. Information on the Company — D. Property, Plants and Equipment”).
Hydrological conditions in 2009, 2010 and 2011 have led to significant changes in our financial condition and results from operations. Hydroelectricgeneration was 37,730 GWh in 2009, 33,689 GWh in 2010, and 33,676 GWh in 2011. The lower hydroelectric generation in 2010 and 2011 was associatedwith conditions in Chile and Argentina as compared to year 2009. Consolidated operating income was Ch$ 1,927 billion in 2009, Ch$ 1,704 billion in2010, and Ch$ 1,566 billion in 2011.
Our thermal generators burn natural gas, LNG, coal or diesel. We can offset the effect of low hydrology (reservoir levels, rain and snow) in thegeographical areas where we operate our plants by thermal generation and purchases. The company’s thermal installed capacity and the ability to purchaseelectricity from other generators allow us to increase thermal generation and/or purchase electricity from competitors to meet our commitments. In addition,given industry structure and the percentage of hydroelectric generation capacity in the countries where we operate, when hydrology is low, electricity pricesgenerally increase. Under certain circumstances, low hydrology could potentially lead to higher revenues and sometimes, higher operating income.
Operating costs associated with thermal generation and energy purchases are higher than the variable cost of hydroelectric generation in normalhydrological conditions. The cost of thermal generation does not directly depend on hydrology but instead on global commodity prices. However, the costof electricity purchases in the spot market does depend on hydrology and commodity prices.
The impact of low hydrology on operating results depends on the resulting movement in electricity prices in the market, the severity of the impact ofhydrological conditions on the Company’s hydroelectric generation, the Company’s cost of thermal generation and the need for energy purchases. Theeffect of low hydrology on market prices may either partially or completely compensate (depending on the conditions of all relevant market factors) for thehigher cost of sales, leading to an insignificant impact on operating results. For further information on the effects of hydrological conditions on ouroperating results, please see “Item 3.
97

Table of Contents
Key Information — D. Risk Factors — “Since our generation business depends heavily on hydrological conditions, drought conditions may hurt ourprofitability.”
b. Regulatory Developments
The regulatory frameworks governing our business in the five countries where we operate have a material effect on our results from operations. Inparticular, regulators set (i) generation tariffs taking into consideration factors such as fuel costs, reservoir levels, exchange rates, future investments ininstalled capacity and demand growth, and (ii) distribution tariffs taking into account the costs of energy purchases paid by distribution companies (whichdistribution companies pass on to their customers) and the “Value Added from Distribution,” or VAD; all of which are intended to reflect investment andoperating costs incurred by distribution and generation companies and is meant to allow such companies to obtain a return on their investments. Theearnings of our electricity subsidiaries are determined to a large degree by government regulators, mainly through the tariff setting process. For additionalinformation relating to the regulatory frameworks in the countries where we operate, see “Item 4. Information on the Company — B. Business Overview— Electricity Industry Regulatory Framework”.
c. Economic Conditions
Macroeconomic conditions in the countries in which we operate may have a significant effect on our operating results. For example, when a countryexperiences sustained economic growth, consumption of electricity by industrial and individual consumers increases. Other macroeconomic factors such asthe variation of the local currency against the dollar in the countries where we operate may impact our results from operations, as well as assets andliabilities, depending on the percentage denominated in dollars. For example, a devaluation of local currencies against the dollar increases the cost ofcapital expenditure plans. For additional information, see “Item 3. Key Information — D. Risk Factors — Foreign exchange risks may adversely affectour results and the dollar value of dividends payable to ADS holders” and “— South American economic fluctuations are likely to affect our results fromoperations and financial condition, as well as the value of our securities.”
Economic Growth and Electricity Demand
Economic growth in 2011 was strong in all of the countries in which we operate, largely based on domestic private consumptions and investment. Theworldwide financial and economic crisis adversely impacted developed economies, but Latin America showed resilience to global threats and the outlookremains better than for the developed world. According to the IMF’s September 2011 World Economic Outlook, the estimated GDP growth forLatin America and the Caribbean (simple average) is 4.5% for 2011, and 4.0% for 2012. Growth was, and will be, driven by many of South America’scommodity exporters— including Argentina, Chile and Peru—all of which are expected to have grown by at least 5.5% in 2011. Growth in South Americais projected to be moderate in 2012, within an estimated range of 3.5% to 5.5%. This economic growth is projected to slow, as domestic demand growthmoderates in response to less accommodative macroeconomic policies and a weakening projected external demand. Overall, external conditions areprojected to remain positive, although with somewhat greater risk aversion and a weaker effect resulting from commodity prices.
Overall electricity demand increased at strong rates during 2011, principally due to the favorable economic situation in most of these countries. TheGDP and electricity growth rate for the years covered by this Report are included in the following table:
2009 2010 2011GDP
Growth(%)
ElectricityDemand
Growth (%)
GDPGrowth
(%)
ElectricityDemand
Growth (%)
GDPGrowth
(%)
ElectricityDemand
Growth (%)Chile (1) (1.7) 0.5 5.2 3.4 6.5 6.0Argentina 0.9 (1.3) 7.5 5.9 8.0 5.5Colombia 0.8 1.5 4.7 2.6 4.9 1.7Brazil (0.2) (1.0) 7.5 7.1 3.8 3.4Peru 0.9 0.9 8.3 8.5 6.2 7.5
Source: GDP growth data was obtained from the World Economic Outlook (September 2011) of the International Monetary Fund (IMF). Electricitydemand growth data was obtained from internal Company physical energy data.(1) Electricity demand growth in the SIC and the SING.
98

Table of Contents
Local Currency Exchange Rate
Variations in the parity of the dollar and the local currency in each of the countries in which we have operations may have an impact on our operatingresults and overall financial position. The impact will depend on the level at which tariffs are pegged to the dollar, dollar−denominated assets and liabilitiesexisting in the period and also the translation of financial statements of our foreign subsidiaries for consolidation purposes to the presentation currency,which is the Chilean peso.
As of December 31, 2010, Enersis had total consolidated indebtedness in financial terms of $ 7,330 million, of which 29.4% was denominated indollars, 22.9% in Colombian pesos, 19.8% in reais, 19.4% in pesos, 5.8% in soles, and 2.7% in Argentine pesos.
The following table sets forth the closing and average local currencies per dollar exchange rates for the periods indicated.
Local Currency Dollar Exchange Rates2009 2010 2011
Average Year End Average Year End Average Year EndChile (peso per dollar) 559.15 507.10 510.22 468.01 483.57 519.20Argentina (Argentine peso per dollar) 3.77 3.80 3.92 3.98 4.13 4.30Colombia (Colombian peso per dollar) 2,155 2,044 1,895 1,914 1,847 1,943Brazil (reais per dollar) 2.00 1.74 1.69 1.66 1.67 1.88Peru (sol per dollar) 3.01 2.89 2.81 2.81 2.75 2.70
Sources: Central Bank of each country.
d. Critical Accounting Policies
Financial Reporting Release Section 501.1 encourages all companies to include a discussion of critical accounting policies or methods used in thepreparation of financial statements. Critical accounting policies are defined as those that reflect significant judgments and uncertainties which wouldpotentially result in materially different results under different assumptions and conditions. We believe that our critical accounting policies are limited tothose described below with reference to the preparation of our financial statements under IFRS. For further detail of the accounting policies and themethods used in the preparation of the financial statements, see Notes 2 and 3 to our Consolidated Financial Statements.
Impairment of Long−Lived Assets
During the period, and principally at period end, the Company evaluates whether there is any indication that an asset has been impaired. Should anysuch indication exist, the company estimates the recoverable amount of that asset to determine the amount of impairment in each case. In the case ofidentifiable assets that do not generate cash flows independently, the company estimates the recoverability of the Cash Generating Unit to which the assetbelongs, which is understood to be the smallest identifiable group of assets that generates independent cash inflows.
Notwithstanding the preceding paragraph, in the case of Cash Generating Units to which goodwill or intangible assets with an indefinite useful lifehave been allocated, a recoverability analysis is performed routinely at each period end.
The recoverable amount is the greater between the fair value less the cost needed to sell and the value in use, which is defined as the present value ofthe estimated future cash flows. In order to calculate the recoverable value of property, plant, and equipment, goodwill and intangible assets, the Group usesvalue in use criteria in practically all cases.
To estimate the value in use, the Group prepares future cash flow projections, before tax, based on the most recent budgets available. These budgetsincorporate management’s best estimates of Cash Generating Units’ revenue and costs using sector projections, past experience, and future expectations.
In general, these projections cover the next ten years, estimating cash flows for subsequent years by applying reasonable growth rates, between 3.2%and 7.9%, which, in no case, are increasing nor exceed the average long−term growth rates for the particular sector and country.
These cash flows are discounted at a given pre−tax rate in order to calculate their present value. This rate reflects the cost of capital of the business andthe geographical area in which the business is conducted. The discount rate is calculated taking into account the current time value of money and the riskpremiums generally used by analysts for the specific business activity and the country involved.
99

Table of Contents
The following discount rates, before tax and expressed in nominal terms, were applied in 2011 and 2010:
2010 2011Country Currency Minimum Maximum Minimum Maximum
Chile Pesos 7.5% 8.8% 8.0% 10.1%Argentina Argentine peso 15.0% 16.9% 15.0% 17.1%Brazil Brazilian reais 9.6% 10.8% 9.5% 11.6%Peru Nuevos soles 7.9% 8.1% 7.3% 9.3%Colombia Colombian peso 9.6% 9.8% 8.9% 10.9%
If the recoverable amount is less than the net carrying amount of the asset, the corresponding provision for impairment loss is recorded for thedifference, and charged to “Reversal of impairment loss (impairment loss) recognized in profit or loss” in the consolidated statement of comprehensiveincome.
Impairment losses recognized for an asset in prior periods are reversed when its estimated recoverable amount changes, increasing the asset’s valuewith a credit to earnings, limited to the asset’s carrying amount if no adjustment had occurred. In the case of goodwill, adjustments that would have beenmade are not reversible.
Litigation and Contingencies
The Company is currently involved in certain legal and tax proceedings. As discussed in Note 22.2 to our Consolidated Financial Statements as ofDecember 31, 2011, we have estimated the probable outflows of resources for resolving these claims. We have reached this estimate after consulting ourlegal and tax advisors who are carrying out our defense in these matters and an analysis of potential results, assuming a combination of litigation andsettlement strategies.
Hedge Revenues Directly Linked to the Dollar
The Company has established a policy to hedge the portion of its revenues directly linked to the dollar by obtaining financing in this currency. Exchange differences related to this debt, as they are cash flow hedge transactions, are charged net of taxes to an equity reserve account, and recorded asincome during the period in which the hedged cash flows are realized. This term has been estimated at ten years.
This policy reflects a detailed analysis of our future dollar revenue streams. Such analysis may change in the future due to new electricity regulationslimiting the amount of revenues tied to the dollar.
Pension and Post−Employment Benefits Liabilities
We have various defined benefits plans for our employees. These plans pay benefits to employees at retirement and use formulas based on years ofservice and the compensation of the participants. We also offer certain additional benefits for some retired employees in particular.
The liabilities shown for the pensions and post−employment benefits reflect our best estimate of the future cost of meeting our obligations under theseplans. The accounting applied to these defined benefit plans involves actuarial calculations which contain key assumptions that include: employee turnover,life expectancy and retirement ages, discount rates, expected returns on assets, the future level of compensation and benefits, the claims rate under medicalplans and future medical costs. These assumptions change as economic and market conditions vary and any change in any of these assumptions could havean important effect on the reported results from operations.
The effect of an increase of one percentage point in the discount rate used to determine the present value of the post−employment defined benefitswould decrease the liability by Ch$ 54,572 million (Ch$ 48,203 million in 2010 and Ch$ 40,456 million in 2009) and the effect of a decrease of onepercentage point in the rate used to determine the present value of the post−employment defined benefits would increase the liability by Ch$ 65,050 million(Ch$ 56,463 million in 2010 and Ch$ 47,467 million in 2009).
Recent Accounting Pronouncements
Please see “Item 18. Financial Statements — Note 2.2” for additional information regarding recent accounting pronouncement.
100

Table of Contents
2. Enersis’ Results from Operations for the Years ended December 31, 2010 and December 31, 2011
Total income in 2011decreased 20.7%, from Ch$ 1,100.7 billion in 2010 to Ch$ 872.5 billion in 2011. This decrease of Ch$ 228.1 billion isattributable primarily to the accounting impairment recorded in our books in connection with our Argentine subsidiaries, Edesur and Endesa Costanera,coupled with an increase in income tax. The decrease in net income attributable only to Enersis (excluding the decrease in net income attributable tonon−controlling interests) amounted to Ch$ 110.8 billion.
In 2011, we recorded an impairment loss in Property, Plant and Equipment of Ch$ 106.4 billion attributable to our operating costs in Edesur, animpairment in tax credits of Ch$ 44.8 billion for Edesur and Endesa Costanera, and a goodwill impairment of Ch$ 14.4 billion associated with ouracquisitions of Edesur and Endesa Costanera.
We implemented the impairment loss in connection with Edesur due to the sustained period of uncertainty in the Argentine electricity sector as towhether distribution tariff adjustments would be carried out by Argentine regulatory authorities to reflect our increased costs in providing electricityservice. Since the enactment of Argentina’s Public Emergency Law in 2002, our costs of providing electricity service have been subject to significantincreases, without adequate tariff increases. Although Edesur did receive an increase in VAD in 2007, ENRE has not allowed much higher operating costsin 2010 and 2011 to be passed through to final tariffs.
Since 2007, increases in tariffs have not occurred due to delays in fulfillment of requirements of the Agreement Act signed between the Republic ofArgentine and Edesur in August 2005, particularly with regards to the semi−annual recognition of tariff adjustments under the cost monitoring mechanismand the implementation of the integral tariff review, each as prescribed in the Agreement Act, the absence of which are severely affecting Edesur’s viabilityas a going concern. Given the already long period during which tariff adjustments had not been made, and our assessment of the prospects of any futuretariff adjustments, at the end of 2011 we recorded the impairment loss and reversal of goodwill related to Edesur.
In connection with Endesa Costanera, our impairment loss was attributable to the inability to obtain revenues which would allow a recovery of costsand to a sustained working capital deficit over a very long period. In addition, our Argentine generator has encountered difficulties in obtaining the timelypayment of receivables from CAMMESA, the operator of the Argentine electricity market. This situation affected Endesa Costanera’s viability as a goingconcern.
Additionally, we incurred Ch$ 70 billion in higher income taxes (excluding impairment on tax credits mentioned above).
The order in which the countries are ranked in these tables is according to their contribution to our 2011 operating income.
Revenues
Generation and Transmission Business
The following table sets forth the physical electricity sales of our subsidiaries and their corresponding changes for the twelve−month periods ended onDecember 31, 2010 and 2011.
Physical sales duringYear ended December 31,
2010 2011 Change % Change(GWh)
Endesa Chile (Chile) (1) 21,847 22,070 222 1.0%Emgesa (Colombia) 14,817 15,112 295 2.0%Edegel (Peru) 8,598 9,450 851 9.9%Cachoeira Dourada (Brazil) 3,833 3,986 153 4.0%Endesa Fortaleza (Brazil) 2,957 2,842 (115) (3.9)%El Chocón (Argentina) 3,361 2,888 (473) (14.1)%Endesa Costanera (Argentina) 8,018 8,493 476 5.9%Total 63,431 64,840 1,409 2.2%
(1) Includes Endesa Chile and its generation subsidiaries.
101

Table of Contents
Distribution Business
Distribution revenues are derived mainly from the resale of electricity purchased from generators. Revenues associated with distribution include therecovery of the cost of electricity purchased and the resulting revenue from the VAD, which is associated with the recovery of costs and the return on theinvestment with respect to the distribution assets plus the losses permitted in the regulatory tariffs. Other revenue deriving from our distribution servicesconsists of charges related to new connections and the maintenance and rental of meters.
The following table sets forth the physical electricity sales of our subsidiaries, by country, and their corresponding variations for the years endedDecember 31, 2010 and 2011.
Physical sales duringYear ended December 31,
2010 2011 Change % Change(GWh)
Codensa (Colombia)(1) 12,515 12,857 342 2.7%Coelce (Brazil) 8,850 8,970 120 1.4%Ampla (Brazil) 9,927 10,223 296 3.0%Chilectra (Chile) 13,098 13,697 599 4.6%Edelnor (Peru) 6,126 6,572 446 7.3%Edesur (Argentina) 16,759 17,233 474 2.8%Total 67,274 69,552 2,278 3.4%
(1) Values for Codensa include the proportioned consolidation of 49.0% of DECSA. This consolidation also affects other figures in this section, such asoperating income, revenues, operating costs and number of clients.
Revenues by Business Segment
The table below presents our revenues for 2010 and 2011:
Year ended December 31,2010 2011 Change % Change
(in million of Ch$)Generation and Transmission BusinessEndesa Chile and subsidiaries (Chile) 1,345,371 1,257,995 (87,376) (6.5)%Emgesa (Colombia) 507,527 498,569 (8,958) (1.8)%Edegel (Peru) 211,263 239,842 28,579 13.5%Cachoeira Dourada (Brazil) 115,663 126,646 10,983 9.5%CIEN (Brazil) 98,909 59,918 (38,991) (39.4)%Endesa Fortaleza (Brazil) 150,371 129,485 (20,886) (13.9)%El Chocón (Argentina) 57,173 48,341 (8,832) (15.4)%Endesa Costanera (Argentina) 295,231 341,824 46,593 15.8%Less: Intercompany Transactions (904) (2,594) (1,690) 186.9%Total 2,780,604 2,700,026 (80,578) (2.9)%
Distribution BusinessCodensa (Colombia) 785,890 815,487 29,597 3.8%Coelce (Brazil) 940,654 859,446 (81,208) (8.6)%Ampla (Brazil) 1,046,387 1,117,269 70,882 6.8%Chilectra and subsidiaries (Chile) 1,016,997 1,046,191 29,194 2.9%Edelnor (Peru) 307,159 329,309 22,150 7.2%Edesur (Argentina) 295,539 279,725 (15,814) (5.4)%Total 4,392,626 4,447,427 54,801 1.2%
Less: Consolidation Adjustments and Other Businesses (609,649) (612,573) (2,924) 0.5%Total 6,563,581 6,534,880 (28,701) (0.4)%
102

Table of Contents
Generation and Transmission Business: Revenues
Revenues in Chile in 2011 decreased by 6.5%, mainly due to lower energy sales, principally due to a lower average sale price, partially offset by largerphysical sales which increased by 1.0%, reaching 22,070 GWh in 2011.
In Colombia, revenues of Emgesa decreased by Ch$ 9.0 billion, or 1.8%, principally due to a 4.0% reduction in the average energy sale price whichwas partially offset by an increase in physical sales of 2.0% as a consequence of higher hydroelectric generation, totaling 15,112 GWh. The “currencytranslation effect” (from translating local Colombian pesos into Chilean pesos) on revenues was negative, causing a decline of 2.6% in peso terms.
Revenues of Edegel, our Peruvian generating company, increased by Ch$ 28.6 billion, or 13.5%, in 2011 This was principally the result of a 9.9%growth in physical sales, totaling 9,450 GWh in 2011, as well as an increase in the average energy sale price for 2011. The currency translation effect onrevenues was negative, causing a decline of 2.7% in peso terms.
Revenues of Cachoeira Dourada rose by 9.5% in 2011, mainly as a result of an increase in average sales prices, expressed in local currency, and anincrease in physical energy sales of 153 GWh, to 3,986 GWh, for the year.
Revenues of CIEN fell by 39.4% in 2011, mainly due to the fact that the Annual Permitted Revenue (APR) was booked since mid April. The APRremunerates the company’s transmission assets, causing lower revenues than the energy−export revenues to Argentina generated during 2010.
Revenues of Endesa Fortaleza decreased by 13.9% in 2011, mainly due to lower sales prices and a reduction in physical sales of 115 GWh, to2,842 GWh. In our Brazilian companies, the currency translation effect on revenues was negative, causing a slight decline of 0.2% in peso terms, incomparison to 2010.
In Argentina, revenues of Endesa Costanera rose by 15.8% in 2011, principally as a result of an increase in physical sales and higher average prices. Physical sales reached 8,493.3 GWh in 2011 compared to 8,017.7 GWh in 2010.
Revenues of El Chocón fell by 15.4% in 2011, explained by a decrease in generation of 19.2% compared to 2010, due to lower hydroelectricavailability, which in turn was a result of reservoir controls at levels limited by each river basin. For both Argentine companies, the net effect of translatingresults from the Argentine peso to the Chilean peso was negative, resulting in a 10.1% decline in revenues in peso terms.
Distribution Business: Revenues
In Colombia, revenues of our subsidiary Codensa increased by 3.8%, mainly as result of a 3.6% increase in the average sale price in local currency, a2.7% increase in physical sales to 12,857 GWh, and increases in other operating revenues, which rose by Ch$ 3.9 billion. This was partially offset by thecurrency translation effect, which resulted in a decline in revenues of 2.6% as expressed in peso terms. The number of customers rose by 70,357, for anaggregate total of over 2.6 million.
In Brazil, revenues of Coelce decreased by 8.6% in 2011, mainly due to a 6.1% drop in the average sale price in local currency, a reduction ofCh$ 98.1 billion in revenues due to the construction of fixed assets in the concession area and the currency translation effect which resulted in a fall ofrevenues of 0.2% in peso terms. This was partially offset by a 1.4% rise in physical sales to 8,970 GWh in 2011. The number of customers rose by 129,778in 2011, for an aggregate total of over 3.2 million.
Revenues of our subsidiary Ampla rose by 6.8% in 2011, mainly due to a 3.0% increase in physical sales (to 10,223 GWh), a 2.2% increase in theaverage sale price in local currency, and an increase in other operating revenues of Ch$ 21.0 billion. This was partially offset by the currency translationeffect, which resulted in a decline of revenues of 0.2% in peso terms. The number of customers rose by 72,881, for an aggregate total exceeding2.6 million.
In Chile, revenues of our subsidiary Chilectra increased by Ch$ 29.2 billion or 2.9% in 2011, principally due to greater electricity demand, which wasreflected by a 4.6% increase in physical sales (reaching 13,697 GWh in 2011). This was partially offset by a slight decrease of 0.6% in the average saleprice and a Ch$ 3.2 billion decrease in other operating revenues. The number of customers rose by 28,325, reaching an aggregate total of over 1.6 million.
In Peru, revenues of Edelnor increased by 7.2% in 2011, due to a 7.3% increase in physical sales to 6,572 GWh and an 8.6% increase in average salesprices in local currency. This was partially offset by a decrease of Ch$ 3.2 billion in other operating revenues and the currency translation effect whichresulted in a decline of revenues of 2.7% in 2011 in peso terms. The number of customers rose by 46,501, to an aggregate total exceeding 1.1 million.
103

Table of Contents
In Argentina, revenues of Edesur decreased by 5.4% in 2011 due mainly to the currency translation effect that resulted in a decrease in revenues of10.1% in peso terms. This was partially offset by a 2.8% increase in physical sales and a Ch$ 0.5 billion increase in other operating revenues. Average saleprices in local currency remained the same as in 2010, as well as energy losses, at a level of 10.5%. The number of customers rose by 35,885, to anaggregate total of almost 2.4 million.
Operating Costs
Operating costs primarily consist of electricity purchases from other parties, fuel purchases, depreciation, amortization and impairment losses,maintenance costs, tolls paid to transmission companies, and employee salaries. Operating costs also include Administrative and Selling expenses.
The following table shows the breakdown of operating costs as a percentage of total operating costs, for the years ended December 2010 and 2011. Ascan see it, the cost structure of the Company was virtually the same in 2010 and 2011.
Year ended December 312010 2011
(percentage of total costs ofoperations)
Electricity purchases 32.0% 35.5%Fuel purchases 13.8% 14.9%Other variable cost 18.3% 12.9%Depreciation, amortization and impairment losses 11.5% 11.3%Other fixed costs 9.3% 10.9%Transmission tolls 8.4% 7.9%Staff benefit costs 6.8% 6.6%
100% 100%
The table below sets forth the breakdown of operating costs for the years ending on December 31, 2010 and 2011:
Year ended December 31,2010 2011 Change % Change
(in million of Ch$)Generation and Transmission BusinessEndesa Chile and subsidiaries (Chile) 832,601 859,191 26,590 3.2%Emgesa (Colombia) 246,044 245,061 (983) (0.4)%Edegel (Peru) 140,944 135,187 (5,757) (4.1)%Cachoeira Dourada (Brazil) 39,800 36,365 (3,435) (8.6)%CIEN (Brazil) 70,853 (8,863) (79,716) (112.5)%Endesa Fortaleza (Brazil) 91,257 80,299 (10,958) (12.0)%El Chocón (Argentina) 25,522 24,599 (923) (3.6)%Endesa Costanera (Argentina) 284,391 335,344 50,953 17.9%Less: Intercompany Transactions (902) (1,531) (629) 69.7%Total 1,730,510 1,705,652 (24,858) (1.4)%
Distribution BusinessCodensa (Colombia) 578,667 630,025 51,358 8.9%Coelce (Brazil) 757,490 678,458 (79,032) (10.4)%Ampla (Brazil) 925,698 943,612 17,914 1.9%Chilectra and Subsidiaries (Chile) 905,231 926,506 21,275 2.4%Edelnor (Peru) 242,210 259,409 17,199 7.1%Edesur (Argentina) 291,595 416,895 125,300 43.0%Total 3,700,891 3,854,905 154,014 4.2%
Less: Consolidation Adjustments and Other Businesses (572,121) (591,988) (19,867) 3.5%Total 4,859,280 4,968,569 109,289 2.2%
104

Table of Contents
Generation and Transmission Business: Operating Costs
Operating costs in Chile increased by 3.2% in 2011 compared to 2010, totaling Ch$ 859.2 billion. Lower hydroelectric generation forced the companyto use thermal energy more intensively, and this caused the procurement and services costs to increase by 2%, or Ch$ 13.4 billion, with higher energypurchases costs of Ch$ 66.3 billion and fuel consumption costs of Ch$ 32.1 billion, partially offset by lower transport expenses of Ch$ 46.1 billion and othervariable costs of Ch$ 38.9 billion. In addition, personnel expenses rose by Ch$ 7.3 billion and depreciation, amortization and impairment losses by Ch$ 3.8billion. Production totaled 20,722 GWh, 0.9% lower than in 2010.
Operating costs of Emgesa decreased by Ch$ 1.0 billion, or 0.4%, mainly due to reduced energy purchases of Ch$ 43.3 billion and reduced fuel costsof Ch$ 3.8 billion. This was partially offset by higher fixed costs, which resulted from the one−time effect of the equity tax reform of Ch$ 40.2 billion(which required the booking of the entire amount of this tax payable for the four year period 2011−2014 on January 1, 2011) added to increased transportcosts of Ch$ 4.0 billion, other variable costs of Ch$ 1.3 billion and a higher charge for depreciation, amortization and impairment of Ch$ 0.7 billionassociated with the increase in generation of 7.2% to 12,090 GWh in 2011. The currency translation effect resulted in a 2.6% decrease in operating costs inpeso terms.
Operating costs of Edegel declined by Ch$ 5.8 billion, or 4.1%, largely due to a reduced personnel expenses of Ch$ 8.8 billion, reduced energypurchase costs of Ch$ 1.7 billion and a reduced charge for depreciation, amortization and impairment of Ch$ 1.5 billion. This was partially offset by anincrease in fuel costs of Ch$ 3.9 billion, resulting from an increase of energy generation of 8.1% to 9,153 GWh. The currency translation effect resulted in areduction of 2.7% in the operating costs expressed in peso terms.
Operating costs of Cachoeira Dourada decreased by 8.6%, or Ch$ 3.4 billion, to Ch$ 36.4 billion in 2011, mainly due to reduced costs for impairmentlosses of Ch$ 3.9 billion following the reaching of an agreement with CELG Distribução S.A. to reverse an account payable provision,which was partiallyoffset by increased transport costs of Ch$ 0.4 billion and a rise in personnel expenses of Ch$ 0.1 billion. Generation reached 3,121 GWh in 2011, a fall of9.0% compared to 2010.
Operating costs of CIEN fell by Ch$ 79.7 billion in 2011, a decrease greater than the total of costs for 2010. This is due to lower procurement andservices costs of Ch$ 41.5 billion (largely due to the reversal on the transport tolls taxes provision) and a lower charge for depreciation, amortization andimpairment of Ch$ 36.7 billion (such decrease due to the fact that depreciation was adjusted to the useful lives of the assets of the concession period in2010). The currency translation effect resulted in a reduction of 0.2% in the operating costs expressed in peso terms.
Operating costs of Endesa Fortaleza fell by Ch$ 11.0 billion in 2011, or 12.0%, mainly due to lower energy purchase costs of Ch$ 4.7 billion, lowerfuel purchase costs of Ch$ 1.8 billion and a decrease in other variable costs of Ch$ 4.8 billion. Generation reached 1,033 GWh in 2011, a fall of 37.9%from the prior year, due to a lower dispatch. The currency translation effect in both Brazilian companies resulted in a reduction of 0.2% in the cost of salesexpressed in peso terms.
Operating costs of our subsidiary El Chocón declined by Ch$ 0.9 billion in 2011, or 3.6%. This was mainly due to a decrease in other variable costs ofCh$ 1.6 billion, partially offset by an increase in the cost of energy purchases of Ch$ 0.8 billion. Generation reached 2,404 GWh in 2011, a fall of 19.2%compared to the prior year. The currency translation effect resulted in a reduction of 10.1% in the cost of sales expressed in peso terms.
Operating costs of Endesa Costanera rose by Ch$ 51.0 billion in 2011 or 17.9%. This was mainly due to an increase in procurement and services costsof Ch$ 48.5 billion, or 19.4%, (such increase largely due to a higher cost of fuel consumption of Ch$ 40.2 billion) and higher transport expenses of Ch$ 4.4billion resulting from a 5.4% increase in production to 8,397 GWh in 2011. Personnel expenses rose by Ch$ 4.4 billion, partially offset by a reduction in thecharge for depreciation, amortization and impairment of Ch$ 1.1 billion and a reduction in other fixed costs of Ch$ 0.8 billion. The currency translationeffect resulted in a reduction of 10.1% in the cost of sales expressed in peso terms.
Distribution Business: Operating Costs
Operating costs of Codensa increased by Ch$ 51.4 billion, or 8.9%, in 2011, mainly due to higher energy purchase costs of Ch$ 20.6 billion, higherfixed costs due to the impact of an equity tax reform charge of Ch$ 19.7 billion, which required booking the entire amount of the tax payable for the fouryear period (2011−2014) on January 1, 2011, higher variable costs of Ch$ 3.4 billion and higher personnel expenses of Ch$ 2.5 billion. Physical losses fellby 0.4 percentage points to 8.1% in 2011. The currency translation effect resulted in an increase of 2.6% in the cost of sales expressed in peso terms.
Operating costs of Coelce decreased by Ch$ 79.0 billion, or 10.4%, in 2011. This is mainly due to a decrease in other variable costs of Ch$ 96.8billion (due to a reduction in fixed asset construction costs in the concession area) and a reduced charge for
105

Table of Contents
depreciation, amortization and impairment of Ch$ 6.3 billion. This is partially offset by an increase in energy purchase costs of Ch$ 26.0 billion andpersonnel expenses of Ch$ 4.0 billion. Physical losses fell by 0.2 percentage points to 11.9% in 2011. In each of Ampla and Coelce, the currencytranslation effect resulted in a reduction of 0.2% in the cost of sales expressed in peso terms.
Operating costs of our subsidiary Ampla grew by Ch$ 17.9 billion, or 1.9% in 2011. This is mainly due to increases in the cost of energy purchases ofCh$ 34.8 billion, in other operating costs of Ch$ 18.3 billion (primarily due to the construction of fixed assets in the concession area, for Ch$ 18.0 billion),in transport costs of Ch$ 10.3 billion and in personnel expenses of Ch$ 2.0 billion. This was partially offset by a decrease in the charge for depreciation,amortization and impairment of Ch$ 48.7 billion, primarily due to impairment losses booked in 2010. Physical losses fell by 0.8 percentage points to 19.7%by December 2011.
Operating costs of Chilectra increased by Ch$ 21.3 billion, or 2.4%, in 2011, mainly due to increases in energy purchase costs of Ch$ 9.2 billion,transport costs of Ch$ 7.2 billion, and personnel expenses of Ch$ 4.7 billion, in addition to a charge for depreciation, amortization and an impairment ofCh$ 4.6 billion associated with Chilectra’s investment in Edesur. This was partially offset by a reduction in other fixed operating costs of Ch$ 3.8 billion,which was associated with reduced repairs, conservation and other activities. Physical sales declined by 0.3 percentage points to 5.5% in 2011.
Operating costs of Edelnor increased by Ch$ 17.2 billion, or 7.1% in 2011, mainly due to an increase in energy purchases of Ch$ 20.4 billion and ahigher charge for depreciation, amortization and impairment of Ch$ 1.0 billion. This was partially offset by a reduction in other variable costs of Ch$ 3.2billion and a reduction in personnel costs of Ch$ 1.2 billion. Physical losses declined by 0.1 percentage points to 8.2%. The currency translation effectresulted in a decrease of 2.7% in the operating costs expressed in peso terms.
Operating costs of Edesur increased by Ch$ 125.3 billion, or 43.0% in 2011. This is primarily due to an impairment loss of Ch$ 106.4 billion taken atthe Enersis level at the end of 2011 in connection with Edesur’s property, plant and equipment. This impairment loss is a result of the inadequatedistribution tariff adjustments allowed for our Argentine subsidiary. Since the Argentine Public Emergency Law of 2002, our operating costs have beensubject to significant inflationary pressures, without any corresponding tariff increases. Increases in tariffs have not occurred due to delays in the fulfillmentof certain requirements of the Agreement Act executed by Edesur and the Republic of Argentina, particularly with regard to the semi−annual recognition oftariff adjustments under the cost monitoring mechanism and the implementation of an integral tariff review contemplated by the Agreement Act, theabsence of which are severely affecting Edesur’s viability as a going concern. Additionally, personnel expenses increased by Ch$ 20.0 billion and otherfixed costs increased by Ch$ 2.6 billion. In contrast, other variable costs declined by Ch$ 0.6 billion and the charge for depreciation fell by Ch$ 1.0 billion. Energy losses remained at 10.5% for both 2010 and 2011. The currency translation effect resulted in a reduction of 10.1% in the operating costs expressedin peso terms.
106
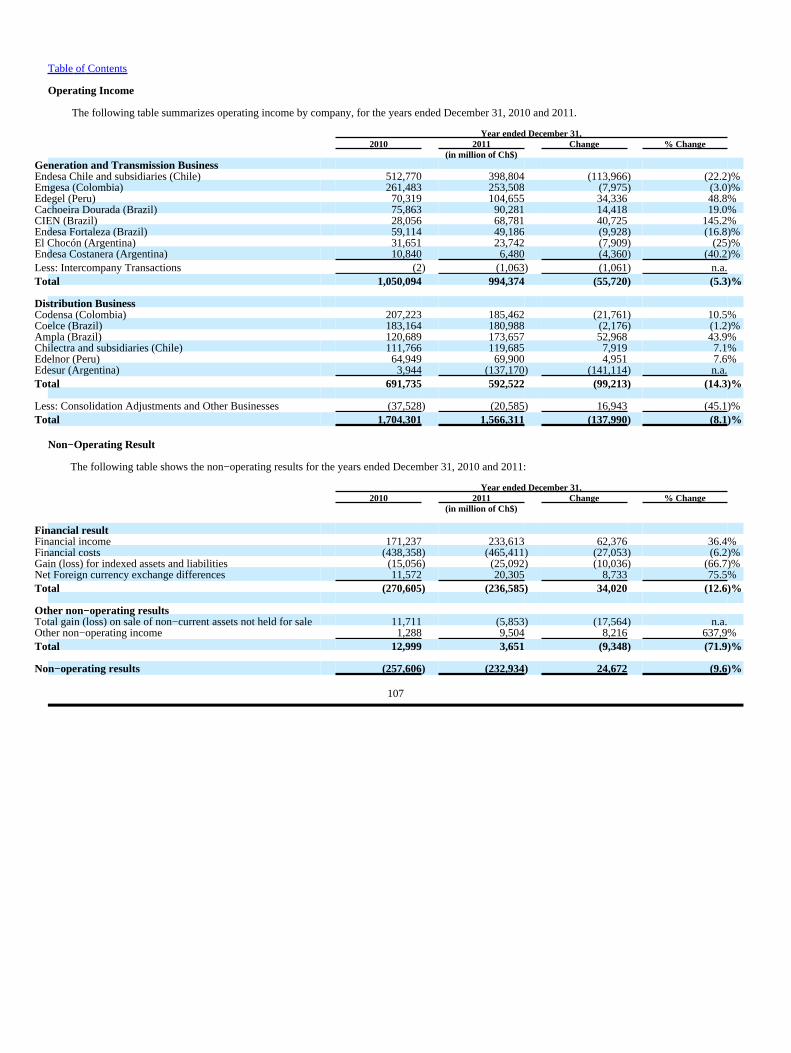
Table of Contents
Operating Income
The following table summarizes operating income by company, for the years ended December 31, 2010 and 2011.
Year ended December 31,2010 2011 Change % Change
(in million of Ch$)Generation and Transmission BusinessEndesa Chile and subsidiaries (Chile) 512,770 398,804 (113,966) (22.2)%Emgesa (Colombia) 261,483 253,508 (7,975) (3.0)%Edegel (Peru) 70,319 104,655 34,336 48.8%Cachoeira Dourada (Brazil) 75,863 90,281 14,418 19.0%CIEN (Brazil) 28,056 68,781 40,725 145.2%Endesa Fortaleza (Brazil) 59,114 49,186 (9,928) (16.8)%El Chocón (Argentina) 31,651 23,742 (7,909) (25)%Endesa Costanera (Argentina) 10,840 6,480 (4,360) (40.2)%Less: Intercompany Transactions (2) (1,063) (1,061) n.a.Total 1,050,094 994,374 (55,720) (5.3)%
Distribution BusinessCodensa (Colombia) 207,223 185,462 (21,761) 10.5%Coelce (Brazil) 183,164 180,988 (2,176) (1.2)%Ampla (Brazil) 120,689 173,657 52,968 43.9%Chilectra and subsidiaries (Chile) 111,766 119,685 7,919 7.1%Edelnor (Peru) 64,949 69,900 4,951 7.6%Edesur (Argentina) 3,944 (137,170) (141,114) n.a.Total 691,735 592,522 (99,213) (14.3)%
Less: Consolidation Adjustments and Other Businesses (37,528) (20,585) 16,943 (45.1)%Total 1,704,301 1,566,311 (137,990) (8.1)%
Non−Operating Result
The following table shows the non−operating results for the years ended December 31, 2010 and 2011:
Year ended December 31,2010 2011 Change % Change
(in million of Ch$)
Financial resultFinancial income 171,237 233,613 62,376 36.4%Financial costs (438,358) (465,411) (27,053) (6.2)%Gain (loss) for indexed assets and liabilities (15,056) (25,092) (10,036) (66.7)%Net Foreign currency exchange differences 11,572 20,305 8,733 75.5%Total (270,605) (236,585) 34,020 (12.6)%
Other non−operating resultsTotal gain (loss) on sale of non−current assets not held for sale 11,711 (5,853) (17,564) n.a.Other non−operating income 1,288 9,504 8,216 637,9%Total 12,999 3,651 (9,348) (71.9)%
Non−operating results (257,606) (232,934) 24,672 (9.6)%
107

Table of Contents
Financial Result
Total financial result for the year 2011 was an expense of Ch$ 236.6 billion, a decrease of 12.6%, or Ch$ 34.0 billion, in comparison to 2010. This isdue to higher financial income of Ch$ 62.4 billion, primarily the result of the booking of Ch$ 35.2 billion related to the agreement reached with CELGDistribução S.A., the effect of an updating of the pension fund assets in Brazil and higher cash investments, primarily in Chilectra, Endesa Fortaleza andEnersis. There was also a positive effect from net exchange differences of Ch$ 8.7 billion, primarily arising from Brazil. This was partially offset by higherfinancial costs of Ch$ 27.1 billion, (which resulted primarily from updating our pension fund liabilities in Brazil and a higher average cost of debt), andgreater indexation charges of Ch$ 10.0 billion, due to the effect of the Unidad de Fomento (UF) value variation on UF−denominated debt for some of ourChilean companies. This value variation is due the value of the UF increasing 3.9% in 2011, compared to an increase of 2.5% in 2010.
Result of asset sales
The result of asset sales shows a decrease of Ch$ 17.6 billion, mainly due to the one−time booking of the loss on the sale of CAM during 2011.
As a result of the foregoing, total non−operating results increased by Ch$ 24.7 billion compared with the previous year.
Net Income for the Year
The following table shows our net income for the year for the periods indicated.
Year ended December 31,2010 2011 Change % Change
(in million of Ch$)Operating income 1,704,301 1,566,311 (137,990) (8.1)%
Non−operating results (257,606) (232,934) 24,672 9.6%Net income before taxes 1,446,695 1,333,377 (113,318) (7.8)%
Income tax (346,007) (460,837) (114,830) (33.2)%
Net Income from Continuing Operations After Tax 1,100,688 872,540 (228,148) (20.7)%Net income from discontinued operations 0 0 0 0.0%
Net Income 1,100,688 872,540 (228,148) (20.7)%Net Income attributable to: Owners of Parent Company 486,227 375,471 (110,756) (22.8)%Net income attributable to: Non−controlling interests 614,461 497,069 (117,392) (19.1)%
Income tax increased from Ch$ 346.0 billion in 2010 to Ch$ 460.8 billion in 2011, an increase of Ch$ 114.8 billion, or 33.2%. The impairment of priortax credits in our Argentine subsidiaries, Edesur and Endesa Costanera, amounted to Ch$ 44.9 billion. Our Brazilian subsidiaries’ taxes increased byCh$ 62.0 billion and are attributable to higher taxable income. Taxable income increased in precisely those countries where the corporate tax rate is higher,primarily in Brazil where the corporate tax rate virtually doubles the Chilean rate. The corporate tax rates in Brazil, Colombia, and Peru are 34%, 33% and30%, respectively. In comparison, the Chilean corporate tax rate is much lower, although it increased temporarily, from 17% to 20%, as a measure tofinance the reconstruction that followed the earthquake in February, 2010. Such increase in income tax rate led to a higher income tax in Chile of Ch$ 8.5billion.
The main changes in the corporate income tax expense of our subsidiaries were as follows: increases in Ampla of Ch$ 20.1 billion, CIEN of Ch$ 19.3billion, Endesa Costanera of Ch$ 17.2 billion, Edesur of Ch$ 12.9 billion, Cachoeira Dourada of Ch$ 12.8 billion, Coelce of Ch$ 12.3 billion, Chilectra andPangue of Ch$ 10.2 billion each, Endesa Chile of Ch$ 8.3 billion, San Isidro of Ch$ 7.3 billion, Edegel of Ch$ 6.8 billion, Codensa of Ch$ 5.8 billion,Enersis of Ch$ 5.6 billion and Emgesa of Ch$ 4.1 billion. These increases were partially offset by decreases in corporate income tax for Pehuenche ofCh$ 8.3 billion, Celta of Ch$ 4.0 billion and Gas Atacama of Ch$ 0.9 billion.
108

Table of Contents
3. Enersis’ Results from Operations for the Years ended December 31, 2009 and December 31, 2010
The order in which the countries are ranked in these tables is according to their contribution to our 2010 operating income.
Revenues
Generation and Transmission Business
The following table sets forth the physical electricity sales of our subsidiaries and their corresponding changes for the twelve−month periods ended onDecember 31, 2009 and 2010.
Physical sales duringYear ended December 31,
2009 2010 Change % Change(GWh)
Endesa Chile (Chile) (1) 22,327 21,847 (480) (2.1)%Emgesa (Colombia) 16,806 14,817 (1,989) (11.8)%Cachoeira Dourada (Brazil) 3,862 3,833 (29) (0.8)%Edegel (Peru) 8,321 8,598 277 3.3%Endesa Fortaleza (Brazil) 3,007 2,957 (50) (1.7)%El Chocón (Argentina) 4,122 3,361 (761) (18.5)%Endesa Costanera (Argentina) 8,284 8,018 (266) (3.2)%Total 66,728 63,431 (3,297) (4.9)%
(1) Includes Endesa Chile and its generation subsidiaries.
Distribution Business
Distribution revenues are derived mainly from the resale of electricity purchased from generators. Revenues associated with distribution include therecovery of the cost of electricity purchased and the resulting revenue from the VAD, which is associated with the recovery of costs and the return on theinvestment with respect to the distribution assets plus the losses permitted in the regulatory tariffs. Other revenue deriving from our distribution servicesconsists of charges related to new connections and the maintenance and rental of meters.
The following table sets forth the physical electricity sales of our subsidiaries, by country, and their corresponding variations for the years endedDecember 31, 2009 and 2010.
Physical sales duringYear ended December 31,
2009 2010 Change % Change(GWh)
Codensa (Colombia)(1) 12,114 12,515 400 3.3%Coelce (Brazil) 7,860 8,850 990 12.6%Ampla (Brazil) 9,394 9,927 533 5.7%Chilectra (Chile) 12,585 13,098 513 4.1%Edelnor (Peru) 5,716 6,126 410 7.2%Edesur (Argentina) 16,026 16,759 733 4.6%Total 63,694 67,274 3,580 5.6%
(1) Values for Codensa include the proportioned consolidation of 49.0% of DECSA. This consolidation also affects other figures in this section, such asoperating income, revenues, operating costs and number of clients.
109

Table of Contents
Revenues by Business Segment
The table below presents our revenues for 2009 and 2010:
Year ended December 31,2009 2010 Change % Change
(in million of Ch$)Generation and Transmission BusinessEndesa Chile and subsidiaries (Chile) 1,373,231 1,345,371 (27,860) (2.0)%Emgesa (Colombia) 500,964 507,527 6,563 1.3%Cachoeira Dourada (Brazil) 88,300 115,663 27,363 31.0%Edegel and subsidiaries (Peru) 213,625 211,263 (2,362) (1.1)%Endesa Fortaleza (Brazil) 138,595 150,371 11,776 8.5%El Chocón (Argentina) 65,298 57,173 (8,125) (12.4)%CIEN (Brazil) 97,961 98,909 948 1.0%Endesa Costanera (Argentina) 231,421 295,231 63,810 27.6%Less: Intercompany Transactions (1,037) (904) 133 (12.8)%Total 2,708,358 2,780,604 72,246 2.7%
Distribution BusinessCodensa (Colombia) 741,168 785,890 44,722 6.0%Coelce (Brazil) 767,993 940,654 172,661 22.5%Ampla (Brazil) 1,012,342 1,046,387 34,045 3.4%Chilectra and subsidiaries (Chile) 1,089,515 1,016,997 (72,518) (6.7)%Edelnor (Peru) 302,295 307,159 4,864 1.6%Edesur (Argentina) 327,088 295,539 (31,549) (9.6)%Total 4,240,401 4,392,626 152,225 3.6%
Less: Consolidation Adjustments and Other Businesses (476,703) (609,649) (132,946) 27.9%Total 6,472,056 6,563,581 91,525 1.4%
Generation and Transmission Business: Revenues
Revenues in Chile decreased 2.0% in 2010, mainly as a result of a decrease of 2.1% in physical sales, to 21,847 GWh, due to the lower electricitydemand in Chile after the earthquake that took place on February 27, 2010 and a 2.6% decrease in average prices in 2010 expressed in peso terms. In 2010,there were lower sales in the spot market due to reduced hydrology, partially offset by higher sales to contracted customers as a result of improvedeconomic conditions and a recovery in energy demand by the end of 2010 compared to 2009.
In Colombia, revenues of Emgesa increased by Ch$ 6.6 billion, or 1.3%, mainly due to the 10% increase in the average energy sales price expressed inlocal currency. This was offset by an 11.8% decrease in physical sales, and amounted to 14,817 GWh in 2010. This is essentially due to lower sales in thespot market and to electricity companies as a result of lower hydroelectric production. The currency translation effect on revenues was positive, causing anincrease of 2.7% in peso terms.
In Brazil, revenues of Cachoeira Dourada increased 31.0% in 2010, mainly as a result of an increase of 27.7% in average sales prices, expressed inlocal currency. Physical energy sales were virtually the same. Revenues of Endesa Fortaleza increased 8.5% in 2010, as a result of an increase of 4.0% inaverage sales prices, expressed in local currency. This was partly offset by a 1.7% decrease in physical sales to 2,957 GWh. For both companies, thecurrency translation effect on revenues was positive, causing an increase of 7.5% in peso terms as compared to 2009.
Revenues of CIEN increased 1.0% in 2010, mainly due to the currency translation effect, which produced a 7.5% increase in revenues in peso terms. This increase was partially offset by lower export revenues of 6.5%. In 2009, CIEN exported energy to Uruguay and Argentina beginning in February ofthat year, whereas in 2010 exports to Argentina began later in the year.
Revenues of Edegel, our generating company in Peru, declined by Ch$ 2.4 billion, or 1.1%, in 2010, mainly as a result of a 5.6% decrease in theaverage sales price in local currency, and a decrease in sales to unregulated customers. This was partially offset by higher sales to regulated customers andin the spot market. It is also explained by the currency translation effect from soles to the peso
110

Table of Contents
in both years, producing a decrease in peso terms of 2.2% in 2010 compared to 2009. This was partially offset by the 3.3% increase in physical sales to8,598 GWh in 2010.
In Argentina, revenues of Endesa Costanera increased 27.6% in 2010, as a result of a 30.7% increase in average energy sale prices, which was partiallyoffset by a 3.2% decrease in physical sales to 8,018 GWh. Revenues of El Chocón decreased 12.4%, mainly due to an 18.5% decrease in physical sales to3,361 GWh. In 2010, generation was 21.3% lower due to reduced hydroelectric availability. For both companies the net effect of the currency translationeffect was negative, resulting in a 13.6% decrease in revenues in peso terms.
Distribution Business: Revenues
In Colombia, revenues of Codensa in 2010 increased 6.0%, mainly due to a 5.5% increase in the average sales price in local currency, a 3.3% increasein physical sales to 12,515 GWh, and the currency translation effect, which resulted in a 2.2% increase in pesos revenues. This increase was partially offsetby a reduction in other operating revenues, including “Codensa Hogar” and public lighting. The number of customers rose by 72,578 to a total exceeding2.5 million in December 2010, and energy losses increased to 8.5%.
In Brazil, revenues of Coelce increased 22.5% in 2010, mainly due to a 12.6% increase in physical sales to 8,850 GWh, a 1.9% increase in the averagesales price in local currency and the currency translation effect, which resulted in a 7.5% increase in peso terms. In 2010, the number of customersincreased 129,131 to a total exceeding 3.1 million, and energy losses increased from 11.6% to 12.1%.
Revenues of Ampla increased 3.4% in 2010, mainly due a 5.7% increase in physical sales to 9,927 GWh and the currency translation effect, whichresulted in a 7.5% increase in peso terms. This increase was partially offset by an 8.8% reduction in the average sales price. In 2010, the number ofcustomers increased 48,998, to a total exceeding 2.5 million, and energy losses declined from 21.2% to 20.5%.
In Chile, revenues of Chilectra decreased by 6.7% in 2010, mainly due to the decrease in sub−transmission tolls set by the authority and theamendment of the process used to determine electricity purchase prices, which resulted from the auction of long−term energy purchase contracts. Revenuesalso decreased because of reduced margins on other businesses of Ch$ 5,303 million related to reduced activity with large customers and transfer businessof networks as a result of reduced post−earthquake activity. This was partially offset by the 4.1% increase in physical sales to 13,098 GWh. In 2010, thenumber of customers increased 30,583 to a total exceeding 1.6 million, and energy losses were 5.8%, compared to 6.1% in 2009.
In Peru, revenues of Edelnor increased 1.6% in 2010, mainly due to a 7.2% increase in physical sales, to 6,126 GWh. This was partially offset by a3.2% reduction in the average sales price and the currency translation effect, which resulted in a 2.2% decrease in peso terms in 2010. The number ofcustomers increased 37,025 to 1.1 million, and energy losses increased to 8.3%.
In Argentina, revenues of Edesur decreased 9.6% in 2010, principally due to a reduced average sales price of 2.9% and the currency translation effect,which resulted in a decrease of 13.6% in peso terms. This decrease was partially offset by the 4.6% increase in physical sales. Energy losses remainedunchanged at 10.5% and the number of customers increased 47,660, to a total exceeding 2.3 million.
Operating Costs
Operating costs mainly consist of electricity purchases from other parties, depreciation, amortization and impairment losses, fuel purchases,maintenance costs, tolls paid to transmission companies, and employee salaries. Operating costs also include Administrative and Selling expenses.
111

Table of Contents
The following table shows the breakdown of operating costs as a percentage of total operating costs, for the years ended December 2009 and 2010.
Year ended December 312009 2010
(percentage of total costs ofoperations)
Electricity purchases 33.5% 32.0%Other Variable cost 17.5% 18.3%Fuel purchases 12.8% 13.8%Depreciation, amortization and impairment losses 11.9% 11.5%Other fixed costs 10.1% 9.3%Transmission tolls 7.0% 8.4%Staff benefit costs 7.4% 6.8%
100% 100%
The cost structure of the Company was virtually the same in 2009 and 2010. The table below sets forth the breakdown of operational costs for theyears ending on December 31, 2009 and 2010:
Year ended December 31,2009 2010 Change % Change
(in million of Ch$)Generation and Transmission BusinessEndesa Chile and subsidiaries (Chile) 733,191 832,601 99,410 13.6%Emgesa (Colombia) 250,153 246,044 (4,109) (1.6)%Cachoeira Dourada (Brazil) 37,671 39,800 2,129 5.7%Edegel and subsidiaries (Peru) 137,576 140,944 3,368 2.4%Endesa Fortaleza (Brazil) 54,669 91,257 36,588 66.9%El Chocón (Argentina) 26,598 25,522 (1,076) (4.0)%CIEN (Brazil) 49,969 70,853 20,884 41.8%Endesa Costanera (Argentina) 227,041 284,391 57,350 25.3%Less: Intercompany Transactions (918) (902) 16 (1.7)%Total 1,515,950 1,730,510 214,560 14.2%
Distribution BusinessCodensa (Colombia) 541,283 578,667 37,384 6.9%Coelce (Brazil) 616,720 757,490 140,770 22.8%Ampla (Brazil) 825,215 925,698 100,483 12.2%Chilectra and Subsidiaries (Chile) 960,483 905,231 (55,252) (5.8)%Edelnor (Peru) 239,870 242,210 2,340 1.0%Edesur (Argentina) 295,212 291,595 (3,617) (1.2)%Less: Intercompany Transactions 201 — (201) n.a.Total 3,478,984 3,700,891 221,907 6.4%
Less: Consolidation Adjustments and Other Businesses (450,323) (572,121) (121,798) 27.0%Total 4,544,611 4,859,280 314,669 6.9%
Generation and Transmission Business: Operating Costs
Operating costs in Chile increased by 13.6% in 2010 as compared to 2009, totaling Ch$ 832.6 billion, largely due to higher energy purchases ofCh$ 87.1 billion, transport costs of Ch$ 53.9 billion and other variable costs of Ch$ 41.1 billion. Production was 20,914 GWh, 6.0% below 2009 levels. Lower hydroelectric generation forced us to rely more intensively on more costly thermal energy, and thus, our energy purchase cost increased by 166%. This was partially offset by a decrease in depreciation and impairment of fixed assets of Ch$ 55.8 billion and in fuel costs of Ch$ 27.2 billion.
The operating costs of Emgesa declined by Ch$ 4.1 billion in 2010, or 1.6%, mainly due to reduced energy purchases of Ch$ 19.2 billion, partly offsetby higher fuel costs of Ch$ 7.2 billion, as a result of lower hydrology in the first half of 2010, as well as higher
112

Table of Contents
transport expenses of Ch$ 3.8 billion, an increase in personnel expenses of Ch$ 1.3 billion and an increase in other fixed operating costs of Ch$ 2.1 billion. The currency translation effect resulted in a 2.7% increase in operating costs in peso terms.
The operating costs of Cachoeira Dourada rose by 5.7%, or Ch$ 2.1 billion, to Ch$ 39.8 billion in 2010, mainly due to an increase in other variablecosts of Ch$ 2.5 billion. The operating costs of Endesa Fortaleza increased by Ch$ 36.6 billion, or 66.9%, mainly due to higher fuel purchase costs ofCh$44.1 billion and an increase in other variable costs of Ch$ 2.2 billion, partly offset by reduced energy purchase costs of Ch$ 9.0 billion. For bothcompanies, the currency translation effect resulted in a 7.5% increase in operating costs measured in peso terms.
The operating costs of CIEN were Ch$ 70.9 billion in 2010, 41.8% higher than the prior year. This is largely due to an increase in the charge fordepreciation and impairment losses of Ch$ 34.8 billion, partially offset by Ch$ 16.2 billion of lower variable costs. The currency translation effect resultedin a 7.5% increase in operating costs measured in pesos.
The operating costs of Edegel grew by Ch$ 3.4 billion, or 2.4% in 2010, largely explained by higher energy purchase costs of Ch$ 4.8 billion andhigher fuel costs of Ch$ 5.0 billion. This principally reflects the absence of the non−recurring reversal of provisions for energy purchases for distributioncustomers without contracts, booked in 2009, and, to a lesser extent, by higher average energy purchase prices, which more than offset the 9.3% reductionin physical purchases. The increase in operating costs was partially offset by reduced fixed costs of Ch$ 4.5 billion, lower transport costs of Ch$ 0.9 billionand reduced other variable costs of Ch$ 0.7 billion. The currency translation effect resulted in a 2.2% decrease in operating costs in peso terms.
The operating costs of Endesa Costanera rose by Ch$ 57.4 billion, or 25.3% in 2010. This is largely due to higher energy and fuel costs of Ch$ 62.7billion and an increase in personnel expenses of Ch$3.3 billion, partially offset by a reduction in other costs such as depreciation, transport costs, other fixedcosts and energy purchases. The operating costs of El Chocón declined by Ch$1.1 billion, or 4.0%, mainly due to reduced other variable costs of Ch$0.7billion, reduced transport costs of Ch$0.4 billion and reduced depreciation of Ch$0.7 billion, partly offset by an increase in energy purchases of Ch$0.8billion. In both companies, the currency translation effect resulted in a 13.6% reduction in operating costs in peso terms.
Distribution Business: Operating Costs
The operating costs of Codensa rose by Ch$ 37.4 billion, or 6.9%, in 2010, mainly due to larger energy purchases of Ch$ 42.4 billion as a result of the6.6% increase in average purchase prices in local currency, an increase in physical purchases, higher transport costs of Ch$ 2.2 billion and an increase indepreciation and impairment of Ch$ 4.6 billion. This was partly offset by a reduction in other variable costs of Ch$ 11.1 billion. The currency translationeffect resulted in a 2.7% increase in operating costs in peso terms.
The operating costs of Ampla grew by Ch$ 100.5 billion, or 12.2% in 2010. This is mainly due to an increase in energy purchase costs of Ch$ 50.2billion, in other operating costs of Ch$ 5.2 billion, in transport costs of Ch$ 5.9 billion and in depreciation and impairment of Ch$ 39.7 billion. Theoperating costs of Coelce rose by Ch$ 140.8 billion, or 22.8% in 2010. This is due to an increase in energy purchase costs of Ch$ 49.0 billion, an increasein other variable costs (basically the construction of fixed assets in the concession area of Ch$ 71.3 billion), higher transport costs of Ch$ 4.7 billion,increases in depreciation and impairment of Ch$ 8.0 billion and an increase in other fixed operating costs of Ch$ 7.8 billion. In both companies, thecurrency translation effect resulted in a 7.5% increase in operating costs in peso terms.
The operating costs of Chilectra fell by Ch$ 55.3 billion, or 5.8%, in 2010, mainly due to reduced energy purchase costs of Ch$ 96.9 billion. Thisdecrease is explained by a lower average purchase price, partially offset by an increase in physical purchases. There was also a decrease of Ch$ 5.9 billionin other variable operating costs, offset by an increase in transport costs of Ch$ 45.5 billion and an increase in the charge for depreciation and impairment ofCh$ 1.9 billion.
The operating costs of Edelnor increased by Ch$ 2.3 billion, or 1.0% in 2010, mainly due to the increase in other variable costs of Ch$ 11.6 billion,partly offset by lower energy purchase costs of Ch$ 3.6 billion and other fixed costs of Ch$ 5.8 billion. The currency translation effect resulted in a 2.2%decrease in operating costs in peso terms.
The operating costs of Edesur decrease by Ch$ 3.6 billion, or 1.2% in 2010. This is mainly explained by reduced energy purchase costs of Ch$ 11.2billion, reduced personnel costs of Ch$ 2.9 billion and a reduced charge for depreciation and impairment of Ch$ 2.5 billion, partly offset by higher fixedcosts of Ch$ 13.4 billion, which were mainly fines and payments to end users resulting from interruptions to the electricity service during the year. Thecurrency translation effect resulted in a 13.6% decrease in operating costs in peso terms.
113
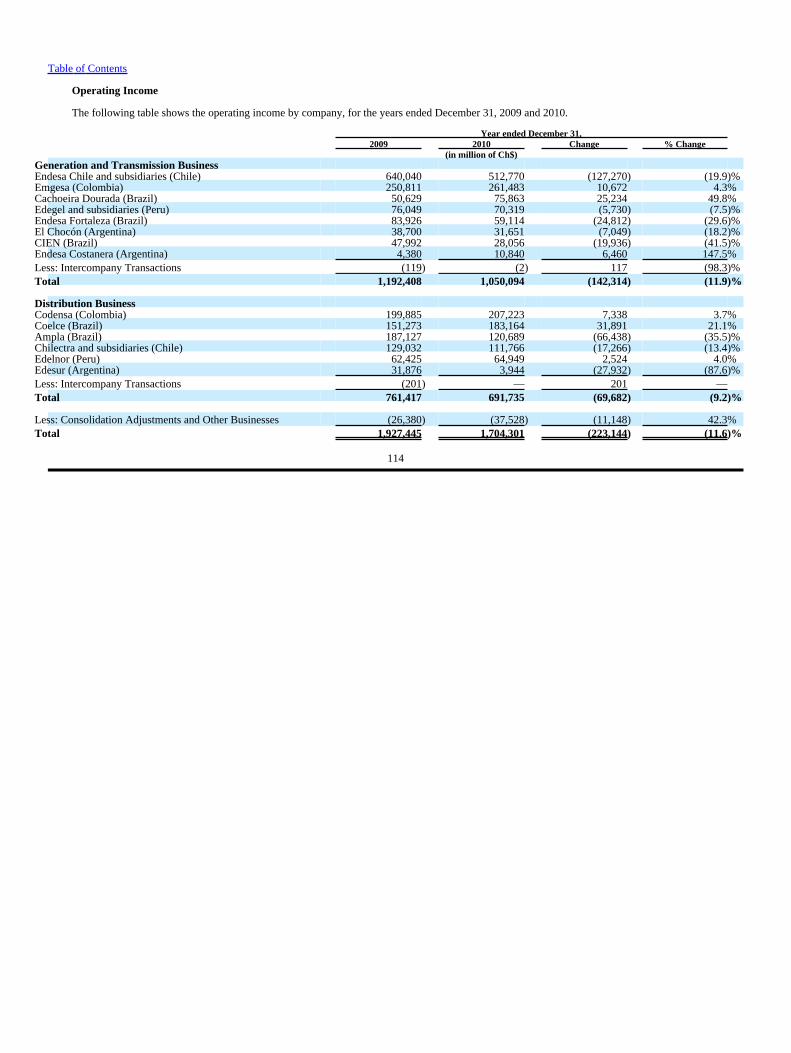
Table of Contents
Operating Income
The following table shows the operating income by company, for the years ended December 31, 2009 and 2010.
Year ended December 31,2009 2010 Change % Change
(in million of Ch$)Generation and Transmission BusinessEndesa Chile and subsidiaries (Chile) 640,040 512,770 (127,270) (19.9)%Emgesa (Colombia) 250,811 261,483 10,672 4.3%Cachoeira Dourada (Brazil) 50,629 75,863 25,234 49.8%Edegel and subsidiaries (Peru) 76,049 70,319 (5,730) (7.5)%Endesa Fortaleza (Brazil) 83,926 59,114 (24,812) (29.6)%El Chocón (Argentina) 38,700 31,651 (7,049) (18.2)%CIEN (Brazil) 47,992 28,056 (19,936) (41.5)%Endesa Costanera (Argentina) 4,380 10,840 6,460 147.5%Less: Intercompany Transactions (119) (2) 117 (98.3)%Total 1,192,408 1,050,094 (142,314) (11.9)%
Distribution BusinessCodensa (Colombia) 199,885 207,223 7,338 3.7%Coelce (Brazil) 151,273 183,164 31,891 21.1%Ampla (Brazil) 187,127 120,689 (66,438) (35.5)%Chilectra and subsidiaries (Chile) 129,032 111,766 (17,266) (13.4)%Edelnor (Peru) 62,425 64,949 2,524 4.0%Edesur (Argentina) 31,876 3,944 (27,932) (87.6)%Less: Intercompany Transactions (201) — 201 —Total 761,417 691,735 (69,682) (9.2)%
Less: Consolidation Adjustments and Other Businesses (26,380) (37,528) (11,148) 42.3%Total 1,927,445 1,704,301 (223,144) (11.6)%
114

Table of Contents
Non−Operating Result
The following table shows the non−operating results for the years ended December 31, 2009 and 2010, and the percentage change between both years:
Year ended December 31,2009 2010 Change % Change
(in million of Ch$)
Financial resultFinancial income 159,670 171,237 11,567 7.2%Financial costs (482,472) (438,358) 44,114 (9.1)%Gain (loss) for indexed assets and liabilities 21,781 (15,056) (36,837) n.a.Net Foreign currency exchange differences (8,235) 11,572 19,807 n.a.Total (309,256) (270,605) 38,651 (12.5)%
Other non−operating resultsTotal gain (loss) on sale of non−current assets not held for sale 50,502 11,711 (38,791) (76.8)%Other non−operating income 2,374 1,288 (1,086) (45.7)%Total 52,876 12,999 (39,877) (75.4)%
Non−operating results (256,380) (257,606) (1,226) 0.5%
Financial Result
Financial result in 2010 was a loss of Ch$ 270.6 billion, which was a decrease of 12.5% or Ch$ 38.6 billion, as compared to the prior year. This ismainly due to reduced financial costs of Ch$ 44.1 billion, as a result of lower average debt and lower average interest rates during 2010, as compared to2009. It is also explained by a reduced charge for exchange differences that showed a positive variation of Ch$ 19.8 billion, mainly coming from Chile,Argentina and Brazil. In Chile, this is due to the effect of the peso appreciation of 8.4% against the dollar in 2010 (compared to an appreciation of 25.5% in2009), which impacts net assets and liabilities denominated in dollars. In Argentina, the Argentine peso depreciated by approximately 4% against the dollarduring 2010 (compared to a devaluation of approximately 9% in 2009). The effect on assets and debt in dollars is a gain of Ch$ 8.2 billion in 2010 and lossof Ch$ 17.3 billion in 2009. In Brazil, the real appreciated almost 5% (compared to an appreciation of over 30% in 2009), which translates into a reducedgain of Ch$ 17.7 billion (loss of Ch$ 3.7 billion in 2010 and gain of Ch$ 14.0 billion in 2009). Finally, higher financial income of Ch$ 11.6 billion, as aresult of an increase in income from larger cash placements during the year, contributed to the reduction in financial loss in 2010 compared to 2009.
The reduced losses described above were partially offset by higher indexation expenses of Ch$ 36.8 billion due to the negative effect produced byvariations in the value of the Unidad de Fomento (UF) in debt denominated in UF of some of our Chilean subsidiaries. This is because the UF in 2010increased in value by 2.4%, compared to a decrease of 2.4% in 2009.
Result of asset sales
The result of asset sales shows a reduced gain of Ch$ 38.8 billion in 2010, mainly due to the booking in 2009 of gains on the sales of shares inEmpresa de Energía de Bogotá for Ch$ 28.1 billion and the sale of the credit portfolio of Codensa Hogar for Ch$ 12.8 billion.
As a result of all of the foregoing, total non−operating results remain virtually unchanged when comparing 2009 and 2010.
115

Table of Contents
Net Income for the Year
The following table shows our net income for the year for the periods indicated.
Year ended December 31,2009 2010 Change % Change
(in million of Ch$)
Operating income 1,927,445 1,704,301 (223,144) (11.6)%Non−operating results (256,380) (257,606) (1,226) (0.5)%Net income before taxes 1,671,065 1,446,695 (224,370) (13.4)%
Income tax (359,737) (346,007) 13,730 (3.8)%
Net Income from Continuing Operations After Tax 1,311,328 1,100,688 (210,640) (16.1)%Net income from discontinued operations 0 0 0 0.0%
Net Income 1,311,328 1,100,688 (210,640) (16.1)%Net Income attributable to: Owners of Parent 660,231 486,227 (174,004) (26.4)%Net income attributable to: Non−controlling interests 651,097 614,461 (36,636) (5.6)%
Corporate income tax expense was reduced by Ch$ 13.7 billion in 2010 compared to 2009, mainly due to a decrease in the corporate income tax forAmpla of Ch$ 23.7 billion, Gas Atacama of Ch$ 13.2 billion, CGTF of Ch$ 10.3 billion, Edesur of Ch$ 10.0 billion, CIEN of Ch$ 4.3 billion and Pangue ofCh$ 2.6 billion. These decreases were partially offset by increases in Enersis of Ch$ 27.9 billion, Endesa Costanera of Ch$ 7.2 billion, Emgesa of Ch$ 6.9billion, Pehuenche of Ch$ 5.5 billion and Chilectra of Ch$ 2.2 billion.
B. Liquidity and Capital Resources.
We are a company with no significant assets other than the stock of our subsidiaries. The following discussion of cash sources and uses reflects thekey drivers of cash flow for Enersis.
Enersis receives cash inflows from its subsidiaries, as well as from related companies in Chile and abroad. Foreign subsidiaries and associates’ cashflows may not be available to satisfy our own liquidity needs, mainly because they are not wholly−owned, and because there is a time lag before we haveeffective access to those funds, through dividends or capital reductions.
However, we believe that cash flow generated from our business operations, as well as cash balances, borrowings from commercial banks, and ampleaccess to both Chilean and foreign capital markets will be sufficient to satisfy all our needs for working capital, debt service, dividends and routine capitalexpenditures.
Set forth below, is the consolidated cash flow from an accounting perspective:
Year ended December 31,2009 2010 2011
(in Ch$ billion)
Net Cash Flows from (used in) operating activities 2,038 1,943 1,698Net Cash Flows from (used in) investing activities (867) (776) (624)Net Cash Flows from (used in) financing activities (1,308) (1,283) (891)
Net increase (decrease) in cash and cash equivalents before effect ofexchange rates changes (137) (115) 183
Effects of exchange rate changes on cash and cash equivalents (46) (58) 76
Cash and cash equivalents at beginning of period 1,318 1,135 961Cash and cash equivalents at end of period 1,135 961 1,220
116

Table of Contents
For the twelve−month period ended December 31, 2011, operating activities generated net cash flow of Ch$ 1,698 billion, a decrease of 12.6% whencompared to 2010. For the construction of cash flow from operating activities, we start with net income of Ch$ 873 billion, to which different adjustmentsare applied. See “Item 5. Operating and Financial Review and Prospects — A. Operating Results — Net Income.” The primary adjustments arenon−monetary items for Ch$ 477 billion, which mainly include amortization and depreciation in the period for a total amount of Ch$ 425 billion, andimpairments for a total amount of Ch$ 136 billion. This was partially offset by tax payments of Ch$ 361 billion.
For the twelve−month period ended December 31, 2010, operating activities generated net cash flow of Ch$ 1,943 billion, a decrease of 4.7% whencompared to 2009. For the construction of cash flow from operating activities, we start with net income of Ch$ 1,101 billion, to which different adjustmentsare applied. See “Item 5. Operating and Financial Review and Prospects — A. Operating Results — Net Income.” The main adjustments arenon−monetary adjustments for Ch$ 527 billion, which mainly include amortization and depreciation in the period for a total amount of Ch$ 449 billion, andimpairments for a total amount of Ch$ 108 billion. This was partially offset by tax payments of Ch$ 349 billion.
For the twelve−month period ended on December 31, 2011, investment activities led to a cash outflow of Ch$ 624 billion, a 19.6% decrease comparedto 2010. This cash flow corresponds primarily the addition of new fixed assets for Ch$ 498.1 billion. Major investments in the generation business wereBocamina II in Chile, with Ch$ 89 billion invested (from an estimated total investment of Ch$ 450 billion), and El Quimbo in Colombia with an investmentof Ch$ 75 billion (from an estimated total investment of Ch$ 620 billion). We have also spent Ch$ 107 billion in the maintenance of existing installedgeneration capacity, mainly in Argentina, Colombia and Peru, and Ch$ 23 billion in other minor projects. On the other hand, major investments in thedistribution business were made in Brazil, with Ch$ 51 billion invested in Coelce and Ch$ 132 billion invested in Ampla. In Colombia, investments totaledCh$ 82 billion. The investment cash flow is also explained by intangible assets’ purchases of Ch$ 187.9 billion.
For the twelve−month period ended on December 31, 2010, investment activities led to a cash outflow of Ch$ 776 billion, a 10.5% decrease comparedto 2009. This cash outflow corresponds primarily to new fixed assets for Ch$ 474 billion. Major investments in the generation business were Bocamina IIin Chile, with Ch$ 70 billion invested, and El Quimbo in Colombia with an investment of Ch$ 16 billion. We have also spent Ch$ 87 billion in maintenanceof existing installed generation capacity, mainly in Argentina, Colombia and Peru. On the other hand, major investments in the distribution business weremade in Brazil, with Ch$ 125 billion invested in Coelce and Ch$ 114 billion invested in Ampla. In Colombia, these investments totaled Ch$ 80 billion. The investment cash flow is also explained by intangible assets’ purchases of Ch$ 227.4 billion and other investments of Ch$ 94.8 billion.
For the twelve−month period ended on December 31, 2011, financing activities originated a cash outflow of Ch$ 891.4 billion. The main drivers aredescribed below.
The aggregated cash inflows were mainly explained by:
• Edegel obtained loans for Ch $ 36 billion.• Emgesa issued bonds for Ch $ 183 billion.• Endesa Brasil Consolidated obtained loans for Ch$ 111 billion and issued bonds for Ch$ 215 billion (Ch$ 100 billion in Ampla and Ch$ 115 in Coelce),
among other financial operations, for a total of Ch$ 387.1 billion cash inflow.
The aggregated cash outflows were mainly explained by:
• Ch$ 648.1 billion in dividend payments (Ch$ 368.2 billion from Endesa Chile, Ch$ 143 from Chilectra and Ch$ 79.4 billion from Codensa, amongothers).
• Ch$ 248.1 billion in payment of interest expense (Ch$ 109.7 billion in Endesa Chile and Ch$ 79.2 billion in Endesa Brasil, among others).• Endesa Brasil consolidated payments of Ch$ 315 billion in loans (Ch $ 54 billion in Endesa Brasil, Ch $ 62 billion in CIEN and Ch$ 50 billion in
Ampla, among others) and Ch$ 71 billion in bonds (Ch$ 48 billion in Ampla and Ch$ 23 billion in Coelce).• Endesa Chile consolidated payment s of Ch$ 55 billion in loans and Ch$ 94 billion in other financial instruments (Ch$ 83 billion on Emgesa’ bonds).
For the twelve−month period ended on December 31, 2010, financing activities originated a cash outflow of Ch$ 1,283 billion. The main drivers aredescribed below.
117
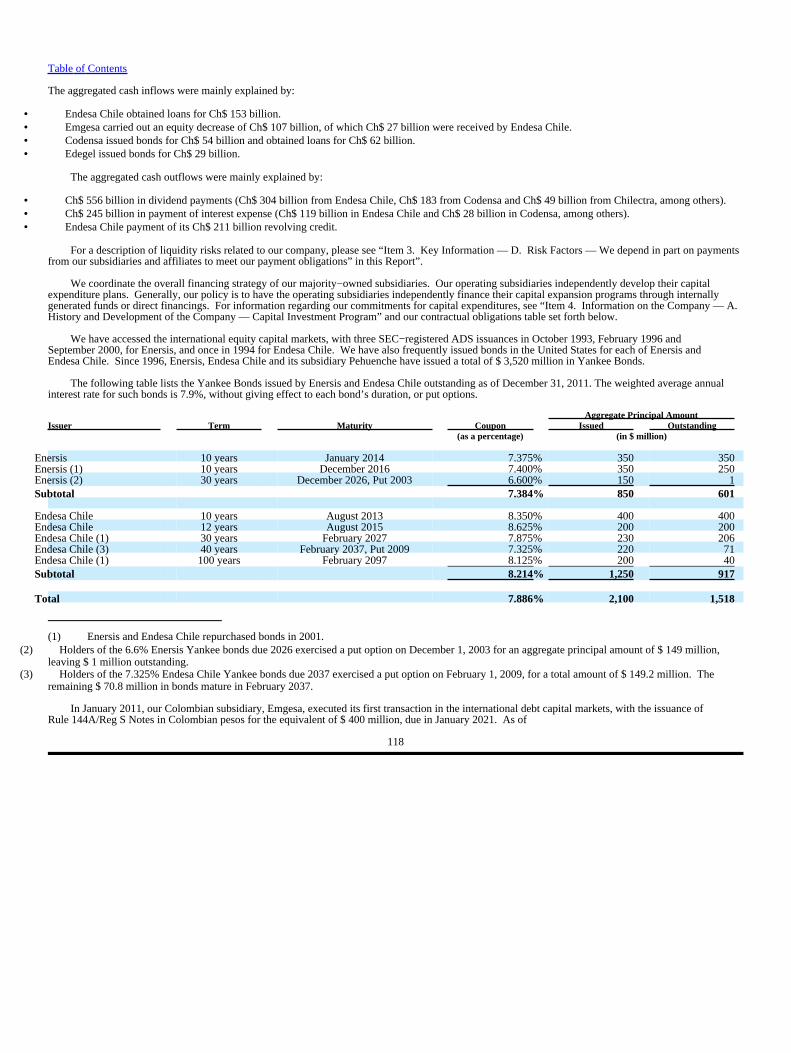
Table of Contents
The aggregated cash inflows were mainly explained by:
• Endesa Chile obtained loans for Ch$ 153 billion.• Emgesa carried out an equity decrease of Ch$ 107 billion, of which Ch$ 27 billion were received by Endesa Chile.• Codensa issued bonds for Ch$ 54 billion and obtained loans for Ch$ 62 billion.• Edegel issued bonds for Ch$ 29 billion.
The aggregated cash outflows were mainly explained by:
• Ch$ 556 billion in dividend payments (Ch$ 304 billion from Endesa Chile, Ch$ 183 from Codensa and Ch$ 49 billion from Chilectra, among others).• Ch$ 245 billion in payment of interest expense (Ch$ 119 billion in Endesa Chile and Ch$ 28 billion in Codensa, among others).• Endesa Chile payment of its Ch$ 211 billion revolving credit.
For a description of liquidity risks related to our company, please see “Item 3. Key Information — D. Risk Factors — We depend in part on paymentsfrom our subsidiaries and affiliates to meet our payment obligations” in this Report”.
We coordinate the overall financing strategy of our majority−owned subsidiaries. Our operating subsidiaries independently develop their capitalexpenditure plans. Generally, our policy is to have the operating subsidiaries independently finance their capital expansion programs through internallygenerated funds or direct financings. For information regarding our commitments for capital expenditures, see “Item 4. Information on the Company — A. History and Development of the Company — Capital Investment Program” and our contractual obligations table set forth below.
We have accessed the international equity capital markets, with three SEC−registered ADS issuances in October 1993, February 1996 andSeptember 2000, for Enersis, and once in 1994 for Endesa Chile. We have also frequently issued bonds in the United States for each of Enersis andEndesa Chile. Since 1996, Enersis, Endesa Chile and its subsidiary Pehuenche have issued a total of $ 3,520 million in Yankee Bonds.
The following table lists the Yankee Bonds issued by Enersis and Endesa Chile outstanding as of December 31, 2011. The weighted average annualinterest rate for such bonds is 7.9%, without giving effect to each bond’s duration, or put options.
Aggregate Principal AmountIssuer Term Maturity Coupon Issued Outstanding
(as a percentage) (in $ million)
Enersis 10 years January 2014 7.375% 350 350Enersis (1) 10 years December 2016 7.400% 350 250Enersis (2) 30 years December 2026, Put 2003 6.600% 150 1Subtotal 7.384% 850 601
Endesa Chile 10 years August 2013 8.350% 400 400Endesa Chile 12 years August 2015 8.625% 200 200Endesa Chile (1) 30 years February 2027 7.875% 230 206Endesa Chile (3) 40 years February 2037, Put 2009 7.325% 220 71Endesa Chile (1) 100 years February 2097 8.125% 200 40Subtotal 8.214% 1,250 917
Total 7.886% 2,100 1,518
(1) Enersis and Endesa Chile repurchased bonds in 2001.(2) Holders of the 6.6% Enersis Yankee bonds due 2026 exercised a put option on December 1, 2003 for an aggregate principal amount of $ 149 million,
leaving $ 1 million outstanding.(3) Holders of the 7.325% Endesa Chile Yankee bonds due 2037 exercised a put option on February 1, 2009, for a total amount of $ 149.2 million. The
remaining $ 70.8 million in bonds mature in February 2037.
In January 2011, our Colombian subsidiary, Emgesa, executed its first transaction in the international debt capital markets, with the issuance ofRule 144A/Reg S Notes in Colombian pesos for the equivalent of $ 400 million, due in January 2021. As of
118
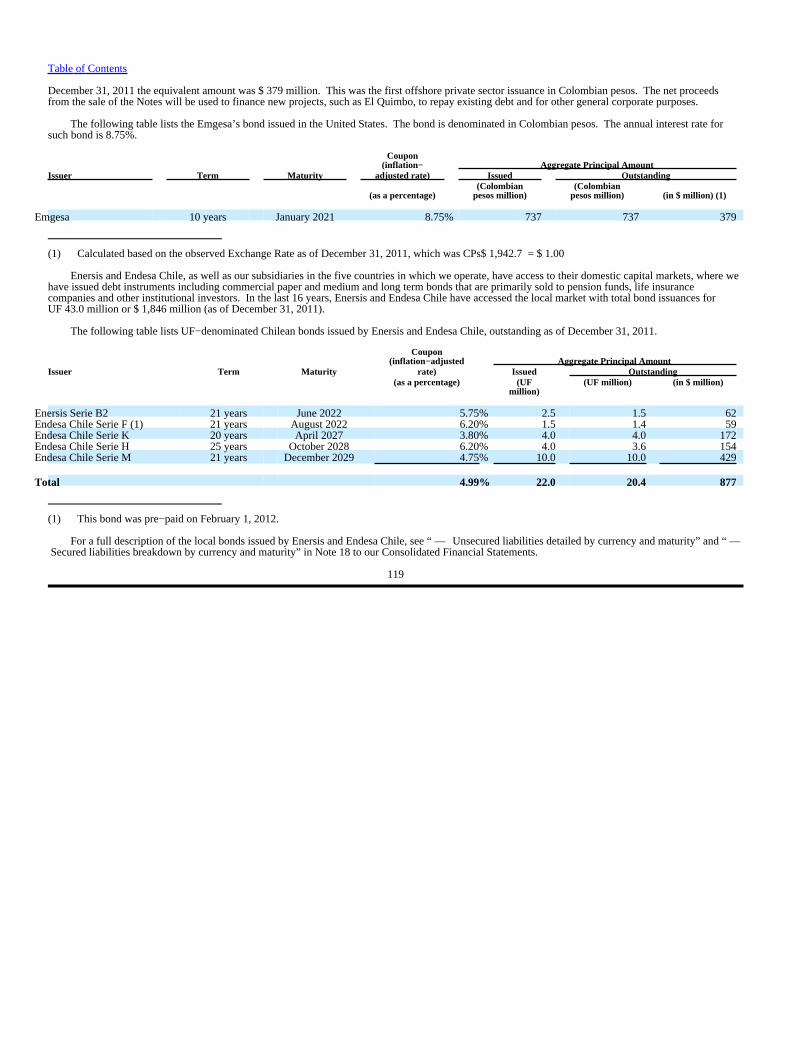
Table of Contents
December 31, 2011 the equivalent amount was $ 379 million. This was the first offshore private sector issuance in Colombian pesos. The net proceedsfrom the sale of the Notes will be used to finance new projects, such as El Quimbo, to repay existing debt and for other general corporate purposes.
The following table lists the Emgesa’s bond issued in the United States. The bond is denominated in Colombian pesos. The annual interest rate forsuch bond is 8.75%.
Coupon(inflation− Aggregate Principal Amount
Issuer Term Maturity adjusted rate) Issued Outstanding
(as a percentage)(Colombian
pesos million)(Colombian
pesos million) (in $ million) (1)
Emgesa 10 years January 2021 8.75% 737 737 379
(1) Calculated based on the observed Exchange Rate as of December 31, 2011, which was CPs$ 1,942.7 = $ 1.00
Enersis and Endesa Chile, as well as our subsidiaries in the five countries in which we operate, have access to their domestic capital markets, where wehave issued debt instruments including commercial paper and medium and long term bonds that are primarily sold to pension funds, life insurancecompanies and other institutional investors. In the last 16 years, Enersis and Endesa Chile have accessed the local market with total bond issuances forUF 43.0 million or $ 1,846 million (as of December 31, 2011).
The following table lists UF−denominated Chilean bonds issued by Enersis and Endesa Chile, outstanding as of December 31, 2011.
Coupon(inflation−adjusted Aggregate Principal Amount
Issuer Term Maturity rate) Issued Outstanding(as a percentage) (UF
million)(UF million) (in $ million)
Enersis Serie B2 21 years June 2022 5.75% 2.5 1.5 62Endesa Chile Serie F (1) 21 years August 2022 6.20% 1.5 1.4 59Endesa Chile Serie K 20 years April 2027 3.80% 4.0 4.0 172Endesa Chile Serie H 25 years October 2028 6.20% 4.0 3.6 154Endesa Chile Serie M 21 years December 2029 4.75% 10.0 10.0 429
Total 4.99% 22.0 20.4 877
(1) This bond was pre−paid on February 1, 2012.
For a full description of the local bonds issued by Enersis and Endesa Chile, see “ —Unsecured liabilities detailed by currency and maturity” and “ —Secured liabilities breakdown by currency and maturity” in Note 18 to our Consolidated Financial Statements.
119

Table of Contents
The following table lists local bonds issued by our foreign subsidiaries, outstanding as of December 31, 2011. We present aggregate information foreach company. The maturity column for each company reflects the issuance with the longest maturity, and the coupon rate corresponds to the weightedaverage coupon of all issuances for each company.
Issuer MaturityCoupon (1)
(as a percentage)Aggregate PrincipalAmount Outstanding
(in $million)
Ampla June 2018 13,10% 404Codensa December 2018 8,91% 587Coelce October 2018 13,31% 309Edegel January 2028 6,58% 177Edelnor August 2020 7,13% 277Emgesa February 2024 9,29% 559Edesur June 2012 11,75% 8
Total 2,320
(1) Many of the coupon rates are variable rates based on local indexes, such as inflation. The table reflects the coupon rate taking into account eachlocal index as of December 31, 2011.
We frequently participate in the international commercial bank markets governed by the laws of the State of New York through both bilateral andsyndicated senior unsecured loans. As of the date of this Report, the amounts outstanding or available for these bank loans are listed below:
Borrower Type Maturity Facility Amount Amount Drawn($ million) (in $ million)
Enersis Syndicated revolving loan December 2012 100 0Endesa Chile Syndicated revolving loan June 2014 200 0Endesa Chile Syndicated term loan June 2014 200 200
Total 500 200
The Enersis revolving credit facility due December 2012 and the Endesa Chile revolving credit facility due June 2014 do not contain a conditionprecedent requirement regarding the non−occurrence of a “Material Adverse Effect” (or MAE, as defined contractually) prior to a disbursement, allowingthe companies full flexibility to draw on up to $ 300 million in the aggregate from such committed revolving facilities under any circumstances, includingsituations involving a MAE.
Enersis and Endesa Chile also borrow from banks in Chile under fully committed facilities in which a potential MAE would not be an impediment tothis source of liquidity. In December 2009, both companies signed 3−year bilateral revolving loans for an aggregate of UF 4.8 million (equivalent to $ 204million as of December 31, 2011) as detailed below.
Borrower Type Maturity Facility Amount Amount Drawn(UF million) (UF million)
Enersis Bilateral revolving loans December 2012 2.4 0Endesa Chile Bilateral revolving loans December 2012 2.4 0
Total 4.8 0
Our subsidiaries also have access to fully committed credit lines in the local markets, as detailed above.
Borrower Type Maturity Facility Amount Amount Drawn($ million) (in $ million)
Ampla Bilateral revolving loans April 2012 75 0Coelce Bilateral revolving loans February 2012 53 0Emgesa Bilateral revolving loans January 2015 185 0
Total 313 0
120

Table of Contents
As a result of the foregoing, we have access to fully committed undrawn revolving loans, both international and domestic, for up to approximately$ 817 million in the aggregate as of December 31, 2011.
Enersis and Endesa Chile also borrow routinely from uncommitted Chilean bank facilities with approved lines of credit for approximately $ 444million in the aggregate. Unlike the previous committed lines not subject to MAE conditions precedent prior to disbursements, this source of funding in theChilean market is not guaranteed under all circumstances. Our subsidiaries also have access to uncommitted local bank facilities, for a total amount of$ 1,526 million, of which $ 1,500 million are undrawn.
Both Enersis and Endesa Chile can also tap the Chilean commercial paper market under programs that have been registered with the Chilean SVS for amaximum of $ 200 million for each borrower. In addition, Enersis has a local bond program registered with the SVS for UF 12.5 million (equivalent to$ 537 million as of December 31, 2011) that has not been drawn upon yet.
Finally, our foreign subsidiaries also have access to other types of financing, including governmental facilities, supplier credit and leasing, amongothers.
Except for the SEC−registered Yankee bonds, which are not subject to financial covenants, Enersis and Endesa Chile’s outstanding debt facilitiesinclude such covenants. The types of financial covenants, and their respective limits, vary from one type of debt to another. As of December 31, 2011, themost restrictive financial covenants affecting Enersis was the Indebtedness to EBITDA Ratio covenant, corresponding to the revolving loan facility thatmatures in December 2012. In the case of Endesa Chile, it was the Capitalization Ratio covenant, corresponding to the UF−denominated Chilean bondsSerie K and Serie H that mature in April 2027 and October 2028, respectively. Under such covenants, the maximum additional debt that could be incurredwithout a breach of covenant is $ 6.4 billion and $ 2.6 billion for Enersis and Endesa Chile, respectively. As of the date of this Report, we are in compliancewith the financial covenants contained in our debt instruments.
As is customary for certain credit and capital market debt facilities, a significant portion of Enersis and Endesa Chile’s financial indebtedness is subjectto cross default provisions. Each of the revolving credit facilities described above, as well as all of Enersis and Endesa Chile’s Yankee Bonds, havecross default provisions with different definitions, criteria, materiality thresholds, and applicability as to the subsidiaries that could give rise to across default.
The cross default provision for the Endesa Chile revolving credit facilities due in July 2014, governed by the laws of the State of New York, refers todefaults of the borrower, without reference to any subsidiary. Under such credit facilities, only matured defaults exceeding $ 50 million qualify for apotential cross default when the principal exceeds $ 50 million, or its equivalent in other currencies. In the case of a matured default above the materialitythreshold, revolving credit facility’s lenders would have the option to accelerate if the lenders representing more than 50% of the aggregate debt of aparticular facility then outstanding choose to do so. None of the Enersis local facilities due in December 2012, or the Endesa Chile local facilities due onthe same date, has cross default provisions to debt other than the respective borrower’s own indebtedness.
In the case of the Enersis bilateral loans maturing in December 2012, governed by the laws of the State of New York, the cross default provision refersto so−called “Relevant Subsidiaries,” a contractually defined term that makes reference only to Endesa Chile and Chilectra, and the latter does not have anydebt with third parties. Therefore, the risk of a cross default under these bank loans is very limited, since there is no reference to subsidiaries in countriesother than Chile. Furthermore, as of the date of this Report, there is no amount outstanding of this facility, and therefore, there is no current exposure tocross default under this credit agreement.
After amendments in July 2009, following a successful solicitation consent, Enersis and Endesa Chile Yankee Bonds’ cross default provisions may betriggered only by debt of the respective borrower or its Chilean subsidiaries. A matured default of either Enersis, Endesa Chile or one of their respectiveChilean subsidiaries could result in a cross default to Enersis and Endesa Chile’s Yankee Bonds if such matured default, on an individual basis, has aprincipal exceeding $ 30 million, or its equivalent in other currencies. In the case of a matured default above the materiality threshold, Yankee bondholderswould have the option to accelerate if either the Trustee or bondholders representing no less than 25% of the aggregate debt of a particular series thenoutstanding choose to do so. Following the 2009 Yankee amendments which ring−fenced Chile, a payment default or a bankruptcy/insolvency defaultoutside of Chile has no contractual effect on our Yankee Bond indentures, no matter how material.
The cross acceleration and bankruptcy/insolvency clauses of three of our four Endesa Chile UF−denominated Chilean bonds were amended inFebruary 2010 after bondholders’ approvals in January 2010. After the amendments, all series of Endesa Chile’s Chilean bonds ring−fenced Endesa Chile,and none of its subsidiaries, either in Chile or outside Chile, can trigger a cross default to Endesa Chile.
121

Table of Contents
Our Argentine subsidiary, Endesa Costanera, did not make an installment payment due on March 30, 2012 of $ 17.6 million (which includes $ 4.3million in interest expense) under the terms of a supplier credit agreement with Mitsubishi Corporation (“MC”) originally entered into in 1996. Theaggregate amount accrued under the supplier credit agreement as of March 30, 2012, including capitalized interest, was $ 141 million. Endesa Costanerahas experienced difficulties in making timely payments under its agreement with MC on a recurring basis since the Argentine crisis of 2002, but has in thepast received waivers expressing the willingness to renegotiate payments. Such missed payments have been carried out on mutually agreed terms. As ofthe date of this Report, Endesa Costanera has not received a waiver for the payment past due. The relevant terms of the supplier credit provide for a180−day grace period for payment. There can be no assurance that Endesa Costanera will receive a waiver or payment extension prior to the expiration ofthe 180−day grace period for payment. (See “Item 4. Information on the Company. B. Business Overview. Electricity Industry Regulatory Framework. Argentina. Regulatory Developments: the industry after the Public Emergency Law” and “Item 5. Operating and Financial Review and Prospects − B. Liquidity and Capital Resources”).
Defaults and cross defaults at the Endesa Costanera level do not trigger cross default provisions under indebtedness of Enersis or any of our Chileansubsidiaries. (See “Item 4. Information on the Company. B. Business Overview. Electricity Industry Regulatory Framework. Argentina. RegulatoryDevelopments: the industry after the Public Emergency Law”).
With the exception of our Argentine subsidiaries, our companies have access to existing credit lines sufficient to satisfy all of their present workingcapital needs. Access to the capital markets on the part of our Argentine subsidiaries has been very limited due to the difficult financial situation stillprevailing in Argentina (particularly in the utilities sector), the poor capital markets environment due to the shortage of off−shore financing, thenationalization of the pension fund system and, in general, higher risk associated with lending to Argentine utilities as a consequence of the regulatoryframework. Notwithstanding these unusual circumstances, these subsidiaries were able to refinance debt maturing in 2011.
Payment of dividends and distributions by our subsidiaries and affiliates represent an important source of funds for us. The payment of dividends anddistributions by certain subsidiaries and affiliates are subject to legal restrictions, such as legal reserve requirements, and capital and retained earningscriteria, and other contractual restrictions. We have been advised by legal counsel in the various geographical locations where our subsidiaries and affiliatesoperate that there currently are no additional legal restrictions on the payment to Enersis of dividends or distributions to us in the jurisdictions where suchsubsidiaries or affiliates are incorporated. Certain credit facilities and investment agreements of our subsidiaries restrict the payment of dividends ordistributions in certain special circumstances. For instance, two of Endesa Chile’s UF−denominated Chilean bonds restrict the amount of intercompanyloans that Endesa Chile and its consolidated subsidiaries are allowed to lend to Enersis. The threshold for the restriction of intercompany loans is now set atthe equivalent of $ 100 million. For a description of liquidity risks resulting from our company status, please see “Item 3. Key Information — D. Riskfactors — We depend in part on payments from our subsidiaries and affiliates to meet our payment obligations.”
Our estimated capital expenditures for the 2012−2016 period, expressed in dollars at internally estimated exchange rates, amount to $ 6,779 million, ofwhich $ 6,499 million are considered non−discretionary investments. We include maintenance capital expenditures as non−discretionary. It is importantfor us to maintain the quality and operation standards required for our facilities, but we do have some flexibility regarding the timing for these investments. We consider the investment in non−conventional renewable energy (NCRE) projects in Chile to be non−discretionary. These investments are being made tocomply with regulations that call for 5% of the total contracted energy to be based on NCRE. Finally, expansion projects under execution are alsonon−discretionary. We consider the remaining $ 280 million of the $ 6,779 million of our estimated capital expenditure for 2012−2016 to be discretionary. The latter includes expansion projects that are still under evaluation, in which case we would undertake them only if deemed profitable.
Other than in Argentina, we do not currently anticipate liquidity shortfalls affecting our ability to satisfy the material obligations described in thisReport. We expect to refinance our indebtedness as it becomes due, fund our purchase obligations outlined previously with internally generated cash, andfund capital expenditures with a mixture of internally generated cash and borrowings.
Transactions that most significantly affected Enersis foreign subsidiaries’ liquidity in 2011 included:
• Endesa Costanera: refinancing of 2011 indebtedness for approximately $ 80 million. With regards to this refinancing, we highlight the $ 35 millionrefinancing of amounts due to Mitsubishi Corporation and of $ 10 million due to Credit Suisse.
• El Chocón: refinancing of syndicated loan for $ 40 million for four years. The Company also obtained a syndicated loan for $ 25 million for 3.5 years,which enabled the company to increase the debt’s average life.
• Edesur: refinancing of bank loans for a total of $ 10 million for 2.5 year maturity, which allowed for an increase in the debt’s average life. Signed creditlines for $ 6 million used to maintain an appropriate level of liquidity and received a total of $ 40 million on bank loans.
• Coelce: local bond issuance for $ 213 million for five and seven year maturities, which allow the company to increase the debt’s average life. Also, thecompany received official loans for a total of $ 32 million for development related projects.
• Ampla: local bond issuance for $ 160 million for five and seven year maturities, which allow the company to increase the debt’s average life. Also, thecompany received official loans for a total of $ 142 million for development related projects and signed three committed credit lines for a total of $ 75million for liquidity purposes.
• Emgesa: International bond issuance for a total of $ 379 million for ten years, used to finance part of the El Quimbo project. The company also signedexchange swap contracts for $ 116 million.
• Edelnor: refinancing of short−term debt for $ 57 million, postponing it to 2018, thus allowing the company to increase the debt’s average life.
122

Table of Contents
• Edegel: enter into bank loan for $ 31 million for seven years to refinancing in advance 2012’s maturities. The company also signed interest swapcontracts for $ 30 million, to hedge leasing operations.
Transactions that most significantly affected Enersis foreign subsidiaries’ liquidity in 2010 included:
• Endesa Costanera: refinancing of all 2010 indebtedness for approximately $ 72 million. Within this refinancing, we highlight the $ 28 millionrefinancing of amounts due to Mitsubishi Corporation and of $ 8.6 million due to Credit Suisse.
• El Chocón: syndicated loan for $ 22 million for 3.5 years, which enabled the company to refinance its short−term debt and to increase the debt’s averagelife. The company also signed forward contracts for $ 29 million.
• Edesur: refinancing of two loans in advance for approximately $ 8 million, which allowed increasing the debt’s average life.
• Coelce: refinancing of debt maturing in 2010 for approximately $ 46 million.
• Endesa Brasil: payment of IFC’s equity interest for $ 111 million.
• Codensa: Bond issuances for a total of $ 116 million for three and six year maturities.
• Emgesa: The first placement of commercial paper was carried out for $ 39 million to refinance short−term debt and local bond issuances for $ 309million with terms between 5 and 15 years.
• Edelnor: Local bond issuance during 2010 for approximately $ 36 million, used to refinance indebtedness.
• Edegel: Bond issuance for $ 20 million and obtained a 7−year term loan for $ 61 million to refinance debt maturing in 2012. The company also signedforward contracts for $ 39 million.
C. Research and Development, Patents and Licenses, etc.
None.
D. Trend Information.
Enersis is a company with subsidiaries engaged in the generation, transmission and distribution of electricity in Chile, Argentina, Brazil, Colombia andPeru. Therefore, our businesses are subject to a wide range of conditions that may result in variability in our earnings and cash flows from year to year. Ingeneral, our net income is a result of our operating income from our generation and distribution businesses and other factors such as income fromunconsolidated related companies, foreign currency exchange rate effects and tax expense.
In our generation business, our operating income for 2011 decreased by 5.3% as compared to 2010. This percent change in the generation segmentoperating income in 2011 varies in each of the five countries where we operate and is due to numerous factors, including hydrological conditions, the priceof fuel used to generate thermal electricity and the prevailing spot market and regulated prices for electricity. We expect to continue evidencing areasonably good operating performance over the coming years, given the favorable macroeconomic perspective for all of the countries in which we operateexcept for Argentina. Despite current uncertainties concerning the global economy, there are good expectations for this region’s growth for the next fiveyears, including a 4.8% growth in gross domestic product, on average, and a stable electricity demand growth.
On the other hand, development of new generation facilities in South America has always fallen behind demand growth. We anticipate that thistendency will continue in the foreseeable future. Also, due to growing environmental restrictions, transmission line saturation, obstacles for fueltransportation and scarcity of places where to locate plants, these new projects involve higher development costs than in the past. We expect that averageelectricity prices will adjust to recognize these increased costs. This could increase the value of our assets, especially in the case of hydroelectric powerplants, which have lower production costs, and thus benefit from greater profitability in scenarios of increasing prices to end users. Furthermore, animportant part of the new installed capacity under development in the five countries in which we operate corresponds to thermal power plants, with coal andnatural gas as their principal fuels, and only a few hydroelectric projects are being developed. Thus, we expect this situation will also impact long term spotprices positively. Long term contracts awarded to Enersis’ subsidiaries in different bids have already incorporated these expected price levels. Currently,we have 23% of our expected annual generation sold under contracts of at least ten years, and 33% in contracts of at least five years.
123

Table of Contents
However, spot prices are subject to great volatility, affecting our forecasted income. In order to address this risk in the generation business, theCompany has implemented commercial policies in order to control relevant variables and provide stability to the profit margins. Our commercial policyseeks to establish a global framework to conduct energy trading operations, setting responsibilities, guidelines and acceptable risk limits aligned withcompany objectives. Therefore, our company defines contractual volumes that minimize the risk of supply in adverse hydrological conditions and includes,where necessary with some unregulated clients, risk mitigation clauses.
In order to mitigate the risk of increasing fuel costs, Enersis has supply contracts to cover part of the fuel needed by its thermal generation units, whichoperate with coal, natural gas, diesel and fuel oil. In Chile, through an equity interest in GNL Quintero, we are the only electricity company that participatesin the LNG terminal at Quintero Bay (the only facility of its kind in the SIC market), enhancing our position to manage fuel supply risks, especially whenfacing increasing fuel costs scenarios. This becomes particularly relevant given the increasing trend to penalize other technologies that are intensive infuels, such as coal and diesel, which have a stronger environmental impact. Because of the drought in Chile and the volatility of the price of Brent oil, wedecided to hedge through a cap on the price of this commodity for the period between April and July 2011, and may do so again in the future. For furtherinformation on this subject, please see “Item 11(a) and 11(b). Quantitative and Qualitative Disclosures About Market Risk — Commodity Price Risk”.
With respect to our distribution business segment, our operating income in 2011 decreased by 14.3% as compared to 2010. This decrease is acombination of numerous factors in each of the five countries where we operate. These include, among others, effects of inflation and exceptional taxpayments, which are partially offset by operational efficiency and the increase in electricity sales due to growth in population and gross domestic product inthe countries in which we operate. Technological advances, such as smart metering, have enabled us to limit the increase in electricity losses in achallenging economic environment. We expect that the South American countries in which we operate will continue to experience high growth rates,positively impacting our distribution business performance. In particular, we expect the growth rates in the electricity sector to continue, mainly due to thegap in the per capita electricity consumption that these countries have with respect to more developed countries. We expect electricity demand to growapproximately 4% annually, on average, over the next ten years.
In connection with the distribution segment tariffs, and taking into account the future periodic review process in each country in which we operate, weexpect that the regulators will continue to recognize investments, encourage efficiency and establish prices that will allow for an appropriate return on ourinvestment. We also anticipate that our distribution companies will probably increase their profitability during the period between periodic tariff settingprocesses. After tariffs have been set, the companies have the opportunity to increase their efficiency, and obtain extra profits associated with suchefficiencies, during the period subsequent to each new tariff setting. For a better understanding of the cycles in the process, please refer to the figure below,where we conceptually describe the effect of the application of the price cap model used by regulators in most of the countries where we operate.
Although the price at which a distribution company purchases the electricity has a substantial impact on the price at which it is sold to end users, itdoes not have an impact on our profitability. The cost of electricity purchased is passed through to end users. However, it is important to note thatdistribution companies usually enter into long−term contracts in order to decrease exposure to electricity price volatility. This is a common practice in mostof the countries in which we operate.
124

Table of Contents
Though our operations in the five countries allow us to somewhat offset and counterbalance variations with respect to these main factors that affect ouroperating results, in light of the variability of these factors over time and across the countries in which we operate, we cannot claim that we are fully hedgedin our portfolio of assets in these countries. Furthermore, we cannot ascertain the likelihood or the extent to which past performance will be indicative offuture performance with respect to our businesses. Any significant change with respect to hydrological conditions, fuel price or the electricity price, amongother factors, could affect our operating income in the generation business. More broadly, any significant change with respect to economic and populationgrowth, as well as changes in the regulatory regimes in the countries in which we operate, among other factors, could affect our operating income in thedistribution business. Variability in our earnings and cash flows can also arise from non−operating factors as well, such as foreign currency exchange rates. For further information regarding 2011 results of the Company compared with those recorded in previous periods, please see “Item 5. Operating andFinancial Review and Prospects — A. Operating Results − Enersis’ Results of Operations for the Years Ended December 31, 2010 and December 31, 2011”and “Item 5. Operating and Financial Review and Prospects — A. Operating Results − Enersis’ Results of Operations for the Years EndedDecember 31, 2009 and December 31, 2010”. Investors should not look at our past performance as indicative of future performance.
We do not expect that our current debt agreements, which impose certain restrictions, could have a negative impact on our capital expenditure plan asdescribed in “Item 5. Operating and Financial Review and Prospects — B. Liquidity and Capital Resources.” We have a large leverage capacity prior to apotential breach of a debt covenant. As of December 31, 2011, Enersis is able to incur up to $ 6.4 billion in incremental debt, while Endesa Chile has anadditional debt capacity of $ 2.6 billion, in each case beyond current levels of consolidated indebtedness. We believe that Enersis will continue to havesimilar comfortable levels of further leverage capacity in the foreseeable future.
In connection with funding sources, as of December 31, 2011, the Company has approximately $ 817 million in committed revolving facilities whichhave not yet been drawn, and additional uncommitted Chilean lines of credit for another $ 444 million in the aggregate. In addition, both Enersis andEndesa Chile have publicly registered certain commercial paper programs for up to $ 400 million in the aggregate and local bond programs for up to $ 537million with the SVS. These funding sources can be increased in case of need.
Finally, as explained above, we expect that the Company will continue generating substantial operating cash, which can be used to finance asignificant part of our capital expenditure plan. If needed, our shareholders can also decrease the dividend payout ratio, subject to certain minimum legalrestrictions, in order to finance our investment plan and future growth.
E. Off—balance Sheet Arrangements.
Enersis is not a party to any off—balance sheet arrangements.
F. Tabular Disclosure of Contractual Obligations.
The table below sets forth the Company’s cash payment obligations as of December 31, 2011:
Ch$ billion (1) Total 2012 2013−2014 2015−2016After2016
Bank debt 573 255 218 37 63Local bonds (2) 1,642 185 322 297 838Yankee bonds 1,168 0 491 315 362Other debt (3) 350 116 126 63 44Interest expense 1,890 341 506 322 721Pension and post−retirement obligations(4) 315 47 82 108 78Purchase obligations(5) 32,094 1,887 3,500 3,256 23,450Financial leases 83 16 20 19 28Total contractual obligations 38,115 2,847 5,265 4,417 25,584
(1) All figures are in Ch$ of each year.(2) Hedging instruments included modify substantially the principal amount of debt.(3) Other debt includes governmental loan facilities, supplier credits and short—term commercial paper among others.(4) We have funded and unfunded pension and post−retirement benefit plans. Our funded plans have contractual annual commitments for contributions
which do not change based on funding status. Cash flow estimates in the table are based on such annual contractual commitments including certainestimable variable factors such as interest. Cash flow estimates in the table relating to our unfunded plans are based on future discounted paymentsnecessary to meet all of our pension and post−retirement obligations.
(5) Includes generation and distribution business purchase obligations comprised mainly of energy purchases, operating and maintenance contracts and otherservices. Of the total amount of Ch$ 32,094 billion, 91% corresponds to energy purchases, 5%
125

Table of Contents
corresponds primarily to fuel supply, services in medium and low voltage lines, and supply of cables, and the remaining 4% to miscellaneous services, suchas GNL regasification, fuel transport and coal handling.
G. Safe Harbor.
The information contained in the Items 5.E and 5.F contains statements that may constitute forward−looking statements. See “Forward−LookingStatements” in the “Introduction” of this Report, for safe harbor provisions.
Item 6. Directors, Senior Management and Employees
A. Directors and Senior Management.
Our Board of Directors consists of seven members who are elected for a three−year term at an Ordinary Shareholders’ Meeting (OSM). If a vacancyoccurs in the interim, the Board of Directors elects a temporary director to fill the vacancy until the next OSM, at which time the entire Board of Directorswill be elected. Our Executive Officers are appointed by the Board of Directors and hold office at the discretion of the Board. Set forth below are themembers of our Board of Directors as of December 31, 2011.
Directors Position Held SincePablo Yrarrázaval V. Chairman 2002Andrea Brentan Vice Chairman 2009Rafael Fernández M. Director 2010Rafael Miranda R. Director 1999Hernán Somerville S. Director 1999Eugenio Tironi B. Director 2000Leonidas Vial E. Director 2010
Set forth below are brief biographical descriptions of our directors, five of whom reside in Chile and two in Spain, as of December 31, 2011.
Pablo Yrarrázaval V.Chairman of the Board of Directors
Mr. Yrarrázaval became Chairman of the Board of Directors in July 2002 and was Chairman of the Directors’ Committee since April 2003 untilJanuary 2010. Mr. Yrarrázaval is a partner in the brokerage firm Corredora de Bolsa Yrarrázaval y Compañía Limitada, Vice Chairman of DepósitoCentral de Valores S.A. (DCV), and is also Chairman of the Santiago Stock Exchange, a position he has held since 1989. Before Mr. Yrarrázaval becameChairman of Enersis, he was Chairman of Endesa Chile.
Andrea BrentanVice Chairman of the Board of Directors
Mr. Brentan has been Vice Chairman since 2009. He was a research assistant at New York University from 1975 to 1977 and then held variouspositions at GIE, an Italian power plant contractor operating worldwide, until the beginning of 1991. From 1991 to 1999, he successively held the positionsof CFO, General Manager and CEO at Sae Sadelmi, a Milan−based company belonging to the ABB Group which is engaged in power plant engineering,procurement and construction and electrical generation equipment manufacturing and service. From 2000 to 2002, he was the Head of the WorldwideSteam Power Plant Business at Alstom, based in Paris. He joined Enel in November 2002, where he held several positions in the company, including Headof Business Development and M&A unit of the International Division, Chairman of Viesgo S.A., Chairman of Enel North America, Enel Latin America andSlovenske Elektrarne, and Director of Enel Energy Europe. Until June 2009, he served as Director of the Iberian Peninsula and Latin American Division ofEnel and Vice Chairman of the Board of Endesa Spain until he later became its CEO. Mr. Brentan is a mechanical engineer from Politecnico di Milano(Italy) and holds a M.Sc. in Applied Sciences from New York University.
Rafael Fernández M.Director of the Board, Member of the Directors’ Committee
Mr. Fernández was appointed Director of Enersis in April 2010. From 1997 to 2006, Mr. Fernández served as Chairman of the Board and Director ofvarious Argentine companies in the generation, transmission, distribution and trading businesses of electricity, as well as in natural gas production andtransport companies. Before that, he was CEO of some power generation companies. He also founded and was a member until 2004 of the AcademicCommittee in the Masters Program in Electricity Business at ITBA (Argentina) and, since 2006, has been a member of the Advisory Committee of theDevelopment Department of Universidad Alberto Hurtado (Chile). Between 2002 and 2006, he was the Executive Director of the Gas and Energy Businessdivision and member of the Board of Directors of Petrobras Energía—Argentina. Between 2006 and January 2010, he served as CEO and Director ofPetrobras Chile Petrolera Ltda. Since October 2011, he has been Director of the Board of Australis Seafood S.A., and since June 2010, has been CEO ofCorporación de Capacitación y Empleo, a subsidiary of Sociedad de Fomento Fabril (SOFOFA). Mr. Fernández is a civil
126

Table of Contents
industrial engineer from Pontificia Universidad Católica de Chile. He also carried out graduate studies at E.S.A.E. in the same university in 1988−1989,and an Advanced Management Program at Duke University in 2005.
Rafael Miranda R.Director of the Board
Mr. Miranda has been a Director of the Board since 1999. He joined Endesa Spain in 1987. From 1987 to 1997, he was Managing Director. BetweenFebruary 1997 and June 2009, he served as Endesa Spain’s CEO. Currently, Mr. Miranda is Chairman of Endesa Foundation, Honorary Chairman ofEurelectric (European Electricity Association), Chairman of the Social Council of Burgos University, Chairman of the Spanish Council of INSEAD (all inSpain), and Chairman of Asociación para el Progreso de la Dirección, an entity formed by the 4,000 largest Spanish companies dedicated to cooperate withdirectors and senior executives’ development. Mr. Miranda holds a B.Sc. in Industrial Engineering from Comillas University (ICAI) and a Master’s Degreein Management Science from the School for Industrial Organization, both in Spain.
Hernán Somerville S.Director of the Board, Chairman of the Directors’ Committee
Mr. Somerville has been a Director of the Board since 1999. From 1983 to 1988, Mr. Somerville was Director of the Chilean Central Bank, serving asChief Debt Negotiator for Chilean public debt and private commercial bank debt. Mr. Somerville was the former Chairman of the Confederation ofProduction & Commerce in Chile. Since 1989, Mr. Somerville has been the Managing Director and Partner of Fintec, an investment, advisory andmanagement company. He was the Chairman of the Chilean Association of Banks and Financial Institutions, and also was Chairman of the Latin AmericanFederation of Banks. He is the Chairman of Transbank S.A., which manages credit and debit cards in Chile. He is also a Board Member of INACAP andChairman of the Chilean Pacific Foundation. Mr. Somerville has a law degree from Universidad de Chile and a Master of Criminal Justice degree fromNew York University Law School.
Eugenio Tironi B.Director of the Board
Mr. Tironi has been a Director of Enersis since July 2000. Between 1990 and 1994, Mr. Tironi was a Director of Communications of the ChileanGovernment. Since 1994, he has been the Chairman of Tironi Asociados, a strategic communications’ firm, which advises Chilean and international firmsin several Latin American countries. He is also the Chairman of Gestión Social S.A., a consulting firm specialized in corporate social responsibility. Inaddition, Mr. Tironi is member of the Board of Trustees of Universidad Alberto Hurtado, researcher at CIEPLAN, and professor at Universidad AdolfoIbáñez. He was a visiting professor at Notre Dame University (U.S.A.) in 2002, and Sorbonne Nouvelle (France) in 2006. He is also a Board member ofseveral non−profit organizations, including Paz Ciudadana, Un techo para Chile and Fundación Orquestas Sinfónicas Juveniles e Infantiles. Mr. Tironi haspublished a very wide selection of books in Chile and abroad, and is a regular columnist of the Chilean newspaper, El Mercurio. Mr. Tironi received aPh.D. in sociology from L’École des Hautes Études en Sciences Sociales (France).
Leonidas Vial E.Director of the Board, Member of the Directors’ Committee
Mr. Vial was appointed Director of Enersis in April 2010. He was Director of Endesa Chile since April 1995 until March 2010. Mr. Vial has beenVice Chairman of the Santiago Stock Exchange since June 1988, as well as a Director of Empresas Santa Carolina S.A., Compañía Industrial ElVolcán S.A, Larraín Vial S.A., Chairman of Compañías CIC S.A. and Embotelladora Arica, none of which are related to the Endesa Group.
Executive Officers
Set forth below are our Executive Officers as of December 31, 2011.
Executive Officers (as of December 31, 2011) Position Current Position Held SinceIgnacio Antoñanzas A. Chief Executive Officer 2006Massimo Tambosco Deputy Chief Executive Officer 2010Ramiro Alfonsín B. Planning and Control Officer 2007Ángel Chocarro G. Accounting Officer 2009Alfredo Ergas S. Chief Financial Officer 2003Juan Pablo Larraín M. Communications Officer 2009Eduardo López M. Procurement Officer 2010Carlos Alberto Niño F. Human Resources Officer 2010Francisco Silva B. General Services Officer 2010Alba Marina Urrea G. Internal Audit Officer 2010Domingo Valdés P. General Counsel 1999
127

Table of Contents
Set forth below are brief biographical descriptions of our Executive Officers, all of whom reside in Chile:
Ignacio Antoñanzas A.was appointed CEO of Enersis in October 2006. He started his career as a commodities trader. He joined Endesa Spain in1994, having worked during his professional career mostly in generation and corporate strategy areas. He has been the CEO of Endesa Net Factory andDirector of Endesa Italia. Until assuming his current position, he served as Deputy General Manager of Strategy for Endesa Spain. Since June 2009, healso serves as Executive Vice President at Endesa Spain in charge of Latin America. Mr. Antoñanzas holds a degree in Mining Engineering with a major inenergy and fuels from the Universidad Politécnica de Madrid, Spain.
Massimo Tamboscobecame Deputy Chief Executive Officer in October 2010. Between 2000 and 2009, he held several positions in finance, planningand control, corporate control and M&A for different Enel Group companies and business units. Previously, he was CFO of Ferrero de México andAdministration Manager of Roca S.r.l in Italy. From March 2009 until his most recent appointment, he held the position of Deputy CFO of Endesa Spain. Mr. Tambosco holds a degree in business administration from the Università Commerciale Luigi Bocconi di Milano (Italy), and attended ExecutivePrograms in the Kellogg School of Management in Chicago and the Harvard Business School in Boston.
Ramiro Alfonsín B. became Planning and Control Officer in March 2007. Before joining the Endesa Group, Mr. Alfonsín worked as Senior FinancialAdvisor at Banco Urquijo KBL Group, as Management Advisor of the Corporate Development and Institutional Relations at Alcatel, and also as CorporateBanking Associate at ABN Amro Bank N.V. He joined the Endesa Spain Group in June 2000, working in Endesa Net Factory as Investment and RiskCapital Manager and later as Planning and Control Manager. Subsequently, he worked in Endesa Italia as a Planning and Investment Deputy Director andin Endesa Europa as Investment and Corporate Relations Deputy Director. Currently, Mr. Alfonsín is a board member of several of Enersis’ companies inArgentina, Brazil, Chile and Colombia. He holds a degree in Business Administration from the Pontificia Universidad Católica de Argentina.
Ángel Chocarro G. is the Enersis’ Accounting Officer since November 2009. Mr. Chocarro has held several positions in both Enersis and theEndesa Spain Group. From 2005 to 2009, he was Enersis’ Director of Consolidation, Internal Controls, and Accounting Criteria. Mr. Chocarro has adegree in Economics and Business Administration from Universidad del País Vasco (Spain).
Alfredo Ergas S. has been the CFO of Enersis since July 2003 after having held a similar position at Endesa Chile. Mr. Ergas joined Enersis inApril 1993. He served as Deputy Chief Financial Officer of Endesa Chile and later in Enersis as Planning and Control Director. Afterwards, Mr. Ergasserved as CFO and Chief Controlling Officer of the Chilean telecommunications company, Smartcom, from 2000 to 2002. Mr. Ergas is the Chairman ofInBest, a non−profit organization formed in November 2009 aimed at promoting the Chilean capital market’s strengths and advantages in financial servicesbefore the international financial community. Mr. Ergas also serves as Chairman of the Issuers’ Committee of the Chilean American Chamber ofCommerce, and Board Director of the Alumni Association of Commercial Engineers of Universidad de Chile. Mr. Ergas is a commercial engineer fromUniversidad de Chile, and has an M.B.A. degree from Trium Global Executive M.B.A., an alliance between New York University, Hautes ÉtudesCommerciales (France) and London School of Economics.
Juan Pablo Larraín M. joined Enersis in August 2006 as Chilectra’s Communications Officer. In October 2009, he was appointed Enersis’Communication Officer and Endesa Spain’s Communication Officer for Latin America and Chile. Before joining Enersis, he worked as Editor in Chief ofDiario Financiero; Communications’ Officer at Hill & Knowlton Chile, National Editor at El Mercurio (Valparaíso) and News Service Editor at Red TV. Mr. Larraín graduated from the School of Journalism at Finis Terrae University (Chile) and holds a Master’s Degree in Professional Journalism fromComplutense University (Spain).
Eduardo López M. was appointed Enersis’ Procurement Officer in June 2008. He joined the group in 1981, having held several positions in thefinancial department in Chilectra until 1992. Between 1992 and 1995, he worked at Edesur where he served as Sales Director. He was also CEO atDiprel S.A., a former Enersis subsidiary, between 1996 and 2001. In 2002, he was appointed as Enersis’ Procurement Director and from 2004 until 2008 heheld the same position at CAM. Mr. López is a commercial engineer from Pontificia Universidad Católica de Valparaíso (Chile).
Carlos Niño F. was appointed Enersis’ Human Resources Officer in December 2010. He joined the group in 1998, having held several positions asHuman Resources Officer at different companies, including Codensa and Emgesa in Colombia and Chilectra in Chile. He was also appointedEndesa Latinoamérica Personnel Management Director in 2009. Previously, he was Personnel Director of Legis S.A. and Human Resources Officer ofColmena Salud, a health insurance company. Mr. Niño is a lawyer from Universidad Externado de Colombia and holds a M.Sc. in Labor and SocialSecurity Law from the Pontificia Universidad Javeriana (Colombia).
Francisco Silva B.was appointed Enersis’ General Services Officer of Enersis in December 2010. Mr. Silva joined Chilectra in 1987 and has workedprimarily in human resources and general management positions in several subsidiaries and affiliates of Enersis
128

Table of Contents
since then. Between 1998 and 2000 and between July 2003 and December 2010 he was Enersis’ Human Resources Officer. From January 2001 toJune 2003, he worked as Adjunct Director of an Endesa Spain subsidiary in Spain. Mr. Silva holds a degree in public administration from Universidad deChile, and received a D.P.A. diploma from Universidad Adolfo Ibáñez (Chile), in 1986.
Alba Marina Urrea G. has been Internal Audit Officer since March 2010. She has been linked to the Group for twelve years and has been responsiblefor the audit of our subsidiaries in Colombia and Peru. She previously served as Audit Director in Cementos Samper, Accounting Director at CemexColombia and as Senior Auditor at Arthur Andersen Colombia. She is a public accountant from the Universidad Autónoma de Bucaramanga (Colombia),with a concentration in Finance from the Universidad del Rosario in Bogotá and a Certification as Internal Auditor from the Institute of Internal Auditors.
Domingo Valdés P. has been General Counsel since May 1999. He joined the Enersis Group as a corporate attorney at law for Chilectra in 1993 andbecame Legal Counsel at Enersis in December 1997. Mr. Valdés worked as an intern at the New York City law firms of Milbank, Tweed,Hadley & McCloy and Chadbourne & Parke LLP. Before joining Chilectra, Mr. Valdés was a lawyer at Chase Manhattan Bank, N.A., CorporateDepartment (Chile) and an associate at Carey & Cía., a Santiago based law firm. Mr. Valdés is also Secretary of the Enersis Board of Directors and aProfessor of Economic and Antitrust Law at Universidad de Chile Law School. Mr. Valdés has a law degree from Universidad de Chile and a Masters ofLaw Degree from the University of Chicago.
B. Compensation.
At the ordinary shareholders’ meeting held on April 26, 2011, our shareholders approved the current compensation policy for the Board of Directors. Directors are paid a variable annual fee, depending on net earnings of the Company, in a relation one per one thousand, and a monthly fee paid in advance,depending on their attendance to the board meetings and their participation as Director of any of our subsidiaries. These advances consist of a fixedcompensation of UF 101 per month and a fee of UF 66 for attending meetings of the Board. The Chairman of the Board (in this case Mr. Yrarrázaval) isentitled to double the compensation for a regular Director under this policy. In 2011, the total compensation paid to each of our directors, including fees forattendance at meetings of the Directors’ Committee, was as follows:
DirectorVariable
CompensationFixed
CompensationDirectors
Committee TotalYear ended December 31, 2011 (in thousands of Ch$)
Pablo Yrarrázaval V. 30,766 49,296 — 80,062Andrea Brentan (1) — — — —Rafael Fernández M. 15,383 24,648 13,410 53,441Rafael Miranda R. 14,608 24,648 — 39,256Hernán Somerville S. 15,383 24,648 13,410 53,441Eugenio Tironi B. 15,383 24,648 — 40,031Leonidas Vial E. 15,383 24,648 13,018 53,049Total. 106,906 172,537 39,839 319,282
(1) Mr. Brentan waived his compensation as Board Director.
We do not disclose, to our shareholders or otherwise, information on individual Executive Officer’s compensations. For the year ended December 31,2011, the aggregate gross compensation paid or accrued, attributable to fiscal year 2011, including performance—based bonuses for the Executive Officersof Enersis, was Ch$ 2,660 million. Enersis’ Executive Officers are eligible for variable compensation under a bonus plan for meeting company—wideobjectives and for their individual contribution to the Company’s results and objectives. The annual bonus plan provides for a range of bonus amountsaccording to seniority level. The bonuses eventually paid to executives consist of a certain number of gross monthly salaries.
The amount accrued by the Company in 2011 to provide for pensions, retirement or similar benefits to our Executive Officers totaled Ch$ 231million. The funds accrued to provide severance indemnity to our Executive Officers amounted to Ch$ 555 million, of which Ch$ 73 was accrued during2011. There are no other amounts set aside or accrued to provide for pension, retirement or similar benefits for our Executive Officers.
All of our Executive Officers have severance indemnity agreements with the Company in the event of voluntary resignation, mutual agreement amongthe parties, or death. They do not have a right to severance indemnity if their relationship with the Company is terminated due to willful misconduct,prohibited negotiations, unjustified absences, abandonment of duties, among other causes, as defined in article 160 of the Chilean Code of Labor. All of theCompany’s employees are entitled to legal severance pay if dismissed due to the needs of the Company, as defined in article 161 of the Chilean Labor Code.
129

Table of Contents
C. Board Practices.
The Board of Directors as of December 31, 2011 was elected at the OSM of April 22, 2010, and the term for this Board of Directors will expire inApril 2013. For information as to the years in which each director began his service at the board, please see “Item 6. Directors, Senior Management andEmployees — A. Directors and Senior Management” above. The members of the Board of Directors do not have service contracts with Enersis or any of itssubsidiaries that provide benefits upon termination of employment.
Corporate Governance
Enersis is managed by its Board of Directors which, in accordance with its bylaws, consists of seven directors who are elected at an OSM. Eachdirector serves for a three−year term and the term of each of the seven directors expires on the same day. The directors can be reelected indefinitely. Staggered terms are not permitted under Chilean law. If a vacancy occurs on the board during the three—year term, the Board of Directors may appoint atemporary director to fill the vacancy. Any vacancy triggers an election for every seat on the Board of Directors at the next OSM.
Chilean corporate law provides that a company’s board of directors is responsible for the management, administration and representation of a companyin all matters concerning its corporate purpose, subject to the provisions of the company’s bylaws and the stockholders’ resolutions. In addition to thebylaws, the Enersis Board of Directors has adopted regulations and policies that guide our corporate governance principles.
The Charter Governing Executives, approved by our Board on May 28, 2003, and the Employee Code of Conduct, explain our principles and ethicalvalues, establish the rules governing our contact with customers and suppliers, and establish the principles that should be followed by employees, includingethical conduct, professionalism and confidentiality. They also impose limitations on the activities that our executives and other employees may undertakeoutside the scope of their employment with us.
In order to ensure compliance with Securities Market Law 18,045 and SVS regulations, our Board of Directors at its meeting held on May 28, 2008,approved the “Manual for the Management of Information of Interest to the Market,” (“Manual”). This document addresses applicable standards regardingthe information of transactions of the Company’s securities or those of its affiliates by directors, management, principal executives, employees and otherrelated parties; existence of blackout periods for such transactions by directors, principal executives and other related parties; existence of mechanisms forthe continuous disclosure of information that is of interest to the market; and mechanisms that provide protection for confidential information. The Manualwas released to the market on May 30, 2008 and posted on the Company’s website at www.enersis.cl. In February 2010, the Manual was modified in orderto comply with the provisions of Law 20,382 (Corporate Governance Improvement Law).
The provisions of this Manual shall be applied to the members of our Board, as well as Enersis executives and employees who have access toprivileged information, and especially those who work in areas related to the securities markets.
In order to supplement the aforementioned corporate governance regulations, the Company’s Board, at its meeting held on June 24, 2010 approved aCode of Ethics and a Zero Tolerance Anti−Corruption Plan (“ZTAC Plan”). The Code of Ethics is structured on the basis of general principles such asimpartiality, honesty, integrity and others of similar importance, which are implied in the behavior criteria detailed in the document. The ZTAC Planreinforces the principles included in the Code of Ethics, but with special emphasis on avoiding corruption in the form of bribes, preferential treatment andother similar matters.
At its meeting of March 29, 2011 Enersis’ Board approved the Prevention Model required by Law 20,393 of December 2, 2009, which imposescriminal responsibility on legal entities for the crimes of asset laundering, financing of terrorism and bribing of Chilean or foreign public officials. The lawencourages companies to adopt this model, whose implementation involves compliance with duties of direction and supervision. The adoption of this modeltherefore reduces, and in some cases relieves, the effects of criminal responsibility even when a crime is committed. One of the elements of this model is thePrevention Officer which was appointed by the Board at its meeting held on October 27, 2010. As of December 31, 2011, our Prevention Officer was AlbaMarina Urrea, Internal Audit Officer.
On October 27, 2010, the Board approved “GUIDELINES 231 Guidelines applicable to non−Italian subsidiaries in accordance with LegislativeDecree 231 of June 8, 2001. Application to Endesa and its Group.” Given that Enersis’ ultimate parent company, Enel S.p.A. has to comply withLegislative Decree 231, which establishes management responsibility for Italian companies as a consequence of certain crimes committed in Italy or abroad,in the name of or for the benefit of such entities, including those crimes described in Chilean Law 20,393, this document, approved by the Board, sets agroup of measures, with standards of behavior expected from all employees, advisers, auditors, officials, directors as well as consultants, contractors,commercial partners, agents and suppliers. Decree 231 includes various activities of a preventive nature that are coherent with and integral to therequirements and
130

Table of Contents
compliance with Chilean Law 20,393, which deals with the criminal responsibility of legal entities. All of the above is supplementary to the behavioralregulations included in the Code of Ethics and ZTAC Plan.
Compliance with NYSE Listing Standards on Corporate Governance
The following is a summary of the significant differences between our corporate governance practices and those applicable to domestic issuers underthe corporate governance rules of the New York Stock Exchange (“NYSE”).
Independence and Functions of the Audit Committee
Under the NYSE corporate governance rules, all members of the Audit Committee must be independent. We have been subject to this requirementsince July 31, 2005. On April 22, 2010, at an ESM, the Company’s bylaws were amended and the Audit Committee was merged with the Directors’Committee. According to the Company’s bylaws all of the members of this Committee must satisfy the requirements of independence as stipulated by theNYSE. Also, Chilean Law requires that the majority of the Directors’ Committee (at least two out of three members) be independent directors. Accordingto Chilean Law, a member would not be considered independent if, at any time, within the last 18 months he or she: (i) maintained any relationship of arelevant nature and amount with the company, with other companies of the same group, with its controlling shareholder or with the principal officers of anyof them or has been a director, manager, administrator or officer of any of them; (ii) maintained a family relationship with any of the members described in(i) above; (iii) has been a director, manager, administrator or principal officer of a non−profit organization that has received contributions from (i) above;(iv) has been a partner or a shareholder that has controlled, directly or indirectly, 10% or more of the capital stock or has been a director, manager,administrator or principal officer of an entity that has provided consulting or legal services for a relevant consideration or external audit services to thepersons listed in (i) above; and (v) has been a partner or a shareholder that has controlled, directly or indirectly, 10% or more of the capital stock or has beena director, manager, administrator or principal officer of the principal competitors, suppliers or clients. In case there are not sufficient independent directorson the Board to serve on the committee, Chilean Law determines that the independent director nominates the rest of the members of the Committee amongthe rest of the Board members that do not meet the Chilean law independence requirements. Chilean Law also requires that all publicly held limited liabilitystock companies that have a market capitalization of at least UF 1,500,000 (approximately $ 64 million as of December 31, 2011) and at least 12.5% of itsvoting shares are held by shareholders that individually control or own less than 10% of such shares, must have at least one independent director and aDirectors’ Committee.
Under the NYSE corporate governance rules, the Audit Committee of a U.S. company must perform the functions detailed in, and otherwise complywith the requirements of NYSE Listed Company Manual Rules 303A.06 and 303A.07. Non−U.S. companies have been required to comply withRule 303A.06 beginning July 31, 2005 but are not required to comply with Rule 303A.07. Since July 31, 2005, we have complied with the independenceand the functional requirements of Rule 303A.06. As required by the Sarbanes−Oxley Act (“SOX”) and the NYSE corporate governance rules, on June 29,2005, Enersis’ Board of Directors created an Audit Committee, composed of three directors who were also members of the Board. As previouslymentioned, this Audit Committee was merged into the Directors’ Committee in April 2010. As required by the Company’s bylaws, the members ofDirectors’ Committee, composed of three members of the Board, should comply with Chilean law, as well as with the criteria and requirements ofindependence prescribed by SOX, the SEC and the NYSE. As of December 31, 2011, our Directors’ Committee was composed of three independentdirectors, all of whom met both the independence criteria of Chilean law and NYSE.
Our Directors’ Committee performs the following functions:
• review of Financial Statements and the Reports of the External Auditors prior to their submission to shareholders’ approval;
• formulation of the proposal to the Board of Directors for the selection of external auditors and private rating agencies;
• review of information related to operations by the Company with related parties and/or related to operations in which the Company’s Board members orrelevant Executive Officers, their spouses or relatives, and/or legal entities in which Board members or relevant executive officers have worked in the last18 months, either directly or indirectly;
• examination of the compensation framework and plans for managers, executive officers and employees;
• preparation of an Annual Management Report, including its main recommendations to shareholders;
• information to the Board of Directors about the convenience of recruiting external auditors to provide non−auditing services, when such services are notprohibited by law, depending on whether such services might affect the external auditors’ independence;
131

Table of Contents
• oversight of the work of external auditors;
• review and approval of the annual auditing plan by the external auditors;
• evaluation of qualifications, independence and quality of the auditing services;
• elaboration of policies regarding employment of former members of the external auditing firm;
• review and discussion of problems or disagreements between management and external auditors regarding the auditing process;
• establishment of procedures for receiving and dealing with complaints regarding accounting, internal control and auditing matters;
• any other function mandated to the committee by the bylaws, the Board of Directors or the shareholders of the Company.
As of December 31, 2011, Messrs. Leonidas Vial, Rafael Fernández and Hernán Somerville (Chairman) were members of this committee, all of whomsatisfied the independence requirements of the NYSE.
Corporate Governance Guidelines
The NYSE’s corporate governance rules require U.S.−listed companies to adopt and disclose corporate governance guidelines. Although Chilean lawdoes not provide for this practice (except for the Manual), the Company has adopted the codes of conduct described above, and at its ESM held inMarch 2006, approved the inclusion of articles in its bylaws that govern the creation, composition, attributions, functions and compensation of theDirectors’ Committee and the Audit Committee.
In order to comply with the new requirements of Law 20,382, which amended the Chilean Companies Act, at the ESM of April 22, 2010, theshareholders of the Company approved amendments to the Company’s bylaws, including amendments providing for the merger of the Directors’ and AuditCommittees. The Directors’ Committee is currently composed of three members that comply with the SOX independence requirements and the NYSEcorporate governance rules. The members of this merged Committee are Messrs. Hernán Somerville S., Leonidas Vial E. and Rafael Fernández M. TheCommittee includes among its functions the duties previously performed by the Audit Committee.
132

Table of Contents
D. Employees.
The following table provides the total number of full time employees at the Company and its subsidiaries for the past three fiscal years:
Company 2009 2010 2011In ArgentinaEndesa Costanera 281 354 366El Chocón 51 50 49Edesur 2,606 2,611 2,831Other businesses (1) 151 100 —Total full time personnel in Argentina 3,089 3,115 3,246
In BrazilCachoeira Dourada 66 65 69Endesa Fortaleza 69 63 72CIEN (2) 63 64 60Ampla (3) 1,233 1,224 1,208Coelce 1,201 1,290 1,308Endesa Brasil 41 40 47Other businesses (1) 233 170 —Total full time personnel in Brazil 2,906 2,916 2,764
In ChileEndesa Chile 595 599 1,003Pehuenche 3 3 3Celta 1 1 1Ingendesa (4) 417 400 3Túnel El Melón 16 16 16GasAtacama (5) 96 94 94HidroAysén (5) 29 24 35Consorcio Ara—Ingendesa (5) 15 14 —Enersis 301 303 317Chilectra (6) 731 719 712ICT Servicios Informáticos — 100 106Other businesses (7) 851 654 35Total full time personnel in Chile 3,055 2,927 2,325
In ColombiaEmgesa 415 430 441Codensa 896 966 981EEC (5) 119 115 116Other businesses(1) 208 133 —Total full time personnel in Colombia 1,638 1,644 1,538
In PeruEdegel 224 228 230Edelnor 577 525 503Other businesses(1) 134 115 —Total full time personnel in Peru 935 868 733
Total full time personnel of Enersis and Subsidiaries 11,623 11,470 10,606
(1) Includes CAM and Synapsis. During 2011, CAM and Synapsis were sold.(2) Includes employees of TESA and CTM who work in Argentina.(3) Includes En—Brasil Comercio e Serviços S.A.(4) Includes employees of Ingendesa Brasil who work in Brazil. During 2011 Ingendesa employees were transferred to Endesa Chile.(5) Jointly controlled companies; includes personnel on a proportional basis.(6) Includes Luz Andes S.A. and Empresa Eléctrica de Colina S.A.(7) Includes CAM, Synapsis and IMV. During 2011, CAM and Synapsis were sold.
133

Table of Contents
The following table provides the total temporary employees at the Company and its subsidiaries for the past three fiscal years:
Company 2009 2010 2011 Average 2011In ArgentinaEndesa Costanera — 22 55 39.9El Chocón — — 3 3.0Edesur 22 16 18 17.2Other businesses (1) 1 1 0 0.2Total temporary personnel in Argentina 23 39 76 60.3
In BrazilCachoeira Dourada — — — —Endesa Fortaleza 1 — — —CIEN (2) 1 1 1 1.0Ampla (3) 2 — — —Coelce 97 18 1 2.2Endesa Brasil — — — —Other businesses (1) 17 11 — 1.7Total temporary personnel in Brazil 118 30 2 4.9
In ChileEndesa Chile 3 4 74 38.3Pehuenche — — — —Celta — — — —Ingendesa (4) 170 103 — 61.7Túnel El Melón — — — —GasAtacama (5) — — — —HidroAysén (5) — — — —Consorcio Ara—Ingendesa (5) — — — 5.6Enersis — 6 1 2.9Chilectra (6) — — — —ICT Servicios Informáticos — — — —Other businesses (7) 5 14 — 9.9Total temporary personnel in Chile 178 127 75 118.4
In ColombiaEmgesa — 14 57 37.3Codensa 2 2 4 4.7EEC (5) — — — —Other businesses(1) 276 311 — 49.3Total temporary personnel in Colombia 278 327 61 91.3
In PeruEdegel 15 16 17 13.9Edelnor 18 28 47 39.2Other businesses(1) 217 227 — 35.1Total temporary personnel in Peru 250 271 64 88.2
Total temporary personnel of Enersis and Subsidiaries 847 794 278 363.1
(1) Includes CAM and Synapsis. During 2011, CAM and Synapsis were sold.(2) Includes TESA and CTM.(3) Includes En—Brasil Comercio e Serviços S.A.(4) Includes employees of Ingendesa Brasil who work in Brazil. During 2011 Ingendesa employees were transferred to Endesa Chile.(5) Jointly controlled companies; includes personnel on a proportional basis.(6) Includes Luz Andes S.A. and Empresa Eléctrica de Colina S.A.(7) Includes CAM, Synapsis and IMV. During 2011, CAM and Synapsis were sold.
134

Table of Contents
Chile
All Chilean employees who are dismissed for reasons other than misconduct are entitled by law to a severance payment. According to Chilean law,permanent employees are entitled to a basic payment of one−month’s salary for each year (or a six−month portion thereof) worked, subject to a limit of atotal payment of no more than 11 months’ pay for employees hired after August 14, 1981. Severance payments to employees hired prior to that date consistof one−month’s salary for each full year worked, not subject to any limitation on the total amount payable. The Company voluntarily makes severancepayments above the limits established by Chilean law. In addition, under Endesa Chile’s collective bargaining agreements, Endesa Chile is obligated tomake severance payments to all covered employees in cases of voluntary resignation or death in specified amounts that increase according to seniority.
Enersis has two collective agreements, both signed during 2011, which will be in force until July and December 2015. Chilectra has five collectiveagreements, all of them signed in December 2008, which expire in December 2012. Empresa Eléctrica de Colina has one collective agreement, signed in2011, which expires in October 2015. ICT has one agreement, signed in 2011, which expires in December 2015. Endesa Chile has collective agreementswith nine different unions, five of them signed during 2011, which expire between 2012 and 2015. Three of these nine contracts were carried over fromIngendesa.
Argentina
Edesur has two collective agreements signed in April 2011, which expire in March 2014. El Chocón has two collective agreements, one signed during2011, which expire in December 2016, and another which is still pending. Endesa Costanera has two collective agreements, which are still pending.
Brazil
Ampla has three bargaining agreements, signed during 2011, which will expire between September 2012 and September 2013. Coelce has oneagreement, signed in 2010 which will expire in October 2012. CIEN has two agreements, signed in 2011, which expire in September 2012 and April 2013. Cachoeira Dourada has two agreements which expire in September 2012, and one of them was signed during 2011. Endesa Fortaleza has two agreements,both signed in 2011, which expire in September 2012 and April 2013. Under Brazilian law, collective bargaining agreements cannot last for more than twoyears.
Colombia
Codensa and Emgesa, each have one collective agreement, both signed during 2011which will be in force until December 2014. EEC’s collectiveagreement is still pending.
Peru
Edelnor has four collective agreements which were signed in 2009 and expire in December 2012. Edegel has one agreement, signed in 2009, whichexpires in 2013.
Management believes Enersis’ relationship with trade unions is positive.
E. Share Ownership.
To the best of the Company’s knowledge, none of Enersis’ directors or officers own more than 0.1% of the shares of the Company. None of Enersis’directors and officers has any stock options. It is not possible to confirm whether any of our directors or officers has a beneficial, rather than direct, interestin the shares of Enersis. To the best of our knowledge, any share ownership by all of the directors and officers of Enersis, in the aggregate, amount tosignificantly less than 10% of our outstanding shares.
Item 7. Major Shareholders and Related Party Transactions
A. Major Shareholders.
Enersis has only one class of capital stock and Endesa Spain, our controlling shareholder, has no different voting rights than Enersis’ othershareholders. As of February 29, 2012, our 32,651,166,465 shares of common stock outstanding were held by 7,455 stockholders of record. There wereseven record holders in the United States of America as of such date.
135

Table of Contents
It is not practicable for us to determine the number of ADS or common shares beneficially owned in the United States, as we are not able to ascertainthe domicile of the final beneficial holders represented by the seven official ADR record holders in the United States of America. Likewise, we cannotreadily determine the domicile of any of our foreign stockholders who hold our common stock, either directly or indirectly.
As of February 29, 2012, Endesa Spain beneficially owned 60.6% of the shares of Enersis. Chilean private pension funds, “Administradoras deFondos de Pensiones,” or AFPs, owned 13.0% in the aggregate. Chilean stockbrokers, mutual funds, insurance companies, foreign equity funds, and otherChilean institutional investors collectively held 10.9 % of our equity. ADR holders owned 12.2% of the equity. The remaining 3.3% was held by 7,262minority shareholders.
The following table sets forth certain information concerning ownership of the common stock as of February 29, 2012 with respect to each stockholderknown to us to own more than 5% of the outstanding shares of common stock:
Number ofShares Owned
Percentageof
SharesOutstanding
Endesa Spain (1) 19,794,583,473 60.6%
(1) Endesa Spain’s 60.6% interest is held through Endesa Latinoamérica.
Since June 25, 2009, Enel has been the ultimate controlling shareholder of Enersis by virtue of its 92.1% shareholding in Endesa Spain. Enel is apublicly−traded company headquartered in Italy, primarily engaged in the energy sector, with presence in 40 countries worldwide, and has over 97,000 MWof net installed capacity. It provides service to more than 61 million clients through its electricity and gas businesses.
B. Related Party Transactions.
Article 146 of Law 18,046 ( the “Chilean Companies Act”) defines related—party transactions as all operations involving the company and anyentity belonging to the corporate group, its parent companies, controlling companies, subsidiaries or related companies, board members, managers,administrators, senior officers or company liquidators, including their spouses, some of their relatives and all entities controlled by them, in addition toindividuals who may appoint at least one member of the company’s directors or who control 10% or more of voting capital, or companies in which a boardmember, manager, administrator, senior officer or company liquidator have been serving in the same position within the last 18 months. The law establishesthat in the event that these persons fulfill the requirements established by Article 146, such persons must immediately inform the Board of Directors of theirrelated—party nature or such other group as the Board may appoint for that purpose. As required by law, “related—party transactions” must comply withcorporate interests, as well as prices, terms and conditions prevailing in the market at the time of their approval. They must also meet all legal requirements,including board acknowledgement and approval of the transaction (excluding the affected directors), approval by the ESM (in some cases, with requisitemajority approval) and be approved pursuant to regulatory procedures.
The aforementioned law, which also applies to Enersis’ affiliates, also provides for some exceptions, stating that in certain cases, Board approvalwould suffice for “related—party transactions”, pursuant to certain related—party transaction thresholds and when such transactions are conducted incompliance with the related—party policies defined by the company’s board. At its meetings held on December 17, 2009 and April 23, 2010, Enersis’Board of Directors approved a related—party policy (política de habitualidad) effective as of January 1, 2010. This policy is available on the company’swebsite.
If an operation is not in compliance with Article 146, this would not affect the operation’s validity, but the company or shareholders may demandcompensation from the individual associated with the infringement as provided under law, and to reparation for damages. It is our policy that all cashinflows and outflows of our Chilean subsidiaries be managed through our centralized cash management policy. It is a common practice in Chile to transfersurplus funds from one company to another affiliate that has a cash deficit. These operations are carried out through either short—term loans or throughstructured inter—company loans. Under Chilean laws and regulations, such transactions must be carried out on an arm’s—length basis. Our centralizedcash management is more efficient for both financial and tax reasons. All of these operations are subject to the supervision of our Directors’ Committee. As of December 2011, these operations were priced at TIP (a Chilean variable interest rate) + 0.05% per month.
In other countries in which we do business, these inter—company transactions are permitted, but they have adverse tax consequences. Accordingly,we do not similarly manage the cash flows of our non−Chilean subsidiaries.
Our subsidiary, Endesa Chile, has made structured loans to its related parties in Chile, primarily to finance projects. As of December 31, 2011, theoutstanding net balance for such loans was $ 38.5 million, at an interest rate of 7.5%. The largest amounts
136

Table of Contents
outstanding during 2011 and 2010 were $ 75 million and $ 256 million respectively. For the two−year period ending December 31, 2011, Endesa Chile hasgranted only one loan to a foreign subsidiary, Endesa Costanera, at a spread of 5.5% over LIBOR. The outstanding balance of this loan was $ 7.1 million asof December 31, 2011. The largest amount outstanding during 2011 and 2010 for such loan was also $ 7.1 million.
As of the date of this Report, the above—mentioned transactions have not experienced material changes. For more information regarding transactionswith related parties, refer to Note 8 of our Consolidated Financial Statements.
C. Interests of Experts and Counsel.
Not applicable.
Item 8. Financial Information
Consolidated Statements and Other Financial Information.
See “Item 18. Financial Statements” for our Consolidated Financial Statements.
Legal Proceedings
We and our subsidiaries are parties to legal proceedings arising in the ordinary course of business. Management considers that it is unlikely that anyloss associated with pending lawsuits will significantly affect the normal development of our business.
For detailed information as of December 31, 2011 on the status of the material pending lawsuits that have been filed against the Company or itssubsidiaries, please refer to Note 22.2 of our Consolidated Financial Statements. Since 2009, in relation to the legal proceedings reported in the Notes to theConsolidated Financial Statements, the Company decided to use the criteria of disclosing lawsuits above a minimum threshold of $ 20 million of potentialimpact to Enersis, and, in some cases, qualitative criteria according to the materiality of the impact in the conduct of our business. The lawsuits statusincludes a general description, the process status and the estimate of the amount involved in each lawsuit.
Dividend Policy
The Board generally establishes a definitive dividend payable each year, and attributable to the prior year, which cannot be less than the legalminimum of 30% of annual net income before negative goodwill amortization. As agreed at a meeting held on February 29, 2012, the Board of Directorswill propose to the OSM that is expected to be held on April 26, 2012, the payment of a definitive dividend of Ch$ 5.7497 per share for fiscal year 2011,equivalent to a payout ratio of 50% (based on annual net income before negative goodwill amortization). The provisional dividend of Ch $ 1.4656 per sharepaid in January 2012 was deducted from the definitive dividend to be paid on May 10, 2012, as agreed by the OSM.
The Board of Directors also approved a dividend policy for fiscal year 2012, according to which a provisional dividend will be paid to stockholdersequal to 15% of the net income accumulated through September 30, 2012. The Board of Directors will propose a definitive dividend payout equal to 50%of the annual net income for fiscal year 2012. Actual dividend payments will be subject to net profits obtained in each period, as well as to expectations offuture profit levels and other conditions that may exist at the time of such dividend declaration. The fulfillment of the aforementioned dividend policy willdepend on actual 2012 net income. The proposed dividend policy is subject to the Board of Director’s prerogative to change the amount and timing of thedividend under the circumstances at the time of the payment.
Currently, there are no restrictions on the ability of Enersis or any of its subsidiaries to pay dividends, other than certain legal restriction of limiting theamount of dividend distributions and in the event of specific circumstances under certain credit agreements, such as: Endesa Costanera, El Chocón, CIENand Endesa Fortaleza may not pay dividends unless they comply with certain financial covenants. In general terms, companies may not pay dividends incase of default on credit agreements. (See “Item 5. Operating and Financial Review and Prospects — B. Liquidity and capital resources” for further detailon Enersis debt instruments).
Stockholders set dividend policies at each subsidiary and affiliate. There are currently no material currency controls which prohibit Enersis fromrepatriating the dividend payments from its non−Chilean principal subsidiaries and affiliates.
The Company pays dividends to shareholders with a record date of five business days before the payment date. Holders of ADS on the applicablerecord dates will be entitled to participate in all future dividends.
137

Table of Contents
Dividends
The table below sets forth, for each of the years indicated, the per share amounts of dividends distributed by the Company and the amount of dividendsdistributed per 50 common shares (one ADS represents 50 common shares) in dollars. See “Item 10. Additional Information — D. Exchange Controls.”
YearNominalCh$(1)
$ perADS (2)
2007 5.42 0.432008 4.95 0.392009 7.02 0.692010 4.64 0.502011 7.45 0.72
(1) This chart details dividends paid in a given year, and not the dividends accrued on that year. These dividends may have been accrued the prior year or thesame year in which they were paid. These amounts do not reflect reduction for any applicable Chilean withholding tax.
(2) The dollar per ADS amount has been calculated by applying the Observed Exchange Rate as of December 31 of each year, to the peso amount. One ADSrepresents 50 common shares.
For a discussion of Chilean withholding taxes and access to the formal currency market in Chile in connection with the payment of dividends and salesof ADS and the underlying Common Stock, see “Item 10. Additional Information — E. Taxation” and “Item 10. Additional Information — D. ExchangeControls.”
B. Significant Changes.
None.
138

Table of Contents
Item 9. The Offer and Listing
A. Offer and Listing Details.
Market Price and Volume Information
The shares of our common stock currently trade on Chilean, United States and Spanish exchanges. Transactions in Chile take place on threeexchanges: the Santiago Stock Exchange, the Electronic Stock Exchange and the Valparaíso Stock Exchange. During 2011, volume traded on the SantiagoStock Exchange amounted to 4,341,597,832 shares.
Shares of our common stock have traded in the United States on the New York Stock Exchange (NYSE) since October 1993 in the form of ADS,under the ticker symbol “ENI.” Each ADS represents 50 shares of common stock, with the ADS in turn evidenced by American Depositary Receipts(ADRs). The ADRs are outstanding under the Second Amended and Restated Deposit Agreement dated as of September 30, 2010 among us, Citibank, N.A.as Depositary Bank, and the holders from time to time of ADRs issued thereunder. Only persons in whose names ADRs are registered on the books of theDepositary are treated by the Depositary as owners of ADRs.
As of February 29, 2012, ADRs evidencing 78,716,604 ADS (equivalent to 3,985,830,200 common shares) were outstanding, representing 12.6% ofthe total number of outstanding shares. It is not practicable for the Company to determine the proportion of ADS beneficially owned by U.S. finalbeneficial holders. The ADS closed at $ 17.63 on the last trading day on the NYSE in 2011.
The table below shows, for the periods indicated, high and low closing prices in pesos on the Santiago Stock Exchange and high and low closing pricesof the ADS in dollars as reported by the NYSE.
Santiago StockExchange (1) NYSE (2)
Chilean Pesos per share $ per ADSHigh Low High Low
2012 195.90 171.50 20 4/9 17 3/7February 195.90 175.50 20 4/9 18 2/9January 184.01 171.50 18 1/3 17 3/7
2011 221.10 169.00 23 1/2 15 4/5December 188.90 176.00 18 2/7 16 3/4November 200.00 173.00 20 2/9 16 4/7October 200.00 169.00 20 1/3 15 4/5September 187.01 170.60 20 3/7 16 1/24th Quarter 200.00 169.00 20 1/3 15 4/53rd Quarter 217.50 170.01 23 1/2 16 1/22nd Quarter 219.30 192.00 23 1/3 20 1/31st Quarter 221.10 180.00 23 2/5 18 7/8
2010 245.00 195.00 25 3/8 17 7/94th Quarter 244.00 213.02 25 3/8 22 4/93rd Quarter 239.11 212.00 24 1/7 19 5/82nd Quarter 223.00 195.00 21 17 7/91st Quarter 245.00 207.99 23 7/8 19 1/3
2009 231.50 162.50 23 12 3/4
2008 194.80 110.00 20 1/4 10 1/8
2007 215.00 157.00 20 1/2 14 1/3
(1) Source: Santiago Stock Exchange.(2) Source: NYSE. One ADS = 50 shares of common stock.
B. Plan of Distribution.
Not applicable.
139

Table of Contents
C. Markets.
In Chile, the Company’s stock is traded on three stock exchanges. The largest exchange in the country, the Santiago Stock Exchange, was establishedin 1893 as a private company. Its equity consists of 48 shares held by 45 stockholders as of the date of this Report. As of December 31, 2011, 229companies had shares listed on the Santiago Stock Exchange. For the year ended 2011, the Santiago Stock Exchange accounted for 85.6% of Enersis’ totalequity traded in Chile. In addition, approximately 14.0% of Enersis’ equity trading was conducted on the Electronic Exchange, an electronic trading marketthat was created by banks and non−member brokerage houses, and 0.4% was traded on the Valparaíso Exchange.
Equities, closed−end funds, fixed−income securities, short−term and money market securities, gold and dollars are traded on the Santiago StockExchange. The Santiago Stock Exchange also trades dollar futures and stock index futures. Securities are traded primarily through an open voice auctionsystem, a firm offers system or the daily auction. Trading through the open voice system occurs on each business day from 9:30 a.m. to 4:00 p.m., duringlocal standard time, and from 9:30 a.m. to 5:00 p.m. during daylight savings time, which differs from New York City time by up to two hours, depending onthe season. The Santiago Stock Exchange has an electronic trading system called Telepregón, which operates continuously from 9:30 a.m. to 4:00 p.m.during local standard time, and from 9:00 a.m. to 5:00 p.m. during daylight savings time, on each business day. During local standard time, electronicauctions may be conducted four times a day, at 10:30 a.m., 11:30 a.m., 1:30 p.m., and 3:30 p.m. During daylight savings time there is an additionalelectronic auction at 4:30 p.m. More than 99% of the auctions and transactions take place electronically.
There are two share price indexes on the Santiago Stock Exchange, the General Shares Price Index, or IGPA, and the Selected Shares Price Index, orIPSA. The IGPA is calculated using the prices of shares that are traded at least 5% of the trading days of a year, with a total annual transactions exceedingUF 10,000 ($ 0.43 million as of December 31, 2011) and a free float of at least 5%. The IPSA is calculated using the prices of the 40 shares with higheramounts traded, on a quarterly basis, with market capitalization above $ 200 million and a free float at least 5%. The shares included in the IPSA and IGPAare weighted according to the weighted value of the shares traded. Enersis has been included in the IPSA since the last quarter of 1988, while Endesa Chilehas been included since its privatization process in 1987.
Shares of Enersis were first listed and began trading on the Bolsa de Valores Latinoamericanos de la Bolsa de Madrid, or Latibex, as ofDecember 2001, under the ticker symbol “XENI”. Until April 2011, the trading unit represented 50 common shares (the same unit conversion of 50:1 as anADS), but since May 2011 the equivalence changed to a 1:1 ratio. Santander Investment S.A. acts as the liaison entity, and the Banco Santander−Chile asthe Depositary Bank in Chile. Trading of our shares on the Latibex during 2011 amounted to approximately 15.7 million units, which in turn wasequivalent to € 4.5 million. The stock closed at € 0.26 on the last 2011 trading day.
Of the total amount of equity volume traded during 2011, the percentage traded per market is as follows:
Percentage of equitytraded in %
Enersis Endesa ChileMarketUnited States (1) 58.8% 38.8%Chile (2) 41.0% 61.0%Spain (3) 0.1% 0.2%Total 100% 100%
(1) Includes NYSE and over−the−counter trading.(2) Includes Santiago Stock Exchange, Electronic Exchange and Valparaíso Exchange.(3) Latibex.
For further information see “Item 9. The Offer and Listing — A. Offer and Listing Details — Market Price and Volume Information”.
D. Selling Shareholders.
Not applicable.
E. Dilution.
Not applicable.
140

Table of Contents
F. Expense of the Issue.
Not applicable.
Item 10. Additional Information
A. Share Capital.
Not applicable.
B. Memorandum and Articles of Association.
Description of Share Capital
Set forth below is certain information concerning our share capital and a brief summary of certain significant provisions of our bylaws and Chileanlaw.
General
Shareholders’ rights in Chilean companies are governed by the company’s bylaws, which serve the same purpose as the articles or certificate ofincorporation and the bylaws of a company incorporated in the United States, and by Law 18,046 (the Chilean Companies Act). In addition, D.L. 3500, orthe Pension Funds’ System Law, which permits the investment by Chilean pension funds in stock of qualified companies, indirectly affects corporategovernance and prescribes certain rights of shareholders. In accordance with the Chilean Companies Act, legal actions by shareholders to enforce theirrights as shareholders of the company must be brought in Chile in arbitration proceedings or, at the option of the plaintiff, before Chilean courts. Membersof the board of directors, managers, officers and principal executives of the company, or shareholders that individually own shares with a book value orstock value higher that UF 5,000 ($ 214,696 as of December 31, 2011) do not have the option to bring the procedure to the courts.
The Chilean securities markets are principally regulated by the Superintendency of Securities and Insurance, or SVS, under Law 18,045 (the SecuritiesMarket Law) and the Chilean Companies Act. These two laws provide for disclosure requirements, restrictions on insider trading and price manipulation,and protection of minority shareholders. The Securities Market Law sets forth requirements for public offerings, stock exchanges and brokers, and outlinesdisclosure requirements for companies that issue publicly offered securities. The Chilean Companies Act and the Securities Market Law, both as amended,provide rules regarding takeovers, tender offers, transactions with related parties, qualified majorities, share repurchases, directors’ committee, independentdirectors, stock options and derivative actions.
Public Register
Enersis is a publicly held stock corporation incorporated under the laws of Chile. Enersis was constituted by public deed issued on June 19, 1981 bythe Santiago Notary Public, Mr. Patricio Zaldívar M. Its existence was approved by SVS Resolution 409−S of July 17, 1981 and it was registered onJuly 21, 1981 in the Commercial Registrar (Registro de Comercio del Conservador de Bienes Raíces y Comercio de Santiago), on pages 13099 No. 7269. Enersis is registered with the SVS and its entry number is 0175. Enersis is also registered with the United States Securities and Exchange Commission andits commission file number is 001−12440.
Reporting Requirements Regarding Acquisition or Sale of Shares
Under Article 12 of the Securities Market Law and General Rule 269 of the SVS, certain information regarding transactions in shares of a publiclyheld stock corporation or in contracts or securities whose price or results depend on or are conditioned in whole or in part on the price of such shares mustbe reported to the SVS and the Chilean stock exchanges. Since American Depositary Shares (ADS) are deemed to represent the shares of common stockunderlying the American Depositary Receipts (ADRs), transactions in ADRs will be subject to these reporting requirements and those established inCircular 1375 of the SVS. Shareholders of publicly held stock corporations are required to report to the SVS and the Chilean stock exchanges:
• any direct or indirect acquisition or sale of shares made by a holder who owns, directly or indirectly, at least 10% of a publicly held stock corporation’ssubscribed capital;
141

Table of Contents
• any direct or indirect acquisition or sale of contracts or securities whose price or results depend on or are conditioned in whole or in part on the price ofshares, made by a holder who owns, directly or indirectly, at least 10% of a publicly held stock corporation’s subscribed capital;
• any direct or indirect acquisition or sale of shares made by a holder who, due to an acquisition of shares of such publicly held stock company, results inthe holder acquiring, directly or indirectly, at least 10% of a publicly held stock company’s subscribed capital; and
• any direct or indirect acquisition or sale of shares in any amount, made by a director, receiver, principal executive, general manager or manager of apublicly held stock company.
In addition, majority shareholders of a publicly held stock corporation must inform the SVS and the Chilean stock exchanges if such transactions areentered into with the intention of acquiring control of the company or if they are making a passive financial investment instead.
Under Article 54 of the Securities Market Law and General Rule 104 enacted by the SVS, any person who directly or indirectly intends to take controlof a publicly held stock corporation must disclose this intent to the market at least ten business days in advance of the proposed change of control and, inany event, as soon as the negotiations for the change of control have taken place or reserved information of the publicly held stock corporation has beenprovided.
Corporate Objectives and Purposes
Article 4 of our bylaws states that our corporate objectives and purposes are, among other things, to conduct the exploration, development, operation,generation, distribution, transmission, transformation, or sale of energy in any form, directly or through other companies, as well as to provideengineering−consultancy services related to these objectives, in Chile and abroad and to participate in the telecommunications business.
Board of Directors
Our Board of Directors is comprised of seven members who are appointed by shareholders at the OSM of the Company and are elected for a period ofthree years, at the end of which they will be re−elected or replaced.
The seven directors elected at the OSM are the seven individual nominees who receive the highest majority of the votes. Each shareholder may votehis shares in favor of one nominee or may apportion his shares among any number of nominees. The effect of these voting provisions is to ensure that ashareholder owning more than 12.5% of our shares is able to elect a member of the Board.
The compensation of the directors is set annually at the OSM. See “Item 6. Directors, Senior Management and Employees — B. Compensation.”
Agreements entered into by Enersis with related parties can only be executed when such agreements serve the interest of the Company, and their price,terms and conditions are consistent with prevailing market conditions at the time of their approval and comply with all the requirements and proceduresindicated in Article 147 of the Chilean Companies Act.
Certain Powers of the Board of Directors
Our bylaws provide that every arrangement or contract that the Company enters into with its controlling shareholder, its directors or executives, orwith their related parties, must be previously approved by two thirds of the Board of Directors and be included in the Board meetings and must comply withthe provisions of the Chilean Companies Act.
Our bylaws do not contain provisions relating to:
• the directors’ power, in the absence of an independent quorum, to vote on compensation for themselves or any members of their body;
• borrowing powers exercisable by the directors and how such borrowing powers can be varied;
• retirement or non−retirement of directors under an age limit requirement; or
• number of shares, if any, required for directors’ qualification.
142

Table of Contents
Certain Provisions Regarding Shareholder Rights
As of the date of the filing of this Report, Enersis’ capital is comprised of only one class of shares, all of which are ordinary shares and have the samerights.
Our bylaws do not contain any provisions relating to:
• redemption provisions;
• sinking funds; or
• liability for capital calls by the Company.
Under Chilean law, the rights of holders of stock of the Company may only be changed by an amendment to the bylaws that comply with therequirements explained below under “Item 10. Additional Information — B. Memorandum and Articles of Association. — Shareholders’ Meetings andVoting Rights.”
Capitalization
Under Chilean law, only the shareholders of a company acting at an ESM have the power to authorize a capital increase. When an investor subscribesfor shares, these are officially issued and registered under his name, and the subscriber is treated as a shareholder for all purposes, except receipt ofdividends and for return of capital in the event that the shares have been subscribed but not paid for. The subscriber becomes eligible to receive dividendsonly for the shares that he has actually paid for or, if he has paid for only a portion of such shares, the pro rata portion of the dividends declared with respectto such shares unless the company’s bylaws provide otherwise. If a subscriber does not fully pay for shares for which he has subscribed on or prior to thedate agreed upon for payment, the company is entitled to auction the shares on the stock exchange where such shares are traded and has a cause of actionagainst the subscriber for the difference between the subscription price and the price actually received at auction, if any. However, until such shares are soldat auction, the subscriber continues to possess all the rights of a shareholder, except the right to receive dividends and return of capital. When there areauthorized and issued shares for which full payment has not been made within the period fixed by shareholders at the same ESM at which the subscriptionwas authorized (which in no case may exceed three years from the date of such meeting), the Board must proceed to collect payment, unless theshareholders’ meeting had authorized (by two thirds of the voting shares) to reduce the company’s capital to the amount effectively collected.
As of December 31, 2011, the subscribed and fully paid capital of the Company totaled Ch$ 2,825 billion and consisted of 32,651,166,465 shares.
Preemptive Rights and Increases of Share Capital
The Chilean Companies Act requires Chilean companies to grant shareholders preemptive rights to purchase a sufficient number of shares to maintaintheir existing ownership percentage of such company whenever such company issues new shares.
Under Chilean law, preemptive rights are exercisable or freely transferable by shareholders during a 30−day period following the day the capitalincrease is made public. During such 30−day period, and for an additional 30−day period immediately following the initial 30−day period, publicly heldstock corporations are not permitted to offer any unsubscribed shares to third parties on terms which are more favorable than those offered to theirshareholders. At the end of the second 30−day period, a Chilean publicly held stock corporation is authorized to sell non−subscribed shares to third partieson any terms, provided they are sold on one of the Chilean stock exchanges.
Shareholders’ Meetings and Voting Rights
An OSM must be held within the first four months following the end of our fiscal year. The last OSM was held on April 26, 2011. An ESM may becalled by the board of directors when deemed appropriate, when requested by shareholders representing at least 10% of the issued shares with voting rightsor by the SVS. To convene an OSM, or an ESM, notice must be given three times in a newspaper located in our corporate domicile. The newspaperdesignated by our shareholders is El Mercurio de Santiago. The first notice must be published not less than 15 days and no more than 20 days in advance ofthe scheduled meeting. Notice must also be mailed to each shareholder, to the SVS and to the Chilean stock exchanges.
Under Chilean law, a quorum for a shareholders’ meeting is established by the presence, in person or by proxy, of shareholders representing at least amajority of the issued shares with voting rights of a company. If a quorum is not present at the first meeting, a reconvened meeting can take place at whichthe shareholders present are deemed to constitute a quorum regardless of the percentage
143

Table of Contents
of the shares represented. The second meeting must take place within 45 days following the scheduled date for the first meeting. Shareholders’ meetingsadopt resolutions by the affirmative vote of a majority of those shares present or represented at the meeting. An ESM must be called to take the followingactions:
• a transformation of the company into a form other than a publicly held stock corporation under the Chilean Companies Act, a merger or split−up of thecompany;
• an amendment to the term of duration or early dissolution of the company;
• a change in the corporation’s domicile;
• a decrease of corporate capital;
• an approval of capital contributions in kind and non−monetary assessments;
• a modification of the authority reserved to shareholders or limitations on the board of directors;
• a reduction in the number of members of the board of directors;
• a disposition of 50% or more of the assets of the corporation, whether it includes disposition of liabilities or not, as well as the approval or theamendment of the business plan which contemplates the disposition of assets in an amount greater that such percentage;
• the disposition of 50% or more of the assets of a subsidiary, as long as such subsidiary represents at least 20% of the assets of the corporation, as well asany disposition of its shares that results in the parent company losing its position as controller;
• the form of distributing corporate benefits;
• issue of guarantees for third−party liabilities which exceed 50% of the assets, except when the third party is a subsidiary of the company, in which caseapproval of the board of directors is deemed sufficient;
• the purchase of the corporation’s own shares;
• others established by the bylaws or the laws;
• certain remedies for the nullification of the corporate bylaws;
• inclusion in the bylaws of the right to purchase shares from minority shareholders, when the controlling shareholders reaches 95% of the company’sshares by means of a tender offer for all of the company’s shares, where at least 15% of the shares have been acquired from unrelated shareholders;
• approval or ratification of acts or contracts with related parties.
Regardless of the quorum present, the vote required for any of the actions above is at least two−thirds of the outstanding shares with voting rights.
Bylaw amendments for the creation of a new class of shares, or an amendment to or an elimination of those classes of shares that already exist, must beapproved by at least two−thirds of the outstanding shares of the affected series.
Chilean law does not require a publicly held stock corporation to provide its shareholders the same level and type of information required by thesecurities laws regarding the solicitation of proxies. However, shareholders are entitled to examine the books of a publicly held stock corporation within the15−day period before its scheduled OSM. Under Chilean law, a notice of a shareholders meeting listing matters to be addressed at the meeting must bemailed at least 15 days prior to the date of such meeting, and, an indication of the way complete copies of the documents that support the matters submittedfor voting can be obtained, which must also be made available to shareholders on the Company’s website. In the case of an OSM, the annual report of theCompany’s activities, which includes audited financial statements, must also be made available to shareholders and published on the Company’s website at:www.enersis.cl.
144

Table of Contents
The Chilean Companies Act provides that, upon the request by the Directors’ Committee or by shareholders representing at least 10% of the issuedshares with voting rights, a Chilean company’s annual report must include, in addition to the materials provided by the board of directors to shareholders,such shareholders’ comments and proposals in relation to the company’s affairs. Similarly, the Chilean Companies Act provides that whenever the board ofdirectors of a publicly held stock corporation convenes an OSM and solicits proxies for the meeting, or circulates information supporting its decisions orother similar material, it is obligated to include the pertinent comments and proposals that may have been made by the Directors’ Committee or byshareholders owning 10% or more of the shares with voting rights who request that such comments and proposals be so included.
Only shareholders registered as such with Enersis at least five business days prior to the date of a meeting are entitled to attend and vote their shares. A shareholder may appoint another individual, who does not need to be a shareholder, as his proxy to attend the meeting and vote on his behalf. Proxies forsuch representation shall be given in writing for all the shares held by the owner. Every shareholder entitled to attend and vote at a shareholders’ meetingshall have one vote for every share subscribed.
There are no limitations imposed by Chilean law or the company’s bylaws on the right of nonresidents or foreigners to hold or vote shares of commonstock. However, the registered holder of the shares of common stock represented by ADSs, and evidenced by outstanding ADRs, is the custodian of theDepositary, currently Citibank N.A. (Chile), or any successor thereto. Accordingly, holders of ADRs are not entitled to receive notice of meetings ofshareholders directly or to vote the underlying shares of common stock represented by ADS and evidenced by the ADRs directly. The Deposit Agreementcontains provisions pursuant to which the Depositary has agreed to solicit instructions from registered holders of ADRs as to the exercise of the votingrights pertaining to the shares of common stock represented by the ADS and evidenced by such ADRs. Subject to compliance with the requirements of theDeposit Agreement and receipt of such instructions, the Depositary has agreed to endeavor, insofar as practicable and permitted under Chilean law and theprovisions of the bylaws, to vote or cause to be voted (or grant a discretionary proxy to the Chairman of the Board of Directors of the company or to aperson designated by the Chairman of the Board of Directors of the company to vote) the shares of common stock represented by the ADS evidenced bysuch ADRs in accordance with any such instruction. The Depositary shall not itself exercise any voting discretion over any shares of common stockunderlying ADS. If no voting instructions are received by the Depositary from a holder of ADRs with respect to the shares of common stock represented bythe ADS, and evidenced by such ADRs, on or before the date established by the Depositary for such purpose, the shares of common stock represented bythe ADS, may be voted in the manner directed by the Chairman of the Board of the company, subject to limitations set forth in the Deposit Agreement.
Dividends and Liquidation Rights
According to the Chilean Companies Act, unless otherwise decided by unanimous vote of its issued shares eligible to vote, all companies mustdistribute a cash dividend in an amount equal to at least 30% of their consolidated net income, before amortization and negative goodwill for each year(calculated according to the local accounting rules applicable to the Company when preparing financial statements to be submitted to the SVS), unless andexcept to the extent the Company has carried forward losses. The law provides that the board of directors must agree to the dividend policy and inform suchpolicy to the shareholders at the OSM.
Any dividend in excess of 30% of net income may be paid, at the election of the shareholder, in cash, in Enersis shares or in shares of publicly heldcorporations held by Enersis. Shareholders who do not expressly elect to receive a dividend other than in cash are legally presumed to have decided toreceive the dividend in cash.
Dividends which are declared but not paid within the appropriate time period set forth in the Chilean Companies Act (as to minimum dividends, 30days after declaration; as to additional dividends, the date set for payment at the time of declaration) are adjusted to reflect the change in the value of UF,from the date set for payment to the date such dividends are actually paid. Such dividends also accrue interest at the then prevailing rate forUF−denominated deposits during such period. The right to receive a dividend lapses if it is not claimed within five years from the date such dividend ispayable. Payments not collected in such period are transferred for the benefit of the Fire Department, formed by volunteers.
In the event of a liquidation of Enersis, the holders of shares would participate in the assets available in proportion to the number of paid−in sharesheld by them, after payment to all creditors.
Approval of Financial Statements
The Board of Directors is required to submit Enersis’ consolidated financial statements to the shareholders annually for their approval. If theshareholders by a vote of a majority of shares present (in person or by proxy) at the shareholders’ meeting reject the financial statements, the Board ofDirectors must submit new financial statements no later than 60 days from the date of such meeting. If the shareholders reject the new financial statements,the entire Board of Directors is deemed removed from office and a new board is elected at the same meeting. Directors who individually approved suchfinancial statements are disqualified for reelection for the following period. Our shareholders have never rejected the financial statements presented by theBoard of Directors.
145
Table of Contents
Change of Control
The Capital Markets Law establishes a comprehensive regulation related to tender offers. The law defines a tender offer as the offer to purchase sharesof companies which publicly offer their shares or securities convertibles into shares and which offer is made to shareholders to purchase their shares underconditions which allow the bidder to reach a certain percentage of ownership of the company within a fixed period of time. These provisions apply to bothvoluntary and hostile tender offers.
Acquisition of Shares
There are no provisions in our bylaws that discriminate against any existing or prospective holder of shares as a result of such shareholder owning asubstantial number of shares. However, no person may directly or indirectly own more than 65% of the outstanding shares of our stock. The foregoingrestriction does not apply to the depositary as record owner of shares represented by ADRs, but it does apply to each beneficial ADS holder. Additionally,our bylaws prohibit any shareholder from exercising voting power with respect to more than 65% of the common stock owned by such shareholder or onbehalf of others representing more than 65% of the outstanding issued shares with voting rights.
Right of Dissenting Shareholders to Tender Their Shares
The Chilean Companies Act provides that upon the adoption of any of the resolutions enumerated below at a meeting of shareholders, dissentingshareholders acquire the right to withdraw from the company and to compel the company to repurchase their shares, subject to the fulfillment of certainterms and conditions. In order to exercise such withdrawal rights, holders of ADRs must first withdraw the shares represented by their ADRs pursuant tothe terms of the deposit agreement.
“Dissenting” shareholders are defined as those who at a shareholders’ meeting vote against a resolution that results in the withdrawal right, or who ifabsent from such meeting, state in writing their opposition to the respective resolution, within the 30 days following the shareholders’ meeting. The pricepaid to a dissenting shareholder of a publicly held stock corporation whose shares are quoted and actively traded on one of the Chilean stock exchanges, isthe greater of (i) the weighted average of the sales prices for the shares as reported on the Chilean stock exchanges on which the shares are quoted for thetwo−month period preceding the shareholders’ meeting giving rise to the withdrawal right, and (ii) the market price resulting from the average price oftransactions on such day. If, because of the volume, frequency, number and diversity of the buyers and sellers, the SVS determines that the shares are notactively traded on a stock exchange, the price paid to the dissenting shareholder shall be the book value. Book value for this purpose shall equal paid capitalplus reserves and profits, less losses, divided by the total number of subscribed shares, whether entirely or partially paid. For the purpose of making thiscalculation, the last consolidated statements of financial position is used, as adjusted to reflect inflation up to the date of the shareholders’ meeting whichgave rise to the withdrawal right.
The resolutions that result in a shareholder’s right to withdraw include, among others, the following:
• the transformation of the company into an entity which is not a publicly held stock corporation governed by Chilean Companies Act;
• the merger of the company with another company;
• disposition of 50% or more of the assets of the corporation, whether it includes disposition of liabilities or not, as well as the approval or the amendmentof the business plan which contemplates the disposition of assets in an amount greater than such percentage;
• the disposition of 50% or more of the assets of a subsidiary, as long as such subsidiary represents at least 20% of the assets of the corporation, as well asany disposition of its shares that results in the parent company losing its position of controller;
• issue of guarantees for third parties’ liabilities which exceed 50% of the assets (if the third party is a subsidiary of the company, the approval of theboard of directors is sufficient);
• the creation of preferential rights for a class of shares or an amendment to the existing ones. In this case the right to withdraw only accrues to thedissenting shareholders of the class or classes of shares adversely affected;
• certain remedies for the nullification of the corporate bylaws; and
• such other causes as may be established by the law or by the company’s bylaws.
146

Table of Contents
Investments by AFPs
The Pension Funds’ System Law permits AFPs to invest their funds in companies that are subject to Title XII and, subject to greater restrictions, inother companies. The determination of which stocks may be purchased by AFPs is made by the Risk Classification Committee. The Risk ClassificationCommittee establishes investment guidelines and is empowered to approve or disapprove those companies that are eligible for AFP investments. Except forthe period from March 2003 to March 2004, Enersis has been a Title XII Company since 1985 and is approved by the Risk Classification Committee.
Title XII companies are required to have bylaws that limit the ownership of any shareholder to a specified maximum percentage, bylaws that requirethat certain actions be taken only at a meeting of the shareholders and bylaws that give the shareholders the right to approve certain investment andfinancing policies.
Registrations and Transfers
Shares issued by Enersis are registered with an administrative agent named DCV Registros S.A. This entity is responsible for Enersis’ shareholdersregistry as well. In case of jointly owned shares, an attorney−in−fact must be appointed to represent the joint owners in dealing with Enersis.
C. Material Contracts.
None.
D. Exchange Controls.
The Central Bank is responsible for, among other things, monetary policies and exchange controls in Chile. Currently applicable foreign exchangeregulations are set forth in the Compendium of Foreign Exchange Regulations (the Compendium) approved by the Chilean Central Bank in 2002. Appropriate registration of a foreign investment in Chile permits the investor access to the Formal Exchange Market. Foreign investments can beregistered with the Foreign Investment Committee under D.L. 600 of 1974 or can be registered with the Central Bank under the Central Bank Act, Law18840 of October 1989.
a) Foreign Investments Contracts and Chapter XXVI
Regarding our initial public offering of ADS in 1993, we entered into a foreign investment contract (the Foreign Investment Contract) with the ChileanCentral Bank and the Depositary, pursuant to Article 47 of the Central Bank Act and Chapter XXVI of the former Compendium of Foreign ExchangeRegulations (Chapter XXVI), which governed the issuance of ADS by a Chilean company. Pursuant to the Foreign Investment Contract, the foreignexchange for payments and distributions with respect to the ADS may be purchased in either the Formal Exchange Market or the Informal ExchangeMarket, but such payments must be necessarily remitted through the Formal Exchange Market.
As of April 19, 2001, Chapter XXVI was eliminated and new investments in ADRs by non−residents of Chile are now governed instead byChapter XIV of the Compendium. This change was made with the purpose of simplifying and facilitating the flow of capital to and from Chile. As a resultof the elimination of Chapter XXVI, access to the Formal Exchange Market is no longer assured. However, because our Foreign Investment Contract wasentered into pursuant to Chapter XXVI, the principles of Chapter XXVI still apply to its terms. Foreign investors who have purchased their shares under aForeign Investment Contract pursuant to Chapter XXVI continue to have access to the Formal Exchange Market for the purpose of converting pesos todollars and repatriating from Chile amounts received with respect to the deposited shares of common stock or shares of common stock withdrawn fromdeposit on surrender of ADRs (including amounts received as cash dividends and proceeds from the sale in Chile of the underlying shares of common stockand any rights with respect thereto). However, foreign investors who have not deposited the shares of common stock into our ADS facility will not have thebenefits of our Foreign Investment Contract with the Central Bank but instead will be subject to the normal foreign investment rules.
The following is a summary of certain provisions which were contained in Chapter XXVI and the Foreign Investment Contract, and which thereforeremain relevant. This summary does not purport to be complete and is qualified in its entirety by reference to Chapter XXVI and the Foreign InvestmentContract.
Under Chapter XXVI and the Foreign Investment Contract, the Central Bank agreed to grant to the Depositary, on behalf of ADR holders, and to anyinvestor not residing or domiciled in Chile who withdraws common stock upon delivery of ADRs (such shares of
147

Table of Contents
common stock being referred to herein as Withdrawn Shares) access to the Formal Exchange Market to convert pesos into dollars (and to remit such dollarsoutside of Chile), including amounts received as:
• cash dividends;
• proceeds from the sale in Chile of Withdrawn Shares subject to receipt by the Central Bank of a certificate from the holder of the Withdrawn Shares (orfrom an institution authorized by the Central Bank) that such holder’s residence and domicile are outside Chile and a certificate from a Chilean stockexchange (or from a brokerage or securities firm established in Chile) that such Withdrawn Shares were sold on a Chilean stock exchange;
• proceeds from the sale in Chile of rights to subscribe for additional shares of Common Stock;
• proceeds from the liquidation, merger or consolidation of our Company; and
• other distributions, including, without limitation, those resulting from any recapitalization, as a result of holding shares of Common Stock representedby ADS or Withdrawn Shares.
Transferees of Withdrawn Shares were not entitled to any of the foregoing rights under Chapter XXVI. Investors receiving Withdrawn Shares inexchange for ADRs had the right to redeposit such shares in exchange for ADRs, provided that certain conditions relating to redeposit were satisfied.
Chapter XXVI provided that access to the Formal Exchange Market in connection with dividend payments was conditioned upon certification by us tothe Central Bank that a dividend payment has been made and any applicable tax has been withheld. Chapter XXVI also provided that the access to theFormal Exchange Market in connection with the sale of Withdrawn Shares or distributions thereon was conditioned upon receipt by the Central Bank ofcertification by the Depositary (or the Custodian on its behalf) that such shares have been withdrawn in exchange for ADRs and receipt of a waiver of thebenefit of the Foreign Investment Contract with respect thereto until such Withdrawn Shares were redeposited.
The Foreign Investment Contract provides that a person who brings foreign currency into Chile to purchase shares of common stock with the benefit ofthe Foreign Investment Contract must convert it into pesos on the same day and has five banking business days within which to invest in shares of commonstock in order to receive the benefits of the Foreign Investment Contract. If such person decides within such period not to acquire shares of common stock,such person can access the Formal Exchange Market to reacquire dollars, provided that the applicable request is presented to the Central Bank within sevenbanking business days of the initial conversion into pesos. Shares acquired as described above may be deposited for ADRs and receive the benefits of theForeign Investment Contract, subject to receipt by the Central Bank of a certificate from the Depositary (or the Custodian on its behalf) that such deposit hasbeen effected, that the related ADRs have been issued and receipt of a declaration from the person making such deposit waiving the benefits of the ForeignInvestment Contract with respect to the deposited shares of common stock.
Access to the Formal Exchange Market under any of the circumstances described above is not automatic. Such access requires approval of the CentralBank based on a request presented through a banking institution established in Chile. The Foreign Investment Contract provides that if the Central Bank hasnot acted on such request within seven banking days, the request will be deemed approved.
Under current Chilean law, the Foreign Investment Contract cannot be changed unilaterally by the Central Bank. It is not certain, however, thatadditional Chilean restrictions applicable to the holders of ADRs, the disposition of underlying shares of Common Stock or the repatriation of the proceedsfrom such disposition could not be imposed in the future, nor can there be any assessment of the duration or impact of such restrictions, if imposed.
The Compendium and International Bond Issuances
Chilean issuers may offer bonds issued by the Central Bank internationally under Chapter XIV, as amended, of the Compendium.
E. Taxation.
Chilean Tax Considerations
The following discussion summarizes material Chilean income and withholding tax consequences to beneficial owners arising from the ownership anddisposition of the shares and ADS. The summary which follows does not purport to be a comprehensive description of all of the tax considerations that maybe relevant to a decision to purchase, own or dispose of shares or ADS and does
148

Table of Contents
not purport to deal with the tax consequences applicable to all categories of investors, some of which may be subject to special rules. Holders of shares andADS are advised to consult their own tax advisors concerning the Chilean and other tax consequences of the ownership of shares or ADS.
The summary that follows is based on Chilean law, as in effect on the date hereof, and is subject to any changes in these or other laws occurring aftersuch date, possibly with retroactive effect. Under Chilean law, provisions contained in statutes such as tax rates applicable to foreign investors, thecomputation of taxable income for Chilean purposes and the manner in which Chilean taxes are imposed and collected may be amended only by anotherlaw. In addition, the Chilean tax authorities enact rulings and regulations of either general or specific application and interpret the provisions of the ChileanIncome Tax Law. Chilean tax may not be assessed retroactively against taxpayers who act in good faith relying on such rulings, regulations andinterpretations, but Chilean tax authorities may change their rulings, regulations and interpretations in the future. The discussion that follows is also based,in part, on representations of the Depositary, and assumes that each obligation in the deposit agreement and any related agreements will be performed inaccordance with its terms. As of this date, there is currently no applicable income tax treaty in effect between the United States and Chile. However, in2010 the United States and Chile signed an income tax treaty that will enter into force once the treaty is ratified by both countries. There can be noassurance that the treaty will be ratified by either country. The following summary assumes that there is no applicable income tax treaty in effect betweenthe United States and Chile.
As used in this Report, the term “foreign holder” means either:
• in the case of an individual, a person who is not a resident of Chile; for purposes of Chilean taxation, an individual holder is resident of Chile if he or shehas resided in Chile for more than six months in one calendar year, or a total of more than six months in two consecutive fiscal years; or
• in the case of a legal entity, an entity that is not organized under the laws of Chile, unless the shares or ADS are assigned to a branch, agent,representative or permanent establishment of such entity in Chile.
Taxation of Shares and ADS
Taxation of Cash Dividends and Property Distributions
General Rule:Cash dividends paid with respect to the shares or ADS held by a foreign holder will be subject to a 35% Chilean withholding tax, whichis withheld and paid by the company. A credit against the Chilean withholding tax is available based on the level of corporate income tax actually paid bythe company on the income to be distributed; however, this credit does not reduce the Chilean withholding tax on a one−to−one basis because it alsoincreases, by the same amount, the basis upon which the Chilean withholding tax is imposed. In addition, if the company distributes less than all of itsdistributable income, the credit for the Chilean corporate income tax paid by the company is proportionately reduced. Since January 1, 2004, the Chileancorporate tax rate has been 17% (except for a temporary rate increase for 2011 and 2012 in connection with the financing of the 2010 earthquakereconstruction). The example below illustrates the effective Chilean withholding tax burden on a cash dividend received by a foreign holder, assuming aChilean withholding tax rate of 35%, an effective Chilean corporate income tax rate of 17% and a distribution of 50% of the net income of the companydistributable after payment of the Chilean corporate income tax:
Line Concept and calculation assumptions Amount1 Company taxable income (based on Line 1 = 100) 100.02 Chilean corporate income tax : 17% x Line 1 17.03 Net distributable income: Line 1 — Line 2 83.04 Dividend distributed (50% of net distributable income): 50% of Line 3 41.55 Withholding tax: (35% of (the sum of Line 4 and 50% of Line 2)) (17.5)6 Credit for 50% of Chilean corporate income tax : 50% x Line 2 8.57 Net withholding tax : Line 5 + Line 6 (9.0)8 Net dividend received: Line 4 − Line 7 32.59 Effective dividend withholding rate : Line 7 / Line 4 21.69%
In general, the effective dividend Chilean withholding tax rate, after giving effect to the credit for the Chilean corporate income tax paid by thecompany, can be computed using the following formula:
Effective Dividend = (Withholding tax rate) − (Chilean corporate income tax rate)Withholding Tax Rate 1 − (Chilean corporate income tax rate)
149

Table of Contents
Using the prevailing rates, the Effective Dividend Withholding Rate =
(35%−17%) / (100%−17%) = 21.69%
Dividends are generally assumed to have been paid out of the Company’s oldest retained profits for purposes of determining the level of Chileancorporate income tax that was paid by the Company. For information as to the retained earnings of the Company for tax purposes and the tax creditavailable on the distribution of such retained earnings, see Note 17 to our Consolidated Financial Statements.
Under Chilean Income Tax Law, dividend distributions made in property are subject to the same Chilean tax rules as cash dividends. Stock dividendsare not subject to Chilean taxation.
The Chilean Income Tax Law was amended in July 2010, as part of the fiscal financing of the 2010 earthquake reconstruction, to provide for thefollowing corporate tax rates: 17.0% for 2010, 20.0% for 2011, 18.5% for 2012 and a return to the 17.0% rate as of 2013. As discussed above, the corporateincome tax is a credit against the withholding tax rate applicable on cash dividends received by a foreign holder.
Exceptions: Despite the aforementioned general rule, there are special circumstances under which a different tax treatment would apply depending onthe source of the income or due to special circumstances existing at the date of the dividend distribution. The most common special cases are brieflydescribed below:
1) Circumstances where there is no credit against the Chilean withholding tax: Dividends distributed by the company to foreign holders would notreceive a credit against the Chilean withholding tax. By way of example, such is the case when dividend distributions exceed the company’s taxable incomeor when the income was not subject to corporate income tax due to an exemption. In these cases, the foreign holder will be subject to the Chileanwithholding tax rate of 35%, without the corporate income tax credit.
2) Circumstances where dividends have been imputed to income exempted from all Chilean income taxes: In these cases, dividends distributed by thecompany to the foreign holder will not be subject to Chilean withholding tax. Income exempted from Chilean income tax is expressly listed in the ChileanIncome Tax Law.
3) Circumstances where dividends are subject to a provisional withholding tax: In the event that on the date of the dividend distribution there are noearnings on which income tax has been paid and there are no tax—exempt earnings, a provisional withholding must be made on the dividends at the time ofpayment to the foreign holders. This provisional withholding is calculated as if the dividends were paid from taxable income without corporate tax credit. In other words, dividends will be subject to a 35% Chilean withholding tax rate, but they will not receive a corporate tax credit of 17%.
The provisional withholding tax must be confirmed with information as of December 31 of the year in which the dividend was paid. This confirmationmust be based on the company’s effective income as of December 31.
4) Circumstances when it is possible to use in Chile certain credits against income taxes paid abroad, or “foreign tax credit”: This occurs whendividends distributed by the Chilean company have as their source income generated by companies domiciled in third countries. If that income was subjectto withholding tax or corporate income tax in those third countries, such income will have a credit or “foreign tax credit” against corresponding Chileantaxes, which can be proportionally transferred to the shareholders of the Chilean company.
Taxation on sale or exchange of ADS, outside Chile
Gains obtained by a foreign holder from the sale or exchange of ADS outside Chile will not be subject to Chilean taxation.
Taxation on sale or exchange of Shares where shares or ADS were acquired on or before April 19, 2001
Gain recognized on a sale or exchange of shares (as distinguished from sales or exchanges of ADS representing such common shares) will be subjectto both a 17% Chilean income tax and the 35% Chilean withholding tax (the former being creditable against the latter) if (i) the foreign holder acquired anddisposed of the shares in the ordinary course of its business or as a regular trader of shares, or (ii) the foreign holder and the purchaser of the shares arerelated parties within the meaning of the Chilean Income Tax Law. In all other cases, gains on the disposition of shares will be subject to a 17% Chileanincome tax but will not be subject to the 35% Chilean withholding tax. The date of acquisition of the ADS is considered to be the date of acquisition of theshares for which the ADS are exchanged.
150

Table of Contents
Taxation on sale or exchange of Shares where Shares or ADS were acquired after April 19, 2001
The Chilean Income Tax Law includes a tax exemption on capital gains arising from the sale of shares of listed companies traded in the stock markets. Although there are certain restrictions, in general terms, the amendment provides that in order to qualify for the capital gain exemption: (i) the shares mustbe of a public stock company with a certain minimum level of trading on a stock exchange; (ii) the sale must be carried out in a Chilean stock exchange, orin a tender offer subject to Chapter XXV of the Chilean Securities Market Law; (iii) the shares which are being sold must have been acquired on a stockexchange, or in a tender offer subject to Chapter XXV of the Chilean Securities Market Law, or in an initial public offering (due to the creation of acompany or to a capital increase), or due to the exchange of convertible bonds; and (iv) the shares must have been acquired after April 19, 2001. If theshares do not qualify for the exemption, capital gains on their sale or exchange, if any, will be taxed in accordance with the rules described in the precedingparagraph. In addition, if the exemption does not apply and the foreign holder has held the shares for less than one year, gains from the disposition of shareswill be subject to both income and withholding tax as described in the preceding paragraph. The date of acquisition of the ADS is considered to be the dateof acquisition of the shares for which the ADS are exchanged.
Taxation of Rights and ADS Rights
For Chilean tax purposes, the receipt of rights or ADS rights by a foreign holder of shares or ADS pursuant to a rights offering is a nontaxable event. In addition, there are no Chilean income tax consequences to foreign holders upon the exercise or the lapse of the rights or the ADS rights. Any gain on thesale, exchange or transfer of the rights by a foreign holder is subject to a 35% Chilean withholding tax.
Other Chilean Taxes
There is no gift, inheritance or succession taxes applicable to the ownership, transfer or disposition of ADS by a foreign holder, but such taxes willgenerally apply to the transfer at death or by gift of the shares by a foreign holder. There is no Chilean stamp, issue, registration or similar taxes or dutiespayable by holders of shares or ADS.
Material U.S. Income Tax Considerations
This discussion is based on the Internal Revenue Code of 1986, as amended (the Code), administrative pronouncements, judicial decisions and final,temporary and proposed Treasury regulations, all as of the date hereof. These authorities are subject to change, possibly with retroactive effect. Thisdiscussion assumes that the Depositary’s activities are clearly and appropriately defined so as to ensure that the tax treatment of ADS will be identical to thetax treatment of the underlying shares.
As of this date, there is currently no applicable income tax treaty in effect between the United States and Chile. However, in 2010 the United Statesand Chile signed an income tax treaty that will enter into force once the treaty is ratified by both countries. There can be no assurance that the treaty will beratified by either country. The following summary assumes that there is no applicable income tax treaty in effect between the United States and Chile.
The following are the material U.S. federal income tax consequences to beneficial owners described herein of owning and disposing of shares orADS, but it does not purport to be a comprehensive description of all of the tax considerations that may be relevant to a particular person’s decision to holdsuch securities. The discussion applies only if you hold shares or ADS as capital assets for U.S. federal income tax purposes and it does not describe all ofthe tax consequences that may be relevant in light of your particular circumstances, such as if you are:
• certain financial institutions;
• insurance companies;
• dealers and traders in securities who use a mark—to—market method of tax accounting;
• persons holding shares or ADS as part of a hedge, “straddle,” integrated transaction or similar transaction;
• persons whose functional currency for U.S. federal income tax purposes is not the U.S. dollar;
• partnerships or other entities classified as partnerships for U.S. federal income tax purposes;
• persons liable for the alternative minimum tax;
151

Table of Contents
• tax—exempt organizations;
• persons holding shares or ADS that own or are deemed to own ten percent or more of our stock;
• persons who acquired our shares or ADS pursuant to the exercise of any employee stock option or otherwise as compensation; or
• persons holding shares or ADS in connection with a trade or business conducted outside of the United States.
If an entity classified as a partnership for U.S. federal income tax purposes holds shares or ADS, the U.S. federal income tax treatment of a partnerwill generally depend on the status of the partner and upon the activities of the partnership. Partnerships holding shares or ADS and partners in suchpartnerships should consult their tax advisors as to the particular U.S. federal income tax consequences of holding and disposing of the shares or ADS.
You are a “U.S. Holder” for purposes of this discussion if you are a beneficial owner of our shares or ADS and if you are, for U.S. federal income taxpurposes:
• a citizen or individual resident of the United States; or
• a corporation, or other entity taxable as a corporation, created or organized in or under the laws of the United States or any political subdivision thereof;or
• an estate, the income of which is subject to U.S. federal income taxation regardless of its source; or
• a trust (i) that validly elects to be treated as a U.S. person for U.S. federal income tax purposes or (ii) (A) if a court within the United States is able toexercise primary supervision over the administration of the trust and (B) one or more U.S. persons have the authority to control all substantial decisions ofthe trust.
You are a “Non—U.S. Holder” for purposes of this discussion if you are a beneficial owner of our shares or ADS and are not a U.S. Holder.
In general, if you own ADS, you will be treated as the owner of the shares represented by those ADS for U.S. federal income tax purposes. Accordingly, no gain or loss will be recognized if you exchange ADS for the underlying shares represented by those ADS.
The U.S. Treasury has expressed concerns that parties to whom ADS are released before shares are delivered to the Depositary (pre—release) orintermediaries in the chain of ownership between holders and the issuer of the security underlying the ADS may be taking actions that are inconsistent withthe claiming of foreign tax credits for holders of depositary shares. Such actions would also be inconsistent with the claiming of the reduced tax rate,described below, applicable to dividends received by certain non—corporate holders. Accordingly, the analysis of the creditability of Chilean taxes, and theavailability of the reduced tax rate for dividends received by certain non—corporate holders, each described below, could be affected by actions taken bysuch parties or intermediaries.
This discussion assumes that the Company is not, and will not become, a passive foreign investment company, as described below.
The summary of U.S. federal income tax consequences set out below is intended for general informational purposes only. You should consult yourtax advisors with respect to the particular tax consequences to you of owning or disposing of shares or ADS, including the applicability and effect of state,local, non—U.S. and other tax laws and the possibility of changes in tax laws.
Taxation of Distributions
Distributions paid on shares or ADS other than certain pro rata distributions of common shares will be treated as dividends taxable as ordinary incometo the extent paid out of our current or accumulated earnings and profits (as determined under U.S. federal income tax principles). Because we do notmaintain calculations of our earnings and profits under U.S. federal income tax principles, it is expected that distributions generally will be reported asdividends.
Subject to applicable limitations and the discussion above regarding concerns expressed by the U.S. Treasury, dividends paid by qualified foreigncorporations to certain non—corporate U.S. Holders in taxable years beginning before January 1, 2013 are taxable at
152

Table of Contents
a maximum rate of 15%. A foreign company is treated as a qualified foreign corporation with respect to dividends paid on stock that is readily tradable onan established securities market in the United States, such as the New York Stock Exchange where our ADS are traded. You should consult your taxadvisors to determine whether the favorable rate will apply to dividends you receive and whether you are subject to any special rules that limit your abilityto be taxed at this favorable rate.
The amount of a dividend will include the net amount withheld by us in respect of Chilean withholding taxes on the distribution. The amount of thedividend will be treated as foreign—source dividend income to you and will not be eligible for the dividends—received deduction generally allowed to U.S.corporations under the Code. Dividends will be included in your income on the date of your, or in the case of ADS, the Depositary’s, receipt of thedividend. The amount of any dividend paid in Chilean pesos will be a U.S. dollar amount calculated by reference to the exchange rate for convertingChilean pesos into dollars in effect on the date of such receipt regardless of whether the payment is in fact converted into dollars. If the dividend isconverted into U.S. dollars on the date of receipt, you generally should not be required to recognize foreign currency gain or loss in respect of the dividendincome. You may have foreign currency gain or loss if the dividend is converted into dollars on a date after the date of receipt.
Subject to applicable limitations that may vary depending upon your circumstances and subject to the discussion above regarding concerns expressedby the U.S. Treasury, the net amount of Chilean withholding tax (after reduction for the credit for Chilean corporate income tax, as discussed above under“Item 10. Additional Information—E. Taxation—Chilean Tax Considerations — Taxation of Shares and ADS — Taxation of Cash Dividends and PropertyDistributions”) withheld from dividends on shares or ADS will be creditable against your U.S. federal income tax liability. The rules governing foreign taxcredits are complex and, therefore, you should consult your tax advisor regarding the availability of foreign tax credits in your particular circumstances. Instead of claiming a credit, you may, at your election, deduct such Chilean taxes in computing your taxable income, subject to generally applicablelimitations under U.S. law. An election to deduct foreign taxes instead of claiming foreign tax credits must apply to all taxes paid or accrued in the taxableyear to foreign countries and possessions of the United States.
Subject to the discussion below under “Information Reporting and Backup Withholding,” if you are a Non—U.S. Holder, you generally will not besubject to U.S. federal income or withholding tax on dividends received by you on your shares or ADS, unless you conduct a trade or business in the UnitedStates and such income is effectively connected with that trade or business.
Sale or Other Disposition of Shares or ADS
For U.S. federal income tax purposes, the gain or loss you realize on the sale or other disposition of shares or ADS will be a capital gain or loss, andwill be a long—term capital gain or loss if you have held the shares or ADS for more than one year. The amount of your gain or loss will equal thedifference between your tax base in the shares or ADS disposed of and the amount realized on the disposition, in each case as determined in dollars. Suchgain or loss will generally be U.S.—source gain or loss for foreign tax credit purposes. In addition, certain limitations exist on the deductibility of capitallosses by both corporate and individual taxpayers.
In certain circumstances, Chilean taxes may be imposed upon the sale of shares. See “Item 10. Additional Information—E. Taxation—Chilean TaxConsiderations — Taxation of Shares and ADS.” If a Chilean tax is imposed on the sale or disposition of shares, and a U.S. Holder does not receivesignificant foreign source income from other sources, such U.S. Holder may not be able to credit such Chilean tax against his U.S. federal income taxliability.
Subject to the discussion below under “Information Reporting and Backup Withholding,” a Non—U.S. Holder of ADS or shares generally will not besubject to United States income or withholding tax on gain from the sale or other disposition of ADS or shares unless (i) such gain is effectively connectedwith the conduct of a trade or business within the United States or (ii) the Non—U.S. Holder is an individual who is present in the United States for at least183 days during the taxable year of the disposition and certain other conditions are met.
Passive Foreign Investment Company Rules
We believe that we were not a “passive foreign investment company” (PFIC) for U.S. federal income tax purposes for our 2011 taxable year. However, because PFIC status depends upon the composition of a company’s income and assets and the market value of its assets from time to time, andbecause it is unclear whether certain types of our income constitute passive income for PFIC purposes, there can be no assurance that we will not beconsidered a PFIC for any taxable year. If we were a PFIC for 2011 or for any prior or future taxable year during which you held shares or ADS, certainadverse consequences could apply to you, including the imposition of higher amounts of tax than would otherwise apply, and additional filingrequirements. You should consult your tax advisors regarding the consequences to you if we were a PFIC, as well as the availability and advisability ofmaking any election, which may mitigate the adverse consequences of PFIC status.
153

Table of Contents
Information Reporting and Backup Withholding
Payments of dividends and sales proceeds that are made within the United States or through certain U.S.—related financial intermediaries generallyare subject to information reporting and to backup withholding unless (i) you are an exempt recipient or (ii) in the case of backup withholding, you providea correct taxpayer identification number and certify that you are not subject to backup withholding.
U.S. information reporting and backup withholding may also apply to Non−U.S. Holders that are not “exempt recipients” and that fail to providecertain information as may be required by United States law and applicable regulations.
The amount of any backup withholding from a payment to you will be allowed as a credit against your U.S. federal income tax liability and mayentitle you to a refund, provided that the required information is timely furnished to the Internal Revenue Service.
Legislation enacted in 2010 requires certain U.S. Holders to report to the Internal Revenue Service information with respect to their investment inshares or, it is assumed, ADS not held through a custodial account with a U.S. financial institution. Investors who fail to report required information couldbecome subject to substantial penalties and/or extended statute of limitations.
You should consult your tax advisors with respect to the particular consequences to you of owning or disposing of shares or ADS.
F. Dividends and Paying Agents.
Not applicable.
G. Statement by Experts.
Not applicable.
H. Documents on Display.
We are subject to the information requirements of the Exchange Act, except that as a foreign issuer, we are not subject to the proxy rules (other thangeneral anti−fraud rules) or the short−swing profit disclosure rules of the Exchange Act. In accordance with these statutory requirements, we file or furnishreports and other information with the SEC. Reports and other information filed or furnished by us with the SEC may be inspected and copied at the publicreference facilities maintained by the SEC at Room 1024, 100 F Street, N.E., Washington, D.C. 20549, and at the SEC’s regional offices at 233 Broadway,New York, New York 10279 and 475 West Jackson Boulevard, Suite 900, Chicago, Illinois 60604. Copies of such material may also be inspected at theoffices of the New York Stock Exchange, 11 Wall Street, New York, New York 10005, on which our ADSs are listed. In addition, the SEC maintains awebsite that contains information filed electronically with the SEC, which can be accessed over the Internet at http://www.sec.gov.
I. Subsidiary information.
Not applicable.
Item 11. Quantitative and Qualitative Disclosures About Market Risk
The Company is exposed to risks arising from changes in commodity prices, interest rates and foreign exchange rates. The Company’s Board ofDirectors approves risk management policies at all levels.
Commodity Price Risk
In our electricity generation business, we are exposed to market risks arising from the price volatility of electricity, natural gas, diesel oil, and coal. Natural gas is used in some of our power plants in South America. We seek to ensure our supply of this fuel by securing long−term contracts with oursuppliers for terms that are expected to match the lifetime of our generation assets. These contracts generally have provisions that allow us to purchase gasat market prices prevailing at the time the purchase occurs. As of December 31, 2011, 2010 and 2009, we did not hold any contracts classified as derivativefinancial instruments, financial instruments, or derivative commodity instruments related to natural gas.
154

Table of Contents
In the countries where we operate using coal and diesel oil, the dispatch mechanism allows the thermal power plants to cover their operational costs. However, under certain circumstances, fuel price fluctuations might affect marginal costs. We transfer commodity prices variations to the sale contractprices according to indexing formulas but only to the degree that this is possible in our different markets. Because of the drought in Chile and the Brentprice volatility, the company decided to hedge this risk with call options in order to set a ceiling on the price of this commodity for the period April toJuly 2011.As of December 31, 2011, 2010 and 2009, we did not hold any contracts classified as derivative financial instruments, financial instruments orderivative commodity instruments related either to coal or to diesel oil.
Additionally, through adequate commercial risk mitigation policies, and a hydro−thermal power plant mix, we seek to naturally protect our operatingincome from electricity price volatility. As of December 31, 2011, 2010 and 2009, we did not hold electricity price−sensitive instruments.
The Company is permanently analyzing ways for hedging commodity price risk.
Interest Rate and Foreign Currency Risk
The recorded values of our financial debt as of December 31, 2011, are detailed below, according to maturity. Total values do not include the effect ofderivatives.
Expected Maturity Date
As of December 31, 2012 2013 2014 2015 2016 Thereafter TotalFair
Value (1)(in millions of Ch$)
Fixed RateChilean $ /UF 1 0 0 0 0 0 1 1Weighted average interest rate 6.3% — — — — — 6.3% —$ 52,152 225,283 206,136 126,436 154,234 205,823 970,064 1,257,376Weighted average interest rate 7.0% 8.8% 7.7% 8.9% 7.6% 8.0% 8.1%Other currencies (2) 93,036 70,681 70,434 34,831 25,146 285,655 579,783 646,471Weighted average interest rate 11.4% 8.3% 8.1% 7.3% 7.5% 9.0% 9.0%Total Fixed Rate 145,189 295,964 276,570 161,266 179,380 491,478 1,549,847 1,903,848Weighted average interest rate 9.8% 8.7% 7.8% 8.5% 7.6% 8.6% 8.5%
Variable RateChilean $ /UF 39,945 9,490 9,823 10,171 9,057 388,148 466,635 618,179Weighted average interest rate 10.7% 10.9% 10.9% 10.9% 10.8% 9.0% 9.3%$ 35,455 24,018 122,548 20,494 19,399 38,123 260,037 260,037Weighted average interest rate 3.9% 6.8% 2.3% 3.4% 3.0% 3.3% 3.2%Other currencies (2) 349,360 142,042 207,943 122,956 123,382 414,809 1,360,493 1,428,566Weighted average interest rate 11.1% 12.8% 9.9% 10.3% 10.5% 9.8% 10.6%Total Variable Rate 424,760 175,550 340,314 153,622 151,838 841,080 2,087,165 2,306,781Weighted average interest rate 10.4% 11.9% 7.2% 9.4% 9.6% 9.2% 9.4%
TOTAL 569,949 471,514 616,883 314,888 331,219 1,332,558 3,637,012 4,210,630
(1) As of December 31, 2011, fair value was calculated based on the discounted value of future cash flows expected to be paid (or received),considering current discount rates that reflect the different risks involved.(2) “Other currencies” includes the Euro, reais, Colombian pesos, Argentine pesos and soles.
155

Table of Contents
The recorded values of our financial debt as of December 31, 2010, are detailed below, according to maturity. Total values do not include the effect ofderivatives.
Expected Maturity Date
As of December 31, 2011 2012 2013 2014 2015 Thereafter TotalFair
Value (1)(in millions of Ch$)
Fixed RateChilean $ /UF 0 0 0 0 0 0 0 0Weighted average interest rate — — — — — — — —US$ 46,209 29,589 202,957 185,819 113,977 316,583 895,134 1,154,196Weighted average interest rate 6.9% 6.8% 8.8% 7.7% 8.9% 7.5% 8.0%Other currencies (2) 127,593 65,162 73,120 59,268 25,222 46,682 397,047 414,620Weighted average interest rate 6.6% 8.5% 6.4% 7.7% 6.9% 7.0% 7.1%Total Fixed Rate 173,802 94,751 276,078 245,087 139,199 363,264 1,292,181 1,568,816Weighted average interest rate 6.7% 7.9% 8.2% 7.7% 8.5% 7.5% 7.7%
Variable RateChilean $ /UF 10,023 9,478 10,099 10,419 11,076 408,013 459,108 205,877Weighted average interest rate 8.4% 8.5% 8.5% 8.5% 8.5% 7.1% 7.3%US$ 50,724 37,896 10,795 104,147 16,459 38,856 258,878 258,600Weighted average interest rate 3.3% 3.2% 2.6% 1.8% 2.8% 2.8% 2.6%Other currencies (2) 356,945 335,415 146,244 135,537 74,595 318,636 1,367,372 1,433,744Weighted average interest rate 10.2% 10.2% 10.3% 11.7% 8.2% 7.6% 9.6%Total Variable Rate 417,692 382,789 167,138 250,103 102,130 765,505 2,085,357 1,898,221Weighted average interest rate 9.3% 9.5% 9.7% 7.4% 7.4% 7.1% 8.2%
TOTAL 591,494 477,540 443,216 495,190 241,329 1,128,770 3,377,538 3,467,037
(1) As of December 31, 2010, fair value was calculated based on the discounted value of future cash flows expected to be paid (or received),considering current discount rates that reflect the different risks involved.(2) “Other currencies” includes the Euro, reais, Colombian pesos, Argentine pesos and soles.
Interest Rate Risk
At December 31, 2010 and 2011, 48.6% and 38.1%, respectively, of our outstanding net debt obligations were subject to floating interest rates.
We manage interest rate risk by maintaining a mixture of both variable and fixed rate debt, according to the policy approved by the Board of Directors.Additionally, we manage interest rate risk through the use of interest rate derivatives. The above percentages include the effect of interest rate derivatives(swaps or collars) that hedge part of our debt.
As of December 31, 2011 the recorded values for financial accounting purposes and the corresponding fair value of the instruments that hedge ourinterest rate risk exposure are as follows:
Expected Maturity Date
As of December 31, 2012 2013 2014 2015 2016 Thereafter TotalFair
Value(2)(in millions of Ch$) (1)
Variable to fixed rates 10,781 7,126 125,248 6,894 5,293 8,368 163,709 (4,386)Fixed to variable rates — — — — — — — —TOTAL 10,781 7,126 125,248 6,894 5,293 8,368 163,709 (4,386)
(1) Calculated based on the Observed Exchange Rate as of December 31, 2011, which was Ch$ 519.20 = $ 1.00.(2) Fair value was calculated based on the discounted value of future cash flows expected to be paid (or received), considering current discount rates that
reflect the different risks involved.
156
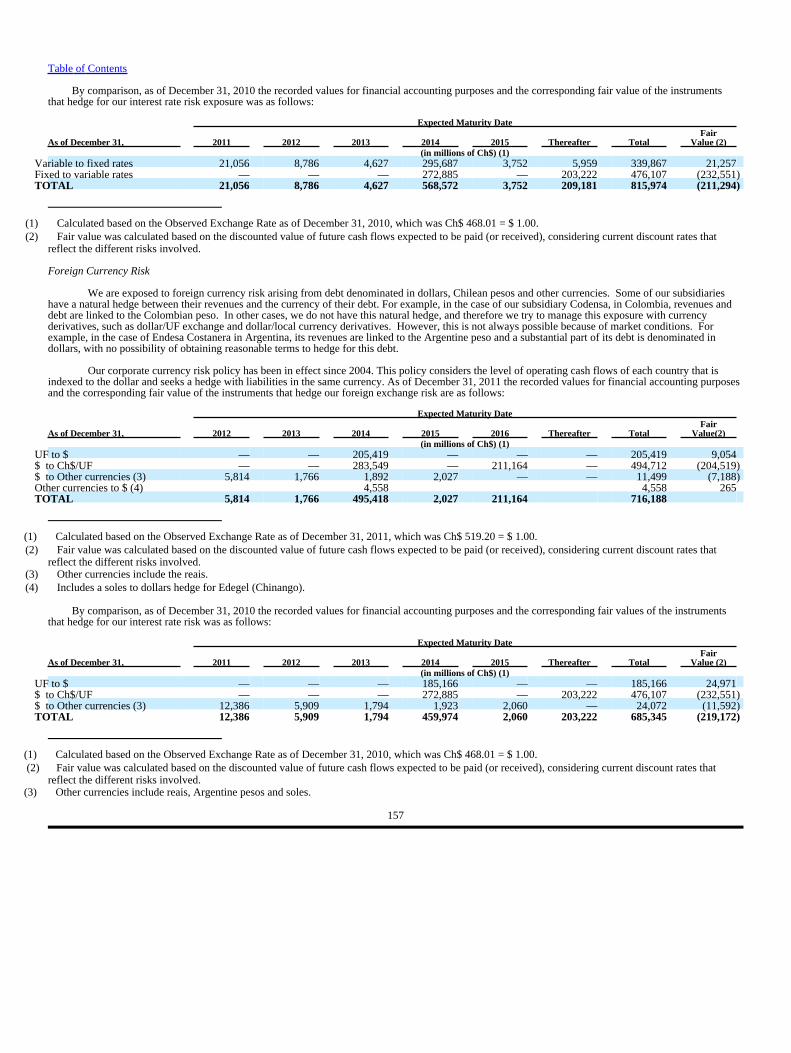
Table of Contents
By comparison, as of December 31, 2010 the recorded values for financial accounting purposes and the corresponding fair value of the instrumentsthat hedge for our interest rate risk exposure was as follows:
Expected Maturity Date
As of December 31, 2011 2012 2013 2014 2015 Thereafter TotalFair
Value (2)(in millions of Ch$) (1)
Variable to fixed rates 21,056 8,786 4,627 295,687 3,752 5,959 339,867 21,257Fixed to variable rates — — — 272,885 — 203,222 476,107 (232,551)TOTAL 21,056 8,786 4,627 568,572 3,752 209,181 815,974 (211,294)
(1) Calculated based on the Observed Exchange Rate as of December 31, 2010, which was Ch$ 468.01 = $ 1.00.(2) Fair value was calculated based on the discounted value of future cash flows expected to be paid (or received), considering current discount rates that
reflect the different risks involved.
Foreign Currency Risk
We are exposed to foreign currency risk arising from debt denominated in dollars, Chilean pesos and other currencies. Some of our subsidiarieshave a natural hedge between their revenues and the currency of their debt. For example, in the case of our subsidiary Codensa, in Colombia, revenues anddebt are linked to the Colombian peso. In other cases, we do not have this natural hedge, and therefore we try to manage this exposure with currencyderivatives, such as dollar/UF exchange and dollar/local currency derivatives. However, this is not always possible because of market conditions. Forexample, in the case of Endesa Costanera in Argentina, its revenues are linked to the Argentine peso and a substantial part of its debt is denominated indollars, with no possibility of obtaining reasonable terms to hedge for this debt.
Our corporate currency risk policy has been in effect since 2004. This policy considers the level of operating cash flows of each country that isindexed to the dollar and seeks a hedge with liabilities in the same currency. As of December 31, 2011 the recorded values for financial accounting purposesand the corresponding fair value of the instruments that hedge our foreign exchange risk are as follows:
Expected Maturity Date
As of December 31, 2012 2013 2014 2015 2016 Thereafter TotalFair
Value(2)(in millions of Ch$) (1)
UF to $ — — 205,419 — — — 205,419 9,054$ to Ch$/UF — — 283,549 — 211,164 — 494,712 (204,519)$ to Other currencies (3) 5,814 1,766 1,892 2,027 — — 11,499 (7,188)Other currencies to $ (4) 4,558 4,558 265TOTAL 5,814 1,766 495,418 2,027 211,164 716,188
(1) Calculated based on the Observed Exchange Rate as of December 31, 2011, which was Ch$ 519.20 = $ 1.00.(2) Fair value was calculated based on the discounted value of future cash flows expected to be paid (or received), considering current discount rates that
reflect the different risks involved.(3) Other currencies include the reais.(4) Includes a soles to dollars hedge for Edegel (Chinango).
By comparison, as of December 31, 2010 the recorded values for financial accounting purposes and the corresponding fair values of the instrumentsthat hedge for our interest rate risk was as follows:
Expected Maturity Date
As of December 31, 2011 2012 2013 2014 2015 Thereafter TotalFair
Value (2)(in millions of Ch$) (1)
UF to $ — — — 185,166 — — 185,166 24,971$ to Ch$/UF — — — 272,885 — 203,222 476,107 (232,551)$ to Other currencies (3) 12,386 5,909 1,794 1,923 2,060 — 24,072 (11,592)TOTAL 12,386 5,909 1,794 459,974 2,060 203,222 685,345 (219,172)
(1) Calculated based on the Observed Exchange Rate as of December 31, 2010, which was Ch$ 468.01 = $ 1.00.(2) Fair value was calculated based on the discounted value of future cash flows expected to be paid (or received), considering current discount rates that
reflect the different risks involved.(3) Other currencies include reais, Argentine pesos and soles.
157

Table of Contents
Table of Contents
(d) Safe Harbor
The information in this “Item 11. Quantitative and Qualitative Disclosures About Market Risk,” contains information that may constituteforward−looking statements. See “Forward−Looking Statements” in the Introduction of this Report for safe harbor provisions.
Item 12. Description of Securities Other Than Equity Securities
A. Debt Securities.
Not applicable.
B. Warrants and Rights.
Not applicable.
C. Other Securities.
Not applicable.
D. American Depositary Shares.
Depositary Fees and Charges
The Company’s ADS program is administered by Citibank, N.A., as Depositary. Under the terms of the Deposit Agreement, an ADS holder mayhave to pay the following service fees to the Depositary:
Service Fees Fees(1) Issuance of ADS upon deposit of Shares Up to $5.00 per 100 ADS (or fraction thereof) issued.(2) Delivery of deposited securities against surrender of ADS Up to $5.00 per 100 ADS (or fraction thereof)
surrendered.(3) Distribution of cash dividends or other cash distributions (i.e., sale of rights and otherentitlements)
Up to $5.00 per 100 ADS (or fraction thereof) held.
(4) Distribution of ADS pursuant to (i) stock dividends or other free stock distributions, or(ii) exercise of rights to purchase additional ADS
Up to $5.00 per 100 ADS (or fraction thereof) held.
(5) Distribution of securities other than ADS or rights to purchase additional ADS (i.e.,spin—off of shares)
Up to $5.00 per 100 ADS (or fraction thereof) held.
(6) Depositary services Up to $5.00 per 100 ADS (or fraction thereof) held on theapplicable record date(s) established by the Depositary.
Depositary Payments for Fiscal Year 2011
The Depositary has agreed to reimburse certain expenses related to the Company’s ADS program and incurred by the Company in connection withthe program. In 2011, the Depositary reimbursed expenses related to Investor Relations’ activities for a total amount of $ 514,658.34.
158

Table of Contents
PART II
Item 13. Defaults, Dividend Arrearages and Delinquencies
None.
Item 14. Material Modifications to the Rights of Security Holders and Use of Proceeds
None.
Item 15. Controls and Procedures
(a) Disclosure Controls and Procedures
The Company carried out an evaluation under the supervision and with the participation of the Company’s management, including the ChiefExecutive Officer and Chief Financial Officer, of the effectiveness of the design and operation of the Company’s “disclosure controls and procedures” (asdefined in Rules 13 (a) −15 (e) and 15 (d) −15 (e) under the Exchange Act) for the year ended December 31, 2011.
There are inherent limitations to the effectiveness of any system of disclosure controls and procedures, including the possibility of human error, andthe circumvention or overriding of the controls and procedures. Accordingly, the Company’s disclosure controls and procedures are designed to providereasonable assurance of achieving their control objectives.
Based upon the Company’s evaluation, the Chief Executive Officer and the Chief Financial Officer concluded that the disclosure controls andprocedures are effective in providing reasonable assurance that information required to be disclosed in the reports the Company files and submits under theExchange Act is recorded, processed, summarized and reported within the time periods specified in the applicable rules and forms, and that it is gatheredand communicated to the Company’s Management, including the Chief Executive Officer and Chief Financial Officer, as appropriate, to allow timelydecisions regarding required disclosure.
Our disclosure controls and procedures are designed to provide reasonable assurance of achieving their objectives, and our principal executive officerand principal financial officer have concluded that our disclosure controls and procedures are effective at that reasonable assurance level.
(b) Management’s Annual Report on Internal Control Over Financial Reporting
As required by Section 404 of the Sarbanes—Oxley Act of 2002, Enersis’ management is responsible for establishing and maintaining “adequateinternal control over financial reporting” (as defined in Rule 13(a)−15 (f) under the Exchange Act). The Company’s internal control over financial reportingis designed to provide reasonable assurance regarding the reliability of financial reporting and the preparation of the financial statements for externalpurposes in accordance with IFRS, as issued by the IASB.
Because of its inherent limitations, internal control over financial reporting may not necessarily prevent or detect some misstatements. It can onlyprovide reasonable assurance regarding financial statement preparation and presentation. Also, projections of any evaluation of effectiveness for futureperiods are subject to the risk that controls may become inadequate because of changes in conditions or because the degree of compliance with the policiesor procedures may deteriorate over time.
Management assessed the effectiveness of its internal control over financial reporting for the year ended December 31, 2011. The assessment wasbased on criteria established in the “Internal Controls — Integrated Framework” issued by the Committee of Sponsoring Organizations of the TreadwayCommission (COSO). Based on the assessment, Enersis’ Management has concluded that as of December 31, 2011, the Company’s internal control overfinancial reporting was effective.
(c) Attestation Report
Ernst & Young Ltda., the independent registered public accounting firm that has audited our Consolidated Financial Statements, has issued anattestation report on the company’s internal control over financial reporting as of December 31, 2011. This attestation report appears on page F−3.
159

Table of Contents
(d) Changes in internal control
There were no changes in the Company’s internal control over financial reporting that occurred during 2011 that have materially affected, or arereasonably likely to materially affect, the Company’s internal control over financial reporting.
Item 16. [Reserved]
Item 16A. Audit Committee Financial Expert
As of December 31, 2011, the Directors’ Committee’s (which performs the functions of the Audit Committee) financial expert was Mr. Leonidas Vial,as determined by the Board of Directors. Mr. Vial is an independent member of the Directors’ Committee pursuant to the requirement of both Chilean lawand NYSE corporate governance rules.
Item 16B. Code of Ethics
The standards of ethical conduct at Enersis are currently governed by means of four corporate rulings or policies: the Charter Governing Executives(Estatuto del Directivo), the Code of Ethics, the Zero Tolerance Anti−Corruption Plan (the “ZTAC Plan”) and the Manual for the Management ofInformation of Interest to the Market (the “Manual”).
The Charter Governing Executives, approved as a corporate statute, was adopted by the Board of Directors in May 2003 and is applicable to allexecutives contractually related to Enersis or its controlled subsidiaries in which it is the majority shareholder, both in Chile and abroad, including the ChiefExecutive Officer, the Chief Financial Officer and other senior officers of the Company. The object of this statute is to establish standards for thegovernance of our management’s actions, the behavior of management with respect to the principles governing their actions and the limitations andincompatibilities involved, all within Endesa Chile’s vision, mission and values. Likewise, the Employee Code of Conduct explains our principles andethical values, establishes the rules governing our contact with customers and suppliers, and establishes the principles that should be followed byemployees, including ethical conduct, professionalism and confidentiality. Both documents also impose limitations on the activities that our executives andother employees may undertake outside the scope of their employment with us.
The Manual, adopted by Enersis’ Board of Directors in May 2008 and amended in February 2010, addresses the following issues: applicable standardsto the information of transactions of the Company’s securities or those of its affiliates by directors, management, principal executives, employees and otherrelated parties; existence of blackout periods for such transactions by directors, management, principal executives, employees and other related parties;existence of mechanisms for the continuous release of information that is of interest to the market; and mechanisms that provide protection for confidentialinformation.
In addition to the above mentioned corporate governance rules, the Board of the Company in its meeting of June 24, 2010 approved the Code of Ethicsand the ZTAC Plan. The Code of Ethics is based on general principles such as impartiality, honesty, integrity and other qualities of similar importance,which are translated into detailed behavioral criteria. The ZTAC Plan reinforces the principles included in the Code of Ethics, but with a special emphasisin avoiding corruption in the form of bribery, preferential treatment, and other similar acts.
A copy of these documents is available upon request, free of charge, by writing or calling us at:
Investor Relations DepartmentEnersis S.A.Santa Rosa 76, Piso 15Santiago, Chile(56−2) 353−4682
During fiscal year 2011, there have been no amendments to any provisions of the abovementioned documents. No waivers from any provisions of theCharter Governing Executives, the Code of Ethics, the ZTAC Plan or the Manual, were expressly or implicitly granted to the Chief Executive Officer, theChief Financial Officer or any other senior financial officer of the Company in fiscal year 2011.
160

Table of Contents
Item 16C. Principal Accountant Fees and Services
In 2011, the shareholders nominated Ernst & Young Servicios Profesionales de Auditoría y Asesoría Ltda. as the Company´s new independentregistered public accounting firm in replacement for Deloitte Auditores y Consultores Ltda.
The following table provides information on the aggregate fees billed by our principal accountants, as well as the other member firms of Ernst &Young and Deloitte, and their respective affiliates, by type of service rendered for periods indicated.
Services Rendered 2010 2011(in $ million)
Audit Fees (1) 3.7 2.5Audit—Related Fees 0.6 —Tax Fees (2) — 0.3All Other Fees 0.1 —
Total 4.3 2.8
(1) Corresponds to fees billed for 2010 and 2011 for professional services rendered by Deloitte and Ernst & Young, respectively, for the audit of Enersis’annual consolidated financial statements and services that are normally provided by Ernst & Young or Deloitte, as appropriate, in connection with statutoryand regulatory filings or engagements for those fiscal years. The decrease of $ 1.2 million in fees during 2011 was mainly due to the hiring of Ernst &Young as a new independent registered public accounting firm.
(2) During 2011, Ernst & Young provided us with services related to a Technical Study of Chilean tax rules for an amount of $ 298,499.
The amounts included in the table above and the related footnotes have been classified in accordance with SEC guidance.
All of the fees disclosed under Audit−Related Fees and All Other Fees were pre−approved by the Audit Committee.
Audit Committee Pre−Approval Policies and Procedures
Our external auditors are appointed by our shareholders at the OSM. Similarly, the shareholders of our subsidiaries, which are located in countrieswhere applicable law and regulation so establishes, appoint their own external auditors.
The Directors’ Committee (which performs the functions of the Audit Committee), through the Economic Financial General Directorate, or EFGD,manages appointment proposals, reviews engagement letters, fee negotiations, performs quality controls in respect of services provided, reviews andcontrols independence issues and other related matters.
The Directors’ Committee has a pre−approval policy regarding the contracting of Enersis’ external auditor, or any affiliate of the external auditor, forprofessional services. The professional services covered by such policy include audit and non−audit services provided to Enersis.
Fees payable in connection with recurring audit services are pre−approved as part of our annual budget. Fees payable in connection withnon−recurring audit services, once they have been analyzed by the EFGD, are submitted to the Audit Committee for approval or rejection.
The pre−approval policy established by the Directors’ Committee for non−audit services and Audit−Related Fees is as follows:
• the business unit that has requested the service and the audit firm expected to perform the service must request that the EFGD manager review the natureof the service to be provided.
• at that point, the EFGD analyzes the request and requires the audit firm that will provide the service to issue a certificate signed by the partnerresponsible for the audit of our Consolidated Financial Statements confirming such audit firm’s independence.
• finally, the proposal is submitted to the Audit Committee for approval or denial.
The services described in footnote (2) to the table above have been approved in line with the procedure described immediately above sinceJuly 2005.
161

Table of Contents
In addition, due to the SEC release number 34−53677 File No. PCAOB−2006−01 (Audit Committee Pre−Approval of Certain Tax Services), theDirectors’ Committee has designed, approved and implemented the necessary procedures to fulfill the new requirements described by this rule.
Item 16D. Exemptions from Listing Requirements for Audit Committees
Not applicable.
Item 16E. Purchases of Equity Securities by the Issuer and Affiliated Purchasers
Neither Enersis nor any affiliated purchaser acquired any shares of Enersis during 2011.
Item 16F. Change in Registrant’s Certifying Accountant
There has been no change in independent accountants for the Company during the two most recent fiscal years or any subsequent interim period exceptas previously reported in the Company’s Annual Report on Form 20−F for the fiscal year ended December 31, 2010, and there have been no disagreementsof the type required to be disclosed by Item 16F (b).
Item 16G. Corporate Governance
For a summary of the significant differences between our corporate governance practices and those applicable to domestic issuers under the corporategovernance rules of the NYSE, please see “Item 6. Directors, Senior Management and Employees—C. Board practices.”
162

Table of Contents
PART III
Item 17. Financial Statements
None.
Item 18. Financial Statements
ENERSIS S.A. and Subsidiaries
Index to the Audited Consolidated Financial Statements
Reports of Independent Registered Public Accounting Firms:Report of Ernst & Young Servicios Profesionales de Auditoría y Asesorías Limitada — Enersis S.A. 2011 F −1Report of Ernst & Young Servicios Profesionales de Auditoría y Asesorías Limitada — Enersis S.A. — Internal Control over FinancialReporting 2011 F −3Report of Deloitte Auditores y Consultores Ltda. — Enersis S.A. 2010 and 2009 F −5Report of KPMG Auditores Consultores Ltda. — Empresa Nacional de Electricidad S.A. 2011 F −6Report of KPMG Auditores Consultores Ltda. — Empresa Nacional de Electricidad S.A. — Internal Control over Financial Reporting 2011F −8Report of Ernst & Young Audit Ltda. — Emgesa S.A. E.S.P. 2011 F −10Report of Deloitte & Touch Ltda. — Emgesa S.A. E.S.P. December 31, 2010 and September 30, 2010 F −11Report of Deloitte & Touch Ltda. — Emgesa S.A. E.S.P. 2009 F −12Report of Pistrelli, Henry Martin y Asociados S.R.L., member firm of Ernst & Young Global — Endesa Argentina S.A. 2011 F −13Report of Ernst & Young Terco Auditores Independentes S.S. — Endesa Brasil S.A. 2011 F −15Report of Deloitte Touch Tohmatsu Auditores Independentes — Endesa Brasil S.A. 2010 and 2009 F −16
Consolidated Financial Statements:Consolidated Statements of Financial Position as of December 31, 2011 and 2010 F −17Consolidated Statements of Comprehensive Income for the years ended December 31, 2011, 2010 and 2009 F −19Consolidated Statements of Changes in Equity for the years ended December 31, 2011, 2010 and 2009 F −21Consolidated Statements of Cash Flows for the years ended December 31, 2010, 2009 and 2008 F −22Notes to the Consolidated Financial Statements F −23
SCHEDULE I Enersis S.A.’s condensed unconsolidated financial information F −141
Item 19. Exhibits
Exhibit Description1.1 By—laws (Estatutos) of ENERSIS S.A., as amended. (*)8.1 List of Subsidiaries as of December 31, 201112.1 Certification of Chief Executive Officer pursuant to Section 302 of the Sarbanes—Oxley Act12.2 Certification of Chief Financial Officer pursuant to Section 302 of the Sarbanes—Oxley Act13.1 Certification of Chief Executive Officer and Chief Financial Officer pursuant to Section 906 of the Sarbanes—Oxley Act
(*) Incorporated by reference to Enersis’ Form 20−F for the year ended December 31, 2009.
We will furnish to the Securities and Exchange Commission, upon request, copies of any not filed instruments that define the rights ofstakeholders of Enersis.
163

Table of Contents
SIGNATURES
The registrant hereby certifies that it meets all of the requirements for filing on Form 20—F and that it has duly caused and authorized the undersignedto sign this annual Report on its behalf.
ENERSIS S.A.
By: /s/ Ignacio Antoñanzas A.Name: Ignacio Antoñanzas A.Title: Chief Executive Officer
Date: April 4, 2012.
164

Table of Contents
Enersis and Subsidiaries
Audited Consolidated Financial Statements as of December 31, 2011 and 2010 and for each of the three years in the period ended December 31,2011 together with the Reports of Independent Registered Public Accounting Firms

Table of Contents
Enersis S.A. and Subsidiaries
Index to the Audited Consolidated Financial Statements
Reports of Independent Registered Public Accounting Firms:Report of Ernst & Young Servicios Profesionales de Auditoría y Asesorías Limitada — Enersis S.A. 2011 F−1Report of Ernst & Young Servicios Profesionales de Auditoría y Asesorías Limitada — Enersis S.A. — Internal Control over Financial Reporting.2011 F−3Report of Deloitte Auditores y Consultores Ltda. — Enersis S.A. 2010 and 2009 F−5Report of KPMG Auditores Consultores Ltda. — Empresa Nacional de Electricidad S.A. 2011 F−6Report of KPMG Auditores Consultores Ltda. — Empresa Nacional de Electricidad S.A. — Internal Control over Financial Reporting. 2011F−8Report of Ernst & Young Audit Ltda. — Emgesa S.A. E.S.P. 2011 F−10Report of Deloitte & Touch Ltda. — Emgesa S.A. E.S.P. December 31, 2010 and September 30, 2010 F−11Report of Deloitte & Touch Ltda. — Emgesa S.A. E.S.P. 2009 F−12Report of Pistrelli, Henry Martin y Asociados S.R.L., member firm of Ernst & Young Global — Endesa Argentina S.A. 2011 F−13Report of Ernst & Young Terco Auditores Independentes S.S. — Endesa Brasil S.A. 2011 F−15Report of Deloitte Touch Tohmatsu Auditores Independentes — Endesa Brasil S.A. 2010 and 2009 F−16
Consolidated Financial Statements:Consolidated Statements of Financial Position at December 31,2011 and 2010 F−17Consolidated Statements of Comprehensive Income for the years ended December 31, 2011, 2010 and 2009 F−19Consolidated Statements of Changes in Equity for the years ended December 31,2011, 2010 and 2009 F−21Consolidated Statements of Cash Flows for the years ended December 31,2011, 2010 and 2009 F−22Notes to the Consolidated Financial Statements F−23
SCHEDULE I Enersis S.A.’s condensed unconsolidated financial information F−141
Ch$ Chilean pesosUS$ United States dollarsUF The UF is a Chilean inflation−indexed, peso−denominated monetary unit that is set daily in advance based on the previous month’s
inflation rate.ThCh$ Thousand of Chilean pesosThUS$ Thousand of United States dollars

Table of Contents
Report of Independent Registered Public Accounting Firm
The Board of Directors and Shareholders of Enersis S.A.
We have audited the accompanying consolidated balance sheet of Enersis S.A. and subsidiaries (“the Company”) as of December 31, 2011, and the relatedconsolidated statements of income, shareholders’ equity, and cash flows for the year ended December 31, 2011 and the schedule of Enersis S.A.’scondensed unconsolidated financial information. These consolidated financial statements and the schedule are the responsibility of the Company’smanagement. Our responsibility is to express an opinion on these financial statements and the schedule based on our audit. We did not audit the financialstatements of Empresa Nacional De Electricidad S.A. (a subsidiary), certain of its consolidated subsidiaries, certain of its associates accounted for usingequity method and certain of its jointly controlled entities accounted for using proportionate consolidation (hereinafter collectively referred to as“Endesa−Chile”) which statements reflect total assets constituting 34% in 2011, and total revenues constituting 32% in 2011 of the related consolidatedtotals. Those statements were audited by other auditors whose report has been furnished to us, and our opinion, insofar as it relates to the amounts includedfor Endesa−Chile, is based solely on the report of the other auditors.
We conducted our audit in accordance with the standards of the Public Company Accounting Oversight Board (United States). Those standards require thatwe plan and perform the audit to obtain reasonable assurance about whether the financial statements are free of material misstatement. An audit includesexamining, on a test basis, evidence supporting the amounts and disclosures in the financial statements. An audit also includes assessing the accountingprinciples used and significant estimates made by management, as well as evaluating the overall financial statement presentation. We believe that our auditand the report of other auditors provide a reasonable basis for our opinion.
In our opinion, based on our audit and the report of other auditors, the financial statements referred to above present fairly, in all material respects, theconsolidated financial position of Enersis S.A. and subsidiaries at December 31, 2011, and the consolidated results of their operations and their cash flowsfor the year ended December 31, 2011, in conformity with International Financial Reporting Standards (IFRS) as issued by the International AccountingStandards Board (“IASB”). Also, in our opinion, the related condensed unconsolidated information schedule, when considered in relation to the basicconsolidated financial statements, taken as whole, present fairly, in all material respects, the information set forth therein.
F−1

Table of Contents
We also have audited, in accordance with the standards of the Public Company Accounting Oversight Board (United States), Enersis S.A’s internal controlover financial reporting as of December 31, 2011, based on criteria established in Internal Control−Integrated Framework issued by the Committee ofSponsoring Organizations of the Treadway Commission and our report dated March 28, 2012 expressed an unqualified opinion thereon based on our auditand the report of other auditor.
Ernst & Young
Santiago, ChileMarch 28, 2012We also have audited, in accordance with the standards of the Public Company Accounting Oversight Board (United States), Enersis S.A’s internal control over financial reporting as of December 31,2011, based on criteria established in Internal Control−Integrated Framework issued by the Committee of Sponsoring Organizations of the Treadway Commission and our report dated March 28, 2012 expressed based on ouraudit and the report of other auditor. Ernst & Young Santiago, Chile March 28, 2012
F−2

Table of Contents
Report of Independent Registered Public Accounting Firm
The Board of Directors and Shareholders of Enersis S.A.
We have audited the internal control over financial reporting of Enersis S.A. and subsidiaries (“the Company”) as of December 31, 2011, based on criteriaestablished in Internal Control—Integrated Framework issued by the Committee of Sponsoring Organizations of the Treadway Commission (the COSOcriteria). The Company’s management is responsible for maintaining effective internal control over financial reporting, and for its assessment of theeffectiveness of internal control over financial reporting included in the accompanying Management’s Annual Report on Internal Control Over FinancialReporting. Our responsibility is to express an opinion on the company’s internal control over financial reporting based on our audit. We did not examine theeffectiveness of internal control over financial reporting of Empresa Nacional De Electricidad S.A. (a subsidiary) and certain of its subsidiaries, associatesand jointly controlled entities (hereinafter collectively referred to as “Endesa−Chile”) which statements reflect total assets constituting 34% in 2011, andtotal revenues constituting 32% in 2011 of the related consolidated totals. The effectiveness of Endesa−Chile’s internal control over financial reporting wasaudited by other auditors whose report has been furnished to us, and our opinion, insofar as it relates to the effectiveness of Endesa−Chile’s internal controlover financial reporting, is based solely on the report of the other auditors.
We conducted our audit in accordance with the standards of the Public Company Accounting Oversight Board (United States). Those standards require thatwe plan and perform the audit to obtain reasonable assurance about whether effective internal control over financial reporting was maintained in all materialrespects. Our audit included obtaining an understanding of internal control over financial reporting, assessing the risk that a material weakness exists, testingand evaluating the design and operating effectiveness of internal control based on the assessed risk, and performing such other procedures as we considerednecessary in the circumstances. We believe that our audit provides a reasonable basis for our opinion.
A company’s internal control over financial reporting is a process designed to provide reasonable assurance regarding the reliability of financial reportingand the preparation of financial statements for external purposes in accordance with generally accepted accounting principles. A company’s internal controlover financial reporting includes those policies and procedures that (1) pertain to the maintenance of records that, in reasonable detail, accurately and fairlyreflect the transactions and dispositions of the assets of the company; (2) provide reasonable assurance that transactions are recorded as necessary to permitpreparation of financial statements inErnst & Young Chile Av. Presidente Riesco 5435, piso 4 Santiago Tel: 56 2 676 1000 Fax: 56 2 676 1010 www.ey.com/cl Report of Independent Registered PublicAccounting Firm The Board of Directors and Shareholders of Enersis S.A. We have audited the internal control over financial reporting of Enersis S.A. and subsidiaries (“the Company”) as of December 31, 2011, based oncriteria established in Internal Control—Integrated Framework issued by the Committee of Sponsoring Organizations of the Treadway Commission (the COSO criteria). The Company’s management is responsible formaintaining effective internal control over financial reporting, and for its assessment of the effectiveness of internal control over financial reporting included in the accompanying Management’s Annual Report on InternalControl Over Financial Reporting. Our responsibility is to express an opinion on the company’s internal control over financial reporting based on our audit. We did not examine the effectiveness of internal control overfinancial reporting of Empresa Nacional De Electricidad S.A. (a subsidiary) and certain of its subsidiaries, associates and jointly controlled entities (hereinafter collectively referred to as “Endesa−Chile”) which statementsreflect total assets constituting 34% in 2011, and total revenues constituting 32% in 2011 of the related consolidated totals. The effectiveness of Endesa−Chile’s internal control over financial reporting was audited by otherauditors whose report has been furnished to us, and our opinion, insofar as it relates to the effectiveness of Endesa−Chile’s internal control over financial reporting, is based solely on the report of the other auditors. Weconducted our audit in accordance with the standards of the Public Company Accounting Oversight Board (United States). Those standards require that we plan and perform the audit to obtain reasonable assurance aboutwhether effective internal control over financial reporting was maintained in all material respects. Our audit included obtaining an understanding of internal control over financial reporting, assessing the risk that a materialweakness exists, testing and evaluating the design and operating effectiveness of internal control based on the assessed risk, and performing such other procedures as we considered necessary in the circumstances. We believethat our audit provides a reasonable basis for our opinion. A company’s internal control over financial reporting is a process designed to provide reasonable assurance regarding the reliability of financial reporting and thepreparation of financial statements for external purposes in accordance with generally accepted accounting principles. A company’s internal control over financial reporting includes those policies and procedures that (1)pertain to the maintenance of records that, in reasonable detail, accurately and fairly reflect the transactions and dispositions of the assets of the company; (2) provide reasonable assurance that transactions are recorded asnecessary to permit preparation of financial statements in
F−3

Table of Contents
accordance with generally accepted accounting principles, and that receipts and expenditures of the company are being made only in accordance withauthorizations of management and directors of the company; and (3) provide reasonable assurance regarding prevention or timely detection of unauthorizedacquisition, use, or disposition of the company’s assets that could have a material effect on the financial statements.
Because of its inherent limitations, internal control over financial reporting may not prevent or detect misstatements. Also, projections of any evaluation ofeffectiveness to future periods are subject to the risk that controls may become inadequate because of changes in conditions, or that the degree ofcompliance with the policies or procedures may deteriorate.
In our opinion, based on our audit and the report of other auditors, Enersis S.A. and subsidiaries maintained, in all material respects, effective internalcontrol over financial reporting as of December 31, 2011, based on the COSO criteria.
We also have audited, in accordance with the standards of the Public Company Accounting Oversight Board (United States), the consolidated balancesheets of Enersis S.A. and subsidiaries as of December 31, 2011, and the related consolidated statements of income, shareholders’ equity, and cash flows forthe year ended December 31, 2011 of Enersis S.A. and subsidiaries and the schedule of Enersis S.A.’s condensed unconsolidated financial information andour report dated March 28, 2012 expressed an unqualified opinion thereon based on our audit and the report of other auditors.
Ernst & Young
Santiago, ChileMarch 28, 2012accordance with generally accepted accounting principles, and that receipts and expenditures of the company are being made only in accordance with authorizations of management and directors of thecompany; and (3) provide reasonable assurance regarding prevention or timely detection of unauthorized acquisition, use, or disposition of the company’s assets that could have a material effect on the financial statements.Because of its inherent limitations, internal control over financial reporting may not prevent or detect misstatements. Also, projections of any evaluation of effectiveness to future periods are subject to the risk that controls maybecome inadequate because of changes in conditions, or that the degree of compliance with the policies or procedures may deteriorate. In our opinion, based on our audit and the report of other auditors, Enersis S.A. andsubsidiaries maintained, in all material respects, effective internal control over financial reporting as of December 31, 2011, based on the COSO criteria. We also have audited, in accordance with the standards of the PublicCompany Accounting Oversight Board (United States), the consolidated balance sheets of Enersis S.A. and subsidiaries as of December 31, 2011, and the related consolidated statements of income, shareholders’ equity, andcash flows for the year ended December 31, 2011 of Enersis S.A. and subsidiaries and the schedule of Enersis S.A.’s condensed unconsolidated financial information and our report dated March 28, 2012 expressed anunqualified opinion thereon based on our audits and the report of other auditors. Ernst & Young Santiago, Chile March 28, 2012
F−4
Table of Contents
REPORT OF INDEPENDENT REGISTERED PUBLIC ACCOUNTING FIRM
To the Board of Directors and Stockholders ofEnersis S.A.:
We have audited the accompanying consolidated statements of financial position of Enersis S.A. and subsidiaries (the “Company”) as of December 31,2010, and the related consolidated statements of comprehensive income, changes in equity, and cash flows for each of the two years then ended, and theschedule of Enersis S.A.´s condensed unconsolidated financial information for each of the two years ended December 31, 2010. These consolidatedfinancial statements and the schedules are the responsibility of the Company’s management. Our responsibility is to express an opinion on theseconsolidated financial statements and the schedule based on our audits. We did not audit the financial statements of Empresa Nacional de Electricidad S.A.(a subsidiary), certain of its consolidated subsidiaries, certain of its associates accounted for using the equity method and certain of its jointly controlledentities accounted for using proportionate consolidation (hereinafter collectively referred to as “Endesa−Chile”), which statements reflect total assetsconstituting 35.01% of the Company’s consolidated total assets as of December 31, 2010 , and total revenues constituting 27.31% and 24.03% of theCompany’s consolidated total revenues for the years ended December 31, 2010 and 2009, respectively. Those financial statements were audited by otherauditors whose reports have been furnished to us, and our opinion, insofar as it relates to the amounts included for Endesa−Chile, is based solely on thereports of the other auditors.
We conducted our audits in accordance with the standards of the Public Company Accounting Oversight Board (United States of America). Those standardsrequire that we plan and perform the audit to obtain reasonable assurance about whether the financial statements are free of material misstatement. An auditincludes examining, on a test basis, evidence supporting the amounts and disclosures in the financial statements. An audit also includes assessing theaccounting principles used and significant estimates made by management, as well as evaluating the overall financial statement presentation. We believethat our audits and the reports of the other auditors provide a reasonable basis for our opinion.
In our opinion, based on our audits and the reports of the other auditors, such consolidated financial statements present fairly, in all material respects, theconsolidated financial position of Enersis S.A. and subsidiaries as of December 31, 2010, and the consolidated results of their operations and their cashflows for each of the two years then ended, in conformity with International Financial Reporting Standards (IFRS) as issued by the International AccountingStandards Board (‘‘IASB’’). Also, in our opinion, the related condensed unconsolidated information schedule for each of the two years ended December 31,2010, when considered in relation to the basic consolidated financial statements, taken as whole, present fairly, in all material respects, the information setforth therein.
Santiago, ChileApril 27, 2011
F−5

Table of Contents
Report of Independent Registered Public Accounting Firm
The Board of Directors and Shareholders ofEmpresa Nacional de Electricidad S.A. (Endesa−Chile):
We have audited the accompanying consolidated statements of financial position of Endesa−Chile and subsidiaries (the Company) as of December 31, 2011and 2010, and the related consolidated statements of comprehensive income, changes in equity, and cash flows for each of the years in the three−year periodended December 31, 2011. These consolidated financial statements are the responsibility of the Company’s management. Our responsibility is to express anopinion on these consolidated financial statements based on our audits. We did not audit the financial statements of certain subsidiaries which statementsreflect total assets constituting 30.05 percent and 22.51 percent of the Company’s consolidated total asset position as of December 31, 2011 and 2010,respectively, and total revenues constituting 35.29 percent, 20.04 percent and 20.10 percent of the Company’s consolidated revenues for the years endedDecember 31, 2011, 2010 and 2009, respectively. In addition, we did not audit the financial statements of Endesa Brasil S.A. (a 40.45% percent ownerinvestee Company). The Company’s investment in Brazil at December 31, 2011and 2010 was M$ 569,012,759 and M$566,846,731 as of December 31,2011 and 2010, respectively, and its equity earning was M$115,355,267, M$90,667,296 and M$96,139,414 for the years ended December 31, 2011, 2010and 2009, respectively. Those consolidated financial statements prepared in accordance with the local statutory accounting basis were audited by otherauditors whose reports have been furnished to us and our opinion, insofar as it relates to the amounts included for those entities on such basis of accounting,is based solely on the reports of the other auditors. Accordingly, we have audited the conversion adjustments to the financial statements of these subsidiariesand nonsubsidiary investees prepared in accordance with the local statutory accounting basis to conform them to the Company’s accounting basis referred tobelow.
We conducted our audits in accordance with the standards of the Public Company Accounting Oversight Board (United States). Those standards require thatwe plan and perform the audit to obtain reasonable assurance about whether the consolidated financial statements are free of material misstatement. Anaudit includes examining, on a test basis, evidence supporting the amounts and disclosures in the consolidated financial statements. An audit also includesassessing the accounting principles used and significant estimates made by management, as well as evaluating the overall financial statement presentation.We believe that our audits and the reports of the other auditors provide a reasonable basis for our opinion.
In our opinion, based on our audits and the reports of the other auditors, the consolidated financial statements referred to above present fairly, in all materialrespects, the financial position of Endesa−Chile and subsidiaries as of December 31, 2011 and 2010, and the results of their operations and their cash flowsfor each of the years in the three−year period ended December 31, 2011, in conformity with International Financial Reporting Standards (IFRS) as issued bythe International Accounting Standards Board (IASB).
© 2012 KPMG Auditores Consultores Ltda., a Chilean limited liability partnership and a member firm of the KPMG network of independent member firms affiliated with KPMG International Cooperative (“KPMGInternational”), a Swiss entity. All rights reserved.©
F−6
Table of Contents
We also have audited, in accordance with the standards of the Public Company Accounting Oversight Board (United States), Endesa−Chile’s internalcontrol over financial reporting as of December 31, 2011, based on the criteria established in Internal Control — Integrated Framework issued by theCommittee of Sponsoring Organizations of the Treadway Commission (COSO), and our report dated March 28, 2012, expressed an unqualified opinion onthe effectiveness of the Company’s internal control over financial reporting.
KPMG Auditores Consultores Ltda.
Santiago, Chile
March 28, 2012
© 2012 KPMG Auditores Consultores Ltda., a Chilean limited liability partnership and a member firm of the KPMG network of independent member firms affiliated with KPMG International Cooperative (“KPMGInternational”), a Swiss entity. All rights reserved.©
F−7

Table of Contents
Report of Independent Registered Public Accounting Firm
The Board of Directors and Shareholders ofEmpresa Nacional de Electricidad S.A. (Endesa−Chile):
We have audited Endesa−Chile’s internal control over financial reporting as of December 31, 2011, based on criteria established in Internal Control −Integrated Framework issued by the Committee of Sponsoring Organizations of the Treadway Commission (COSO). Endesa−Chile’s management isresponsible for maintaining effective internal control over financial reporting and for its assessment of the effectiveness of internal control over financialreporting, included in the accompanying Management’s Annual Report on Internal Control over Financial Reporting. Our responsibility is to express anopinion on Endesa−Chile’s internal control over financial reporting based on our audit.
We conducted our audit in accordance with the standards of the Public Company Accounting Oversight Board (United States). Those standards require thatwe plan and perform the audit to obtain reasonable assurance about whether effective internal control over financial reporting was maintained in all materialrespects. Our audit included obtaining an understanding of internal control over financial reporting, assessing the risk that a material weakness exists, andtesting and evaluating the design and operating effectiveness of internal control based on the assessed risk. Our audit also included performing such otherprocedures as we considered necessary in the circumstances. We believe that our audit provides a reasonable basis for our opinion.
A company’s internal control over financial reporting is a process designed to provide reasonable assurance regarding the reliability of financial reportingand the preparation of financial statements for external purposes in accordance with generally accepted accounting principles. A company’s internal controlover financial reporting includes those policies and procedures that (1) pertain to the maintenance of records that, in reasonable detail, accurately and fairlyreflect the transactions and dispositions of the assets of the company; (2) provide reasonable assurance that transactions are recorded as necessary to permitpreparation of financial statements in accordance with generally accepted accounting principles, and that receipts and expenditures of the company are beingmade only in accordance with authorizations of management and directors of the company; and (3) provide reasonable assurance regarding prevention ortimely detection of unauthorized acquisition, use, or disposition of the company’s assets that could have a material effect on the financial statements.
Because of its inherent limitations, internal control over financial reporting may not prevent or detect misstatements. Also, projections of any evaluation ofeffectiveness to future periods are subject to the risk that controls may become inadequate because of changes in conditions, or that the degree ofcompliance with the policies or procedures may deteriorate.
In our opinion, Endesa−Chile maintained, in all material respects, effective internal control over financial reporting as of December 31, 2011, based oncriteria established in Internal Control — Integrated Framework issued by the Committee of Sponsoring Organizations of the Treadway Commission.
© 2012 KPMG Auditores Consultores Ltda., a Chilean limited liability partnership and a member firm of the KPMG network of independent member firms affiliated with KPMG International Cooperative (“KPMGInternational”), a Swiss entity. All rights reserved.©2012 KPMG Auditores Consultores Ltda., a Chilean limited liability partnership and a member firm of the KPMG network of independent member firms affiliated withKPMG International Cooperative ("KPMG International"), a Swiss entity. All rights reserved. Report of Independent Registered Public Accounting Firm The Board of Directors and Shareholders of Empresa Nacional deElectricidad S.A. (Endesa−Chile): We have audited Endesa−Chile's internal control over financial reporting as of December 31, 2011, based on criteria established in Internal Control − Integrated Framework issued by theCommittee of Sponsoring Organizations of the Treadway Commission (COSO). Endesa−Chile's management is responsible for maintaining effective internal control over financial reporting and for its assessment of theeffectiveness of internal control over financial reporting, included in the accompanying Management's Annual Report on Internal Control over Financial Reporting. Our responsibility is to express an opinion onEndesa−Chile's internal control over financial reporting based on our audit. We conducted our audit in accordance with the standards of the Public Company Accounting Oversight Board (United States). Those standardsrequire that we plan and perform the audit to obtain reasonable assurance about whether effective internal control over financial reporting was maintained in all material respects. Our audit included obtaining an understandingof internal control over financial reporting, assessing the risk that a material weakness exists, and testing and evaluating the design and operating effectiveness of internal control based on the assessed risk. Our audit alsoincluded performing such other procedures as we considered necessary in the circumstances. We believe that our audit provides a reasonable basis for our opinion. A company's internal control over financial reporting is aprocess designed to provide reasonable assurance regarding the reliability of financial reporting and the preparation of financial statements for external purposes in accordance with generally accepted accounting principles. Acompany's internal control over financial reporting includes those policies and procedures that (1) pertain to the maintenance of records that, in reasonable detail, accurately and fairly reflect the transactions and dispositions ofthe assets of the company; (2) provide reasonable assurance that transactions are recorded as necessary to permit preparation of financial statements in accordance with generally accepted accounting principles, and thatreceipts and expenditures of the company are being made only in accordance with authorizations of management and directors of the company; and (3) provide reasonable assurance regarding prevention or timely detection ofunauthorized acquisition, use, or disposition of the company's assets that could have a material effect on the financial statements. Because of its inherent limitations, internal control over financial reporting may not prevent ordetect misstatements. Also, projections of any evaluation of effectiveness to future periods are subject to the risk that controls may become inadequate because of changes in conditions, or that the degree of compliance withthe policies or procedures may deteriorate. In our opinion, Endesa−Chile maintained, in all material respects, effective internal control over financial reporting as of December 31, 2011, based on criteria established in InternalControl — Integrated Framework issued by the Committee of Sponsoring Organizations of the Treadway Commission.
F−8

Table of Contents
We also have audited, in accordance with the standards of the Public Company Accounting Oversight Board (United States), the consolidated statement offinancial position of Endesa−Chile and subsidiaries as of December 31, 2011 and 2010, and the related consolidated statements of comprehensive income,changes in stockholder’s equity, and cash flows for each of years in the three−year period ended December 31, 2011, and our report dated March 28, 2012expressed an unqualified opinion on those consolidated financial statements.
KPMG Auditores Consultores Ltda.
Santiago, Chile
March 28, 2012
© 2012 KPMG Auditores Consultores Ltda., a Chilean limited liability partnership and a member firm of the KPMG network of independent member firms affiliated with KPMG International Cooperative (“KPMGInternational”), a Swiss entity. All rights reserved.©
F−9

Table of Contents
Report of Independent Registered Public Accounting Firm
The Board of Directors and Shareholders of Emgesa S.A. E.S.P
We have audited the accompanying consolidated balance sheet of Emgesa S.A. E.S.P. and its Subsidiary (“the Company”) as of December 31, 2011, and therelated consolidated statements of income, shareholders’ equity and cash flows for the year then ended. These consolidated financial statements are theresponsibility of the Company’s management. Our responsibility is to express an opinion on these consolidated financial statements based on our audit.
We conducted our audit in accordance with the standards of the Public Company Accounting Oversight Board (United States). Those standards require thatwe plan and perform the audit to obtain reasonable assurance about whether the financial statements are free of material misstatement. We were not engagedto perform an audit of the Company’s internal control over financial reporting. Our audit included consideration of internal control over financial reportingas a basis for designing audit procedures that are appropriate in the circumstances, but not for the purpose of expressing an opinion on the effectiveness ofthe Company’s internal control over financial reporting. Accordingly, we express no such opinion. An audit also includes examining, on a test basis,evidence supporting the amounts and disclosures in the financial statements, assessing the accounting principles used and significant estimates made bymanagement, and evaluating the overall financial statement presentation. We believe that our audit provides a reasonable basis for our opinion.
In our opinion, the consolidated financial statements referred to above present fairly, in all material respects, the financial position of Emgesa S.A. E.S.P.and its subsidiary at December 31, 2011, and the results of its operations and its cash flows for the year then ended, in conformity with accounting practicesgenerally accepted in Colombia.
Ernst & YoungBogotá, ColombiaFebrary 14, 2012
F−10

Table of Contents
REPORT OF INDEPENDENT REGISTERED PUBLIC ACCOUNTING FIRM
To the Board of Directors and Shareholders ofEmgesa S.A. E.S.P.:
We have audited the balance sheet of EMGESA S.A. E.S.P. (the “Company”) as of December 31, 2010, and the statements of income, shareholders’ equityand cash flows for the three month period ended December 31, 2010 and the nine month period ended September 30, 2010. These financial statements arethe responsibility of the Company’s management (none of which are included herein). Our responsibility is to express an opinion on these financialstatements based on our audits.
We conducted our audits in accordance with the standards of the Public Company Accounting Oversight Board (United States of America). Those standardsrequire that we plan and perform the audit to obtain reasonable assurance about whether the financial statements are free of material misstatement. TheCompany is not required to have, nor were we engaged to perform, an audit of its internal control over financial reporting. Our audits included considerationof internal control over financial reporting as a basis for designing audit procedures that are appropriate in the circumstances, but not for the purpose ofexpressing an opinion on the effectiveness of the Company’s internal control over financial reporting. Accordingly, we express no such opinion. An auditalso includes examining, on a test basis, evidence supporting the amounts and disclosures in the financial statements, assessing the accounting principlesused and significant estimates made by management, as well as evaluating the overall financial statement presentation. We believe that our audit provides areasonable basis for our opinion.
In our opinion, such financial statements present fairly, in all material respects, the financial position of EMGESA S.A. E.S.P. as of December 31, 2010, andthe results of its operations and its cash flows for the three month period ended December 31, 2010 and the nine month period ended September 30, 2010 inconformity with accounting principles generally accepted in Colombia.
Deloitte & Touche Ltda.
Bogotá, ColombiaMarch 25, 2011
F−11

Table of Contents
REPORT OF INDEPENDENT REGISTERED PUBLIC ACCOUNTING FIRM
To the Board of Directors and Shareholders ofEmgesa S.A. E.S.P.:
We have audited the statements of income, shareholders’ equity and cash flows of EMGESA S.A. E.S.P. (the “Company”) for the year ended December 31,2009, (none of which are included herein). These financial statements are the responsibility of the Company’s management. Our responsibility is to expressan opinion on these financial statements based on our audits.
We conducted our audits in accordance with the standards of the Public Company Accounting Oversight Board (United States of America). Those standardsrequire that we plan and perform the audit to obtain reasonable assurance about whether the financial statements are free of material misstatement. TheCompany is not required to have, nor were we engaged to perform, an audit of its internal control over financial reporting. Our audits included considerationof internal control over financial reporting as a basis for designing audit procedures that are appropriate in the circumstances, but not for the purpose ofexpressing an opinion on the effectiveness of the Company’s internal control over financial reporting. Accordingly, we express no such opinion. An auditalso includes examining, on a test basis, evidence supporting the amounts and disclosures in the financial statements, assessing the accounting principlesused and significant estimates made by management, as well as evaluating the overall financial statement presentation. We believe that our audit provides areasonable basis for our opinion.
In our opinion, such financial statements present fairly, in all material respects, the results of operations and cash flows of EMGESA S.A. E.S.P. for the yearended December 31, 2009 in conformity with accounting principles generally accepted in Colombia.
Deloitte & Touche Ltda.
Bogotá, ColombiaMarch 25, 2011
F−12

Table of Contents
Report of Independent Registered Public Accounting Firm
To the Board of Directors of Endesa Argentina S.A.:
We have audited the accompanying consolidated balance sheet of Endesa Argentina S.A. and subsidiaries as of December 31, 2011, and the relatedconsolidated statements of income, shareholders’ equity, and cash flows for the year then ended. These financial statements are the responsibility of theCompany’s management. Our responsibility is to express an opinion on these financial statements based on our audit.
We conducted our audit in accordance with the standards of the Public Company Accounting Oversight Board (United States of America). Those standardsrequire that we plan and perform the audit to obtain reasonable assurance about whether the financial statements are free of material misstatement. We werenot engaged to perform an audit of the Company’s internal control over financial reporting. Our audit included consideration of internal control overfinancial reporting as a basis for designing audit procedures that are appropriate in the circumstances, but not for the purpose of expressing an opinion onthe effectiveness of the Company’s internal control over financial reporting. Accordingly, we express no such opinion. An audit also includes examining,on a test basis, evidence supporting the amounts and disclosures in the financial statements, assessing the accounting principles used and significantestimates made by management, and evaluating the overall financial statement presentation. We believe that our audit provides a reasonable basis for ouropinion.
In our opinion, the financial statements referred to above present fairly, in all material respects, the consolidated financial position of Endesa Argentina S.A.and subsidiaries at December 31, 2011, and the consolidated results of their operations and their cash flows for the year then ended, in conformity withaccounting principles generally accepted in the Buenos Aires City, Argentine Republic.
1
F−13

Table of Contents
As mentioned in note 1. to the accompanying financial statements, the Company’s subsidiary Endesa Costanera S.A. has recurring losses and a workingcapital deficiency, a situation which, as explained in the note, Endesa Costanera S.A.´s management expects will be reversed to the extent that there is afavorable resolution to the requests made to regulators for the increase in the tariff prices of energy and power to spot market prices. These circumstancesraise substantial doubt about Endesa Costanera S.A.´s ability to continue as a going concern. The financial statements referred to above have been preparedassuming Endesa Costanera S.A. will continue as a going concern and, accordingly, do not include any adjustments to reflect the possible future effects onthe recoverability and classification of assets or the amounts and classification of liabilities that may result from the outcome of these uncertainties.
March 23, 2012Buenos Aires, Argentina
/S/ PISTRELLI, HENRY MARTIN Y ASOCIADOS S.R.L.Member of Ernst & Young Global
2
F−14

Table of Contents
Report of independent registered public accounting firm
To the Board of Directors and Shareholders ofEndesa Brasil S.A.
We have audited the accompanying consolidated balance sheet of Endesa Brasil S.A. and subsidiaries (the “Company”) as of December 31, 2011, and therelated consolidated statements of income, comprehensive income, shareholders’ equity and cash flows for the year then ended. These consolidatedfinancial statements are the responsibility of the Company’s management. Our responsibility is to express an opinion on these consolidated financialstatements based on our audit.
We conducted our audit in accordance with the standards of the Public Company Accounting Oversight Board (United States). Those standards require thatwe plan and perform the audit to obtain reasonable assurance about whether the financial statements are free of material misstatement. We were not engagedto perform an audit of the Company’s internal control over financial reporting. Our audit included consideration of internal control over financial reportingas a basis for designing audit procedures that are appropriate in the circumstances, but not for the purpose of expressing an opinion on the effectiveness ofthe Company’s internal control over financial reporting. Accordingly, we express no such opinion. An audit also includes examining, on a test basis,evidence supporting the amounts and disclosures in the financial statements, assessing the accounting principles used and significant estimates made bymanagement, and evaluating the overall financial statement presentation. We believe that our audit provides a reasonable basis for our opinion.
In our opinion, the consolidated financial statements referred to above present fairly, in all material respects, the consolidated financial position of EndesaBrasil S.A. and subsidiaries at December 31, 2011, and the consolidated results of their operations and their cash flows for the year then ended, inconformity with accounting practices generally accepted in Brazil.
ERNST & YOUNG TERCOAuditores Independentes S.S.
Márcio F. OstwaldPartnerRio de Janeiro, March 27, 2012
Uma empresa−membro da Ernst & Young Global Limited
F−15

Table of Contents
REPORT OF INDEPENDENT REGISTERED PUBLIC ACCOUNTING FIRM
To the Board of Directors and Shareholders ofEndesa Brasil S.A.Niterói − RJ
We have audited the accompanying consolidated balance sheet of Endesa Brasil S.A., and subsidiaries (the “Company”) as of December 31, 2010, and therelated consolidated statement of income, statement of comprehensive income, changes in equity and cash flows for each of the two years in the periodended December 31, 2010 and 2009. These financial statements, prepared in accordance with accounting practice adoptedin Brazil and presented inBrazilian reais, are the responsibility of the Company’s Management. Our responsibility is to express an opinion on these financial statements based on ouraudits.
We conducted our audits in accordance with the auditing standards of the Public Company Accounting Oversight Board (United States). Those standardsrequire that we plan and perform the audit to obtain reasonable assurance about whether the financial statements are free of material misstatement. TheCompany is not required to have, nor were we engaged to perform, an audit of its internal control over financial reporting. Our audits included considerationof internal control over financial reporting as a basis for designing audit procedures that are appropriate in the circumstances, but not for the purpose ofexpressing an opinion on the effectiveness of the Company’s internal control over financial reporting. Accordingly, we express no such opinion. An auditalso includes examining, on a test basis, evidence supporting the amounts and disclosures in the financial statements, assessing the accounting principlesused and significant estimates made by management, as well as evaluating the overall financial statement presentation. We believe that our audits provide areasonable basis for our opinion.
In our opinion, such consolidated financial statements present fairly, in all material respects, the financial position of Endesa Brasil S.A. and subsidiaries asof December 31, 2010 and the results of their operations and their cash flows for each of the two years in the period ended December 31, 2010 and 2009 inaccordance with accounting practices adopted in Brazil.
DELOITTE TOUCHE TOHMATSUAuditores Independentes
Rio de JaneiroApril 26, 2011
Deloitte refers to one or more of Deloitte Touche Tohmatsu Limited, a UK private company limited by guarantee, and its network of member firms, each ofwhich is a legally separate and independent entity. Please see www.deloitte.com/about for a detailed description of the legal structure of Deloitte ToucheTohmatsu Limited and its member firms.
© Deloitte Touche Tohmatsu. All rights reserved.
F−16

Table of Contents
ENERSIS S.A. AND SUBSIDIARIES
Consolidated Statements of Financial PositionAt December 31, 2011 and 2010
(In thousands of Chilean pesos — ThCh$)
12−31−2011 12−31−2010Note ThCh$ ThCh$
ASSETS
CURRENT ASSETS
Cash and cash equivalents 5 1,219,921,268 961,355,037Other current financial assets 6 939,220 7,817,509Other current non−financial assets 72,466,312 35,993,248Trade and other current receivables 7 977,602,388 1,038,098,240Accounts receivable from related companies 8 35,282,592 20,471,607Inventories 9 77,925,544 62,651,704Current tax assets 10 141,827,684 137,987,341Total current assets other than assets classified as held for sale and discontinued
operations 2,525,965,008 2,264,374,686
Non−current assets classified as held for sale and discontinued operations 11 — 73,893,290Non−current assets classified as held for sale and discontinued operations — 73,893,290
TOTAL CURRENT ASSETS 2,525,965,008 2,338,267,976
NON−CURRENT ASSETS
Other non−current financial assets 6 37,355,061 62,968,722Other non−current non−financial assets 109,501,108 103,736,295Non−current receivables 7 443,328,450 319,567,960Investments accounted for using the equity method 12 13,193,262 14,101,652Intangible assets other than goodwill 13 1,467,398,214 1,452,586,405Goodwill 14 1,476,404,126 1,477,021,924Property, plant, and equipment, net 15 7,242,731,006 6,751,940,655Investment property 16 38,055,889 33,019,154Deferred tax assets 17 379,938,628 452,634,364
TOTAL NON−CURRENT ASSETS 11,207,905,744 10,667,577,131
TOTAL ASSETS 13,733,870,752 13,005,845,107
The attached notes are an integral part of these consolidated financial statements
F−17

Table of Contents
ENERSIS S.A. AND SUBSIDIARIES
Consolidated Statements of Financial PositionAt December 31, 2011 and 2010
(In thousands of Chilean pesos — ThCh$)
12−31−2011 12−31−2010Note ThCh$ ThCh$
LIABILITIES AND EQUITY
CURRENT LIABILITIES
Other current financial liabilities 18 672,082,338 665,598,018Trade and other current payables 21 1,235,064,459 1,224,489,998Accounts payable to related companies 8 157,177,638 148,202,260Other current provisions 22 99,702,654 115,449,236Current tax liabilities 10 235,853,242 147,666,655Current provisions for employee benefits 23 — 5,450,382Other current non−financial liabilities 60,653,304 35,790,548Total current liabilities other than those associated with current assets classified
as held for sale and discontinued operations 2,460,533,635 2,342,647,097
Liabilities associated with current assets classified as held for sale and discontinuedoperations 11 — 64,630,389
TOTAL CURRENT LIABILITIES 2,460,533,635 2,407,277,486
NON−CURRENT LIABILITIES
Other non−current financial liabilities 18 3,271,355,293 3,014,956,447Other non−current payables 21 14,304,607 37,236,712Non−current accounts payable to related companies 8 — 1,084,290Other long−term provisions 22 202,573,641 225,522,329Deferred tax liabilities 17 508,438,255 555,923,578Non−current provisions for employee benefits 23 277,526,013 215,818,975Other non−current non−financial liabilities 102,985,451 33,997,334
TOTAL NON−CURRENT LIABILITIES 4,377,183,260 4,084,539,665
TOTAL LIABILITIES 6,837,716,895 6,491,817,151
EQUITYIssued capital 24.1 2,824,882,835 2,824,882,835Retained earnings 2,232,968,880 2,103,689,509Share premium 24.1 158,759,648 158,759,648Other reserves 24.5 (1,320,882,757) (1,351,787,356)
Equity attributable to the owners of the parent company 3,895,728,606 3,735,544,636
Non−controlling interest 24.6 3,000,425,251 2,778,483,320
TOTAL EQUITY 6,896,153,857 6,514,027,956
TOTAL LIABILITIES AND EQUITY 13,733,870,752 13,005,845,107
The attached notes are an integral part of these consolidated financial statements
F−18

Table of Contents
ENERSIS S.A. AND SUBSIDIARIES
Consolidated Statements of Comprehensive IncomeFor the years ended December 31, 2011, 2010 and 2009(In thousands of Chilean pesos)
Years ended December 31,2011 2010 2009
Note ThCh$ ThCh$ ThCh$STATEMENT OF COMPREHENSIVE INCOME
Net incomeSales 25 6,254,252,089 6,179,229,824 6,113,283,615Other operating income 25 280,628,255 384,351,289 358,772,038
Total Revenues 6,534,880,344 6,563,581,113 6,472,055,653
Raw materials and consumables used 26 (3,538,434,729) (3,521,646,254) (3,210,593,577)Contribution Margin 2.996.445.615 3,041,934,859 3,261,462,076
Other work performed by the entity and capitalized 50,173,112 44,869,365 33,730,519Employee benefits expenses 27 (378,552,126) (374,678,013) (370,402,445)Depreciation and amortization expense 28 (424,900,036) (449,017,275) (454,369,959)Reversal of impairment loss (impairment loss) recognized in the
year’s profit or loss 28 (136,157,459) (108,373,429) (85,285,525)Other expenses 29 (540,698,397) (450,434,769) (457,689,197)
Operating Income 1,566,310,709 1,704,300,738 1,927,445,469
Other gains (losses) 30 (4,814,294) 11,983,434 50,640,278Financial income 31 233,612,869 171,236,948 159,670,405Financial costs 31 (465,411,363) (438,358,251) (482,472,627)Share of profit (loss) of associates accounted for using the equity
method 12 8,465,904 1,015,739 2,235,579Foreign currency exchange differences 31 20,305,690 11,572,474 (8,235,253)Profit (loss) from indexed assets and liabilities 31 (25,092,203) (15,055,706) 21,781,329
Net Income before tax 1,333,377,312 1,446,695,376 1,671,065,180Income tax 32 (460,836,692) (346,006,968) (359,737,610)
Net income from continuing operations 872,540,620 1,100,688,408 1,311,327,570Net income from discontinued operations — — —
NET INCOME 872,540,620 1,100,688,408 1,311,327,570
Net income attributable toOwners of parent company 375,471,254 486,226,814 660,231,043Non−controlling interests 497,069,366 614,461,594 651,096,527NET INCOME 872,540,620 1,100,688,408 1,311,327,570
Basic earnings per share
Basic earnings per share from continuing operations Ch$/ share 11.50 14.89 20.22
Basic earnings per share Ch$/ share 11.50 14.89 20.22
Diluted earnings per share
Diluted earnings per share from continuing operations Ch$/ share 11.50 14.89 20.22
Diluted earnings per share Ch$/ share 11.50 14.89 20.22
The attached notes are an integral part of these consolidated financial statements
F−19

Table of Contents
ENERSIS S.A. AND SUBSIDIARIES
Consolidated Statements of Comprehensive IncomeFor the years ended December 31, 2011, 2010 and 2009(In thousands of Chilean pesos)
Years ended December 31,2011 2010 2009
Note ThCh$ ThCh$ ThCh$
STATEMENT OF COMPREHENSIVE INCOME
Net Income 872,540,620 1,100,688,408 1,311,327,570
Components of other comprehensive income, before taxes
Exchange differences on translationForeign currency translation gains (losses), before taxes 211,929,739 (138,554,045) (246,854,956)
Total exchange differences on translation 211,929,739 (138,554,045) (246,854,956)
Available−for−sale financial assetsGains (losses) from measuring of available−for−sale financial assets,
before taxes (55,959) (179) 61,031Total available−for−sale financial assets (55,959) (179) 61,031
Cash flow hedgeGains (losses) from cash flow hedge, before taxes (79,722,581) 50,576,145 201,567,024Reclassification adjustments on cash flow hedge, before taxes (8,309,911) (19,664,842) (8,765,356)
Total cash flow hedge (88,032,492) 30,911,303 192,801,668
Actuarial gains (losses) on defined benefit plans (62,246,623) (48,495,375) (15,599,453)Total other components of other comprehensive income, before
taxes 61,594,665 (156,138,296) (69,591,710)
Income tax related to components of other comprehensive incomeIncome tax related to available−for−sale financial assets 9,513 31 (10,528)Income tax related to cash flow hedge 14,110,400 (5,301,050) (33,917,966)Income tax related to defined benefit plans 23,078,884 16,515,279 1,369,374
Total income tax 37,198,797 11,214,260 (32,559,120)
Total Other Comprehensive Income 98,793,462 (144,924,036) (102,150,830)TOTAL COMPREHENSIVE INCOME 971,334,082 955,764,372 1,209,176,740
Comprehensive income attributable toOwners of parent company 368,568,685 396,687,094 655,007,019Non−controlling interests 602,765,397 559,077,278 554,169,721TOTAL COMPREHENSIVE INCOME 971,334,082 955,764,372 1,209,176,740
The attached notes are an integral part of these consolidated financial statements
F−20

Table of Contents
ENERSIS S.A. AND SUBSIDIARIES
Consolidated Statement of Changes in EquityFor the years ended December 31, 2011, 2010 and 2009
(In thousands of Chilean pesos)
Changes in Other Reserves
Statement of Changes in Net Equity Issued Capital Share Premium
Reserve forexchange
differences intranslation
Reserve for cashflow hedge
Reserve foractuarial gainsand losses on
defined benefitplans
Reserve for gainsand losses onremeasuring
available−for−salefinancial assets
Othermiscellaneous
reserves Other reservesRetainedearnings
Equityattributable to
owners ofparent company
Non−controllinginterests Total Equity
Equity at beginning of year 01/01/2011 2,824,882,835 158,759,648 113,278,890 40,783,463 — 41,825 (1,505,891,534)(1,351,787,356)2,103,689,509 3,735,544,636 2,778,483,3206,514,027,956Changes in equityComprehensive incomeNet income 375,471,254 375,471,254 497.069.366 872.540.620Other comprehensive income 60,106,895 (41,093,728) (25,887,747) (27,989) — (6,902,569) (6,902,569) 105.696.031 98.793.462Comprehensive income 368,568,685 602.765.397 971.334.082Dividends (209,886,734) (209,886,734) (209.886.734)Increase (decrease) through transfers and
other changes 3,236,883 25,887,747 8,682,538 37,807,168 (36,305,149) 1,502,019 (380,823,466)(379.321.447)Total changes in equity — — 63,343,778 (41,093,728) — (27,989) 8,682,538 30,904,599 129,279,371 160,183,970 221,941,931 382.125.901Equity at end of year 12−31−2011 2,824,882,835 158,759,648 176,622,668 (310,265) — 13,836 (1,497,208,996)(1,320,882,757)2,232,968,880 3,895,728,606 3,000,425,2516,896,153,857
Changes in Other Reserves
Statement of Changes in Net Equity Issued Capital Share Premium
Reserve forexchange
differences intranslation
Reserve for cashflow hedge
Reserve foractuarial gainsand losses on
defined benefitplans
Reserve for gainsand losses onremeasuring
available−for−salefinancial assets
Othermiscellaneous
reserves Other reservesRetainedearnings
Equityattributable to
owners ofparent company
Non−controllinginterests Total Equity
Equity at beginning of year 01/01/2010 2,824,882,835 158,759,648 196,973,210 26,100,491 — 41,699 (1,505,891,534)(1,282,776,134)1,817,613,206 3,518,479,555 2,858,524,0896,377,003,644Changes in equityComprehensive incomeNet income 486,226,814 486,226,814 614.461.594 1.100.688.408Other comprehensive income (83,694,320) 14,682,972 (20,528,498) 126 (89,539,720) (89,539,720) (55.384.316) (144.924.036)Comprehensive income 396,687,094 559.077.278 955.764.372Dividends (179,622,013) (179,622,013) (179.622.013)Increase (decrease) through transfers and
other changes 20,528,498 20,528,498 (20,528,498) — (639,118,047)(639.118.047)Total changes in equity — — (83,694,320) 14,682,972 — 126 — (69,011,222) 286,076,303 217,065,081 (80,040,769) 137.024.312Equity at end of year 12−31−2010 2,824,882,835 158,759,648 113,278,890 40,783,463 — 41,825 (1,505,891,534)(1,351,787,356)2,103,689,509 3,735,544,636 2,778,483,3206,514,027,956
Changes in Other Reserves
Statement of Changes in Net Equity Issued Capital Share Premium
Reserve forexchange
differences intranslation
Reserve for cashflow hedge
Reserve foractuarial gainsand losses on
defined benefitplans
Reserve for gainsand losses onremeasuring
available−for−salefinancial assets
Othermiscellaneous
reserves Other reservesRetainedearnings
Equityattributable to
owners ofparent company
Non−controllinginterests Total Equity
Equity at beginning of year 01/01/2009 2,824,882,835 158,759,648 283,959,611 (61,975,971) — 9,565 (1,505,891,534)(1,283,898,329)1,391,570,726 3,091,314,880 2,937,816,3406,029,131,220Changes in equityComprehensive incomeNet income 660,231,043 660.231.043 651.096.527 1.311.327.570Other comprehensive income (86,986,401) 88,076,462 (6,346,219) 32,134 — (5,224,024) (5,224,024) (96.926.806) (102.150.830)Comprehensive income 655,007,019 554.169.721 1.209.176.740Dividends (227,842,344) (227,842,344) (227.842.344)Increase (decrease) through transfers and
other changes 6,346,219 6,346,219 (6,346,219) — (633,461,972)(633.461.972)Total changes in equity — — (86,986,401) 88,076,462 — 32,134 — 1,122,195 426,042,480 427,164,675 (79,292,251) 347.872.424Equity at end of year 31/12/2009 2,824,882,835 158,759,648 196,973,210 26,100,491 — 41,699 (1,505,891,534)(1,282,776,134)1,817,613,206 3,518,479,555 2,858,524,0896,377,003,644
The attached notes are an integral part of these consolidated financial statements
F−21

Table of Contents
ENERSIS S.A. AND SUBSIDIARIES
Consolidated Statements of Cash FlowsFor the years ended December 31, 2011, 2010 and 2009(In thousands of Chilean pesos)
Years ended December 31,2011 2010 2009
Note ThCh$ ThCh$ ThCh$Indirect Statement of Cash FlowCash flows from (used in) operating activitiesNet income 872,540,620 1,100,688,408 1,311,327,570
Adjustments to reconcile net incomeAdjustments for income tax expense 32 460,836,692 346,006,968 359,737,610Adjustments for decrease (increase) in inventories (9,318,985) 13,375,040 31,682,662Adjustments for decrease (increase) in trade accounts receivable (10,784,206) (164,046,056) 112,512,315Adjustments for decrease (increase) in other operating receivables (*) (233,612,869) (171,236,948) (159,670,405)Adjustments for increase (decrease) in trade accounts payable (179,339,834) 128,804,617 (218,629,211)Adjustments for increase (decrease) in other operating payables (*) 490,503,566 453,413,957 460,691,298Adjustments for depreciation and amortization expense 28 424,900,036 449,017,275 454,369,959Adjustments for impairment loss (reversal of impairment loss) recognized in
the year’s profit or loss 28 136,157,459 108,373,429 85,285,525Adjustments for provisions (83,616,655) (29,193,303) 16,436,304Adjustments for unrealized foreign exchange losses (gains) 31 (20,305,690) (11,572,474) 8,235,523Adjustments for undistributed profits of associates (8,465,904) (1,015,739) (2,235,579)Other adjustments for non−cash items 242,957,656 71,286,149 (53,398,066)
Total adjustments to reconcile net income 1,209,911,266 1,193,212,915 1,095,017,935
Income tax refunded (paid) (361,092,038) (349,296,688) (367,981,146)Other cash inflows (outflows) (22,913,382) (1,189,488) (34,668)
Net cash flows from (used in) operating activities 1,698,446,466 1,943,415,147 2,038,329,691
Cash flows from (used in) investment activitiesCash flows from losing control of subsidiaries or other businesses 5.c 12,662,234 — (290,471,658)Other payments to acquire interests in joint ventures — — (19,912,162)Loans to related companies (25,500) — (8,615,091)Proceeds from the sale of property, plant and equipment 6,048,912 8,889,879 7,559,368Purchase of property, plant and equipment (498,142,062) (473,921,829) (526,521,933)Proceeds from sales of intangible assets 8,965,592 1,424,691 5,292,416Purchases of intangible assets (187,864,119) (227,418,842) (209,939,738)Proceeds from other long−term assets 41,114 — 190,166,892Purchases of other long−term assets — — (12,641)Dividends received 4,025,233 3,278,931 2,675,741Interest received 19,611,804 6,807,678 4,346,438Other inflows (outflows) of cash 10,707,112 (94,841,624) (21,834,208)Net cash flows from (used in) investing activities (623,969,680) (775,781,116) (867,266,576)
Cash flows from (used in) financing activitiesProceeds from long−term loans 646,273,100 263,124,754 826,440,011Total proceeds from loans 646,273,100 263,124,754 826,440,011Loans from related companies 9,128,650 821,636 —Repayments from borrowings (629,404,409 (740,286,720) (1,283,351,536)Payments of finance lease liabilities (11,478,851) (24,129,963) (3,171,884)Payments from loans to related companies — — (16,986,597)Dividends paid (648,107,205) (556,087,040) (578,607,484)Interest paid (248,096,873) (244,595,847) (252,736,851)Other inflows (outflows) of cash (9,743,963) 18,132,411 8,350Net cash flows from (used in) financing activities (891,429,551) (1,283,020,769) (1,308,405,991)
Net increase (decrease) in cash and cash equivalents before effect ofexchange rate changes 183,047,235 (115,386,738) (137,342,876)
Effect of exchange rate changes on cash and cash equivalentsEffect of exchange rate changes on cash and cash equivalents 75,518,996 (58,159,046) (45,818,128)Net increase (decrease) in cash and cash equivalents 258.566.231 (173,545,784) (183,161,004)Cash and cash equivalents at beginning of year 5 961,355,037 1,134,900,821 1,318,061,825Cash and cash equivalents at end of year 5 1,219,921,268 961,355,037 1,134,900,821
(*) Includes accrued interest.
The attached notes are an integral part of these consolidated financial statements
F−22

Table of Contents
ENERSIS S.A. AND SUBSIDIARIES
NOTES TO THE CONSOLIDATED FINANCIAL STATEMENTS
Table of Contents
1. THE GROUP’S ACTIVITIES AND FINANCIAL STATEMENTS F−26
2. BASIS OF THE PRESENTATION OF THE CONSOLIDATED FINANCIAL STATEMENTS F−272.1. Accounting principles F−272.2. New accounting pronouncements F−272.3. Responsibility for the information given and the estimates made F−302.4. Subsidiaries and jointly controlled entities F−30
2.4.1. Changes in the scope of consolidation F−312.4.2. Consolidated companies with an ownership interest of less than 50% F−312.4.3. Companies not consolidated with an ownership interest of over 50% F−31
2.5. Associated companies F−312.6. Basis of consolidation and business combinations F−31
3. ACCOUNTING PRINCIPLES APPLIED F−33a) Property, plant, and equipment F−33b) Investment property F−35c) Goodwill F−35d) Intangible assets other than goodwill F−36e) Asset impairment F−37f) Leases F−38g) Financial instruments F−39h) Investments accounted for using the equity method F−42i) Inventories F−42j) Non−current assets held for sale and discontinued operations F−42k) Treasury shares F−43l) Provisions F−43m) Conversion of balances in foreign currency F−44n) Current / non−current classification F−44o) Income tax F−44p) Revenue and expense recognition F−45q) Earnings per share F−45r) Dividends F−45s) Systems of share−based remunerations F−46t) Cash flow statement F−46
4. SECTOR REGULATION AND ELECTRICITY SYSTEM OPERATIONS F−474.1. Generation F−47
a) Chile F−47b) The rest of Latin America F−48
4.2. Distribution F−50a) Chile F−50b) The rest of Latin America F−50
5. CASH AND CASH EQUIVALENTS F−52
6. OTHER FINANCIAL ASSETS F−53
7. TRADE AND OTHER RECEIVABLES F−54
8. BALANCES AND TRANSACTIONS WITH RELATED COMPANIES F−568.1 Balances and transactions with related companies F−568.2 Board of Directors and key management personnel F−578.3 Compensation for ker management personnel F−608.4 Compensation plans linked to share price F−60
F−23

Table of Contents
9. INVENTORIES F−62
10. CURRENT TAX RECEIVABLES AND PAYABLES F−62
11. NON−CURRENT ASSETS AND DISPOSAL GROUPS HELD FOR SALE F−63
12. INVESTMENTS ACCOUNTED FOR USING THE EQUITY METHOD, AND JOINTLY−CONTROLLED COMPANIES F−6412.1. Equity method accounted investments F−6412.2. Jointly controlled companies F−65
13. INTANGIBLE ASSETS OTHER THAN GOODWILL F−66
14. GOODWILL F−68
15. PROPERTY, PLANT AND EQUIPMENT F−69
16. INVESTMENT PROPERTY F−73
17. DEFERRED TAX F−74
18. OTHER FINANCIAL LIABILITIES F−75
19. RISK MANAGEMENT POLICY F−8419.1. Interest rate risk F−8419.2. Exchange rate risk F−8519.3. Commodities risk F−8519.4. Liquidity risk F−8619.5. Credit risk F−8619.6. Risk measurement F−87
20. FINANCIAL INSTRUMENTSs F−8820.1. Financial instruments, classified by type and category F−8820.2. Derivative Instruments F−8920.3. Fair value hierarchies F−91
21. TRADE AND OTHER PAYABLES F−92
22. PROVISIONS F−9322.1. Provisions F−9322.2. Lawsuits and Arbitration Proceedings F−94
23. EMPLOYMENT BENEFIT OBLIGATIONS F−10123.1. General information F−10123.2. Details, movements, and presentation in financial statements F−10123.3. Other disclosures F−104
24. EQUITY F−10524.1. Equity attributable to the parent company’s owners F−10524.2. Foreign currency translation F−10624.3. Capital management F−10624.4. Restrictions on subsidiaries’ transferring funds to the parent F−10624.5. Other reserves F−10724.6. Non−controlling interests F−108
25. REVENUES F−109
26. RAW MATERIALS AND CONSUMABLES USED F−110
27. EMPLOYEE BENEFITS EXPENSES F−110
28. DEPRECIATION, AMORTIZATION, AND IMPAIRMENT LOSSES F−110
29. OTHER EXPENSES F−111
30. OTHER GAINS (LOSSES) F−111
F−24

Table of Contents
31. FINANCIAL RESULTS F−112
32. INCOME TAX F−113
33. SEGMENT INFORMATION F−11433.1. Segmentation criteria F−11433.2. Generation, distribution, and others F−11533.3. Countries F−11833.4. Generation and distribution by country F−118
34. THIRD PARTY GUARANTEES, OTHER CONTINGENT ASSETS AND LIABILITIES, AND OTHER COMMITMENTS F−12734.1. Direct guarantees F−12734.2. Indirect guarantees F−12734.3. Other information F−127
35. PERSONNEL FIGURES F−128
36. SUBSEQUENT EVENTS F−128
37. ENVIRONMENT F−129
38. SUMMARIZED FINANCIAL INFORMATION OF PRINCIPAL SUBSIDIARIES AND JOINTLY CONTROLLEDCOMPANIES F−130
APPENDIX No. 1 ENERSIS GROUP COMPANIES F−131
APPENDIX No. 2 CHANGES IN THE SCOPE OF CONSOLIDATION F−133
APPENDIX No. 3 ENERSIS GROUP ASSOCIATED COMPANIES F−134
APPENDIX No. 4 ADDITIONAL INFORMATION ON FINANCIAL DEBT F−135
APPENDIX No. 5 ASSETS AND LIABILITIES IN FOREIGN CURRENCIES F−140
F−25

Table of Contents
ENERSIS S.A. AND SUBSIDIARIES
CONSOLIDATED FINANCIAL STATEMENTS AT DECEMBER 31, 2011 AND 2010(In thousands of Chilean pesos)
1. THE GROUP’S ACTIVITIES AND FINANCIAL STATEMENTS
Enersis S.A. (hereinafter the Parent Company or the Company) and its subsidiaries comprise the Enersis Group (hereinafter Enersis or the Group).
Enersis S.A. is a publicly traded corporation with registered address and head office located at Avenida Santa Rosa, No. 76, in Santiago, Chile. TheCompany is registered in the securities register of the Superintendency of Securities and Insurance of Chile (Superintendencia de Valores y Seguros or SVS)under number 175. In addition, the Company is registered with the Securities and Exchange Commission of the United States of America (hereinafter U.S.SEC), and with Spain’s Comisión Nacional del Mercado de Valores. The Company’s shares have been listed on the New York Stock Exchange since 1993and on the Latibex since 2001.
Enersis S.A. is a subsidiary of Endesa, S.A., a Spanish company controlled by Enel S.p.A. (hereinafter Enel).
In 1981, the Company was initially created under the corporate name of Compañía Chilena Metropolitana de Distribución Eléctrica S.A. Later on, theCompany changed its by−laws and its name to Enersis S.A. effective August 1, 1988. For tax purposes, the Company operates under Chilean taxidentification number 94,271,000−3.
As of December 31, 2011, the Group had 10,844 employees. During 2011, the Group averaged a total of 11,039 employees. See Note 35 for additionalinformation regarding employee distribution by category and geographic location.
The Company’s corporate purpose consists of engaging, whether in Chile or abroad, in exploring for, developing, operating, generating, distributing,transmitting, transforming, and/or selling energy in any of its forms, either directly or through another company. It is also engaged in telecommunicationsactivities, and it provides engineering consultation services in Chile and abroad. The Company’s corporate purpose also includes investing in, and managingits investments in, subsidiaries and associates that generate, transmit, distribute, or trade electricity, or whose corporate purpose includes any of thefollowing:
(i) energy in any kind or form;
(ii) supplying public services, or services whose main component is energy;
(iii) telecommunications and computer services; and
(iv) Internet−based intermediation businesses.
The Company’s 2010 consolidated financial statements were approved by the Board of Directors at a meeting held on January 26, 2011. The consolidatedfinancial statements were then submitted to the consideration of a General Shareholders Meeting held on April 26, 2011, which gave its final approval onthe consolidated financial statements.
These consolidated financial statements are presented in thousands of Chilean pesos (unless expressly stated otherwise), as the Chilean peso is thefunctional currency of the main economic environment in which Enersis operates. Foreign operations are reported in accordance with the accountingpolicies stated in Notes 2.6 and 3.m.
F−26

Table of Contents
2. BASIS OF PRESENTATION OF THE CONSOLIDATED FINANCIAL STATEMENTS
2.1 Accounting principles
The December 31, 2011 consolidated financial statements of Enersis and its subsidiaries have been prepared in accordance with International FinancialReporting Standards (IFRS), issued by the International Accounting Standards Board (hereinafter “IASB”), and approved by its Board of Directors at itsmeeting held on January 31, 2012.
These consolidated financial statements present fairly the financial position of Enersis and its subsidiaries as of December 31, 2011 and 2010, as well as theresults of operations, the changes in equity, and the cash flows for the years ending December 31, 2011, 2010 and 2009.
These consolidated financial statements voluntarily present the figures for the 2009 fiscal year consolidated statement of comprehensive income,consolidated statement of cash flow, and consolidated statement of changes in equity, along with their corresponding notes.
These consolidated financial statements have been prepared using cost method accounting applied to the business in operation principle except, inaccordance with IFRS, those assets and liabilities that are reported at a fair value and those non−current assets and groups that are available for sale, whichare recorded at the book value or the fair value minus sales costs, whichever is lower (see Note 3).
The consolidated financial statements have been prepared from accounting records maintained by the Company and its subsidiaries. Each entity prepares itsfinancial statements according to the accounting principles and standards in force in each country, so the necessary adjustments and reclassifications havebeen made in the consolidation process in order to present the consolidated financial statements in accordance with IFRS and the criteria of the IFRSInterpretation Committee, (hereinafter IFRIC).
2.2 New accounting pronouncements
a) Accounting pronouncements effective from January 1, 2011:
Standards, Interpretations, and AmendmentsMandatory
application for:Amendment to IAS 32: Classification of rights issuingStipulates that the purchase option rights, options, or certificates of a specific number of thecompany’s own equity instruments, for a set amount in any currency, shall constitute equityinstruments if the company offers the rights to all shareholders in proportion to their stockownership.
Annual periods beginning on orafter February 1, 2010.
IFRIC 19: Extinguishing financial liabilities with equity instrumentsEstablishes that the equity instruments issued by a company to a creditor to pay a financial liability,either wholly or partially, shall constitute a “consideration paid.” These equity instruments will berecorded at their fair value at their initial acknowledgement unless this value cannot be reliablydetermined, in which case they will be valued in such a way as to reflect the best possible estimate oftheir fair value.
Annual periods beginning on orafter July 1, 2010.
IAS 24 Revised: Related party disclosuresClarifies the definition of related parties and updates the requirements for disclosure. It includes anexemption for certain disclosures on transactions between entities that are controlled, jointlycontrolled, or significantly influenced by the State.
Annual periods beginning on orafter January 2011.
F−27

Table of Contents
Standards, Interpretations, and AmendmentsMandatory
application for:Amendment to IFRIC 14: Prepayments of a minimum funding requirementEliminates an unintended consequence of the treatment of prepayments of minimum fundingrequirements, in some circumstances where there is an obligation to maintain a minimum level offinancing for defined contributions.
Annual periods beginning on orafter January 1, 2011.
Improvements to the IFRS (issued in 2010).Affects standards: IFRS 1, IFRS 3, IFRS 7, IAS 1, IAS 27, IAS 34, and IFRIC 13.
Mostly to annual periodsbeginning on or after January 1,2011.
The application of these accounting pronouncements has not had any significant effects for the Group. The remaining accounting criteria applied in 2011 areconsistent with those applied in 2010.
b) Accounting pronouncements effective for periods beginning January 1, 2012 or later:
As of the issuance date of these consolidated financial statements, the following accounting pronouncements had been issued by the IASB, but they werenot yet mandatory:
Standards, Interpretations, and AmendmentsMandatory
application for:Amendment to IFRS 7: Financial instruments: DisclosuresModifies the information required when financial assets are transferred in order to promotetransparency and to facilitate an analysis of how the risks may affect the entity’s financial situation.
Annual periods beginning on orafter July 1, 2011.
Amendment to IAS 12: Income taxes — Recovery of underlying assetsMakes an exception to the general principles of IAS 12 for investment properties that are measuredusing the fair value model contained in IAS 40, “Investment Properties.”
Annual periods beginning on orafter January 1, 2012.
Amendment to IAS 1: Presentation of financial statementsModifies aspects of presenting thecomponents of “Other comprehensive income,” requiring that these components be grouped intothose that will and those that will not subsequently be reclassified as losses and gains.
Annual periods beginning on orafter July 1, 2012.
IFRS 10: Consolidated financial statementsEstablishes clarifications and new parameters for defining control, as well as the principles forpreparing consolidated financial statements that apply to all entities (including special purposeentities or structured entities).
Annual periods beginning on orafter January 1, 2013.
IFRS 11: Joint arrangementsRedefines the concept of joint control, aligning with IFRS 10 and requiring that entities that are partof a joint agreement determine the type of agreement (joint operation or joint business) byevaluating their rights and obligations. The standard eliminates the possibility of proportionalconsolidation for joint businesses.
Annual periods beginning on orafter January 1, 2013.
F−28

Table of Contents
Standards, Interpretations, and AmendmentsMandatory
application for:IFRS 12: Disclosures of interests in other entitiesRequires certain disclosures that allow for assessing the nature of the stake held in other entitiesand the risks involved, as well as how these stakes affect the entity’s financial situation, financialperformance, and cash flows.
Annual periods beginning on orafter January 1, 2013.
IFRS 13: Fair value measurementEstablishes, in a single standard, a framework for assessing the fair value of assets and liabilities,and incorporates new concepts and clarifications for this assessment. It also requires that theentities disclose certain information on the assessment of the fair value of their assets and liabilities.
Annual periods beginning on orafter January 1, 2013.
New IAS 27: Separate financial statementsWhen IFRS 10 was issued, it eliminated from IAS 27 everything connected with consolidatedfinancial statements, restricting its scope only to separate financial statements.
Annual periods beginning on orafter January 1, 2013.
New IAS 28: Investments in associates and joint venturesModified by the effect of the issuance of IFRS 10 and IFRS 11 in order to make the definitions andother clarifications contained in these new IFRS consistent.
Annual periods beginning on orafter January 1, 2013.
Amendment to IFRS 7: Financial instruments: DisclosuresClarifies the disclosure requirements for the offsetting of financial assets and financial liabilities.
Annual periods beginning on orafter January 1, 2013.
Amendment to IAS 19: Employee benefitsModifies recognition and disclosure of changes in the obligations from defined benefit plans and inthe assets affected by the plan, eliminating the corridor method and accelerating recognition ofcosts from past services.
Annual periods beginning on orafter January 1, 2013.
Amendment to IAS 32: Financial instruments: PresentationClarifies the requirements for the offsetting of financial assets and financial liabilities in order toeliminate the inconsistencies from applying the current IAS 32 criteria for offsetting.
Annual periods beginning on orafter January 1, 2014.
IFRS 9: Financial Instruments: Classification and measurementThe first stage of the IASB project to replace IAS 39, “Financial Instruments: Recognition andMeasurement.” Modifies classification and measurement of financial assets and includes treatmentand classification of financial liabilities.
Annual periods beginning on orafter January 1, 2015.
The Group is still assessing the impact of applying IFRS 9, IFRS 10, IFRS 11, IFRS 12, and IFRS 13 from the date they go into effect. In Management’sopinion, the application of the other standards, interpretations, and amendments pending application will not have a significant effect on the consolidatedfinancial statements of Enersis and its subsidiaries.
F−29

Table of Contents
2.3 Responsibility for the information given and the estimates made
The Company’s Board of Directors is responsible for the information contained in these consolidated financial statements and expressly states that all IFRSprinciples and standards that are applicable to the Group have been fully implemented.
In preparing the consolidated financial statements, certain estimates made by the Company’s Management have been used to quantify some of the assets,liabilities, income, expenses, and commitments recorded in the statements.
These estimates basically refer to:
• The valuation of assets and goodwill to determine the existence of impairment losses (see Note 3.e).
• The assumptions used to calculate the actuarial liabilities and obligations to employees, such as discount rates, mortality tables, salary increases, andothers (see Note 23).
• The useful life of property, plant and equipment, and intangible assets (see Notes 3.a and 3.d).
• The assumptions used to calculate the fair value of financial instruments (see Notes 3.g.5 and 20).
• Energy supplied to customers whose meter readings are pending.
• Certain assumptions inherent in the electricity system affecting transactions with other companies, such as production, customer billings, energyconsumption, etc. that allow for estimating electricity system settlements that must occur on the corresponding final settlement dates, but that are pending asof the date of issuance of the consolidated financial statements and could affect the balances of assets, liabilities, income and expenses recorded in thestatements.
• The probability that uncertain or contingent liabilities will be incurred and their related amounts (see Note 3.l).
• Future disbursements for the closure of facilities and restoration of land (see Note 3.a).
• The tax results of the various subsidiaries of the Group that will be reported to the respective tax authorities in the future, and that have served as thebasis for recording different balances related to income taxes in these consolidated financial statements (see Note 3.o).
Although these estimates have been based on the best information available on the issuance date of these consolidated financial statements, future eventsmay occur that would require a change (increase or decrease) to these estimates in subsequent years. This change would be done prospectively, recognizingthe effects of such an estimation change in the corresponding future consolidated financial statements.
2.4 Subsidiaries and jointly controlled entities
Subsidiaries are defined as entities in which the Parent Company controls the majority of the voting rights or, should that not be the case, is authorized todirect the financial and operating policies of such entities.
Jointly controlled entities are those in which the situation described in the preceding paragraph exists as a result of an agreement with other shareholders andcontrol is exercised jointly with them.
Appendix No.1 of these consolidated financial statements, entitled Enersis Group Companies, describes Enersis’ relationship with each of its subsidiariesand jointly controlled entities.
F−30

Table of Contents
2.4.1 Changes in the scope of consolidation
The process of selling the companies Compañía Americana de Multiservicios (CAM) and Synapsis Soluciones y Servicios IT (Synapsis) was completedduring the first quarter of 2011. The sale of CAM was concluded on February 24, 2011 for the amount of ThCh$ 6,775,748 (US$ 14,2 million), while thesale of Synapsis was finalized on March 1, 2011 for ThCh$ 24,710,920 (US$ 52 million). For more information, see Note 11.
The elimination of CAM and Synapsis from the Enersis consolidated statements has resulted in reductions in the consolidated statement of financial positionof ThCh$ 80,050,947 in current assets, ThCh$ 31,003,337 in non−current assets, ThCh $56,359,935 in current liabilities, and ThCh$ 14,558,579 innon−current liabilities.
During 2010 there were no significant changes in the Enersis Group’s scope of consolidation.
The section titled “Changes in the Enersis Group scope of consolidation,” included as Appendix No.2 to these consolidated financial statements, lists thecompanies included within the scope of the Group’s consolidation, together with information on the Group’s respective ownership interest percentages.
2.4.2 Consolidated companies with an ownership interest of less than 50%
Although the Enersis Group holds less than a 50% interest in Codensa S.A E.S.P. and in Emgesa S.A. E.S.P., they are considered subsidiaries since theGroup exercises control over the entities, either directly or indirectly, through contracts or agreements with shareholders, or as a consequence of theirstructure, composition, and shareholder classes.
2.4.3 Companies not consolidated with an ownership interest of over 50%
Although the Enersis Group holds more than a 50% interest in Centrales Hidroeléctricas de Aysén, S.A. (Aysén), it is considered a jointly controlled entitysince the Group, through contracts and agreements with shareholders, exercises joint control of the company.
2.5 Associated companies
Associated Companies are those in which Enersis, either directly or indirectly, exercises significant influence. In general, significant influence is assumed tobe those cases in which the Group has an ownership interest of over 20% (see Note 3.h).
Appendix No.3 to these consolidated financial statements, entitled “Associated Companies,” describes Enersis’ relationship with each associated company.
2.6 Basis of consolidation and business combinations
The subsidiaries are consolidated and all their assets, liabilities, income, expenses, and cash flows are included in the consolidated financial statements oncethe adjustments and eliminations from intra−Group transactions have been made.
Jointly controlled entities are consolidated using the proportional consolidation method. The Group recognizes, line by line, its share of the assets, liabilities,income, and expenses of such entities, so the adding of balances and subsequent eliminations take place only in proportion to the Group’s ownership interestin them.
The comprehensive income of subsidiaries and jointly controlled entities is included in the consolidated comprehensive income statement from the effectivedate of acquisition until the effective date of disposal or termination of joint control, as applicable.
F−31

Table of Contents
The parent company’s and its subsidiaries’ operations, as well as those of jointly controlled entities, have been consolidated under the following basicprinciples:
1. At the date of acquisition, the assets, liabilities, and contingent liabilities of the subsidiary or jointly controlled entity are recorded at market value. If, inthe parent company’s stake, there is a positive difference between the acquisition cost and the fair value of the assets and liabilities of the company acquired,including contingent liabilities, this difference is recorded as goodwill. If the difference is negative, it is recorded as a credit to income.
2. Non−controlling interests in equity and in the comprehensive income of the consolidated subsidiaries are presented, respectively, under the line items“Total Equity: Non−controlling interests” in the consolidated statement of financial position and “Net Income attributable to non−controlling interests” and“Other comprehensive income attributable to non−controlling interests” in the consolidated statement of comprehensive income.
3. The financial statements of foreign companies with functional currencies other than the Chilean peso are translated as follows:
a. For assets and liabilities, the prevailing exchange rate on the closing date of the financial statements is used.
b. For items in the comprehensive income statement, the average exchange rate for the year is used (unless this average is not a reasonable approximationof the cumulative effect of the exchange rates in effect on the dates of the transactions, in which case the exchange rate in effect on the date of eachtransaction is used).
c. Equity remains at the historical exchange rate from the date of acquisition or contribution, and retained earnings at the average exchange rate at thedate of generation.
Exchange differences arising in the conversion of the financial statements are recognized in the item “Exchange difference on translation” within theconsolidated statement of comprehensive income: Other comprehensive income (see Note 24.2).
Translation adjustments that existed at Enersis’ transition date to IFRS, January 1, 2004, were deemed to be zero and transferred to reserves, using theexemption for that purpose in IFRS 1 “First time Adoption of IFRS” (see Note 24.5).
All balances and transactions between consolidated companies, as well as the share of the proportionally consolidated companies, were eliminated in theconsolidation process.
F−32

Table of Contents
3. ACCOUNTING PRINCIPLES APPLIED
The main accounting policies used in preparing the accompanying consolidated financial statements were the following:
a) Property, plant, and equipment
Property, plant and equipment are valued at acquisition cost, net of accumulated depreciation and any impairment losses they may have experienced. Inaddition to the price paid to acquire each item, the cost also includes, where applicable, the following concepts:
• Financing expenses accrued during the construction period that are directly attributable to the acquisition, construction, or production of qualifiedassets, which require a substantial period of time before being ready for use such as, for example, electricity generation or distribution facilities. The Groupdefines “substantial period” as one that exceeds 12 months. The interest rate used is that of the specific financing or, if none exists, the mean financing rateof the company carrying out the investment. The mean financing rate depends principally on the geographic area and ranges between 7.89% and 15.5%. Theamount capitalized for this concept amounted to ThCh$ 35,945,738, ThCh$ 15,137,380, and ThCh$ 9,137,217 for the periods ended December 31, 2011,2010, and 2009, respectively.
• Employee expenses directly related to construction in progress. The amounts capitalized under this concept for the periods ended December 31,2011, 2010, and 2009 were ThCh$ 32,042,815, ThCh$ 26,741,111, and ThCh$ 16,723,291, respectively.
• Future disbursements that the Group must make to close their facilities are incorporated into the value of the asset at present value, recording thecorresponding provision in accounting. The Group reviews their estimate of these future disbursements on a yearly basis, increasing or decreasing the valueof the asset based on the results of this estimate (see Note 22).
• Items acquired before the Group’s date of transition to IFRS, on January 1, 2004, include in the purchasing cost, where appropriate, assetreappraisals permitted in the various countries to adjust the value of the property, plant and equipment for inflation as of that date (see Note 24.5).
Items for construction work in progress are transferred to operating assets once the testing period has been completed and they are available for use, atwhich time depreciation begins.
Expansion, modernization, or improvement costs that represent an increase in productivity, capacity or efficiency, or a longer useful life are capitalized as agreater cost for the corresponding assets.
The replacement or overhaul of entire components that increase the asset’s useful life, or its economic capacity, are recorded as an increase in value for therespective assets, derecognizing the replaced or overhauled components. Expenses for periodic maintenance, conservation, and repair are recorded directlyin income as an expense for the year in which they are incurred.
The Company, based on the outcome of impairment testing explained in Note 3.e), considers that the book value of assets does not exceed their netrecoverable value.
Property, plant, and equipment, net of its residual value, is depreciated by distributing the cost of the different items that comprise it on a straight−line basisover its estimated useful life, which is the period during which the companies expect to use the assets. Useful life estimates are periodically reviewed and, ifappropriate, adjusted prospectively.
F−33

Table of Contents
The following are the main categories of property, plant, and equipment with their respective estimated useful lives.
Categories of Property, plant, and equipment Years of estimated useful lifeBuildings 22 — 100Plant and equipment 3 — 65IT Equipment 3 — 15Fixtures and Fittings 5 — 21Motor Vehicles 5 — 10Other 2 — 33
Additionally, the following provides greater detail on the useful lives of plant and equipment items:
Years of estimated useful lifeGenerating Facilities:Hydroelectric power plantsCivil engineering works 35 — 65Electromechanical equipment 10 — 40Coal−fired / fuel−oil power plants 25 — 40Combined cycle plants 10 — 25Renewable energy power plants 35Transmission and distribution facilities:High−voltage network 10 — 60Low− and medium−voltage network 10 — 60Measuring and remote control equipment 3 — 50Other facilities 4 — 25
Regarding the administrative concessions held by the Group’s electric companies, the following lists the years remaining until expiration for the concessionsthat do not have an indefinite term:
Concession holder and operator Country Concession term Period remaining until expirationEmpresa Distribuidora Sur S.A. − Edesur (Distribution) Argentina 95 years 76 yearsHidroeléctrica El Chocón S.A. (Generation) Argentina 30 years 12 yearsTransportadora de Energía S.A. (Transmission) Argentina 85 years 76 yearsCompañía de Transmisión del Mercosur S.A. (Transmission) Argentina 87 years 76 yearsCentral Eléctrica Cachoeira Dourada S.A. (Generation) Brazil 30 years 16 yearsCentral Geradora Termeléctrica Fortaleza S.A (Generation) Brazil 30 years 20 yearsCompañía de Interconexión Energética S.A. (CIEN − Line 1) Brazil 20 years 9 yearsCompañía de Interconexión Energética S.A. (CIEN − Line 2 Brazil 20 years 11 years
The Group’s management evaluated the specific contract term of each of the aforementioned concessions, which vary by country, business activity, andjurisprudence, and concluded that, with the exception of CIEN, there are no determining factors indicating that the grantor, which in every case is agovernment entity, controls the infrastructure and, at the same time, can continuously set the price to be charged for services. These requirements areessential for
F−34

Table of Contents
applying IFRIC 12 “Service Concession Agreements,” which establishes how to record and value certain types of concessions (see Note 3.d.1 forconcession agreements within the scope of IFRIC 12).
On April 19, 2011, our subsidiary CIEN successfully completed the change in business model that we had previously been reporting. Under the newagreement, the Government continues to control the infrastructure, but CIEN receives fixed payments, which puts it on an equal footing with a publictransmission concession (with regulated prices).
Under this business model, its concessions fall within the scope of Standard IFRIC 12, but the infrastructure has not been derecognized due to the fact thatCIEN has not substantially transferred the significant risks and benefits to the Brazilian Government.
Concession contracts not covered under IFRIC 12 are recognized according to general criteria. To the extent that the Group recognizes assets as property,plant, and equipment, they are amortized over their economic life or the concession term, whichever is shorter. Any obligation to invest, improve or replaceis considered in the estimation of impairment to Property, Plant, and Equipment as future contractual cash outflow necessary to obtain future cash inflow.
Gains or losses that arise from the sale or disposal of items of property, plant and equipment are recognized in income for the period and calculated as thedifference between the sale value and the net book value.
b) Investment property
Investment property includes primarily land and buildings held for the purpose of earning rental income and/or for capital appreciation.
Investment property is valued at acquisition cost less any accumulated depreciation and impairment losses that have been incurred. Investment property,excluding land, is depreciated on a straight−line basis over the useful lives of the related assets.
The breakdown of the fair value of investment property is detailed in Note 16.
c) Goodwill
Goodwill generated upon consolidation represents the difference between the acquisition cost and the Group’s share of the fair value of assets and liabilities,including identifiable contingent assets and liabilities of a subsidiary at the acquisition date.
Acquired assets and liabilities are temporarily valued as of the date the company takes control and reviewed within no more than a year after the acquisitiondate. Until the fair value of assets and liabilities is ultimately determined, the difference between the acquisition price and the book value of the acquiredcompany is temporarily recorded as goodwill.
If goodwill is finally determined as existing in the financial statements the year following the acquisition, the prior year’s accounts, which are presented forcomparison purposes, are modified to include the value of the acquired assets and liabilities and of the definitive goodwill from the acquisition date.
Goodwill generated from acquiring companies with functional currencies other than the Chilean peso is valued in the functional currency of the acquiredcompany and converted to Chilean pesos using the exchange rate in effect as of the date of the statement of financial position.
Goodwill generated before the date of transition to IFRS, on January 1, 2004, is maintained at its net value recorded as of that date, while goodwilloriginated afterwards is valued at acquisition cost (see Notes 14 and 24.5).
F−35

Table of Contents
Goodwill is not amortized; instead, at each period end the Company estimates whether any impairment has reduced its recoverable value to an amount lessthan the net recorded cost and, if so, it immediately adjusts for impairment (see Note 3.e).
d) Intangible assets other than goodwill
Intangible assets are initially recognized at their acquisition or production cost, and are subsequently valued at their cost, net of their accumulatedamortization and of the impairment losses they may have experienced.
Intangible assets are amortized on a straight line basis during their useful life, starting from the time that they are in usable condition, except for those withan indefinite useful life, which are not amortized. As of December 31, 2011, there were no significant amounts in intangible assets with an indefinite usefullife.
The criteria for recognizing these assets’ impairment losses and, if applicable, recovery of impairment losses recorded in previous fiscal years are explainedin letter e) of this Note.
d.1) Concessions
IFRIC 12 “Service Concession Agreements” provides accounting guidelines for public−to−private service concession agreements. This accountinginterpretation applies if:
a) The grantor controls or regulates which services the operator should provide with the infrastructure, to whom it must provide them, and at what price;and
b) The grantor controls − through ownership, beneficial entitlement, or otherwise − any significant residual interest in the infrastructure at the end of theterm of the agreement.
If both of the above conditions are met simultaneously, the consideration received by the Group for the infrastructure construction is recognized at its fairvalue, as either an intangible asset when the Group receives the right to charge users of the public service, as long as these charges are conditional on thedegree to which the service is used; or as a financial asset when the Group has an unconditional contractual right to receive cash or other financial assetfrom the grantor or a third party. The Group recognizes the contractual obligations assumed for maintenance of the infrastructure during its use, or for itsreturn to the grantor at the end of the concession agreement within the conditions specified in the agreement, as long as it does not involve an activity thatgenerates income, in accordance with the Group’s provision accounting policy (see Note 3.l).
Finance expenses attributable to the concession agreements are capitalized based on criteria established in Note 3.a above, provided that the Group has acontractual right to receive an intangible asset. No finance expenses were capitalized during the fiscal years 2011 and 2010 (ThCh$ 1,992,733 during the2009 fiscal year).
Additionally, during the periods ended December 31, 2011, 2010, and 2009, employee expenses directly attributable to construction in progress, amountingto ThCh$ 18,130,297, ThCh$ 18,128,254, and ThCh$ 17,007,228, respectively, were capitalized.
F−36

Table of Contents
The subsidiaries that have recognized an intangible asset from their service concession agreements are the following:
Concession holder and operator Country TermPeriod remaining to
expiration
Ampla Energia e Serviços S.A. (*)(Distribution)
Brazil 30 years 15 years
Companhia Energética do Ceará S.A. (*)(Distribution)
Brazil 30 years 17 years
Sociedad Concesionaria Túnel El Melón S.A.(Highway infrastructure)
Chile 23 years 5 years
(*) Considering that part of the rights acquired by our subsidiaries are unconditional, a financial asset at amortized cost has also been recognized (see Notes3.g.1 and 7).
d.2) Research and development expenses
The Group follows the policy of recording the costs incurred in a project’s development phase as intangible assets in the statement of financial position aslong as the project’s technical viability and economic returns are reasonably assured.
Expenditures on research activities are recognized as an expense in the period in which they are incurred. These expenses amounted to ChTh$ 843,403 andThCh$ 18,404 as of December 31, 2011 and 2010, respectively. No research and development expenses were recognized in the year ending December 31,2009.
d.3) Other intangible assets
These intangible assets correspond primarily to computer software, water rights, and easements. They are initially recognized at acquisition or productioncost and are subsequently measured at cost less accumulated amortization and impairment losses, if any.
Computer software programs are amortized, on average, over five years. Certain easements and water rights have indefinite useful lives and are thereforenot amortized, while others have useful lives ranging from 40 to 60 years, depending on their characteristics, and they are amortized over that term.
e) Asset impairment
During the period, and principally at period end, the Company evaluates whether there is any indication that an asset has been impaired. Should any suchindication exist, the company estimates the recoverable amount of that asset to determine the amount of impairment in each case. In the case of identifiableassets that do not generate cash flows independently, the company estimates the recoverability of the Cash Generating Unit to which the asset belongs,which is understood to be the smallest identifiable group of assets that generates independent cash inflows.
Notwithstanding the preceding paragraph, in the case of Cash Generating Units to which goodwill or intangible assets with an indefinite useful life havebeen allocated, a recoverability analysis is performed routinely at each period end.
The recoverable amount is the greater amount between the fair value less the cost needed to sell and the value in use, which is defined as the present valueof the estimated future cash flows. In order to calculate the recoverable value of Property, plant, and equipment, goodwill and intangible assets, the Groupuses value in use criteria in practically all cases.
To estimate the value in use, the Group prepares future cash flow projections, before tax, based on the most recent budgets available. These budgetsincorporate management’s best estimates of Cash Generating Units’ revenue and costs using sector projections, past experience, and future expectations.
F−37

Table of Contents
In general, these projections cover the next ten years, estimating cash flows for subsequent years by applying reasonable growth rates, between 3.2% and7.9%, which, in no case, are increasing nor exceed the average long−term growth rates for the particular sector and country.
These cash flows are discounted at a given pre−tax rate in order to calculate their present value. This rate reflects the cost of capital of the business and thegeographical area in which the business is conducted. The discount rate is calculated taking into account the current value of money and the risk premiumsgenerally used by analysts for the specific business activity and country involved.
The following discount rates, before tax and expressed in nominal terms, were applied in 2011 and 2010:
2011 2010Country Currency Minimum Maximum Minimum Maximum
Chile Chilean peso 8.0% 10.1% 7.5% 8.8%Argentina Argentine peso 15.0% 17.1% 15.0% 16.9%Brazil Brazilian real 9.5% 11.6% 9.6% 10.8%Peru Peruvian sol 7.3% 9.3% 7.9% 8.1%Colombia Colombian peso 8.9% 10.9% 9.6% 9.8%
If the recoverable amount is less than the net carrying amount of the asset, the corresponding provision for impairment loss is recorded for the difference,and charged to “Reversal of impairment loss (impairment loss) recognized in profit or loss” in the consolidated statement of comprehensive income.
Impairment losses recognized for an asset in prior periods are reversed when its estimated recoverable amount changes, increasing the asset’s value with acredit to earnings, limited to the asset’s carrying amount if no adjustment had occurred. In the case of goodwill, adjustments that would have been made arenot reversible.
The following procedure is used to determine the need to adjust financial assets for impairment:
• In the case of commercial assets, the Group’s policy is to record impairment through an allowance account based on the age of past−due balances.This policy is generally applied except in those cases where a specific collectability analysis is recommended, such as in the case of receivables frompublically owned companies.
• In the case of receivables of a financial nature, impairment is determined on case−by−case basis. As of the date of issuance of these consolidatedfinancial statements, the Company had no significant past due non−commercial financial assets
f) Leases
The Group applies IFRIC 4 to assess whether an agreement is or contains a lease. Leases that transfer to the lessee substantially all of the risks and rewardsinherent in ownership are classified as finance leases. All other leases are classified as operating leases.
Finance leases in which the Group acts as a lessee are recognized when the agreement begins. At that time, the Group records an asset based on the natureof the lease and a liability for the same amount, equal to the fair value of the leased asset or the present value of the minimum lease payments, if the latter islower. Subsequently, the minimum lease payments are divided between finance expense and principal reduction. The finance expense is recorded in theincome statement and distributed over the lease term, so as to obtain a constant interest rate for each period over the balance of the debt pendingamortization. The asset depreciates on the same terms as other similar depreciable assets, as long as there is reasonable certainty that the lessee will acquireownership of the asset at the end of the lease. If no such certainty exists, the asset depreciates over the shorter term between the useful life of the asset andthe term of the lease.
F−38

Table of Contents
Operating lease payments are expensed on a straight−line basis over the term of the lease unless another type of systematic basis of distribution is deemedmore representative.
g) Financial instruments
Financial instruments are contracts that give rise to both a financial asset in one company and a financial liability or equity instrument in another company.
g.1) Financial assets other than derivatives
The Group classifies its financial assets other than derivatives, whether permanent or temporary, except for investments accounted for using the equitymethod (see Note 12) and those held for sale (Note 11), into four categories:
• Trade and other current receivables and Accounts receivable from related companies: These are recorded at amortized cost, which is the initial fairvalue less principal repayments made, plus accrued and uncharged interest, calculated using the effective interest method.
The effective interest method is used to calculate the amortized cost of a financial asset or financial liability (or group of financial assets or financialliabilities) and is charged to finance income or cost over the relevant period. The effective interest rate is the discount rate that exactly matches the estimatedcash flows to be received or paid over the expected life of the financial instrument (or, when appropriate, over a shorter period) to the net carrying amountof the financial asset or financial liability.
• Held−to−maturity investments: Investments that the Group intends to hold and is capable of holding until their maturity is accounted for at amortizedcost as defined in the preceding paragraph.
• Financial assets at fair value with changes in net income: This includes the trading portfolio and those financial assets that have been designated assuch upon initial recognition and that are managed and evaluated using fair value criteria. They are valued in the consolidated statement of financial positionat fair value, with changes in value recorded directly in income when they occur.
• Available−for−sale financial assets: These are financial assets specifically designated as available for sale or that do not fit within any of the threepreceding categories and consist almost entirely of financial investments in equity instruments (see Note 6).
These investments are recorded in the consolidated statement of financial position at fair value when it can be reliably determined. For interests in unlistedcompanies or companies with very little liquidity, normally the market value cannot be reliably determined. When this occurs, those interests are valued atacquisition cost or a lesser amount if evidence of impairment exists.
Changes in fair value, net of tax, are recorded in the consolidated statement of comprehensive income: Other comprehensive results, until the investmentsare disposed of, at which time the amount accumulated in this account for that investment is fully charged to the period’s profit or loss.
Should the fair value be less than the acquisition cost, and if there is objective evidence that the asset has been more than temporarily impaired, thedifference is recorded directly in the period’s losses.
Purchases and sales of financial assets are accounted for using their trade date.
g.2) Cash and cash equivalents
This account within the statement of consolidated financial position includes cash and bank balances, time deposits, and other highly liquid short−terminvestments readily convertible to cash and which are subject to insignificant risk of changes in value.
F−39

Table of Contents
g.3) Financial liabilities other than derivatives
Financial liabilities are generally recorded based on cash received, net of any costs incurred in the transaction. In subsequent periods, these obligations arevalued at their amortized cost, using the effective interest rate method (see Note 3.g.1).
In the particular case that a liability is the underlying item of a fair value hedge derivative, as an exception, such liability will be valued at its fair value forthe portion of the hedged risk.
In order to calculate the fair value of debt, both in the cases when it is recorded in the statement of financial position and for fair value disclosure purposesas seen in Note 20, debt has been divided into fixed interest rate debt (hereinafter “fixed−rate debt”) and variable interest rate debt (hereinafter“floating−rate debt”). Fixed−rate debt is that on which fixed−interest coupons established at the beginning of the transaction are paid explicitly or implicitlyover its term. Floating−rate debt is that issued at a variable interest rate, i.e., each coupon is established at the beginning of each period based on thereference interest rate. All debt has been valued by discounting expected future cash flows with a market−interest rate curve based on the payment’scurrency.
g.4) Derivative financial instruments and hedge accounting
Derivatives held by the Group are primarily transactions entered into to hedge interest and/or exchange rate risk, intended to eliminate or significantlyreduce these risks in the underlying transactions being hedged.
Derivatives are recorded at fair value as of the date of the statement of financial position as follows: if their fair value is positive, they are recorded within“Other financial assets”; and if their fair value is negative, they are recorded within “Other financial liabilities.” For derivatives on commodities, the positivevalue is recorded in “Trade and other current receivables,” and negative values are recorded in “Trade and other current liabilities.”
Changes in fair value are recorded directly in income except when the derivative has been designated for accounting purposes as a hedge instrument and allof the conditions established under IFRS for applying hedge accounting are met, including that the hedge be highly effective. In this case, changes arerecorded as follows:
• Fair value hedges: The underlying portion for which the risk is being hedged is valued at its fair value, as is the hedge instrument, and any changes inthe value of both are recorded in the comprehensive income statement by netting the effects in the same comprehensive income statement account.
• Cash flow hedges: Changes in the fair value of the effective portion of derivatives are recorded in an equity reserve known as “Reserve of cash flowhedges.” The cumulative loss or gain in this account is transferred to the comprehensive income statement to the extent that the underlying item impacts thecomprehensive income statement because of the hedged risk, netting the effect in the same comprehensive income statement account. Gains or losses fromthe ineffective portion of the hedge are recorded directly in the comprehensive income statement.
A hedge is considered highly effective when changes in the fair value or the cash flows of the underlying item directly attributable to the hedged risk, areoffset by changes in the fair value or the cash flows of the hedging instrument, with effectiveness ranging from 80% to 125%.
The Company does not apply hedge accounting to its investments abroad.
F−40

Table of Contents
As a general rule, long−term commodity purchase or sale agreements are recorded in the consolidated statement of financial position at their fair value as ofperiod end, recording any differences in value directly in income, except when all of the following conditions are met:
• The sole purpose of the agreement is for the Group’s own use.
• The Group’s future projections justify the existence of these agreements for its own use.
• Past experience with agreements shows that they have been utilized for the Group’s own use, except in certain isolated cases when they had to beused for exceptional reasons or reasons associated with logistical issues beyond the control and projection of the Group.
• The agreement does not stipulate settlement by differences and the parties do not make it a practice to settle similar contracts by differences in thepast.
The long−term commodity purchase or sale agreements maintained by the Group, which are mainly for electricity, fuel, and other supplies, meet theconditions described above. Thus, the purpose of fuel purchase agreements is to use them to generate electricity, the electricity purchase contracts are usedto make sales to end−customers, and the electricity sale contracts are used to sell the company’s own product.
The Company also evaluates the existence of derivatives embedded in contracts or financial instruments to determine if their characteristics and risk areclosely related to the principal contract, provided that the set is not being accounted for at fair value. If they are not closely related, they are recordedseparately and changes in value are accounted for directly in the comprehensive income statement.
g.5) Fair value measurement and classification of financial instruments
The fair value of the various derivative financial instruments is calculated as follows:
• For derivatives traded on a formal market, by its quoted price as of year−end.
• The Group values derivatives not traded on formal markets by using discounted expected cash flows and generally accepted options valuation models,based on current and future market conditions as of year−end.
Using the procedures described, the Group classifies financial instruments at the following levels:
Level 1: Quoted price (unadjusted) in active markets for identical assets or liabilities;
Level 2: Inputs other than quoted prices included within Level 1 that are observable for the asset or liability, either directly (i.e. as prices) or indirectly (i.e. derivedfrom prices); and
Level 3: Inputs for assets or liabilities that are not based on observable market data (unobservable inputs).
g.6) Derecognition of financial assets
Financial assets are derecognized when:
• The contractual rights to receive cash flows related to the financial asset expire or have been transferred or, if the contractual rights are retained, theGroup has assumed a contractual obligation to pay these cash flows to one or more receivers.
• The Group has substantially transferred the risks and rewards of ownership of the financial asset, or, when it neither transfers nor retains substantially allthe risks and rewards but does not retain control over the asset.
F−41

Table of Contents
Transactions in which the Group retains substantially all the inherent risks and rewards of ownership of the transferred asset, it continues recognizing thetransferred asset in its entirety and recognizes a financial liability for the consideration received. Transactions costs are recognized in profit and loss byusing the effective interest method (see Note 3.g.1).
h) Investments accounted for using the equity method
Investments in associates in which the Group has significant influence are recorded using the equity method.
The equity method consists of recording the investment in the statement of financial position based on the share of its equity that the Group’s interestrepresents in its capital, adjusted for, if appropriate, the effect of transactions with subsidiaries plus any goodwill generated in acquiring the company. If theresulting amount is negative, zero is recorded for that investment in the statement of financial position, unless there is a commitment from the Group tosupport the company’s negative equity situation, in which case a provision is recorded.
Dividends received from these companies are deducted from the value of the investment, and any profit or loss obtained from them to which the Group isentitled based on its interest is recorded under “Share of profit (loss) of associates accounted for using equity method.”
Appendix No. 3, “Enersis Group Associated Companies,” included in these consolidated financial statements, provides information about Enersis’relationship with each of its associates.
i) Inventories
Inventories are valued at their weighted average acquisition price or the net realizable value, whichever is lower.
j) Non−current assets held for sale and discontinued operations
The Group classifies the following as “Non−current assets held for sale”: property, plant and equipment; intangible assets; investments accounted for usingthe equity method and disposals groups (a group of assets to be disposed of and the liabilities directly associated with those assets), if as of the date of theconsolidated financial statements, the Group has taken active measures for their sale and estimates that such a sale is highly probable.
These held−for−sale assets or disposal groups are valued at the lower of their book value or fair value less selling costs. Depreciation and amortization onthese assets cease when they meet the criteria to be classified as held for sale.
Non−current assets held for sale and the components of the disposal groups classified as held for sale are presented in these consolidated statement offinancial position as a single line item within assets called “Non−current assets or disposal groups classified as held for sale,” and the respective liabilitiesare presented as a single line item within liabilities called “Liabilities included in disposal groups classified as held for sale.”
The Group classifies as “Discontinued operations” those which represent separate major lines of business or are part of a single coordinated plan to disposeof a separate major line of business that either has been disposed of, or are classified as held for sale.
The components of profit or loss after taxes from discontinued operations are presented as a single line item in the consolidated comprehensive incomestatement as “Net income from discontinued operations.”
F−42

Table of Contents
k) Treasury shares
Treasury shares are deducted from equity in the consolidated statement of financial position and valued at acquisition cost.
The gains and losses from the disposal of treasury shares are recorded directly under “Equity − Retained earnings”. As of December 31, 2011, there are notreasury shares, and no transactions with treasure shares were made during the 2011, 2010, or 2009 fiscal years.
l) Provisions
Obligations existing as of the date of the consolidated financial statements resulting from past events which may negatively impact the Group’s equity, andwhose amount and timing of payment are uncertain, are recorded as provisions in the consolidated statement of financial position at the present value of themost likely amount that it is believed that the Group will have to disburse to settle the obligation.
Provisions are quantified using the best information available as of the date of issuance of the consolidated financial statements regarding the consequencesof the event causing the provision and are re−estimated at each subsequent accounting close.
l.1) Provisions for post−employment benefits and similar obligations
Some of the Group’s subsidiaries have pension and similar obligations to their employees. Such obligations, which combine defined benefits and definedcontributions, are basically formalized through pension plans, except for certain non−monetary benefits, mainly electricity supply commitments, which, dueto their nature, have not been externalized and are covered by the related in−house provisions.
For defined benefit plans, the cost of providing benefits is determined using the Projected Unit Credit Method, with actuarial valuations being carried out atthe end of each reporting period. Past service costs relating to changes in benefits are recognized immediately to the extent that the benefits are alreadyvested, and otherwise are amortized on a straight−line basis over the average period until the benefits become vested.
The defined benefit plan obligations in the statement of financial position represent the present value of the accrued obligations, adjusted, once the fair valueof the different plans’ assets has been deducted, if applicable.
For each of the plans, any positive difference between the actuarial liability for past services and the plan assets is recognized under line item “Provisionsfor employee benefits” within current and non−current liabilities in the consolidated statement of financial position, and any negative difference isrecognized under line item “Other financial assets” within non−current assets in the consolidated statement of financial position, provided that the negativedifference is recoverable by the Group, usually through a reduction in future contributions and taking into consideration the limit established in IFRIC 14,“IAS 19 The limit on a defined benefit asset, minimum funding requirements, and their interaction.”
Contributions to defined contribution benefit plans are recognized as an expense in the consolidated statement of comprehensive income when theemployees have rendered their services.
Actuarial gains and losses arising in the measurement of both the plan liabilities and the plan assets, including the limit in IFRIC 14, are recognized directlyunder “Equity − Retained earnings.”
F−43

Table of Contents
m) Conversion of balances in foreign currency
Transactions carried out by each company in a currency other than its functional currency are recorded using the exchange rates in effect as of the date ofeach transaction. During the year, any differences that arise between the exchange rate recorded in accounting and the rate prevailing as of the date ofcollection or payment are recorded as “Foreign currency exchange differences” in the comprehensive income statement.
Likewise, at the end of each period, balances receivable or payable in a currency other than each company’s functional currency are converted using theperiod−end exchange rate. Any valuation differences are recorded as “Foreign currency exchange differences” in the comprehensive income statement.
The Group has established a policy to hedge the portion of its subsidiaries’ revenue that is directly linked to variations in the US dollar by obtainingfinancing in this currency. Exchange differences related to this debt, as they are cash flow hedge transactions, are charged, net of taxes, to a reserve accountin equity and recorded in income during the period in which the hedged cash flows are realized. This term has been estimated at ten years.
n) Current / Non−current classification
In these consolidated statements of financial position, assets and liabilities expected to be recovered or settled within twelve months are presented as currentitems and those assets and liabilities expected to be recovered or settled in more than twelve months are presented as non−current items.
Should the Company have any obligations that mature in less than twelve months but can be refinanced over the long term at the Company’s discretion,through unconditionally available credit agreements with long−term maturities, such obligations may be classified as long−term liabilities.
o) Income tax
Income taxes for the period are determined as the sum of current taxes from the Group’s different subsidiaries and result from applying the tax rate to thetaxable base for the period, after allowable deductions have been made, plus any changes in deferred tax assets and liabilities and tax credits, both for taxlosses and deductions. Differences between the book value and tax basis of assets and liabilities generate deferred tax asset and liability balances, which arecalculated using tax rates expected to be in effect when the assets and liabilities are realized.
Current taxes and changes in deferred tax assets and liabilities not arising from business combinations are recorded in income or in equity in the statementof financial position, based on where the gains or losses originating them were recorded.
Deferred tax assets and tax credits are recognized only when it is likely that future tax gains will be sufficient to recover deductions for temporarydifferences and make use of tax credits.
Deferred tax liabilities are recognized for all temporary differences, except those derived from the initial recognition of goodwill and those that arose fromvaluing investments in subsidiaries, associates and jointly−controlled companies in which the Group can control their reversal and where it is likely thatthey will not be reversed in the foreseeable future.
Any deductions that can be applied to current tax liabilities are credited to earnings within the line item “Income tax expenses”, except when doubts existabout their tax realization, in which case they are not recognized until they are effectively realized, or when they correspond to specific tax incentives, inwhich case they are recorded as grants.
At each accounting period close, the Company reviews the deferred taxes it has recorded, both assets and liabilities, in order to ensure they remain currentand otherwise make any necessary corrections based on the results of this analysis.
F−44

Table of Contents
p) Revenue and expense recognition
Revenues and expenses are recognized on an accrual basis.
Revenue is recognized when the gross inflow of economic benefits arising in the course of the Group’s ordinary activities in the period occurs, provided thatthis inflow of economic benefits results in an increase in total equity that is not related to contributions from equity participants and that these benefits canbe measured reliably. Revenue is measured at the fair value of the consideration received or receivable that gives rise to the revenue.
Revenue associated with the rendering of services is only recognized if it can be estimated reliably, based on the stage of completion of the service renderedat the date of the statement of financial position.
The Group excludes from the revenue figure gross inflows of economic benefits it receives when it acts as an agent or commission agent on behalf of thirdparties, and only recognizes as revenue economic benefits received for its own account.
When goods or services are exchanged or swapped for goods or services of a similar nature, the exchange is not regarded as a revenue−generatingtransaction.
The Group records the net amount non−financial asset purchase or sale contracts settled for the net amount of cash or through some other financialinstruments. Contracts entered into and maintained for the purpose of receiving or delivering these non−financial assets are recognized on the basis of thecontractual terms of the purchase, sale, or usage requirements expected by the entity.
Interest income (expense) is recognized at the effective interest rate applicable to the outstanding principal over the repayment period.
q) Earnings per share
Basic earnings per share are calculated by dividing net income attributable to owners of the Parent (the numerator) by the weighted average number ofordinary shares outstanding (the denominator) during the period, excluding the average number of shares of the Parent held by the Group, if any.
During the 2011, 2010, and 2009 fiscal years, the Group did not engage in any transaction of any kind with potential dilutive effects leading to dilutedearnings per share that could differ from basic earnings per share.
r) Dividends
Article 79 of the Chilean Companies Act establishes that, unless unanimously agreed otherwise by the shareholders of all issued shares, listed corporationsmust distribute a cash dividend to its shareholders on a yearly basis, prorated by the shares owned or the proportion established in the company’s by−laws ifthere are preferred shares, of at least 30% of net income for each period, except when accumulated losses from prior years must be absorbed.
As it is practically impossible to achieve a unanimous agreement given Enersis’ highly fragmented share capital, as of the end of each period the amount ofthe dividend obligation to its shareholders is determined, net of interim dividends approved during the year, and then accounted for in “Trade and othercurrent payables” or “Accounts payable to related companies,” as appropriate, and charged to Equity.
Interim and final dividends are deducted from equity as soon as they are approved by the competent body, which in the first case is normally the Company’sBoard of Directors and in the second case is the Ordinary Shareholders’ Meeting.
F−45

Table of Contents
s) Systems of share−based remunerations
When Group employees take part in remuneration plans tied to the price of Enel stock, and the cost of the plan is borne by this company, the Group recordsthe fair value of the award as an expense for employee benefits. At the same time, an increase is recorded to equity under Other Reserves for the sameamount, representing Enel’s contribution (see Note 8.3).
t) Cash flow statement
The cash flow statement reflects the changes in cash that took place during the period in relation to both continuing and discontinued operations, calculatedusing the indirect method. The following terms are used in the consolidated cash flow statements:
• Cash flows: inflows and outflows of cash or cash equivalents, which are defined as highly liquid investments maturing in less than three months witha low risk of changes in value.
• Operating activities: the principal revenue−producing activities of the Group and other activities that cannot be considered investing or financingactivities.
• Investing activities: the acquisition and disposal of long−term assets and other investments not included in cash and cash equivalents
• Financing activities: activities that result in changes in the size and composition of the total equity and borrowings of the Group.
F−46

Table of Contents
4. SECTOR REGULATION AND ELECTRICITY SYSTEM OPERATIONS
There are different regulations in the Latin American countries in which the Group operates. The main characteristics of each business are discussed below.
4.1 Generation:
a) Chile
In Chile, the electricity sector is regulated by the General Law of Electrical Services (Chilean Electricity Law), also known as DFL No. 1 of 1982, of theMinistry of Mining —whose compiled and coordinated text was established in DFL No. 4 issued in 2006 by the Ministry of Economy (the ElectricityLaw)— as well as by an associated Regulation (D.S. No. 327 issued in 1998). Three government bodies are primarily responsible for enforcing this law: theNational Energy Commission (CNE), which has the authority to propose regulated tariffs (node prices) and to draw up indicative plans for the constructionof new generating units; the Superintendency of Electricity and Fuels (SEF), which supervises and oversees compliance with the laws, regulations, andtechnical standards that govern the generation, transmission, and distribution of electricity, as well as liquid fuels, and gas; and, finally, the recently createdMinistry of Energy, which will be responsible for proposing and guiding public policies on energy matters. It also oversees the SEF, the CNE, and theChilean Commission for Nuclear Energy (“ChCNE”), thus strengthening coordination and allowing for an integrated view of the energy sector. TheMinistry of Energy also includes the Agency for Energy Efficiency and the Center for Renewable Energy. The Chilean Electricity Law has also establisheda Panel of Experts whose main task is to resolve potential discrepancies among the players in the electricity market, including electricity companies, systemoperators, regulators, etc.
The Chilean electrical sector is divided into four electrical grids: the Sistema Interconectado Central (SIC), the Sistema Interconectado del Norte Grande(SING), and two separate medium−size grids located in southern Chile, one in Aysén and the other in Magallanes. The SIC, the main electrical grid, runs2,400 km longitudinally and connects the country from Taltal in the north to Quellon, on the island of Chiloe in the south. The SING covers the northernpart of the country, from Arica down to Coloso, covering a length of some 700 km.
The electricity industry is divided into three business segments: generation, transmission, and distribution, all operating in an interconnected andcoordinated manner, and whose main purpose is to supply electrical energy to the market at minimum cost while maintaining the quality and safety servicestandards required by the electrical regulations. Given their characteristics, the power transmission and distribution businesses are natural monopolies; thesesegments are regulated as such by the electricity law, which requires free access to networks and regulates rates.
Under the Chilean Electricity Law, companies engaged in generation and transmission on interconnected electrical grid must coordinate their operationsthrough a centralizing operating agent, the Centro de Despacho Económico de Carga (CDEC), in order to operate the system at minimum cost whilemaintaining reliable service. For this reason, the CDEC plans and operates the system, including the calculation of the so−called “marginal cost,” which isthe price assigned to CDEC−organized energy transfers occurring among power generating companies.
Therefore, a company’s decision to generate electricity is subject to the CDEC’s operation plan. On the other hand, each company is free to decide whetherto sell its energy to regulated or unregulated customers. Any surplus or deficit between a company’s sales to its customers and its energy supply is sold to,or purchased from, other generators at the spot market price.
F−47

Table of Contents
A power generating company may have the following types of customers:
(i) Regulated customers: Those residential and commercial consumers and small and medium−size businesses with a connected capacity equal to or lessthan 500 kW located in the concession area of a distribution company. Customers that consume from 500 kW to 2000 kW may choose to be regulated orunregulated clients. Until 2009, the transfer prices between generators and distribution companies were capped at a maximum value called the node price,which is regulated by the Ministry of Energy. Node prices are set every six months, in April and October, based on a report prepared by the CNE that takesinto account projections of expected marginal costs in the system over the next 48 months for the SIC and 24 months for the SING. Beginning in 2010, andas the node price contracts begin to expire, the transfer prices between generators and distributors will be replaced by the results of regulated biddingprocesses, with a price cap set by the authority every six months.
(ii) Unregulated customers: Those customers, mainly industrial and mining companies, with a connected capacity of over 2,000 kW. These consumers canfreely negotiate prices for electrical supply with generators and/or distributors. Customers with capacity between 500 and 2,000 kW, as indicated in thepreceding paragraph, have the option to contract energy at prices agreed upon with their suppliers or be subject to regulated prices, with a minimum stay ofat least four years under each pricing system.
(iii) Spot market: This represents energy and capacity transactions among generating companies that result from the CDEC’s coordination to keep thesystem running as economically as possible, where the surpluses (deficits) between a generator’s energy supply and the energy it needs to comply withbusiness commitments are transferred through sales (purchases) to (from) other generators in the CDEC. In the case of energy, transfers are valued at themarginal cost, while node prices for capacity are set every semester by the regulators.
In Chile, the capacity that must be paid to each generator depends on an annual calculation performed by the CDEC to determine the firm capacity of eachpower plant, which is not the same as the dispatched capacity.
Beginning in 2010 with the enactment of Law 20,018, distribution companies must have enough supply permanently available to cover their entire demandprojected for a period of three years; to do so, they must carry out long−term public bidding processes.
Regarding renewable energy, in April of 2008 Law 20,257 was enacted, which encourages the use of Non−Conventional Renewable Energies. The principalaspect of this law is that at least 5% of generators’ energy sold to its customers comes from renewable sources between years 2010 and 2014. Thisrequirement progressively increases by 0.5% from year 2015 until 2024, when a 10% renewable energy requirement will be reached.
b) The rest of Latin America
In the other Latin American countries where the Group operates, different regulations are enforced. In general, regulations in Brazil, Argentina, Peru, andColombia allow participation of private capital in the electricity sector, uphold free competition in electricity generation, and define criteria to avoid certainlevels of economic concentration and/or market practices that may cause a decline in this activity. Unlike Chile, state−owned companies participate in theelectricity sector together with private companies in the electricity generation, transmission, and distribution activities.
The participation of companies in different activities (generation, distribution, and commercial), is allowed, as long as these activities are properlyseparated, both from an accounting and corporate point of view. Nevertheless, the transmission sector is where the strictest restrictions are usually imposed,mainly due to its nature and the need to assure adequate access to all players.
F−48
Table of Contents
In regards to the main characteristics of the electricity generation business, it can be said that in general, these are open markets in which private players arefree to make their own investment decisions. The exceptions are: Brazil, a country which, based on the contractual needs of the distribution companies, theMinistry of Energy actively participates in the electricity system’s expansion by establishing capacity quotas by technology (separate bids for thermal,hydraulic, or renewable energies) or participates directly by organizing public bids for specific projects; and Argentina where, despite the government’spromotion of initiatives to encourage electricity investments, such as “Energia Plus,” installed capacity has not increased as much as expected. OnNovember 25, 2010, the Ministry of Energy and the participants in the electricity generation market signed an agreement that, among other aspects, seeks toincrease new generation project developments financed with funds that make up part of the outstanding debt that the Argentine government has withelectricity companies.
The operation in these countries is coordinated in a centralized manner in which an independent operator coordinates the dispatch of electrical charges. Except for Colombia, where charge dispatched is based on prices offered by the players, in the other countries charge dispatched is centralized, based onvariable production costs in order to ensure the fulfillment of the demand at a minimum cost for the system. From that dispatch, the marginal cost, whichdefines the price for spot transactions, is determined.
Nevertheless, in Argentina and Peru to some extent there is currently intervention in setting prices in these marginal generation markets. This has occurredin Argentina since the 2002 crisis, and in Peru as a result of a recent Emergency Law enacted in 2008 that defines an idealized marginal cost, consideringthat no actual restrictions exist on the transportation system for gas and electricity.
In Colombia, Brazil, Peru, and Argentina, generation players are able to sell energy through contracts in the regulated or unregulated markets, and to tradetheir surplus/deficit on the spot market. The unregulated market is focused on the segment of large users, although the limits that define this status vary ineach market. The principal differences among the markets involve how energy sales are regulated among generators and distributors and how regulatedprices are established for the determination of the tariffs charged to end users.
Initially, Argentine law contemplated that the selling price charged by generators to distributors would have to be obtained from a centralized calculation ofthe average spot price expected for the next six months. However, after the 2002 crisis, Argentine authorities have established the price arbitrarily, forcingintervention in the marginal system and provoking a mismatch between actual generation costs and payment of the demand through distributors.Additionally, energy that can be sold by generators is limited to the demand that each generator had sold via energy contracts during the May — June 2005period.
In Brazil, the regulated purchase price used in the determination of tariffs to end users is based on average prices of open bids, and there are separatebidding processes for existing and new energy. Bidding processes for new energy contemplate long−term generation contracts in which new generationprojects must cover the growth of demand foreseen by distributors. The open bids for existing energy consider shorter contractual terms and seek to coverthe distributors’ contractual needs arising from the expiry of prior contracts. Each bidding process is coordinated centrally. Authorities set maximum pricesand, as a result, contracts are signed where all distributors participating in the process buy pro rata from each offering generator.
In Colombia, distributors are free to decide their supply, being able to define the conditions of public bidding processes where they acquire energy for theregulated market, and they are able to buy energy on the spot market. Prices paid by end users reflect an average of the purchase price. Since 2004, theCREG (the Colombian Energy and Gas Regulation Commission) is working on a proposal to modify the energy contracting system in the Colombianmarket. Under the proposal, the existing contracting system will be modified into an electronic contract system. This mechanism will replace the currentbidding process for energy auctions with standardized commercial conditions, where contractual demand will be treated as a single aggregate demand.
F−49

Table of Contents
In Peru, as in Chile, distributors are obligated to enter into contracts, and the legislation was amended so that public bids for energy would be based ondistributor requirements. Currently, there are only a few contracts between generators and distributors that are in force at “bar price” (the equivalent of thenode price in Chile), which is set on the basis of centralized calculations. However, since 2007 contracts are based on public bids. Authorities approve theterms and conditions for the bidding and set the maximum price for each bid.
With the exception of Colombia, in all the other countries there is some statute in force that promotes the use of renewable energy. In practical terms, thereare no incentives or obligations similar to those in Chile that would push these renewable energy technologies to be competitive on a larger scale.Authorities are responsible for promoting specific bidding processes under special conditions in order to make these projects viable.
4.2 Distribution:
In the five countries where the Group operates, selling prices charged to clients are based on the purchase price paid to generators plus a componentassociated with the value added in distribution. Regulators set this value periodically through reviews of distribution tariffs. As a result, distribution isessentially a regulated activity.
a) Chile
In Chile, the distribution value added (VAD) is established every four years. For this, the local regulator, (i.e. the CNE) classifies companies in accordancewith typical areas that group companies with similar distribution costs. A distribution company’s return on investment depends on the company’sperformance compared to model company standards defined by the regulator. In April 2009, the regulator published tariff formulas which are effective forthe period November 2008 through November 2012.
b) The rest of Latin America
Similarly, in Peru, the VAD is calculated every 4 years, also using a model company method based on a typical area. The tariffs for the 2009−2013 periodwere published in October 2009.
In Brazil, there are three types of tariff adjustments: i) Ordinary Tariff Reviews (RTO) which are conducted periodically in accordance with the provisionsin the concession contracts (in Coelce every 4 years and in Ampla every 5 years); (ii) Annual adjustment (IRT); and (iii) Extraordinary Reviews.
The latest RTO for Ampla is applicable for the 2009−2014 periods and for Coelce for the 2007−2011 period. At the end of 2011, the ANEEL regulatingagency issued the modifications to the tariff calculation methods used for the third round of periodic reviews; one of the major changes is the decrease in theWACC. The most recent annual adjustments made by ANEEL were in April 2010 for Coelce and in March 2011 for Ampla. Coelce’s RTO for the2011−2015 period and the annual readjustment are in process, using the new tariff methodology for the third round, and will go into effect in April 2012.
In Colombia, the CREG established in 2008 a new methodology for calculating the rate of return applicable to compensation for distribution, as well as anew methodology for establishing the charges for regional transmission and local distribution systems use. In October 2009, the CREG published thedistribution charges for Codensa for the period 2009−2013. In 2011, the CREG carried out a study of the productivity index of the sales industry and issuedthe final resolutions of the Sales Regulations and loss management plans. The sales charge will be reviewed in 2012.
In Argentina, tariffs were frozen after the country’s debt default in 2001. Edesur’s tariff restructuring started in 2007 with the enforcement of the “ActaAcuerdo.” Starting in that year, tariff adjustments (positive impact in the VAD) and inflation readjustments (via the cost monitoring mechanism, MMC)have been made. The last adjustment through the application of the MMC was for May−October 2007, and MMC adjustments not transferred to tariffs forsubsequent periods remain pending to date. In July 2008, increases were authorized for clients with consumption in excess of 650kWh quarterly, and inOctober 2008, the government approved an increase for consumption in excess of 1,000 kWh per month; this last increase is a pass−through to thegenerators and was suspended between June and September 2010
F−50

Table of Contents
but restarted in October 2010. During the first few months of 2010, Edesur submitted the rate charts applying Resolution 467/08 and the complementaryinformation requested by ENRE; the Comprehensive Tariff Review (RTI) of Edesur’s concession contract covered in the Renegotiation Agreement Accordis still pending. At the end of 2011, the Government announced a reduction in state subsidies, and a seasonal price increase was established for customers incertain businesses and industries and for some segments of residential customers in specific geographic areas.
• Market for unregulated customers
In the countries where the Group operates, distributors can supply their customers under a regulated or freely agreed conditions. The supply limitationsimposed on the unregulated market are as follows:
Country kW thresholdArgentina > 30 kW
Brazil > 3,000 kWChile > 500 kW
Colombia > 100 kW or 55 MWh−monthPeru > 200 kW (*)
(*) In April 2009, Peru established that clients between 200 and 2,500 kW could choose between the regulated and unregulated markets.
• Limits on integration and concentration
In general, current legislation defends free competition and defines criteria to avoid certain levels of economic concentration and/or market practices thatwould lead to a deterioration of the market.
In principle, the regulators allow the participation of companies in different activities (e.g. generation, distribution, and commercialization) as long as thereis an adequate separation of each activity, for both accounting and company purposes. Nevertheless, most of the restrictions imposed involve the transportsector mainly because of its nature and the need to guarantee adequate access to all agents. In Argentina and Colombia there are specific restrictions ifgeneration or distribution companies want to become majority shareholders in transportation companies.
Additionally, in Colombia, companies that were created after 1994 cannot be vertically integrated. Furthermore, generation companies cannot participate ina distribution company if the participation rate is greater than 25% and vice versa. Moreover, companies in Peru need a permit from the local authority ifthey have an ownership interest of more than 5% in one business and want to participate in another business.
Regarding concentration in a specific sector, in Argentina and Chile, there are no specific limits that affect the vertical or horizontal integration of acompany. On the other hand, in Peru, integrations are subject to authorization if such integration is 5% vertical and 15% horizontal. In Colombia, for thegeneration and commercialization sectors, companies cannot have a market share that exceeds 25%. Finally in Brazil, since 2007 there have been norestrictions to generation integration. As for distribution, there are concentration limits, both on a national and electric subsystem level. On a national level,the authorities allow a 20% concentration in both segments. As for the electric subsystem, the limit is 35% of the North and Northeast subsystems and 25%of the South, Southeast, and Midwest subsystems.
With regard to consolidations and mergers between agents of the same segment, current regulation requires authorization from the local regulator.
F−51

Table of Contents
• Access to the grid
In the countries where the Group operates, the right of access and toll or access price is regulated by the local authority.
In Peru, the toll−setting process that recognizes investments in Secondary and Complementary Transmission Systems for the period July 2006 through April2013, and which are effective starting November 1, 2009, was concluded back in 2009.
In Chile, during 2010, local authorities developed part of the tariff process for determining the Subtransmission System’s Annual Value for the period 2011through 2014. The CNE published the final technical report on May 13, 2011. Chilectra submitted its discrepancies to the Panel of Experts on June 3, 2011and explained the grounds for these discrepancies in a public hearing on June 16. The Panel of Experts issued its ruling on August 8. The CNE incorporatedthis ruling and drew up a final technical report, which the Ministry of Energy is expected to use to publish its subtransmission tariff decree in the firstquarter of 2012. The Decree will be retroactive to January 2011.
5. CASH AND CASH EQUIVALENTS
a) The detail of cash and cash equivalents as of December 31, 2011, 2010, and 2009 is as follows:
Balance at12−31−2011 12−31−2010 12−31−2009
Cash and Cash Equivalents ThCh$ ThCh$ ThCh$
Cash balances 1,287,851 279,960 2,033,228Bank balances 269,065,858 186,975,512 280,296,850Time deposits 398,152,529 518,742,837 631,827,134Other fixed−income instruments 551,415,030 255,356,728 220,743,609
Total 1,219,921,268 961,355,037 1,134,900,821
Time deposits have a maturity of three months or less from their date of acquisition and accrue the market interest for this type of investments. Otherfixed−income investments are mainly comprised of resale agreements maturing in 30 days or less. There are no amounts of cash and cash equivalentsbalances held by the Group that are not available for its use.
b) The detail of cash and cash equivalents by currency is as follows:
12−31−2011 12−31−2010 12−31−2009Currency ThCh$ ThCh$ ThCh$
Chilean peso 535,594,942 322,190,328 171,799,777Argentine peso 27,058,157 45,357,753 28,624,735Colombian peso 268,199,899 150,964,209 395,598,094Brazilian real 278,155,164 309,896,646 370,793,677Peruvian sol 38,902,348 39,467,666 21,485,345U.S. dollar 72,010,758 93,478,435 146,599,193
Total 1,219,921,268 961,355,037 1,134,900,821
F−52

Table of Contents
c) The following table shows the amounts received from the disposal of subsidiaries:
12−31−2011 12−31−2010 12−31−2009Disposal of subsidiaries ThCh$ ThCh$ ThCh$
Inflow received for disposals in cash and cash equivalents 31,486,668 — (23,744,357)Inflow of cash and cash equivalents in entities disposed of (18,824,434) — 3,832,195Assets and liabilities other than cash and cash equivalents in entities
disposed of (21,311,336) — 12,828,632Total consideration received for disposals (*) (8,649,102) — (7,083,530)
(*) See Note 2.4.1
6. OTHER FINANCIAL ASSETS
The detail of other financial assets as of December 31, 2011 and 2010 is the following:
Balance atCurrent Non−current
12−31−2011 12−31−2010 12−31−2011 12−31−2010Other financial assets ThCh$ ThCh$ ThCh$ ThCh$
Available−for−sale financial investments — unquoted equity securities — — 2,805,803 2,422,288Available−for−sale financial investments — quoted equity securities — — 86,852 88,909Post−employment benefits (Surplus) (*) — — — 3,352,698Financial assets held to maturity — 7,735,440 20,793,960 29,461,230Hedging derivatives (**) 748,078 64,518 12,178,355 27,212,944Non−hedging derivatives (***) 47,504 17,551 — 91,262Other assets 143,638 — 1,490,091 339,391Total 939,220 7,817,509 37,355,061 62,968,722
(*) See Note 23.2(**) See Note 20.2.a(***) See Note 20.2.b
F−53

Table of Contents
7. TRADE AND OTHER RECEIVABLES
(a) The detail of trade and other receivables as of December 31, 2011 and 2010 is as follows:
Balance at12−31−2011 12−31−2010
Current Non−current Current Non−currentTrade and other Receivables, Gross ThCh$ ThCh$ ThCh$ ThCh$
Trade and other receivables, gross 1,166,221,729 444,327,960 1,216,533,291 335,892,068Trade receivables, gross 1,064,550,354 182,387,693 1,124,250,876 206,462,719Other receivables, gross 101,671,375 261,940,267 92,282,415 129,429,349
Balance at12−31−2011 12−31−2010
Current Non−current Current Non−currentTrade and other Receivables, Net ThCh$ ThCh$ ThCh$ ThCh$
Trade and other receivables, net 977,602,388 443,328,450 1,038,098,240 319,567,960Trade receivables, net (1) 882,853,961 181,435,318 953,663,462 190,617,091Other receivables, net (2) 94,748,427 261,893,132 84,434,778 128,950,869
(1) At December 31, 2010, this item included ThCh$ 40,398,048 corresponding to receivables due to our subsidiary Cachoeira Dourada S.A. fromCompañía de Electricidade de Goiás (CELG), a state−owned entity of the State of Goiás, from previous years. CELG finally obtained the financing neededto meet its obligations, and the amounts owed were paid in December 2011.
(2) The non−current portion includes the financial asset classified as loans and receivables measured at amortized cost arising from application of IFRIC12, Service Concession Arrangements, totaling ThCh$ 212,947,609 as of December 31, 2011 and ThCh$ 122,301,426 as of December 31, 2010.
(3) In general, balances in trade and other receivables do not accrue interest, except for receivables that arise through the application of IFRIC 12.
(4) There are no significant trade and other receivables balances held by the Group that are not available for its use.
(5) No single customer on an individual basis holds a balance that is significant in terms of the Group’s total sales or receivables.
(6) Refer to Note 8.1 for detailed information on amounts, terms, and conditions associated with accounts receivable from related companies.
F−54

Table of Contents
(b) As of December 31, 2011 and 2010, the balance of unimpaired past due trade receivables is as follows:
Balance atTrade accounts receivable past due and unpaid butnot impaired
12−31−2011ThCh$
12−31−2010ThCh$
Less than three months 81,387,613 124,589,681Between three and six months 38,450,793 33,311,703Between six and twelve months 30,144,689 29,193,251More than twelve months 114,487,265 147,592,648Total 264,470,360 334,687,283
(c) The reconciliation of changes in the allowance for impairment of trade receivables is as follows:
Current andNon−current
Trade receivables past due and impaired ThCh$Balance at January 1, 2010 165,332,661Increases (decreases) for the year (*) 95,391,111Amounts written off (60,563,032)Foreign currency translation differences (5,401,581)Balance at December 31, 2010 194,759,159Increases (decreases) for the year (*) 18,649,480Amounts written off (7,046,353)Foreign currency translation differences (16,743,435)Balance at December 31, 2011 189,618,851
(*) See Note 28: Depreciation, amortize ation, and impairment losses.
F−55

Table of Contents
8. BALANCES AND TRANSACTIONS WITH RELATED COMPANIES
Related party transactions are performed at current market conditions.
Balances and transactions between the Company and its subsidiaries and jointly controlled entities have been eliminated on consolidation and are notitemized in this note.
As of the date of these financial statements, no guarantees have been given or received nor has any allowance for bad or doubtful accounts been recordedwith respect to receivable balances for related party transactions.
8.1 Balances and transactions with related companies
The balances of accounts receivable and payable between the Company and its non−consolidatable related companies are as follows:
a) Accounts receivable from related companies
Balance atTaxpayer ID Current Non−CurrentNo. Term of 12−31−2011 12−31−2010 12−31−2011 12−31−2010(RUT) Company Country Nature of Relationship Currency Description of Transaction Transaction ThCh$ ThCh$ ThCh$ ThCh$
Foreign Empresa Eléctrica dePiura S.A.
Peru Common ImmediateParent
Sol Other services Less than 90 days 208,118 144,144 — —
Foreign Endesa Energía S.A.U. Spain Common ImmediateParent
CPs Other services Less than 90 days 30,857 57,725 — —
Foreign Endesa LatinoaméricaS.A.U.
Spain Related to ImmediateParent
US$ Expenses Less than 90 days 26,165 26,166 — —
Foreign Endesa LatinoaméricaS.A.U.
Spain Related to ImmediateParent
CPs Other services Less than 90 days — 27,787 — —
Foreign Endesa Spain Spain Related to ImmediateParent
US$ Other services Less than 90 days 4,230 4,230 — —
Foreign Endesa Spain Spain Related to ImmediateParent
CH$ Other services Less than 90 days — 47,229 — —
96,524,140−K Empresa ElectricaPanguipulli S.A.
Chile Common ImmediateParent
CH$ Other services Less than 90 days 107 — — —
96,880,800−1 Empresa ElectricaPuyehue S.A.
Chile Common ImmediateParent
CH$ Other services Less than 90 days 7 — — —
Foreign Generalima S.A.C. Peru Common ImmediateParent
CH$ Other services Less than 90 days 311,013 134,482 — —
Foreign Generalima S.A.C. Peru Common ImmediateParent
Sol Other services Less than 90 days 578 — — —
Foreign SACME S.A. Argentina Associate Ar$ Other services Less than 90 days 630,091 312,951 — —Foreign Endesa Cemsa S.A. Argentina Associate Ar$ Commercial current accountLess than 90 days 23,839,664 18,413,497 — —Foreign Endesa Cemsa S.A. Argentina Associate Ar$ Other Less than 90 days 16,724 — — —76,788,080−4 GNL Quintero S.A. Chile Associate CH$ Other services Less than 90 days 8,926,072 458,094 — —76,418,940−k GNL Chile S.A. Chile Associate US$ Other services Less than 90 days 591,541 533,218 — —76,418,940−k GNL Chile S.A. Chile Associate CH$ Loans Less than 90 days 379,862 312,084 — —Foreign PH Chucas Costa Rica Costa Rica Common Immediate
ParentCH$ Other services Less than 90 days 317,563 — — —
Total 35,282,592 20,471,607 — —
b) Accounts payable to related companies
Balance atCurrent Non−Current
Taxpayer ID 12−31−2011 12−31−2010 12−31−2011 12−31−2010
No. (RUT) Company Country Nature of Relationship CurrencyDescription ofTransaction Term of Transaction ThCh$ ThCh$ ThCh$ ThCh$
Foreign Empresa Eléctrica dePiura S.A.
Peru Common ImmediateParent
Sol Other services Less than 90 days 995,885 858,345 — —
Foreign Endesa LatinoaméricaS.A
Spain Related to ImmediateParent
Ar$ Dividends Less than 90 days 130,841 127,669 — —
Foreign Endesa LatinoaméricaS.A
Spain Related to ImmediateParent
CH$ Dividends Less than 90 days 69,240,261 89,382,016 — —
Foreign Endesa LatinoaméricaS.A
Spain Related to ImmediateParent
Real Dividends Less than 90 days 1,207,252 — — —
Foreign Endesa LatinoaméricaS.A.
Spain Related to ImmediateParent
CPs Dividends Less than 90 days 27,306,717 — — —
Foreign Endesa LatinoaméricaS.A. (1)
Spain Related to ImmediateParent
US$ Loans Less than one year — 2,428,068 — 1,084,290
96,524,140−K Empresa ElectricaPanguipulli S.A.
Chile Common ImmediateParent
CH$ Other services Less than 90 days 182,599 — — —
96,880,800−1 Empresa ElectricaPuyehue S.A.
Chile Common ImmediateParent
CH$ Other services Less than 90 days 60,659 — — —
Foreign SACME Argentina Associate Ar$ Other services Less than 90 days 152,402 139,826 — —96,806,130−5 Electrogas S.A. Chile Associate CH$ Other services Less than 90 days 538,373 217,889 — —Foreign Endesa Cemsa S.A. Argentina Associate Ar$ Commercial Current
AccountLess than 90 days 19,615,744 15,953,845 — —
Foreign Endesa Cemsa S.A. Argentina Associate Real Services rendered Less than 90 days 21,546,571 15,658,298 — —Foreign Endesa Cemsa S.A. Argentina Associate Ar$ Other services Less than 90 days 3,081 3,006 — —Foreign Endesa Cemsa S.A. Argentina Associate CH$ Other services Less than 90 days 68,039 — — —76,418,940−k GNL Chile S.A. Chile Associate CH$ Other services Less than 90 days 8,517,317 23,427,988 — —Foreign Carboex S.A. Spain Common Immediate
ParentCH$ Other services Less than 90 days 5,586,847 5,310 — —
Foreign TermoeléctricaManuel Belgrano S.A.
Argentina Associate Ar$ Commercial CurrentAccount
Less than 90 days 846 — — —
Foreign Enel Energy EuropeS.L.U.
Italy Ultimate ControllingParty
CPs Other services Less than 90 days 124,977 — — —
Foreign Enel Energy EuropeS.L.U.
Italy Ultimate ControllingParty
CH$ Other services Less than 90 days 1,613,683 — — —
Foreign Enel Energy EuropeS.L.U.
Italy Ultimate ControllingParty
Euros Other services Less than 90 days 13,589 — — —
Foreign Enel Energy EuropeS.L.U.
Italy Ultimate ControllingParty
Real Other services Less than 90 days 44,705 — — —
Foreign Enel DistribuzioneS.p.A
Italy Ultimate ControllingParty
CH$ Other services Less than 90 days 4,782 — — —
Foreign Enel Green PowerMexico
Mexico Common ImmediateParent
CH$ Other services Less than 90 days 222,468 — — —
Total 157,177,638 148,202,260 — 1,084,290
(1) The balance payable to Endesa Latinoamérica S.A.U. relates to a loan granted to Compañía de Interconexión Energética S.A. (CIEN) to purchase machinery and equipment necessary to complete the construction of its secondtransmission line. The loan is denominated in US dollars, bears an annual interest rate of LIBOR + 2.73% and matures in May 2012

F−56

Table of Contents
c) Significant transactions and income/expense effects:
Transactions with non−consolidatable related companies and their effects in profit or loss are as follows:
Taxpayer ID No.(RUT) Company Country Nature of Relationship Description of Transaction
12−31−2011Total
ThCh$
12−31−2010Total
ThCh$
12−31−2009Total
ThCh$
Foreign Empresa Eléctrica de Piura S.A. Peru Common Immediate Parent Other operating income 57,534 162,670 —Foreign Empresa Eléctrica de Piura S.A. Peru Common Immediate Parent Other fixed operating expenses — (56,482) —Foreign Empresa Eléctrica de Piura S.A. Peru Common Immediate Parent Energy purchases (13,352,506) (14,267,877) (9,528,999)Foreign Empresa Eléctrica de Piura S.A. Peru Common Immediate Parent Other services rendered 210,546 191,034 243,809Foreign Empresa Eléctrica de Piura S.A. Peru Common Immediate Parent Energy sales 97,878 3,512 968,848Foreign Endesa Energía S.A.U. Spain Common Immediate Parent Other operating income 48,844 39,585 35,352Foreign Endesa Latinoamérica S.A Spain Immediate Parent Financial interest 118,904 (178,114) 1,533,007Foreign Endesa Latinoamérica S.A Spain Immediate Parent Other fixed operating expenses (4,490) — —Foreign Endesa Servicios S.A.U. Spain Common Immediate Parent Other services rendered 23,148 70,331 480,584Foreign Endesa Servicios S.A.U. Spain Common Immediate Parent Other fixed operating expenses (1,165) (7,380) —Foreign Endesa Servicios S.A.U. Spain Common Immediate Parent Other sales 75,041 127,091 —Foreign Eléctrica Cabo Blanco S.A.C. Peru Common Immediate Parent Other services rendered — 2,705 —Foreign Generalima S.A.C. Peru Common Immediate Parent Other services rendered 598,940 395,480 113,00176,418,940−k GNL Chile S.A. Chile Associate Gas consumption (161,567,799) (157,412,913) —76,418,940−k GNL Chile S.A. Chile Associate Other services rendered 39,006 — —76,788,080−4 GNL Quinteros S.A. Chile Associate Energy sales 6,824,604 418,290 398,26776,788,080−4 GNL Quinteros S.A. Chile Associate Loans — — (247,192)76,788,080−4 GNL Quinteros S.A. Chile Associate Other services rendered — 86,563 37,65196,976,600−0 Gestión Social S.A. (*) Chile Related to Director Other services rendered 75,693 91,412 78,34578,488,290−k Tironi y Asociados S.A. (*) Chile Related to Director Other services rendered 33,703 62,602 17,243Foreign SACME Argentina Associate Outsourced services (945,433) (759,389) (759,968)96,880,800−1 Empresa Eléctrica Puyehue S.A. Chile Common Immediate Parent Energy purchases (2,277,414) (1,919,788) —96,880,800−2 Empresa Eléctrica Puyehue S.A. Chile Common Immediate Parent Energy sales 43,114 48,042 —96,524,140−K Empresa Eléctrica Panguipulli S.A. Chile Common Immediate Parent Energy purchases (3,813,927) (3,554,055) —96,524,140−K Empresa Eléctrica Panguipulli S.A. Chile Common Immediate Parent Energy sales 131,038 8,876 —Foreign Enel S.p.A. Italy Ultimate Controlling Party Other services rendered — — 688,898Foreign Enel S.p.A. Italy Ultimate Controlling Party Other sales — 175,358 —Foreign Enel Energy Europe S.L.U. Italy Ultimate Controlling Party Other services rendered 1,389,272 — —96,806,130−5 Electrogas S.A. Chile Associate Gas transportation tolls (2,914,936) (2,814,618) (1,239,471)Foreign Carboex S.A.U. Spain Common Immediate Parent Other services rendered (39,042,866) — —Foreign Termoeléctrica Manuel Belgrano S.A. Argentina Associate Other financial income 286,516 — —Foreign Termoeléctrica José de San Martín S.A.Argentina Associate Other financial income 211,530 — —Foreign ENEL Green Power Mexico Mexico Common Immediate Parent Other services rendered 19,216 — —Foreign PH Chucas Costa Rica Costa Rica Common Immediate Parent Other services rendered 419,356 — —76,583,350−7 Konecta Chile S.A. Chile Associate Loans — — 49,99276,583,350−8 Konecta Chile S.A. Chile Associate Other variable expenses — (22,179) —76,583,350−7 Konecta Chile S.A. Chile Associate Other services rendered 29,788 170,762 3,028
Total (213,186,865) (178,938,482) (7,127,605)
Transfers of short−term funds between related companies are treated as current cash transactions, with associated variable interest rates based on marketconditions. The resulting amounts receivable or payable are usually at 30 days term, with automatic rollover for the same term and amortization in line withcash flows.
(*) Companies with a connection to Enersis Director Eugenio Tironi Barrios.As of December 31, 2011, balance pending payment to the companySociedad Gestión Social S.A. is ThCh$ 4,119. At the end of the 2010 fiscal year, the balance payable was ThCh$ 17,097.
8.2 Board of Directors and key management personnel
Enersis is managed by Board of Directors which consists of seven members. Each director serves for a three−year term after which they can be reelected.
The Board of Directors was elected at the Ordinary Shareholders Meeting held on April 26, 2011. The Chairman, Vice Chairman, and Secretary weredesignated at the Board meeting held on April 27, 2011.
F−57

Table of Contents
a) Accounts receivable and payable and other transactions
• Accounts receivable and payable
There are no outstanding amounts receivable or payable between the Company and the members of the Board of Directors and key management personnel.
• Other transactions
No other transactions have taken place between the Company and the members of the Board of Directors and key management personnel.
b) Compensation for Directors.
In accordance with Article 33 of Law No.18,046 governing stock corporations, the compensation of Directors is established each year at the OrdinaryShareholders Meeting of Enersis S.A.
The remuneration consists of paying a variable annual compensation equal to one one−thousandth of the profit for the year (attributable to Shareholders ofthe company). Also, each member of the Board will be paid a monthly compensation, one part a fixed monthly fee and another part dependent on meetingsattended. The remuneration breaks down as follows:
• 101 UF as a fixed monthly fee, and
• 66 UF as per diem for each Board meeting attended.
The amounts paid for the monthly fee will be treated as payment in advance of the variable annual compensation described above. As stated in the by−laws,the remuneration for the Chairman of the Board will be twice that of a Director, and the compensation of the Vice Chairman will be 50% higher than that ofa Director.
Any advance payments received will be deducted from the annual variable compensation, with no reimbursement if the annual variable compensation islower than the total amount paid in advances. The variable compensation will be paid after the Ordinary Shareholders’ Meeting approves the AnnualReport, Balance Sheet and Financial Statements, and the Independent Auditors’ Reports and Account Inspectors’ Reports for the year ending December 31,2011.
If any Director of Enersis S.A. is a member of more than one Board in any Chilean or foreign subsidiaries and/or associates, or holds the position of directoror advisor in other Chilean or foreign companies or legal entities in which Enersis S.A. has a direct or indirect ownership interest, that Director can becompensated for his/her participation in only one of those Boards.
The Executive Officers of Enersis S.A. and/or any of its Chilean or foreign subsidiaries or associates will not receive any compensation or per diem if theyhold the position of director in any of the Chilean or foreign subsidiaries or associates of Enersis S.A. Nevertheless, the executives may receive suchcompensation or per diem provided it is authorized as payment in advance of the variable portion of their remuneration received from the respectivecompanies by which the executives are employed.
Directors Committee:
Each member of the Directors Committee will receive a variable remuneration equal to 0.11765 thousandth of the profit for the year (attributable to ownersof parent). Also each member will be paid a monthly compensation, one part in a fixed monthly fee and another part dependent on meetings attended.
F−58

Table of Contents
This remuneration is broken down as follows:
• 38.00 UF as a fixed monthly fee, and• 18.00 UF as per diem for each Board meeting attended.
The amounts paid for the monthly fee will be treated as payment in advance of the variable annual compensation described above.
Any advance payments received will be deducted from the annual variable compensation, with no reimbursement if the annual variable compensation islower than the total amount paid in advances. The variable compensation will be paid after the Ordinary Shareholders’ Meeting approves the AnnualReport, Balance Sheet and Financial Statements, and the Independent Auditors’ Reports and Account Inspectors’ Reports for the year ending December 31,2011.
The following tables show details of the compensation paid to the members of the Board of Directors as of December 31, 2011 and 2010:
12−31−2011
Taxpayer IDNo. (RUT) Name Position Period in Position
EnersisBoardThCh$
Board ofSubsidiaries or
AssociatesThCh$
DirectorsCommittee
ThCh$
AuditingCommittee
ThCh$5,710,967−K Pablo Yrarrázaval Valdés Chairman January − December 2011 80,062 — — —
Foreign Andrea Brentan (1) Vice Chairman January − December 2011 — — — —48,070,966−7 Rafael Miranda Robredo Director January − December 2011 39,256 — — —5,719,922−9 Leonidas Vial Echeverría (2) Director January − December 2011 40,031 — 13,018 —6,429,250−1 Rafael Fernández Morandé (2) Director January − December 2011 40,031 — 13,410 —4,132,185−7 Hernán Somerville Senn Director January − December 2011 40,031 — 13,410 —5,715,860−3 Eugenio Tironi Barrios Director January − December 2011 40,031 — — —
TOTAL 279,442 — 39,838 —
12−31−2010
Taxpayer IDNo. (RUT) Name Position Period in Position
EnersisBoardThCh$
Board ofSubsidiaries or
AssociatesThCh$
DirectorsCommittee
ThCh$
AuditingCommittee
ThCh$5,710,967−K Pablo Yrarrázaval Valdés Chairman January − December 2010 55,023 — 759 —48,070,966−7 Rafael Miranda Robredo Director January − December 2010 27,511 — —5,719,922−9 Leonidas Vial Echeverría (2) Director April − December 2010 19,138 — 6,638 —6,429,250−1 Rafael Fernández Morandé (2) Director April − December 2010 19,138 — 6,638 —4,132,185−7 Hernán Somerville Senn Director January − December 2010 26,743 — 8,665 1,5205,715,860−3 Eugenio Tironi Barrios Director January − December 2010 26,750 — 764 —5,206,994−7 Patricio Claro Grez (3) Director January − April 2010 8,373 — 2,284 1,520
TOTAL 182,676 — 25,748 3,040
12−31−2009
Taxpayer IDNo. (RUT) Name Position Period in Position
EnersisBoard
ThCh$
Board ofSubsidiaries or
AssociatesThCh$
DirectorsCommittee
ThCh$
AuditingCommittee
ThCh$5,710,967−K Pablo Yrarrázaval Valdés Chairman January − December 2009 55,012 — 8,388 —48,070,966−7 Rafael Miranda Robredo Vice Chairman January − December 2009 35,855 — — —48,077,275−K Pedro Larrea Paguaga Director January − July 2009 16,856 — — —4,132,185−7 Hernán Somerville Senn Director January − December 2009 28,280 — 9,163 3,8245,715,860−3 Eugenio Tironi Barrios Director January − December 2009 28,279 — — —5,206,994−7 Patricio Claro Grez Director January − December 2009 28,280 — 9,163 3,8244,108,103−1 Juan Eduardo Errázuriz Ossa Director January − October 2009 23,698 — — 3,061
TOTAL 216,260 — 26,714 10,709
(1) Mr. Andrea Brentan waived the fees and allowances due him as company Director.(2) Director since April 27, 2010.(3) Director until April 27, 2010.
c) Guarantees established by the Company in favor of the Directors
No guarantees have been given to the directors
F−59

Table of Contents
8.3 Compensation for key management personnel
a) Compensation received by key management personnel
Key Management Personnel
Taxpayer IDNo. (Rut) Name Position
22,298,662−1 Ignacio Antoñanzas Alvear Chief Executive Officer23,535,550−7 Massimo Tambosco (1) Deputy Chief Executive Officer9,574,296−3 Alfredo Ergas Segal Chief Financial Officer14,710,692−0 Angel Chocarro García Accounting Officer22,357,225−1 Ramiro Alfonsín Balza Planning and Control Officer23,363,734−3 Urrea Gómez Alba Marina (2) Internal Audit Officer7,006,337−9 Francisco Silva Bafalluy (3) General Services Officer11,470,853−4 Juan Pablo Larraín Medina Communications Officer23,014,537−7 Carlos Niño Forero (4) Human Resources Officer7,706,387−0 Eduardo Lopez Miller (2) Procurement Officer6,973,465−0 Domingo Valdés Prieto General Counsel
(1) Since October 1, 2010(2) Since April 1, 2010(3) Until November 2010 as Human Resources Officer and since December 1, 2010 as Regional General Services Officer(4) Since December 1, 2010
Compensation paid to key management personnel totaled ThCh$ 3,458,934 as of December 31, 2011 (ThCh$ 2,695,060 as of December 31, 2010). Thiscompensation includes the salaries paid and an estimate of the accrued short−term (annual bonuses) and long−term (severance indemnities payment)benefits.
Incentive plans for key management personnel
Enersis has implemented an annual bonus plan for its executives based on meeting company−wide objectives and on the level of their individualcontribution in achieving the overall goals of the Group. The plan provides for a range of bonus amounts according to seniority level. The bonuses paid tothe executives consist of a certain number of monthly gross remunerations.
b) Guarantees established by the Company in favor of key management personnel
No guarantees have been given to key management personnel.
8.4 Compensation plans linked to share price
There are no payment plans granted to the Directors or key management personnel based on the price of Enersis stock.
However, certain key Enersis personnel benefit from one of the Enel remuneration plans that is based on the price of its stock. The cost of this plan is borneby Enel and does not give rise to any payment obligations for Enersis. The main features of this plan are the following:
Restricted share units plan from 2008:
This plan is aimed at Enel Group executives, and its beneficiaries are divided into brackets. The basic number of units granted to each beneficiary wasdetermined on the basis of the average gross annual compensation of the bracket, as well as the price of Enel shares at the start of the period covered by theplan (January 2, 2008). The right to exercise the units is subordinate to the condition that the executives concerned remain employed within the Group, witha few exceptions.
F−60

Table of Contents
The plan establishes a suspensory operational objective (a “hurdle target”) as follows:
i) For the first 50% of the basic number of units granted, Group EBITDA for 2008−2009, calculated on the basis of the amounts specified in the budgetsfor those years; and
ii) For the remaining 50% of the basic number of units granted, Group EBITDA for 2008−2010, calculated on the basis of the amounts specified in thebudgets for those years
If the hurdle target, as described above, is achieved, the actual number of units that can be exercised by each beneficiary is determined on the basis of aperformance objective represented by:
i) For the first 50% of the basic number of units granted, a comparison on a total shareholders’ return basis — for the period from January 1, 2008 toDecember 31, 2009 — between the performance of ordinary Enel shares on the Italian stock exchange and that of a specific reference index.
ii) For the remaining 50% of the basic number of units granted, a comparison on a total shareholders’ return basis — for the period from January 1, 2008to December 31, 2010 — between the performance of ordinary Enel shares on the Italian stock exchange and that of a specific reference index.
The number of units that can be exercised may vary up or down with respect to the basic unit granted by a percentage amount of between 0% and 120% asdetermined on the basis of a specific performance scale.
If the hurdle target is not achieved in the first two−year period, the first tranche of 50% of the units granted may be recovered if the same hurdle target isachieved over the longer three−year period indicated above. It is also possible to extend the validity of the performance level registered in the 2008−2010period to the 2008−2009 period.
Depending on the degree to which both objectives are met, of the total number of units granted, 50% may be exercised from the second year subsequent tothe year in which they were granted, and the remaining 50% as from the third year subsequent to the year in which they were granted. The deadline forexercising all the units is the sixth year subsequent to the year in which they were granted.
The following table summarizes the plan’s evolution.
Number ofRestricted Share
UnitsRestricted units granted December 31, 2008 2,700Restricted units expired in 2009 —Restricted units pending at December 31, 2009 2,700Restricted units expired in 2010 —Restricted units exercised in 2010 —Restricted units pending at December 31, 2010 2,700Restricted units pending at January 1, 2011 (with a revaluation of 120%) 3,240Restricted units exercised in the first half of 2011 3,240(*)Restricted units pending at December 31, 2011 —
(*) The fiscal year value of the restricted share units was €13,683.
Using the accounting criterion described in Note 3.s, Enersis simultaneously recognized a personnel expense and an equity increase for € 1,614(ThCh$ 1,094). This amount corresponds to the accrued value during the period in which key personnel involved in this plan provided services to Enersis.
F−61

Table of Contents
9. INVENTORIES
The detail of inventories as of December 31, 2011 and 2010 is as follows:
Balance at12−31−2011 12−31−2010
Classes of Inventory ThCh$ ThCh$
Goods 2,575,623 691,241Supplies for production 52,637,681 36,711,384Other inventories (*) 22,712,240 25,249,079
Total 77,925,544 62,651,704
Detail of other inventories(*) Other inventories 22,712,240 25,249,079Supplies for projects and spare parts 9,817,787 7,332,861Electric supplies 12,894,453 17,916,218
There are no inventories pledged as security for liabilities.
As of December 31, 2011, the figure for raw materials and supplies recognized as an expense was ThCh$ 742,639,363 (ThCh$ 672,038,103 andThCh$ 580,237,613 as of December 31, 2010 and 2009, respectively). See Note 26.
As of December 31, 2011, 2010, and 2009, no inventories have been written down.
10. CURRENT TAX RECEIVABLES AND PAYABLES
The detail of current tax receivables as of December 31, 2011 and 2010 is as follows:
Balance at12−31−2011 12−31−2010
Tax Receivables ThCh$ ThCh$
Monthly provisional tax payments 84,429,230 72,580,350VAT tax credit 39,192,265 29,618,364Tax credit for absorbed profits 8,067,408 14,672,543Tax credit for training expenses 7,040 242,796Other 10,131,741 20,873,288
Total 141,827,684 137,987,341
The detail of current tax payables as of December 31, 2011 and 2010 is as follows:
Balance at12−31−2011 12−31−2010
Tax Payables ThCh$ ThCh$
Income tax payable 104,420,761 72,454,199VAT tax charge 45,054,989 36,856,368Stamp taxes 136 733Provision for taxes 6,096,210 1,583,669Other 80,281,146 36,771,686
Total 235,853,242 147,666,655
F−62

Table of Contents
11. NON−CURRENT ASSETS AND DISPOSAL GROUPS HELD FOR SALE
During the fourth quarter of 2009, the Board of Directors of Enersis authorized the sale of the subsidiaries Compañía Americana de Multiservicios S.A.(CAM) and Synapsis Soluciones y Servicios IT Ltda. (Synapsis), as they were considered “non−core” businesses. The sale process included at first aninternal verification of the market and the hiring of financial advisors to provide assistance in the sale process. Once offers were received, they weresubmitted to the Board so that it could make the final decision about the sale and its specific conditions.
The potential sale of CAM was considered to be highly probable as of the end of 2009. As for Synapsis, such consideration was taken into account as ofSeptember 2010. After those dates, the Company applied IFRS 5 Non−current Assets Held for Sale and Discontinued Operations (IFRS 5) to account forthese transactions.
CAM and Synapsis provide services in the five countries where Enersis operates in Latin America, i.e. Chile, Argentina, Brazil, Colombia, and Peru. CAMis present with its products and services throughout the electric cycle, including provision, materials logistics, construction and startup of electric projects,certification of equipment, and measurement of final consumption. On the other hand, Synapsis is a company that provides information technologyservices. It specializes in defining strategies companies can use and helping them select software that satisfies their business needs. Synapsis also designsthe infrastructure of the services that will be provided and the methodology to be used, as well as other services.
On December 20, 2010, the Board of Directors of Enersis accepted the offers received to purchase its entire interests in CAM and Synapsis. The CAM offerwas presented by Graña y Montero S.A.A, a Peruvian company that offered US$ 20 million, an amount which, after a price adjustment and contractualcompensations, was reduced to US$ 14.2 million. As for Synapsis, Riverwood Capital L.P., a company domiciled in the United States of America,presented a US$ 52 million offer to purchase Synapsis, which will be paid upon the closing of the sales transaction. The sale of CAM was closed onFebruary 24, 2011, and the Synapsis sale was finalized on March 1, 2011 (see Note 2.4.1).
As described in Note 3 j), non−current assets and disposal groups held for sale have been recorded at the lower of book value or fair value less selling costs. The impact of this treatment was to record an additional impairment on CAM’s net assets as of December 31, 2010 in the amount of ThCh$ 14,881,960,which accumulates to a total impairment of ThCh$ 36,797,809 related to CAM as of December 31, 2010 (ThCh$ 21,915,849 as of December 31, 2009),which was calculated based on the sales price received
Results of operations on these companies prior to sale in 2011 were not significant. The detail of the assets and liabilities classified as held for sale as ofDecember 31, 2010 is as follows:
ASSETSDec. 2010
ThCh$
CURRENT ASSETS 47,201,981Cash and cash equivalents 9,495,181Other current non−financial assets 1,250,133Trade and other receivables 22,976,361Inventories 7,439,747Current tax assets 6,040,559
NON−CURRENT ASSETS 26,691,309Other non−current financial assets 53,909Other non−current non−financial assets 547,349Non−current receivables 2,367,103Intangible assets other than goodwill 1,461,938Property, plant, and equipment, net 19,130,668Deferred taxes 3,130.342
TOTAL ASSETS 73,893,290
LIABILITIESDec. 2010
ThCh$
CURRENT LIABILITIES 56,007,440Other current financial liabilities 6,210,788Trade and other payables 28,912,663Other short−term provisions 11,739,296Other current non−financial liabilities 9,144,693
NON−CURRENT LIABILITIES 8,622,949Other non−current financial liabilities 837,446Deferred taxes 4,171,839Non−current provisions for employee benefits 2,582,969Other non−current non−financial liabilities 1,030,695
TOTAL LIABILITIES 64,630,389
F−63

Table of Contents
12. INVESTMENTS ACCOUNTED FOR USING THE EQUITY METHOD, AND JOINTLY−CONTROLLED COMPANIES
12.1 Equity method accounted investments
a. The following tables present the changes in shareholders’ equity of the Group’s equity method investments during the 2011 and 2010 fiscal years:
Taxpayer IDNo. (RUT)
Movements in Investmentsin Associates Country Currency
OwnershipInterest
Balance at01/01/2011
ThCh$
Share ofProfit (Loss)
ThCh$
DividendsDeclared
ThCh$
ForeignCurrency
Translation
ThCh$
OtherComprehensive
Income
ThCh$
Balance at12−31−2011
ThCh$
NegativeEquity
Provision
ThCh$
Balance at12−31−2011
ThCh$
96,806,130−5 Electrogas S.A. (1) Chile U.S. dollar 42.50% 3,827 4,159,992 (4,142,727) 918,611 8,793,697 9,733,400 — 9,733,400
96,889,570−2 Inversiones ElectrogasS.A. Chile
Chileanpeso 42.50% 8,089,685 — — — (8,089,685) — — —
76,788,080−4 GNL Quintero S.A. Chile U.S. dollar 20.00% 2,883,633 4,055,771 — 66,992 (15,880,240)(8,873,844)8,873,844 —
Foreign Endesa Cemsa S.A. ArgentinaArgentinepeso 45.00% 3,094,078 249,673 — 84,729 — 3,428,480 — 3,428,480
Foreign Sacme S.A. ArgentinaArgentinepeso 50.00% 30,151 468 — 763 — 31,382 — 31,382
76,583,350−7 Konecta Chile S.A. ChileChileanpeso 26.20% 278 — — — (278) — — —
TOTAL 14,101,652 8,465,904 (4,142,727) 1,071,095 (15,176,506) 4,319,418 8,873,844 13,193,262
Taxpayer IDNo. (RUT)
Movements in Investmentsin Associates Country Currency
OwnershipInterest
Balance at01/01/2010
ThCh$
Share ofProfit (Loss)
ThCh$
DividendsDeclared
ThCh$
ForeignCurrency
Translation
ThCh$
OtherComprehensive
Income
ThCh$
Balance at12−31−2010
ThCh$
NegativeEquity
Provision
ThCh$
Balance at12−31−2010
ThCh$
96,806,130−5 Electrogas S.A. (1) Chile U.S. dollar 0.02% 3,775 1,867 (1,635) (180) — 3,827 — 3,827
96,889,570−2 Inversiones ElectrogasS.A. Chile
Chileanpeso 42.50% 7,818,937 3,352,867 (3,186,199) 104,080 — 8,089,685 — 8,089,685
76,788,080−4 GNL Quintero S.A. Chile U.S. dollar 20.00%10,127,465 (2,542,879) — (569,597) (4,131,356) 2,883,633 — 2,883,633
Foreign Endesa Cemsa S.A. ArgentinaArgentinepeso 45.00% 3,297,780 202,973 — (406,675) — 3,094,078 — 3,094,078
Foreign Sacme S.A. ArgentinaArgentinepeso 50.00% 33,226 911 — (3,986) — 30,151 — 30,151
76,583,350−7 Konecta Chile S.A. ChileChileanpeso 26.20% 278 — — — — 278 — 278
TOTAL 21,281,461 1,015,739 (3,187,834) (876,358) (4,131,356)14,101,652 — 14,101,652
(1) On November 16, 2011, the company Electrogas S.A. merged with the company Inversiones Electrogas S.A.
F−64

Table of Contents
b. As of December 31, 2011 and December 31, 2010 no changes in ownership interest in our investment associates have occurred.
c. Additional financial information about investments in associates
• Investments with significant influence
The following tables show summarized information from the Financial Statements of the main investments in associates where the Group has significantinfluence, including the aggregated amounts of assets, liabilities, revenues, expenses, and profit or loss as of December 31, 2011 and December 31, 2010.
December 31, 2011
Investments with significant influenceOwnershipInterest %
Current AssetsThCh$
Non−currentAssetsThCh$
CurrentLiabilities
ThCh$
Non−currentLiabilities
ThCh$RevenuesThCh$
ExpensesThCh$
Profit (Loss)ThCh$
Endesa Cemsa S.A. 45.00% 49,705,466 820,787 42,907,410 — 3,423,785 (2,868,957) 554,828GNL Quintero S.A. 20.00% 112,362,755 600,607,534 76,192,955 681,146,225 95,676,650 (75,397,751) 20,278,899Electrogas S.A. 42.50% 2,688,608 44,772,738 9,510,888 15,048,487 17,218,630 (7,430,408) 9,788,222
December 31, 2010
Investments with significant influenceOwnershipInterest %
CurrentAssetsThCh$
Non−currentAssetsThCh$
CurrentLiabilities
ThCh$
Non−currentLiabilities
ThCh$RevenuesThCh$
ExpensesThCh$
Profit (Loss)ThCh$
Endesa Cemsa S.A. 45.00% 42,063,375 710,433 35,898,080 — 3,631,967 (3,180,916) 451,051Inversiones Electrogas S.A. 42.50% — 19,034,552 — — 8,053,180 (164,082) 7,889,098GNL Quintero S.A. 20.00% 43,182,432 548,261,034 15,642,419 561,382,881 46,342,847 (59,057,243) (12,714,396)Electrogas S.A. 0.02125% 6,145,145 36,271,189 8,307,494 16,098,755 15,575,506 (6,788,817) 8,786,689
Appendix No.3 to these consolidated financial statements provides information on the main activities of our associate companies and the ownership interestthe Group holds in them.
None of our associates have published price quotations.
12.2 Jointly controlled companies
The following tables set out summarized information from the financial statements of the main jointly controlled companies that are reported usingproportional consolidation as of December 31, 2011 and December 31, 2010.
December 31, 2011
Jointly controlled companiesOwnershipInterest %
CurrentAssetsThCh$
Non−currentAssetsThCh$
CurrentLiabilities
ThCh$
Non−currentLiabilities
ThCh$RevenuesThCh$
ExpensesThCh$
Profit (Loss)ThCh$
Centrales Hidroeléctricas de Aysén S.A. 51.00% 10,250,367 115,878,802 7,348,428 1,035,256 — (4,664,851) (4,664,851)Transmisora Eléctrica de Quillota Ltda. 50.00% 1,463,786 10,533,846 298,164 966,978 2,310,668 (1,632,824) 677,844GasAtacama S.A. 50.00% 93,103,848 314,752,350 77,452,973 45,808,413 260,889,567 (225,125,891) 35,763,676Distribuidora Eléctrica de Cundinamarca S.A.
E.S.P. 48.99% 19,310,231 95,221,154 21,878,731 35,202,359 67,811,590 (61,233,568) 6,578,022
December 31, 2010
Jointly controlled companiesOwnershipInterest %
CurrentAssetsThCh$
Non−currentAssetsThCh$
CurrentLiabilities
ThCh$
Non−currentLiabilities
ThCh$RevenuesThCh$
ExpensesThCh$
Profit (Loss)ThCh$
Centrales Hidroeléctricas de Aysén S.A. 51.00% 7,609,649 99,469,947 7,655,622 642,418 — (7,186,862) (7,186,862)Transmisora Eléctrica de Quillota Ltda. 50.00% 3,226,372 9,502,126 1,730,150 943,702 2,122,132 (1,196,978) 925,154GasAtacama S.A. 50.00% 111,484,190 291,968,048 138,310,532 43,440,220 334,321,296 (294,331,806) 39,989,490Sistemas Sec S.A. (*) 49.00% 4,948,616 6,402,040 4,057,366 3,793,979 5,420,246 (5,074,838) 345,408Distribuidora Eléctrica de Cundinamarca S.A.
E.S.P. 48.99% 22,106,093 95,012,672 25,746,539 29,366,858 71,377,710 (63,501,842) 7,875,868
(*) Company belonging to the CAM Group. See Note 2.4.1 and Note 11.
F−65

Table of Contents
13. INTANGIBLE ASSETS OTHER THAN GOODWILL
Intangible assets as of December 31, 2011 and 2010 are detailed as follows:
Intangible Assets, Net12−31−2011
ThCh$12−31−2010
ThCh$
Intangible Assets, Net 1,467,398,214 1,452,586,405Easements and water rights 26,462,064 24,444,264Concessions 1,376,286,402 1,352,756,775Development costs 10,282,488 10,262,982Patents, registered trademarks, and other rights 2,363,933 2,023,121Computer software 48,745,282 58,255,724Other identifiable intangible assets 3,258,045 4,843,539
Intangible Assets, Gross12−31−2011
ThCh$12−31−2010
ThCh$
Intangible Assets, Gross 2,361,625,560 2,257,171,663Easements and water rights 33,067,875 31,480,016Concessions 2,152,351,766 2,038,188,016Development costs 17,698,378 18,875,653Patents, registered trademarks, and other rights 9,237,477 9,025,123Computer software 139,315,361 148,061,864Other identifiable intangible assets 9,954,703 11,540,991
Accumulated Amortization and Impairment12−31−2011
ThCh$12−31−2010
ThCh$
Accumulated Amortization and Impairment, Total (894,227,346) (804,585,258)Easements and water rights (6,605,811) (7,035,752)Concessions (776,065,364) (685,431,241)Development costs (7,415,890) (8,612,671)Patents, registered trademarks, and other rights (6,873,544) (7,002,002)Computer software (90,570,079) (89,806,140)Other identifiable intangible assets (6,696,658) (6,697,452)
F−66

Table of Contents
The reconciliation of the carrying amounts of intangible assets for the 2011 and 2010 fiscal years is as follows:
Year ended December 31, 2011
DevelopmentCosts, Net
Easements andWater Rights,
NetConcessions,
Net
Patents,Registered
Trademarks,and OtherRights, Net
ComputerSoftware, Net
OtherIdentifiableIntangibleAssets, Net
IntangibleAssets, Net
Movements in Intangible Assets ThCh$ ThCh$ ThCh$ ThCh$ ThCh$ ThCh$ ThCh$
Opening balance at 01/01/2011 10,262,982 24,444,264 1,352,756,775 2,023,121 58,255,724 4,843,539 1,452,586,405Movements in identifiable intangible assetsAdditions 2,897,310 500,709 173,836,828 718,039 13,095,987 22,860 191,071,733Disposals (813,771) — (8,618,410) — (182,691) (20,853) (9,635,725)Amortization (*) (1,044,292) (341,988) (88,675,941) (1,379,500) (10,797,238) (442,587) (102,681,546)Foreign currency translation differences 517,527 276,864 (17,416,448) 98,355 1,325,759 161,688 (15,036,255)Other increases (decreases) (1,537,268) 1,582,215 (35,596,402) 903,918 (12,952,259) (1,306,602) (48,906,398)Total movements in identifiable intangible assets 19,506 2,017,800 23,529,627 340,812 (9,510,442) (1,585,494) 14,811,809
Closing balance in identifiable intangible assets at 12/31/2011 10,282,488 26,462,064 1,376,286,402 2,363,933 48,745,282 3,258,045 1,467,398,214
(*) See Note 28, Depreciation, amortization, and impairment loss.
Year ended December 31, 2010
DevelopmentCosts, Net
Easements andWater Rights,
NetConcessions,
Net
Patents,Registered
Trademarks,and OtherRights, Net
ComputerSoftware, Net
OtherIdentifiableIntangibleAssets, Net
IntangibleAssets, Net
Movements in Intangible Assets ThCh$ ThCh$ ThCh$ ThCh$ ThCh$ ThCh$ ThCh$
Opening balance at 01/01/2010 12,330 24,077,874 1,357,976,679 6,844,249 52,003,080 5,208,033 1,446,122,245Movements in identifiable intangible assetsAdditions 854,638 1,257,221 250,062,078 — 19,185,187 3,201,990 274,561,114Transfers to (from) non−current assets and disposal groups held for
sale — — — — (2,176,053) (216,865) (2,392,918)Disposals — — (13,311,084) — (121,912) — (13,432,996)Amortization (1,322) (370,817) (94,009,562) — (12,177,319) (4,417,989) (110,977,009)Foreign currency translation differences (243,935) (320,358) (66,056,947) (1,932) (589,717) 254 (67,212,635)Other increases (decreases) 9,641,271 (199,656) (81,904,389) (4,819,196) 2,132,458 1,068,116 (74,081,396)Total movements in identifiable intangible assets 10,250,652 366,390 (5,219,904) (4,821,128) 6,252,644 (364,494) 6,464,160
Closing balance in identifiable intangible assets at 12/31/2010 10,262,982 24,444,264 1,352,756,775 2,023,121 58,255,724 4,843,539 1,452,586,405
According to the Group management’s estimates and projections, the expected future cash flows attributable to intangible assets allow recovery of thecarrying amount of these assets recorded as of December 31, 2011 (see Note 3.e).
As of December 31, 2011 and 2010, the Company does not have significant intangible assets with an indefinite useful life.
F−67

Table of Contents
14. GOODWILL
The following table shows goodwill by the Cash−Generating Unit or group of Cash−Generating Units to which it belongs and movements for the yearsended December 31, 2011 and 2010:
Company
OpeningBalance at01/01/2010
ThCh$
ForeignCurrency
TranslationThCh$
Closing Balance at12/31/2010
ThCh$
Impairment LossAccounted for in
Income Statement
ThCh$
ForeignCurrency
TranslationThCh$
Closing Balance at12/31/2011
ThCh$
Empresa Distribuidora Sur S.A. (*) 9,874,383 (1,161,106) 8,713,277 (8,931,451) 218,174 —Ampla Energia e Serviços S.A. 247,628,585 (7,897,598) 239,730,987 — (3,207,683) 236,523,304Investluz S.A. 125,801,783 (4,012,172) 121,789,611 — (1,629,587) 120,160,024Empresa Eléctrica de Colina Ltda. 2,240,478 — 2,240,478 — — 2,240,478Compañía Distribuidora y Comercializadora
de Energía S.A. 10,748,633 (212,190) 10,536,443 — 1,053,186 11,589,629Empresa Eléctrica Pangue S.A. 3,139,337 — 3,139,337 — — 3,139,337Endesa Costanera S.A. (**) 6,023,583 (708,301) 5,315,282 (5,448,372) 133,090 —Hidroeléctrica el Chocón S.A. 14,176,409 (1,666,976) 12,509,433 — 313,227 12,822,660Compañía Eléctrica San Isidro S.A. 1,516,768 — 1,516,768 — — 1,516,768Empresa de Energía de Cundinamarca S.A. 7,497,542 (149,075) 7,348,467 — 734,527 8,082,994Empresa de Distribución Eléctrica de Lima
Norte S.A.A. 40,516,247 (2,010,631) 38,505,616 — 6,005,693 44,511,309Centrais Elétricas Cachoeira Dourada S.A. 91,330,028 (3,426,563) 87,903,465 — (1,176,179) 86,727,286Edegel S.A.A. 75,920,260 (2,989,192) 72,931,068 — 10,848,527 83,779,595Emgesa S.A. E.S.P. 4,769,025 (95,607) 4,673,418 — 467,264 5,140,682Chilectra S.A. 128,374,362 — 128,374,362 — — 128,374,362Empresa Nacional de Electricidad S.A. 731,782,459 — 731,782,459 — — 731,782,459Inversiones Distrilima S.A. 12,051 (598) 11,453 — 1,786 13,239
Total 1,501,351,933 (24,330,009) 1,477,021,924 (14,379,823) 13,762,025 1,476,404,126
According to the Group management’s estimates and projections, the expected future cash flows projections attributable to the Cash−Generating Units orgroups of Cash−Generating Units to which the acquired goodwill has been allocated allow recovery of its carrying value as of December 31, 2011 and 2010(see Note 3.e).
(*) See Note 15.d) viii(**) See Note 34.3
F−68

Table of Contents
15. PROPERTY, PLANT, AND EQUIPMENT
Property, plant, and equipment as of December 31, 2011 and December 31, 2010 are as follows:
12−31−2011 12−31−2010Classes of Property, Plant, and Equipment, Net ThCh$ ThCh$
Property, Plant, and Equipment, Net 7,242,731,006 6,751,940,655Construction in progress 1,072,203,347 810,013,619Land 103,166,702 122,864,336Buildings 103,542,090 103,735,435Plant and equipment 5,864,732,615 5,613,164,538Fixtures and fittings 71,886,276 74,513,233Other 27,199,976 27,649,494
12−31−2011 12−31−2010Classes of Property, Plant, and Equipment, Gross ThCh$ ThCh$
Property, Plant, and Equipment, Gross 12,611,068,947 11,526,132,674Construction in progress 1,072,203,347 810,013,619Land 103,166,702 122,864,336Buildings 181,206,892 185,815,964Plant and equipment 11,016,684,462 10,166,489,832Fixtures and fittings 203,946,217 203,665,511Other 33,861,327 37,283,412
Classes of Accumulated Depreciation and Impairment,Property, Plant, and Equipment
12−31−2011ThCh$
12−31−2010ThCh$
Accumulated Depreciation and Impairment, Property, Plant, andEquipment, Total (5,368,337,941) (4,774,192,019)
Buildings (77,664,802) (82,080,529)Plant and equipment (5,151,951,847) (4,553,325,294)Fixtures and Fittings (132,059,941) (129,152,278)Other (6,661,351) (9,633,918)
F−69

Table of Contents
The reconciliation of the carrying amounts of property, plant and equipment for the 2011 and 2010 fiscal years is as follows:
Changes in 2011
Construction inProgressThCh$
LandThCh$
Buildings, NetThCh$
Plant andEquipment, Net
ThCh$
Fixtures andFittings, Net
ThCh$
Other Property,Plant, and
Equipment, NetThCh$
Property, Plant,and Equipment,
NetThCh$
Opening balance at January 1, 2011 810,013,619 122,864,336 103,735,435 5,613,164,538 74,513,233 27,649,494 6,751,940,655ChangesAdditions 512,145,923 601,827 560,334 26,297,088 8,744,381 228 548,349,781Retirements (894,857) (27,495) (11,695) (1,478,364) (276,423) — (2,688,834)Depreciation expense (*) (47,084) — (4,917,847) (292,351,527) (23,896,598) (1,005,434) (322,218,490)Impairment loss recognized in Consolidated
Statement of Comprehensive Income (*) — — — (106,449,843) — — (106,449,843)Foreign currency translation differences 19,527,280 4,656,121 4,175,863 318,631,910 14,856,991 196,655 362,044,820Other increases (decreases) (268,541,534) (24,928,087) — 306,918,813 (2,055,308) 359,033 11,752,917Total changes 262,189,728 (19,697,634) (193,345) 251,568,077 (2,626,957) (449,518) 490,790,351Closing balance at December 31, 2011 1,072,203,347 103,166,702 103,542,090 5,864,732,615 71,886,276 27,199,976 7,242,731,006
(*) See Note 28, Depreciation, amortization, and impairment losses.
Changes in 2010
Construction inProgressThCh$
LandThCh$
Buildings, NetThCh$
Plant andEquipment, Net
ThCh$
Fixtures andFittings, Net
ThCh$
Other Property,Plant, and
Equipment, NetThCh$
Property, Plant,and Equipment,
NetThCh$
Opening balance at January 1, 2010 710,996,813 105,539,626 537,134,153 5,304,578,506 9,551,749 196,270,395 6,864,071,242ChangesAdditions 396,969,270 — — — — — 396,969,270Disposals (56,851) (386,262) (43,444) (1,402,931) (270) (75,990) (1,965,748)Transfers to (from) non−current assets and
disposal groups held for sale (3,390,701) (172,020) (1,442,144) (8,436,203) (7,257,038) (2,136,836) (22,834,942)Depreciation expense — — (17,163,012) (312,401,602) (3,851,776) (4,623,876) (338,040,266)Impairment loss recognized in Consolidated
Statement of Comprehensive Income — — — (1,340,235) — — (1,340,235)Foreign currency translation differences (12,614,659) (3,009,524) (27,306,886) (112,553,429) (633,677) (5,903,177) (162,021,352)Other increases (decreases) (281,890,253) 20,892,516 (387,443,232) 744,720,432 76,704,245 (155,881,022) 17,102,686Total changes 99,016,806 17,324,710 (433,398,718) 308,586,032 64,961,484 (168,620,901) (112,130,587)Closing balance at December 31, 2010 810,013,619 122,864,336 103,735,435 5,613,164,538 74,513,233 27,649,494 6,751,940,655
Additional information on property, plant and equipment, net
a) Main investments
Material investments in the electricity generation business include developments in the program to create new capacity.
A particularly important project in Chile is the construction of the Bocamina II Coal−fired Thermal Power Plant, with capacity of 370 MW.
In Colombia, the Central Hidráulica El Quimbo, a hydroelectric dam with 400 MW of installed capacity and an average annual generation of some 2,216GWH, is currently under construction.
b) Finance leases
As of December 31, 2011 and December 31, 2010, property, plant and equipment includes ThCh$ 137,092,811 and ThCh$ 129,749,447 respectively, inleased assets classified as finance leases.
F−70

Table of Contents
The present value of future lease payments derived from these finance leases is as follows:
12−31−2011 12−31−2010Gross
ThCh$
Interest
ThCh$
Present Value
ThCh$
Gross
ThCh$
Interest
ThCh$
Present Value
ThCh$
Less than one year 15,954,189 2,145,937 13,808,252 12,311,927 2,117,942 10,193,985From one to five years 39,105,238 5,827,660 33,277,578 40,900,311 8,856,066 32,044,245More than five years 27,619,488 2,457,926 25,161,562 32,304,929 3,209,115 29,095,814
Total 82,678,915 10,431,523 72,247,392 85,517,167 14,183,123 71,334,044
Leasing assets relate primarily to:
1. Endesa Chile S.A.: lease agreement for Electric Transmission Lines and Installations (Ralco−Charrúa 2X220 KV) entered into between Endesa Chileand Abengoa Chile S.A. The lease agreement has a 20−year maturity and bears interest at an annual rate of 6.5%.
2. Edegel S.A.A.: lease agreements to finance the project of converting the Ventanilla thermoelectric plant to a combined cycle plant. The agreementswere signed between Edegel S.A. and the financial institutions BBVA − Banco Continental, Banco de Crédito del Perú, Citibank del Peru, and BancoInternacional del Peru − Interbank. These agreements have an average term of 8 years and bear interest at an annual rate of Libor + 2.5% as ofDecember 31, 2011.
The company also has an agreement with Scotiabank, which financed the construction of a new open cycle plant at the Santa Rosa Plant. This agreementhas a term of 9 years and bears interest an annual rate of Libor + 1.75%.
c) Operating leases
The consolidated statements of income at December 31, 2011, 2010, and 2009 include ThCh$ 17,042,089, ThCh$ 16,980,825, and ThCh$ 19,969,187,respectively, corresponding to accrual during these periods of operating lease contracts for material assets in operation.
As of December 31, 2011, 2010, and 2009, the total future lease payments under those contracts are as follows:
12−31−2011ThCh$
12−31−2010ThCh$
12−31−2009ThCh$
Less than one year 7,690,811 5,655,232 14,046,981From one to five years 21,347,042 19,916,962 22,922,219More than five years 41,634,563 26,625,179 13,741,992Total 70,672,416 52,197,373 50,711,192
d) Other information
i) As of December 31, 2011 and 2010, the Group had contractual commitments for the acquisition of property, plant and equipment amounting toThCh$ 179,872,981 and ThCh$ 205,979,469, respectively.
ii) As of December 31, 2011 and 2010, the Group had property, plant and equipment pledged as security for liabilities in the amount of ThCh$ 328,844,715and ThCh$ 305,655,772, respectively (see Note 34).
iii) The Company and its foreign subsidiaries have insurance policies for risk, earthquake, machinery breakdown and damages for business interruption with aUS$ 300 million limit in the case of generating companies and a US$ 30 million limit for distribution companies, including business interruption coverage.The premiums associated with these policies are presented under the line item “Prepayments” within assets.
F−71

Table of Contents
iv) GasAtacama, in which Endesa Chile has a 50% ownership interest, consolidated using the proportional integration method, has, among other assets, acombined−cycle electricity generation plant in northern Chile. As importing natural gas from neighboring countries was not possible, GasAtacama has beenforced to generate electricity using alternative fuels, the cost of which significantly increased since the last few months of 2007 due to increases in oil prices.As a result, the company filed lawsuits for early termination of its contract with distributor Emel. On January 25, 2008, a ruling was issued in arbitrationproceedings on this matter to deny early termination. This situation significantly reduced the recoverable value of the aforementioned plant and, therefore,as of December 31, 2007, an impairment provision of US$ 110 million was recorded.
v) The asset situation, primarily that of works and infrastructure, involving facilities built to support power generation in the SIC grid, has changed since 1998,due primarily to the installation in the SIC of new thermoelectric plants, the arrival of LNG, and new projects that will starting up soon. This results in anew configuration of ample supply for the coming years, in which it is expected that these facilities will not need to be used. Therefore, as of December 31,2009, the company recorded an impairment provision of ThCh$ 43,999,600 for these assets.
vi) As a result of the February 27, 2010 earthquake in Chile, some of our plant and equipment were partially or totally impaired. The impact on our total assets,however, is minor as the only facilities that suffered some damage in infrastructure were the Bocamina I and Bocamina II plants, the latter underconstruction, as well as a few other assets from our distribution business.
Due to these impairments, we have written down ThCh$ 369,643 in assets. Additionally, the Group had to incur expenditures related to repair and capitalimprovements totaling ThCh$ 9,733,426, primarily at the Bocamina I plant. All of the disbursements incurred are covered by insurance, which carries aUS$ 2.5 million policy deductible.
The Group has the necessary insurance coverage for these types of exceptional claims, which provide coverage for material damage as well as businessinterruption. See Note 25.
vii) Our subsidiary Compañía de Interconexión Energética (CIEN) was initially in the business of selling electricity in Argentina and Brazil. However, becauseof the reduction in the availability of power generation and physical guarantee of energy and its associated power, the Company has focused its business ona different compensation structure that is not based on the purchase and sale of energy between the countries. Given the strategic importance of theCompany’s assets in the relations between Brazil and Argentina, the Company and the Brazilian Government have jointly drawn up a new business planmodel changing its selling activity to an electricity transmission activity with payment of a fixed compensation. This new plan involves integrating itstransmission lines with the Brazilian transmission grid operated by the Brazilian Government.
In prior periods, the Argentine and Uruguayan Governments formalized toll payments with the Company to transport energy between the two countries.Management considers that this situation further emphasizes the importance of the application made to the Brazilian Government to approve the newbusiness plan and considers that it will probably be approved. In addition, on June 4, 2010 the Company signed a new transmission contract for a six−monthperiod for a total of US$ 155 million to cover the energy transmission required by the Argentine Government.
Finally, on April 5, 2011, the Diario Oficial (The Official Gazette) published Portarías Ministeriales (Ministerial Decrees) 210/2011 and 211/2011 thatequipped CIEN with a regulated interconnection line involving payment of a regulated toll. The Receita Anual Permitida (RAP), or income permittedannually, corresponded to 248 million Brazilian reals, to be adjusted according to the Broad National Consumer Price Index (IPCA) every year in June andwith the rate to be reviewed every four years. The Line 1 concession lasts until June 2020 and the Line 2 concession until July 2022, with compensationprovisions for non−amortized investments. This successfully concludes the change in CIEN’s business model that we had previously been reporting.
F−72

Table of Contents
viii) Our Argentine subsidiary, Empresa Distribuidora Sur S.A., has seen its financial equilibrium seriously affected by the delay in the compliance with certainpoints of the Acta de Acuerdo agreement signed with the Argentine Government, particularly the twice−yearly rate adjustments recognized through thecost−monitoring mechanism (MMC) and the establishment of an Integral Rate Review (RTI) as provided for in this agreement.
At the close of the 2011 fiscal year, Enersis had recorded an impairment loss of ThCh$ 106,449,843 for the Property, Plant and Equipment of EmpresaDistribuidora Sur S.A., as well as an additional loss of ThCh$ 8,931,451 for the complete impairment of the purchase goodwill that was assigned to itsArgentine subsidiary (see Note 14) in order to cover almost the total equity risk that this company represents for the Enersis Group.
16. INVESTMENT PROPERTY
The detail of the composition of, and changes in, investment property during the 2011 and 2010 fiscal years:
Investment Properties ThCh$
Opening balance at January 1, 2010 31,231,839Additions 1,303,676Disposals (2,732,209)Depreciation expense (24,029)Impairment losses reversed, recognized in the Consolidated Statement of
Comprehensive Income (*) 3,239,877Balance at December 31, 2010 33,019,154Additions 2,716,250Disposals (977,173)Depreciation expense (24,029)Impairment losses reversed, recognized in the Consolidated Statement of
Comprehensive Income (*) 3,321,687Closing balance investment property at December 31, 2011 38,055,889
(*) See Note 28.
The fair value of the Group’s investment properties as of December 31, 2011, determined on the basis of valuations carried out internally, wasThCh$ 36,492,692. As of December 31, 2010, the market value of these properties was ThCh$ 34,099,993.
The selling price of investment properties disposed of in the 2011 and 2010 fiscal years was ThCh$ 5,102,508 and ThCh$ 8,015,891, respectively.
The amounts recognized in profit or loss during the 2011 and 2010 fiscal years as direct operating expenses arising from investment properties were notsignificant.
The Group has insurance policies to cover operational risks of its investment properties, as well as to cover legal claims against the Group that couldpotentially arise from exercising its business activity. The Group’s management considers that the insurance policy coverage is sufficient against the risksinvolved.
F−73

Table of Contents
17. DEFERRED TAX
a. The deferred taxes recognized by temporary differences as of December 31, 2011 and 2010 are as follows:
Deferred Tax Assets Deferred Tax Liabilities
Temporary Differences12−31−2011
ThCh$12−31−2010
ThCh$12−31−2011
ThCh$12−31−2010
ThCh$Deferred tax relating to depreciations 87,992,490 124,814,250 455,205,366 474,063,238Deferred tax relating to amortizations — — 6,082,237 8,292,149Deferred tax relating to accruals 12,161,705 9,031,226 5,034,474 26,142,262Deferred tax relating to provisions 86,876,561 130,298,290 4,431,328 7,494,432Deferred tax relating to foreign exchange contracts 31,195,995 46,746,028 107,097 1,155,119Deferred tax relating to post−employment benefit
obligations 38,807,414 38,073,254 5,074,020 3,674,593Deferred tax relating to revaluations of financial
instruments 37,813,186 39,794,055 880,379 4,324,798Deferred tax relating to tax losses 22,117,495 36,399,383 — —Deferred tax relating to other items 62,973,782 27,477,878 31,623,354 30,776,987Total 379,938,628 452,634,364 508,438,255 555,923,578
b. The following table presents the changes in deferred taxes in the Consolidated Statement of Financial Position for the 2011 and 2010 fiscal years:
Assets LiabilitiesDeferred Tax Movements ThCh$ ThCh$
Balance at January 1, 2010 454,896,521 573,049,297Increase (decrease) in profit or loss (9,615,881) (2,995,918)Increase (decrease) in other comprehensive income 13,742,269 2,870,641Foreign currency translation (12,073,361) (17,943,096)Other increase (decrease) 5,684,816 942,654Balance at December 31, 2010 452,634,364 555,923,578Increase (decrease) in profit or loss (48,785,847) (26,492,538)Increase (decrease) in in other comprehensive income 14,647,632 3,942,971Foreign currency translation 8,826,145 33,797,031Other increase (decrease) (47,383,666) (58,732,787)Balance at December 31, 2011 379,938,628 508,438,255
Recovery of deferred tax assets will depend on whether sufficient tax profits are obtained in the future. The Company believes that the future profitprojections for its numerous subsidiaries will allow these assets to be recovered.
c. As of December 31, 2011 and 2010, the Group has not recognized deferred tax assets related to tax losses totaling ThCh$ 39,313,993 andThCh$ 16,551,349, respectively. See Note 3.o.
The Enersis Group has not recognized deferred tax liabilities for taxable temporary differences associated with investment in subsidiaries, associates, andjointly controlled entities, as it is able to control the timing of the reversal of the temporary differences and considers that it is probable that such temporarydifferences will not reverse in the foreseeable future. The aggregate amount of taxable temporary differences associated with investments in subsidiaries,associates, and jointly controlled entities for which deferred tax liabilities have not been recognized totaled ThCh$ 2,204,931,942 as of December 31, 2011(ThCh$ 1,995,679,814 as of December 31, 2010).
F−74

Table of Contents
The Group is potentially subject to income tax audits by the tax authorities of each country in which the Group operates. Such tax audits can be performeduntil the applicable statute of limitations expires. Tax audits by their nature are often complex and can require several years to complete. The following tablepresents a summary of tax years, potentially subject to examination, in the significant tax jurisdictions in which the Group operates:
Country PeriodChile 2007−2011
Argentina 2002−2011Brazil 2007−2011
Colombia 2009−2011Peru 2007−2011
Given the range of possible interpretations of tax standards, the results of any future inspections carried out by tax authorities for the years subject to auditcan give rise to tax liabilities that cannot currently be quantified objectively. Nevertheless, Enersis Management estimates that the liabilities, if any, thatmay arise from such audits, would not significantly impact the companies’ future results.
The effects of deferred tax on the components of other comprehensive income are as follows:
December 31, 2011 December 31, 2010 December 31, 2009
Effects of Deferred Tax on the Components of Other
Amount
Before Tax
Income Tax
Expense
(Benefit)
Amount
After TaxAmount Before
Tax
Income Tax
Expense
(Benefit)Amount After
TaxAmount Before
Tax
Income Tax
Expense
(Benefit)Amount After
TaxComprehensive Income ThCh$ ThCh$ ThCh$ ThCh$ ThCh$ ThCh$ ThCh$ ThCh$ ThCh$
Available−for sale financial assets (55,959) 9,513 (46,446) (179) 31 (148) 61,031 (10,528) 50,503Cash flow hedge (88,032,492) 14,110,400 (73,922,092) 30,911,303 (5,301,050) 25,610,253 192,801,668 (33,917,966) 158,883,702Foreign currency translation 211,929,739 — 211,929,739 (138,554,045) — (138,554,045) (246,854,956) — (246,854,956)Actuarial income on defined−benefit pension plans (62,246,623) 23,078,884 (39,167,739) (48,495,375) 16,515,279 (31,980,096) (15,599,453) 1,369,374 (14,230,079)
Income tax related to components of other income andexpenses debited or credited to Equity 61,594,665 37,198,797 98,793,462 (156,138,296) 11,214,260 (144,924,036) (69,591,710) (32,559,120) (102,150,830)
18. OTHER FINANCIAL LIABILITIES
The balance of other financial liabilities as of December 31, 2011 and 2010 is as follows:
December 31, 2011 December 31, 2010
Classes of Financial Liabilities
Current
ThCh$
Non−current
ThCh$
Current
ThCh$
Non−current
ThCh$Interest−bearing loans 661,974,731 3,049,197,963 652,979,492 2,763,822,330Hedging derivatives (*) 6,200,643 212,913,735 10,002,909 240,113,443Non−hedging derivatives (**) 807,105 — — —Obligation for Túnel El Melón concession 2,207,755 9,243,595 1,967,333 11,020,674Other financial liabilities 892,104 — 648,284 —
Total 672,082,338 3,271,355,293 665,598,018 3,014,956,447
(*) See Note 20.2.a(**) See Note 20.2.b
F−75

Table of Contents
Interest−bearing liabilities
18.1 The detail of current and non−current interest−bearing borrowings as of December 31, 2011 and 2010 is as follows:
Balance at December 31, 2011 Balance at December 31, 2010
Classes of Loans that Accrue Interest
Current
ThCh$
Non−current
ThCh$
Current
ThCh$
Non−current
ThCh$Bank loans 278,455,859 316,103,001 184,452,979 451,937,608Unsecured obligations 242,785,757 2,439,913,903 281,652,334 2,039,070,748Secured obligations 10,660,476 9,635,108 9,522,288 17,703,710Finance leases 13,808,252 58,439,140 10,193,985 61,140,059Other loans 116,264,387 225,106,811 167,157,906 193,970,205
Total 661,974,731 3,049,197,963 652,979,492 2,763,822,330
18.2 Liabilities by currency and contractual maturity as of December 31, 2011 and 2010 are as follows:
• Summary of Bank Loans by currency and contractual maturity
Current Non−currentMaturity Maturity Total
Secured/
One to Three
MonthsThree to Twelve
MonthsTotal Currentat 12−31−2011
One to ThreeYears
Three to Five
YearsMore than Five
YearsNon−Currentat 12−31−2011
Country Currency Nominal Rate Unsecured ThCh$ ThCh$ ThCh$ ThCh$ ThCh$ ThCh$ ThCh$Chile US$ 1.97% Unsecured 84,500 1,607,710 1,692,210 107,025,578 849,449 — 107,875,027Peru US$ 3.63% Unsecured 2,354,628 8,838,878 11,193,506 4,296,544 19,212,039 26,158,087 49,666,670Peru Soles 5.20% Unsecured 310,428 1,541,618 1,852,046 — — 30,832,352 30,832,352Argentina US$ 5.28% Unsecured 494,597 6,393,975 6,888,572 17,983,101 1,598,484 — 19,581,585Argentina Ar$ 21.17% Unsecured 37,631,229 17,687,954 55,319,183 40,368,276 2,414,084 — 42,782,360Colombia CPs 6.48% Unsecured 262,107 86,794,795 87,056,902 — — — —Brazil US$ 6.05% Unsecured — 5,825,541 5,825,541 13,909,371 11,722,036 6,352,599 31,984,006Brazil Reais 12.89% Unsecured 9,173,097 99,454,802 108,627,899 33,381,001 — — 33,381,001
Total 50,310,586 228,145,273 278,455,859 216,963,871 35,796,092 63,343,038 316,103,001
Current Non−currentMaturity Maturity Total
Secured/
One to Three
MonthsThree to Twelve
MonthsTotal Currentat 12−31−2010
One to ThreeYears
Three to Five
YearsMore than Five
YearsNon−Currentat 12−31−2010
Country Currency Nominal Rate Unsecured ThCh$ ThCh$ ThCh$ ThCh$ ThCh$ ThCh$ ThCh$Chile US$ 2.75% Unsecured 381,532 1,364,781 1,746,313 2,871,499 95,144,820 — 98,016,319Peru US$ 2.95% Unsecured 999,046 16,410,407 17,409,453 11,694,152 6,908,207 21,661,326 40,263,685Peru Soles 3.96% Unsecured 1,839,538 — 1,839,538 31,245,764 — — 31,245,764Argentina US$ 5.24% Unsecured 5,085,358 17,057,145 22,142,503 4,013,854 — — 4,013,854Argentina Ar$ 17.27% Unsecured 14,760,009 16,463,487 31,223,496 27,395,848 706,664 — 28,102,512Colombia CPs 6.91% Unsecured — 5,041,882 5,041,882 — 74,201,702 — 74,201,702Brazil US$ 6.35% Unsecured — 5,253,378 5,253,378 11,677,838 13,433,724 9,323,740 34,435,302Brazil Reais 10.17% Unsecured 10,149,162 89,647,254 99,796,416 141,658,470 — — 141,658,470
Total 33,214,645 151,238,334 184,452,979 230,557,425 190,395,117 30,985,066 451,937,608
The fair value of current and non−current bank borrowings totaled ThCh$ 582,919,972 at December 31, 2011 and ThCh$ 844,554,823 at December 31,2010.
F−76

Table of Contents
• Identification of Bank Borrowings by Companies
12−2011ID No. Effective Current ThCh$ Non−current ThCh$
Taxpayer IDNo. (RUT) Company Country
FinancialInstitution
FinancialInstitution Country Currency
InterestRate
NominalInterest Rate
Type ofAmortization
Lessthan 90
days
Morethan
90 daysTotal
Current
One toThreeYears
Three toFive
Years
MorethanFive
Years
TotalNon−
currentForeign Ampla Brazil Foreign Banco Itaú Brazil Reais 6.15% 6.15% Semi−annually 1,694 1,856,820 1,858,514 — — — —Foreign Ampla Brazil Foreign Unibanco Brazil Reais 6.16% 6.16% Semi−annually 26,242 1,479,891 1,506,133 — — — —Foreign Ampla Brazil Foreign Banco Alfa Brazil Reais 5.91% 5.91% Semi−annually2,211,77312,517,87614,729,649 — — — —Foreign Ampla Brazil Foreign Brasdesco Brazil Reais 6.09% 6.09% Semi−annually6,481,458 7,048,95513,530,413 5,563,500 — — 5,563,500Foreign Ampla Brazil Foreign Banco do Brazil Brazil Reais 6.05% 6.05% At maturity 275,812 — 275,81227,817,501 — — 27,817,501Foreign Ampla Brazil Foreign BANCO HSBC Brazil Reais 6.01% 6.01% Semi−annually 176,11820,863,12621,039,244 — — — —
Foreign CGTFFortaleza Brazil Foreign IFC − A Brazil US$ 7.99% 7.89% Semi−annually — 2,426,516 2,426,516 5,406,532 6,238,628 3,470,63415,115,794
Foreign CGTFFortaleza Brazil Foreign IFC − B Brazil US$ 2.69% 2.69% Semi−annually — 3,399,025 3,399,025 8,502,839 4,712,630 — 13,215,469
Foreign CGTFFortaleza Brazil Foreign IFC − C Brazil US$ 11.96% 11.96% Semi−annually — — — — 770,778 2,881,965 3,652,743
Foreign Chinango Peru ForeignBANCOCONTINENTAL Peru Soles 3.85% 3.80% At maturity — — — — — — —
Foreign Chinango Peru Foreign Banco Continental Peru US$ 4.07% 3.21% At maturity — — — — — — —Foreign Chinango Peru Foreign Banco Continental Peru US$ 3.52% 3.52% At maturity — — — — — — —Foreign Chinango Peru Foreign Banco Scotiabank Peru US$ 4.26% L3M+3.7% At maturity 71,315 — 71,315 1,127,370 1,288,42213,689,48416,105,276
Foreign Chinango Peru ForeignBANCOCONTINENTAL Peru Soles 3.85% 3.80% At maturity 3,068 1,541,618 1,544,686 — — — —
Foreign Codensa. Colombia Foreign Banco Agrario Colombia CPs 5.99% 5.81% At maturity 262,107 — 262,107 — — — —
Foreign CIEN Brazil ForeignBanco SantanderCentral Hispano Brazil Reais 1.08% 1.02% Semi−annually — 55,688,13455,688,134 — — — —
Foreign Edegel Peru Foreign Banco de Crédito Peru US$ 3.38% L3M+3% Quarterly 1,890,464 5,610,961 7,501,425 1,870,361 — — 1,870,361Foreign Edegel Peru Foreign Banco Continental Peru US$ 3.54%L3M+3.13% Quarterly — — — 1,298,81317,923,61712,468,60331,691,033Foreign Edegel Peru Foreign Banco Scotiabank Peru US$ 1.65%L6M+1.25% Semi−annually — 1,870,716 1,870,716 — — — —Foreign Edegel Peru Foreign Banco Continental Peru US$ 2.90% L3M+2.5% At maturity 392,849 1,357,201 1,750,050 — — — —Foreign Edelnor Peru Foreign Banco de Crédito Peru Soles 2.60% 2.60% At maturity 18,741 — 18,741 — — 2,890,532 2,890,532Foreign Edelnor Peru Foreign Banco de Crédito Peru Soles 4.00% 4.00% Semi−annually 18,741 — 18,741 — — 2,890,532 2,890,532Foreign Edelnor Peru Foreign Banco de Crédito Peru Soles 4.00% 4.00% Semi−annually 8,847 — 8,847 — — 2,505,128 2,505,128Foreign Edelnor Peru Foreign Banco de Crédito Peru Soles 4.00% 4.00% Semi−annually 7,497 — 7,497 — — 1,156,213 1,156,213Foreign Edelnor Peru Foreign Banco de Crédito Peru Soles 4.00% 4.00% Semi−annually 31,235 — 31,235 — — 4,817,554 4,817,554Foreign Edelnor Peru Foreign Banco de Crédito Peru Soles 4.00% 4.00% Semi−annually 18,741 — 18,741 — — 2,890,532 2,890,532Foreign Edelnor Peru Foreign Banco de Crédito Peru Soles 4.00% 4.00% Semi−annually 44,826 — 44,826 — — 4,046,745 4,046,745Foreign Edelnor Peru Foreign Banco de Crédito Peru Soles 4.00% 4.00% Semi−annually — — — — — — —Foreign Edelnor Peru Foreign Banco Continental Peru Soles 4.40% 4.40% Semi−annually 132,120 — 132,120 — — 7,708,094 7,708,094Foreign Edelnor Peru Foreign Banco de InterbankPeru Soles 6.90% 6.90% At maturity 26,612 — 26,612 — — 1,927,022 1,927,022Foreign Edesur Argentina Foreign BBVA Argentina Ar$ 21.55% 20.00% Semi−annually 42,370 2,414,082 2,456,452 — — — —Foreign Edesur Argentina Foreign Citibank Argentina Ar$ 17.88% 16.00% Monthly 311,088 1,810,562 2,121,650 — — — —Foreign Edesur Argentina Foreign Banco de Galicia Argentina Ar$ 20.16% 18.52% Monthly 1,260,656 2,414,082 3,674,738 — — — —Foreign Edesur Argentina Foreign Citibank Argentina Ar$ 18.97% 17.50% Monthly 282,930 1,750,209 2,033,139 — — — —
Foreign Edesur Argentina ForeignBanco de la Ciudadde Buenos Aires Argentina Ar$
14.85% 14.61% At maturity — — — 1,207,041 — — 1,207,041
Foreign Edesur Argentina Foreign Supervielle Argentina Ar$ 31.92% 27.00% At maturity 852,036 — 852,036 — — — —Foreign Edesur Argentina Foreign Comafi Argentina Ar$ 28.33% 25.00% At maturity 1,192,058 — 1,192,058 — — — —Foreign Edesur Argentina Foreign Standard Bank Argentina Ar$ 19.18% 17.94% Quarterly — — — 1,810,562 — — 1,810,562
Foreign Edesur Argentina ForeignBanco SantanderRio Argentina Ar$
19.12% 17.88% Quarterly 4,834,533 — 4,834,533 2,414,082 — — 2,414,082
Foreign Edesur Argentina Foreign BBVA Argentina Ar$ 21.55% 20.00% Semi−annually 617,884 — 617,884 — — — —Foreign Edesur Argentina Foreign Standard Bank Argentina Ar$ 16.75% 16.05% Quarterly — — — 1,810,562 — — 1,810,562
Foreign Edesur Argentina ForeignBanco SantanderRio Argentina Ar$
19.12% 17.88% Semi−annually — — — 4,224,644 — — 4,224,644
Foreign Edesur Argentina Foreign Banco Itaú Argentina Ar$ 21.52% 19.65% Monthly — — — 3,017,603 — — 3,017,603Foreign Edesur Argentina Foreign Banco Macro Argentina Ar$ 22.66% 20.60% Monthly — — — 2,414,082 — — 2,414,082
Foreign Edesur Argentina ForeignBanco de la Ciudadde Buenos Aires Argentina Ar$ 15.19% 14.52% At maturity 186,005 — 186,005 8,449,285 — — 8,449,285
Foreign Edesur Argentina Foreign Banco Davivienda Colombia CPs 6.48% 6.48% Annual — 8,977,569 8,977,569 — — — —Foreign Emgesa Colombia Foreign Bancolombia Colombia CPs 6.48% 6.48% Yearly — 6,430,876 6,430,876 — — — —Foreign Emgesa Colombia Foreign Bancolombia Colombia CPs 6.48% 6.48% Annual — 21,177,56621,177,566 — — — —Foreign Emgesa Colombia Foreign BBVA Colombia Colombia CPs 6.48% 6.48% Annual — 23,478,35623,478,356 — — — —Foreign Emgesa Colombia Foreign Banco Santander Colombia CPs 6.48% 6.48% Annual — 26,730,42826,730,428 — — — —
Foreign Emgesa Colombia ForeignBanco Provincia deBuenos Aires Argentina US$ 16.00% 16.00% At maturity 368,366 — 368,366 — — — —
Foreign EndesaCostanera Argentina Foreign Banco Galicia Argentina US$ 3.80% LIBOR+3% At maturity — — — — — — —
Foreign EndesaCostanera Argentina Foreign
Credit SuisseInternational Argentina US$ 11.28%LIBOR+12% At maturity 44,820 — 44,820 5,195,104 — — 5,195,104
Foreign EndesaCostanera Argentina Foreign Citibank Argentina US$ 4.80%LIBOR+4.5% At maturity — — — — — — —
Foreign EndesaCostanera Argentina Foreign
Banco NaciónArgentina Argentina Ar$ 14.00%BAIBOR+5% At maturity 3,555,128 — 3,555,128 — — — —
Foreign EndesaCostanera Argentina Foreign
MediocreditoItalyno Argentina Ar$ 1.75% 1.75% At maturity — — — — — — —
12−2010ID No. Effective Current ThCh$ Non−current ThCh$
Taxpayer IDNo. (RUT) Company Country
FinancialInstitution
FinancialInstitution Country Currency
InterestRate
NominalInterest Rate
Type ofAmortization
Lessthan 90
days
Morethan
90 daysTotal
Current
One toThreeYears
Three toFive
Years
MorethanFive
YearsTotal
Non−currentForeign Ampla Brazil Foreign Banco Itaú Brazil Reais 6.15% 6.15% Semi−annually 4,887 1,882,368 1,887,255 1,882,350 — — 1,882,350Foreign Ampla Brazil Foreign Unibanco Brazil Reais 6.16% 6.16% Semi−annually 48,591 1,500,240 1,548,831 1,500,240 — — 1,500,240Foreign Ampla Brazil Foreign Banco Alfa Brazil Reais 5.91% 5.91% Semi−annually2,321,766 1,410,000 3,731,76614,100,000 — — 14,100,000Foreign Ampla Brazil Foreign Brasdesco Brazil Reais 6.09% 6.09% Semi−annually7,117,655 7,145,88014,263,53518,425,880 — — 18,425,880Foreign Ampla Brazil Foreign Banco do Brazil Brazil Reais 6.05% 6.05% At maturity 286,544 — 286,54428,200,000 — — 28,200,000Foreign Ampla Brazil Foreign BANCO HSBC Brazil Reais 6.01% 6.01% Semi−annually 369,71921,150,00021,519,71921,150,000 — — 21,150,000
Foreign CGTFFortaleza Brazil Foreign IFC − A Brazil US$ 7.99% 7.89% Semi−annually — 2,034,087 2,034,087 4,532,161 5,229,685 6,034,564 15,796,410
Foreign CGTFFortaleza Brazil Foreign IFC − B Brazil US$ 2.69% 2.69% Semi−annually — 3,219,291 3,219,291 7,145,677 8,204,039 — 15,349,716
Foreign CGTFFortaleza Brazil Foreign IFC − C Brazil US$ 11.96% 11.96% Semi−annually — — — — — 3,289,176 3,289,176
Foreign Chinango Peru ForeignBANCOCONTINENTAL Peru Soles 3.85% 3.80% At maturity 27,549 — 27,549 4,901,950 — — 4,901,950
Foreign Chinango Peru Foreign Banco Continental Peru US$ 4.07% 3.21% At maturity — 3,524,902 3,524,902 — — — —Foreign Chinango Peru Foreign Banco Continental Peru US$ 3.52% 3.52% At maturity — 6,579,812 6,579,812 — — — —Foreign Chinango Peru Foreign Banco Scotiabank Peru US$ 4.26% L3M+3.7% At maturity — — — — — — —
Foreign Chinango Peru ForeignBANCOCONTINENTAL Peru Soles 3.85% 3.80% At maturity 1,936 — 1,936 1,333,864 — — 1,333,864
Foreign Codensa. Colombia Foreign Banco Agrario Colombia CPs 5.99% 5.81% At maturity — — — — — — —
Foreign CIEN Brazil ForeignBanco SantanderCentral Hispano Brazil Reais 1.08% 1.02% Semi−annually — 56,558,76656,558,76656,400,000 — — 56,400,000
Foreign Edegel Peru Foreign Banco de Crédito Peru US$ 3.38% L3M+3% Quarterly 583,558 1,686,071 2,269,629 8,430,354 — — 8,430,354Foreign Edegel Peru Foreign Banco Continental Peru US$ 3.54%L3M+3.13% Quarterly 415,488 1,246,464 1,661,952 1,577,727 6,908,20721,661,326 30,147,260Foreign Edegel Peru Foreign Banco Scotiabank Peru US$ 1.65%L6M+1.25% Semi−annually — 3,373,158 3,373,158 1,686,071 — — 1,686,071Foreign Edegel Peru Foreign Banco Continental Peru US$ 2.90% L3M+2.5% At maturity — — — — — — —Foreign Edelnor Peru Foreign Banco de Crédito Peru Soles 2.60% 2.60% At maturity 101,810 — 101,810 3,501,393 — — 3,501,393Foreign Edelnor Peru Foreign Banco de Crédito Peru Soles 4.00% 4.00% Semi−annually 10,102 — 10,102 2,500,995 — — 2,500,995Foreign Edelnor Peru Foreign Banco de Crédito Peru Soles 4.00% 4.00% Semi−annually 10,102 — 10,102 2,500,995 — — 2,500,995

Foreign Edelnor Peru Foreign Banco de Crédito Peru Soles 4.00% 4.00% Semi−annually 4,255 — 4,255 2,167,529 — — 2,167,529Foreign Edelnor Peru Foreign Banco de Crédito Peru Soles 4.00% 4.00% Semi−annually 4,041 — 4,041 1,000,398 — — 1,000,398Foreign Edelnor Peru Foreign Banco de Crédito Peru Soles 4.00% 4.00% Semi−annually 16,837 — 16,837 4,168,325 — — 4,168,325Foreign Edelnor Peru Foreign Banco de Crédito Peru Soles 4.00% 4.00% Semi−annually 10,102 — 10,102 2,500,995 — — 2,500,995Foreign Edelnor Peru Foreign Banco de Crédito Peru Soles 4.00% 4.00% Semi−annually1,544,238 — 1,544,238 — — — —Foreign Edelnor Peru Foreign Banco Continental Peru Soles 4.40% 4.40% Semi−annually 108,566 — 108,566 6,669,320 — — 6,669,320Foreign Edelnor Peru Foreign Banco de InterbankPeru Soles 6.90% 6.90% At maturity — — — — — — —Foreign Edesur ArgentinaForeign BBVA Argentina Ar$ 21.55% 20.00% Semi−annually — 1,177,774 1,177,774 — — — —Foreign Edesur ArgentinaForeign Citibank Argentina Ar$ 17.88% 16.00% Monthly — — — — — — —Foreign Edesur ArgentinaForeign Banco de Galicia Argentina Ar$ 20.16% 18.52% Monthly — — — — — — —Foreign Edesur ArgentinaForeign Citibank Argentina Ar$ 18.97% 17.50% Monthly — — — — — — —
Foreign Edesur ArgentinaForeignBanco de la Ciudadde Buenos Aires Argentina Ar$
14.85% 14.61% At maturity — — — 1,413,329 — — 1,413,329
Foreign Edesur ArgentinaForeign Supervielle Argentina Ar$ 31.92% 27.00% At maturity — — — — — — —Foreign Edesur ArgentinaForeign Comafi Argentina Ar$ 28.33% 25.00% At maturity — — — — — — —Foreign Edesur ArgentinaForeign Standard Bank Argentina Ar$ 19.18% 17.94% Quarterly — — — 1,413,328 353,332 — 1,766,660
Foreign Edesur ArgentinaForeignBanco SantanderRio Argentina Ar$
19.12% 17.88% Quarterly — — — 1,943,328 — — 1,943,328
Foreign Edesur ArgentinaForeign BBVA Argentina Ar$ 21.55% 20.00% Semi−annually — 1,177,774 1,177,774 2,355,548 — — 2,355,548Foreign Edesur ArgentinaForeign Standard Bank Argentina Ar$ 16.75% 16.05% Quarterly — — — 1,413,328 — — 1,413,328
Foreign Edesur ArgentinaForeignBanco SantanderRio Argentina Ar$
19.12% 17.88% Semi−annually — 1,001,108 1,001,108 2,355,548 353,332 — 2,708,880
Foreign Edesur ArgentinaForeign Banco Itaú Argentina Ar$ 21.52% 19.65% Monthly — — — — — — —Foreign Edesur ArgentinaForeign Banco Macro Argentina Ar$ 22.66% 20.60% Monthly — — — — — — —
Foreign Edesur ArgentinaForeignBanco de la Ciudadde Buenos Aires Argentina Ar$ 15.19% 14.52% At maturity — — — 918,665 — — 918,665
Foreign Edesur ArgentinaForeign Banco Davivienda Colombia CPs 6.48% 6.48% Annual — 521,504 521,504 — 7,675,010 — 7,675,010Foreign Emgesa Colombia Foreign Bancolombia Colombia CPs 6.48% 6.48% Yearly — 373,568 373,568 — 5,497,818 — 5,497,818Foreign Emgesa Colombia Foreign Bancolombia Colombia CPs 6.48% 6.48% Annual — 1,230,198 1,230,198 — 18,104,904 — 18,104,904Foreign Emgesa Colombia Foreign BBVA Colombia Colombia CPs 6.48% 6.48% Annual — 1,363,850 1,363,850 — 20,071,871 — 20,071,871Foreign Emgesa Colombia Foreign Banco Santander Colombia CPs 6.48% 6.48% Annual — 1,552,762 1,552,762 — 22,852,099 — 22,852,099
Foreign Emgesa Colombia ForeignBanco Provincia deBuenos Aires Argentina US$ 16.00% 16.00% At maturity 602,549 — 602,549 — — — —
Foreign EndesaCostanera ArgentinaForeign Banco Galicia Argentina US$ 3.80% LIBOR+3% At maturity 713,260 — 713,260 — — — —
Foreign EndesaCostanera ArgentinaForeign
Credit SuisseInternational Argentina US$ 11.28%LIBOR+12% At maturity 6,596 — 6,596 4,013,854 — — 4,013,854
Foreign EndesaCostanera ArgentinaForeign Citibank Argentina US$ 4.80%LIBOR+4.5% At maturity 614,327 — 614,327 — — — —
Foreign EndesaCostanera ArgentinaForeign
Banco NaciónArgentina Argentina Ar$ 14.00%BAIBOR+5%At maturity — 1,815,068 1,815,068 2,077,593 — — 2,077,593
Foreign EndesaCostanera ArgentinaForeign
MediocreditoItalyno Argentina Ar$ 1.75% 1.75% At maturity — 963,655 963,655 — — — —
F−77

Table of Contents
• Identification of Bank Borrowings by Companies, continued
12−2011ID No. Effective Current ThCh$ Non−current ThCh$
Taxpayer IDNo. (RUT) Company Country
FinancialInstitution Financial Institution Country Currency
InterestRate
NominalInterest Rate
Type ofAmortization
Less than90
days
More than90 days
TotalCurrent
One toThreeYears
Three toFive
Years
MorethanFive
Years
Total Non−current
ForeignEndesaCostanera Argentina Foreign Banco Santander Río Argentina Ar$ 15.50% 15.50% At maturity 1,898,686 — 1,898,686 — — — —
ForeignEndesaCostanera Argentina Foreign Banco Itau Argentina Ar$ 16.90% BAIBOR+5% At maturity 3,529,419 — 3,529,419 — — — —
ForeignEndesaCostanera Argentina Foreign Citibank Argentina Ar$ 13.50% 13.50% At maturity 6,393,434 — 6,393,434 — — — —
ForeignEndesaCostanera Argentina Foreign Banco Galicia Argentina Ar$ 16.00% 16.00% At maturity 5,167,489 — 5,167,489 — — — —
ForeignEndesaCostanera Argentina Foreign Citibank Argentina US$ 5.43% LIBOR+4.8% At maturity — — — — — — —
ForeignEndesaCostanera Argentina Foreign Banco Galicia Argentina US$ 3.80%EURIBOR+3.85% At maturity — — — — — — —
ForeignEndesaCostanera Argentina Foreign Banco Supervielle Argentina Ar$ 16.00% 16.00% At maturity 2,566,218 — 2,566,218 — — — —
ForeignEndesaCostanera Argentina Foreign Banco Ciudad Argentina Ar$ 16.00% 16.00% At maturity 978,500 — 978,500 — — — —
ForeignEndesaCostanera Argentina Foreign Banco Standard Argentina Ar$ 16.00% 16.00% At maturity 2,509,954 — 2,509,954 — — — —
ForeignEndesaCostanera Argentina Foreign Banco Macro Argentina Ar$ 16.00% 16.00% At maturity 368,142 — 368,142 — — — —
ForeignEndesaCostanera Chile Foreign B.N.P. Paribas USA US$ 6.32% 6.32% Semi−annually 50,233 849,448 899,681 1,698,896 849,449 — 2,548,345
91,081,000−6 Endesa Chile Chile ForeignExport DevelopmentCorporation Loan USA US$ 1.60% Libor+1.0 Semi−annually — 758,262 758,262 1,486,682 — — 1,486,682
91,081,000−6 Endesa Chile . Chile ForeignBanco Bilbao VizcayaArgentaria S.A. USA US$ 1.93% Libor+0.75 At maturity 34,267 — 34,267 30,494,018 — — 30,494,018
91,081,000−6 Endesa Chile Chile ForeignThe Bank ofTokyo−Mitsubishi, Ltd. USA US$ 1.93% Libor+0.75 At maturity — — — 17,055,976 — — 17,055,976
91,081,000−6 Endesa Chile Chile ForeignCaja Madrid, Caja MadridMiami Agency USA US$ 1.93% Libor+0.75 At maturity — — — 26,312,836 — — 26,312,836
91,081,000−6 Endesa Chile Chile ForeignBanco Santander CentralHispano S.A. N.Y.B. USA US$ 1.93% Libor+0.75 At maturity — — — 17,055,976 — — 17,055,976
91,081,000−6 Endesa Chile Chile Foreign
Banco Español de crédito
S.A. N.Y.B. USA US$ 1.93% Libor+0.75 At maturity — — — 12,921,194 — — 12,921,19491,081,000−6 Endesa Chile Argentina Foreign Deutsche Bank Argentina US$ 3.80% Libor+3.5% At maturity 40,734 3,197,006 3,237,740 6,393,998 799,242 — 7,193,240
ForeignHidroeléctricaEl Chocón Argentina Foreign Standard Bank Argentina US$ 3.80% Libor+3.5% At maturity 40,677 3,196,969 3,237,646 6,393,999 799,242 — 7,193,241
ForeignHidroeléctricaEl Chocón Argentina Foreign Banco Itau − Syndicated Argentina Ar$ 19.36% BPC + 5.75% Semi−annually 25,858 1,545,012 1,570,870 — — — —
ForeignHidroeléctricaEl Chocón Argentina Foreign Standard − Syndicated Argentina Ar$ 19.36% BPC + 5.75% Semi−annually 20,196 1,207,041 1,227,237 — — — —
ForeignHidroeléctricaEl Chocón Argentina Foreign
Banco Santander −Syndicated Argentina Ar$ 19.36% BPC + 5.75% Semi−annually 25,859 1,545,012 1,570,871 — — — —
ForeignHidroeléctricaEl Chocón Argentina Foreign
Banco Hipotecario −Syndicated Argentina Ar$ 19.36% BPC + 5.75% Semi−annually 16,968 1,013,914 1,030,882 — — — —
ForeignHidroeléctricaEl Chocón Argentina Foreign
Banco de Galicia −Syndicated Argentina Ar$ 19.36% BPC + 5.75% Semi−annually 8,077 482,816 490,893 — — — —
ForeignHidroeléctricaEl Chocón Argentina Foreign Banco Itau − Syndicated Argentina Ar$ 19.36% BPC + 5.75% Semi−annually 82,953 497,792 580,745 761,701 — — 761,701
ForeignHidroeléctricaEl Chocón Argentina Foreign
Banco Santander −Syndicated Argentina Ar$ 19.36% BPC + 5.75% Semi−annually 132,688 796,817 929,505 1,219,258 — — 1,219,258
ForeignHidroeléctricaEl Chocón Argentina Foreign
Banco de la Ciudad deBuenos Aires Argentina Ar$ 15.84% 15.84% At maturity — — — — — — —
ForeignHidroeléctricaEl Chocón Argentina Foreign Citibank Argentina Ar$ 14.50% 14.50% At maturity — — — — — — —
ForeignHidroeléctricaEl Chocón Argentina Foreign Banco Francés Argentina Ar$ 14.93% 14.93% At maturity — — — — — — —
ForeignHidroeléctricaEl Chocón Argentina Foreign Banco Industrial Argentina Ar$ 17.34% BPC + 5.00% At maturity — — — — — — —
ForeignHidroeléctricaEl Chocón Argentina Foreign Banco Macro Argentina Ar$ 17.75% 17.75% At maturity — — — — — — —
ForeignHidroeléctricaEl Chocón Argentina Foreign
Banco Itau − NuevoSyndicated Argentina Ar$ 19.12% BPC + 5.25% Semi−annually 100,996 — 100,996 2,414,203 603,521 — 3,017,724
ForeignHidroeléctricaEl Chocón Argentina Foreign
Standard − NuevoSyndicated Argentina Ar$ 19.12% BPC + 5.25% Semi−annually 283,419 1,095,492 1,378,911 4,090,481 603,521 — 4,694,002
ForeignHidroeléctricaEl Chocón Argentina Foreign
Banco Santander − NuevoSyndicated Argentina Ar$ 19.12% BPC + 5.25% Semi−annually 100,996 — 100,996 2,414,203 603,521 — 3,017,724
ForeignHidroeléctricaEl Chocón Argentina Foreign
Banco Hipotecario − NuevoSyndicated Argentina Ar$ 19.12% BPC + 5.25% Semi−annually 66,315 398,233 464,548 609,361 — — 609,361
ForeignHidroeléctricaEl Chocón Argentina Foreign
Banco de Galicia − NuevoSyndicated Argentina Ar$ 19.12% BPC + 5.25% Semi−annually 167,311 398,233 565,544 3,023,612 603,521 — 3,627,133
ForeignHidroeléctricaEl Chocón Argentina Foreign
Banco de la Ciudad − NuevoSindicado Argentina Ar$ 19.12% BPC + 5.25% Semi−annually 53,063 318,657 371,720 487,596 — — 487,596
ForeignHidroeléctricaEl Chocón Chile Foreign PNC BANK USA US$ 3.09% 3.09% Semi−annually — — — — — — —
Total 50,310,586 228,145,273 278,455,859 216,963,871 35,796,092 63,343,038 316,103,001
12−2010ID No. Effective Current ThCh$ Non−current ThCh$
Taxpayer IDNo. (RUT) Company Country
FinancialInstitution Financial Institution Country Currency
InterestRate
NominalInterest Rate
Type ofAmortization
Less than90
days
More than90 days
TotalCurrent
One toThreeYears
Three toFive Years
MorethanFive
Years
Total Non−current
ForeignEndesaCostanera Argentina Foreign Banco Santander Río Argentina Ar$ 15.50% 15.50% At maturity 882,153 — 882,153 — — — —
ForeignEndesaCostanera Argentina Foreign Banco Itau Argentina Ar$ 16.90% BAIBOR+5% At maturity 2,679,318 — 2,679,318 — — — —
ForeignEndesaCostanera Argentina Foreign Citibank Argentina Ar$ 13.50% 13.50% At maturity — 3,705,866 3,705,866 — — — —
ForeignEndesaCostanera Argentina Foreign Banco Galicia Argentina Ar$ 16.00% 16.00% At maturity 1,778,439 — 1,778,439 — — — —
ForeignEndesaCostanera Argentina Foreign Citibank Argentina US$ 5.43% LIBOR+4.8% At maturity 381,952 — 381,952 — — — —
ForeignEndesaCostanera Argentina Foreign Banco Galicia Argentina US$ 3.80%EURIBOR+3.85% At maturity — 277,010 277,010 — — — —
ForeignEndesaCostanera Argentina Foreign Banco Supervielle Argentina Ar$ 16.00% 16.00% At maturity 1,779,852 — 1,779,852 — — — —
ForeignEndesaCostanera Argentina Foreign Banco Ciudad Argentina Ar$ 16.00% 16.00% At maturity — 954,115 954,115 — — — —
ForeignEndesaCostanera Argentina Foreign Banco Standard Argentina Ar$ 16.00% 16.00% At maturity 1,159,754 — 1,159,754 — — — —
ForeignEndesaCostanera Argentina Foreign Banco Macro Argentina Ar$ 16.00% 16.00% At maturity 357,808 — 357,808 — — — —
ForeignEndesaCostanera Chile Foreign B.N.P. Paribas USA US$ 6.32% 6.32% Semi−annually — 821,662 821,662 — — — —
91,081,000−6 Endesa Chile Chile ForeignExport DevelopmentCorporation Loan USA US$ 1.60% Libor+1.0 Semi−annually 356,896 335,088 691,984 1,531,395 1,531,396 — 3,062,791

91,081,000−6 Endesa Chile . Chile ForeignBanco Bilbao VizcayaArgentaria S.A. USA US$ 1.93% Libor+0.75 At maturity 24,636 — 24,636 1,340,104 670,052 — 2,010,156
91,081,000−6 Endesa Chile Chile ForeignThe Bank ofTokyo−Mitsubishi, Ltd. USA US$ 1.93% Libor+0.75 At maturity — — — — 27,418,295 — 27,418,295
91,081,000−6 Endesa Chile Chile ForeignCaja Madrid, Caja MadridMiami Agency USA US$ 1.93% Libor+0.75 At maturity — — — — 15,335,657 — 15,335,657
91,081,000−6 Endesa Chile Chile ForeignBanco Santander CentralHispano S.A. N.Y.B. USA US$ 1.93% Libor+0.75 At maturity — — — — 23,235,843 — 23,235,843
91,081,000−6 Endesa Chile Chile Foreign
Banco Español de crédito
S.A. N.Y.B. USA US$ 1.93% Libor+0.75 At maturity — — — — 15,335,656 — 15,335,65691,081,000−6 Endesa Chile Argentina Foreign Deutsche Bank Argentina US$ 3.80% Libor+3.5% At maturity 1,383,337 8,390,068 9,773,405 — 11,617,921 — 11,617,921
ForeignHidroeléctricaEl Chocón Argentina Foreign Standard Bank Argentina US$ 3.80% Libor+3.5% At maturity 1,383,337 8,390,067 9,773,404 — — — —
ForeignHidroeléctricaEl Chocón Argentina Foreign Banco Itau − Syndicated Argentina Ar$ 19.36% BPC + 5.75% Semi−annually 22,071 1,095,330 1,117,401 — — — —
ForeignHidroeléctricaEl Chocón Argentina Foreign Standard − Syndicated Argentina Ar$ 19.36% BPC + 5.75% Semi−annually 22,071 1,095,330 1,117,401 1,095,330 — — 1,095,330
ForeignHidroeléctricaEl Chocón Argentina Foreign
Banco Santander −Syndicated Argentina Ar$ 19.36% BPC + 5.75% Semi−annually 23,732 1,177,774 1,201,506 1,095,330 — — 1,095,330
ForeignHidroeléctricaEl Chocón Argentina Foreign
Banco Hipotecario −Syndicated Argentina Ar$ 19.36% BPC + 5.75% Semi−annually 19,936 989,330 1,009,266 1,177,774 — — 1,177,774
ForeignHidroeléctricaEl Chocón Argentina Foreign
Banco de Galicia −Syndicated Argentina Ar$ 19.36% BPC + 5.75% Semi−annually 9,493 471,110 480,603 989,330 — — 989,330
ForeignHidroeléctricaEl Chocón Argentina Foreign Banco Itau − Syndicated Argentina Ar$ 19.36% BPC + 5.75% Semi−annually 8,307 412,221 420,528 471,110 — — 471,110
ForeignHidroeléctricaEl Chocón Argentina Foreign
Banco Santander −Syndicated Argentina Ar$ 19.36% BPC + 5.75% Semi−annually 8,307 412,221 420,528 412,221 — — 412,221
ForeignHidroeléctricaEl Chocón Argentina Foreign
Banco de la Ciudad deBuenos Aires Argentina Ar$ 15.84% 15.84% At maturity 10,029 — 10,029 412,221 — — 412,221
ForeignHidroeléctricaEl Chocón Argentina Foreign Citibank Argentina Ar$ 14.50% 14.50% At maturity 729,446 — 729,446 — — — —
ForeignHidroeléctricaEl Chocón Argentina Foreign Banco Francés Argentina Ar$ 14.93% 14.93% At maturity 596,140 — 596,140 — — — —
ForeignHidroeléctricaEl Chocón Argentina Foreign Banco Industrial Argentina Ar$ 17.34% BPC + 5.00% At maturity 711,729 — 711,729 — — — —
ForeignHidroeléctricaEl Chocón Argentina Foreign Banco Macro Argentina Ar$ 17.75% 17.75% At maturity 2,391,059 — 2,391,059 — — — —
ForeignHidroeléctricaEl Chocón Argentina Foreign
Banco Itau − NuevoSyndicated Argentina Ar$ 19.12% BPC + 5.25% Semi−annually 245,369 2,314 247,683 — — — —
ForeignHidroeléctricaEl Chocón Argentina Foreign
Standard − NuevoSyndicated Argentina Ar$ 19.12% BPC + 5.25% Semi−annually 539,813 5,092 544,905 1,226,886 — — 1,226,886
ForeignHidroeléctricaEl Chocón Argentina Foreign
Banco Santander − NuevoSyndicated Argentina Ar$ 19.12% BPC + 5.25% Semi−annually 392,591 3,703 396,294 2,699,066 — — 2,699,066
ForeignHidroeléctricaEl Chocón Argentina Foreign
Banco Hipotecario − NuevoSyndicated Argentina Ar$ 19.12% BPC + 5.25% Semi−annually 196,296 1,851 198,147 1,962,957 — — 1,962,957
ForeignHidroeléctricaEl Chocón Argentina Foreign
Banco de Galicia − NuevoSyndicated Argentina Ar$ 19.12% BPC + 5.25% Semi−annually 196,296 1,851 198,147 981,478 — — 981,478
ForeignHidroeléctricaEl Chocón Argentina Foreign
Banco de la Ciudad − NuevoSindicado Argentina Ar$ 19.12% BPC + 5.25% Semi−annually — — — 981,478 — — 981,478
ForeignHidroeléctricaEl Chocón Chile Foreign PNC BANK USA US$ 3.09% 3.09% Semi−annually — 208,031 208,031 — — — —
Total 33,214,645 151,238,334 184,452,979 230,557,425 190,395,117 30,985,066 451,937,608
Appendix No.4, letter a), presents additional information on financial debt which includes a projection of future cash flows (undiscounted) that the Groupwill have to disburse to settle the bank loans detailed above.
F−78

Table of Contents
18.3 The detail of Unsecured Liabilities by currency and maturity as of December 31, 2011 and 2010 is as follows:
• Summary of Unsecured Liabilities by currency and maturity
Current Non−currentMaturity Maturity
NominalAnnual Secured/
One to ThreeMonths
Three toTwelveMonths
TotalCurrent at
12−31−2011One to Three
YearsThree to Five
YearsMore thanFive Years
TotalNon−current
at 12−31−2011Country Currency Rate Unsecured ThCh$ ThCh$ ThCh$ ThCh$ ThCh$ ThCh$ ThCh$
Chile US$ 8.10%Unsecured 22,439,241 802,032 23,241,273 396,001,073236,020,317 157,801,599 789,822,989Chile CH$ 5.29%Unsecured 31,548,592 9,198,469 40,747,061 13,764,742 14,617,263 378,064,242 406,446,247Peru US$ 6.97%Unsecured 853,625 60,597 914,222 5,049,784 13,692,084 19,828,195 38,570,063Peru Soles 7.37%Unsecured 27,920,075 57,158 27,977,233 80,986,235 42,415,673 28,905,326 152,307,234Argentina Ar$ 12.28%Unsecured 15,571 3,963,560 3,979,131 — — — —Colombia CPs 8.99%Unsecured 1,753,145 36,094,355 37,847,500 131,329,301 76,673,844 574,038,462 782,041,607Brazil Reais 12.97%Unsecured 6,688,369 101,390,968108,079,337 60,242,802 120,351,829 90,131,132 270,725,763
Total 91,218,618 151,567,139242,785,757687,373,937503,771,0101,248,768,9562,439,913,903
Current Non−currentMaturity Maturity
NominalAnnual Secured/
One to ThreeMonths
Three toTwelveMonths
TotalCurrent at
12−31−2010One to Three
YearsThree to Five
YearsMore thanFive Years
TotalNon−current
at 12−31−2010Country Currency Rate Unsecured ThCh$ ThCh$ ThCh$ ThCh$ ThCh$ ThCh$ ThCh$
Chile US$ 8.10%Unsecured 20,226,869 722,956 20,949,825 185,675,099263,691,199 261,884,873 711,251,171Chile CH$ 5.32%Unsecured 1,091,599 9,114,072 10,205,671 14,544,226 15,984,434 396,428,448 426,957,108Peru US$ 6.88%Unsecured 870,099 3,801,453 4,671,552 — 7,528,779 27,242,221 34,771,000Peru Soles 7.35%Unsecured 19,784,574 49,456 19,834,030 57,933,048 51,988,516 39,215,602 149,137,166Argentina Ar$ 12.28%Unsecured — 7,736,090 7,736,090 3,862,274 — — 3,862,274Colombia CPs 7.88%Unsecured 1,586,797 131,473,631133,060,428 89,822,752 37,829,581 414,522,034 542,174,367Brazil Reais 11.29%Unsecured 7,503,875 77,690,863 85,194,738 128,445,480 42,472,182 — 170,917,662
Total 51,063,813 230,588,521281,652,334480,282,879419,494,6911,139,293,1782,039,070,748
18.4 The detail of Secured Liabilities by currency and maturity as of December 31, 2011 and 2010 is as follows:
• Summary of Secured Liabilities by currency and maturity
Current Non−currentMaturity Total Maturity Total
NominalAnnual Secured/
One to ThreeMonths
Three to TwelveMonths
Current at
12−31−2011One to Three
YearsThree to Five
YearsMore thanFive Years
Non−currentat 12−31−2011
Country Currency Rate Unsecured ThCh$ ThCh$ ThCh$ ThCh$ ThCh$ ThCh$ ThCh$
Peru US$ 6.15% Secured — 10,463,994 10,463,994 — — — —Peru Soles 6.41% Secured 135,886 60,596 196,482 9,635,108 — — 9,635,108
Total 135,886 10,524,590 10,660,476 9,635,108 — — 9,635,108
Current Non−currentMaturity Total Maturity Total
NominalAnnual Secured/
One to ThreeMonths
Three to TwelveMonths
Current at
12−31−2010One to Three
YearsThree to Five
YearsMore thanFive Years
Non−currentat 12−31−2010
Country Currency Rate Unsecured ThCh$ ThCh$ ThCh$ ThCh$ ThCh$ ThCh$ ThCh$
Peru US$ 6.15% Secured — 66,252 66,252 9,367,060 — — 9,367,060Peru Soles 6.26% Secured 4,373,389 5,082,647 9,456,036 4,168,325 4,168,325 — 8,336,650
Total 4,373,389 5,148,899 9,522,288 13,535,385 4,168,325 — 17,703,710
The fair value of current and non−current secured and unsecured liabilities totaled ThCh$ 3,209,731,363 and ThCh$ 2,753,493,822 as of December 31,2011 and December 31, 2010 respectively.
F−79

Table of Contents
• Secured and Unsecured Liabilities by Company
12−2011Taxpayer ID ID No. Current ThCh$ Non−current ThCh$
No.(RUT) Company Country
FinancialInstitution Financial Institution Country Currency
EffectiveInterest Rate
NominalInterest Rate
Secured/Unsecured
Less than90 days
More than90 days
TotalCurrent
One toThree Years
Three toFive Years
More thanFive Years
Total
Non−current
Foreign Chinango Peru ForeignBANCOCONTINENTAL Peru Soles 6.57% 6.57% YES — 60,596 60,596 4,817,554 — — 4,817,554
Foreign Chinango Peru ForeignBANCOCONTINENTAL Peru Soles 6.16% 6.16% YES — — — — — — —
Foreign Chinango Peru ForeignBANCOCONTINENTAL Peru Soles 6.15% 6.15% YES 135,886 — 135,886 4,817,554 — — 4,817,554
Foreign Chinango Peru ForeignBANCOCONTINENTAL Peru Soles 5.91% 5.91% YES — — — — — — —
Foreign Chinango Peru ForeignBANCOCONTINENTAL Peru US$ 6.15% 6.15% YES — 10,463,994 10,463,994 — — — —
Total Secured Bonds 135,886 10,524,590 10,660,476 9,635,108 — — 9,635,108
Foreign Ampla Brazil Foreign BONDS Brazil Reais 12.01% CDI+1.05%aa No 4,711,895 83,544,437 88,256,332 — 17,199,885 34,700,328 51,900,213Foreign Ampla Brazil Foreign BONDS Brazil Reais 12.28% CDI+1.30%aa No 164,014 — 164,014 — 32,546,476 — 32,546,476Foreign Ampla Brazil Foreign BONDS Brazil Reais 16.48% CDI+5.61%aa No 147,518 — 147,518 27,931,549 14,103,489 — 42,035,038Foreign Codensa Colombia Foreign B5 Colombia CPs CPI+6.14% CPI+6.14% No — — — — — — —Foreign Codensa Colombia Foreign B8 Colombia CPs 9.09% 8.80% No 390,407 — 390,407 66,868,280 — — 66,868,280Foreign Codensa Colombia Foreign B302 Colombia CPs CPI+4.60% CPI+4.60% No — — — — — — —Foreign Codensa Colombia Foreign B102 Colombia CPs 8.03% 7.80% No 456,111 — 456,111 — — 104,210,669 104,210,669Foreign Codensa Colombia Foreign B502 Colombia CPs 5.97% 5.97% No 30,623 9,019,194 9,049,817 — — — —Foreign Codensa Colombia Foreign B503 Colombia CPs 6.06% 6.06% No 115,603 — 115,603 22,868,952 — — 22,868,952Foreign Codensa Colombia Foreign B503 Colombia CPs 8.74% 8.46% No 91,853 — 91,853 20,194,220 — — 20,194,220Foreign Codensa Colombia Foreign B103 Colombia CPs 8.28% 8.04% No 181,497 — 181,497 — — 21,397,849 21,397,849Foreign Codensa Colombia Foreign B304 Colombia CPs 5.65% 5.53% No 114,096 — 114,096 21,397,849 — — 21,397,849Foreign Codensa Colombia Foreign B304 Colombia CPs 6.61% 6.45% No 372,955 — 372,955 — 38,783,602 — 38,783,602Foreign Coelce Brazil Foreign Itaú Brazil Reais 12.34% 12.11% No — 700,207 700,207 — 28,930,201 — 28,930,201Foreign Coelce Brazil Foreign Santander Brazil Reais 14.41% 14.11% No 1,664,942 17,146,324 18,811,266 32,311,253 27,571,778 55,430,804 115,313,835
Foreign Edegel Peru ForeignBANCOCONTINENTAL Peru Soles 6.41% 6.31% No — 7,603 7,603 — — 4,817,555 4,817,555
Foreign Edegel Peru ForeignBANCOCONTINENTAL Peru Soles 6.38% 6.28% No 148,780 — 148,780 — — 4,817,555 4,817,555
Foreign Edegel Peru ForeignBANCOCONTINENTAL Peru Soles 6.86% 6.75% No 86,706 — 86,706 3,854,084 — — 3,854,084
Foreign Edegel Peru ForeignBANCOCONTINENTAL Peru Soles 6.54% 6.44% No — 33,597 33,597 4,817,555 — — 4,817,555
Foreign Edegel Peru ForeignBANCOCONTINENTAL Peru Soles 6.73% 6.63% No — 15,958 15,958 4,817,555 — — 4,817,555
Foreign Edegel Peru ForeignBANCOCONTINENTAL Peru Soles 6.61% 6.50% No 88,723 — 88,723 4,817,555 — — 4,817,555
Foreign Edegel Peru ForeignBANCOCONTINENTAL Peru Soles 6.70% 6.59% No 112,871 — 112,871 5,453,472 — — 5,453,472
Foreign Edegel Peru ForeignBANCOCONTINENTAL Peru US$ 5.86% 5.78% No 141,895 — 141,895 — — 5,195,251 5,195,251
Foreign Edegel Peru ForeignBANCOCONTINENTAL Peru US$ 6.06% 5.97% No — — — — — — —
Foreign Edegel Peru ForeignBANCOCONTINENTAL Peru US$ 6.44% 6.34% No 141,900 — 141,900 — — 5,195,251 5,195,251
Foreign Edegel Peru ForeignBANCOCONTINENTAL Peru US$ 7.25% 7.13% No — 60,597 60,597 5,049,784 — — 5,049,784
Foreign Edegel Peru ForeignBANCOCONTINENTAL Peru US$ 7.13% 7.13% No 104,550 — 104,550 — 3,301,582 — 3,301,582
Foreign Edegel Peru ForeignBANCOSCOTIABANK Peru US$ 9.20% 9.00% No 85,722 — 85,722 — 5,195,251 — 5,195,251
Foreign Edegel Peru ForeignBANCOSCOTIABANK Peru US$ 6.09% 6.00% No 146,718 — 146,718 — — 4,242,442 4,242,442
Foreign Edegel Peru ForeignBANCOSCOTIABANK Peru US$ 6.73% 6.63% No 157,752 — 157,752 — 5,195,251 — 5,195,251
Foreign Edegel Peru ForeignBANCOSCOTIABANK Peru US$ 7.93% 7.78% No 75,088 — 75,088 — — 5,195,251 5,195,251
Foreign Edelnor Peru ForeignMilitary/PolicePension Fund Peru Soles 1.27% 0.54% No — — — — — — —
Foreign Edelnor Peru Foreign FCR — Macro fund Peru Soles 8.67% 5.44% No — — — — — — —Foreign Edelnor Peru Foreign Rimac Internacional
Cia de SegurosPeru Soles 9.92% 6.50% No 4,840 — 4,840 — — — —
Foreign Edelnor Peru Foreign Rimac InternacionalCia de Seguros
Peru Soles 9.92% 6.50% No 48,852 — 48,852 4,756,410 — — 4,756,410
Foreign Edelnor Peru Foreign AFP Integra Peru Soles 8.94% 8.75% No 17,997 — 17,997 4,746,484 — — 4,746,484Foreign Edelnor Peru Foreign Retirement Fund for
NoncommissionedOfficers andSpecialists − Fosersoe
Peru Soles 8.00% 7.84% No 10,266 — 10,266 9,476,559 — — 9,476,559
Foreign Edelnor Peru Foreign AFP Integra Peru Soles 7.71% 7.56% No 28,102 — 28,102 — 5,781,065 — 5,781,065
12−2010Taxpayer ID ID No. Current ThCh$ Non−current ThCh$
No.(RUT) Company Country
FinancialInstitution Financial Institution Country Currency
EffectiveInterest Rate
NominalInterest Rate
Secured/Unsecured
Less than90 days
More than90 days
TotalCurrent
One toThree Years
Three toFive Years
More thanFive Years
Total
Non−current
Foreign Chinango Peru ForeignBANCOCONTINENTAL Peru Soles 6.57% 6.57% YES — 52,430 52,430 4,168,325 — — 4,168,325
Foreign Chinango Peru ForeignBANCOCONTINENTAL Peru Soles 6.16% 6.16% YES — 5,030,217 5,030,217 — — — —
Foreign Chinango Peru ForeignBANCOCONTINENTAL Peru Soles 6.15% 6.15% YES 117,614 — 117,614 — 4,168,325 — 4,168,325
Foreign Chinango Peru ForeignBANCOCONTINENTAL Peru Soles 5.91% 5.91% YES 4,255,775 — 4,255,775 — — — —
Foreign Chinango Peru ForeignBANCOCONTINENTAL Peru US$ 6.15% 6.15% YES — 66,252 66,252 9,367,060 — — 9,367,060
Total Secured Bonds 4,373,389 5,148,899 9,522,288 13,535,385 4,168,325 — 17,703,710
Foreign Ampla Brazil Foreign BONDS Brazil Reais 12.01% CDI+1.05%aa No 4,686,546 52,169,863 56,856,409 52,170,000 — — 52,170,000

Foreign Ampla Brazil Foreign BONDS Brazil Reais 12.28% CDI+1.30%aa No 174,000 — 174,000 32,523,060 — — 32,523,060Foreign Ampla Brazil Foreign BONDS Brazil Reais 16.48% CDI+5.61%aa No 153,269 — 153,269 13,096,397 26,860,183 — 39,956,580Foreign Codensa Colombia Foreign B5 Colombia CPs CPI+6.14% CPI+6.14% No 240,683 48,655,410 48,896,093 — — — —Foreign Codensa Colombia Foreign B8 Colombia CPs 9.09% 8.80% No 307,948 — 307,948 60,819,262 — — 60,819,262Foreign Codensa Colombia Foreign B302 Colombia CPs CPI+4.60% CPI+4.60% No 353,650 — 353,650 — — — —Foreign Codensa Colombia Foreign B102 Colombia CPs 8.03% 7.80% No — — — — — 94,695,348 94,695,348Foreign Codensa Colombia Foreign B502 Colombia CPs 5.97% 5.97% No 22,810 — 22,810 8,203,302 — — 8,203,302Foreign Codensa Colombia Foreign B503 Colombia CPs 6.06% 6.06% No 69,066 — 69,066 20,800,188 — — 20,800,188Foreign Codensa Colombia Foreign B503 Colombia CPs 8.74% 8.46% No 89,400 — 89,400 — 18,367,417 — 18,367,417Foreign Codensa Colombia Foreign B103 Colombia CPs 8.28% 8.04% No 90,029 — 90,029 — — 19,462,164 19,462,164Foreign Codensa Colombia Foreign B304 Colombia CPs 5.65% 5.53% No 132,693 — 132,693 — 19,462,164 — 19,462,164Foreign Codensa Colombia Foreign B304 Colombia CPs 6.61% 6.45% No 280,518 — 280,518 — — 35,275,172 35,275,172Foreign Coelce Brazil Foreign Itaú Brazil Reais 12.34% 12.11% No 890,856 25,521,000 26,411,856 — — — —Foreign Coelce Brazil Foreign Santander Brazil Reais 14.41% 14.11% No 1,599,204 — 1,599,204 30,656,023 15,611,999 — 46,268,022
Foreign Edegel Peru ForeignBANCOCONTINENTAL Peru Soles 6.41% 6.31% No — 6,578 6,578 — — 4,168,325 4,168,325
Foreign Edegel Peru ForeignBANCOCONTINENTAL Peru Soles 6.38% 6.28% No 128,730 — 128,730 — — 4,168,325 4,168,325
Foreign Edegel Peru ForeignBANCOCONTINENTAL Peru Soles 6.86% 6.75% No 75,030 — 75,030 — 3,334,660 — 3,334,660
Foreign Edegel Peru ForeignBANCOCONTINENTAL Peru Soles 6.54% 6.44% No 76,767 — 76,767 4,168,325 — — 4,168,325
Foreign Edegel Peru ForeignBANCOCONTINENTAL Peru Soles 6.73% 6.63% No — 29,070 29,070 4,168,325 — — 4,168,325
Foreign Edegel Peru ForeignBANCOCONTINENTAL Peru Soles 6.61% 6.50% No — 13,808 13,808 4,168,325 — — 4,168,325
Foreign Edegel Peru ForeignBANCOCONTINENTAL Peru Soles 6.70% 6.59% No 97,660 — 97,660 — 4,718,544 — 4,718,544
Foreign Edegel Peru ForeignBANCOCONTINENTAL Peru US$ 5.86% 5.78% No 127,919 — 127,919 — — 4,683,530 4,683,530
Foreign Edegel Peru ForeignBANCOCONTINENTAL Peru US$ 6.06% 5.97% No 100,637 3,746,824 3,847,461 — — — —
Foreign Edegel Peru ForeignBANCOCONTINENTAL Peru US$ 6.44% 6.34% No 127,923 — 127,923 — — 4,683,530 4,683,530
Foreign Edegel Peru ForeignBANCOCONTINENTAL Peru US$ 7.25% 7.13% No — 54,629 54,629 — 4,552,391 — 4,552,391
Foreign Edegel Peru ForeignBANCOCONTINENTAL Peru US$ 7.13% 7.13% No 132,266 — 132,266 — — 3,824,571 3,824,571
Foreign Edegel Peru ForeignBANCOSCOTIABANK Peru US$ 9.20% 9.00% No 94,171 — 94,171 — 2,976,388 — 2,976,388
Foreign Edegel Peru ForeignBANCOSCOTIABANK Peru US$ 6.09% 6.00% No 142,213 — 142,213 — — 4,683,530 4,683,530
Foreign Edegel Peru ForeignBANCOSCOTIABANK Peru US$ 6.73% 6.63% No 77,278 — 77,278 — — 4,683,530 4,683,530
Foreign Edegel Peru ForeignBANCOSCOTIABANK Peru US$ 7.93% 7.78% No 67,692 — 67,692 — — 4,683,530 4,683,530
Foreign Edelnor Peru ForeignMilitary/PolicePension Fund Peru Soles 1.27% 0.54% No 3,465,734 — 3,465,734 — — — —
Foreign Edelnor Peru Foreign FCR — Macro fund Peru Soles 8.67% 5.44% No 819,886 — 819,886 — — — —Foreign Edelnor Peru Foreign Rimac Internacional
Cia de SegurosPeru Soles 9.92% 6.50% No 40,394 — 40,394 — 3,932,869 — 3,932,869
Foreign Edelnor Peru Foreign Rimac InternacionalCia de Seguros
Peru Soles 9.92% 6.50% No 14,881 — 14,881 — 3,924,661 — 3,924,661
Foreign Edelnor Peru Foreign AFP Integra Peru Soles 8.94% 8.75% No 8,489 — 8,489 — 7,835,713 — 7,835,713Foreign Edelnor Peru Foreign Retirement Fund for
NoncommissionedOfficers andSpecialists − Fosersoe
Peru Soles 8.00% 7.84% No 24,315 — 24,315 — 5,001,990 — 5,001,990
Foreign Edelnor Peru Foreign AFP Integra Peru Soles 7.71% 7.56% No 25,430 — 25,430 666,932 — — 666,932
F−80

Table of Contents
• Secured and Unsecured Liabilities by Company, continued
12−2011ID No. Effective Current ThCh$ Non−current ThCh$
Taxpayer IDNo. (RUT) Company Country
FinancialInstitution
FinancialInstitution Country Currency
InterestRate
NominalInterest
RateSecured/
Unsecured
Less than90
daysMore than
90 daysTotal
Current
One toThreeYears
Three toFive Years
More thanFive Years
TotalNon−current
Foreign Edelnor Peru Foreign Social HealthInsurance −Essalud
Peru Soles
8.32% 8.16% No 29,390 — 29,390 770,809 — — 770,809Foreign Edelnor Peru Foreign AFP Profuturo Peru Soles 7.35% 7.22% No 23,074 — 23,074 2,890,532 — — 2,890,532Foreign Edelnor Peru Foreign AFP Integra Peru Soles 8.16% 8.00% No 137,526 — 137,526 — 3,468,639 — 3,468,639Foreign Edelnor Peru Foreign AFP Horizonte Peru Soles 6.77% 6.66% No 2,516,119 — 2,516,119 — — — —Foreign Edelnor Peru Foreign AFP Integra Peru Soles 5.77% 5.69% No 69,553 — 69,553 — 2,890,532 — 2,890,532Foreign Edelnor Peru Foreign AFP Integra Peru Soles 5.99% 5.91% No 173,552 — 173,552 — 5,241,499 — 5,241,499Foreign Edelnor Peru Foreign FCR — Macro
FundPeru Soles
6.06% 5.97% No 44,894 — 44,894 2,890,532 — — 2,890,532Foreign Edelnor Peru Foreign AFP Profuturo Peru Soles 7.06% 6.94% No 3,897,275 — 3,897,275 — — — —Foreign Edelnor Peru Foreign AFP Integra Peru Soles 6.67% 6.56% No 44,894 — 44,894 — 3,854,043 — 3,854,043Foreign Edelnor Peru Foreign AFP Horizonte Peru Soles 6.96% 6.84% No 7,930,354 — 7,930,354 — — — —Foreign Edelnor Peru Foreign AFP Prima Peru Soles 6.38% 6.28% No 179,735 — 179,735 — 7,708,087 — 7,708,087Foreign Edelnor Peru Foreign AFP Prima Peru Soles 6.93% 6.81% No 5,894,881 — 5,894,881 — — — —Foreign Edelnor Peru Foreign AFP Prima Peru Soles 7.25% 7.13% No 5,082,940 — 5,082,940 — — — —Foreign Edelnor Peru Foreign AFP Integra Peru Soles 7.64% 7.50% No 186,831 — 186,831 5,781,065 — — 5,781,065Foreign Edelnor Peru Foreign Mapfre Peru
Cia de SegurosPeru Soles
7.87% 7.72% No 81,366 — 81,366 3,854,043 — — 3,854,043Foreign Edelnor Peru Foreign AFP Prima Peru Soles 8.49% 8.31% No 15,498 — 15,498 4,817,554 — — 4,817,554Foreign Edelnor Peru Foreign AFP Prima Peru Soles 8.42% 8.25% No — — — — — — —Foreign Edelnor Peru Foreign AFP Prima Peru Soles 7.97% 7.81% No 16,209 — 16,209 — 4,817,554 — 4,817,554Foreign Edelnor Peru Foreign AFP Prima Peru Soles 8.06% 7.91% No 209,478 — 209,478 5,781,065 — — 5,781,065Foreign Edelnor Peru Foreign AFP Profuturo Peru Soles 8.23% 8.06% No — — — — — — —Foreign Edelnor Peru Foreign AFP Profuturo Peru Soles 6.67% 6.56% No 210,758 — 210,758 5,781,065 — — 5,781,065Foreign Edelnor Peru Foreign AFP Profuturo Peru Soles 7.06% 7.06% No 115,030 — 115,030 — 4,800,211 — 4,800,211Foreign Edelnor Peru Foreign AFP Profuturo Peru Soles 6.63% 6.63% No 48,664 — 48,664 5,679,896 — — 5,679,896Foreign Edelnor Peru Foreign AFP Profuturo Peru Soles 7.44% 7.44% No 85,060 — 85,060 — — 5,781,065 5,781,065Foreign Edelnor Peru Foreign Fondo Mi
ViviendaPeru Soles
6.50% 6.50% No 42,555 — 42,555 — 3,854,043 — 3,854,043Foreign Edelnor Peru Foreign Rimac
InternacionalCia de Seguros
Peru Soles
7.03% 7.03% No 171,987 — 171,987 — — 5,781,065 5,781,065Foreign Edelnor Peru Foreign AFP Prima Peru Soles 6.50% 6.50% No 40,360 — 40,360 — — 3,854,043 3,854,043Foreign Edelnor Peru Foreign Fifth Series A Peru Soles 7.03% 7.03% No 124,955 — 124,955 — — 3,854,043 3,854,043Foreign Edesur ArgentinaForeign oeds7 Argentina Ar$ 12.28% 11.75% No — — — — — — —Foreign Edesur ArgentinaForeign oeds7 Argentina Ar$ 12.28% 11.75% No 15,571 3,963,560 3,979,131 — — — —Foreign Emgesa ColombiaForeign A−10 Bonds Colombia CPs 8.21% 7.97% No — 534,079 534,079 — — 56,169,355 56,169,355Foreign Emgesa ColombiaForeign B−103 Bonds Colombia CPs 8.33% 8.33% No — 3,654,924 3,654,924 — — 45,470,431 45,470,431Foreign Emgesa ColombiaForeign A102 Bonds Colombia CPs 8.21% 7.97% No — 101,729 101,729 — — 9,747,283 9,747,283Foreign Emgesa ColombiaForeign A5 Bonds Colombia CPs 5.32% 5.22% No — 116,036 116,036 — 13,223,871 — 13,223,871Foreign Emgesa ColombiaForeign B10 Bonds Colombia CPs 8.97% 8.69% No — 575,302 575,302 — — 42,811,747 42,811,747Foreign Emgesa ColombiaForeign B15 Bonds Colombia CPs 9.29% 8.99% No — 205,704 205,704 — — 14,844,758 14,844,758Foreign Emgesa ColombiaForeign B09−09 Bonds Colombia CPs 9.10% 8.80% No — 1,416,305 1,416,305 — — 58,362,634 58,362,634Foreign Emgesa ColombiaForeign B12 Bonds Colombia CPs 9.30% 9.00% No — 592,993 592,993 — — 23,960,242 23,960,242Foreign Emgesa ColombiaForeign Commercial
papersColombia CPs
4.20% 4.20% No — — — — — — —Foreign Emgesa ColombiaForeign E5−09 Bonds Colombia CPs 9.27% 9.27% No — 1,146,419 1,146,419 — 24,666,371 — 24,666,371Foreign Emgesa ColombiaForeign B7 Bonds Colombia CPs 9.31% 9.00% No — — — — — — —Foreign Emgesa ColombiaForeign B72 Bonds Colombia CPs 9.31% 9.00% No — — — — — — —Foreign Emgesa ColombiaForeign Foreign bonds Colombia CPs 10.17% 10.17% No — 2,288,195 2,288,195 — — 24,072,581 24,072,581Foreign Emgesa ColombiaForeign Quimbo bonds Colombia CPs 10.17% 10.17% No — 16,443,475 16,443,475 — — 172,990,913 172,990,91391,081,000−6Endesa
ChileChile Foreign The Bank of
New YorkMellon — FirstIssuance S−1
USA US$
7.96% 7.96% No 3,507,440 — 3,507,440 — — 105,516,202 105,516,20291,081,000−6Endesa
ChileChile Foreign The Bank of
New YorkMellon — FirstIssuance S−2
USA US$
7.40% 7.40% No 1,121,609 — 1,121,609 — — 36,254,989 36,254,98991,081,000−6Endesa
ChileChile Foreign The Bank of
New YorkMellon — FirstIssuance S−3
USA US$
8.26% 8.26% No 710,395 — 710,395 — — 15,584,934 15,584,93491,081,000−6Endesa
ChileChile 97,004,000−5Banco
Santander Chile− 264 Series−F
Chile U.F.
6.44% 6.44% No 31,548,592 — 31,548,592 — — — —91,081,000−6Endesa
ChileChile Foreign The Bank of
New YorkMellon −144−A
USA US$
8.50% 8.50% No 7,225,533 — 7,225,533206,726,825 — — 206,726,82591,081,000−6Endesa
ChileChile Foreign The Bank of
New YorkMellon −144−A
USA US$
8.83% 8.83% No 3,731,750 — 3,731,750 — 102,843,263 — 102,843,26391,081,000−6Endesa
ChileChile 97,004,000−5Banco
Santander Chile− 317 Series−H
Chile U.F.
7.17% 7.17% No — 5,653,703 5,653,703 9,274,316 9,274,316 51,798,587 70,347,21991,081,000−6Endesa
ChileChile 97,004,000−5Banco
Santander Chile− 318 Series−K
Chile U.F.
3.86% 3.86% No — 699,402 699,402 — — 88,931,329 88,931,32991,081,000−6Endesa
ChileChile 97,004,000−5Banco
Santander Chile− 522Series−M
Chile U.F.
4.82% 4.82% No — 436,109 436,109 — — 218,509,846 218,509,84694,271,000−3Enersis Chile Foreign Yankee Bonds
2016USA US$
7.76% 7.40% No — 799,582 799,582 — 133,177,054 — 133,177,05494,271,000−3Enersis Chile Foreign Yankee Bonds
2026USA US$
7.76% 6.60% No — 2,450 2,450 — — 445,474 445,47494,271,000−3Enersis Chile Foreign Yankee Bonds
2014USA US$
7.69% 7.38% No 6,142,514 — 6,142,514189,274,248 — — 189,274,24894,271,000−3Enersis Chile 97,004,000−5Bonds UF 269 Chile U.F. 7.02% 5.75% No — 2,409,255 2,409,255 4,490,426 5,342,947 18,824,480 28,657,853
Total Unsecured Bonds 91,218,618151,567,139242,785,757687,373,937503,771,0101,248,768,9562,439,913,903
12−2010
ID No. Effective Current ThCh$Non−current
ThCh$
Taxpayer IDNo. (RUT) Company Country
FinancialInstitution
FinancialInstitution Country Currency
InterestRate
NominalInterest
RateSecured/
Unsecured
Less than90
days
More than90
daysTotal
Current
One toThreeYears
Three toFive
YearsMore thanFive Years
TotalNon−Current
Foreign Edelnor Peru Foreign Social HealthInsurance −Essalud
Peru Soles8.32
%8.16
%No 19,965 — 19,965 2,500,995 — — 2,500,995
Foreign Edelnor Peru Foreign AFP Profuturo Peru Soles 7.35% 7.22% No 118,993 — 118,993 — — 3,001,194 3,001,194Foreign Edelnor Peru Foreign AFP Integra Peru Soles 8.16% 8.00% No 60,180 — 60,180 — — 2,500,995 2,500,995Foreign Edelnor Peru Foreign AFP Horizonte Peru Soles 6.77% 6.66% No 3,432,135 — 3,432,135 — — — —Foreign Edelnor Peru Foreign AFP Integra Peru Soles 5.77% 5.69% No 150,163 — 150,163 — — 4,535,138 4,535,138Foreign Edelnor Peru Foreign AFP Integra Peru Soles 5.99% 5.91% No 38,844 — 38,844 2,500,995 — — 2,500,995

Foreign Edelnor Peru Foreign FCR — MacroFund
Peru Soles 6.06% 5.97% No 37,405 — 37,405 3,334,660 — — 3,334,660
Foreign Edelnor Peru Foreign AFP Profuturo Peru Soles 7.06% 6.94% No 38,844 — 38,844 — 3,334,660 — 3,334,660Foreign Edelnor Peru Foreign AFP Integra Peru Soles 6.67% 6.56% No 192,403 — 192,403 6,669,320 — — 6,669,320Foreign Edelnor Peru Foreign AFP Horizonte Peru Soles 6.96% 6.84% No 155,513 — 155,513 — 6,669,320 — 6,669,320Foreign Edelnor Peru Foreign AFP Prima Peru Soles 6.38% 6.28% No 98,477 — 98,477 5,001,990 — — 5,001,990Foreign Edelnor Peru Foreign AFP Prima Peru Soles 6.93% 6.81% No 161,653 — 161,653 5,001,990 — — 5,001,990Foreign Edelnor Peru Foreign AFP Prima Peru Soles 7.25% 7.13% No 3,401,208 — 3,401,208 — — — —Foreign Edelnor Peru Foreign AFP Integra Peru Soles 7.64% 7.50% No 70,401 — 70,401 3,334,660 — — 3,334,660Foreign Edelnor Peru Foreign Mapfre Peru
Cia de SegurosPeru Soles 7.87% 7.72% No 13,410 — 13,410 — 4,168,325 — 4,168,325
Foreign Edelnor Peru Foreign AFP Prima Peru Soles 8.49% 8.31% No 14,025 — 14,025 — — 4,168,325 4,168,325Foreign Edelnor Peru Foreign AFP Prima Peru Soles 8.42% 8.25% No 3,452,068 — 3,452,068 — — — —Foreign Edelnor Peru Foreign AFP Prima Peru Soles 7.97% 7.81% No 181,248 — 181,248 5,001,990 — — 5,001,990Foreign Edelnor Peru Foreign AFP Prima Peru Soles 8.06% 7.91% No 9,509 — 9,509 2,167,529 — — 2,167,529Foreign Edelnor Peru Foreign AFP Profuturo Peru Soles 8.23% 8.06% No 2,589,753 — 2,589,753 — — — —Foreign Edelnor Peru Foreign AFP Profuturo Peru Soles 6.67% 6.56% No 152,924 — 152,924 4,245,022 — — 4,245,022Foreign Edelnor Peru Foreign AFP Profuturo Peru Soles 7.06% 7.06% No 182,356 — 182,356 5,001,990 — — 5,001,990Foreign Edelnor Peru Foreign AFP Profuturo Peru Soles 6.63% 6.63% No 99,528 — 99,528 — 4,153,319 — 4,153,319Foreign Edelnor Peru Foreign AFP Profuturo Peru Soles 7.44% 7.44% No 42,106 — 42,106 — 4,914,455 — 4,914,455Foreign Edelnor Peru Foreign Fondo Mi
ViviendaPeru Soles 6.50% 6.50% No 73,597 — 73,597 — — 5,001,990 5,001,990
Foreign Edelnor Peru Foreign RimacInternacionalCia de Seguros
Peru Soles7.03
%7.03
%No 36,820 — 36,820 — — 3,334,660 3,334,660
Foreign Edelnor Peru Foreign AFP Prima Peru Soles 6.50% 6.50% No 148,809 — 148,809 — — 5,001,990 5,001,990Foreign Edelnor Peru Foreign Fifth Series A Peru Soles 7.03% 7.03% No 34,921 — 34,921 — — 3,334,660 3,334,660Foreign Edesur ArgentinaForeign oeds7 Argentina Ar$ 12.28% 11.75% No — 3,886,654 3,886,654 — — — —Foreign Edesur ArgentinaForeign oeds7 Argentina Ar$ 12.28% 11.75% No — 3,849,436 3,849,436 3,862,274 — — 3,862,274Foreign Emgesa ColombiaForeign A−10 Bonds Colombia CPs 8.21% 7.97% No — 411,850 411,850 — — 51,088,180 51,088,180Foreign Emgesa ColombiaForeign B−103 Bonds Colombia CPs 8.33% 8.33% No — 2,810,154 2,810,154 — — 42,837,829 42,837,829Foreign Emgesa ColombiaForeign A102 Bonds Colombia CPs 8.21% 7.97% No — 78,448 78,448 — — 9,384,105 9,384,105Foreign Emgesa ColombiaForeign A5 Bonds Colombia CPs 5.32% 5.22% No — 83,357 83,357 — — 12,027,617 12,027,617Foreign Emgesa ColombiaForeign B10 Bonds Colombia CPs 8.97% 8.69% No — 449,458 449,458 — — 38,938,924 38,938,924Foreign Emgesa ColombiaForeign B15 Bonds Colombia CPs 9.29% 8.99% No — 161,483 161,483 — — 13,501,876 13,501,876Foreign Emgesa ColombiaForeign B09−09 BondsColombia CPs 9.10% 8.80% No — 1,108,613 1,108,613 — — 53,083,052 53,083,052Foreign Emgesa ColombiaForeign B12 Bonds Colombia CPs 9.30% 9.00% No — 465,607 465,607 — — 21,792,758 21,792,758Foreign Emgesa ColombiaForeign Commercial
papersColombia CPs 4.20% 4.20% No — 17,113,595 17,113,595 — — — —
Foreign Emgesa ColombiaForeign E5−09 Bonds Colombia CPs 9.27% 9.27% No — 1,042,712 1,042,712 — — 22,435,009 22,435,009Foreign Emgesa ColombiaForeign B7 Bonds Colombia CPs 9.31% 9.00% No — 44,319,708 44,319,708 — — — —Foreign Emgesa ColombiaForeign B72 Bonds Colombia CPs 9.31% 9.00% No — 14,773,236 14,773,236 — — — —Foreign Emgesa ColombiaForeign Foreign bonds Colombia CPs 10.17% 10.17% No — — — — — — —Foreign Emgesa ColombiaForeign Quimbo bonds Colombia CPs 10.17% 10.17% No — — — — — — —91,081,000−6Endesa
ChileChile Foreign The Bank of
New YorkMellon — FirstIssuance S−1
USA US$
7.96% 7.96% No 3,161,628 — 3,161,628 — — 94,921,874 94,921,87491,081,000−6Endesa
ChileChile Foreign The Bank of
New YorkMellon — FirstIssuance S−2
USA US$
7.40% 7.40% No 1,011,025 — 1,011,025 — — 32,652,675 32,652,67591,081,000−6Endesa
ChileChile Foreign The Bank of
New YorkMellon — FirstIssuance S−3
USA US$
8.26% 8.26% No 640,355 — 640,355 — — 13,515,600 13,515,60091,081,000−6Endesa
ChileChile 97,004,000−5Banco
SantanderChile − 264Series−F
Chile U.F.
6.44
%
6.44
%
No 1,091,599 321,834 1,413,433 1,609,167 2,252,833 25,121,867 28,983,867
91,081,000−6EndesaChile
Chile Foreign The Bank ofNew YorkMellon −144−A
USA US$
8.50
%
8.50
%
No 6,513,139 — 6,513,139185,675,099 — — 185,675,099
91,081,000−6EndesaChile
Chile Foreign The Bank ofNew YorkMellon −144−A
USA US$
8.83
%
8.83
%
No 3,363,822 — 3,363,822 — 92,366,575 — 92,366,575
91,081,000−6EndesaChile
Chile 97,004,000−5BancoSantanderChile − 317Series−H
Chile U.F.
7.17
%
7.17
%
No — 5,497,845 5,497,845 8,925,508 8,925,508 54,281,364 72,132,380
91,081,000−6EndesaChile
Chile 97,004,000−5BancoSantanderChile − 318Series−K
Chile U.F.
3.86
%
3.86
%
No — 673,096 673,096 — — 85,561,441 85,561,441
91,081,000−6EndesaChile
Chile 97,004,000−5BancoSantanderChile − 522Series−M
Chile U.F.
4.82
%
4.82
%
No — 419,706 419,706 — — 210,717,524 210,717,524
94,271,000−3Enersis Chile Foreign Yankee Bonds2016
USA US$ 7.76% 7.40% No — 720,747 720,747 — — 120,393,171 120,393,171
94,271,000−3Enersis Chile Foreign Yankee Bonds2026
USA US$ 7.76% 6.60% No — 2,209 2,209 — — 401,553 401,553
94,271,000−3Enersis Chile Foreign Yankee Bonds2014
USA US$ 7.69% 7.38% No 5,536,900 — 5,536,900 — 171,324,624 — 171,324,624
94,271,000−3Enersis Chile 97,004,000−5Bonds UF 269 Chile U.F. 7.02% 5.75% No — 2,201,591 2,201,591 4,009,551 4,806,093 20,746,252 29,561,896
Total Unsecured Bonds 51,063,813230,588,521281,652,334480,282,879419,494,6911,139,293,178 2,039,070,748
Appendix No.4, letter b) presents additional information on financial debt which includes a projection of future cash flows (undiscounted) that the Groupwill have to disburse to settle the secured and unsecured obligations detailed above
F−81
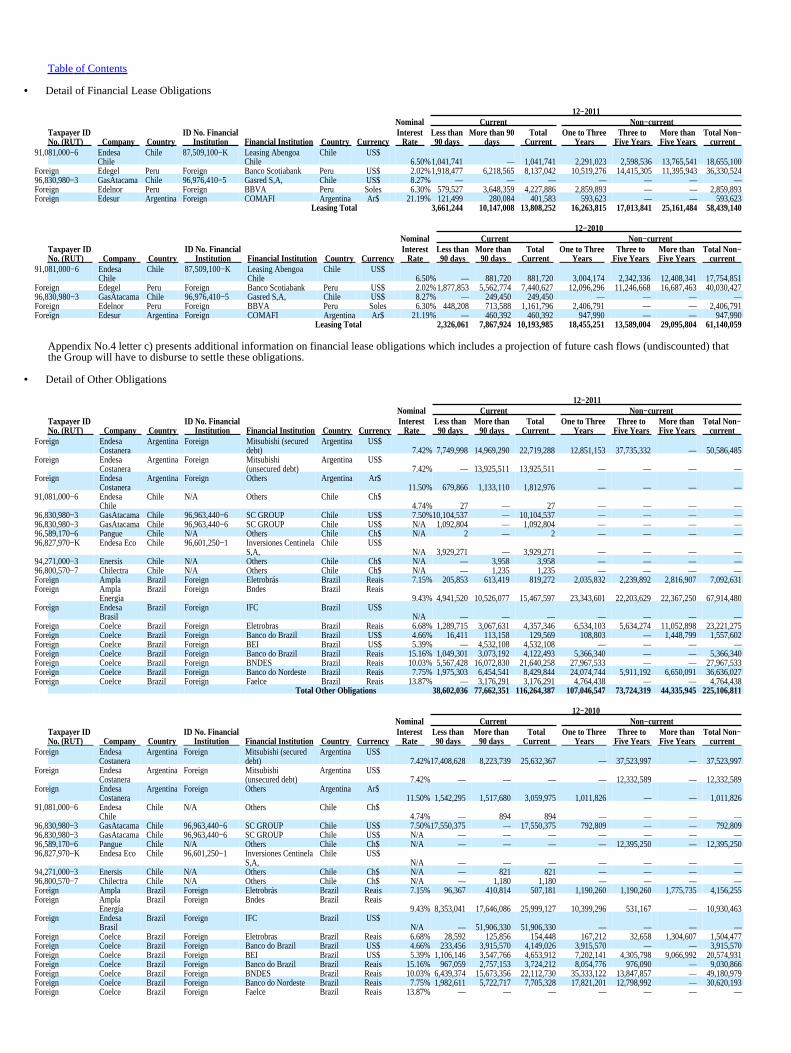
Table of Contents
• Detail of Financial Lease Obligations
12−2011Nominal Current Non−current
Taxpayer IDNo. (RUT) Company Country
ID No. FinancialInstitution Financial Institution Country Currency
InterestRate
Less than90 days
More than 90days
TotalCurrent
One to ThreeYears
Three toFive Years
More thanFive Years
Total Non−current
91,081,000−6 EndesaChile
Chile 87,509,100−K Leasing AbengoaChile
Chile US$6.50%1,041,741 — 1,041,741 2,291,023 2,598,536 13,765,541 18,655,100
Foreign Edegel Peru Foreign Banco Scotiabank Peru US$ 2.02%1,918,477 6,218,565 8,137,042 10,519,276 14,415,305 11,395,943 36,330,52496,830,980−3 GasAtacama Chile 96,976,410−5 Gasred S,A, Chile US$ 8.27% — — — — — — —Foreign Edelnor Peru Foreign BBVA Peru Soles 6.30% 579,527 3,648,359 4,227,886 2,859,893 — — 2,859,893Foreign Edesur Argentina Foreign COMAFI Argentina Ar$ 21.19% 121,499 280,084 401,583 593,623 — — 593,623
Leasing Total 3,661,244 10,147,008 13,808,252 16,263,815 17,013,841 25,161,484 58,439,140
12−2010Nominal Current Non−current
Taxpayer IDNo. (RUT) Company Country
ID No. FinancialInstitution Financial Institution Country Currency
InterestRate
Less than90 days
More than90 days
TotalCurrent
One to ThreeYears
Three toFive Years
More thanFive Years
Total Non−current
91,081,000−6 EndesaChile
Chile 87,509,100−K Leasing AbengoaChile
Chile US$6.50% — 881,720 881,720 3,004,174 2,342,336 12,408,341 17,754,851
Foreign Edegel Peru Foreign Banco Scotiabank Peru US$ 2.02%1,877,853 5,562,774 7,440,627 12,096,296 11,246,668 16,687,463 40,030,42796,830,980−3 GasAtacama Chile 96,976,410−5 Gasred S,A, Chile US$ 8.27% — 249,450 249,450 — — — —Foreign Edelnor Peru Foreign BBVA Peru Soles 6.30% 448,208 713,588 1,161,796 2,406,791 — — 2,406,791Foreign Edesur Argentina Foreign COMAFI Argentina Ar$ 21.19% — 460,392 460,392 947,990 — — 947,990
Leasing Total 2,326,061 7,867,924 10,193,985 18,455,251 13,589,004 29,095,804 61,140,059
Appendix No.4 letter c) presents additional information on financial lease obligations which includes a projection of future cash flows (undiscounted) thatthe Group will have to disburse to settle these obligations.
• Detail of Other Obligations
12−2011Nominal Current Non−current
Taxpayer IDNo. (RUT) Company Country
ID No. FinancialInstitution Financial Institution Country Currency
InterestRate
Less than90 days
More than90 days
TotalCurrent
One to ThreeYears
Three toFive Years
More thanFive Years
Total Non−current
Foreign EndesaCostanera
Argentina Foreign Mitsubishi (secureddebt)
Argentina US$7.42% 7,749,998 14,969,290 22,719,288 12,851,153 37,735,332 — 50,586,485
Foreign EndesaCostanera
Argentina Foreign Mitsubishi(unsecured debt)
Argentina US$7.42% — 13,925,511 13,925,511 — — — —
Foreign EndesaCostanera
Argentina Foreign Others Argentina Ar$11.50% 679,866 1,133,110 1,812,976 — — — —
91,081,000−6 EndesaChile
Chile N/A Others Chile Ch$4.74% 27 — 27 — — — —
96,830,980−3 GasAtacama Chile 96,963,440−6 SC GROUP Chile US$ 7.50%10,104,537 — 10,104,537 — — — —96,830,980−3 GasAtacama Chile 96,963,440−6 SC GROUP Chile US$ N/A 1,092,804 — 1,092,804 — — — —96,589,170−6 Pangue Chile N/A Others Chile Ch$ N/A 2 — 2 — — — —96,827,970−K Endesa Eco Chile 96,601,250−1 Inversiones Centinela
S,A,Chile US$
N/A 3,929,271 — 3,929,271 — — — —94,271,000−3 Enersis Chile N/A Others Chile Ch$ N/A — 3,958 3,958 — — — —96,800,570−7 Chilectra Chile N/A Others Chile Ch$ N/A — 1,235 1,235 — — — —Foreign Ampla Brazil Foreign Eletrobrás Brazil Reais 7.15% 205,853 613,419 819,272 2,035,832 2,239,892 2,816,907 7,092,631Foreign Ampla
EnergíaBrazil Foreign Bndes Brazil Reais
9.43% 4,941,520 10,526,077 15,467,597 23,343,601 22,203,629 22,367,250 67,914,480Foreign Endesa
BrasilBrazil Foreign IFC Brazil US$
N/A — — — — — — —Foreign Coelce Brazil Foreign Eletrobras Brazil Reais 6.68% 1,289,715 3,067,631 4,357,346 6,534,103 5,634,274 11,052,898 23,221,275Foreign Coelce Brazil Foreign Banco do Brazil Brazil US$ 4.66% 16,411 113,158 129,569 108,803 — 1,448,799 1,557,602Foreign Coelce Brazil Foreign BEI Brazil US$ 5.39% — 4,532,108 4,532,108 — — — —Foreign Coelce Brazil Foreign Banco do Brazil Brazil Reais 15.16% 1,049,301 3,073,192 4,122,493 5,366,340 — — 5,366,340Foreign Coelce Brazil Foreign BNDES Brazil Reais 10.03% 5,567,428 16,072,830 21,640,258 27,967,533 — — 27,967,533Foreign Coelce Brazil Foreign Banco do Nordeste Brazil Reais 7.75% 1,975,303 6,454,541 8,429,844 24,074,744 5,911,192 6,650,091 36,636,027Foreign Coelce Brazil Foreign Faelce Brazil Reais 13.87% — 3,176,291 3,176,291 4,764,438 — — 4,764,438
Total Other Obligations 38,602,036 77,662,351 116,264,387 107,046,547 73,724,319 44,335,945 225,106,811
12−2010Nominal Current Non−current
Taxpayer IDNo. (RUT) Company Country
ID No. FinancialInstitution Financial Institution Country Currency
InterestRate
Less than90 days
More than90 days
TotalCurrent
One to ThreeYears
Three toFive Years
More thanFive Years
Total Non−current
Foreign EndesaCostanera
Argentina Foreign Mitsubishi (secureddebt)
Argentina US$7.42%17,408,628 8,223,739 25,632,367 — 37,523,997 — 37,523,997
Foreign EndesaCostanera
Argentina Foreign Mitsubishi(unsecured debt)
Argentina US$7.42% — — — — 12,332,589 — 12,332,589
Foreign EndesaCostanera
Argentina Foreign Others Argentina Ar$11.50% 1,542,295 1,517,680 3,059,975 1,011,826 — — 1,011,826
91,081,000−6 EndesaChile
Chile N/A Others Chile Ch$4.74% — 894 894 — — — —
96,830,980−3 GasAtacama Chile 96,963,440−6 SC GROUP Chile US$ 7.50%17,550,375 — 17,550,375 792,809 — — 792,80996,830,980−3 GasAtacama Chile 96,963,440−6 SC GROUP Chile US$ N/A — — — — — — —96,589,170−6 Pangue Chile N/A Others Chile Ch$ N/A — — — — 12,395,250 — 12,395,25096,827,970−K Endesa Eco Chile 96,601,250−1 Inversiones Centinela
S,A,Chile US$
N/A — — — — — — —94,271,000−3 Enersis Chile N/A Others Chile Ch$ N/A — 821 821 — — — —96,800,570−7 Chilectra Chile N/A Others Chile Ch$ N/A — 1,180 1,180 — — — —Foreign Ampla Brazil Foreign Eletrobrás Brazil Reais 7.15% 96,367 410,814 507,181 1,190,260 1,190,260 1,775,735 4,156,255Foreign Ampla
EnergíaBrazil Foreign Bndes Brazil Reais
9.43% 8,353,041 17,646,086 25,999,127 10,399,296 531,167 — 10,930,463Foreign Endesa
BrasilBrazil Foreign IFC Brazil US$
N/A — 51,906,330 51,906,330 — — — —Foreign Coelce Brazil Foreign Eletrobras Brazil Reais 6.68% 28,592 125,856 154,448 167,212 32,658 1,304,607 1,504,477Foreign Coelce Brazil Foreign Banco do Brazil Brazil US$ 4.66% 233,456 3,915,570 4,149,026 3,915,570 — — 3,915,570Foreign Coelce Brazil Foreign BEI Brazil US$ 5.39% 1,106,146 3,547,766 4,653,912 7,202,141 4,305,798 9,066,992 20,574,931Foreign Coelce Brazil Foreign Banco do Brazil Brazil Reais 15.16% 967,059 2,757,153 3,724,212 8,054,776 976,090 — 9,030,866Foreign Coelce Brazil Foreign BNDES Brazil Reais 10.03% 6,439,374 15,673,356 22,112,730 35,333,122 13,847,857 — 49,180,979Foreign Coelce Brazil Foreign Banco do Nordeste Brazil Reais 7.75% 1,982,611 5,722,717 7,705,328 17,821,201 12,798,992 — 30,620,193Foreign Coelce Brazil Foreign Faelce Brazil Reais 13.87% — — — — — — —

Total Other Obligations 55,707,944 111,449,962 167,157,906 85,888,213 95,934,658 12,147,334 193,970,205
Appendix No.4 letter d) presents additional information on other obligations which includes a projection of future cash flows (undiscounted) that the Groupwill have to disburse to settle these obligations.
F−82

Table of Contents
18.5Hedged debt
Of Enersis’ US dollar denominated debt, as of December 31, 2011, ThCh$ 739,686,386 is related to future cash flow hedges for the Group’s USdollar−linked operating income (see Note 3.m). As of December 31, 2010, this amount totaled ThCh$ 679,999,810.
The following table details movements in “Reserve of cash flow hedges” during 2011 and 2010 due to exchange differences of this debt:
12−31−2011 12−31−2010 12−31−2009Balance in hedging reserves (hedging income) at the beginning of the year, net 67,748,527 60,346,205 (61,905,837)Foreign currency exchange differences recorded in equity, net (28,520,464) 15,654,909 126,579,938Recognition of foreign currency exchange differences in profit or loss, net (9,306,696) (8,252,587) (4,327,896)Foreign currency translation differences 633,136 — —Balance in hedging reserves (hedging income) at the end of the year, net 30,554,503 67,748,527 60,346,205
18.6 Other information
As of December 31, 2011 and 2010, the Enersis Group has long−term lines of credit available for use amounting to ThCh$ 238,832,000 andThCh$ 242,750,000, respectively.
Various of the Company’s and its subsidiaries’ credit facilities contain certain financial ratio covenants, customary In these types of contracts. Theseagreements also include affirmative and negative covenants that require ongoing monitoring. Additionally, there are certain restrictions in the events ofdefault sections that also require compliance.
Some of Enersis’ and Endesa Chile’s credit facilities include cross default provisions. Regarding the provision affecting Enersis, the loan subscribed onDecember 2009 under New York jurisdiction and that matures December 2012, stipulates that a cross default arises when Enersis, Chilectra or Endesa Chileis in arrears with any one of its debt repayments, whether on interest or on the principal. There have been no disbursements on this syndicated loan to date. Endesa Chile’s loan, syndicated the State of New York law, subscribed in 2008 and expiring in 2014, and which contains a disbursed balance of US$ 200million to date, does not make reference to Endesa Chile’s subsidiaries, so cross default can only originate if Endesa Chile defaults on other of its own debt.For debt repayments to become accelerated due to cross default, the amount in default must exceed US$ 50 million, or its equivalent in other currencies. Additionally, other conditions must be met before debt repayments can be accelerated, including expiration of the grace period (if any) and a formal noticedocumenting intention to accelerate debt repayment from the lenders that represent more than 50% of the balance owed under the credit facility.Additionally, in December 2009, both Enersis and Endesa Chile subscribed loans under Chilean law that stipulate that a cross default will arise only by thedebtor’s default. In these loans, the amount in default must also exceed the US$ 50 million threshold aforementioned or its equivalent in foreign currency. Note that since their subscription, these credit facilities have never been disbursed.
Regarding Enersis’ and Endesa Chile’s bonds registered with the U.S. SEC, commonly known as “Yankee Bonds,” the cross default for nonpayment canarise from other debt affecting the same company, or from any of its Chilean subsidiaries, regardless of the amount, as long as the principal that originatedthe cross default exceeds US$ 30 million, or its equivalent in other currency. The acceleration of the debt repayment caused by the cross default provisiondoes not happen automatically; instead, bondholders of at least 25% of a certain series of the Yankee Bonds must demand this. Additionally, the bankruptcyor insolvency of a foreign subsidiary does not have a contractual impact on Enersis’ and Endesa Chile’s Yankee Bonds.
Enersis’ and Endesa Chile’s Chilean bonds stipulate that a cross default can only arise if the “Issuer” of the debt instrument (as defined in the debtagreement) is in default. Furthermore, the acceleration of the debt repayment must be requested by at least 50% of the bondholders of a particular series.
As of December 31, 2011 and December 31, 2010, Enersis S.A., Endesa Chile, and their respective subsidiaries were in full compliance with allabove−described financial and other covenants and restrictions.
F−83

Table of Contents
19. RISK MANAGEMENT POLICY
The Group’s companies are exposed to certain risks that are managed by systems that identify, measure, limit concentration of, and monitor these risks.
The main principles in the Group’s risk management policy include the following:
• Compliance with corporate governance standards.
• Strict compliance with all the Group’s internal policies.
• The Group’s Risk Committee is the organization in charge of defining, approving, and updating the basic principles that are to inspire actions takenregarding risk.
• Risk Governance is organized operationally through the Risk Control and Risk Management areas, which are two independent functions.
• Each business and corporate area determines:
I. The markets and product areas in which it will operate based on its knowledge and ability to ensure effective risk management.
II. Criteria regarding counterparts.
III. Authorized operators.
• Business and corporate areas establish their risk tolerance in a manner consistent with the defined strategy for each market in which they operate.
• Business limits are ratified by the Group’s Risk Committee.
• All of the operations of the businesses and corporate areas are conducted within the limits approved for each case.
• Businesses, corporate areas, lines of business and companies design the risk management controls necessary to ensure that transactions in the marketsare conducted in accordance with Enersis’ policies, standards, and procedures.
19.1. Interest rate risk
Changes in interest rates affect the fair value of assets and liabilities bearing fixed interest rates, as well as the expected future cash flows of assets andliabilities subject to floating interest rates.
The objective of managing interest rate risk exposure is to achieve a balance in the debt structure to minimize the cost of debt with reduced volatility inprofit or loss.
In compliance with the current interest rate hedging policy, the proportion of fixed debt and/or hedged debt over the net total debt was 62% as ofDecember 31, 2011.
Depending on the Group’s estimates and on the objectives of the debt structure, hedging transactions are performed by entering into derivatives contractsthat mitigate interest rate risk. Derivative instruments currently used to comply with the risk management policy are interest rate swaps to set floating rate atfixed rate.
The financial debt structure of the Group detailed by fixed, hedged, and floating rate debt, net of hedging derivative instruments, is as follows:
F−84
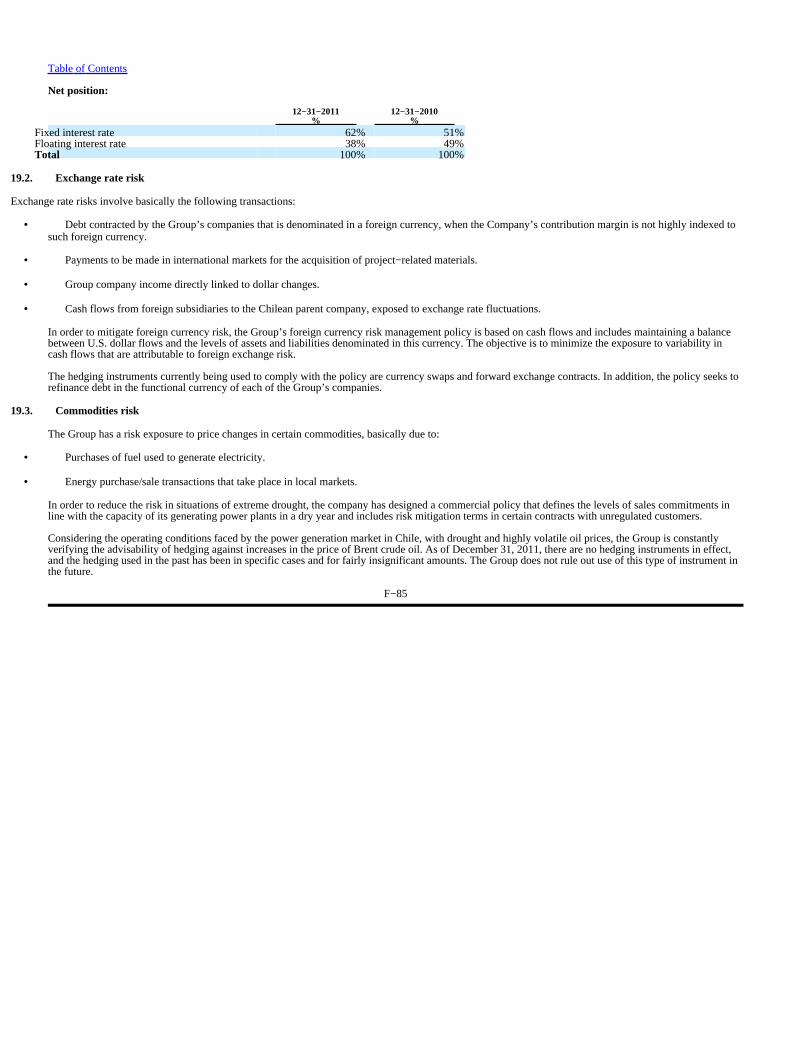
Table of Contents
Net position:
12−31−2011 12−31−2010% %
Fixed interest rate 62% 51%Floating interest rate 38% 49%Total 100% 100%
19.2. Exchange rate risk
Exchange rate risks involve basically the following transactions:
• Debt contracted by the Group’s companies that is denominated in a foreign currency, when the Company’s contribution margin is not highly indexed tosuch foreign currency.
• Payments to be made in international markets for the acquisition of project−related materials.
• Group company income directly linked to dollar changes.
• Cash flows from foreign subsidiaries to the Chilean parent company, exposed to exchange rate fluctuations.
In order to mitigate foreign currency risk, the Group’s foreign currency risk management policy is based on cash flows and includes maintaining a balancebetween U.S. dollar flows and the levels of assets and liabilities denominated in this currency. The objective is to minimize the exposure to variability incash flows that are attributable to foreign exchange risk.
The hedging instruments currently being used to comply with the policy are currency swaps and forward exchange contracts. In addition, the policy seeks torefinance debt in the functional currency of each of the Group’s companies.
19.3. Commodities risk
The Group has a risk exposure to price changes in certain commodities, basically due to:
• Purchases of fuel used to generate electricity.
• Energy purchase/sale transactions that take place in local markets.
In order to reduce the risk in situations of extreme drought, the company has designed a commercial policy that defines the levels of sales commitments inline with the capacity of its generating power plants in a dry year and includes risk mitigation terms in certain contracts with unregulated customers.
Considering the operating conditions faced by the power generation market in Chile, with drought and highly volatile oil prices, the Group is constantlyverifying the advisability of hedging against increases in the price of Brent crude oil. As of December 31, 2011, there are no hedging instruments in effect,and the hedging used in the past has been in specific cases and for fairly insignificant amounts. The Group does not rule out use of this type of instrument inthe future.
F−85

Table of Contents
19.4. Liquidity risk
The Group maintains a liquidity risk management policy that consists of entering into long−term committed banking facilities and temporary financialinvestments for amounts that cover the projected needs over a period of time that is determined based on the situation and expectations for debt and capitalmarkets.
The projected needs mentioned above include maturities of financial debt, net of financial derivatives. For further details regarding the features andconditions of financial obligations and financial derivatives, see Notes 18 and 20, and Appendix No.4.
As of December 31, 2011, the Group has cash and cash equivalent totaling ThCh$ 1,219,921,268 and unconditionally available lines of credits totalingThCh$ 238,832,000. As of December 31, 2010, the Group had ThCh$ 961,355,037 in cash and cash equivalents and ThCh$ 242,750,000 in unconditionalavailable lines of credit.
19.5. Credit risk
Given the current economic climate, the Group has been carefully following its credit risk.
Trade receivables:
The credit risk for receivables from the Group’s commercial activity has historically been very low, due to the short term period of collections fromcustomers, resulting in non−significant cumulative receivables amounts. This situation applies to both the electricity generating and distribution lines ofbusiness.
In our electricity generating business, some countries’ regulations allow the suspension of energy service to customers with outstanding payments, and mostcontracts have termination clauses for payment default. The Company monitors its credit risk on an ongoing basis and measures quantitatively its maximumexposure to payment default risk, which, as stated above, is very low.
In our electricity distribution companies, the suspension of energy service for customers in payment default is permitted in all cases, in accordance withcurrent regulations in each country. This facilitates our credit risk management, which is also low in this line of business.
Financial assets:
Cash surpluses are invested in the highest−rated local and foreign financial entities (with risk rating equivalent to investment grade) with thresholdsestablished for each entity.
Banks that have received investment grade ratings from at least two of the three major international rating agencies (Moody’s, S&P, and Fitch) are selectedfor making investments.
Investments are backed with treasury bonds from the countries in which the company operates and/or with commercial papers issued by the highest ratedbanks; wherever possible and when market conditions permit, the treasury bonds are preferred.
Derivative instruments are entered into with entities with solid creditworthiness; approximately 80% of derivative transactions are performed entities ratedA or higher.
F−86

Table of Contents
19.6. Risk measurement
The Enersis Group measures the Value at Risk (VaR) of its debt positions and financial derivatives in order to ensure that the risk assumed by the companyremains consistent with the risk exposure defined by Management, thereby reducing volatility in the income statement.
The portfolio of positions included in calculating the current Value at Risk consists of the following:
• Debt
• Financial derivatives
The VaR determined represents the potential loss in value of the portfolio of positions described above in one day with a 95% confidence level. Todetermine the VaR, we take into account the volatility of the risk variables affecting the value of the portfolio of positions including:
• U.S. dollar Libor interest rate.
• The customary local indices used in the banking industry for debt, considering the various currencies in which our companies operate.
• The exchange rates of the various currencies used in the calculation.
The calculation of VaR is based on generating possible future scenarios (at one day) of market values (both spot and term) for the risk variables, usingBootstrapping simulations. The number of scenarios generated ensures compliance with the simulation convergence criteria. The table of volatilities andcorrelations between the various risk variables calculated based on the historical values of the logarithmic price return has been applied to simulate thefuture price scenario.
Once the price scenarios have been obtained, the fair value of the portfolio is calculated using such scenarios, thereby obtaining a distribution of possiblevalues at one day. The one−day 95%−confidence VaR number is calculated as the 5% percentile of the potential increases in the fair value of the portfolio inone day.
The various debt positions and financial derivatives included in the calculation have been valued consistently using the financial capital calculationmethodology reported to Management.
Taking into account the assumptions described above, the Value at Risk of the previously discussed positions, broken down by type of position, is shown inthe following table.
12−31−2011 12−31−2010Financial Positions ThCh$ ThCh$
Interest rate 41,560,004 38,847,459Exchange rate 3,602,591 539,575Correlation (310,050) (2,695,024)Total 44,852,545 36,692,010
The Value at Risk positions have varied during the 2011 and 2010 fiscal years depending on the start/maturity of operations throughout each year.
F−87

Table of Contents
20. FINANCIAL INSTRUMENTS
20.1 Financial instruments, classified by type and category
a) The detail of financial assets, classified by type and category, as of December 31, 2011 and 2010, is as follows:
December 31, 2011
Financial assetsheld for trading
ThCh$
Financial assets atfair value withchange in net
incomeThCh$
Held−to−maturityinvestments
ThCh$
Loans andreceivables
ThCh$
Available−for−salefinancial assets
ThCh$
Hedge derivatives
ThCh$
Derivative instruments 47,504 — — — — 748,078Other financial assets — — — 1,013,028,618 — —Total Current 47,504 — — 1,013,028,618 — 748,078
Equity instruments — — — — 2,892,655 —Derivative instruments — — — — — 12,178,355Other financial assets — — 20,793,960 444,818,541 — —Total Non−current — — 20,793,960 444,818,541 2,892,655 12,178,355
Total 47,504 — 20,793,960 1,457,847,159 2,892,655 12,926,433
December 31, 2010
Financial assetsheld for trading
ThCh$
Financial assets atfair value withchange in net
incomeThCh$
Held−to−maturityinvestments
ThCh$
Loans andreceivables
ThCh$
Available−for−salefinancial assets
ThCh$Hedge derivatives
ThCh$
Derivative instruments 17,551 — — — — 64,518Other financial assets — — 7,735,440 1,058,569,847 — —Total Current 17,551 — 7,735,440 1,058,569,847 — 64,518
Equity instruments — — — — 2,511,197 —Derivative instruments 91,262 — — — — 27,212,944Other financial assets — — 29,461,230 319,907,351 — —Total Non−current 91,262 — 29,461,230 319,907,351 2,511,197 27,212,944
Total 108,813 — 37,196,670 1,378,477,198 2,511,197 27,277,462
b) The detail of financial liabilities, classified by type and category, as of December 31, 2011 and 2010, is as follows:
December 31, 2011
Financial liabilities heldfor trading
ThCh$
Financial liabilities atfair value with
change in net income
ThCh$
Loans and payables
ThCh$
Hedge derivatives
ThCh$
Interest−bearing loans 11,601,335 3,929,271 646,444,125 —Derivative instruments 807,105 — — 6,200,643Other financial liabilities — — 1,395,341,923 —Total Current 12,408,440 3,929,271 2,041,786,048 6,200,643
Interest−bearing loans 13,215,469 — 3,035,982,494 —Derivative instruments — — — 212,913,735Other financial liabilities — — 23,548,235 —Total Non−current 13,215,469 — 3,059,530,729 212,913,735
Total 25,623,909 3,929,271 5,101,316,777 219,114,378
December 31, 2010
Financial liabilities heldfor trading
Financial liabilities atfair value with
change in net income Loans and payables Hedge derivativesThCh$ ThCh$ ThCh$ ThCh$
Interest−bearing loans 6,509,732 — 646,469,760 —Derivative instruments — — — 10,002,909Other financial liabilities — — 1,375,307,875 —Total Current 6,509,732 — 2,021,777,635 10,002,909
Interest−bearing loans 15,171,516 12,395,250 2,736,255,564 —Derivative instruments — — — 240,113,443Other financial liabilities — — 49,341,676 —Total Non−current 15,171,516 12,395,250 2,785,597,240 240,113,443
Total 21,681,248 12,395,250 4,807,374,875 250,116,352
F−88

Table of Contents
20.2 Derivative instruments
The risk management policy of the Group uses primarily interest rate and foreign exchange rate derivatives to hedge its exposure to interest rate and foreigncurrency risks.
The Company classifies its hedges as follows:
• Cash flow hedges: Those that hedge the cash flows of the underlying hedged item.
• Fair value hedges: Those that hedge the fair value of the underlying hedged item.
• Non−hedge derivatives: Financial derivatives that do not meet the requirements established by IFRS to be designated as hedge instruments arerecorded at fair value with changes in net income (assets held for trading).
a) Assets and liabilities for hedge derivative instruments
As of December 31, 2011 and 2010, financial derivative transactions that qualify as hedge instruments resulted in recognition of the following assets andliabilities in the statement of financial position:
December 31, 2011 December 31, 2010Assets Liabilities Assets Liabilities
Current Non−current Current Non−current Current Non−current Current Non−currentThCh$ ThCh$ ThCh$ ThCh$ ThCh$ ThCh$ ThCh$ ThCh$
Interest rate hedge: — 2,792,448 119,964 7,048,868 64,518 1,825,059 661,966 4,878,454Cash flow hedge — 2,792,448 119,964 7,048,868 64,518 1,825,059 661,966 4,878,454Exchange rate hedge: 748,078 9,385,907 6,080,679 205,864,867 — 25,387,885 9,340,943 235,234,989Cash flow hedge 748,078 9,385,907 3,070,825 201,717,556 — 25,387,885 3,867,323 229,257,717Fair value hedge — — 3,009,854 4,147,311 — — 5,473,620 5,977,272Total 748,078 12,178,355 6,200,643 212,913,735 64,518 27,212,944 10,002,909 240,113,443
• General information on hedge derivative instruments
Hedging derivative instruments and their corresponding hedged instruments are shown in the following table:
Detail of HedgeInstruments
Description of HedgeInstrument Description of Hedged Instrument
Fair Value ofHedged Instruments
12−31−2011
Fair Value ofHedged Instruments
12−31−2010Type of Risks
Hedged
SWAP Interest rate Bank borrowings (4,376,384) (3,715,361) Cash flowSWAP Exchange rate Bank borrowings — (509,567) Cash flowSWAP Exchange rate Bank borrowings (7,157,165) (11,450,892) Fair valueSWAP Exchange rate Unsecured obligations (bonds) (194,654,396) (207,163,070) Cash flow
At the close of the 2011 and 2010 fiscal years, the Group has not recognized significant gains or losses for ineffective cash flow hedges.
For fair value hedges the gain or losses recognized on the hedging instrument and on the underlying hedged item is detailed in the following table:
December 31, 2011 December 31, 2010 December 31, 2009Gain
ThCh$
Loss
ThCh$
Gain
ThCh$
Loss
ThCh$
Gain
ThCh$
Loss
ThCh$
Hedging instrument 4,034,969 — 3,788,165 — — 9,435,859Hedged item — 4,763,189 — 6,749,098 7,893,882 —TOTAL 4,034,969 4,763,189 3,788,165 6,749,098 7,893,882 9,435,859
F−89

Table of Contents
b) Financial derivative instrument assets and liabilities at fair value with changes in net income
As of December 31, 2011 and 2010, financial derivative transactions recorded at fair value with changes in net income, resulted in the recognition of thefollowing assets and liabilities in the statement of financial position:
December 31, 2011 December 31, 2010Assets Liabilities Assets Liabilities Assets Liabilities Assets Liabilities
CurrentThCh$
CurrentThCh$
Non−currentThCh$
Non−currentThCh$
CurrentThCh$
CurrentThCh$
Non−currentThCh$
Non−currentThCh$
Non−hedging derivativeinstruments 47,504 807,105 — — 17,551 — 91,262 —
c) Other information on derivatives:
The following tables present the fair value of hedging and non−hedging derivatives entered into by the Group as well as the remaining contractual maturitiesas of December 31, 2011 and 2010:
December 31, 2011Notional value
Fair Value Less than 1 year 1−2 years 2−3 years 3−4 Years 4−5 YearsSubsequent
years TotalFinancial Derivatives ThCh$ ThCh$ ThCh$ ThCh$ ThCh$ ThCh$ ThCh$ ThCh$
Interest rate hedge: (4,376,384) 10,780,523 7,125,818 125,247,877 6,893,698 5,292,723 8,368,224 163,708,863Cash flow hedge (4,376,384) 10,780,523 7,125,818 125,247,877 6,893,698 5,292,723 8,368,224 163,708,863Exchange rate hedge: (201,811,561) 29,287,450 10,912,595 499,430,704 2,091,618 211,163,933 — 752,886,300Cash flow hedge (194,654,396) 23,473,223 9,147,062 497,538,936 64,588 211,163,933 — 741,387,742Fair value hedge (7,157,165) 5,814,227 1,765,533 1,891,768 2,027,030 — — 11,498,558Derivatives not designated for
hedge accounting (759,601) 17,569,294 — — — — — 17,569,294TOTAL (206,947,546) 57,637,267 18,038,413 624,678,581 8,985,316 216,456,656 8,368,224 934,164,457
December 31, 2010Notional value
Fair value Less than 1 year 1−2 years 2−3 Years 3−4 Years 4−5 YearsSubsequent
years TotalFinancial Derivatives ThCh$ ThCh$ ThCh$ ThCh$ ThCh$ ThCh$ ThCh$ ThCh$
Interest rate hedge: (3,650,843) 16,841,269 — 10,670,628 107,488,844 6,314,801 13,385,086 154,700,628Cash flow hedge (3,650,843) 16,841,269 — 10,670,628 107,488,844 6,314,801 13,385,086 154,700,628Exchange rate hedge: (219,188,047) 7,219,945 13,573,114 — 462,159,584 9,023,829 203,222,043 695,198,515Cash flow hedge (207,737,155) 7,219,945 4,680,100 — 462,159,584 — 203,222,043 677,281,672Fair value hedge (11,450,892) — 8,893,014 — — 9,023,829 — 17,916,843Derivatives not designated for
hedge accounting 108,813 72,537 — — — — — 72,537TOTAL (222,730,077) 24,133,751 13,573,114 10,670,628 569,648,428 15,338,630 216,607,129 849,971,680
The hedging and non−hedging derivatives contractual maturities do not represent the total Group’s risks exposure, as the amounts presented in the abovetables have been drawn up based on undiscounted contractual cash inflows and outflows for their settlement.
F−90

Table of Contents
20.3 Fair value hierarchies
Financial instruments recognized at fair value in the consolidated statement of financial position are classified based on the hierarchies described in Note3.g.5.
The following table presents financial assets and liabilities measured at fair value as of December 31, 2011 and 2010:
Financial Instruments measured at Fair Value
Fair Value measured at end of reporting
period using:12−31−2011 Level 1 Level 2 Level 3
ThCh$ ThCh$ ThCh$ ThCh$Financial AssetsCash flow hedge derivatives 12,926,433 — 12,926,433 —Derivatives not designated for hedge
accounting 47,504 — 47,504 —Available−for−sale financial assets,
non−current 86,852 86,852 — —Total 13,060,789 86,852 12,973,937 —Financial LiabilitiesCash flow hedge derivatives 211,957,213 — 211,957,213 —Fair value hedge derivatives 7,157,165 — 7,157,165 —Derivatives not designated for hedge
accounting 807,105 — 807,105 —Interest−bearing borrowings, short term 11,601,335 — 11,601,335 —Interest−bearing borrowings, long−term 13,215,469 — 13,215,469Other non−current financial liabilities 3,929,271 — — 3,929,271Total 248,667,558 — 244,738,287 3,929,271
Financial Instruments measured at Fair Value
Fair Value measured at end of reporting
period using:12−31−2010 Level 1 Level 2 Level 3
ThCh$ ThCh$ ThCh$ ThCh$Financial AssetsCash flow hedge derivatives 27,277,462 — 27,277,462 —Derivatives not designated for hedge
accounting 108,813 — 108,813 —Available−for−sale financial assets,
non−current 88,909 88,909 — —Total 27,475,184 88,909 27,386,275 —Financial LiabilitiesCash flow hedge derivatives 238,665,460 — 238,665,460 —Fair value hedge derivatives 11,450,892 — 11,450,892 —Derivatives not designated for hedge
accounting 6,509,732 — 6,509,732 —Interest−bearing borrowings, short term 15,171,516 — 15,171,516 —Other non−current financial liabilities 12,395,250 — — 12,395,250Total 284,192,850 — 271,797,600 12,395,250
20.3.1 The following is the reconciliation between opening and closing balances for financial instruments whose fair value is classified at level 3:
Non−current Interest−Bearing Loans ThCh$Balance at December 31, 2009 11,953,000Total losses recognized in financial profit or loss 442,250Balance at December 31, 2010 12,395,250Total profit recognized in financial profit or loss (8,465,979)Balance at December 31, 2011 3,929,271
The fair value of Level 3 has been calculated by applying a traditional discounted cash flow method. These projected cash flows include assumptions fromwithin the company that are primarily based on estimates for prices and levels of energy production and firm capacity, as well as the costs of operating andmaintaining some of our plants.
None of the possible reasonable scenarios foreseeable in the assumptions mentioned in the above paragraph would result in a significant change in the fairvalue of the financial instruments included at this level.
F−91

Table of Contents
21. TRADE AND OTHER PAYABLES
Trade and other payables as of December 2011 and 2010 is as follows:
Current Non−current12−31−2011 12−31−2010 12−31−2011 12−31−2010
Trade and Other Payables ThCh$ ThCh$ ThCh$ ThCh$Trade payables 393,066,581 305,079,295 — 4,477,313Other payables 841,997,878 919,410,703 14,304,607 32,759,399Total 1,235,064,459 1,224,489,998 14,304,607 37,236,712
The breakdown of Trade Accounts and other Payables as of December 31, 2011 and 2010, is as follows:
Non−currentCurrent One to Five Years
12−31−2011 12−31−2010 12−31−2011 12−31−2010Trade and Other Payables ThCh$ ThCh$ ThCh$ ThCh$
Energy suppliers 354,964,500 417,786,845 — 5,565,832Fuel and gas suppliers 38,102,081 37,808,210 — —Payables for goods and services 612,692,782 385,380,841 243,790 13,410,089Dividends payable to third parties 89,492,092 249,404,275 — —Fines and claims 74,994,982 53,729,963 — —Research and development 17,971,576 33,202,794 3,894,943 1,895,349Payables to tax authorities 17,684,946 32,851,967 7,580,699 11,216,940Mitsubishi contract — 3,397,620 — 3,288,535Obligations for social programs 14,987,123 1,122,119 1,327,278 —Other accounts payable 14,174,377 9,805,364 1,257,897 1,859,967Total 1,235,064,459 1,224,489,998 14,304,607 37,236,712
See Note 19.4 for the description of the liquidity risk management policy.
F−92

Table of Contents
22. PROVISIONS
22.1 Provisions
a) The breakdown of provisions as of December 31, 2011 and 2010, is as follows:
Current Non−current12−31−2011 12−31−2010 12−31−2011 12−31−2010
Provisions ThCh$ ThCh$ ThCh$ ThCh$Provision for warranty — — — 2,821,692Provision for legal proceedings 28,429,816 44,903,128 186,849,932 209,740,117Decommissioning, restoration, and rehabilitation costs — — 13,806,632 10,779,096Provision for suppliers and services 31,001,461 26,183,409 — —Provision for employee benefits 31,162,406 31,935,562 65,221 1,201,357Risk provisions — — 38,388 —Other provisions 9,108,971 12,427,137 1,813,468 980,067
Total 99,702,654 115,449,236 202,573,641 225,522,329
b) Movements in provisions as of December 31, 2011 and 2010 is as follows:
WarrantyLegal
Proceedings
Decommissioning,Restoration, and
Rehabilitation CostsOther
Provisions TotalThCh$ ThCh$ ThCh$ ThCh$ ThCh$
Movements in ProvisionsInitial balance at January 1, 2011 2,821,692 254,643,245 10,779,096 72,727,532 340,971,565Movements in ProvisionsAdditional provisions — — 2,049,816 — 2,049,816Increase (decrease) in existing provisions — 36,123,460 54,806 2,684,365 38,862,631Provisions used — (43,482,537) — (14,019,715) (57,502,252)Unused provisions reversed — (69,128,722) — — (69,128,722)Increase from adjustment to value of money over time — 38,900 393,141 47,818 479,859Foreign currency translation (38,273) (547,411) 573,146 1,737,638 1,725,100Other increase (decrease) (2,783,419) 37,632,813 (43,373) 10,012,277 44,818,298Total movements in provisions (2,821,692) (39,363,497) 3,027,536 462,383 (38,695,270)Final balance at December 31, 2011 — 215,279,748 13,806,632 73,189,915 302,276,295
WarrantyLegal
Proceedings
Decommissioning,Restoration, and
Rehabilitation CostsOther
Provisions TotalThCh$ ThCh$ ThCh$ ThCh$ ThCh$
Movements in ProvisionsInitial balance at January 1, 2010 2,875,372 258,404,359 10,234,267 78,797,369 350,311,367Movements in ProvisionsAdditional provisions — 30,017,390 — 8,668,661 38,686,051Increase (decrease) in existing provisions 37,506 26,663,407 563,120 5,321,740 32,585,773Provisions used — (21,169,685) — (16,888,613) (38,058,298)Unused provisions reversed — (32,025,516) — (121,367) (32,146,883)Increase from adjustment to value of money over time — — 56,434 53,791 110,225Foreign currency translation (91,186) (7,644,162) (74,726) (3,995,350) (11,805,424)Other increase (decrease) — 397,452 1 891,301 1,288,754Total movements in provisions (53,680) (3,761,114) 544,829 (6,069,837) (9,339,802)Final balance at December 31, 2010 2,821,692 254,643,245 10,779,096 72,727,532 340,971,565
F−93

Table of Contents
22.2 Lawsuits and Arbitration Proceedings
As of the date of these consolidated financial statements, the most relevant litigation involving Enersis and its subsidiaries is as follows:
1.− Law 25,561 on Public Emergency and Reform to the Currency System, enacted on January 6, 2002 by the Argentine authorities, voided certainprovisions of the concession agreement of Enersis’s subsidiary Edesur. That law also required that utility concession agreements be renegotiated within areasonable timeframe to adjust them in light of the emerging economic crisis in Argentina. However, failure to renegotiate Edesur’s concession agreementprompted Enersis S.A., Chilectra S.A., Endesa Chile and Elesur S.A. (now Chilectra S.A.) (collectively, the “Claimants”) to file an arbitration petition in2003 under the Treaty for the Promotion and Protection of Chilean−Argentine Investments with the International Center for Settlement of InvestmentDisputes (ICSID). The statement of claim principally requested that the ICSID declare that Edesur’s assets had been expropriated and that Edesur suffereddamages totaling US$1,306,875,960. In addition, the Claimants requested that ICSID award indemnification caused to Edesur’s assets due to lack of fairand equitable treatment, totaling US$318,780,600. Claimants also seek, with respect to both claims, compounded annual interest of 6.9% per annum. TheClaimants also claimed the sums resulting from the damages caused as from July 1, 2004. Finally, the claimants also demanded US$ 102,164,683 for ElesurS.A. (now Chilectra S.A.) due to a lower price received on a sale of its shares as a result of the alleged expropriation. On June 15, 2005, the Argentineauthorities and Edesur executed a Letter of Understanding, which was not objected to by the Argentine parliament and was later ratified by the ExecutiveBranch. The Letter of Understanding amends and supplements the terms and conditions of the Concession Agreement, introducing adjusted rates, firstduring a transitional period and then under a Comprehensive Rate Review that will establish the conditions for a regular 5−year rate period. Arbitration hasbeen stayed since March 2006 in accordance with the terms of the Letter of Understanding, which stay has been renewed yearly at the Claimants’ request.On October 13, 2010, the arbitral panel advised that the proceedings were stayed until October 6, 2011. Once this stay expired, the arbitral panel was to askthe parties to provide a status report on the negotiation process in accordance with the Letter of Understanding, which as of this date has not yet taken place.In October 2010, arbitrator Robert Volterra tendered his resignation. Applicable regulations required the claimants to designate a replacement within 45days as from the notice sent by the Clerk’s Office; however, the claimants asked that the proceeding be stayed also with regard to the designation of thesubstitute arbitrator, to which the Argentine Republic consented.
2.− Meridional Servicios, Emprendimientos y Participaciones (“Meridional”) is a company whose only assets are the rights derived from the constructioncompanies Mistral and CIVEL, which had entered into a civil works contract with Centrais Elétricas Fluminense S.A. (“CELF”). The contract was cancelledby CELF before its privatization process started, which eventually led to the creation of Enersis’s Brazilian distribution subsidiary Ampla. Since CELF’sassets were transferred to Ampla during the privatization, Meridional sued Ampla in 1998 contending that the assets had been transferred fraudulently.Ampla only acquired assets from CELF, but is not its successor−in−interest since CELF, a state−owned company, still exists and maintains its legalpersonality. The plaintiff demanded payment of pending invoices and contractual penalties for repudiation of the civil works contract. In March 2009, theCourt decided in favor of Meridional, and Ampla and the State of Rio de Janeiro filed appeals. On December 15, 2009, the State Court accepted the plea andoverturned the lower court’s decision in favor of Ampla. Meridional appealed this ruling, which was denied. In July 2010, Meridional filed a new plea(agravo regimental) with the High Court of Justice of Brazil, which the court denied in late August 2010, ruling it was groundless.
On the basis of this decision, Meridional filed a new plea known as mandado de segurança, which was also dismissed. In June 2011, Meridional filed anEmbargo de Declaração, which was denied by the court. Against this ruling Meridional filed a Recurso Ordinario with the Higher Court of Justice (inBrasilia). On August 30 of this year, the process was sent to the Ministerio Público. The amount in controversy in this case is US$427 million.
F−94

Table of Contents
3.− On March 19, 2009, an Arbitration tribunal was established by the Mediation and Arbitration Chamber of the Getúlio Vargas/RJ Foundation issued anaward related to an arbitration claim filed in 2005 by Enertrade Comercializadora de Energía S.A. (“Enertrade”) against Enersis’s Brazilian distributionsubsidiary, Ampla, arising out of a dispute regarding a power purchase agreement. The ruling ordered Ampla to: i) pay the difference between thecontractual price and the sum paid for the period from January 1, 2004, to August 28, 2006, revised and with interest; ii) pay from October to December2003, plus interest and a 2% penalty. In addition, the arbitral tribunal ruled that the contract had ended on August 28, 2006 and that Ampla owes nothing toEnertrade after that date. Ampla filed a petition seeking an annulment of the arbitration award, including a petition (“antecipaçâo de tutela”), asking thatexecution of the arbitration award be suspended until a final ruling be passed in a pending trial of Enertrade vs. ANEEL (“Mandado de Segurança”), whichdiscussed the administrative approval of the power purchase agreement under arbitration. The amount involved is estimated at US$53 million. In May 2009,the “antecipaçâo de tutela” was granted, which suspended the effects of the arbitration award. Enertrade has filed several petitions to try and revoke theinjunctions mentioned above, maintaining the stay on the execution of the arbitration award. Simultaneously, Ampla and Enertrade have continuednegotations but have yet to reach an agreement. In May of 2011, AMPLA sought a decision on the merits from the court, and in September of 2011 Amplafiled a Memorial with the Judge by reason of the replacement of Judges during the process. Ampla is currently awaiting a decision from the trial court.
4.− Companhia Brasileira de Antibióticos (“CIBRAN”) sued Enersis’s Brazilian distribution subsidiary, Ampla, for damages for the loss of products and rawmaterials, machinery breakdown, among other things, which allegedly occurred as a result of poor service provided by Ampla between 1987 andMay 1994. CIBRAN is also seeking payment of punitive damages. This litigation is in the trial stage and has been joined with various other claims filed byCibran against Ampla, including five other actions for smaller amounts based on power outages allegedly caused by Ampla. The judge decided to conduct asingle expert assessment for these various claims, which was in part adverse to Ampla. On March 4, 2011, Ampla challenged the expert assessment, seekingits annulment, pointing out various contradictions in which the expert’s assessment and demanded that a new assessment be conducted. The amountinvolved for of all of these cases is estimated at approximately US$59.19 million.
5.− In October 2009, Tractebel Energía S.A. sued CIEN claiming an alleged breach of the “Purchase & Sale Agreement for 300 MW of Firm Capacity withrelated energy originating from Argentina” entered into in 1999 by and between CIEN and Centrais Geradoras do Sul do Brasil S.A (Gerasul — presentlyTractebel Energia). Tractebel asked the court to order that CIEN pay a rescission penalty of R$ 117,666,976.00 (approximately US$ 62.72 million) plusother fines due to the non−availability of “firm capacity and related energy,” and asked the court to determine those other fines in its ruling. The breachallegedly occurred due to a failure by CIEN to assure the availability of capacity contractually agreed with Tractebel over the 20−year period, whichallegedly took place beginning in March 2005. In November 2009, CIEN answered the lawsuit, arguing that this unavailability was caused by the“Argentine Crisis,” since CIEN imports all the energy it delivers — when needed − to Tractebel from that country. CIEN also argued that the “ArgentineCrisis” was an extraordinary event in which CIEN was not involved to any extent, and that this situation was even acknowledged by the Brazilianauthorities at the time. In May 2010, Tractebel notified CIEN via a written statement that it intended to exercise its step−in rights in Line I (30%). Theprocess is currently at the trial stage. In October 2011, Tractebel filed its reply to the filings submitted by CIEN, and the lawsuit was sent to the judge inNovember for him to decide on the lawsuit and determine if he will provide CIEN the opportunity to make any statements it feels necessary or to begindiscovery.
6.− Suit filed by Furnas Centrais Eletricas S.A. and served on June 15, 2010, based on CIEN’s alleged breach of Firm Capacity Purchase AgreementNo. 12,399, for the purchase of 700 MW of firm capacity with related energy originating from Argentina. The agreement was signed in May 1998, withCIEN committing itself to purchase electricity in the Wholesale Electric Market of the Argentine Republic (Mercado Eléctrico Mayorista de la RepúblicaArgentina hereinafter “MEM”), and transporting it from the Argentine Electric System through the Sistema de Transmissao de Interligacao, to be madeavailable in Brazil at the Itá substation. The contract has a 20 year term effective June 21, 2000. On April 11, 2005, CIEN advised Furnas that it was unableto fulfill the agreement due to events beyond its control, alleging force majeure. Consequently, on April 14, 2005, Furnas notified CIEN that it rejected theforce majeure allegations. Fumas is requesting that CIEN should be forced to pay a R$520,800,659 (US$ 280.84 million) as a rescission penalty as providedfor in the agreement, as adjusted plus interest from the date of filing of the claim until actual payment, as well as other penalties based on the lack of
F−95

Table of Contents
availability of the contracted capacity, and other charges to be determined upon the issuance of the final verdict. Discovery in the lawsuit is now completedand, on June 14, 2011, the 12th Civil Section of the Court of Justice unanimously affirmed the decision of the trial court judge to withdraw certainforeign−language documents from the case. CIEN has filed a Special Remedy (Recurso Especial) against this decision, which will be decided upon by theHigh Court of Justice in Brasilia. At present, the resolution of the principal action and a decision on the merits of the injunction are pending.
7.− In December 2001, the article of the Federal Constitution on which our Brazilian distribution subsidiary, Ampla, argued that it was not required to paycertain taxes (COFINS, Contribuição para o Financiamento da Seguridade Social) and pursuant to which Ampla did not pay tax, was amended. AMPLAbegan paying COFINS in April 2002, claiming that legislative modifications are effective 90 days after they are published.. However, the Receita Federalargued that this constitutional norm applies only to changes at the level of statutes, but not to those introduced to the Constitution itself, which would applyimmediately. Also, the Receita Federal claims that, due to the change in tax treatment made by AMPLA (switching from collected to accrued basis),Ampla’s COFINS amount payable increased in the first half of 2002. This decision was rendered in July 2003. The trial−level administrative decision wasadverse to AMPLA, which filed an appeal in October 2003. In November 2007, the appeal was decided at the administrative appeals level, partly in favor ofthe State in relation to the effective term of the constitutional reform, and in part in favor of AMPLA as regards the change in tax treatment from acollected−revenue basis to an accrued−revenue basis. In April 2008, the Federal Tax Department appealed this decision with the Upper Appellate Chamber.In October 2008, AMPLA filed its answer to this appeal and also filed its own appeal with the Upper Chamber with the regards to the part of the decisionthat did not favor AMPLA. In May 2009, the Federal Tax Department applied interest on the fine imposed, calculated by applying SELIC (SpecialSettlement and Custody System —Portuguese acronym: restatement index determined by the federal government based on the benchmark interest rate ofthe Central Bank of Brazil), as from the month following receipt of the infringement notice. Consequently, since the infringement notice was received inJuly 2003, SELIC corresponds to interest accumulated since August 2003, yielding a 101.21% rate. In August 2009, AMPLA was notified that the SpecialRemedy filed by the company had been dismissed. AMPLA filed another appeal from this decision with the President of the Upper Chamber of TaxAppeals. This appeal by Ampla sought to have the Special Remedy instituted, and its outcome was adverse to AMPLA. In May 2010, AMPLA was notifiedthis decision. In July 2010, AMPLA received a demand for production of evidence, requesting that it submit the amounts that represent its financial income.On July 26, 2010, AMPLA filed a reply to the demand for production of evidence. The resolution on the Special Remedy filed by the Federal TaxDepartment is pending. Also pending is the decision on the remedy filed by AMPLA with the President of the Upper Chamber of Tax Appeals. The amountinvolved is approximately US$92.05 million.
8.− To fund its investment in Coelce in 1998, our Brazilian distribution subsidiary, AMPLA, issued FRNs (bonds) totaling US$350 million maturing in 2008,which were underwritten by Cerj Overseas (a foreign subsidiary of AMPLA). The bonds were exempted from withholding tax (15% or 25%) on interestpayments made abroad, provided that, among other things, no prepayments were made before the average 96 month amortization period. To purchase thebonds, Cerj Overseas obtained 6−month foreign debt financing, whereupon, in October 1998, Cerj Overseas encountered problems in accessing othersources of financing and was forced to refinance with AMPLA, which loaned the funds in reales. The Federal Tax Department argued that the withholdingtax exemption applicable to the bonds was lost in 1998 because the loans made in reales by AMPLA to Cerj Overseas were allegedly equivalent to aprepayment of the debt before the average 96−month amortization period. Ampla was notified of the loss of special tax treatment in July 2005. InAugust 2005 AMPLA filed an appeal with lower administrative court, which was dismissed. In April 2006, an appeal was filed with the Taxpayers Council,which was decided entirely in favor of AMPLA in December 2007. In January 2010, AMPLA was notified this favorable decision by the TaxpayersCouncil, as well as the Special Remedy filed by the tax authorities. In February 2010, AMPLA presented its counterarguments against the Special Remedyfiled by the tax authorities, which is now pending resolution. The amount of this lawsuit is US$417.52 million.
F−96

Table of Contents
9.− In 2002, the State of Río de Janeiro (“RJ”) issued a decree establishing that the ICMS (Imposto sobre operações relativas à circulação de mercadorias esobre prestações de serviços de transporte interestadual, intermunicipal e de comunicação) calculated and paid on the 10th, 20th and 30th days of the samemonth of the accrual. Due to cash problems, our Brazilian distribution subsidiary, AMPLA, kept paying ICMS in accordance with the previous system (onthe 5th day of the month following its accrual). Notwithstanding the existence of an informal agreement with the State of Rio de Janeiro and two amnestylaws, in September 2005 the State of RJ notified AMPLA of a resolution to collect the fine on late payments, and such resolution was appealed by AMPLAthat same year. In February 2007, AMPLA was notified of the trial−level administrative decision, which confirmed the charges pressed by the State of RJ.In March 2007, AMPLA filed an appeal with the Taxpayers Council of the State of RJ. AMPLA obtained a “liminar” (injunction) in its favor, allowing it tofile this appeal without posting a bond to guarantee 30% of the value of the adjusted amount of the fine. On August 26, 2010, AMPLA received an adverseruling from the Taxpayers Council of the State of RJ. The Taxpayers Council, in a manner considered unlawful, ruled that AMPLA’s administrative remedyhad been decided against such Council. Thereafter, on September 1, 2010, AMPLA filed an appeal with the En Banc Council (a special body within theTaxpayers Council) to amend the decision of the Taxpayers Council. The resolution of the En Banc Council is pending. The amount of the lawsuit is US$99.91 million.
10.− In late 2002, our Brazilian generation subsidiary CGTF filed a petition against the Federal Government seeking an acknowledgment that the assetsimported for the turbo−generator units should be classified under “Other Generators” in order to be eligible for a 0% Import Tax (II) and Industrial ProductsTax (IPI). The Federal Government argued that the imported assets do not qualify as generators. CGTF obtained an interlocutory resolution in its favorallowing it to clear the goods through customs with a 0% duty after depositing a bond with the court. In September 2008, the trial−level court decidedentirely in CGTF’s favor. This ruling acknowledged the Generator’s classification as sought by CGTF, and determined that the judicial bond had to remaindeposited to secure the outcome of the case. In February 2009, the Receita Federal filed an appeal with the Federal Regional Court (TRF). In May 2010, theFederal regional Court (TRF), judged favorably for CGTF, fully upholding the trial court’s decision in favor of CGTF and dismissing the FederalGovernment’s appeal. The appellate court’s decision, which classified CGTF’s equipment as generators for taxation purposes, was rendered final becausethe Receita Federal did not appeal to a higher courts (admitting that the basic issue was chiefly evidential and that no appeal was therefore warranted). InSeptember 2009, CGTF received a final judgment in its favor that allowed for its assets to be levied a 0% tax and be cleared through customs after posting abond with the court. In October 2009, an appellate decision was published that confirmed the trial−level decision in favor of CGTF. In November 2009, theFederal Government filed a special petition (embargo de declaracao) against the appellate decision. In December 2009, the appellate decision that upheldthe trial court’s decision in favor of CGTF was published. In November 2009, the Federal Government filed a special petition against the appellate decision.In December 2009, the special petition filed by the government was decided in favor of CGTF. In March 2010, the government filed a special petition withthe High Court of Justice (Brasilia). In June 2011, a resolution was issued that quashed the special petition filed by the Receita Federal. In August 2011, theReceita Federal was notified that its special petition had been denied. In September 2011, CGTF replied to this petition and the same is now pending. Theamount involved is US$ 44.17 million.
11.− In 2005, three lawsuits were filed against ENDESA CHILE, the Chilean Tax Authority and the General Water Affairs Bureau (DGA), currently beingtreated as a single proceeding, requesting that DGA Resolution 134 be declared void as a matter of public policy, such resolution having establishednon−consumptive water rights in favor of Endesa to build the Neltume hydroelectric station project. Alternatively, damages were sought for the detrimentallegedly sustained by the plaintiffs due to the loss of their status as riparian owners along the Pirehueico Lake, as well as due to the devaluation of theirproperties. The defendants have rejected these allegations, contending that the resolution complies with all legal requirements, and that the exercise of thisright does not cause any detriment to the plaintiffs, among other arguments. To date, the court has issued a resolution opening a discovery period, andseveral petitions for reconsideration are presently pending resolution by the court. The sums involved in these suits are undetermined. This case was joinedwith two other cases: the first one is captioned “Arrieta v. the State and Others” in the 9th Civil Court, docket 15279−2005 and the second is captioned“Jordán v. the State and Others”, in the 10th Civil Court, docket 1608−2005. With regards to these cases,, an injunction has been ordered against enteringinto any acts and contracts concerning Endesa’s water rights related to the Neltume Project. A petition was made to have the injunction lifted, but it wasdenied, and an appeal was filed from this decision but it was also ultimately
F−97

Table of Contents
denied. A petition was then filed to have the injunction replaced by a nominal bond by subsidiary Enigesa, which petition as also denied. Endesa appealedthis decision and the appeal is currently under review. Discovery was ordered by the appeals court and the parties filed a plea for reconsideration, which iscurrently pending a decision.
12.− Five legal proceedings were initiated in 2008, 2009 and 2011 against PANGUE S.A., a subsidiary of ENDESA CHILE, where the plaintiffs soughtdamages that they allege were due to flooding caused by the operations of the Pangue hydroelectric station, in particular related to spills caused inJuly 2006. PANGUE S.A. has responded to such lawsuits arguing that its operation of the power station was in accordance with existing regulations and thatit acted with due diligence and care. Consequently, PANGUE S.A. argues that there is no causal between the floods and the spills caused by the stationduring the period in question. These proceedings are being reviewed in several courts. The amounts claimed in these four cases is equal to $17,718,704,000(US$ 34.12 million) in the aggregate. In two of these cases, the court has already ruled in favor of PANGUE S.A., and the plaintiffs filed appeals, with onestill pending before the Concepción Court of Appeals and the other already ending with a favorable appellate ruling on May 26, 2011, when the plaintiffs’appeal on the merits with the Supreme Court was dismissed. The three other cases are in their evidentiary stage, with rulings now imminent. The final caseis now closed after the court issued an final enforceable judgment that declared the proceedings abandoned. It should be noted that these proceedings arecovered by an insurance policy, and therefore PANGUE S.A. faces no monetary risk.
13.− In 2010, three suits for damages were filed against ENDESA CHILE by plaintiffs alleging that they were affected by the flooding of the Bio−Bio river inRegion VIII. The plaintiffs blamed the company for losses caused by its deficient operation of the Ralco hydroelectric station during the flood. These threecases were joined and their discovery period has ended, and the parties are awaiting a verdict. The plaintiffs are required to produce legal evidence provingthe causal link between the operation of the Ralco hydroelectric station during the floods and the damages that the plaintiffs claim they sustained as a resultof deficient facility operation. The amount involved in the three suits totals $ 14,610,042,700 (US$ 28.13 million). It should be noted that these proceedingsare covered by an insurance policy, and therefore ENDESA CHILE. faces no monetary risk.
14.− In July and September of 2010, Ingeniería y Construcción Madrid S.A. and Transportes Silva y Silva Limitada filed separate lawsuits against ENDESACHILE and the General Water Affairs Bureau (DGA), seeking to nullify and void the administrative resolution that established ENDESA CHILE’s waterrights for the Neltume hydroelectric station, and the administrative resolution that authorized the relocation of the collection point of such rights. Theplaintiffs argue that both administrative resolutions should be void due to public−policy considerations. Essentially, the plaintiffs demand payment for theirwater rights located in the area of the hydraulic works for the future Neltume Station. ENDESA CHILE has rejected these claims, contending that theplaintiffs are engaging in wrongful prosecution to prevent the construction of the station in order to obtain monetary compensation. As to the proceduralstatus of the two lawsuits filed by Ingeniería y Construcción Madrid S.A., the period has expired for both lawsuits and in one of the lawsuits (CaseNo. 7036−2010) the pleas for reconsideration filed in opposition to the discovery writ were decided upon October 5, 2011, with the evidentiary periodhaving ended with written interrogatories and expert reports still pending. In the second lawsuit filed by Ingeniería y Construcción Madrid S.A.; (CaseNo. 6705−2010) a writ of discovery has been issued and has yet to be notified. In the lawsuits filed by Transportes Silva y Silva Ltda., in once lawsuit theparties are awaiting a writ of discovery to be issued, while in the other a writ of discovery has already been issued but remains to be notified. All theseclaims are for an undetermined amount.
15.− On January 18, 2011, an Arbitration Tribunal was established to hear the case captioned “Empresa Nacional de Electricidad S.A. vs. CMPC CelulosaS.A.”, instituted at the behest of Endesa Chile to determine the damages awarded in another arbitration between the parties on March 27, 2009. In the priorarbitration, a majority decision agreed with and affirmed Endesa Chile’s position regarding the treatment of excess consumption in the power and capacitysupply agreement executed by the parties on May 31, 2003. Once the arbitration award was rendered final and binding in 2010, Endesa Chile began movingtoward instituting a new arbitration to determine the amount of damages recognized in the arbitration award of 2009. A claim was filed requesting a sum ofCh$41,864,543,390 (US$ 80.63 million). An answer to the claim was filed by CMPC on June 6, 2011. The proceeding was then stayed to allow fornegotiations between the parties, which were ultimately fruitless, and the stay was lifted on September 30, 2011. Endesa filed a rejoinder in reply to thedefendant’s answer and the defendant was given 10 business days
F−98

Table of Contents
to answer. The argument stage of the arbitration has now ended, and the parties await a summons to a reconciliation hearing.
16.− In 2001, a suit was filed against Colombian generation subsidiary Emgesa S.A. ESP., Empresa de Energía de Bogotá S.A. ESP. and Corporación AutónomaRegional by the inhabitants of Sibaté, Department of Cundinamarca. The lawsuit seeks to make the defendants jointly and severally liable for the damagesarising from the pollution of the El Muñá reservoir, as a result of Emgesa S.A.’s pumping of polluted waters from the Bogotá river. Emgesa has challengedthese allegations, arguing that the company is not liable for these damages, arguing, among other things, that it receives already polluted water. Theplaintiffs’ initial demand was for $3,000,000,000 in thousands of Colombian pesos (approx. US$ 1,544.24 million). Emgesa S.A. ESP petitioned for thejoinder of approximately 60 public and private entities that also discharge their effluents into the Bogotá river or are otherwise are have responsibility forthe environmental management of the river, which is why the lawsuit was sent on to the State Council (Consejo de Estado), with remedies pending by theseentities before this regulatory body. On June 29, 2010, the parties were notified of a motion filed by the attorney for the plaintiffs, whereby the plaintiffssought to declare the acts of the Administrative Court of Cundinamarca since August 1, 2006 null and void. The plaintiff’s claim that as of such date theCourt lacks jurisdiction over this proceeding since according to Law 472 of 1998, the Administrative Circuit Courts are the relevant courts to hear classactions. Emgesa intervened promptly, claiming that such annulment request would be irrelevant and unlawful. The Third Section of the State Council hasaffirmed the resolution of the Court that denied Emgesa’s impleader petition and joined various legal entities as defendants, including the appellants:Hospital Juan F. Copras, Refisal S.A., Tinzuque S.A., Emocables S.A., Cristalería Peldar S.A., Líquido Carbónico Colombiano S.A., Icollantas S.A. andAgrinal S.A. Elsewhere, the annulment request filed by the inhabitants of the municipality of Sibaté was denied, although the State Council required theAdministrative Court for Adversary Proceedings (Tribunal Contencioso Administrativo) to pass the case to the Administrative Courts of the Bogotá Circuit(Juzgados Asdministrativos del Circuito de Bogotá) for its review. In June 2011, the court issued a writ ruling that the lawsuit was passed to the FifthAdministrative Court of Bogotá (Juzgado Quinto Administrativo de Bogotá), which then in turn sent it to the State Council to resolve on appeal from thewrit of admission requested by Alpina. The appeal is currently still pending.
17.− The Peruvian tax authority, SUNAT (Superintendencia Nacional de Aduanas y de Administración Tributaria), through Tax and Fine Resolutions(Resoluciones de Impuestos y Multas) issued in 2001, questioned EDEGEL’s method used in accounting for depreciation of Edegel’s revalued assets. InJanuary 2002, EDEGEL filed a petition (recurso de reclamacion) against these resolutions, which SUNAT dismissed as groundless. EDEGEL filed anappeal with the National Tax Court, which ruled in its favor in 2004, upholding (i) its right to depreciate the greater value obtained from revaluating theassets, based on the fact that Edegel had a statutory stability agreement (convenio de estabilidad jurídica), and (ii) the inapplicability of Rule VIII of the TaxCode, since there was no fraud involved. Also, the resolution provided that SUNAT had to verify that the revaluation of assets was not done at more thanfair value. From that date, EDEGEL has received several notices from SUNAT request a determination of the revaluation surplus and the tax payable. InJanuary 2006, a complaint was filed, followed by an appeal filed in 2008 against the resolution of SUNAT’s before the Tax Court, which is currentlypending. This amount of this claim equals approximately US$ 51.31 million.
18 − In 2004, 2005 and 2006, Peru’s tax authority, SUNAT, notified EDELNOR of several Assessment and Fine Resolutions whereby SUNAT objected to theIncome Tax and General Sales Tax paid from 2000 to 2003. With regards to Income Tax, SUNAT objected to the tax loss declared, during such period.EDELNOR accepted these objections in part and questioned some of them. In relation to General Sales Tax, the objections were substantially less.EDELNOR filed an appeal against these resolutions with SUNAT. In February 2009, EDELNOR was notified of administrative trial−level resolutionsissued by SUNAT, which in part upheld the company’s appeal with SUNAT. In May 2009, an appeal was filed against these resolutions with the Tax Court,and such appeal is currently pending. The amount of this claim equals US$ 51.60 million.
F−99

Table of Contents
19.− On May 24, 2011, Endesa was served a with a lawsuit filed by 19 riparian owners along the Pirehueico Lake asking to find DGA Resolution 732, whichauthorized the relocation of water catchment rights for the Neltume Station from the Pirehueico Lake drain to 900 meters downstream along the Fui River,to be declared null and void. The plaintiffs seek for this annulment to be annotated at the margin of the notarized instrument that memorialized DGAResolution 732,. The plaintiffs also seek that the recordation of said instrument be struck from the waters registry, if entered; that the Chilean State, DGAand argue that Endesa be required to pay the damages caused to the plaintiffs as a result of the challenged resolution, seeking to reserve their right toindicate the type and amount of damages in subsequent legal proceedings. The claim is for an undetermined amount since the plaintiffs have requested thatdamages be determined in another suit, once the administrative resolution is declared null and void. To date, the argument period is over and a writ ofdiscovery has been issued but not yet served.
The Management of Enersis S.A. considers that the reserves established in the Consolidated Financial Statements adequately cover the litigation risksdiscussed in this Note, and therefore the same are not expected to generate any liabilities in addition to those already recorded.
Given the nature of the risks covered by these reserves, one cannot determine a reasonable timeframe for the payments, if any, related to the same.
F−100

Table of Contents
23. EMPLOYMENT BENEFIT OBLIGATIONS
23.1 General information:
Enersis S.A. and certain of its subsidiaries in Chile, Brazil, Colombia, and Argentina provide various post−employment benefits for all or some of its activeor retired employees. These benefits are calculated and recorded in the financial statements according to the criteria described in Note 3.l.1, and includeprimarily the following:
a) Defined benefits plans:
• Complementary pension: The beneficiary is entitled to receive a monthly amount that supplements the pension obtained from the respective socialsecurity system
• Staff severance indemnities: The beneficiary receives a certain number of contractual salaries upon retirement. Such benefit is subject to a vestingminimum service requirement period, which depending on the company, varies within a range from 5 to 15 years
• Electricity: The beneficiary receives a monthly bonus to cover a portion of his/her billed residential electricity consumption• Health benefit: The beneficiary receives health coverage in addition to that to which s/he is entitled under his/her social security regime.
b) Other benefits:
Five−year benefit: A benefit certain employees receive after 5 years; begins to accrue after the first year.
Unemployment: A benefit paid regardless of whether the employee is fired or leaves voluntarily. This benefit accrues on a daily basis and is paid at the timeof contract termination (although the law allows for partial withdrawals for housing and education).
c) Defined contribution benefits:
The Group makes contributions to a retirement benefit plan where the beneficiary receives additional pension supplements upon his/her retirement,disability, or death.
23.2 Details, movements, and presentation in financial statements:
a) The post−employment obligations associated with defined benefits plans and the related assets plan as of December 31, 2011 and December 31, 2010is detailed as follows:
The amounts included in the consolidated statement of financial position are the following
Balance at12−31−2011 12−31−2010
ThCh$ ThCh$
Post−employment benefit obligation, current — 5,450,382Post−employment benefit obligation, non−current 277,526,013 215,818,975
Total 277,526,013 221,269,357
(−) Surplus of plan assets (*) — (3,352,698)
Total post−employment obligations, net 277,526,013 217,916,659
(*) Corresponds to the surplus of the fair value of plan assets over the present value of the defined benefit obligation in the subsidiary Coelce. This amounthas been presented within “Other financial assets” (see Note 6).
F−101

Table of Contents
The amounts included in the statement of financial position arising from the Group´s obligation with respect to its defined benefit plans are as follows:
Balance at12−31−2011 12−31−2010
ThCh$ ThCh$
Post−employment obligations 600,384,950 554,990,745(−) Fair value of plan assets (*) (366,137,888) (377,239,859)
Total 234,247,062 177,750,886
Amount not recognized as an asset due to limit on Defined Benefit Plan Assets 31,908,269 31,425,234Minimum financing required (IFRIC 14) (**) 11,370,682 11,527,032Transfer to disposal groups held for sale (***) — (2,786,493)
Total Post−Employment Obligations, net 277,526,013 217,916,659
(*) Plan assets to fund defined benefit plans in our Brazilian subsidiaries (Ampla and Coelce); the remaining defined benefit plans in our other subsidiariesare unfunded.
(**) The Brazilian subsidiaries are subject to minimum funding requirements of contributions that must be made to a plan over a given period, inaccordance with IFRIC 14.
(***) Corresponds to benefit obligations in our subsidiaries CAM and Synapsis classified as held for sale (see Note 11 and 2.4.1).
b) The reconciliation of opening and closing balances of the present value of the defined benefit obligations as of December 31, 2011 and December 31,2010 is as follows:
Present Value of Post−employment Benefit Obligations ThCh$
Initial balance at January 1, 2010 510,334,175Current Service Cost 4,455,159Interest cost 52,703,379Contributions from plan participants 1,461,694Actuarial (Gains) losses 48,675,226Foreign currency translation (15,843,247)Benefits paid (46,795,641)Balance at December 31, 2010 554,990,745Current Service Cost 4,355,454Interest cost 57,048,714Contributions from plan participants 1,252,638Actuarial (Gains) losses 31,390,546Foreign currency translation 890,940Benefits paid (52,715,892)Cost of past services 4,385,031Reduction of obligation due to sale of Cam and Synapsis (2,885,053)Other 1,671,827
Final balance at December 31, 2011 600,384,950
As of December 31, 2011, out of the total amount of post−employment benefit obligations, 5.99% is from defined benefit plans in Chilean companies (6.4%at December 31, 2010); 78.56% is from defined benefit plans in Brazilian companies (79.1% at December 31, 2010); 14.17% is from defined benefit plansin Colombian companies (14.1% at December 31, 2010); and the remaining 1.28% is from defined benefit plans in one Argentine subsidiary (0.4% atDecember 31, 2010).
F−102

Table of Contents
c) Movements in the fair value of the benefit plan assets is as follows:
Fair Value of Benefit Plan Assets ThCh$Initial balance at January 1, 2010 (362,690,337)Expected return (41,253,550)Actuarial (gains) losses (2,416,269)Foreign currency translation 12,205,535Contributions (15,530,103)Benefits paid 32,444,865Balance at December 31, 2010 (377,239,859)Expected return (44,345,866)Actuarial (gains) losses 29,912,014Foreign currency translation 5,214,769Employer Contributions (13,605,383)Contributions (1,252,638)Benefits paid 35,179,075
Final balance at December 31, 2011 (366,137,888)
The amounts included in the fair value of plan assets for equity instruments of the Group’s own financial instruments and for property occupied by theGroup are as follows:
12−31−2011 12−31−2010ThCh$ ThCh$
Equity instruments 5 5Real estate 10,152,936 9,570,510
Total 10,152,941 9,570,515
d) The major categories of benefit plan assets at the end of each reporting period are as follows:
12−31−2011 12−31−2010Category of Benefit Plan Assets ThCh$ % ThCh$ %
Equity instruments (variable income) 55,291,894 16% 65,913,747 18%Fixed income assets 275,643,406 75% 283,356,040 75%Real estate investments 20,653,101 6% 23,748,294 6%Other 14,549,487 3% 4,221,778 1%Total 366,137,888 100% 377,239,859 100%
The expected rate of return on the benefit plan assets has been estimated considering the projections for financial markets of fixed and variable incomeinstruments, and assuming that asset categories will have a weighting similar to that of the previous year. The average return on plan assets was 12.09% asof December 31, 2011.
e) The total expense recognized in profit or loss and comprehensive income with respect to the defined benefit plans as of December 31, 2011, 2010, and2009 are as follows:
12−31−2011 12−31−2010 12−31−2009ThCh$ ThCh$ ThCh$
Normal service cost for defined benefits plan 4,355,454 4,455,159 5,138,692Interest cost for defined benefits plan 57,048,714 52,703,379 51,679,594Expected return on plan assets (44,345,866) (41,253,550) (32,050,585)
Expenses recognized in Profit or Loss 17,058,302 15,904,988 24,767,701Net actuarial (gains) losses 62,246,623 48,495,375 15,599,453Total expense recognized in Comprehensive Income 79,304,925 64,400,363 40,367,154
F−103

Table of Contents
23.3 Other disclosures:
• Actuarial assumptions:
As of December 31, 2011 and December 31, 2010, the following assumptions were used in the actuarial calculation of defined benefits:
Chile Brazil Colombia Argentina12−31−2011 12−31−2010 12−31−2011 12−31−2010 12−31−2011 12−31−2010 12−31−2011 12−31−2010
Discount rates used 6.50% 6.50% 10.50% 10.50% 8.50% 9,52% 5,50% 16,80%Expected return on plan assets N/A N/A 11.10% 12.90% / 13.41% N/A N/A N/A N/AExpected rate of salary increases 3.00% 3.00% 6.59% 4.50% 3.5% − 4.0% − 4.5% 4,51% 0,00% 11,30%Mortality tables RV−2004 RV−2004 / RV−85 AT 2000 AT 2000 RV 08 RV 08 RV 2004 CSO 1980
• Sensitivity:
As of December 31, 2011, the sensitivity of the value of the actuarial liability for post−employment benefits to variations of 100 basis points in the discountrate assumes a decrease of ThCh$ 54.571.512 (ThCh$ 48,202,624 as of December 31, 2010) if the rate rises and an increase of ThCh$ 65.049.753(ThCh$ 56,462,882 as of December 31, 2010) if the rate falls.
• Defined contribution:
The total expense recognized in the consolidated statement of comprehensive income within line item “Employee expenses” represents contributionspayables to the defined contribution plans by the Group. As of December 31, 2011, the amounts recognized as expenses were ThCh$ 1,998,189(ThCh$ 1,382,818 and ThCh$ 2,132,317 as of December 2010 and 2009, respectively).
F−104

Table of Contents
24. EQUITY
24.1 Equity attributable to the parent company’s owners
24.1.1 Subscribed and paid capital and number of shares
Enersis S.A.’s share capital as of December 31, 2011 and December 31, 2010 was ThCh$ 2,824,882,835, divided into 32,651,166,465 fully subscribed andpaid no par value shares listed at the Bolsa de Comercio de Santiago de Chile, Bolsa Electrónica de Chile, Bolsa de Valores de Valparaíso, New York StockExchange (NYSE), and Bolsa de Valores Latinoamericanos de la Bolsa de Madrid (LATIBEX). There has been no change in the numbers of shares as ofDecember 31, 2011 and December 31, 2010.
Capital contributions made in 2003 and 1995 resulted in share premiums amounting to ThCh$ 125,881,577 and ThCh$ 32,878,071, respectively. TheChilean Companies Law permits the use of the share premium account balance to increase capital and does not establish any specific restrictions as to itsuse.
24.1.2 Dividends
The Enersis Board of Directors, at the Board Meeting held on February 26, 2010, agreed to propose to the General Shareholders Meeting, to be held onApril 22, 2010, the distribution of a final dividend equivalent to 35.11% of the Company’s 2009 net income, at Ch$ 7.1 per share.
The aforementioned proposal modified the Company’s Dividend Policy for 2009, which allowed for distribution of an expected final dividend of 60% of theCompany’s net income. This was disclosed as an Essential Event dated February 26, 2010. In the General Ordinary Shareholders’ Meeting held onApril 22, 2010, the shareholders agreed to distribute the minimum mandatory dividend and an additional dividend amounting to Ch$ 7.1 per share. Thisdividend was partially paid during 2009 (Interim Dividend No. 80) and the remaining Ch$ 4.64323 per share was paid on May 6, 2010 (Final DividendNo. 81).
The Board agreed to establish a dividend policy for 2010 amounting to 60% of 2010 net income.
The Enersis Board, at its Ordinary Session held on October 27, 2010, unanimously agreed to pay an interim dividend on January 27, 2011 of Ch$ 1.57180per share out of 2010 net income and corresponding to 15% of the Company’s net income through September 30, 2010.
At the Ordinary Shareholders’ Meeting held on April 26, 2011, it was unanimously agreed to pay a minimum obligatory dividend (partially paid throughinterim dividend No. 82) and an additional dividend totaling Ch$ 7.44578. Given that the interim dividend No. 82 had already been paid, distribution andpayment of the balance of final dividend No. 83 totaling Ch$ 5.87398 per share was made from May 12, 2011 onwards.
The foregoing constitutes a modification to the Company’s 2010 dividend policy, which considered payment of the interim dividend in December.
The Enersis Board, at its Ordinary Session held on November 30, 2011, unanimously agreed to distribute an interim dividend of Ch$ 1.46560 per share onJanuary 27, 2012 to be charged against the 2011 fiscal year net income; the amount to be distributed amounts to 15% of the liquid profits calculated as ofSeptember 30, 2011.
Fulfillment of the aforementioned dividend plan is subject to the actual net income earned by the Company during the current year, and to the results of theCompany’s periodic income projections or to the existence of certain conditions, as applicable.
F−105

Table of Contents
The following table details the dividends paid in the last six years:
Dividend No.Type of
Dividend Payment DatePesos Per
Share Charged to72 Final 04−20−2005 0.41654 200473 Final 04−03−2006 1.00000 200574 Interim 12−26−2006 1.11000 200675 Final 05−23−2007 4.89033 200676 Interim 12−27−2007 0.53119 200777 Final 04−30−2008 3.41256 200778 Interim 12−19−2008 1.53931 200879 Final 05−12−2009 4.56069 200880 Interim 12−17−2009 2.45677 200981 Final 05−06−2010 4.64323 200982 Interim 01−27−2011 1.57180 201083 Final 05−12−2011 5.87398 201084 Interim 01−27−2012 1.46560 2011
24.2 Foreign currency translation
The following table details translation adjustments, net of taxes, in the consolidated statement of financial position and the consolidated statement of changein equity as of December 31, 2011, 2010, and 2009.
12−31−2011 12−31−2010 12−31−2009Foreign Currency Translation ThCh$ ThCh$ ThCh$
Distrilec Inversora S.A. (32,242,851) (31,997,882) (25,140,985)Empresa Distribuidora Sur S.A. (39,867,010) (39,533,598) (30,917,314)Ampla Energia e Serviços S.A. 125,398,489 131,368,333 145,683,499Ampla Investimentos e Serviços S.A. 1,047,218 2,457,495 3,558,280Codensa S.A. E.S.P. 20,185,717 8,383,309 8,666,552Inversiones Distrilima S.A. 7,760,149 (631,395) 1,913,422Edelnor 2,567,123 (9,402,243) (5,533,832)Investluz S.A. 3,630,372 3,645,236 3,681,834Endesa Brasil S.A. 20,839,624 32,580,194 55,686,633Central Costanera S.A. (6,301,808) (6,826,288) (3,209,430)GasAtacama S.A. 3,979,726 (2,013,576) 2,261,348Emgesa S.A. E.S.P. 51,141,069 38,858,582 40,494,477Hidroelectrica El Chocón S.A. (9,846,088) (10,306,187) (7,744,971)Generandes Peru S.A. 28,938,192 766,900 9,417,649Grupo Synapsis — (1,148,937) (339,801)Grupo CAM — (2,087,946) (1,259,460)Others (607,254) (833,107) (244,691)TOTAL 176,622,668 113,278,890 196,973,210
24.3 Capital management
The Company’s objective is to maintain an adequate level of capitalization in order to be able to secure its access to the financial markets, so as to fulfill itsmedium− and long−term goals while maximizing the return to its shareholders and maintaining a sound financial position.
24.4 Restrictions on subsidiaries’ transferring funds to the parent
Certain of the Group’s subsidiaries must comply with financial ratio covenants which require them to have a minimum level of equity or other requirementsthat restrict the transferring of assets to the parent company. The Group’s restricted net assets as of December 31, 2011 from its subsidiaries Endesa Chile,Endesa Brasil, Ampla Energía, Coelce, and Edelnor totaled ThCh$ 1,037,860,473, ThCh$ 142,130,265, ThCh$ 437,934,092, ThCh$ 49,905,714, andThCh$ 84,428,267, respectively.
F−106

Table of Contents
24.5 Other reserves
Other reserves within Equity as of December 31, 2011, 2010, and 2009 are as follows:
Balance atJanuary 1, 2011 Movements 2011
Balance at
December 31, 2011ThCh$ ThCh$ ThCh$
Exchange differences on translation 113,278,890 63,343,778 176,622,668Cash flow hedges 40,783,463 (41,093,728) (310,265)Remeasurement of available−for−sale financial assets 41,825 (27,989) 13,836Miscellaneous other reserves (1,505,891,534) 8,682,538 (1,497,208,996)TOTAL (1,351,787,356) 30,904,599 (1,320,882,757)
Balance atJanuary 1, 2010 Movements 2010
Balance at
December 31, 2010ThCh$ ThCh$ ThCh$
Exchange differences on translation 196,973,210 (83,694,320) 113,278,890Cash flow hedges (188,691,145) 14,682,972 (174,008,173)Remeasurement of available−for−sale financial assets 41,699 126 41,825Miscellaneous other reserves (1,291,099,898) — (1,291,099,898)TOTAL (1,282,776,134) (69,011,222) (1,351,787,356)
Balance atJanuary 1, 2009 Movements 2009
Balance at
December 31, 2009ThCh$ ThCh$ ThCh$
Exchange differences on translation 283,959,611 (86,986,401) 196,973,210Cash flow hedges (276,767,607) 88,076,462 (188,691,145)Remeasurement of available−for−sale financial assets 9,565 32,134 41,699Miscellaneous other reserves (1,291,099,898) — (1,291,099,898)TOTAL (1,283,898,329) 1,122,195 (1,282,776,134)
• Foreign currency translation reserves: These arise primarily from exchange differences relating to:
• Translation of the financial statements of our foreign operations from their functional currencies to our presentation currency (i.e. Chilean peso) (seeNote 2.6.3); and
• Translation of goodwill arising from the acquisition of foreign operations with a functional currency other than the Chilean peso (see Note 3.c).
• Cash flow hedging reserves: These represent the cumulative portion of gains and losses on hedging instruments deemed effective in cash flow hedges(Note 3.g.4. and 3.m).
• Other miscellaneous reserves
Other miscellaneous reserves include the following:
(i) In accordance with Oficio Circular No. 456 of the SVS, accumulated price level restatements related to paid−in capital since our transition to IFRS 1 onJanuary 1, 2004 through December 31, 2008.
Note that despite the fact that the Company adopted IFRS as its accounting standards as of January 1, 2009, the January 1, 2004 transition date disclosedpreviously was that used by the our Parent Company Endesa, S.A. in its transition to IFRS. This applies the exemption provided for this purpose in IFRS 1,“First−time adoption.”
(ii) Translation differences existing at the date of transition to IFRS (exemption IFRS 1 “First−time adoption”).
F−107

Table of Contents
(iii) Reserves arising from transactions between entities under common control, mainly explained by the creation of the Endesa Brasil Holding in 2005 andthe merger of our Colombian subsidiaries Emgesa and Betania in 2007.
24.6 Non−controlling interests
The following is an explanation of the main variations in minority interests during the 2011, 2010, and 2009 fiscal years:
a) On October 9, 2009, in a transaction on the Lima, Peru Stock Exchange, our subsidiary Endesa Chile purchased an additional 29.3974% ownershipinterest in Edegel S.A.A. for US$ 375 million. This purchase resulted in a decrease of ThCh$ 127,551,963 in the equity attributable to non−controllinginterests in such entity.
• Then, on October 15, in another transaction on the Lima Stock Exchange, Enersis purchased an additional 24% ownership interest in Empresa deDistribución Eléctrica de Lima Norte S.A.A. (Edelnor) for US$ 145.7 million. This purchase resulted in a decrease of ThCh $37,886,392 the equityattributable to non−controlling interests in such entity.
• It should be noted that the Endesa Chile and Enersis Boards of Directors authorized the above transactions after reviewing the external valuationsprovided by investment banks hired for this purpose, as well as its own internal valuation carried out by the executive management of each company. Inboth cases, the stock was purchased from Generalima S.A.C., a Peruvian company that is entirely a subsidiary of Endesa Latinoamérica, the direct parent ofEnersis.
b) The negative variation reflected in the line item “Increase (decrease) through transfers and other changes” in the Statement of Changes in Equity isexplained primarily by:
(i) The amount corresponding to the non−controlling interests in dividends declared by the consolidated subsidiaries
(ii) In addition the 2010 fiscal year includes the amount corresponding to the non−controlling interests in the Emgesa S.A. E.S.P return of capital. The amountreceived by the non−controlling interests corresponds to ThCh$ 85,231,132.
F−108

Table of Contents
25. REVENUES
The detail of revenues presented in the Statement of Comprehensive Income for the years ended December 31, 2011, 2010, and 2009 is as follows:
Balance at12−31−2011 12−31−2010 12−31−2009
Revenues ThCh$ ThCh$ ThCh$
Energy sales 5,805,296,274 5,653,724,917 5,579,145,884
Other sales 31,746,174 50,570,774 56,489,259Sale of metering equipment 2,229,019 2,621,293 2,822,658Sale of electronic supplies 18,913,641 31,263,834 39,840,661Sale of products and services 10,603,514 16,685,647 13,825,940
Revenue from other services 417,209,641 474,934,133 477,648,472Tolls and transmission 249,719,988 182,638,100 229,183,380Metering equipment leases 6,540,680 9,646,546 8,327,754Public lighting 27,583,293 31,092,463 30,603,007Verifications and connections 15,605,137 14,106,659 14,869,456Engineering services 11,896,382 15,871,319 19,960,120Advisory services — 23,442,524 26,976,336Other services 105,864,161 198,136,522 147,728,419
Total operating revenue 6,254,252,089 6,179,229,824 6,113,283,615
Balance at12−31−2011 12−31−2010 12−31−2009
Other operating income ThCh$ ThCh$ ThCh$
Revenue from construction contracts 179,051,253 252,401,048 200,493,636Mutual support 25,188,962 23,287,510 17,809,432Third party services to own and third party fixtures 8,693,287 10,611,783 24,832,249Leases 765,055 699,787 841,083Sale of new businesses 12,619,489 11,380,343 9,238,121Other revenue (1) 54,310,209 85,970,818 105,557,517
Total other income 280,628,255 384,351,289 358,772,038
(1) During the 2011 fiscal year, the Company recognized ThCh$ 7,273,992 (ThCh$ 22,225,795 in December 2010) related to the Bocamina power plantbusiness interruption insurance policy, which was activated as a result of the February 27, 2010 earthquake that damaged that plant (see Note 15 d) vi).
F−109

Table of Contents
26. RAW MATERIALS AND CONSUMABLES USED
Raw materials and consumables used presented in profit or loss as of December 31, 2011, 2010, and 2009 are detailed as follows:
Balance at12−31−2011 12−31−2010 12−31−2009
Raw Materials and Consumables Used ThCh$ ThCh$ ThCh$
Energy purchases (1,762,818,298) (1,554,714,636) (1,520,198,225)Fuel consumption (742,639,363) (672,038,103) (580,237,613)Transportation costs (393,991,121) (405,983,092) (316,287,883)Costs from construction contracts (179,051,253) (252,401,048) (200,493,636)Other variable supplies and services (459,934,694) (636,509,375) (593,376,220)
Total (3,538,434,729) (3,521,646,254) (3,210,593,577)
27. EMPLOYEE BENEFITS EXPENSES
Employee expenses recognized in profit or loss as of December 2011, 2010, and 2009 is as follows:
Balance at12−31−2011 12−31−2010 12−31−2009
Employee Benefits Expenses ThCh$ ThCh$ ThCh$
Wages and salaries (277,553,004) (295,339,462) (296,862,091)Post−employment benefit obligations expense (6,353,643) (5,837,977) (7,271,009)Social security and other contributions (92,915,099) (63,391,743) (52,252,408)Other employee expenses (1,730,380) (10,108,831) (14,016,937)
Total (378,552,126) (374,678,013) (370,402,445)
28. DEPRECIATION, AMORTIZATION, AND IMPAIRMENT LOSSES
Depreciation, amortization, and impairment losses recognized in profit or loss as of December 31, 2011, 2010, and 2009 can be broken down as follows:
Balance at12−31−2011 12−31−2010 12−31−2009
ThCh$ ThCh$ ThCh$
Depreciation (322,218,490) (338,040,266) (346,587,547)Amortization (102,681,546) (110,977,009) (107,782,412)
Subtotal (424,900,036) (449,017,275) (454,369,959)Reversal (losses) from impairment (*) (136,157,459) (108,373,429) (85,285,525)
Total (561,057,495) (557,390,704) (539,655,484)
Balance at12−31−2011 12−31−2010 12−31−2009
(*) Impairment Losses ThCh$ ThCh$ ThCh$
Financial assets (see Note 7c) (18,649,480) (95,391,111) (22,179,120)Assets and disposal groups held for sale (see Note 11) — (14,881,960) (21,915,849)Goodwill (see Note 14) (14,379,823) — —Fixed assets (see Note 15) (106,449,843) (1,340,235) (43,999,600)Reversal of investment property provision (see Note 16) 3,321,687 3,239,877 2,809,044
Total (136,157,459) (108,373,429) (85,285,525)
F−110

Table of Contents
29. OTHER EXPENSES
Other miscellaneous operating expenses as of December 31, 2011, 2010, and 2009 can be broken down as follows:
Balance at12−31−2011 12−31−2010 12−31−2009
Other Expenses ThCh$ ThCh$ ThCh$
Other supplies and services (95,222,224) (130,232,972) (146,952,970)Professional, outsourced, and other services (180,880,189) (113,944,110) (117,604,978)Repairs and maintenance (89,045,849) (69,199,458) (53,933,371)Indemnities and fines (14,733,175) (41,316,694) (20,934,632)Taxes and charges (90,333,630) (26,456,298) (33,891,117)Insurance premiums (20,745,032) (19,147,361) (19,866,916)Leases and rental costs (17,042,089) (16,980,825) (19,969,187)Marketing, public relations, and advertising (10,316,261) (16,207,055) (16,338,026)Other supplies (14,716,010) (11,701,238) (19,372,298)Travel expenses (6,428,292) (4,306,510) (4,966,691)Environmental expenses (1,235,646) (942,248) (3,859,011)
Total (540,698,397) (450,434,769) (457,689,197)
30. OTHER GAINS (LOSSES)
Other gains (losses) as of December 31, 2011, 2010, and 2009 are detailed as follows:
Balance at12−31−2011 12−31−2010 12−31−2009
Other Gains (Losses) ThCh$ ThCh$ ThCh$
Investment sales (Cam Group and Synapsis (*)) (10,733,882) 272,686 28,113,548Sale of Condesa Hogar portfolio — — 12,784,152Land sales 3,766,963 8,381,710 9,253,010Other assets 2,152,625 3,329,038 489,568Total (4,814,294) 11,983,434 50,640,278
(*) Includes foreign currency translation differences of ThCh$ (3,236,883).
F−111

Table of Contents
31. FINANCIAL RESULTS
Financial income and costs as of December 31, 2011, 2010, and 2009 are as follows:
Balance at12−31−2011 12−31−2010 12−31−2009
Financial Income ThCh$ ThCh$ ThCh$
Income from cash and cash equivalents 124,109,491 68,144,673 79,364,437Income from expected return on plan assets (Brazil) 44,345,866 41,253,550 32,050,585Other financial income 62,735,004 56,962,380 41,884,708Income from other financial assets 2,422,508 4,876,345 6,370,675
Total 233,612,869 171,236,948 159,670,405
Balance at12−31−2011 12−31−2010 12−31−2009
Financial Costs ThCh$ ThCh$ ThCh$
Financial Costs (465,411,363) (438,358,251) (482,472,627)
Bank loans (134,214,794) (127,921,732) (137,274,372)Secured and unsecured obligations (161,347,460) (150,777,160) (171,723,898)Financial leasing (2,937,215) (3,056,546) (3,733,454)Valuation of financial derivatives (23,723,865) (19,034,198) (19,307,617)Financial provisions (90,830,303) (73,709,974) (12,105,233)Post−employment benefit obligations (57,048,714) (52,703,379) (51,679,594)Capitalized borrowing costs 35,945,738 15,137,380 11,165,950Other financial costs (31,254,750) (26,292,642) (97,814,409)
Gain (loss) from indexed assets and liabilities (25,092,203) (15,055,706) 21,781,329
Foreign currency exchange differences, net 20,305,690 11,572,474 (8,235,253)
Positive 71,301,059 83,236,540 82,015,125Negative (50,995,369) (71,664,066) (90,250,378)
Total financial costs (470,197,876) (441,841,483) (468,926,551)
Total financial results (236,585,007) (270,604,535) (309,256,146)
F−112

Table of Contents
32. INCOME TAX
The following table reconciles income taxes resulting from applying the general current tax rate to “Net income before taxes” to the income tax expenserecorded in the accompanying Consolidated Statement of Comprehensive Income for the 2011, 2010, and 2009 fiscal years:
Balance at12−31−2011 12−31−2010 12−31−2009
Income Tax ThCh$ ThCh$ ThCh$
Current tax expense (458,621,881) (397,519,578) (422,830,225)Tax benefit from tax assets not previously recognized (Credits and/or benefits on
current tax) 42,545,139 51,094,799 39,752,182Adjustments to current tax from the previous period (882,687) (2,869,081) 12,569,886Other current tax expense (301,441) (2,597,705) (4,276,209)
Current Tax Expense, Net (417,260,870) (351,891,565) (374,784,366)
Deferred tax income (expense) from origination and reversal of temporarydifferences (43,612,506) 7,335,286 15,046,756
Deferred tax (income) or expense from tax rate changes or new taxes 148,137 (1,450,689) —Other deferred tax expense (111,453) — —
Deferred Tax Income (expense), net (43,575,822) 5,884,597 15,046,756
Effect of changes in the tax status of the entity or its shareholders — — —
(Income tax income (expense) (460,836,692) (346,006,968) (359,737,610)
The principal temporary differences are detailed in Note 17a.
12−31−2011 12−31−2010 12−31−2009Reconciliation of Tax Expense ThCh$ ThCh$ ThCh$
Tax expense using statutory rate (20%) (266,675,462) (245,938,215) (284,081,079)Tax effect of rates in other jurisdictions (117,057,673) (159,695,526) (166,163,264)Tax effect of non−taxable revenues 51,007,579 44,357,904 40,858,030Tax effect of non−tax−deductible expenses (106,636,806) (9,065,332) (30,896,605)Tax effect from change in tax rate 148,137 (1,450,689) —Tax effect of over−provided tax in previous period (882,687) (2,869,081) 12,569,886Price level restatement for tax purposes (investments and equity) (20,739,780) 28,653,971 67,975,422Total adjustments to tax expense using statutory rate (194,161,230) (100,068,753) (75,656,531)
Income tax (460,836,692) (346,006,968) (359,737,610)
On July 29, 2010, Chilean Law No.20,455 “Modifica diversos cuerpos legales para obtener recursos destinados al financiamiento de la reconstrucción delpaís” (modifies tax entities to obtain funds to finance the reconstruction of the country) was enacted and published in the Diario Oficial on July 31, 2010.This law, among other things temporarily increases tax rates for the commercial years 2011 and 2012 (20% and 18.5%, respectively), and returns to 17% in2013.
F−113

Table of Contents
33. SEGMENT INFORMATION
33.1 Segmentation criteria
The Group’s activities are organized primarily around its core businesses, electric energy generation, transmission, and distribution. On that basis, the Grouphas established two major business lines.
In addition, segment information has been organized by the geographical areas in which the Group operates:
• Chile• Argentina• Brazil• Peru• Colombia
Given that the Group’s corporate organization basically matches its business organization and, therefore, the segments organization, the following segmentinformation is based on the financial information of the companies forming each segment.
The following tables present the segment information for the 2011 and 2010 fiscal years.
F−114
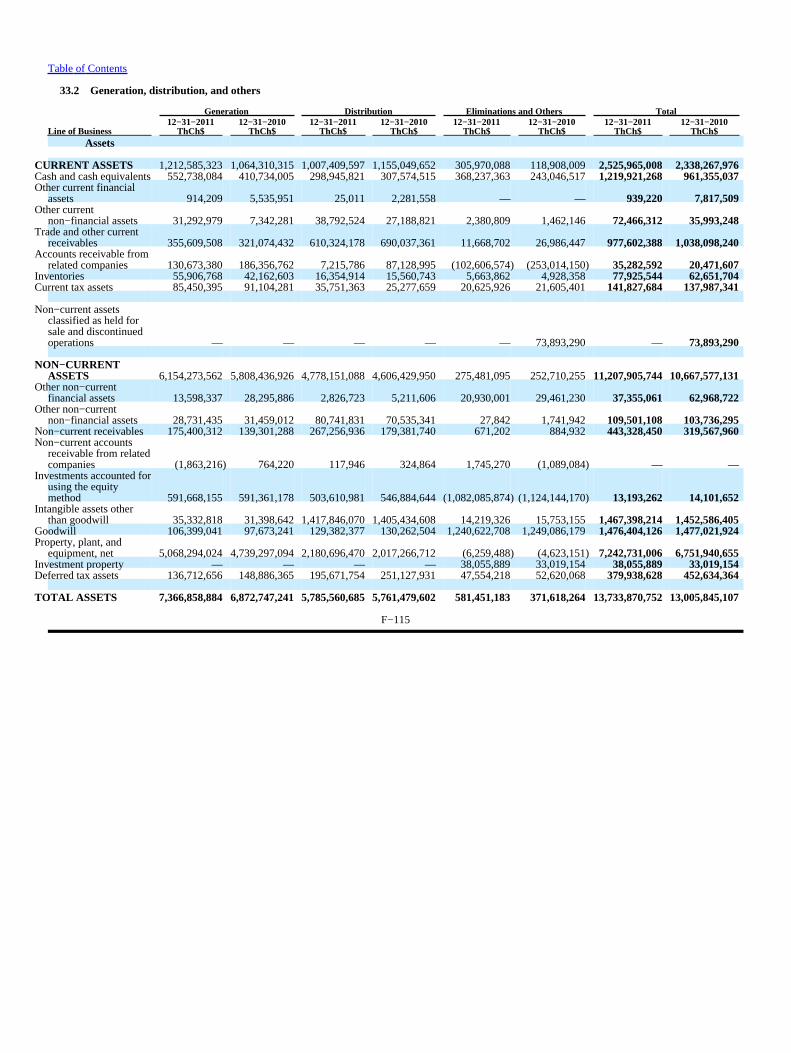
Table of Contents
33.2 Generation, distribution, and others
Generation Distribution Eliminations and Others Total
Line of Business12−31−2011
ThCh$12−31−2010
ThCh$12−31−2011
ThCh$12−31−2010
ThCh$12−31−2011
ThCh$12−31−2010
ThCh$12−31−2011
ThCh$12−31−2010
ThCh$Assets
CURRENT ASSETS 1,212,585,3231,064,310,3151,007,409,5971,155,049,652 305,970,088 118,908,009 2,525,965,008 2,338,267,976Cash and cash equivalents552,738,084 410,734,005 298,945,821 307,574,515 368,237,363 243,046,517 1,219,921,268 961,355,037Other current financial
assets 914,209 5,535,951 25,011 2,281,558 — — 939,220 7,817,509Other current
non−financial assets 31,292,979 7,342,281 38,792,524 27,188,821 2,380,809 1,462,146 72,466,312 35,993,248Trade and other current
receivables 355,609,508 321,074,432 610,324,178 690,037,361 11,668,702 26,986,447 977,602,388 1,038,098,240Accounts receivable from
related companies 130,673,380 186,356,762 7,215,786 87,128,995 (102,606,574) (253,014,150) 35,282,592 20,471,607Inventories 55,906,768 42,162,603 16,354,914 15,560,743 5,663,862 4,928,358 77,925,544 62,651,704Current tax assets 85,450,395 91,104,281 35,751,363 25,277,659 20,625,926 21,605,401 141,827,684 137,987,341
Non−current assetsclassified as held forsale and discontinuedoperations — — — — — 73,893,290 — 73,893,290
NON−CURRENTASSETS 6,154,273,5625,808,436,9264,778,151,0884,606,429,950 275,481,095 252,710,255 11,207,905,74410,667,577,131
Other non−currentfinancial assets 13,598,337 28,295,886 2,826,723 5,211,606 20,930,001 29,461,230 37,355,061 62,968,722
Other non−currentnon−financial assets 28,731,435 31,459,012 80,741,831 70,535,341 27,842 1,741,942 109,501,108 103,736,295
Non−current receivables 175,400,312 139,301,288 267,256,936 179,381,740 671,202 884,932 443,328,450 319,567,960Non−current accounts
receivable from relatedcompanies (1,863,216) 764,220 117,946 324,864 1,745,270 (1,089,084) — —
Investments accounted forusing the equitymethod 591,668,155 591,361,178 503,610,981 546,884,644(1,082,085,874)(1,124,144,170) 13,193,262 14,101,652
Intangible assets otherthan goodwill 35,332,818 31,398,642 1,417,846,0701,405,434,608 14,219,326 15,753,155 1,467,398,214 1,452,586,405
Goodwill 106,399,041 97,673,241 129,382,377 130,262,504 1,240,622,708 1,249,086,179 1,476,404,126 1,477,021,924Property, plant, and
equipment, net 5,068,294,0244,739,297,0942,180,696,4702,017,266,712 (6,259,488) (4,623,151) 7,242,731,006 6,751,940,655Investment property — — — — 38,055,889 33,019,154 38,055,889 33,019,154Deferred tax assets 136,712,656 148,886,365 195,671,754 251,127,931 47,554,218 52,620,068 379,938,628 452,634,364
TOTAL ASSETS 7,366,858,8846,872,747,2415,785,560,6855,761,479,602 581,451,183 371,618,264 13,733,870,75213,005,845,107
F−115

Table of Contents
Generation Distribution Eliminations and Others Total12−31−2011
ThCh$12−31−2010
ThCh$12−31−2011
ThCh$12−31−2010
ThCh$12−31−2011
ThCh$12−31−2010
ThCh$12−31−2011
ThCh$12−31−2010
ThCh$LIABILITIES AND
EQUITY
CURRENTLIABILITIES 1,150,249,282 1,143,674,971 1,394,053,750 1,298,274,817 (83,769,398) (34,672,303) 2,460,533,634 2,407,277,486
Other current financialliabilities 365,375,002 315,103,380 292,160,116 284,864,090 14,547,220 65,630,548 672,082,338 665,598,018
Trade and other currentpayables 380,701,745 417,077,978 774,128,579 714,667,656 80,234,135 92,744,364 1,235,064,459 1,224,489,998
Accounts payable torelated companies 234,167,088 288,461,159 126,083,948 141,795,739 (203,073,399)(282,054,639) 157,177,637 148,202,260
Other short−termprovisions 36,030,224 43,331,481 43,227,192 51,478,884 20,445,238 20,638,871 99,702,654 115,449,236
Current tax liabilities 122,601,990 69,759,646 110,935,913 75,509,486 2,315,339 2,397,523 235,853,242 147,666,655Current provisions for
employee benefits — 2,703,107 — 2,690,108 — 57,167 — 5,450,382Other current
non−financial liabilities 11,373,233 7,238,220 47,518,002 27,268,854 1,762,069 1,283,474 60,653,304 35,790,548
Liabilities associated withnon−current assetsclassified as held forsale and discontinuedoperations — — — — — 64,630,389 — 64,630,389
NON−CURRENTLIABILITIES 2,231,327,095 2,110,719,491 1,572,059,394 1,545,885,669 573,796,771 427,934,505 4,377,183,260 4,084,539,665
Other non−currentfinancial liabilities 1,755,575,529 1,621,961,525 952,894,143 831,035,287 562,885,621 561,959,635 3,271,355,293 3,014,956,447
Other non−currentpayables 243,234 13,548,800 14,060,817 23,380,657 556 307,255 14,304,607 37,236,712
Accounts payable torelated companies 81,953 1,163,160 — 147,930,726 (81,953) (148,009,596) — 1,084,290
Other long−termprovisions 20,833,139 67,038,203 181,636,893 158,484,126 103,609 — 202,573,641 225,522,329
Deferred tax liabilities 341,568,310 349,429,640 162,528,439 200,477,944 4,341,506 6,015,994 508,438,255 555,923,578Non−current provisions for
employee benefits 36,504,909 27,147,186 234,826,662 181,236,136 6,194,442 7,435,653 277,526,013 215,818,975Other non−current
non−financial liabilities 76,520,021 30,430,977 26,112,440 3,340,793 352,990 225,564 102,985,451 33,997,334
EQUITY 3,985,282,507 3,618,352,778 2,819,447,541 2,917,319,116 91,423,809 (21,643,938) 6,896,153,857 6,514,027,956Equity attributable to
owners of parent 3,985,282,507 3,618,352,778 2,819,447,541 2,917,319,116 91,423,809 (21,643,938) 3,895,728,606 3,735,544,636Issued capital 1,752,890,037 1,830,431,254 1,010,886,630 1,088,609,246 61,106,168 (94,157,665) 2,824,882,835 2,824,882,835Retained earnings 1,838,419,172 1,566,278,776 957,047,345 1,318,048,927 (562,497,637)(780,638,194) 2,232,968,880 2,103,689,509Share premium — — — — 158,759,648 158,759,648 158,759,648 158,759,648Other reserves 393,973,298 221,642,748 851,513,566 510,660,943 434,055,630 694,392,273 (1,320,882,757)(1,351,787,356)
Non−controlling interests — — — — — — 3,000,425,251 2,778,483,320
Total Liabilities andEquity 7,366,858,884 6,872,747,241 5,785,560,685 5,761,479,602 581,451,182 371,618,264 13,733,870,75213,005,845,107
F−116

Table of Contents
Generation Distribution Eliminations and Others Total12−31−2011 12−31−2010 12−31−2009 12−31−2011 12−31−2010 12−31−2009 12−31−2011 12−31−2010 12−31−2009 12−31−2011 12−31−2010 12−31−2009
STATEMENT OF COMPREHENSIVE INCOME ThCh$ ThCh$ ThCh$ ThCh$ ThCh$ ThCh$ ThCh$ ThCh$ ThCh$ ThCh$ ThCh$ ThCh$REVENUES 2,700,026,218 2,780,604,080 2,708,357,655 4,447,427,469 4,392,625,917 4,240,401,202 (612,573,343)(609,648,884)(476,703,204) 6,534,880,344 6,563,581,113 6,472,055,653Sales 2,681,583,403 2,735,336,937 2,692,140,931 4,187,214,704 4,053,333,247 3,892,291,952 (614,546,018)(609,440,360)(471,149,268) 6,254,252,089 6,179,229,824 6,113,283,615Energy sales 2,587,301,858 2,599,487,673 2,570,529,382 3,830,011,900 3,754,753,999 3,642,828,755 (612,017,484)(700,516,755)(634,212,253) 5,805,296,274 5,653,724,917 5,579,145,884Other sales 10,642,489 15,262,308 6,009,988 8,391,707 9,220,770 12,431,451 12,711,978 26,087,696 38,047,820 31,746,174 50,570,774 56,489,259Other services rendered 83,639,056 120,586,956 115,601,561 348,811,097 289,358,478 237,031,746 (15,240,512) 64,988,699 125,015,165 417,209,641 474,934,133 477,648,472
Other operating income 18,442,815 45,267,143 16,216,724 260,212,765 339,292,670 348,109,250 1,972,675 (208,524) (5,553,936) 280,628,255 384,351,289 358,772,038
RAW MATERIALS AND CONSUMABLES USED (1,272,985,092)(1,300,760,188)(1,058,410,593)(2,904,965,972)(2,861,855,754)(2,687,937,114) 639,516,335 640,969,688 535,754,130 (3,538,434,729)(3,521,646,254)(3,210,593,577)Energy purchases (272,699,080) (264,194,654) (197,058,728)(2,099,527,411)(1,988,241,950)(1,958,392,871) 609,408,193 697,721,968 635,253,374 (1,762,818,298)(1,554,714,636)(1,520,198,225)Fuel consumption (742,631,157) (672,030,596) (580,234,432) — — — (8,206) (7,507) (3,181) (742,639,363) (672,038,103) (580,237,613)Transport expenses (210,422,135) (233,134,592) (177,886,470) (228,281,706) (216,929,666) (158,940,229) 44,712,720 44,081,166 20,538,816 (393,991,121) (405,983,092) (316,287,883)Other variable supplies and services (47,232,720) (131,400,346) (103,230,963) (577,156,855) (656,684,138) (570,604,014) (14,596,372)(100,825,939)(120,034,879) (638,985,947) (888,910,423) (793,869,856)
CONTRIBUTION MARGIN 1,427,041,126 1,479,843,892 1,649,947,062 1,542,461,497 1,530,770,163 1,552,464,088 26,942,992 31,320,804 59,050,926 2,996,445,615 3,041,934,859 3,261,462,076
Other work performed by entity and capitalized 6,404,803 688,024 731,901 39,331,002 34,742,737 32,998,618 4,437,307 9,438,604 — 50,173,112 44,869,365 33,730,519Employee benefits expense (84,624,505) (76,018,545) (69,577,977) (252,417,780) (215,810,871) (216,622,884) (41,509,841) (82,848,597) (84,201,584) (378,552,126) (374,678,013) (370,402,445)Other expense (148,540,710) (109,570,881) (118,108,486) (389,777,503) (366,421,018) (367,766,183) (2,380,185) 25,557,129 28,185,472 (540,698,398) (450,434,770) (457,689,197)
GROSS OPERATING RESULT 1,200,280,714 1,294,942,490 1,462,992,500 939,597,216 983,281,011 1,001,073,639 (12,509,727) (16,532,060) 3,034,814 2,127,368,203 2,261,691,441 2,467,100,953
Depreciation, amortization, and impairment losses (205,906,910) (244,848,894) (270,584,246) (347,074,905) (291,545,800) (239,656,554) (8,075,680) (20,996,010) (29,414,684) (561,057,495) (557,390,704) (539,655,484)
OPERATING INCOME 994,373,804 1,050,093,596 1,192,408,254 592,522,311 691,735,211 761,417,085 (20,585,407) (37,528,070) (26,379,870) 1,566,310,708 1,704,300,737 1,927,445,469
FINANCIAL RESULTS (96,533,304) (139,201,816) (186,313,678) (114,211,524) (94,631,362) (99,796,594) (25,840,179) (36,771,357) (23,145,874) (236,585,007) (270,604,535) (309,256,146)Financial income 88,970,416 27,878,995 40,841,166 127,716,519 132,691,391 117,121,114 16,925,934 10,666,562 1,708,125 233,612,869 171,236,948 159,670,405Financial costs (187,258,748) (178,031,427) (239,569,394) (242,555,022) (227,390,652) (226,454,904) (35,597,593) (32,936,172) (16,448,329) (465,411,363) (438,358,251) (482,472,627)Gains (losses) from indexed assets and liabilities (5,369,555) (2,885,747) 9,009,669 42,067 153,805 458,162 (19,764,715) (12,323,764) 12,313,498 (25,092,203) (15,055,706) 21,781,329Foreign currency exchange differences 7,124,583 13,836,363 3,404,881 584,912 (85,906) 9,079,034 12,596,195 (2,177,983) (20,719,168) 20,305,690 11,572,474 (8,235,253)Gains 36,535,322 59,331,363 71,795,866 4,951,758 7,255,856 18,584,732 39,385,744 24,744,149 (8,365,473) 80,872,824 91,331,368 82,015,125Losses (29,410,739) (45,495,000) (68,390,985) (4,366,846) (7,341,762) (9,505,698) (26,789,549) (26,922,132) (12,353,695) (60,567,134) (79,758,894) (90,250,378)
Share of profit (loss) of associates accounted for usingthe equity method 8,215,763 811,855 2,233,946 468 911 82,758,254 249,673 202,973 (82,756,621) 8,465,904 1,015,739 2,235,579
Gains (losses) from other investments 1,038,160 234,251 (55,494) 70 — 82,850 — 38,435 110,587 1,038,230 272,686 137,943Gains (losses) from sale of property, plant, and
equipment 975,577 1,631,416 64,430 (313,790) 1,365,276 24,938,953 (6,514,311) 8,714,057 25,498,952 (5,852,524) 11,710,749 50,502,335
NET INCOME BEFORE TAX 908,070,000 913,569,302 1,008,337,458 477,997,535 598,470,036 769,400,548 (52,690,224) (65,343,962)(106,672,826) 1,333,377,311 1,446,695,376 1,671,065,180
Income tax (255,341,927) (197,493,560) (201,746,950) (200,528,618) (141,600,737) (178,201,978) (4,966,146) (6,912,671) 20,211,318 (460,836,691) (346,006,968) (359,737,610)
NET INCOME AFTER TAX FROM CONTINUINGOPERATIONS 652,728,073 716,075,742 806,590,508 277,468,917 456,869,299 591,198,570 (57,656,370) (72,256,633) (86,461,508) 872,540,620 1,100,688,408 1,311,327,570
Net income from discontinued operations — — — — — — — — — — — —NET INCOME 652,728,073 716,075,742 806,590,508 277,468,917 456,869,299 591,198,570 (57,656,370) (72,256,633) (86,461,508) 872,540,620 1,100,688,408 1,311,327,570
RESULT FOR THE PERIOD 652,728,073 716,075,742 806,590,508 277,468,917 456,869,299 591,198,570 (57,656,370) (72,256,633) (86,461,508) 872,540,620 1,100,688,408 1,311,327,570Owners of parent — — — — — — — — — 375,471,254 486,226,814 660,231,043Non−controlling interests — — — — — — — — — 497,069,366 614,461,594 651,096,527
F−117

Table of Contents
33.3 Countries
Chile Argentina Brazil Colombia Peru Eliminations Total12−31−2011 12−31−2010 12−31−2011 12−31−2010 12−31−2011 12−31−2010 12−31−2011 12−31−2010 12−31−2011 12−31−2010 12−31−2011 12−31−2010 12−31−2011 12−31−2010
Country ThCh$ ThCh$ ThCh$ ThCh$ ThCh$ ThCh$ ThCh$ ThCh$ ThCh$ ThCh$ ThCh$ ThCh$ ThCh$ ThCh$ASSETS
CURRENT ASSETS 1,117,076,586 958,252,718 198,804,567 206,682,679 680,639,175 773,987,829 439,170,846 298,436,755 138,640,932 118,519,262 (48,367,098) (17,611,267) 2,525,965,008 2,338,267,976Cash and cash equivalents 588,127,702 396,117,160 43,522,761 64,001,651 277,962,207 309,608,364 268,253,856 150,969,852 42,054,742 40,658,010 — — 1,219,921,268 961,355,037Other current financial assets 47,504 17,551 143,638 2,271,690 — 5,463,750 699,517 64,518 48,561 — — — 939,220 7,817,509Other current non−financial
assets 8,430,910 2,823,979 2,444,742 3,453,937 43,310,736 24,929,082 13,185,071 1,741,706 5,094,853 3,044,544 — — 72,466,312 35,993,248Trade and other current
receivables 338,292,487 424,328,700 108,345,327 105,722,882 318,551,280 399,849,969 137,785,949 134,933,800 73,975,674 55,329,513 651,671 (82,066,624) 977,602,388 1,038,098,240Accounts receivable from
related companies 49,976,938 9,118,913 34,084,870 20,580,614 — — 30,857 85,521 208,696 124,492 (49,018,769) (9,437,933) 35,282,592 20,471,607Inventories 37,057,881 31,508,007 4,921,951 4,012,205 1,266,810 1,329,912 17,676,019 10,639,048 17,002,883 15,162,532 — — 77,925,544 62,651,704Current tax assets 95,143,164 94,338,408 5,341,278 6,639,700 39,548,142 32,806,752 1,539,577 2,310 255,523 4,200,171 — — 141,827,684 137,987,341
Non−current assets classified asheld for sale anddiscontinued operations — — — — — — — — — — — 73,893,290 — 73,893,290
NON−CURRENT ASSETS 7,893,250,053 7,882,741,067 593,346,110 612,376,604 3,805,276,863 3,724,836,639 2,353,927,049 2,089,588,249 1,246,563,957 1,087,290,030 (4,684,458,288)(4,729,255,458)11,207,905,74410,667,577,131Other non−current financial
assets 32,942,181 57,422,721 161,140 — 27,818 3,352,698 1,214,684 8,267 3,009,238 2,185,036 — — 37,355,061 62,968,722Other non−current non−financial
assets 599,528 1,327,410 1,984,737 10,897,471 106,916,843 89,288,250 — 1,111,481 — — — 1,111,683 109,501,108 103,736,295Non−current receivables 4,531,190 9,751,497 151,690,773 123,872,850 273,379,275 177,122,226 13,727,212 8,821,387 — — — — 443,328,450 319,567,960Non−current accounts receivable
from related companies 6,179,892 5,570,592 — — 44,861,006 36,381,275 — — — — (51,040,898) (41,951,867) — —Investments accounted for using
the equity method 4,681,940,902 4,728,577,212 4,727,255 4,360,892 1,217,587,204 1,231,117,115 76 — 49,887,780 49,494,618 (5,940,949,955)(5,999,448,185) 13,193,262 14,101,652Intangible assets other than
goodwill 40,438,658 43,574,579 3,649,971 3,394,462 1,375,676,408 1,362,506,970 44,330,454 40,486,684 3,302,723 2,623,710 — — 1,467,398,214 1,452,586,405Goodwill 2,312,632 2,311,244 2,357,592 2,453,791 119,058,905 120,673,559 13,209,651 7,348,467 10,361,690 10,502,214 1,329,103,656 1,333,732,649 1,476,404,126 1,477,021,924Property, plant, and equipment 2,998,303,344 2,907,392,986 424,077,441 435,556,490 479,342,553 502,536,126 2,184,994,520 1,908,861,856 1,178,479,794 1,021,665,793 (22,466,646) (24,072,596) 7,242,731,006 6,751,940,655Investment property 38,055,889 33,019,154 — — — — — — — — — — 38,055,889 33,019,154Deferred tax assets 87,945,837 93,793,672 4,697,201 31,840,648 188,426,851 201,858,420 96,450,452 122,950,107 1,522,732 818,659 895,555 1,372,858 379,938,628 452,634,364
TOTAL ASSETS 9,010,326,640 8,840,993,785 792,150,677 819,059,282 4,485,916,038 4,498,824,468 2,793,097,895 2,388,025,004 1,385,204,889 1,205,809,292 (4,732,825,387)(4,746,866,725)13,733,870,75213,005,845,107
F−118

Table of Contents
Country Chile Argentina Brazil Colombia Peru Eliminations Total12−31−2011 12−31−2010 12−31−2011 12−31−2010 12−31−2011 12−31−2010 12−31−2011 12−31−2010 12−31−2011 12−31−2010 12−31−2011 12−31−2010 12−31−2011 12−31−2010
ThCh$ ThCh$ ThCh$ ThCh$ ThCh$ ThCh$ ThCh$ ThCh$ ThCh$ ThCh$ ThCh$ ThCh$ ThCh$ ThCh$LIABILITIES AND EQUITY
CURRENT LIABILITIES 661,869,058 647,462,363 494,783,567 368,365,266 650,237,150 749,685,522 483,448,241 432,517,038 170,828,751 122,675,915 (633,131) 86,571,381 2,460,533,635 2,407,277,486Other current financial liabilities 88,087,416 57,353,811 105,336,295 91,305,044 288,730,920 316,931,058 124,904,402 138,102,310 65,023,305 61,905,795 — — 672,082,338 665,598,018Trade and other current payables 405,601,668 397,291,875 283,219,858 188,824,968 234,837,848 350,493,006 223,557,756 242,087,064 68,645,529 46,211,217 19,201,800 (418,132) 1,235,064,459 1,224,489,998Accounts payable to related
companies 48,929,238 95,959,740 45,686,586 21,522,018 34,092,017 22,670,347 51,713,966 (8,763,202) 1,068,536 (5,545,768) (24,312,705) 22,359,124 157,177,638 148,202,260Other short−term provisions 54,333,202 61,952,297 25,324,807 31,334,089 6,801,936 9,290,490 10,860 1,498,668 8,754,075 11,373,692 4,477,774 — 99,702,654 115,449,236Current tax liabilities 58,625,870 26,985,525 12,379,051 18,739,444 67,476,356 45,603,630 76,893,506 50,694,810 20,478,459 5,643,246 — — 235,853,242 147,666,655Current provisions for employee
benefits — 1,341,781 — 591,831 — — — 3,516,770 — — — — — 5,450,382Other current non−financial
liabilities 6,291,663 6,577,334 22,836,970 16,047,872 18,298,073 4,696,991 6,367,751 5,380,618 6,858,847 3,087,733 — — 60,653,304 35,790,548
Liabilities associated withnon−current assets classified asheld for sale and discontinuedoperations — — — — — — — — — — — 64,630,389 — 64,630,389
NON−CURRENT LIABILITIES 1,819,290,887 1,798,546,677 206,938,488 182,056,288 929,216,917 866,894,226 928,038,093 749,238,211 527,947,698 525,104,242 (34,248,823) (37,299,979) 4,377,183,260 4,084,539,665Other non−current financial
liabilities 1,538,473,627 1,511,148,690 113,544,053 87,795,042 515,352,311 483,293,292 782,142,214 616,376,069 321,843,088 316,343,354 — — 3,271,355,293 3,014,956,447Other non−current payables — 3,595,790 1,146,930 325,183 13,157,677 33,173,070 — 142,669 — — — — 14,304,607 37,236,712Accounts payable to related
companies — — 34,248,823 36,634,177 — 1,750,092 — — — — (34,248,823) (37,299,979) — 1,084,290Other long−term provisions 17,935,877 17,164,654 9,239,778 11,451,261 168,801,883 183,780,246 4,762,542 2,198,153 1,833,561 10,928,015 — — 202,573,641 225,522,329Deferred tax liabilities 204,262,599 222,646,728 13,419,881 21,549,260 67,691,941 61,907,742 19,717,371 52,263,418 203,346,463 197,556,430 — — 508,438,255 555,923,578Non−current provisions for
employee benefits 35,817,248 33,170,562 7,627,051 1,400,727 149,353,832 102,989,784 84,727,882 78,257,902 — — — — 277,526,013 215,818,975Other non−current non−financial
liabilities 22,801,536 10,820,253 27,711,972 22,900,638 14,859,273 — 36,688,084 — 924,586 276,443 — — 102,985,451 33,997,334
EQUITY 6,529,166,695 6,394,984,745 90,428,622 268,637,728 2,906,461,9712,882,244,7201,381,611,5611,206,269,755 686,428,440 558,029,135 (4,697,943,433)(4,796,138,127) 6,896,153,857 6,514,027,956Equity attributable to owners of
parent 6,529,166,695 6,394,984,745 90,428,622 268,637,728 2,906,461,9712,882,244,7201,381,611,5611,206,269,755 686,428,440 558,029,135 (4,697,943,433)(4,796,138,127) 3,895,728,606 3,735,544,636Issued capital 5,517,944,809 5,504,650,136 230,798,614 233,455,382 1,768,841,5361,016,335,188 150,811,424 147,297,657 197,139,383 198,134,490 (5,040,652,931)(4,274,990,018) 2,824,882,835 2,824,882,835Retained earnings 2,728,371,595 2,687,545,567 (99,901,666) 77,431,069 459,494,106 446,813,310 125,770,175 274,298,955 72,384,456 56,504,426 (1,053,149,787)(1,438,903,818) 2,232,968,880 2,103,689,509Share premium 158,759,648 158,759,648 — — — — — — — — — — 158,759,648 158,759,648Other reserves (1,875,909,357)(1,955,970,606)(40,468,326) (42,248,723) 678,126,329 1,419,096,2221,105,029,962 784,673,143 416,904,601 303,390,219 1,395,859,285 917,755,709 (1,320,882,757) (1,351,787,356)
Non−controlling interests — — — — — — — — — — — — 3,000,425,251 2,778,483,320
Total liabilities and equity 9,010,326,640 8,840,993,785 792,150,677 819,059,282 4,485,916,0384,498,824,4682,793,097,8952,388,025,0041,385,204,8891,205,809,292(4,732,825,387)(4,746,866,725)13,733,870,752 13,005,845,107
F−119

Table of Contents
Country Chile Argentina Brazil Colombia12−31−2011 12−31−2010 12−31−2009 12−31−2011 12−31−2010 12−31−2009 12−31−2011 12−31−2010 12−31−2009 12−31−2011 12−31−2010 12−31−2009
ThCh$ ThCh$ ThCh$ ThCh$ ThCh$ ThCh$ ThCh$ ThCh$ ThCh$ ThCh$ ThCh$ ThCh$STATEMENT OF COMPREHENSIVE INCOME
REVENUES 2,124,479,297 2,085,557,501 2,283,457,941 675,647,122 658,417,051 637,839,445 2,165,287,761 2,230,116,193 1,979,203,998 1,113,791,686 1,163,978,952 1,096,256,547Sales 2,097,527,758 2,041,203,346 2,260,373,406 667,299,420 644,085,670 624,398,698 1,970,909,825 1,953,154,510 1,732,004,318 1,080,920,739 1,135,970,285 1,040,262,693Energy sales 1,961,366,637 1,868,868,808 2,071,597,022 641,615,807 614,505,180 590,796,228 1,787,773,720 1,778,434,279 1,564,412,704 991,306,129 1,019,682,987 948,485,479Other sales 21,888,297 37,515,316 42,402,319 — — (49,808) 6,072,128 3,332,080 4,180,089 3,289,633 6,557,919 6,515,455Other services rendered 114,272,824 134,819,222 146,374,065 25,683,613 29,580,490 33,652,278 177,063,977 171,388,151 163,411,525 86,324,977 109,729,379 85,261,759Other operating income 26,951,539 44,354,155 23,084,535 8,347,702 14,331,381 13,440,747 194,377,936 276,961,683 247,199,680 32,870,947 28,008,667 55,993,854
RAW MATERIALS AND CONSUMABLES USED (1,280,894,315)(1,157,432,602)(1,131,384,329)(457,898,841)(413,059,847)(365,964,562)(1,228,453,536)(1,308,455,877)(1,074,015,467) (385,326,627) (463,847,068) (428,527,683)Energy purchases (747,064,363) (542,253,232) (581,492,020)(153,569,548)(148,902,836)(160,131,967) (587,111,958) (543,260,558) (443,577,232) (186,337,063) (246,229,847) (229,843,920)Fuel consumption (350,733,784) (318,644,651) (345,815,766)(283,048,981)(242,853,893)(180,160,003) (35,498,349) (37,260,897) 6,826,322 (23,946,682) (27,780,401) (20,572,023)Transport expenses (146,853,453) (183,181,403) (107,329,158) (9,143,907) (4,875,869) (6,886,114) (107,475,644) (93,660,230) (82,792,555) (114,302,814) (111,637,522) (105,632,478)Other variable supplies and services (36,242,715) (113,353,316) (96,747,385) (12,136,405) (16,427,249) (18,786,478) (498,367,585) (634,274,192) (554,472,002) (60,740,068) (78,199,298) (72,479,262)
CONTRIBUTION MARGIN 843,584,982 928,124,899 1,152,073,612 217,748,281 245,357,204 271,874,883 936,834,225 921,660,316 905,188,531 728,465,059 700,131,884 667,728,864
Other work performed by entity and capitalized 11,168,239 11,962,653 2,666,652 12,146,533 8,296,765 8,057,055 18,130,297 18,128,254 17,007,228 6,497,714 4,423,015 3,003,205Employee benefits expense (105,910,635) (113,164,815) (110,843,668)(106,287,626) (79,533,998) (79,385,952) (110,708,252) (109,354,257) (108,515,145) (48,007,413) (51,541,615) (47,341,752)Other expenses (113,660,233) (100,976,501) (106,575,741) (88,827,726) (89,055,759) (77,076,137) (161,072,702) (148,686,023) (158,794,504) (146,263,633) (78,880,441) (75,624,710)
GROSS OPERATING RESULTS 635,182,353 725,946,236 937,320,855 34,779,462 85,064,212 123,469,849 683,183,568 681,748,290 654,886,110 540,691,727 574,132,843 547,765,607
Depreciation, amortization, and impairment losses (123,699,667) (119,048,628) (194,587,688)(138,094,097) (34,724,329) (42,541,505) (131,553,418) (229,368,430) (145,172,290) (101,908,200) (102,190,376) (96,735,454)
OPERATING INCOME 511,482,686 606,897,608 742,733,167 (103,314,635) 50,339,883 80,928,344 551,630,150 452,379,860 509,713,820 438,783,527 471,942,467 451,030,153
FINANCIAL RESULTS (78,797,719) (106,356,565) (114,219,912) (31,563,414) (15,788,697) (40,008,868) (32,405,059) (64,838,758) (69,697,374) (76,360,671) (62,523,560) (72,011,415)Financial income 34,484,561 15,604,598 26,321,994 13,314,838 10,926,110 9,381,341 173,831,176 132,197,987 103,326,143 11,407,941 11,883,669 20,075,886Financial costs (93,072,101) (109,360,408) (135,713,458) (36,394,214) (34,924,333) (32,076,508) (225,571,907) (193,320,965) (187,048,645) (87,553,973) (74,211,667) (92,155,200)Gains (losses) from indexed assets and liabilities (25,092,203) (15,055,706) 21,781,329 — — — — — — — — —Foreign currency exchange differences 4,882,024 2,454,951 (26,609,777) (8,484,038) 8,209,526 (17,313,701) 19,335,672 (3,715,780) 14,025,128 (214,639) (195,562) 67,899Gains 53,545,105 38,536,192 34,338,086 6,006,240 20,715,091 3,564,040 29,865,459 30,931,909 47,716,990 738,510 963,520 1,887,294Losses (48,663,081) (36,081,241) (60,947,863) (14,490,278) (12,505,565) (20,877,741) (10,529,787) (34,647,689) (33,691,862) (953,149) (1,159,082) (1,819,395)
Share of profit (loss) of associates accounted for usingthe equity method 8,215,729 811,657 (8,074,230) 250,141 203,884 374,621 — — — — — —
Negative consolidation difference — — — — — — — — — — — —
Gains (losses) from other investments 1,053,408 1,626,786 172,804 498,877 1,596,643 2,683,755 — 29,251 — 70 — (34,772)Gains (losses) from sale of property, plant, and
equipment (6,039,997) 8,825,168 37,360,860 — — — — (34,754) 486,834 (230,878) 2,515,018 12,851,414Other expenses distinct from operating expenses — — — — — — — — — — — —
NET INCOME BEFORE TAX 435,914,107 511,804,654 657,972,689 (134,129,031) 36,351,713 43,977,852 519,225,091 387,535,599 440,503,280 362,192,048 411,933,925 391,835,380
Income tax (110,530,698) (91,503,756) (68,971,765) (34,044,480) (13,131,879) (15,197,010) (129,039,820) (66,998,716) (107,407,226) (142,998,659) (134,315,662) (127,250,804)
NET INCOME AFTER TAX FROM CONTINUINGOPERATIONS 325,383,409 420,300,898 589,000,924 (168,173,511) 23,219,834 28,780,842 390,185,271 320,536,883 333,096,054 219,193,389 277,618,263 264,584,576
Net income from discontinued operations — — — — — — — — — — — —NET INCOME 325,383,409 420,300,898 589,000,924 (168,173,511) 23,219,834 28,780,842 390,185,271 320,536,883 333,096,054 219,193,389 277,618,263 264,584,576
RESULT FOR THE PERIOD 325,383,409 420,300,898 589,000,924 (168,173,511) 23,219,834 28,780,842 390,185,271 320,536,883 333,096,054 219,193,389 277,618,263 264,584,576Owners of parent — — — — — — — — — — — —Non−controlling interests — — — — — — — — — — — —
Country Peru Eliminations Total12−31−2011 12−31−2010 12−31−200912−31−201112−31−201012−31−2009 12−31−2011 12−31−2010 12−31−2009
ThCh$ ThCh$ ThCh$ ThCh$ ThCh$ ThCh$ ThCh$ ThCh$ ThCh$STATEMENT OF COMPREHENSIVE INCOME
REVENUES 458,047,567 429,229,748 479,144,395 (2,373,089) (3,718,332) (3,846,673)6,534,880,344 6,563,581,113 6,472,055,653Sales 439,967,436 408,534,345 460,091,173 (2,373,089) (3,718,332) (3,846,673)6,254,252,089 6,179,229,824 6,113,283,615Energy sales 423,233,981 372,233,663 403,854,451 — — — 5,805,296,274 5,653,724,917 5,579,145,884Other sales 565,295 4,375,367 5,012,398 (69,179) (1,209,908) (1,571,194) 31,746,174 50,570,774 56,489,259Other services rendered 16,168,160 31,925,315 51,224,324 (2,303,910) (2,508,424) (2,275,479) 417,209,641 474,934,133 477,648,472Other operating income 18,080,131 20,695,403 19,053,222 — — — 280,628,255 384,351,289 358,772,038
RAW MATERIALS AND CONSUMABLES USED (185,931,510)(180,533,345)(213,585,176) 70,100 1,682,485 2,883,640(3,538,434,729)(3,521,646,254)(3,210,593,577)Energy purchases (88,735,366)(74,068,163)(105,153,086) — — — (1,762,818,298)(1,554,714,636)(1,520,198,225)Fuel consumption (49,411,567)(45,498,261)(40,516,143) — — — (742,639,363) (672,038,103) (580,237,613)Transport expenses (16,215,303)(12,628,068)(13,647,578) — — — (393,991,121) (405,983,092) (316,287,883)Other variable supplies and services (31,569,274)(48,338,853)(54,268,369) 70,100 1,682,485 2,883,640 (638,985,947) (888,910,423) (793,869,856)
CONTRIBUTION MARGIN 272,116,057 248,696,403 265,559,219 (2,302,989) (2,035,847) (963,033)2,996,445,615 3,041,934,859 3,261,462,076
Other work performed by entity and capitalized 2,230,329 2,058,678 2,996,379 — — — 50,173,112 44,869,365 33,730,519Employee benefits expense (7,638,200) (21,083,328)(24,315,928) — — — (378,552,126) (374,678,013) (370,402,445)Other expenses (33,100,304)(33,890,176)(40,566,405) 2,226,200 1,054,130 948,300 (540,698,398) (450,434,770) (457,689,197)
GROSS OPERATING RESULTS 233,607,882 195,781,577 203,673,265 (76,789) (981,717) (14,733)2,127,368,203 2,261,691,441 2,467,100,953
Depreciation, amortization, and impairment losses (59,219,178)(60,339,333)(60,618,547) (6,582,935)(11,719,608) — (561,057,495) (557,390,704) (539,655,484)
OPERATING INCOME 174,388,704 135,442,244 143,054,718 (6,659,724)(12,701,325) (14,733)1,566,310,708 1,704,300,737 1,927,445,469
FINANCIAL RESULTS (22,714,456)(25,742,132)(34,167,002) 5,256,312 4,645,177 20,848,425 (236,585,007) (270,604,535) (309,256,146)Financial income 2,723,717 2,116,913 3,631,106 (2,149,364) (1,492,329) (3,066,065) 233,612,869 171,236,948 159,670,405Financial costs (24,968,532)(28,154,018)(38,544,881) 2,149,364 1,613,140 3,066,065 (465,411,363) (438,358,251) (482,472,627)Gains (losses) from indexed assets and liabilities — — — — — — (25,092,203) (15,055,706) 21,781,329Foreign currency exchange differences (469,641) 294,973 746,773 5,256,312 4,524,366 20,848,425 20,305,690 11,572,474 (8,235,253)Gains 702,589 1,553,835 2,333,966 (9,985,079) (1,369,179) (7,825,251) 80,872,824 91,331,368 82,015,125Losses (1,172,230) (1,258,862) (1,587,193) 15,241,391 5,893,545 28,673,676 (60,567,134) (79,758,894) (90,250,378)
Share of profit (loss) of associates accounted for usingthe equity method — — 9,935,172 34 198 16 8,465,904 1,015,739 2,235,579

Negative consolidation difference — — — — — — — — —
Gains (losses) from other investments — — — (514,125) (2,979,994) (2,683,844) 1,038,230 272,686 137,943Gains (losses) from sale of property, plant, and
equipment 418,351 405,317 (196,773) — — — (5,852,524) 11,710,749 50,502,335Other expenses distinct from operating expenses — — — — — — — — —
NET INCOME BEFORE TAX 152,092,599 110,105,429 118,626,115 (1,917,503)(11,035,944) 18,149,864 1,333,377,311 1,446,695,376 1,671,065,180
Income tax (44,223,034)(40,056,955)(40,910,805) — — — (460,836,691) (346,006,968) (359,737,610)
NET INCOME AFTER TAX FROM CONTINUINGOPERATIONS 107,869,565 70,048,474 77,715,310 (1,917,503)(11,035,944) 18,149,864 872,540,620 1,100,688,408 1,311,327,570
Net income from discontinued operations — — — — —NET INCOME 107,869,565 70,048,474 77,715,310 (1,917,503)(11,035,944) 18,149,864 872,540,620 1,100,688,408 1,311,327,570
RESULT FOR THE PERIOD 107,869,565 70,048,474 77,715,310 (1,917,503)(11,035,944) 18,149,864 872,540,620 1,100,688,408 1,311,327,570Owners of parent — — — — — — 375,471,254 486,226,814 660,231,043Non−controlling interests — — — — — — 497,069,366 614,461,594 651,096,527
F−120

Table of Contents
33.4 Generation and distribution by country
a) Generation
Line of Business GenerationCountry Chile Argentina Brazil Colombia Peru Eliminations Total
12−31−2011 12−31−2010 12−31−2011 12−31−2010 12−31−2011 12−31−2010 12−31−2011 12−31−2010 12−31−2011 12−31−2010 12−31−2011 12−31−2010 12−31−2011 12−31−2010ThCh$ ThCh$ ThCh$ ThCh$ ThCh$ ThCh$ ThCh$ ThCh$ ThCh$ ThCh$ ThCh$ ThCh$ ThCh$ ThCh$
ASSETSCURRENT ASSETS 581,738,393 581,919,944 113,950,708 96,454,500 229,070,896 206,821,621 239,044,005 154,997,283 75,650,050 50,330,357 (26,868,729) (26,213,389)1,212,585,323 1,064,310,315Cash and cash equivalents 230,289,585 225,658,998 22,383,610 18,626,377 131,040,180 77,999,226 136,260,140 74,583,887 32,764,569 13,865,517 — — 552,738,084 410,734,005Other current financial assets 47,504 17,551 143,638 — — 5,463,750 674,506 54,650 48,561 — — — 914,209 5,535,951Other current non−financial
assets 5,388,772 1,073,419 1,197,748 2,254,847 14,283,730 808,494 7,964,428 1,370,458 2,458,301 1,835,063 — — 31,292,979 7,342,281Trade and other current
receivables 175,085,843 150,897,103 54,090,162 53,364,468 63,940,752 83,976,499 45,507,596 41,680,862 16,985,155 11,027,554 — (19,872,054) 355,609,508 321,074,432Accounts receivable from other
related companies 58,683,378 103,058,701 33,441,555 20,203,295 19,803,730 28,663,608 35,104,241 32,368,651 10,509,205 8,403,843 (26,868,729) (6,341,335) 130,673,380 186,356,762Inventories 29,481,511 24,443,037 1,783,282 1,750,879 2,504 22,842 11,993,970 4,936,465 12,645,501 11,009,380 — — 55,906,768 42,162,603Current tax assets 82,761,800 76,771,135 910,713 254,634 — 9,887,202 1,539,124 2,310 238,758 4,189,000 — — 85,450,395 91,104,281
Non−current assets classified asheld for sale anddiscontinued operations — — — — — — — — — — — — — —
NON−CURRENT ASSETS 4,058,185,785 3,989,974,642 319,979,207 290,297,224 600,244,367 614,488,434 1,393,219,292 1,203,713,202 812,558,136 730,619,632 (1,029,913,225)(1,020,656,208)6,154,273,562 5,808,436,926Other non−current financial
assets 12,014,822 27,935,909 161,140 — — — 1,205,585 — 216,790 359,977 — — 13,598,337 28,295,886Other non−current
non−financial assets 342,343 146,349 1,099,011 10,203,998 27,290,081 19,997,184 — 1,111,481 — — — — 28,731,435 31,459,012Non−current receivables 160,518 1,820,235 150,312,091 123,377,243 21,685,968 11,129,694 3,241,735 2,974,116 — — — — 175,400,312 139,301,288Non−current accounts
receivable from relatedcompanies 6,179,892 5,570,592 — — 42,997,790 37,063,260 — — — — (51,040,898) (41,869,632) (1,863,216) 764,220
Investments accounted for usingthe equity method 1,594,961,765 1,591,313,598 3,428,479 3,094,078 10,801,536 10,950,060 — — 49,887,780 49,494,618 (1,067,411,405)(1,063,491,176) 591,668,155 591,361,178
Intangible assets other thangoodwill 11,005,836 9,638,098 176,228 190,799 1,410,902 972,900 22,281,991 20,247,206 457,861 349,639 — — 35,332,818 31,398,642
Goodwill 14,024 12,636 2,357,592 2,453,791 — — 5,126,657 — 10,361,690 10,502,214 88,539,078 84,704,600 106,399,041 97,673,241Property, plant, and equipment 2,400,516,617 2,328,158,165 157,747,465 136,585,507 456,994,530 480,313,680 1,302,924,129 1,125,145,217 750,111,283 669,094,525 — — 5,068,294,024 4,739,297,094Investment property — — — — — — — — — — — — — —Deferred tax assets 32,989,968 25,379,060 4,697,201 14,391,808 39,063,560 54,061,656 58,439,195 54,235,182 1,522,732 818,659 — — 136,712,656 148,886,365
TOTAL ASSETS 4,639,924,178 4,571,894,586 433,929,915 386,751,724 829,315,263 821,310,055 1,632,263,297 1,358,710,485 888,208,186 780,949,989 (1,056,781,954)(1,046,869,597)7,366,858,885 6,872,747,241
F−121

Table of Contents
Line of Business GenerationCountry Chile Argentina Brazil Colombia Peru Eliminations Total
12−31−2011 12−31−2010 12−31−2011 12−31−2010 12−31−2011 12−31−2010 12−31−2011 12−31−2010 12−31−2011 12−31−2010 12−31−2011 12−31−2010 12−31−2011 12−31−2010ThCh$ ThCh$ ThCh$ ThCh$ ThCh$ ThCh$ ThCh$ ThCh$ ThCh$ ThCh$ ThCh$ ThCh$ ThCh$ ThCh$
LIABILITIES AND EQUITYCURRENT LIABILITIES 419,861,754 461,971,755 184,089,684 151,057,167 223,439,239 182,940,166 220,413,976 286,630,051 77,444,300 61,493,965 25,000,330 (418,133)1,150,249,283 1,143,674,971Other current financial liabilities 73,513,845 43,626,925 82,987,086 79,751,906 62,027,186 64,363,398 113,869,956 87,860,103 32,976,929 39,501,048 — — 365,375,002 315,103,380Trade and other current payables 210,953,110 221,957,794 47,852,899 28,920,947 47,171,805 63,002,748 50,897,328 86,644,371 23,834,560 16,970,251 (7,957) (418,133) 380,701,745 417,077,978Accounts payable to related
companies 69,582,013 142,252,923 43,569,836 28,374,815 81,664,568 37,105,842 14,328,510 80,508,993 13,875 218,586 25,008,287 — 234,167,089 288,461,159Other short−term provisions 29,277,728 35,783,147 3,901,399 2,553,179 — 1,874,736 10,860 22,520 2,840,237 3,097,899 — — 36,030,224 43,331,481Current tax liabilities 31,286,802 14,656,865 5,362,401 11,212,408 30,425,114 16,593,444 40,779,406 26,604,320 14,748,267 692,609 — — 122,601,990 69,759,646Current provisions for employee
benefits — — — — — — — 2,703,107 — — — — — 2,703,107Other current non−financial
liabilities 5,248,256 3,694,101 416,063 243,912 2,150,566 (2) 527,916 2,286,637 3,030,432 1,013,572 — — 11,373,233 7,238,220
Liabilities associated withnon−current assets classified asheld for sale and discontinuedoperations — — — — — — — — — — — — — —
NON−CURRENT LIABILITIES 1,193,061,174 1,172,214,180 165,441,384 141,817,640 58,875,184 156,436,680 530,859,723 356,958,221 317,338,453 319,926,947 (34,248,823) (36,634,177)2,231,327,095 2,110,719,491Other non−current financial
liabilities 975,588,006 949,189,055 87,602,569 70,465,040 36,725,221 94,332,102 486,420,793 339,291,052 169,238,940 168,684,276 — — 1,755,575,529 1,621,961,525Other non−current payables — 3,288,535 241,287 — 1,947 10,117,596 — 142,669 — — — — 243,234 13,548,800Accounts payable to related
companies 81,953 78,870 34,248,823 36,634,177 — 1,084,290 — — — — (34,248,823) (36,634,177) 81,953 1,163,160Other long−term provisions 10,251,812 9,797,457 — — 8,596,721 46,119,690 316,576 348,770 1,668,030 10,772,286 — — 20,833,139 67,038,203Deferred tax liabilities 177,178,521 192,358,468 13,419,881 11,817,785 4,538,425 4,783,002 — — 146,431,483 140,470,385 — — 341,568,310 349,429,640Non−current provisions for
employee benefits 12,334,488 9,971,456 2,216,852 — — — 21,953,569 17,175,730 — — — — 36,504,909 27,147,186Other non−current non−financial
liabilities 17,626,394 7,530,339 27,711,972 22,900,638 9,012,870 — 22,168,785 — — — — — 76,520,021 30,430,977
EQUITY 3,027,001,250 2,937,708,650 84,398,847 93,876,916 547,000,840 481,933,209 880,989,598 715,122,213 493,425,433 399,529,077 (1,047,533,461)(1,009,817,287)3,985,282,507 3,618,352,778Equity attributable to owners of
parent 3,027,001,250 2,937,708,650 84,398,847 93,876,916 547,000,840 481,933,209 880,989,598 715,122,213 493,425,433 399,529,077 (1,047,533,461)(1,009,817,287)3,985,282,507 3,618,352,778Issued capital 2,153,213,074 2,132,404,418 92,185,037 92,185,037 204,171,117 203,659,553 142,906,410 142,906,410 164,297,758 164,297,758 (1,003,883,359) (905,021,922)1,752,890,037 1,830,431,254Retained earnings 1,140,321,396 1,152,825,041 (7,554,043) 10,088,706 202,644,366 123,291,764 128,464,532 149,784,385 70,760,796 23,141,069 303,782,125 107,147,811 1,838,419,172 1,566,278,776Share premium — — — — — — — — — — — — — —Treasury shares — — — — — — — — — — — — — —Other equity interests — — — — — — — — — — — — — —Other reserves (266,533,220) (347,520,809) (232,147) (8,396,827) 140,185,357 154,981,892 609,618,656 422,431,418 258,366,879 212,090,250 (347,432,227) (211,943,176) 393,973,298 221,642,748
Non−controlling interests — — — — — — — — — — — — — —
TOTAL LIABILITIES ANDEQUITY 4,639,924,178 4,571,894,585 433,929,915 386,751,724 829,315,263 821,310,055 1,632,263,297 1,358,710,485 888,208,186 780,949,989 (1,056,781,954)(1,046,869,597)7,366,858,885 6,872,747,241
F−122

Table of Contents
Line of Business GenerationCountry Chile Argentina Brazil Colombia
12−31−2011 12−31−2010 12−31−2009 12−31−2011 12−31−2010 12−31−2009 12−31−2011 12−31−2010 12−31−2009 12−31−2011 12−31−2010 12−31−2009ThCh$ ThCh$ ThCh$ ThCh$ ThCh$ ThCh$ ThCh$ ThCh$ ThCh$ ThCh$ ThCh$ ThCh$
STATEMENT OF COMPREHENSIVE INCOMEREVENUES 1,257,995,225 1,345,370,795 1,373,230,894 395,296,464 358,089,711 303,112,035 309,049,119 359,211,026 318,321,960 498,568,875 507,526,498 500,964,413Sales 1,244,969,978 1,315,430,658 1,367,051,056 395,107,435 351,429,303 299,912,430 306,693,874 351,386,168 314,667,204 496,505,095 507,148,312 500,829,922Energy sales 1,214,467,888 1,286,727,887 1,349,609,938 389,963,331 345,706,935 293,388,675 253,753,923 258,243,192 224,502,356 495,453,014 506,194,881 500,175,971Other sales 10,642,489 15,262,308 6,009,988 — — — — — — — — —Other services rendered 19,859,601 13,440,463 11,431,130 5,144,104 5,722,368 6,523,755 52,939,951 93,142,976 90,164,848 1,052,081 953,431 653,951
Other operating income 13,025,247 29,940,137 6,179,838 189,029 6,660,408 3,199,605 2,355,245 7,824,858 3,654,756 2,063,780 378,186 134,491
RAW MATERIALS AND CONSUMABLES USED (679,798,692) (666,388,433) (511,521,900)(315,717,397)(267,824,397)(208,539,466) (55,607,090)(109,560,464) (82,267,885)(134,977,823)(176,746,281)(184,067,482)Energy purchases (205,693,620) (139,373,210) (52,310,897) (13,740,208) (9,296,132) (9,375,553) (9,943,885) (27,257,255) (32,746,221) (29,508,762) (72,764,711) (91,955,452)Fuel consumption (350,725,578) (318,637,144) (345,812,585)(283,048,981)(242,853,893)(180,160,003) (35,498,349) (37,260,897) 6,826,322 (23,946,682) (27,780,401) (20,572,023)Transport expenses (115,056,998) (161,189,862) (107,314,035) (8,165,583) (3,636,524) (5,363,800) (16,353,299) (5,098,408) (4,851,240) (54,452,560) (50,431,204) (46,663,960)Other variable supplies and services (8,322,496) (47,188,217) (6,084,383) (10,762,625) (12,037,848) (13,640,110) 6,188,443 (39,943,904) (51,496,746) (27,069,819) (25,769,965) (24,876,047)
CONTRIBUTION MARGIN 578,196,533 678,982,362 861,708,994 79,579,067 90,265,314 94,572,569 253,442,029 249,650,562 236,054,075 363,591,052 330,780,217 316,896,931
Other work performed by entity and capitalized 3,954,056 — — — — — 244,254 — — 2,187,900 688,024 517,847Employee benefits expense (42,826,606) (31,556,880) (29,654,313) (19,020,797) (14,457,685) (11,009,053) (12,425,160) (11,622,887) (11,417,189) (13,009,393) (12,219,664) (10,959,497)Other expenses (52,364,624) (50,276,801) (51,829,666) (9,996,620) (11,003,847) (12,461,750) (10,652,946) (11,621,153) (14,560,167) (61,997,033) (21,193,354) (19,127,781)
GROSS OPERATING RESULT 486,959,359 597,148,681 780,225,015 50,561,650 64,803,782 71,101,766 230,608,177 226,406,522 210,076,719 290,772,526 298,055,223 287,327,500
Depreciation, amortization, and impairment losses (88,155,103) (84,379,198) (140,184,964) (16,647,907) (18,093,427) (23,365,251) (27,115,088) (67,594,458) (32,305,072) (37,264,422) (36,572,942) (36,516,121)
OPERATING INCOME 398,804,256 512,769,483 640,040,051 33,913,743 46,710,355 47,736,515 203,493,089 158,812,064 177,771,647 253,508,104 261,482,281 250,811,379
FINANCIAL RESULT (47,157,682) (62,503,182) (89,797,956) (24,064,353) (9,499,131) (33,772,058) 31,870,959 (20,035,955) (25,088,330) (44,412,198) (35,898,815) (42,513,775)Financial income 15,047,206 4,880,575 9,495,037 6,318,260 1,504,063 2,507,846 62,448,962 19,217,791 18,523,222 6,440,538 3,441,874 11,968,380Financial costs (57,750,591) (70,389,036) (90,931,585) (20,995,238) (18,112,699) (19,226,132) (49,265,315) (36,376,407) (52,183,133) (50,600,130) (39,269,219) (54,646,985)Gain (loss) for indexed assets and liabilities (5,369,555) (2,885,747) 9,009,669 — — — — — — — — —Foreign currency exchange differences 915,258 5,891,026 (17,371,077) (9,387,375) 7,109,505 (17,053,772) 18,687,312 (2,877,339) 8,571,581 (252,606) (71,470) 164,830Gains 16,349,908 12,258,950 28,981,945 4,805,473 19,544,626 2,092,050 27,309,335 27,014,846 39,823,108 370,895 184,162 263,663Losses (15,434,650) (6,367,924) (46,353,022) (14,192,848) (12,435,121) (19,145,822) (8,622,023) (29,892,185) (31,251,527) (623,501) (255,632) (98,833)
Share of the profit (loss) of associates accounted forusing the equity method 8,215,763 811,855 (8,074,214) — — 372,988 — — — — — —
Negative consolidation difference — — — — — — — — — — — —Gains (losses) from other investments 539,283 234,251 (20,722) 498,877 — — — — — — — (34,772)Gains (losses) on sale of property, plant, and
equipment 478,619 24,894 34,186 — — — — 23,169 25,505 70,187 1,127,732 83,708Other expenses distinct from operating expenses — — — — — — — — — — — —
NET INCOME BEFORE TAX 360,880,239 451,337,301 542,181,345 10,348,267 37,211,224 14,337,445 235,364,048 138,799,278 152,708,822 209,166,093 226,711,198 208,346,540
Income tax (79,043,325) (70,628,343) (76,281,986) (21,796,346) (13,781,110) (5,927,003) (46,012,835) (15,507,514) (28,251,488) (80,740,375) (76,639,668) (69,788,953)
NET INCOME AFTER TAX FROM CONTINUINGOPERATIONS 281,836,914 380,708,958 465,899,359 (11,448,079) 23,430,114 8,410,442 189,351,213 123,291,764 124,457,334 128,425,718 150,071,530 138,557,587
Net income from discontinued operations — — — — — — — — — — — —NET INCOME 281,836,914 380,708,958 465,899,359 (11,448,079) 23,430,114 8,410,442 189,351,213 123,291,764 124,457,334 128,425,718 150,071,530 138,557,587
RESULT FOR THE PERIOD 281,836,914 380,708,958 465,899,359 (11,448,079) 23,430,114 8,410,442 189,351,213 123,291,764 124,457,334 128,425,718 150,071,530 138,557,587Owners of parent — — — — — — — — — — — —Non−controlling interests — — — — — — — — — — — —
Line of Business GenerationCountry Peru Eliminations Total
12−31−201112−31−201012−31−200912−31−201112−31−201012−31−2009 12−31−2011 12−31−2010 12−31−2009ThCh$ ThCh$ ThCh$ ThCh$ ThCh$ ThCh$ ThCh$ ThCh$ ThCh$
STATEMENT OF COMPREHENSIVE INCOMEREVENUES 239,841,441211,263,618213,624,981 (724,906) (857,568) (896,628)2,700,026,218 2,780,604,080 2,708,357,655Sales 239,031,927210,800,064210,576,947 (724,906) (857,568) (896,628)2,681,583,403 2,735,336,937 2,692,140,931Energy sales 233,663,702202,614,778202,852,442 — — — 2,587,301,858 2,599,487,673 2,570,529,382Other sales — — — — — — 10,642,489 15,262,308 6,009,988Other services rendered 5,368,225 8,185,286 7,724,505 (724,906) (857,568) (896,628) 83,639,056 120,586,956 115,601,561
Other operating income 809,514 463,554 3,048,034 — — — 18,442,815 45,267,143 16,216,724
RAW MATERIALS AND CONSUMABLES USED (86,884,090)(80,240,613)(72,013,860) — — — (1,272,985,092)(1,300,760,188)(1,058,410,593)Energy purchases (13,812,605)(15,503,346)(10,670,605) — — — (272,699,080) (264,194,654) (197,058,728)Fuel consumption (49,411,567)(45,498,261)(40,516,143) — — — (742,631,157) (672,030,596) (580,234,432)Transport expenses (16,393,695)(12,778,594)(13,693,435) — — — (210,422,135) (233,134,592) (177,886,470)Other variable supplies and services (7,266,223) (6,460,412) (7,133,677) — — — (47,232,720) (131,400,346) (103,230,963)
CONTRIBUTION MARGIN 152,957,351131,023,005141,611,121 (724,906) (857,568) (896,628)1,427,041,126 1,479,843,892 1,649,947,062
Other work performed by entity and capitalized 18,593 — 214,054 — — — 6,404,803 688,024 731,901Employee benefits expense 2,657,451 (6,161,429) (6,537,925) — — — (84,624,505) (76,018,545) (69,577,977)Other expenses (14,254,393)(16,333,294)(21,025,750) 724,906 857,568 896,628 (148,540,710) (109,570,881) (118,108,486)
GROSS OPERATING RESULT 141,379,002108,528,282114,261,500 — — — 1,200,280,714 1,294,942,490 1,462,992,500
Depreciation, amortization, and impairment losses (36,724,390)(38,208,869)(38,212,838) — — — (205,906,910) (244,848,894) (270,584,246)
OPERATING INCOME 104,654,612 70,319,413 76,048,662 — — — 994,373,804 1,050,093,596 1,192,408,254
FINANCIAL RESULT (10,596,299)(14,738,535)(23,600,707) (2,173,731) 3,473,802 28,459,148 (96,533,304) (139,201,816) (186,313,678)Financial income 862,313 455,981 1,341,180 (2,146,863) (1,621,289) (2,994,499) 88,970,416 27,878,995 40,841,166Financial costs (10,794,337)(15,505,355)(25,576,058) 2,146,863 1,621,289 2,994,499 (187,258,748) (178,031,427) (239,569,394)Gain (loss) for indexed assets and liabilities — — — — — — (5,369,555) (2,885,747) 9,009,669Foreign currency exchange differences (664,275) 310,839 634,171 (2,173,731) 3,473,802 28,459,148 7,124,583 13,836,363 3,404,881Gains 19,821 805,044 635,100 (12,320,110) (476,265) — 36,535,322 59,331,363 71,795,866

Losses (684,096) (494,205) (929) 10,146,379 3,950,067 28,459,148 (29,410,739) (45,495,000) (68,390,985)
Share of the profit (loss) of associates accounted forusing the equity method — — 9,935,172 — — — 8,215,763 811,855 2,233,946
Negative consolidation difference — — — — — — — — —Gains (losses) from other investments — — — — — — 1,038,160 234,251 (55,494)Gains (losses) on sale of property, plant, and
equipment 426,771 455,621 (78,969) — — — 975,577 1,631,416 64,430Other expenses distinct from operating expenses — — — — — — — — —
NET INCOME BEFORE TAX 94,485,084 56,036,499 62,304,158 (2,173,731) 3,473,802 28,459,148 908,070,000 913,569,302 1,008,337,458
Income tax (27,749,046)(20,936,925)(21,497,520) — — — (255,341,927) (197,493,560) (201,746,950)
NET INCOME AFTER TAX FROM CONTINUINGOPERATIONS 66,736,038 35,099,574 40,806,638 (2,173,731) 3,473,802 28,459,148 652,728,073 716,075,742 806,590,508
Net income from discontinued operations — — — — — — — — —NET INCOME 66,736,038 35,099,574 40,806,638 (2,173,731) 3,473,802 28,459,148 652,728,073 716,075,742 806,590,508
RESULT FOR THE PERIOD 66,736,038 35,099,574 40,806,638 (2,173,731) 3,473,802 28,459,148 652,728,073 716,075,742 806,590,508Owners of parent — — — — — — — — —Non−controlling interests — — — — — — — — —
F−123

Table of Contents
b) Distribution
Line of Business DistributionCountry Chile Argentina Brazil Colombia Peru Eliminations Total
12−31−2011 12−31−2010 12−31−2011 12−31−2010 12−31−2011 12−31−2010 12−31−2011 12−31−2010 12−31−2011 12−31−2010 12−31−2011 12−31−2010 12−31−2011 12−31−2010ThCh$ ThCh$ ThCh$ ThCh$ ThCh$ ThCh$ ThCh$ ThCh$ ThCh$ ThCh$ ThCh$ ThCh$ ThCh$ ThCh$
ASSETS
CURRENT ASSETS 193,667,154 308,282,584 84,947,442 110,182,639 424,487,557 404,494,596 239,448,013 255,980,239 73,305,844 76,808,391 (8,446,413) (698,797)1,007,409,597 1,155,049,652Cash and cash equivalents 26,582,727 106,822,082 21,100,767 45,328,399 109,978,438 52,245,576 131,993,716 76,385,965 9,290,173 26,792,493 — — 298,945,821 307,574,515Other current financial assets — — — 2,271,690 — — 25,011 9,868 — — — — 25,011 2,281,558Other current non−financial
assets 2,312,576 1,422,618 1,246,994 1,199,090 27,375,759 22,986,384 5,220,643 371,248 2,636,552 1,209,481 — — 38,792,524 27,188,821Trade and other current
receivables 152,223,272 185,002,586 54,255,165 52,358,414 254,576,869 315,121,464 92,278,353 93,252,938 56,990,519 44,301,959 — — 610,324,178 690,037,361Accounts receivable from other
related companies 10,623,831 6,640,662 776,127 379,832 — 209,526 4,247,788 80,257,637 14,453 340,135 (8,446,413) (698,797) 7,215,786 87,128,995Inventories 1,924,748 2,136,612 3,138,669 2,261,326 1,252,066 1,307,070 5,682,049 5,702,583 4,357,382 4,153,152 — — 16,354,914 15,560,743Current tax assets — 6,258,024 4,429,720 6,383,888 31,304,425 12,624,576 453 — 16,765 11,171 — — 35,751,363 25,277,659
Non−current assets classified asheld for sale anddiscontinued operations — — — — — — — — — — — — — —
NON−CURRENT ASSETS 1,116,514,950 1,153,691,583 272,099,510 320,842,717 1,994,823,050 1,889,350,205 960,707,757 885,875,047 434,005,821 356,670,398 — — 4,778,151,088 4,606,429,950Other non−current financial
assets 25,176 25,582 — — — 3,352,698 9,099 8,267 2,792,448 1,825,059 — — 2,826,723 5,211,606Other non−current
non−financial assets 229,343 550,802 885,726 693,473 79,626,762 69,291,066 — — — — — — 80,741,831 70,535,341Non−current receivables 3,699,470 7,046,330 1,378,682 495,607 251,693,307 165,992,532 10,485,477 5,847,271 — — — — 267,256,936 179,381,740Non−current accounts
receivable from relatedcompanies — — — — 117,946 324,864 — — — — — — 117,946 324,864
Investments accounted for usingthe equity method 503,579,522 546,854,493 31,383 30,151 — — 76 — — — — — 503,610,981 546,884,644
Intangible assets other thangoodwill 15,263,011 18,189,812 3,473,743 3,203,663 1,374,215,991 1,361,527,584 22,048,463 20,239,478 2,844,862 2,274,071 — — 1,417,846,070 1,405,434,608
Goodwill 2,240,478 2,240,478 — — 119,058,905 120,673,559 8,082,994 7,348,467 — — — — 129,382,377 130,262,504Property, plant, and equipment 583,180,744 561,616,684 266,329,976 298,970,983 20,746,848 20,391,138 882,070,391 783,716,639 428,368,511 352,571,268 — — 2,180,696,470 2,017,266,712Investment property — — — — — — — — — — — — — —Deferred tax assets 8,297,206 17,167,402 — 17,448,840 149,363,291 147,796,764 38,011,257 68,714,925 — — — — 195,671,754 251,127,931
TOTAL ASSETS 1,310,182,104 1,461,974,167 357,046,952 431,025,356 2,419,310,607 2,293,844,801 1,200,155,770 1,141,855,286 507,311,665 433,478,789 (8,446,413) (698,797)5,785,560,685 5,761,479,602
F−124

Table of Contents
Line of Business DistributionCountry Chile Argentina Brazil Colombia Peru Eliminations Total
12−31−2011 12−31−2010 12−31−2011 12−31−2010 12−31−2011 12−31−2010 12−31−2011 12−31−2010 12−31−2011 12−31−2010 12−31−2011 12−31−2010 12−31−2011 12−31−2010ThCh$ ThCh$ ThCh$ ThCh$ ThCh$ ThCh$ ThCh$ ThCh$ ThCh$ ThCh$ ThCh$ ThCh$ ThCh$ ThCh$
LIABILITIES AND EQUITYCURRENT LIABILITIES 196,759,945 171,286,364 310,638,397 226,189,613 489,046,971 553,701,924 302,355,437 269,331,660 103,699,413 78,464,053 (8,446,413) (698,797)1,394,053,750 1,298,274,817Other current financial liabilities 26,351 2,668 22,349,209 11,553,138 226,703,734 200,661,330 11,034,446 50,242,207 32,046,376 22,404,747 — — 292,160,116 284,864,090Trade and other current payables 137,937,525 86,947,700 235,366,718 159,903,785 183,352,939 283,132,512 172,660,428 155,442,693 44,810,969 29,240,966 — — 774,128,579 714,667,656Accounts payable to related
companies 23,267,428 63,921,986 2,249,562 2,212,567 20,937,120 30,669,756 76,706,628 34,172,478 11,369,623 11,517,749 (8,446,413) (698,797) 126,083,948 141,795,739Other short−term provisions 9,088,010 6,792,229 21,423,408 28,780,910 6,801,936 6,153,804 — 1,476,148 5,913,838 8,275,793 — — 43,227,192 51,478,884Current tax liabilities 25,872,525 10,039,050 7,016,288 7,526,565 36,202,808 28,902,744 36,114,100 24,090,490 5,730,192 4,950,637 — — 110,935,913 75,509,486Current provisions for employee
benefits — 1,284,614 — 591,831 — — — 813,663 — — — — — 2,690,108Other current non−financial
liabilities 568,106 2,298,117 22,233,212 15,620,817 15,048,434 4,181,778 5,839,835 3,093,981 3,828,415 2,074,161 — — 47,518,002 27,268,854
Liabilities associated withnon−current assets classified asheld for sale and discontinuedoperations — — — — — — — — — — — — — —
NON−CURRENT LIABILITIES 52,473,555 196,967,970 41,497,104 40,238,648 870,301,120 711,221,766 397,178,370 392,279,990 210,609,245 205,177,295 — — 1,572,059,394 1,545,885,669Other non−current financial
liabilities — — 25,941,484 17,330,002 478,627,090 388,961,190 295,721,421 277,085,017 152,604,148 147,659,078 — — 952,894,143 831,035,287Other non−current payables — — 905,643 325,183 13,155,174 23,055,474 — — — — — — 14,060,817 23,380,657Accounts payable to related
companies — 146,500,704 — — — 1,430,022 — — — — — — — 147,930,726Other long−term provisions 7,618,844 7,367,197 9,239,778 11,451,261 160,166,774 137,660,556 4,445,966 1,849,383 165,531 155,729 — — 181,636,893 158,484,126Deferred tax liabilities 22,742,572 24,272,266 — 9,731,475 63,153,516 57,124,740 19,717,371 52,263,418 56,914,980 57,086,045 — — 162,528,439 200,477,944Non−current provisions for
employee benefits 17,289,987 15,763,453 5,410,199 1,400,727 149,352,163 102,989,784 62,774,313 61,082,172 — — — — 234,826,662 181,236,136Other non−current non−financial
liabilities 4,822,152 3,064,350 — — 5,846,403 — 14,519,299 — 924,586 276,443 — — 26,112,440 3,340,793
EQUITY 1,060,948,604 1,093,719,833 4,911,451 164,597,095 1,059,962,516 1,028,921,111 500,621,963 480,243,636 193,003,007 149,837,441 — — 2,819,447,541 2,917,319,116Equity attributable to owners of
parent 1,060,948,604 1,093,719,833 4,911,451 164,597,095 1,059,962,516 1,028,921,111 500,621,963 480,243,636 193,003,007 149,837,441 — — 2,819,447,541 2,917,319,116Issued capital 368,494,984 368,494,984 135,477,599 135,477,599 466,167,408 547,861,028 7,905,014 3,934,010 32,841,625 32,841,625 — — 1,010,886,630 1,088,609,246Retained earnings 978,146,893 998,431,191 (92,338,025) 66,482,841 72,309,174 104,634,235 (2,694,357) 123,200,147 1,623,660 25,300,513 — — 957,047,345 1,318,048,927Share premium — — — — — — — — — — — — — —Treasury shares — — — — — — — — — — — — — —Other equity interests — — — — — — — — — — — — — —Other reserves (285,693,273) (273,206,342) (38,228,123) (37,363,345) 521,485,934 376,425,848 495,411,306 353,109,479 158,537,722 91,695,303 — — 851,513,566 510,660,943
Non−controlling interests — — — — — — — — — — — — — —
TOTAL LIABILITIES ANDEQUITY 1,310,182,104 1,461,974,167 357,046,952 431,025,356 2,419,310,607 2,293,844,801 1,200,155,770 1,141,855,286 507,311,665 433,478,789 (8,446,413) (698,797)5,785,560,685 5,761,479,602
F−125

Table of Contents
Line of Business DistributionCountry Chile Argentina Brazil Colombia
12−31−2011 12−31−2010 12−31−2009 12−31−2011 12−31−2010 12−31−2009 12−31−2011 12−31−2010 12−31−2009 12−31−2011 12−31−2010 12−31−2009ThCh$ ThCh$ ThCh$ ThCh$ ThCh$ ThCh$ ThCh$ ThCh$ ThCh$ ThCh$ ThCh$ ThCh$
STATEMENT OF COMPREHENSIVE INCOMEREVENUES 1,046,190,998 1,016,997,495 1,089,515,077 279,724,815 295,538,314 327,087,549 1,976,715,786 1,987,041,550 1,780,335,633 815,486,660 785,889,588 741,167,816Sales 1,035,360,191 1,003,001,004 1,066,239,632 271,566,142 287,867,341 318,293,459 1,784,693,095 1,717,875,184 1,536,790,709 783,614,400 757,935,491 684,930,692Energy sales 936,062,746 900,798,434 1,007,550,579 251,678,813 268,829,105 297,441,695 1,661,700,350 1,648,205,624 1,473,905,923 677,266,087 657,681,311 585,665,734Other sales 6,051,771 7,166,927 10,418,293 — — — — — — 2,293,979 2,035,272 1,999,965Other services rendered 93,245,674 95,035,643 48,270,760 19,887,329 19,038,236 20,851,764 122,992,745 69,669,560 62,884,786 104,054,334 98,218,908 97,264,993
Other operating income 10,830,807 13,996,491 23,275,445 8,158,673 7,670,973 8,794,090 192,022,691 269,166,366 243,544,924 31,872,260 27,954,097 56,237,124
RAW MATERIALS AND CONSUMABLES USED (803,854,371) (788,044,087) (845,396,679)(141,879,982)(142,565,611)(153,916,681)(1,297,135,167)(1,310,974,462)(1,109,711,167)(451,191,503)(426,625,508)(393,206,055)Energy purchases (728,175,203) (718,972,828) (815,863,794)(139,846,898)(139,626,236)(150,780,462) (704,848,626) (644,017,840) (544,826,586)(338,121,156)(317,529,068)(275,176,733)Fuel consumption — — — — — — — — — — — —Transport expenses (52,701,930) (45,459,555) — (978,324) (1,239,345) (1,522,314) (92,384,968) (88,561,822) (77,941,315) (82,215,432) (81,668,944) (79,476,600)Other variable supplies and services (22,977,238) (23,611,704) (29,532,885) (1,054,760) (1,700,030) (1,613,905) (499,901,573) (578,394,800) (486,943,266) (30,854,915) (27,427,496) (38,552,722)
CONTRIBUTION MARGIN 242,336,627 228,953,408 244,118,398 137,844,833 152,972,703 173,170,868 679,580,619 676,067,088 670,624,466 364,295,157 359,264,080 347,961,761
Other work performed by entity and capitalized 2,776,876 2,524,049 2,666,652 12,146,533 8,296,765 8,057,055 17,886,043 18,128,254 17,007,228 4,309,814 3,734,991 2,485,358Employee benefits expense (29,792,819) (24,818,903) (24,641,080) (87,034,352) (63,168,597) (66,048,079) (92,462,436) (86,726,523) (84,491,569) (33,383,134) (30,266,521) (29,972,265)Other expenses (60,852,918) (64,729,067) (64,826,993) (78,690,268) (77,589,301) (64,218,481) (146,412,225) (144,659,664) (153,761,807) (85,303,430) (61,109,969) (60,815,070)
GROSS OPERATING RESULT 154,467,766 141,929,487 157,316,977 (15,733,254) 20,511,570 50,961,363 458,592,001 462,809,155 449,378,318 249,918,407 271,622,581 259,659,784
Depreciation, amortization, and impairment losses (34,783,079) (30,162,735) (28,284,945)(121,436,654) (16,567,619) (19,085,702) (103,946,132) (158,955,424) (111,178,295) (64,456,300) (64,400,224) (59,775,278)
OPERATING INCOME 119,684,687 111,766,752 129,032,032 (137,169,908) 3,943,951 31,875,661 354,645,869 303,853,731 338,200,023 185,462,107 207,222,357 199,884,506
FINANCIAL RESULT 10,648,013 2,470,113 2,906,811 (7,990,001) (6,198,811) (5,626,845) (72,935,412) (54,257,621) (57,393,403) (31,913,547) (26,452,173) (29,268,297)Financial income 15,874,126 10,576,373 14,891,938 6,538,668 9,324,258 6,866,221 97,925,921 101,888,814 83,232,583 5,531,446 9,289,334 9,885,040Financial costs (4,383,448) (8,048,514) (17,384,760) (15,352,367) (16,070,345) (12,048,619) (171,235,373) (155,096,284) (145,101,661) (37,469,524) (35,637,190) (39,051,936)Gain (loss) for indexed assets and liabilities 42,067 153,805 458,162 — — — — — — — — —Foreign currency exchange differences (884,732) (211,551) 4,941,471 823,698 547,276 (444,447) 374,040 (1,050,151) 4,475,675 24,531 (104,317) (101,401)Gains 798,025 2,679,429 8,283,203 1,121,128 617,720 1,287,472 2,081,506 3,249,786 6,419,927 328,173 604,900 1,561,581Losses (1,682,757) (2,890,980) (3,341,732) (297,430) (70,444) (1,731,919) (1,707,466) (4,299,937) (1,944,252) (303,642) (709,217) (1,662,982)
Share of the profit (loss) of associates accounted forusing the equity method — — 82,756,621 468 911 1,633 — — — — — —
Negative consolidation difference — — — — — — — — — — — —Gains (losses) from other investments — — 82,850 — — — — — — 70 — —Gains (losses) on sale of property, plant, and
equipment (4,305) (3,349) 12,050,737 — — — — — 250,284 (301,065) 1,389,720 12,755,736Other expenses distinct from operating expenses — — — — — — — — — — — —
NET INCOME BEFORE TAX 130,328,395 114,233,516 226,829,051 (145,159,441) (2,253,949) 26,250,449 281,710,457 249,596,110 281,056,904 153,247,565 182,159,904 183,371,945
Income tax (33,614,812) (23,402,198) (21,064,399) (12,248,134) 635,038 (9,357,145) (75,932,075) (43,566,137) (72,619,778) (62,216,531) (56,459,150) (56,364,261)
NET INCOME AFTER TAX FROM CONTINUINGOPERATIONS 96,713,583 90,831,318 205,764,652 (157,407,575) (1,618,911) 16,893,304 205,778,382 206,029,973 208,437,126 91,031,034 125,700,754 127,007,684
Net income from discontinued operations — — — — — — — — — — — —NET INCOME 96,713,583 90,831,318 205,764,652 (157,407,575) (1,618,911) 16,893,304 205,778,382 206,029,973 208,437,126 91,031,034 125,700,754 127,007,684
RESULT FOR THE PERIOD 96,713,583 90,831,318 205,764,652 (157,407,575) (1,618,911) 16,893,304 205,778,382 206,029,973 208,437,126 91,031,034 125,700,754 127,007,684Owners of parent — — — — — — — — — — — —Non−controlling interests — — — — — — — — — — — —
Line of Business DistributionCountry Peru Eliminations Total
12−31−2011 12−31−2010 12−31−200912−31−201112−31−201012−31−2009 12−31−2011 12−31−2010 12−31−2009ThCh$ ThCh$ ThCh$ ThCh$ ThCh$ ThCh$ ThCh$ ThCh$ ThCh$
STATEMENT OF COMPREHENSIVE INCOMEREVENUES 329,309,210 307,158,970 302,295,127 — — — 4,447,427,4694,392,625,9174,240,401,202Sales 311,980,876 286,654,227 286,037,460 — — — 4,187,214,7044,053,333,2473,892,291,952Energy sales 303,303,904 279,239,525 278,264,824 — — — 3,830,011,9003,754,753,9993,642,828,755Other sales 45,957 18,571 13,193 — — — 8,391,707 9,220,770 12,431,451Other services rendered 8,631,015 7,396,131 7,759,443 — — — 348,811,097 289,358,478 237,031,746
Other operating income 17,328,334 20,504,743 16,257,667 — — — 260,212,765 339,292,670 348,109,250
RAW MATERIALS AND CONSUMABLES USED (210,904,949)(193,646,086)(185,706,532) — — — (2,904,965,972)(2,861,855,754)(2,687,937,114)Energy purchases (188,535,528)(168,095,978)(171,745,296) — — — (2,099,527,411)(1,988,241,950)(1,958,392,871)Fuel consumption — — — — — — — — —Transport expenses (1,052) — — — — — (228,281,706) (216,929,666) (158,940,229)Other variable supplies and services (22,368,369)(25,550,108)(13,961,236) — — — (577,156,855) (656,684,138) (570,604,014)
CONTRIBUTION MARGIN 118,404,261 113,512,884 116,588,595 — — — 1,542,461,4971,530,770,1631,552,464,088
Other work performed by entity and capitalized 2,211,736 2,058,678 2,782,325 — — — 39,331,002 34,742,737 32,998,618Employee benefits expense (9,745,039) (10,830,327)(11,469,891) — — — (252,417,780) (215,810,871) (216,622,884)Other expenses (18,518,662)(18,333,017)(24,143,832) — — — (389,777,503) (366,421,018) (367,766,183)
GROSS OPERATING RESULT 92,352,296 86,408,218 83,757,197 — — — 939,597,216 983,281,011 1,001,073,639
Depreciation, amortization, and impairment losses (22,452,740)(21,459,798)(21,332,334) — — — (347,074,905) (291,545,800) (239,656,554)
OPERATING INCOME 69,899,556 64,948,420 62,424,863 — — — 592,522,311 691,735,211 761,417,085
FINANCIAL RESULT (12,080,615)(10,893,433)(10,414,860) 60,038 700,563 — (114,211,524) (94,631,362) (99,796,594)Financial income 1,846,358 1,612,612 2,245,332 — — — 127,716,519 132,691,391 117,121,114Financial costs (14,114,310)(12,538,319)(12,867,928) — — — (242,555,022) (227,390,652) (226,454,904)Gain (loss) for indexed assets and liabilities — — — — — — 42,067 153,805 458,162Foreign currency exchange differences 187,337 32,274 207,736 60,038 700,563 — 584,912 (85,906) 9,079,034Gains 562,888 308,495 1,032,549 60,038 (204,474) — 4,951,758 7,255,856 18,584,732Losses (375,551) (276,221) (824,813) — 905,037 — (4,366,846) (7,341,762) (9,505,698)

Share of the profit (loss) of associates accounted forusing the equity method — — — — — — 468 911 82,758,254
Negative consolidation difference — — — — — — — — —Gains (losses) from other investments — — — — — — 70 — 82,850Gains (losses) on sale of property, plant, and
equipment (8,420) (21,095) (117,804) — — — (313,790) 1,365,276 24,938,953Other expenses distinct from operating expenses — — — — — — — — —
NET INCOME BEFORE TAX 57,810,521 54,033,892 51,892,199 60,038 700,563 — 477,997,535 598,470,036 769,400,548
Income tax (16,517,066)(18,808,290)(18,796,395) — — — (200,528,618) (141,600,737) (178,201,978)
NET INCOME AFTER TAX FROM CONTINUINGOPERATIONS 41,293,455 35,225,602 33,095,804 60,038 700,563 — 277,468,917 456,869,299 591,198,570
Net income from discontinued operations — — — — — — — — —NET INCOME 41,293,455 35,225,602 33,095,804 60,038 700,563 — 277,468,917 456,869,299 591,198,570
RESULT FOR THE PERIOD 41,293,455 35,225,602 33,095,804 60,038 700,563 — 277,468,917 456,869,299 591,198,570Owners of parent — — — — — — — — —Non−controlling interests — — — — — — — — —
F−126

Table of Contents
34. THIRD PARTY GUARANTEES, OTHER CONTINGENT ASSETS AND LIABILITIES, AND OTHER COMMITMENTS
34.1 Direct guarantees
Balance pendingDebtor Assets Committed at December 31, Guarantees Released
AccountingCreditor of Guarantee Name Relationship Type of Guarantee Type Currency Value Currency 2011 2010 2012 Assets2013 Assets2014 AssetsSoc. de Energía de la
República ArgentinaEndesaArgentinaEndesa
Costanera
Creditor Pledge Shares
ThCh$ — ThCh$ — 963,655 — — — — — —Mitsubishi Endesa
CostaneraCreditor Pledge Combined
cycle ThCh$ 42,351,337 ThCh$ 73,262,031 66,236,055 — — — — — —Credit Suisse First BostonEndesa
CostaneraCreditor Pledge Combined
cycle ThCh$ 11,313,893 ThCh$ 5,192,000 4,011,514 — — — — — —Various creditors Edegel Creditor Pledge Real estate
andequipment ThCh$ 100,476,362 ThCh$ 7,127,904 13,008,383 — — — — — —
Scotiabank Chinango Creditor Pledge Collectionflows ThCh$ 22,694,232 ThCh$ 16,095,200 — — — — — — —
Banco Santander(Guarantee agent)
G.N.L.Quintero
Investee Pledge SharesThCh$ — ThCh$ 109,265,974 94,071,116 — — — — — —
Deutsche Bank (*) /Santander Benelux
Enersis Creditor Deposit account Depositaccount ThCh$ 20,793,960 ThCh$ 55,264,828 62,720,234 — — — — — —
Various creditors Ampla Creditor Pledge oncollection andothers ThCh$ 10,646,394 ThCh$ 140,483,626 84,993,209 — — — — — —
Various creditors Coelce Creditor Pledge oncollection andothers ThCh$ 16,453,910 ThCh$ 99,126,606102,571,290 — — — — — —
International FinanceCorporation
CGTFortaleza
Creditor Mortgage andpledge
Real estateandequipment ThCh$ 174,703,123 ThCh$ 38,087,401 17,867,290 — — — — — —
As of December 31, 2011, Enersis had commitments for future purchases of energy amounting to ThCh$ 29,249,750,127 (ThCh$ 26,115,482,639 as ofDecember 31, 2010).
34.2 Indirect guarantees
Balance PendingCreditor Debtor Assets Committed at December 31, Guarantee Releasedof Type of BookGuarantee Name Relation Guarantee Currency Value Currency 2011 2010 2012 Assets 2013 Assets 2014 2015
Bank credit bill CIEN Subsidiary Guarantee ThCh$ 55,410,663 ThCh$ 55,410,663 140,797,232 — — — — — —Bonds and bank
borrowings Chinango Subsidiary Guarantee ThCh$ 21,553,733 ThCh$ 21,553,733 34,817,262 — — — — — —
34.3 Other information
Our Argentine subsidiary, Endesa Costanera, is experiencing a deficit in its working capital, as it is under pressure from the difficulties it is having inobtaining rate adjustments that reflect actual generation costs, a situation that is creating difficulties in the company’s short−term financial equilibrium.Endesa Costanera hopes to revert the current situation through a favorable resolution of the requests it has made to the Argentine Government. Thiscompany does not represent a significant equity risk for the Group.
F−127

Table of Contents
35. PERSONNEL FIGURES
Enersis personnel, including that of subsidiaries and jointly−controlled companies in the five Latin American countries where the Group is present, isdistributed as follows as of December 31, 2011 and December 31, 2010:
12−31−2011
Country
Managers
and Main
Executives
Professionalsand
TechniciansWorkers and
Others TotalAverage for
the Period (*)Chile 94 1,963 340 2,397 2,522Argentina 43 2,401 883 3,327 3,242Brazil 40 2,414 310 2,764 2,780Peru 20 624 153 797 854Colombia 27 1,517 55 1,599 1,641Total 224 8,919 1,741 10,884 11,039
(*) Includes average staff at Cam and Synapsis up to the time they were sold, See Note 2,4,1 and Note 11.
12−31−2010
Country
Managers
and Main
Executives
Professionalsand
TechniciansWorkers and
Others
Total
(**)Average forthe Period
Chile 106 2,397 546 3,049 3,152Argentina 33 2,276 850 3,159 3,115Brazil 45 2,514 387 2,946 2,940Peru 18 944 177 1,139 1,131Colombia 27 1,819 125 1,971 1,923Total 229 9,950 2,085 12,264 12,261
(**) Includes 387 employees from Synapsis and 1,313 from CAM. See Note 2.4.1 and Note 11.
36. SUBSEQUENT EVENTS
No significant events have occurred between December 31, 2011 and date of issuance of these financial statements that could materially affect thepresentation of the financial statements.
F−128

Table of Contents
37. ENVIRONMENT
Environmental expenses as of December 31, 2011, 2010, and 2009 are as follows:
Company Incurring the Cost Project12−31−2011
ThCh$12−31−2010
ThCh$12−31−2009
ThCh$
Endesa Chile S.A. Studies, monitoring, laboratory analysis, removal andfinal disposal of solid waste at hydroelectric powerstations (HPS) and thermoelectric power stations. — — 2,416,053
GasAtacama S.A. Environmental monitoring (air quality, marinemonitoring, etc.). 72,711 72,984 65,481
Centrales Hidroeléctricas de AysénS.A.
Expenses in education and tourism.455,617 294,327 116,820
Empresa Eléctrica Pehuenche S.A. Environmental expenses. — — 57,394Chinango S.A.C. Air and climate protection, waste water management,
soil and water recovery, noise and vibration reduction,biodiversity and landscape protection. 211,544 — —
Edegel S.A.A. Environmental monitoring, waste management,mitigation and restoration. 336,435 444,983 667,059
Codensa S.A. E.S.P. Environmental management of PCB transformers. 71,667 69,820 53,926Companhia Energética do Ceará Environmental monitoring, waste management, ISO
14,001 audit, environmental education. — 4,344 212,166Ampla Energia e Servicos S.A. Environmental license and environmental management
equipment. — 17,377 8,688Empresa Distribuidora Sur S.A. Final disposal of waste and contaminants. 56,185 10,287 151,563Companía de Interconexión EnergéticaS.A.
Environmental compensation, improvements tofacilities and environmental control, implementation oflandscaping project. — — 11,491
Centrais Elétricas Cachoeira DouradaS.A.
Repopulating of deposit sites.— — 50,449
Central Geradora TermeléctricaFortaleza S.A.
Purchase of environmental monitoring equipment.— — 25,505
Compañía de Transmisión delMercosur S.A.
ISO 14,001 Audit and ENRE 57/2003 Resolution(Public Safety), environmental monitoring, andenvironmental standards update. 15,100 13,412 10,837
Transportadora de Energía S.A. ISO 14,001 Audit and ENRE 57/2003 Resolution(Public Safety), environmental monitoring, andenvironmental standards update. 16,387 14,714 11,579
Total 1,235,646 942,248 3,859,011
F−129

Table of Contents
38. SUMMARIZED FINANCIAL INFORMATION OF PRINCIPAL SUBSIDIARIES AND JOINTLY CONTROLLED ENTITIES
As of December 31, 2011 and 2010, the summarized financial information of our principal subsidiaries and jointly controlled entities under IFRS is asfollows:
12−31−2011
Type of FinancialStatements
Current AssetsThCh$
Non−currentAssetsThCh$
Total AssetsThCh$
CurrentLiabilities
ThCh$
Non−currentliabilitiesThCh$
Total LiabilitiesThCh$
RevenueThCh$
CostsThCh$
Profit (Loss)ThCh$
Chilectra S.A. Consolidated 193,667,1541,116,514,9501,310,182,104(196,759,945) (52,473,555) (249,233,500)1,035,360,191(924,569,246)110,790,945Synapsis Soluciones y
Servicios IT Ltda. Consolidated — — — — — — 6,690,708 (6,561,185) 129,523Inmobiliaria Manso de
Velasco Ltda. Consolidated 30,451,690 36,347,961 66,799,651 (3,801,501) (675,754) (4,477,255) 7,741,781 (1,479,399) 6,262,382Compañía Americana de
Multiservicios de ChileS.A. Consolidated — — — — — — 15,582,078 (16,890,062) (1,307,984)
ICT ServiciosInformáticos Ltda. Separate 3,386,984 296,193 3,683,177 (2,119,237) (557,313) (2,676,550) 5,897,820 (5,282,766) 615,054
Inversiones DistrilimaS.A. Separate 73,612 53,558,686 53,632,298 (8,288) — (8,288) 12,106,048 (4,386) 12,101,662
Empresa de DistribuciónEléctrica de LimaNorte S.A.A. Separate 73,237,435 434,005,821 507,243,256(103,696,328) (210,609,245) (314,305,573) 311,980,876(270,687,421) 41,293,455
Empresa Nacional deElectricidad S.A. Separate 723,937,1723,238,686,0833,962,623,255(488,951,209)(1,087,287,205) (1,576,238,414)1,184,084,739(812,433,884)371,650,855
Endesa Eco S.A. Separate 5,437,267 135,146,612 140,583,879(139,297,158) (8,360,757) (147,657,915) 14,315,105 (11,047,198) 3,267,907Empresa Eléctrica
Pehuenche S.A. Separate 56,656,641 234,597,856 291,254,497 (77,321,477) (39,046,758) (116,368,235) 195,003,413 (78,664,231)116,339,182Compañía Eléctrica San
Isidro S.A. Separate 68,408,746 77,242,199 145,650,945 (71,972,413) (9,267,849) (81,240,262) 243,562,829(199,292,302) 44,270,527Empresa Eléctrica Pangue
S.A. Separate 34,480,062 131,950,788 166,430,850 (44,091,140) (13,223,971) (57,315,111) 119,050,275 (40,689,183) 78,361,092Compañía Eléctrica
Tarapacá S.A. Separate 33,507,950 78,813,461 112,321,411 (15,031,457) (5,726,043) (20,757,500) 39,522,009 (38,375,668) 1,146,341Inversiones Endesa Norte
S.A. Separate 41 25,157,716 25,157,757 (3,641,034) — (3,641,034) — (270,529) (270,529)Inversiones GasAtacama
Holding Ltda. Separate 46,551,925 157,376,178 203,928,103 (38,726,488) (22,904,207) (61,630,695) 130,444,784(112,562,946) 17,881,838Soc. Concesionaria Túnel
El Melón S.A. Separate 29,481,896 15,071,789 44,553,685 (5,430,649) (11,437,055) (16,867,704) 7,687,068 (2,664,769) 5,022,299Endesa Argentina S.A. Separate 8,573,370 34,592,709 43,166,079 (103,684) — (103,684) — 453,345 453,345Endesa Costanera S.A. Separate 58,093,676 141,156,445 199,250,121(160,504,466) (61,581,301) (222,085,767) 341,636,333(364,229,923) (22,593,590)Hidroeléctrica El Chocón
S.A. Separate 27,754,942 161,753,755 189,508,697 (24,739,392) (69,116,012) (93,855,404) 48,326,998 (36,168,754) 12,158,244Emgesa S.A. E.S.P. Separate 239,044,0051,393,219,2921,632,263,297(220,413,976) (530,859,723) (751,273,699) 496,479,981(368,041,227)128,438,754Generandes Perú S.A. Separate 162,255 208,237,040 208,399,295 (9,633) — (9,633) 22,317,674 (180,671) 22,137,003Edegel S.A.A. Separate 70,142,623 709,616,464 779,759,087 (60,257,964) (275,273,113) (335,531,077) 214,815,328(140,762,791) 74,052,537Chinango S.A.C. Separate 11,140,497 112,163,451 123,303,948 (22,972,028) (42,065,340) (65,037,368) 25,943,033 (17,770,892) 8,172,141Centrales Hidroeléctricas
de Aysén S.A. Separate 5,227,686 59,098,190 64,325,876 (3,747,698) (527,981) (4,275,679) — (2,379,074) (2,379,074)Endesa Brasil S.A. Separate 144,245,7061,071,816,1091,216,061,815 (5,924,851) (2,225) (5,927,076) 160,755,284 10,670,289 171,425,573Central Geradora
TermeléctricaFortaleza S.A. Separate 85,453,417 162,710,126 248,163,543 (40,948,473) (38,033,756) (78,982,229) 127,130,032 (86,764,813) 40,365,219
Centrais ElétricasCachoeira DouradaS.A. Separate 118,123,679 144,987,597 263,111,276 (29,508,803) (4,697,541) (34,206,344) 126,646,148 (12,834,467)113,811,681
Compañía deInterconexiónEnergética S.A. Separate 25,533,963 292,499,911 318,033,874(151,994,548) (16,143,887) (168,138,435) 54,757,129 (18,519,083) 36,238,046
Compañía de Transmisióndel Mercosur S.A. Separate 18,236,701 3,922,642 22,159,343 (3,751,001) (15,927,509) (19,678,510) 2,682,140 (2,906,410) (224,270)
Companhia Energética doCeará Separate 202,961,217 773,140,433 976,101,650(194,185,629) (311,700,107) (505,885,736) 805,668,597(669,295,646)136,372,951
EN−Brasil Comércio eServiços S.A. Separate 2,449,053 115,999 2,565,052 (1,071,810) (38,388) (1,110,198) 5,839,550 (4,878,723) 960,827
Ampla Energia e ServiçosS.A. Separate 215,407,3251,102,615,0891,318,022,414(293,476,867) (548,590,886) (842,067,753) 979,024,498(909,619,067) 69,405,431
Ampla Investimentos eServiços S.A. Separate 1,507,987 138,395,284 139,903,271 (51,994,249) — (51,994,249) — 16,979,113 16,979,113
Codensa S.A. E.S.P. Separate 1,669 46,733 48,402 (1,029,247) — (1,029,247) — (1,063,733) (1,063,733)Inversora Codensa S.A.S. Separate 233,090,499 934,300,0851,167,390,584(294,852,363) (379,922,653) (674,775,016) 751,734,951(663,876,013) 87,858,938Empresa de Energía de
Cundinamarca S.A. Separate 1,076 76 1,152 (2) (33) (35) — — —Empresa Distribuidora
Sur S.A. Separate 9,578,051 54,738,504 64,316,555 (10,724,651) (17,255,717) (27,980,368) 33,225,646 (30,053,506) 3,172,140
12−31−2010Type of
FinancialStatements
Current AssetsThCh$
Non−currentAssetsThCh$
Total AssetsThCh$
Current LiabilitiesThCh$
Non−currentliabilitiesThCh$
Total LiabilitiesThCh$
RevenueThCh$
CostsThCh$
Profit (Loss)ThCh$
Chilectra S.A. Consolidated 308,282,5841,153,691,5831,461,974,167 (171,286,364) (196,967,970) (368,254,334)1,003,001,004(852,052,652)150,948,352Synapsis Soluciones y
Servicios IT Ltda. Consolidated 27,547,119 10,385,607 37,932,726 (15,618,790) (1,915,098) (17,533,888) 66,028,200 (70,214,530) (4,186,330)Inmobiliaria Manso de
Velasco Ltda. Consolidated 32,323,759 35,782,164 68,105,923 (3,422,178) (1,623,485) (5,045,663) 10,546,195 (2,729,975) 7,816,220Compañía Americana de
Multiservicios deChile S.A. Consolidated 71,769,555 25,904,845 97,674,400 (45,136,731) (6,707,851) (51,844,582) 131,410,554(133,224,067) (1,813,513)
ICT ServiciosInformáticos Ltda. Separate 4,077,868 233,684 4,311,552 (3,372,931) (456,919) (3,829,850) 2,174,853 (2,193,935) (19,082)
Inversiones DistrilimaS.A. Separate 368,480 46,340,936 46,709,416 (3,835) — (3,835) 11,116,825 (18,031) 11,098,794
Empresa de DistribuciónEléctrica de LimaNorte S.A.A. Separate 76,439,911 356,670,398 433,110,309 (78,460,218) (205,177,295) (283,637,513) 286,654,227(251,428,625) 35,225,602

Empresa Nacional deElectricidad S.A. Separate 693,166,8273,171,595,8083,864,762,635 (464,147,067)(1,057,670,971) (1,521,818,038)1,173,423,692(654,190,040)519,233,652
Endesa Eco S.A. Separate 6,327,207 138,782,297 145,109,504 (137,123,791) (20,442,170) (157,565,961) 13,515,877 (16,056,170) (2,540,293)Empresa Eléctrica
Pehuenche S.A. Separate 54,209,408 242,417,018 296,626,426 (60,865,292) (41,020,747) (101,886,039) 234,534,178 (57,265,757)177,268,421Compañía Eléctrica San
Isidro S.A. Separate 43,642,004 81,215,943 124,857,947 (55,987,180) (11,948,576) (67,935,756) 167,998,478(154,961,416) 13,037,062Empresa Eléctrica
Pangue S.A. Separate 26,348,540 135,422,607 161,771,147 (48,954,765) (13,940,056) (62,894,821) 99,324,285 (35,590,926) 63,733,359Compañía Eléctrica
Tarapacá S.A. Separate 28,342,554 77,234,443 105,576,997 (7,312,647) (7,839,404) (15,152,051) 45,280,244 (41,788,042) 3,492,202Inversiones Endesa Norte
S.A. Separate — 25,157,716 25,157,716 (3,370,464) — (3,370,464) — (146,130) (146,130)Inversiones GasAtacama
Holding Ltda. Separate 55,742,095 145,984,024 201,726,119 (69,155,266) (21,720,110) (90,875,376) 167,160,648(147,165,903) 19,994,745Soc. Concesionaria Túnel
El Melón S.A. Separate 21,178,870 17,552,855 38,731,725 (2,391,836) (13,674,875) (16,066,711) 6,701,752 (2,364,828) 4,336,924Endesa Argentina S.A. Separate 7,852,572 33,753,943 41,606,515 (44,284) — (44,284) 5,641,118 151,175 5,792,293Endesa Costanera S.A. Separate 45,572,669 128,841,292 174,413,961 (107,230,903) (65,903,875) (173,134,778) 288,534,151(290,157,746) (1,623,595)Hidroeléctrica El Chocón
S.A. Separate 18,399,302 144,894,940 163,294,242 (43,781,981) (38,683,634) (82,465,615) 57,172,784 (32,791,612) 24,381,172Emgesa S.A. E.S.P. Separate 154,997,2831,203,713,2021,358,710,485 (286,630,051) (356,958,221) (643,588,272) 507,137,563(357,040,190)150,097,373Generandes Perú S.A. Separate 54,688 180,174,348 180,229,036 (21,008) — (21,008) 21,122,454 (214,017) 20,908,437Edegel S.A.A. Separate 44,851,844 643,944,854 688,796,698 (40,685,019) (282,540,573) (323,225,592) 188,755,959(152,380,933) 36,375,026Chinango S.A.C. Separate 5,717,609 98,861,331 104,578,940 (21,081,723) (49,460,678) (70,542,401) 23,636,752 (19,685,636) 3,951,116Centrales Hidroeléctricas
de Aysén S.A. Separate 3,880,921 50,729,673 54,610,594 (3,904,367) (327,633) (4,232,000) — (3,665,300) (3,665,300)Endesa Brasil S.A. Separate 269,141,0821,085,178,3001,354,319,382 (58,046,034) — (58,046,034) 200,739,840 6,041,979 206,781,819Central Geradora
TermeléctricaFortaleza S.A. Separate 67,892,629 162,438,204 230,330,833 (32,581,434) (39,966,450) (72,547,884) 142,546,333 (93,304,291) 49,242,042
Centrais ElétricasCachoeira DouradaS.A. Separate 94,488,048 134,422,068 228,910,116 (13,765,546) (7,521,222) (21,286,768) 115,662,684 (40,215,273) 75,447,411
Compañía deInterconexiónEnergética S.A. Separate 44,440,944 317,628,162 362,069,106 (136,593,186) (108,949,008) (245,542,194) 93,177,151 (94,574,840) (1,397,689)
Compañía deTransmisión delMercosur S.A. Separate 14,503,105 3,826,350 18,329,455 (449,321) (15,233,324) (15,682,645) 2,983,647 (2,420,226) 563,421
Compañía Energética doCeará Separate 177,267,456 737,234,010 914,501,466 (244,318,033) (226,036,818) (470,354,851) 788,759,176(634,806,589)153,952,587
EN−Brasil Comércio eServiços S.A. Separate 1,033,812 54,708 1,088,520 (489,835) — (489,835) 1,879,321 (1,267,362) 611,959
Ampla Energia e ServiçosS.A. Separate 218,527,1581,031,433,8941,249,961,052 (307,918,902) (481,355,952) (789,274,854) 929,116,008(877,038,622) 52,077,386
Ampla Investimentos eServiços S.A. Separate 1,579,764 136,771,841 138,351,605 (60,967,554) — (60,967,554) — 22,325,366 22,325,366
Codensa S.A. E.S.P. Separate 251,294,158 865,089,7331,116,383,891 (262,861,871) (377,891,111) (640,752,982) 723,345,987(599,569,993)123,775,994Empresa de Energía de
Cundinamarca S.A. Separate 10,831,321 46,553,360 57,384,681 (12,615,030) (14,388,879) (27,003,909) 36,621,778 (31,864,753) 4,757,025Empresa Distribuidora
Sur S.A. Separate 110,182,639 320,842,717 431,025,356 (226,189,613) (40,238,648) (266,428,261) 287,867,341(289,486,252) (1,618,911)
F−130

Table of Contents
APPENDIX No. 1 ENERSIS GROUP COMPANIES:
This appendix is part of Note 2.4 “Subsidiaries and jointly−controlled entities.”It presents the Group’s ownership interest in each company.
Taxpayer ID Company Functional % Ownership Interest at 12−31−2011 % Ownership Interest at 12−31−2010No, (RUT) (in alphabetical order) Currency Direct Indirect Total Direct Indirect Total Relation Country Activity
96,773,290−7 Aguas Santiago Poniente S.A. Chilean peso 0.00% 78.88% 78.88% 0.00% 78.88% 78.88% Subsidiary Chile Sanitation ServicesForeign
Ampla Energía e Serviços S.A. Brazilian real 13.68% 78.25% 91.93% 13.68% 78.25% 91.93% Subsidiary BrazilElectric energy production, transportation,and distribution
Foreign Ampla Investimentos e ServiçosS.A. Brazilian real 13.68% 78.25% 91.93% 13.68% 78.25% 91.93% Subsidiary Brazil
Electric energy production, transmission,transformation, distribution, and sales
ForeignAtacama Finance Co Dollar 0.00% 50.00% 50.00% 0.00% 50.00% 50.00%Joint control
CaymanIslands Portfolio company
Foreign Compañía Americana deMultiservicios de Brasil Ltda. Brazilian real 0.00% 0.00% 0.00% 0.00% 99.99% 99.99% Subsidiary Brazil
Purchase and sales of electricity−relatedproducts
Foreign Centrais Elétricas CachoeiraDourada S.A. Brazilian real 0.00% 99.61% 99.61% 0.00% 99.61% 99.61% Subsidiary Brazil Generation and sales of electric energy
76,003,204−2Central Eólica Canela S.A. Chilean peso 0.00% 75.00% 75.00% 0.00% 75.00% 75.00% Subsidiary Chile
Promotion and development of renewableenergy projects
Foreign Central GeneradoraTermoeléctrica Fortaleza S.A. Brazilian real 0.00% 100.00% 100.00% 0.00% 100.00% 100.00%Subsidiary Brazil Development of a thermoelectric project
76,652,400−1 Centrales Hidroeléctricas deAysén S.A. Chilean peso 0.00% 51.00% 51.00% 0.00% 51.00% 51.00%Joint control Chile
Development and running of ahydroelectric project
ForeignCentral Vuelta Obligado S.A.
Argentinepeso 0.00% 34.50% 34.50% 0.00% 0.00% 0.00%Joint control Argentina Electricity generation and sales
99,573,910−0 Chilectra Inversud S.A. Chilean peso 0.00% 100.00% 100.00% 0.00% 100.00% 100.00%Subsidiary Chile Portfolio company96,800,570−7 Chilectra S.A. Chilean peso 99.08% 0.01% 99.09% 99.08% 0.01% 99.09% Subsidiary Chile Participation in companies of any nature
ForeignChinango S.A.C. Peruvian sol 0.00% 80.00% 80.00% 0.00% 80.00% 80.00% Subsidiary Peru
Electric energy generation, sales, anddistribution
Foreign Compañía Americana deMultiservicios de ArgentinaLtda.
Argentinepeso 0.00% 0.00% 0.00% 0.00% 100.00% 100.00%Subsidiary Argentina
Electric network meters, postal, energymeter calibration
96,543,670−1 Compañía Americana deMultiservicios de Chile Ltda. Chilean peso 0.00% 0.00% 0.00% 99.99% 0.00% 99.99% Subsidiary Chile
Purchase and sales of electricity−relatedproducts
Foreign Compañía Americana deMultiservicios de ColombiaLtda.
ColombianPeso 0.00% 0.00% 0.00% 0.00% 100.00% 100.00%Subsidiary Colombia
Technical services in calibration andmetering
Foreign Compañía Americana deMultiservicios del Perú Ltda. Peruvian sol 0.00% 0.00% 0.00% 0.00% 100.00% 100.00%Subsidiary Peru
Purchase, sales, and distribution ofelectricity−related products
Foreign Compañía de InterconexiónEnergética S.A. Brazilian real 0.00% 100.00% 100.00% 0.00% 100.00% 100.00%Subsidiary Brazil
Electric energy production, transportation,and distribution
Foreign Compañía de Transmisión delMercosur S.A.
Argentinepeso 0.00% 99.99% 99.99% 0.00% 99.99% 99.99% Subsidiary Argentina
Electric energy production, transportation,and distribution
ForeignCodensa S.A. E.S.P.
Colombianpeso 12.47% 9.35% 21.82% 12.47% 9.35% 21.82% Subsidiary Colombia Electric energy distribution and sales
Taxpayer ID Company Functional % Ownership Interest at 12−31−2011 % Ownership Interest at 12−31−2010No, (RUT) (in alphabetical order) Currency Direct Indirect Total Direct Indirect Total Relation Country Activity
96,783,220−0 Compañía Eléctrica San Isidro S.A. Chilean peso 0.00% 100.00% 100.00% 0.00% 100.00% 100.00%Subsidiary Chile Complete electric energy cycle96,770,940−9 Compañía Eléctrica Tarapacá S.A. Chilean peso 0.00% 100.00% 100.00% 0.00% 100.00% 100.00%Subsidiary Chile Complete electric energy cycle
Foreign Compañía Energética Do Ceará S.A.Brazilianreal 0.00% 58.87% 58.87% 0.00% 58.87% 58.87%Subsidiary Brazil Complete electric energy cycle
77,625,850−4 Consorcio Ara− Ingendesa Ltda. Chilean peso 0.00% 50.00% 50.00% 0.00% 50.00% 50.00%Joint
control Chile Engineering services
96,764,840−K Constructora y Proyectos Los MaitenesS.A. Chilean peso 0.00% 55.00% 55.00% 0.00% 55.00% 55.00%Subsidiary Chile Construction and facilities
Foreign Distribuidora Eléctrica deCundinamarca S.A. E.S.P.
Colombianpeso 0.00% 49.00% 49.00% 0.00% 49.00% 49.00%
Jointcontrol Colombia Electricity distribution and sales
Foreign Distrilec Inversora S.A.Argentinepeso 27.19% 24.31% 51.50% 27.19% 24.31% 51.50%Subsidiary Argentina Portfolio company
Foreign Edegel S.A.A. Peruvian sol 0.00% 83.60% 83.60% 0.00% 83.60% 83.60%Subsidiary PeruElectric energy generation, sales,and distribution
Foreign Emgesa S.A. E.S.P.Colombianpeso 0.00% 26.87% 26.87% 0.00% 26.87% 26.87%Subsidiary Colombia Electric energy generation
Foreign Empresa de Distribución Eléctrica deLima Norte S.A.A. Peruvian sol 35.02% 30.15% 65.17% 35.02% 30.15% 65.17%Subsidiary Peru
Electric energy distribution andsales
Foreign Empresa de Energía de CundinamarcaS.A.
Colombianpeso 0.00% 49.00% 49.00% 0.00% 49.00% 49.00%
Jointcontrol Colombia
Electric energy distribution andsales
96,588,800−4 Empresa de Ingeniería Ingendesa S.A.Chilean peso 0.00% 100.00% 100.00% 0.00% 100.00% 100.00%Subsidiary Chile Engineering services
Foreign Empresa Distribuidora Sur S.A.Argentinepeso 16.02% 77.21% 93.23% 16.02% 77.21% 93.23%Subsidiary Argentina
Electric energy distribution andsales
96,783,910−8 Empresa Eléctrica de Colina Ltda. Chilean peso 0.00% 100.00% 100.00% 0.00% 100.00% 100.00%Subsidiary ChileComplete energy cycle andrelated supplies
96,589,170−6 Empresa Eléctrica Pangue S.A. Chilean peso 0.00% 94.99% 94.99% 0.00% 94.99% 94.99%Subsidiary Chile Complete electric energy cycle96,504,980−0 Empresa Eléctrica Pehuenche S.A. Chilean peso 0.00% 92.65% 92.65% 0.00% 92.65% 92.65%Subsidiary Chile Complete electric energy cycle91,081,000−6 Endesa Chile S.A. Chilean peso 59.98% 0.00% 59.98% 59.98% 0.00% 59.98%Subsidiary Chile Complete electric energy cycle
Foreign Endesa Argentina S.A.Argentinepeso 0.00% 100.00% 100.00% 0.00% 100.00% 100.00%Subsidiary Argentina Portfolio company
Foreign Endesa Brasil S.A.Brazilianreal 22.06% 49.46% 71.52% 22.06% 49.46% 71.52%Subsidiary Brazil Portfolio company
Foreign Endesa Costanera S.A.Argentinepeso 0.00% 69.76% 69.76% 0.00% 69.76% 69.76%Subsidiary Argentina Electricity generation and sales
F−131

Table of Contents
Company % Ownership Interest at 12−31−2011 % Ownership Interest at 12−31−2010Taxpayer ID No. (RUT) (in alphabetical order) Functional Currency Direct Indirect Total Direct Indirect Total Relation Country Activity
96,827,970−K Endesa Eco S.A. Chilean peso 0.00% 100.00% 100.00% 0.00% 100.00% 100.00%Subsidiary Chile Renewable energy projects96,526,450−7 Endesa Inversiones Generales S.A.Chilean peso 0.00% 100.00% 100.00% 0.00% 100.00% 100.00%Subsidiary Chile Portfolio company
Foreign Energex Co. U.S. dollar 0.00% 50.00% 50.00% 0.00% 50.00% 50.00%Joint
controlCaymanIslands Portfolio company
Foreign EN−Brasil Comércio e ServiçosS.A. Brazilian real 0.00% 99.99% 99.99% 0.00% 99.99% 99.99%Associate Brazil Portfolio company
Foreign Eólica Fanzenda Nova−Geracao eComercializacao de Energia S.A.Brazilian real 0.00% 99.95% 99.95% 0.00% 99.95% 99.95%Associate Brazil
Promotion anddevelopment of renewableenergy projects
96,830,980−3 GasAtacama S.A. U.S. dollar 0.00% 50.00% 50.00% 0.00% 50.00% 50.00%Joint
control ChileAdministration andmanagement of companies
Foreign Gasoducto Atacama ArgentinaS.A. U.S. dollar 0.00% 49.99% 49.99% 0.00% 49.99% 49.99%
Jointcontrol Chile
Transportation of naturalgas
78,882,820−9 Gasoducto Atacama Chile S.A. U.S. dollar 0.00% 50.00% 50.00% 0.00% 50.00% 50.00%Joint
control ChileTransportation of naturalgas
77,032,280−4 Gasoducto Taltal Ltda. Chilean peso 0.00% 50.00% 50.00% 0.00% 50.00% 50.00%Joint
control ChileTransportation of naturalgas
Foreign Generandes Perú S.A. Peruvian sol 0.00% 61.00% 61.00% 0.00% 61.00% 61.00%Subsidiary Peru Portfolio company
76,041,891−9 Hidroaysén Transmisión S.A. Chilean peso 0.00% 51.00% 51.00% 0.00% 51.00% 51.00%Joint
control ChileDevelopment of electricitytransmission systems
Foreign Hidroeléctrica El Chocón S.A. Argentine peso 0.00% 67.67% 67.67% 0.00% 67.67% 67.67%Subsidiary ArgentinaElectric energy productionand sales
Foreign Hidroinvest S.A. Argentine peso 0.00% 96.09% 96.09% 0.00% 96.09% 96.09%Subsidiary Argentina Portfolio company
In application process ICT Servicios Informáticos Ltda. Chilean peso 99.00% 1.00% 100.00% 99.00% 1.00% 100.00%Subsidiary ChileInformation andtechnology services
Foreign Ingendesa do Brasil Ltda. Brazilian real 0.00% 100.00% 100.00% 0.00% 100.00% 100.00%Subsidiary BrazilProject engineeringconsulting
79,913,810−7 Inmobiliaria Manso de VelascoLtda. Chilean peso 99.99% 0.00% 99.99% 99.99% 0.00% 99.99%Subsidiary Chile Construction and works
Foreign Inversiones Distrilima S.A. Peruvian sol 34.99% 15.38% 50.37% 34.99% 15.38% 50.37%Subsidiary Peru Portfolio company
96,887,060−2Inversiones Endesa Norte S.A. Chilean peso 0.00% 100.00% 100.00% 0.00% 100.00% 100.00%Subsidiary Chile
Investment in energyprojects in the northernChile
76,014,570−K Inversiones GasAtacama HoldingLtda. U.S. dollar 0.00% 50.00% 50.00% 0.00% 50.00% 50.00%
Jointcontrol Chile Natural gas transportation
Company % Ownership Interest at 12−31−2011 % Ownership Interest at 12−31−2010Taxpayer ID No. (RUT) (in alphabetical order) Functional Currency Direct Indirect Total Direct Indirect Total Relation Country Activity
Foreign Inversora Codensa S.A.S. Colombian peso 0.00% 100.00% 100.00% 0.00% 100.00% 100.00%Subsidiary ColombiaInvestment in domestic publicenergy services activities
Foreign Investluz S.A. Brazilian real 0.00% 100.00% 100.00% 0.00% 100.00% 100.00%Subsidiary Brazil Portfolio company
96,800,460−3Luz Andes Ltda. Chilean peso 0.00% 100.00% 100.00% 0.00% 100.00% 100.00%Subsidiary Chile
Energy and fueltransportation, distribution,and sales
96905700−K Progas S.A. Chilean peso 0.00% 50.00% 50.00% 0.00% 50.00% 50.00%Joint
control Chile Gas distribution
99,584,600−4Sistema Sec S.A. Chilean peso 0.00% 0.00% 0.00% 0.00% 49.00% 49.00%
Jointcontrol Chile
Supply of signaling,electrification, andcommunications systems
77,047,280−6 Sociedad Agrícola de CamerosLtda. Chilean peso 0.00% 57.50% 57.50% 0.00% 57.50% 57.50%Subsidiary Chile Financial investments
78,970,360−4Sociedad Agrícola eInmobiliaria Pastos VerdesLtda. Chilean peso 0.00% 55.00% 55.00% 0.00% 55.00% 55.00%Subsidiary Chile Financial investments
96,671,360−7 Sociedad Concesionaria TúnelEl Melón S.A. Chilean peso 0.00% 100.00% 100.00% 0.00% 100.00% 100.00%Subsidiary Chile
Execution, construction, andoperation of the El Melóntunnel
79197570−6 Sociedad ConsorcioIngendesa−Ara Limitada Chilean peso 0.00% 50.00% 50.00% 0.00% 50.00% 50.00%
Jointcontrol
Santiago,Chile Engineering services
Foreign Sociedad Portuaria CentralCartagena S.A. Colombian peso 0.00% 99.85% 99.85% 0.00% 99.85% 99.85%Associate Colombia Port administration
Foreign Southern Cone PowerArgentina S.A. Argentine peso 0.00% 100.00% 100.00% 0.00% 100.00% 100.00%Subsidiary Argentina Portfolio company
Foreign Synapsis Argentina S.R.I. Argentine peso 0.00% 0.00% 0.00% 5.00% 95.00% 100.00%Subsidiary Argentina Computer servicesForeign Synapsis Brasil Ltda. Brazilian real 0.00% 0.00% 0.00% 0.00% 100.00% 100.00%Subsidiary Brazil Computer servicesForeign Synapsis Colombia Ltda. Colombian peso 0.00% 0.00% 0.00% 0.20% 99.80% 100.00%Subsidiary Colombia Computer services
ForeignSynapsis Perú S.R.I. Peruvian sol 0.00% 0.00% 0.00% 0.00% 100.00% 100.00%Subsidiary Peru
Computer andtelecommunications servicesand products
96,529,420−1 Synapsis Soluciones y ServiciosIt Ltda. Chilean peso 0.00% 0.00% 0.00% 99.99% 0.01% 100.00%Subsidiary Chile
Supply and sale of computerservices and equipment
Foreign Termoeléctrica José de SanMartín S.A. Argentine peso 0.00% 20.86% 20.86% 0.00% 20.86% 20.86%Associate Argentina
Construction and operation ofcombined cycle plant
Foreign Termoeléctrica ManuelBelgrano S.A. Argentine peso 0.00% 20.86% 20.86% 0.00% 20.86% 20.86%Associate Argentina
Electric energy production,transportation, anddistribution
77,017,930−0 Transmisora Eléctrica deQuillota Ltda. Chilean peso 0.00% 50.00% 50.00% 0.00% 50.00% 50.00%
Jointcontrol Chile
Electric energy transportationand distribution
ForeignTransportadora de Energía S.A.Argentine peso 0.00% 100.00% 100.00% 0.00% 100.00% 100.00%Subsidiary Argentina
Electric energy production,transportation, anddistribution
F−132

Table of Contents
APPENDIX No. 2 CHANGES IN THE SCOPE OF CONSOLIDATION:
This appendix is part of Note 2.4.1 “Changes in the scope of consolidation.”
Incorporated into the scope of consolidation during the 2011 and 2010 fiscal years
% Ownership Interest % Ownership Interestat December 31, 2011 at December 31, 2010
Company Direct Indirect Total Consolidation Method Direct Indirect Total Consolidation Method
ICT Servicios InformáticosLtda. — — — 99.00% 1.00% 100.00%Consolidation
Central Vuelta ObligadoS.A. 0.00% 34.50% 34.50% Joint control
Excluded from the scope of consolidation during the 2011 and 2010 fiscal years
% Ownership Interest % Ownership Interestat December 31, 2011 at December 31, 2010
Company (*) Direct Indirect Total Consolidation Method Direct Indirect Total Consolidation Method
Compañía Americana de Multiservicios deBrasil Ltda. — — — — 0.00% 99.99% 99.99%Consolidation
Compañía Americana de Multiservicios deArgentina Ltda. — — — — 0.00% 100.00% 100.00%Consolidation
Compañía Americana de MultiserviciosLtda. — — — — 99.99% 0.00% 99.99%Consolidation
Compañía Americana de Multiservicios deColombia Ltda. — — — — 0.00% 100.00% 100.00%Consolidation
Compañía Americana de Multiservicios delPerú Ltda. — — — — 0.00% 100.00% 100.00%Consolidation
Synapsis Argentina S.R.L. — — — — 5.00% 95.00% 100.00%ConsolidationSynapsis Brasil Ltda. — — — — 0.00% 100.00% 100.00%ConsolidationSynapsis Colombia Ltda. — — — — 0.20% 99.80% 100.00%ConsolidationSynapsis Perú S.R.L. — — — — 0.00% 100.00% 100.00%ConsolidationSynapsis Soluciones y Servicios IT Ltda. — — — — 99.99% 0.01% 100.00%Consolidation
(*) See Notes 2.4.1 and 11.
F−133

Table of Contents
APPENDIX No. 3 ENERSIS GROUP ASSOCIATED COMPANIES:
This appendix is part of Note 3.h “Investments in associates accounted for using the equity method”.
Taxpayer ID Company Functional % Ownership Interest at 12−31−2011 % Ownership Interest at 12−31−2010No, (RUT) (in alphabetic order) Currency Direct Indirect Total Direct Indirect Total Country Activity
96,806,130−5 Electrogas S.A. U.S. dollar 42.50% 0.00% 42.50% 0.00% 42.50% 42.50% Chile Portfolio company
Foreign Endesa CemsaS.A.
Argentinepeso 0.00% 45.00% 45.00% 0.00% 45.00% 45.00%Argentina Electricity wholesaler
76,418,940−K GNL Chile S.A.Chileanpeso 0.00% 33.33% 33.33% 0.00% 33.33% 33.33% Chile
Promotion of liquefiedgas supply project
76,788,080−4GNL QuinteroS.A. U.S. dollar 0.00% 20.00% 20.00% 0.00% 20.00% 20.00% Chile
Development, design,and supply of a liquidnatural gas regasifyingterminal
96,889,570−2 InversionesElectrogas S.A.
Chileanpeso 0.00% 0.00% 0.00% 0.00% 42.50% 42.50% Chile Portfolio company
Foreign Sacme S.A. U.S. dollar 0.00% 50.00% 50.00% 0.00% 50.00% 50.00%ArgentinaElectric systemsupervision and control
F−134

Table of Contents
APPENDIX No. 4 ADDITIONAL INFORMATION ON FINANCIAL DEBT:
This appendix is part of Note 18 “Other financial liabilities.”
The following tables present the contractual undiscounted cash flows by type of financial debt:
a) Bank borrowings
a. Summary of bank loans by currency and maturity
Current Non−current Current Non−currentMaturity Maturity Maturity Maturity
Country CurrencyNominal
RateOne to Three
Months
Three toTwelveMonths
Total Currentat 12−31−2011
One to ThreeYears
Three to FiveYears
More thanFive Years
Total Non−current at
12−12−31−2011One to Three
Months
Three toTwelveMonths
Total Currentat 12−31−2010
One to ThreeYears
Three toFive Years
More thanFive Years
Total Non−current at
12−31−2010ThCh$ ThCh$ ThCh$ ThCh$ ThCh$ ThCh$ ThCh$ ThCh$ ThCh$ ThCh$ ThCh$ ThCh$ ThCh$ ThCh$
Chile US$ 0.99% 906,389 3,359,497 4,265,886 109,631,899 876,746 — 110,508,645 816,706 18,915,156 19,731,862 3,202,593 83,824,641 — 87,027,234Peru US$ 3.64% 2,810,297 10,519,166 13,329,463 7,864,024 25,087,748 26,158,087 59,109,859 1,458,040 17,809,137 19,267,177 14,419,663 14,145,757 21,661,326 50,226,746Peru Soles 4.62% 431,794 2,987,507 3,419,301 3,362,985 — 38,373,491 41,736,476 1,839,538 1,031,134 2,870,672 32,616,930 — — 32,616,930Argentina US$ 6.16% 2,662,019 9,436,481 12,098,500 17,142,594 1,612,063 — 18,754,657 5,085,358 18,145,263 23,230,621 4,013,855 — — 4,013,855Argentina Ar$ 9.18% 37,689,501 28,405,542 66,095,043 47,915,942 2,458,440 — 50,374,382 14,760,009 24,845,072 39,605,081 29,992,159 2,424,007 — 32,416,166Colombia CPs 6.58% 1,338,154 82,134,906 83,473,060 — — — — 744,241 5,091,793 5,836,034 — 75,664,686 — 75,664,686Brazil US$ 5.90% 644,936 12,599,186 13,244,122 17,532,685 17,877,446 6,352,599 41,762,730 765,141 11,617,821 12,382,962 19,990,693 18,600,098 10,681,077 49,271,868Brazil Reais 10.81% 30,524,862 175,096,068 205,620,930 142,254,517 90,580,272 8,209,057 241,043,846 34,521,334 175,760,765 210,282,099 235,737,812 41,010,710 9,066,992 285,815,514
77,007,952 324,538,353 401,546,305 345,704,646 138,492,715 79,093,234 563,290,595 59,990,367 273,216,141 333,206,508 339,973,705 235,669,899 41,409,395 617,052,999
b. Identification of bank borrowings by company
12−2011Effective Nominal Current Non−current
Taxpayer IDNo, (RUT) Company Country Financial Institution Currency
InterestRate
InterestRate
Less than90 days
More than 90days
TotalCurrent
One to ThreeYears
Three to FiveYears
More thanFive Years
Total Non−current
Foreign Ampla Brazil Banco Itaú Reais 12.47% 6.15% 57,479 1,964,473 2,021,952 — — — —Foreign Ampla Brazil Unibanco Reais 12.49% 6.16% 45,870 1,542,373 1,588,243 — — — —Foreign Ampla Brazil Banco Alfa Reais 12.26% 5.91%1,779,341 12,975,006 14,754,347 — — — —Foreign Ampla Brazil Brasdesco Reais 6.09% 6.09%5,982,354 13,453,719 19,436,073 — — — —Foreign Ampla Brazil Banco do Brasil Reais 12.68% 6.05% 875,019 2,942,372 3,817,391 30,333,452 — — 30,333,452Foreign Ampla Brazil BANCO HSBC Reais 9.73% 9.73% 632,464 22,045,700 22,678,164 — — — —Foreign Ampla Brazil Electrobras Reais 6.02% 6.02% 339,935 1,111,948 1,451,883 2,916,206 5,539,073 725,103 9,180,382Foreign Ampla Brazil Bndes Reais 11.02% 11.02%6,488,408 16,888,622 23,377,030 33,192,137 52,961,281 3,133,364 89,286,782Foreign CGTF
FortalezaBrazil IFC — A US$
7.91% 7.89% 344,277 3,510,015 3,854,292 7,427,750 7,100,739 4,604,499 19,132,988Foreign CGTF
FortalezaBrazil IFC — B US$
2.98% 2.98% 114,099 4,162,847 4,276,946 8,990,990 4,835,251 — 13,826,241Foreign CGTF
FortalezaBrazil IFC — C US$
11.98% 11.96% 108,598 365,176 473,774 875,946 5,584,166 — 6,460,112Foreign CIEN Brazil Banco Santander
Central HispanoReais
13.05% 12.18%1,801,366 59,020,877 60,822,243 — — — —Foreign Coelce Brazil Banco Europeo de
InvestimentosUS$
6.58% 6.58% 19,073 173,334 192,407 237,999 357,290 1,748,100 2,343,389Foreign Coelce Brazil Eletrobras Reais 6.58% 6.58%1,721,402 4,747,664 6,469,066 8,943,102 16,832,769 4,350,590 30,126,461Foreign Coelce Brazil Banco do Brasil Reais 10.75% 10.75%1,310,254 4,235,607 5,545,861 5,443,423 — — 5,443,423Foreign Coelce Brazil Bndes Reais 9.95% 9.95%9,231,834 30,273,652 39,505,486 56,108,514 15,247,149 — 71,355,663Foreign Coelce Brazil Banco do
NordesteReais
13.15% 8.50% 259,136 3,894,055 4,153,191 5,317,683 — — 5,317,683Foreign Coelce Brazil Banco Europeo de
InvestimentosUS$
5.49% 5.49% 58,889 4,387,814 4,446,703 — — — —Foreign Edegel Peru Banco de Crédito US$ 3.97% 3.97% 405,477 1,378,129 1,783,606 — — — —Foreign Edegel Peru Banco de Crédito US$ 3.97% 3.97%1,949,762 5,760,203 7,709,965 1,880,534 — — 1,880,534Foreign Edegel Peru Banco Continental US$ 7.19% 7.19% 280,841 944,367 1,225,208 3,559,934 7,313,080 26,158,087 37,031,101Foreign Edegel Peru Banco Scotiabank US$ 5.70% 5.70% 8,155 1,878,060 1,886,215 — — — —Foreign Edegel Peru Banco Continental Soles 3.80% 3.80% 14,597 1,585,500 1,600,097 — — — —Foreign Edegel Peru Banco Continental Soles 4.30% 4.30% 260 — 260 — — — —Foreign Edegel Peru Banco Scotiabank US$ 5.95% 5.95% 166,062 558,407 724,469 2,423,556 17,774,668 — 20,198,224Foreign Edegel Peru Banco de Crédito US$ 32.27% 9.59% — — — — — — —Foreign Edelnor Peru Banco de Crédito Soles 15.78% 2.60% 37,891 127,413 165,304 305,625 — 3,584,598 3,890,223Foreign Edelnor Peru Banco de Crédito Soles 15.78% 4.00% 37,891 127,413 165,304 305,625 — 3,584,598 3,890,223Foreign Edelnor Peru Banco de Crédito Soles 5.18% 4.00% 32,360 108,816 141,176 261,016 — 3,097,880 3,358,896Foreign Edelnor Peru Banco de Crédito Soles 5.26% 4.00% 15,156 50,965 66,121 122,250 — 1,433,839 1,556,089Foreign Edelnor Peru Banco de Crédito Soles 5.26% 4.00% 63,151 212,355 275,506 509,375 — 5,974,330 6,483,705
12−2010Effective Nominal Current Non−current
Taxpayer IDNo, (RUT) Company Country Financial Institution Currency
InterestRate
InterestRate
Less than90 days
More than 90days
TotalCurrent
One to ThreeYears
Three to FiveYears
More thanFive Years
Total Non−current
Foreign Ampla Brazil Banco Itaú Reais 12.47% 6.15% 101,554 2,149,535 2,251,089 2,014,313 — — 2,014,313Foreign Ampla Brazil Unibanco Reais 12.49% 6.16% 80,587 1,698,892 1,779,479 1,585,020 — — 1,585,020Foreign Ampla Brazil Banco Alfa Reais 12.26% 5.91%2,321,766 3,599,477 5,921,243 14,100,000 — — 14,100,000Foreign Ampla Brazil Brasdesco Reais 6.09% 6.09%7,117,655 13,583,761 20,701,416 18,425,880 — — 18,425,880Foreign Ampla Brazil Banco do Brasil Reais 12.68% 6.05% 763,245 2,538,618 3,301,863 28,701,429 — — 28,701,429Foreign Ampla Brazil BANCO HSBC Reais 9.73% 9.73%1,116,014 24,085,514 25,201,528 21,832,924 — — 21,832,924Foreign Ampla Brazil Electrobras Reais 6.02% 6.02% 183,646 738,057 921,703 1,731,933 3,074,414 589,902 5,396,249Foreign Ampla Brazil Bndes Reais 11.02% 11.02%9,075,941 20,796,621 29,872,562 9,181,709 488,855 — 9,670,564

Foreign CGTFFortaleza
Brazil IFC — A US$7.91% 7.89% 261,361 3,383,432 3,644,793 6,938,582 5,647,394 7,977,977 20,563,953
Foreign CGTFFortaleza
Brazil IFC — B US$2.98% 2.98% 145,163 3,664,317 3,809,480 5,979,125 12,952,704 — 18,931,829
Foreign CGTFFortaleza
Brazil IFC — C US$11.98% 11.96% 106,304 353,577 459,881 848,122 — 2,703,100 3,551,222
Foreign CIEN Brazil Banco SantanderCentral Hispano
Reais13.05% 12.18%3,166,878 64,735,216 67,902,094 60,518,449 — — 60,518,449
Foreign Coelce Brazil Banco Europeo deInvestimentos
US$6.58% 6.58% 18,857 197,806 216,663 2,225,398 — — 2,225,398
Foreign Coelce Brazil Eletrobras Reais 6.58% 6.58%1,521,161 5,224,999 6,746,160 9,147,592 7,457,925 4,670,947 21,276,464Foreign Coelce Brazil Banco do Brasil Reais 10.75% 10.75% 69,396 5,878,755 5,948,151 9,423,706 976,090 — 10,399,796Foreign Coelce Brazil Bndes Reais 9.95% 9.95%7,020,880 25,008,603 32,029,483 59,074,857 29,013,426 3,806,143 91,894,426Foreign Coelce Brazil Banco do
NordesteReais
13.15% 8.50%1,982,611 5,722,717 7,705,328 — — — —Foreign Coelce Brazil Banco Europeo de
InvestimentosUS$
5.49% 5.49% 233,456 4,018,689 4,252,145 3,999,466 — — 3,999,466Foreign Edegel Peru Banco de Crédito US$ 3.97% 3.97% 653,107 1,953,825 2,606,932 4,307,956 4,307,955 — 8,615,911Foreign Edegel Peru Banco de Crédito US$ 3.97% 3.97% 268,854 1,472,491 1,741,345 1,603,280 — — 1,603,280Foreign Edegel Peru Banco Continental US$ 7.19% 7.19% 415,488 645,897 1,061,385 1,957,430 9,837,802 21,661,326 33,456,558Foreign Edegel Peru Banco Scotiabank US$ 5.70% 5.70% 23,655 3,427,268 3,450,923 1,697,864 — — 1,697,864Foreign Edegel Peru Banco Continental Soles 3.80% 3.80% 12,762 42,449 55,211 1,379,498 — — 1,379,498Foreign Edegel Peru Banco Continental Soles 4.30% 4.30% 77,109 167,805 244,914 5,030,048 — — 5,030,048Foreign Edegel Peru Banco Scotiabank US$ 5.95% 5.95% 96,936 10,309,656 10,406,592 — — — —Foreign Edegel Peru Banco de Crédito US$ 32.27% 9.59% — — — 4,853,133 — — 4,853,133Foreign Edelnor Peru Banco de Crédito Soles 15.78% 2.60% 108,895 — 108,895 2,658,128 — — 2,658,128Foreign Edelnor Peru Banco de Crédito Soles 15.78% 4.00% 25,172 83,723 108,895 2,658,128 — — 2,658,128Foreign Edelnor Peru Banco de Crédito Soles 5.18% 4.00% 21,816 72,561 94,377 2,310,826 — — 2,310,826Foreign Edelnor Peru Banco de Crédito Soles 5.26% 4.00% 10,069 — 10,069 1,063,251 — — 1,063,251Foreign Edelnor Peru Banco de Crédito Soles 5.26% 4.00% 41,953 — 41,953 4,430,213 — — 4,430,213
F−135

Table of Contents
c. Identification of bank borrowings by company
12−2011Effective Current Non−current
Taxpayer IDNo, (RUT) Company Country Financial Institution Currency
InterestRate
NominalInterest Rate
Less than90 days
More than90 days
TotalCurrent
One toThree Years
Three toFive Years
More thanFive Years
Total Non−current
Foreign Edelnor Peru Banco de Crédito Soles 15.78% 2.60% 37,891 127,413 165,304 305,625 — 3,584,598 3,890,223Foreign Edelnor Peru Banco de Crédito Soles 6.01% 2.63% 60,638 203,903 264,541 489,101 — — 489,101Foreign Edelnor Peru Banco de Crédito Soles 32.27% 2.64% — — — — — 5,157,627 5,157,627Foreign Edelnor Peru BBVA Soles 5.16% 4.40% 99,201 333,576 432,777 800,145 — 9,525,160 10,325,305Foreign Edelnor Peru Interbank Soles 6.82% 5.72% 32,758 110,153 142,911 264,223 — 2,430,861 2,695,084Foreign Edesur Argentina BBVA Ar$ 21.31% 14.00% 128,257 2,499,512 2,627,769 — — — —
Foreign Edesur ArgentinaBanco de la Ciudad deBuenos Aires Ar$ 14.85% 14.85% 673,842 228,279 902,121 3,245,052 — — 3,245,052
Foreign Edesur Argentina Standard Bank Ar$ 23.67% 17.61% 213,681 718,530 932,211 4,195,131 — — 4,195,131Foreign Edesur Argentina Banco Santander Rio Ar$ 59.77% 15.98% 179,826 604,690 784,516 1,811,063 — — 1,811,063Foreign Edesur Argentina Banco Santander Rio Ar$ 15.17% 15.17% 435,062 483,752 918,814 2,896,973 — — 2,896,973Foreign Edesur Argentina Citibank Ar$ 16.20% 16.20% 6,354,203 1,169,601 7,523,804 9,498,494 — — 9,498,494Foreign Edesur Argentina Banco de Galicia Ar$ 16.27% 16.27% 2,120,536 1,891,956 4,012,492 — — — —Foreign Edesur Argentina Macro Ar$ 24.96% 24.96% 151,298 508,762 660,060 3,474,143 — — 3,474,143Foreign Edesur Argentina Itaú Ar$ 19.91% 19.91% 288,456 4,819,512 5,107,968 2,454,313 — — 2,454,313
Foreign Edesur ArgentinaBanco de la Ciudad deBuenos Aires Ar$ 16.00% 16.00% 124,577 158,143 282,720 1,364,912 — — 1,364,912
Foreign Emgesa Colombia Davivienda CPs 6.99% 6.99% 138,411 8,481,828 8,620,239 — — — —Foreign Emgesa Colombia Bancolombia CPs 6.99% 6.99% 99,148 6,208,686 6,307,834 — — — —Foreign Emgesa Colombia Bancolombia CPs 6.99% 6.99% 326,504 20,008,140 20,334,644 — — — —Foreign Emgesa Colombia BBVA Colombia CPs 6.99% 6.99% 361,976 22,181,880 22,543,856 — — — —
Foreign Emgesa ColombiaBanco Santander CentralHispano CPs 6.99% 6.99% 412,115 25,254,372 25,666,487 — — — —
Foreign Endesa Costanera ArgentinaBanco Provincia deBuenos Aires US$ 32.27% 6.00% — — — — — — —
Foreign Endesa Costanera Argentina Banco Galicia US$ 32.27% 5.44% — — — — — — —Foreign Endesa Costanera Argentina Credit Suisse International US$ 12.85% 12.26% 166,419 3,156,573 3,322,992 2,652,744 — — 2,652,744Foreign Endesa Costanera Argentina Citibank US$ 5.00% 5.00% 156,279 — 156,279 — — — —Foreign Endesa Costanera Argentina Banco Nación Argentina Ar$ 15.82% 15.82% 1,382,931 1,533,096 2,916,027 — — — —Foreign Endesa Costanera Argentina Mediocredito Italyno Ar$ 32.27% 1.75% — — — — — — —Foreign Endesa Costanera Argentina Banco Santander Río Ar$ 15.00% 15.00%10,746,076 1,949,571 12,695,647 — — — —Foreign Endesa Costanera Argentina Banco Itau Ar$ 18.12% 18.12% 3,503,302 — 3,503,302 — — — —Foreign Endesa Costanera Argentina Citibank Ar$ 25.30% 13.00% 1,478,241 — 1,478,241 — — — —Foreign Endesa Costanera Argentina Banco Galicia Ar$ 22.24% 15.00% 1,105,942 — 1,105,942 — — — —Foreign Endesa Costanera Argentina Citibank US$ 5.32% 5.32% 209,622 — 209,622 — — — —
Foreign Endesa Costanera ArgentinaBanco de la Ciudad deBuenos Aires Ar$ 6.70% 6.70% 4,670,705 — 4,670,705 — — — —
Foreign Endesa Costanera Argentina Macro Ar$ 32.27% 14.75% — — — — — — —Foreign Endesa Costanera Argentina Standard Bank Ar$ 15.40% 15.40% 832,611 — 832,611 — — — —Foreign Endesa Costanera Argentina Supervielle Ar$ 28.00% 13.00% 123,454 — 123,454 — — — —91,081,000−6 Endesa Chile Chile B,N,P, Paribas US$ 6.32% 5.96% 53,521 1,002,756 1,056,277 1,915,379 876,746 — 2,792,125
91,081,000−6 Endesa Chile ChileExport DevelopmentCorporation Loan US$ 2.50% 2.50% 379,501 764,980 1,144,481 1,132,904 — — 1,132,904
91,081,000−6 Endesa Chile ChileBanco Bilbao VizcayaArgentaria S,A, US$ 1.83% 1.65% 473,367 1,591,761 2,065,128 106,583,616 — — 106,583,616
Foreign Hidroeléctrica ElChocón Argentina Deutsche Bank US$ 9.16% 3.80% 518,208 1,530,246 2,048,454 3,576,867 402,643 — 3,979,510
Foreign Hidroeléctrica ElChocón Argentina Standard Bank US$ 3.80% 3.80% 1,611,491 4,749,662 6,361,153 10,912,983 1,209,420 — 12,122,403
Foreign Hidroeléctrica ElChocón Argentina ITAU − Syndicated Ar$ 20.10% 18.67% 1,791,907 — 1,791,907 — — — —
Foreign Hidroeléctrica ElChocón Argentina
STANDARD −Syndicated Ar$ 21.27% 18.67% 64,001 1,336,177 1,400,178 — — — —
Foreign Hidroeléctrica ElChocón Argentina
SANTANDER −Syndicated Ar$ 20.10% 20.10% 80,629 1,707,695 1,788,324 — — — —
Foreign Hidroeléctrica ElChocón Argentina
HIPOTECARIO −Syndicated Ar$ 21.96% 18.67% 55,506 1,125,918 1,181,424 — — — —
Foreign Hidroeléctrica ElChocón Argentina GALICIA − Syndicated Ar$ 21.85% 18.67% 26,301 535,888 562,189 — — — —
Foreign Hidroeléctrica ElChocón Argentina Citibank Ar$ 22.39% 14.30% 112,503 1,115,167 1,227,670 1,471,923 — — 1,471,923
Foreign Hidroeléctrica ElChocón Argentina BBVA Ar$ 22.09% 14.50% 152,645 1,527,554 1,680,199 2,019,288 — — 2,019,288
Foreign Hidroeléctrica ElChocón Argentina Macro Ar$ 17.75% 17.75% 233,981 2,275,667 2,509,648 2,994,506 — — 2,994,506
Foreign Hidroeléctrica ElChocón Argentina
Banco Santander Rio −Syndicated Ar$ 17.44% 17.44% 329,514 1,108,036 1,437,550 6,245,072 1,229,220 — 7,474,292
Foreign Hidroeléctrica ElChocón Argentina Banco Industrial de Azul Ar$ 17.14% 17.14% 329,514 1,108,036 1,437,550 6,245,072 1,229,220 — 7,474,292
96,830,980−3 InversionesGasAtacama HoldingChile PNC BANK US$ 32.27% 3.09% — — — — — — —
Total 77,007,952 324,538,353 401,546,305 345,704,646 138,492,715 79,093,234 563,290,595
12−2010Effective Current Non−current
Taxpayer IDNo, (RUT) Company Country Financial Institution Currency
InterestRate
NominalInterest Rate
Less than90 days
More than90 days
TotalCurrent
One toThree Years
Three toFive Years
More thanFive Years
Total Non−current
Foreign Edelnor Peru Banco de Crédito Soles 15.78% 2.60% 25,172 83,723 108,895 2,658,128 — — 2,658,128Foreign Edelnor Peru Banco de Crédito Soles 6.01% 2.63% 1,308,111 334,293 1,642,404 — — — —Foreign Edelnor Peru Banco de Crédito Soles 32.27% 2.64% 134,344 — 134,344 3,591,829 — — 3,591,829Foreign Edelnor Peru BBVA Soles 5.16% 4.40% 74,135 246,580 320,715 6,836,881 — — 6,836,881Foreign Edelnor Peru Interbank Soles 6.82% 5.72% — — — — — — —Foreign Edesur Argentina BBVA Ar$ 21.31% 14.00% 271,817 3,031,502 3,303,319 2,534,402 — — 2,534,402
Foreign Edesur ArgentinaBanco de la Ciudad deBuenos Aires Ar$ 14.85% 14.85% 54,835 182,384 237,219 1,466,744 — — 1,466,744
Foreign Edesur Argentina Standard Bank Ar$ 23.67% 17.61% 156,756 521,383 678,139 3,845,625 727,040 — 4,572,665Foreign Edesur Argentina Banco Santander Rio Ar$ 59.77% 15.98% — 601,759 601,759 2,008,017 — — 2,008,017Foreign Edesur Argentina Banco Santander Rio Ar$ 15.17% 15.17% — 1,354,637 1,354,637 2,530,914 — — 2,530,914Foreign Edesur Argentina Citibank Ar$ 16.20% 16.20% — — — — — — —Foreign Edesur Argentina Banco de Galicia Ar$ 16.27% 16.27% — — — — — — —Foreign Edesur Argentina Macro Ar$ 24.96% 24.96% — — — — — — —Foreign Edesur Argentina Itaú Ar$ 19.91% 19.91% — — — — — — —
Foreign Edesur ArgentinaBanco de la Ciudad deBuenos Aires Ar$ 16.00% 16.00% 39,530 131,479 171,009 957,228 — — 957,228
Foreign Emgesa Colombia Davivienda CPs 6.99% 6.99% — 603,337 603,337 — 7,812,518 — 7,812,518Foreign Emgesa Colombia Bancolombia CPs 6.99% 6.99% — 432,186 432,186 — 23,602,722 — 23,602,722Foreign Emgesa Colombia Bancolombia CPs 6.99% 6.99% — 1,423,236 1,423,236 — 23,817,961 — 23,817,961Foreign Emgesa Colombia BBVA Colombia CPs 6.99% 6.99% 328,989 1,251,871 1,580,860 — 20,431,485 — 20,431,485
Foreign Emgesa ColombiaBanco Santander CentralHispano CPs 6.99% 6.99% 415,252 1,381,163 1,796,415 — — — —
Foreign Endesa Costanera ArgentinaBanco Provincia deBuenos Aires US$ 32.27% 6.00% 605,038 — 605,038 — — — —
Foreign Endesa Costanera Argentina Banco Galicia US$ 32.27% 5.44% 713,260 351,529 1,064,789 — — — —Foreign Endesa Costanera Argentina Credit Suisse International US$ 12.85% 12.26% 643,599 1,931,528 2,575,127 2,055,803 — — 2,055,803Foreign Endesa Costanera Argentina Citibank US$ 5.00% 5.00% 160,286 267,560 427,846 — — — —Foreign Endesa Costanera Argentina Banco Nación Argentina Ar$ 15.82% 15.82% 184,556 2,497,668 2,682,224 1,994,435 — — 1,994,435Foreign Endesa Costanera Argentina Mediocredito Italyno Ar$ 32.27% 1.75% — 963,655 963,655 — — — —Foreign Endesa Costanera Argentina Banco Santander Río Ar$ 15.00% 15.00% 881,772 — 881,772 — — — —Foreign Endesa Costanera Argentina Banco Itau Ar$ 18.12% 18.12% 1,853,593 890,721 2,744,314 — — — —Foreign Endesa Costanera Argentina Citibank Ar$ 25.30% 13.00% — 3,954,652 3,954,652 — — — —

Foreign Endesa Costanera Argentina Banco Galicia Ar$ 22.24% 15.00% 1,808,418 — 1,808,418 — — — —Foreign Endesa Costanera Argentina Citibank US$ 5.32% 5.32% 6,489 426,386 432,875 — — — —
Foreign Endesa Costanera ArgentinaBanco de la Ciudad deBuenos Aires Ar$ 6.70% 6.70% 35,128 1,011,545 1,046,673 — — — —
Foreign Endesa Costanera Argentina Macro Ar$ 32.27% 14.75% 357,550 — 357,550 — — — —Foreign Endesa Costanera Argentina Standard Bank Ar$ 15.40% 15.40% 1,159,080 — 1,159,080 — — — —Foreign Endesa Costanera Argentina Supervielle Ar$ 28.00% 13.00% 1,788,875 — 1,788,875 — — — —91,081,000−6 Endesa Chile Chile B,N,P, Paribas US$ 6.32% 5.96% 60,946 944,030 1,004,976 1,823,007 1,648,517 — 3,471,524
91,081,000−6 Endesa Chile ChileExport DevelopmentCorporation Loan US$ 2.50% 2.50% 356,896 688,663 1,045,559 1,379,586 670,052 — 2,049,638
91,081,000−6 Endesa Chile ChileBanco Bilbao VizcayaArgentaria S,A, US$ 1.83% 1.65% 397,349 17,072,365 17,469,714 — 81,506,072 — 81,506,072
Foreign Hidroeléctrica ElChocón Argentina Deutsche Bank US$ 9.16% 3.80% 1,479,285 7,585,610 9,064,895 979,026 — — 979,026
Foreign Hidroeléctrica ElChocón Argentina Standard Bank US$ 3.80% 3.80% 1,477,401 7,582,650 9,060,051 979,026 — — 979,026
Foreign Hidroeléctrica ElChocón Argentina ITAU − Syndicated Ar$ 20.10% 18.67% 136,513 1,869,470 2,005,983 1,687,700 — — 1,687,700
Foreign Hidroeléctrica ElChocón Argentina
STANDARD −Syndicated Ar$ 21.27% 18.67% 106,749 1,460,783 1,567,532 1,318,645 — — 1,318,645
Foreign Hidroeléctrica ElChocón Argentina
SANTANDER −Syndicated Ar$ 20.10% 20.10% 415,988 1,589,995 2,005,983 1,687,700 — — 1,687,700
Foreign Hidroeléctrica ElChocón Argentina
HIPOTECARIO −Syndicated Ar$ 21.96% 18.67% 88,490 1,223,925 1,312,415 1,106,099 — — 1,106,099
Foreign Hidroeléctrica ElChocón Argentina GALICIA − Syndicated Ar$ 21.85% 18.67% 41,985 582,414 624,399 526,511 — — 526,511
Foreign Hidroeléctrica ElChocón Argentina Citibank Ar$ 22.39% 14.30% 740,013 — 740,013 — — — —
Foreign Hidroeléctrica ElChocón Argentina BBVA Ar$ 22.09% 14.50% 21,510 595,558 617,068 — — — —
Foreign Hidroeléctrica ElChocón Argentina Macro Ar$ 17.75% 17.75% 2,704,496 — 2,704,496 — — — —
Foreign Hidroeléctrica ElChocón Argentina
Banco Santander Rio −Syndicated Ar$ 17.44% 17.44% 1,533,640 2,013,163 3,546,803 8,328,139 1,696,967 — 10,025,106
Foreign Hidroeléctrica ElChocón Argentina Banco Industrial de Azul Ar$ 17.14% 17.14% 378,715 368,379 747,094 — — — —
96,830,980−3 InversionesGasAtacama HoldingChile PNC BANK US$ 32.27% 3.09% 1,515 210,098 211,613 — — — —
Total 59,990,367 273,216,141 333,206,508 339,973,705 235,669,899 41,409,395 617,052,999
F−136

Table of Contents
b) Secured and unsecured liabilities by currency and maturity
d. Summary of secured and unsecured liabilities by currency and maturity
Current Non−current Current Non−currentMaturity Maturity Maturity Maturity
NominalOne to Three
MonthsThree to Twelve
MonthsTotal Current at
12−31−2011 One to Three Years Three to Five YearsMore than Five
YearsTotal Non−current at
12−31−2011One to Three
MonthsThree to
Twelve MonthsTotal Current at
12−31−2010One to Three
YearsThree to Five
YearsMore than Five
YearsTotal Non−current
at 12−31−2010Country Currency rate ThCh$ ThCh$ ThCh$ ThCh$ ThCh$ ThCh$ ThCh$ ThCh$ ThCh$ ThCh$ ThCh$ ThCh$ ThCh$ ThCh$
Chile US$ 8.15% 22,439,241 48,971,036 71,410,277 481,039,815 346,571,275 425,876,193 1,253,487,283 20,226,869 44,237,144 64,464,013 299,076,238 429,205,042 515,592,354 1,243,873,634Chile U.F. 9.71% 41,003,385 39,199,072 80,202,457 89,539,138 263,688,193 527,887,200 881,114,531 8,474,004 33,742,901 42,216,905 77,732,304 187,444,894 542,172,671 807,349,869Peru US$ 6.82% 853,625 2,238,831 3,092,456 15,656,525 27,138,567 24,540,662 67,335,754 870,099 6,351,625 7,221,724 18,968,745 8,678,373 38,097,741 65,744,859Peru Soles 6.75% 31,909,724 18,212,792 50,122,516 81,151,846 50,536,091 48,755,116 180,443,053 19,784,574 22,667,166 42,451,740 64,109,539 68,651,225 59,006,695 191,767,459Argentina Ar$ 11.74% 116,551 4,100,169 4,216,720 — — — — 510,018 9,010,562 9,520,580 4,165,269 — — 4,165,269Colombia CPs 8.76% 17,854,990 68,624,369 86,479,359 299,425,050 335,136,989 589,777,719 1,224,339,758 47,619,509 131,473,631 179,093,140 152,631,795 183,051,591 442,910,408 778,593,794Brazil Reais 12.75% 11,815,750 134,615,237 146,430,987 123,922,410 200,558,653 90,131,132 414,612,195 7,503,875 97,708,841 105,212,716 155,008,143 48,941,503 — 203,949,646
125,993,266 315,961,506 441,954,772 1,090,734,784 1,223,629,768 1,706,968,022 4,021,332,574 104,988,948 345,191,870 450,180,818 771,692,033 925,972,628 1,597,779,869 3,295,444,530
e. Secured and unsecured liabilities by company
12−2011Taxpayer Effective Nominal Current Non−currentID No,(RUT) Company Country Financial Institution Country Currency
InterestRate
InterestRate
Less than 90days
More than 90days Total Current
One to ThreeYears
Three to FiveYears
More thanFive Years
Total Non−current
Foreign Ampla Brazil BONDS Brazil Reais 9.56% 9.56% 6,698,731 102,230,946108,929,677 59,162,266 133,237,309 — 192,399,575Foreign CodensaColombia B5 Colombia CPs 32.27% 8.00% — — — — — — —Foreign CodensaColombia B8 Colombia CPs 9.61% 8.51% 1,601,595 5,385,582 6,987,177 74,917,478 — — 74,917,478Foreign CodensaColombia B102 Colombia CPs 8.81% 7.77% 863,459 2,903,500 3,766,959 6,964,604 52,594,867 — 59,559,471Foreign CodensaColombia B502 Colombia CPs 6.34% 6.21% 142,540 9,063,816 9,206,356 — — — —Foreign CodensaColombia B503 Colombia CPs 6.48% 6.37% 369,477 1,242,417 1,611,894 24,349,062 — — 24,349,062Foreign CodensaColombia B503 Colombia CPs 9.29% 8.17% 467,694 1,572,686 2,040,380 22,071,605 — — 22,071,605Foreign CodensaColombia B102 Colombia CPs 8.62% 7.50% 1,404,776 4,723,752 6,128,528 11,330,829 86,996,017 — 98,326,846Foreign CodensaColombia B103 Colombia CPs 8.81% 7.75% 469,953 1,580,283 2,050,236 3,790,614 32,393,688 — 36,184,302Foreign CodensaColombia B304 Colombia CPs 6.50% 5.13% 346,784 1,166,108 1,512,892 21,620,973 — — 21,620,973Foreign CodensaColombia B604 Colombia CPs 7.42% 6.03% 717,221 2,411,754 3,128,975 5,785,056 46,931,965 — 52,717,021Foreign Coelce Brazil Itaú Brazil Reais 10.47% 10.47% 2,539,943 23,718,519 26,258,462 43,973,620 34,824,619 — 78,798,239Foreign Coelce Brazil Santander Brazil Reais 13.57% 13.57% 2,577,076 8,665,772 11,242,848 20,786,524 32,496,725 90,131,132 143,414,381
Foreign Edegel PeruBANCOCONTINENTAL Peru Soles 6.32% 6.31% — — — — — — —
Foreign Edegel PeruBANCOCONTINENTAL Peru Soles 6.31% 6.28% 75,800 254,886 330,686 611,394 1,775,041 5,728,426 8,114,861
Foreign Edegel PeruBANCOCONTINENTAL Peru Soles 6.28% 6.17% 75,424 253,624 329,048 608,367 6,582,587 — 7,190,954
Foreign Edegel PeruBANCOCONTINENTAL Peru Soles 6.75% 6.11% 64,842 218,041 282,883 4,267,060 — — 4,267,060
Foreign Edegel PeruBANCOCONTINENTAL Peru Soles 6.50% 5.92% 78,051 262,457 340,508 4,868,653 — — 4,868,653
Foreign Edegel PeruBANCOCONTINENTAL Peru Soles 6.44% 6.17% 77,300 259,934 337,234 4,919,966 — — 4,919,966
Foreign Edegel PeruBANCOCONTINENTAL Peru Soles 6.63% 6.33% 79,552 267,504 347,056 4,950,085 — — 4,950,085
Foreign Edegel PeruBANCOCONTINENTAL Peru US$ 6.19% 5.97% 160,276 — 160,276 — — 10,819,378 10,819,378
Foreign Edegel PeruBANCOCONTINENTAL Peru US$ 6.48% 6.06% 83,851 281,959 365,810 2,639,913 — 8,220,849 10,860,762
Foreign Edegel PeruBANCOCONTINENTAL Peru US$ 9.19% 6.44% 115,630 388,820 504,450 5,903,654 — — 5,903,654
Foreign Edegel PeruBANCOCONTINENTAL Peru US$ 7.94% 7.78% 83,988 282,422 366,410 677,444 6,208,170 — 6,885,614
Foreign Edegel PeruBANCOCONTINENTAL Peru US$ 7.27% 7.13% 59,850 201,252 261,102 3,783,487 — — 3,783,487
Foreign Edegel PeruBANCOSCOTIABANK Peru US$ 6.76% 6.63% 87,568 294,460 382,028 706,319 6,190,863 — 6,897,182
Foreign Edegel PeruBANCOSCOTIABANK Peru US$ 6.12% 6.00% 79,307 266,681 345,988 639,685 6,096,813 — 6,736,498
Foreign Edegel PeruBANCOSCOTIABANK Peru US$ 6.60% 6.10% 85,503 287,515 373,018 689,660 6,853,252 — 7,542,912
Foreign Edegel PeruBANCOCONTINENTAL Peru Soles 6.59% 6.23% 89,628 301,387 391,015 5,873,636 — — 5,873,636
Foreign Edegel PeruBANCOCONTINENTAL Peru Soles 6.47% 6.47% 77,676 261,195 338,871 5,051,067 — — 5,051,067
Foreign Edegel PeruBANCOCONTINENTAL Peru Soles 6.16% 6.09% 73,923 248,577 322,500 5,114,463 — — 5,114,463
Foreign Edegel PeruBANCOCONTINENTAL Peru Soles 32.27% 6.16% — — — — — — —
Foreign Edegel PeruBANCOCONTINENTAL Peru US$ 6.06% 6.06% 97,652 235,722 333,374 616,363 1,789,469 5,500,435 7,906,267
12−2010Taxpayer Effective Nominal Current Non−currentID No,(RUT) Company Country Financial Institution Country Currency
InterestRate
InterestRate
Less than 90days
More than 90days
TotalCurrent
One to ThreeYears
Three to FiveYears
More thanFive Years
Total Non−current
Foreign Ampla Brazil BONDS Brazil Reais 9.56% 9.56% 5,058,194 66,186,606 71,244,800 115,328,463 32,291,490 — 147,619,953Foreign CodensaColombia B5 Colombia CPs 32.27% 8.00%34,864,627 14,808,827 49,673,454 — — — —Foreign CodensaColombia B8 Colombia CPs 9.61% 8.51% 1,305,256 4,341,394 5,646,650 60,819,262 — — 60,819,262

Foreign CodensaColombia B102 Colombia CPs 8.81% 7.77% 700,056 2,328,447 3,028,503 — — 94,695,348 94,695,348Foreign CodensaColombia B502 Colombia CPs 6.34% 6.21% 128,474 427,314 555,788 8,288,014 — — 8,288,014Foreign CodensaColombia B503 Colombia CPs 6.48% 6.37% 333,765 1,110,132 1,443,897 21,659,750 19,672,953 — 41,332,703Foreign CodensaColombia B503 Colombia CPs 9.29% 8.17% 378,323 1,258,334 1,636,657 21,257,241 — — 21,257,241Foreign CodensaColombia B102 Colombia CPs 8.62% 7.50% 1,124,031 3,738,624 4,862,655 — 36,313,095 80,644,446 116,957,541Foreign CodensaColombia B103 Colombia CPs 8.81% 7.75% 380,204 1,264,592 1,644,796 — — 26,883,291 26,883,291Foreign CodensaColombia B304 Colombia CPs 6.50% 5.13% 251,482 836,452 1,087,934 — — 20,546,246 20,546,246Foreign CodensaColombia B604 Colombia CPs 7.42% 6.03% 536,552 1,784,618 2,321,170 — — — —Foreign Coelce Brazil Itaú Brazil Reais 10.47% 10.47% 846,422 26,202,959 27,049,381 — — — —Foreign Coelce Brazil Santander Brazil Reais 13.57% 13.57% 1,599,259 5,319,276 6,918,535 39,679,680 16,650,013 — 56,329,693
Foreign Edegel PeruBANCOCONTINENTAL Peru Soles 6.32% 6.31% 4,162,360 — 4,162,360 — — — —
Foreign Edegel PeruBANCOCONTINENTAL Peru Soles 6.31% 6.28% 66,273 220,431 286,704 528,747 1,293,774 5,217,004 7,039,525
Foreign Edegel PeruBANCOCONTINENTAL Peru Soles 6.28% 6.17% 65,396 217,512 282,908 521,745 1,276,641 4,424,723 6,223,109
Foreign Edegel PeruBANCOCONTINENTAL Peru Soles 6.75% 6.11% 56,693 188,567 245,260 452,314 3,464,092 — 3,916,406
Foreign Edegel PeruBANCOCONTINENTAL Peru Soles 6.50% 5.92% 68,242 226,979 295,221 4,482,746 — — 4,482,746
Foreign Edegel PeruBANCOCONTINENTAL Peru Soles 6.44% 6.17% 67,586 224,796 292,382 4,524,506 — — 4,524,506
Foreign Edegel PeruBANCOCONTINENTAL Peru Soles 6.63% 6.33% 69,554 231,344 300,898 4,557,650 — — 4,557,650
Foreign Edegel PeruBANCOCONTINENTAL Peru US$ 6.19% 5.97% 269,406 4,353,667 4,623,073 626,739 — 5,590,323 6,217,062
Foreign Edegel PeruBANCOCONTINENTAL Peru US$ 6.48% 6.06% 75,208 250,147 325,355 428,296 — 3,383,243 3,811,539
Foreign Edegel PeruBANCOCONTINENTAL Peru US$ 9.19% 6.44% 103,734 345,028 448,762 600,026 1,468,183 7,663,880 9,732,089
Foreign Edegel PeruBANCOCONTINENTAL Peru US$ 7.94% 7.78% 75,334 250,569 325,903 601,038 1,470,659 4,120,651 6,192,348
Foreign Edegel PeruBANCOCONTINENTAL Peru US$ 7.27% 7.13% 53,683 178,554 232,237 532,248 846,573 5,665,215 7,044,036
Foreign Edegel PeruBANCOSCOTIABANK Peru US$ 6.76% 6.63% 78,556 261,284 339,840 567,661 — 5,504,523 6,072,184
Foreign Edegel PeruBANCOSCOTIABANK Peru US$ 6.12% 6.00% 71,151 236,654 307,805 608,863 — 6,169,906 6,778,769
Foreign Edegel PeruBANCOSCOTIABANK Peru US$ 6.60% 6.10% 76,315 253,831 330,146 827,616 4,892,958 — 5,720,574
Foreign Edegel PeruBANCOCONTINENTAL Peru Soles 6.59% 6.23% 78,364 260,646 339,010 625,209 4,767,047 — 5,392,256
Foreign Edegel PeruBANCOCONTINENTAL Peru Soles 6.47% 6.47% 67,914 225,888 293,802 4,639,193 — — 4,639,193
Foreign Edegel PeruBANCOCONTINENTAL Peru Soles 6.16% 6.09% 64,633 214,975 279,608 164,402 — — 164,402
Foreign Edegel PeruBANCOCONTINENTAL Peru Soles 32.27% 6.16% 77,560 5,057,591 5,135,151 — — — —
Foreign Edegel PeruBANCOCONTINENTAL Peru US$ 6.06% 6.06% 66,712 221,891 288,603 13,746,666 — — 13,746,666
F−137

Table of Contents
f. Secured and unsecured liabilities by company
12−2011Effective Nominal Current Non−current
Taxpayer IDNo, (RUT) Company Country Financial Institution Country Currency
InterestRate
InterestRate
Less than 90days
More than 90days Total Current
One to ThreeYears
Three to FiveYears
More than FiveYears
Total Non−current
Foreign Edegel PeruBANCOCONTINENTAL Peru US$ 32.27% 5.79% — — — — — — —
Foreign Edelnor PeruMilitary / Police pensionfund Peru Soles 5.45% 5.44% 63,823 214,613 278,436 5,077,124 — — 5,077,124
Foreign Edelnor Peru FCR − Macrofund Peru Soles 6.44% 1.27% 76,203 256,244 332,447 5,180,728 — — 5,180,728
Foreign Edelnor PeruRimac Internacional Ciade Seguros Peru Soles 6.48% 6.48% 151,944 510,933 662,877 10,342,337 — — 10,342,337
Foreign Edelnor PeruRimac Internacional Ciade Seguros Peru Soles 32.27% 0.48% — — — — — — —
Foreign Edelnor Peru AFP Integra Peru Soles 14.00% 14.00% 126,147 424,187 550,334 1,017,494 — 5,991,693 7,009,187Foreign Edelnor Peru Retirement Insurance
fund forNoncommissionedOfficers and Specialists −Fosersoe
Peru Soles
7.44% 7.31% 107,277 360,734 468,011 865,289 2,512,167 6,209,886 9,587,342Foreign Edelnor Peru AFP Integra Peru Soles 7.88% 7.31% 15,147 821,547 836,694 — — — —Foreign Edelnor Peru Social Health Insurance −
EssaludPeru Soles
7.57% 7.56% 54,563 183,474 238,037 2,962,950 — — 2,962,950Foreign Edelnor Peru AFP Profuturo Peru Soles 8.17% 7.56% 70,593 237,379 307,972 569,399 4,271,435 — 4,840,834Foreign Edelnor Peru AFP Integra Peru Soles 7.23% 7.22% 52,086 175,146 227,232 420,122 3,482,779 — 3,902,901Foreign Edelnor Peru AFP Horizonte Peru Soles 7.06% 7.06% 62,548 210,325 272,873 504,506 4,816,026 — 5,320,532Foreign Edelnor Peru AFP Integra Peru Soles 8.01% 7.06% 104,593 351,709 456,302 843,643 — 6,430,925 7,274,568Foreign Edelnor Peru AFP Integra Peru Soles 6.67% 6.66% 48,033 161,519 209,552 3,034,955 — — 3,034,955Foreign Edelnor Peru FCR − Macrofund Peru Soles 5.70% 5.69% 3,926,418 — 3,926,418 — — — —Foreign Edelnor Peru AFP Profuturo Peru Soles 5.91% 5.69% 56,814 191,045 247,859 458,259 3,910,505 — 4,368,764Foreign Edelnor Peru AFP Integra Peru Soles 5.97% 5.91% 7,975,989 7,975,989 — — — —Foreign Edelnor Peru AFP Horizonte Peru Soles 6.94% 5.97% 133,328 448,335 581,663 1,075,419 8,019,674 — 9,095,093Foreign Edelnor Peru AFP Prima Peru Soles 6.94% 6.94% 6,065,488 — 6,065,488 — — — —Foreign Edelnor Peru AFP Prima Peru Soles 6.85% 6.56% 98,656 6,111,343 6,209,999 — — — —Foreign Edelnor Peru AFP Prima Peru Soles 7.13% 5.94% 68,516 230,393 298,909 552,643 5,457,537 — 6,010,180Foreign Edelnor Peru AFP Integra Peru Soles 6.29% 5.94% 60,381 203,039 263,420 3,893,541 — — 3,893,541Foreign Edelnor Peru Mapfre Peru Cia de
SegurosPeru Soles
6.82% 6.28% 81,845 275,214 357,059 5,284,017 — — 5,284,017Foreign Edelnor Peru AFP Prima Peru Soles 7.13% 6.81% 85,597 287,833 373,430 690,422 5,790,825 — 6,481,247Foreign Edelnor Peru AFP Prima Peru Soles 32.27% 7.13% — — — — — — —Foreign Edelnor Peru AFP Prima Peru Soles 7.72% 7.50% 111,264 374,141 485,405 — — 6,004,573 6,004,573Foreign Edelnor Peru AFP Prima Peru Soles 8.32% 7.72% 51,945 2,662,041 2,713,986 — — — —Foreign Edelnor Peru AFP Profuturo Peru Soles 32.27% 8.25% — — — — — — —Foreign Edelnor Peru AFP Profuturo Peru Soles 32.27% 7.81% — — — — — — —Foreign Edelnor Peru AFP Profuturo Peru Soles 7.82% 7.81% 4,936,463 — 4,936,463 — — — —Foreign Edelnor Peru AFP Profuturo Peru Soles 7.91% 7.91% 6,276,791 — 6,276,791 — — — —Foreign Edelnor Peru AFP Profuturo Peru Soles 8.07% 6.56% 96,506 324,515 421,021 778,412 — 4,863,685 5,642,097Foreign Edelnor Peru Fondo Mi Vivienda Peru Soles 6.57% 6.56% 92,948 312,552 405,500 — — 6,177,926 6,177,926Foreign Edelnor Peru Atlantic Security Bank Peru Soles 7.07% 6.16% 101,873 342,563 444,436 821,704 — 7,348,002 8,169,706Foreign Edelnor Peru AFP Integra Peru Soles 7.45% 7.44% 63,749 214,363 278,112 514,191 3,917,515 — 4,431,706Foreign Edesur Argentina oeds7 Argentina Ar$ 11.74% 8.00% 116,551 4,100,169 4,216,720 — — — —Foreign Emgesa Colombia B10 Bonds Colombia CPs 32.27% 7.05% — — — — — — —Foreign Emgesa Colombia A−10 Bonds Colombia CPs 8.22% 7.21% 1,150,327 3,868,134 5,018,461 9,278,465 — 56,536,718 65,815,183Foreign Emgesa Colombia B−103 Bonds Colombia CPs 9.97% 5.11% 1,129,556 3,798,288 4,927,844 9,110,927 — 62,840,794 71,951,721Foreign Emgesa Colombia A102 Bonds Colombia CPs 8.13% 6.34% 216,825 729,104 945,929 1,748,896 10,768,120 — 12,517,016Foreign Emgesa Colombia A2−5 Bonds Colombia CPs 5.43% 4.83% 179,093 602,226 781,319 14,001,389 — — 14,001,389Foreign Emgesa Colombia B105 Bonds Colombia CPs 9.27% 4.83% 569,828 1,916,126 2,485,954 28,105,888 — — 28,105,888Foreign Emgesa Colombia B105 Bonds Colombia CPs 9.13% 5.33% 1,328,332 4,466,698 5,795,030 10,714,236 84,115,563 — 94,829,799Foreign Emgesa Colombia A5 Bonds Colombia CPs 32.27% 7.77% — — — — — — —Foreign Emgesa Colombia B9 Bonds Colombia CPs 32.27% 6.07% — — — — — — —Foreign Emgesa Colombia B104 Bonds Colombia CPs 9.28% 7.94% 989,794 3,328,320 4,318,114 7,983,617 — 65,971,663 73,955,280Foreign Emgesa Colombia B104 Bonds Colombia CPs 9.80% 9.80% 354,285 1,191,331 1,545,616 2,857,637 8,296,492 21,943,442 33,097,571Foreign Emgesa Colombia C10 Bonds Colombia CPs 32.27% 8.14% — — — — — — —Foreign Emgesa Colombia E105−5 Bonds Colombia CPs 9.33% 9.27% 556,858 1,872,513 2,429,371 4,491,583 13,040,277 28,416,894 45,948,754Foreign Emgesa Colombia B1 Bonds Colombia CPs 10.17% 7.76% 4,386,227 14,749,291 19,135,518 35,379,018 — 310,816,486 346,195,504Foreign Emgesa Colombia Commercial papers Colombia CPs 10.17% 4.00% 610,366 2,052,440 2,662,806 4,923,173 — 43,251,722 48,174,89591,081,000−6 Endesa
ChileChile The Bank of New York
Mellon — First Issue S−1USA US$
7.88% 7.88% 703,310 2,364,976 3,068,286 5,672,852 16,469,819 84,974,171 107,116,84291,081,000−6 Endesa
ChileChile The Bank of New York
Mellon — First Issue S−2USA US$
8.27% 7.33% 2,204,773 7,413,852 9,618,625 17,783,553 51,630,453 177,679,777 247,093,78391,081,000−6 Endesa
ChileChile The Bank of New York
Mellon — First Issue S−3USA US$
9.21% 8.13% 2,384,734 8,018,994 10,403,728 19,235,104 109,486,718 — 128,721,82291,081,000−6 Endesa
ChileChile Banco Santander Chile
— 264 Series−FChile U.F.
10.59% 6.20% 31,321,953 — 31,321,953 — — — —91,081,000−6 Endesa
ChileChile The Bank of New York
Mellon − 144 − AUSA US$
8.95% 8.35% 4,635,971 15,589,088 20,225,059 218,659,499 — — 218,659,49991,081,000−6 Endesa
ChileChile The Bank of New York
Mellon − 144 − AUSA US$
8.74% 8.63% 457,603 1,538,753 1,996,356 3,690,997 10,715,959 162,562,141 176,969,09791,081,000−6 Endesa
ChileChile Banco Santander Chile
— 317 Series−HChile U.F.
10.66% 6.20% 2,124,125 11,532,964 13,657,089 24,422,163 58,670,925 66,097,899 149,190,98791,081,000−6 Endesa
ChileChile Banco Santander Chile
— 318 Series−KChile U.F.
7.85% 3.80% 1,746,368 5,872,402 7,618,770 14,086,088 40,895,714 145,246,623 200,228,42591,081,000−6 Endesa
ChileChile Banco Santander Chile
— 522 Series−MChile U.F.
8.95% 4.75% 4,973,783 16,725,028 21,698,811 40,118,205 136,748,818 305,217,831 482,084,85494,271,000−3 Enersis Chile Yankee bonds 2016 USA US$ 7.71% 7.40% 2,492,775 8,382,298 10,875,073 20,106,557 158,089,452 — 178,196,00994,271,000−3 Enersis Chile Yankee bonds 2026 USA US$ 6.88% 6.60% 7,638 25,685 33,323 61,611 178,874 660,104 900,58994,271,000−3 Enersis Chile Yankee bonds 2014 USA US$ 7.68% 7.38% 9,552,437 5,637,390 15,189,827 195,829,642 — — 195,829,64294,271,000−3 Enersis Chile UF 269 Bonds Chile U.F. 10.36% 5.75% 837,156 5,068,678 5,905,834 10,912,682 27,372,736 11,324,847 49,610,265
Total 125,993,266 315,961,506 441,954,7721,090,734,7841,223,629,768 1,706,968,0224,021,332,574
12−2010Effective Nominal Current Non−current
Taxpayer IDNo, (RUT) Company Country Financial Institution Country Currency
InterestRate
InterestRate
Less than 90days
More than 90days Total Current
One to ThreeYears
Three to FiveYears
More than FiveYears
Total Non−current

Foreign Edegel Peru BANCO CONTINENTAL Peru US$ 32.27% 5.79% — — — 429,592 — — 429,592Foreign Edelnor Peru Military / Police pension fund Peru Soles 5.45% 5.44% 53,845 179,094 232,939 429,592 7,737,244 — 8,166,836Foreign Edelnor Peru FCR − Macrofund Peru Soles 6.44% 1.27% 64,056 213,056 277,112 511,056 4,027,619 — 4,538,675
Foreign Edelnor PeruRimac Internacional Cia deSeguros Peru
Soles6.48% 6.48% 127,846 425,227 553,073 1,019,989 8,041,180 — 9,061,169
Foreign Edelnor PeruRimac Internacional Cia deSeguros Peru
Soles32.27% 0.48% 815,693 — 815,693 — — — —
Foreign Edelnor Peru AFP Integra Peru Soles 14.00% 14.00% 110,243 366,678 476,921 879,547 5,838,330 — 6,717,877Foreign Edelnor Peru Retirement Insurance fund for
Noncommissioned Officers andSpecialists — Fosersoe
Peru Solses
7.44% 7.31% 3,352,913 — 3,352,913 — — — —Foreign Edelnor Peru AFP Integra Peru Soles 7.88% 7.31% 13,176 43,824 57,000 719,004 — — 719,004Foreign Edelnor Peru Social Health Insurance −
EssaludPeru Soles
7.57% 7.56% 47,638 158,449 206,087 — 2,752,371 — 2,752,371Foreign Edelnor Peru AFP Profuturo Peru Soles 8.17% 7.56% 61,654 205,067 266,721 491,892 3,713,379 — 4,205,271Foreign Edelnor Peru AFP Integra Peru Soles 7.23% 7.22% 45,473 151,246 196,719 362,794 3,026,055 — 3,388,849Foreign Edelnor Peru AFP Horizonte Peru Soles 7.06% 7.06% 3,371,548 — 3,371,548 — — — —Foreign Edelnor Peru AFP Integra Peru Soles 8.01% 7.06% 91,381 303,942 395,323 729,064 1,836,652 — 2,565,716Foreign Edelnor Peru AFP Integra Peru Soles 6.67% 6.66% 41,929 139,461 181,390 — 2,791,758 — 2,791,758Foreign Edelnor Peru FCR − Macrofund Peru Soles 5.70% 5.69% 47,769 158,885 206,654 3,379,468 — — 3,379,468Foreign Edelnor Peru AFP Profuturo Peru Soles 5.91% 5.69% 49,607 164,996 214,603 395,775 3,710,199 — 4,105,974Foreign Edelnor Peru AFP Integra Peru Soles 5.97% 5.91% 100,263 333,484 433,747 6,863,872 — — 6,863,872Foreign Edelnor Peru AFP Horizonte Peru Soles 6.94% 5.97% 116,536 387,610 504,146 929,757 7,552,392 — 8,482,149Foreign Edelnor Peru AFP Prima Peru Soles 6.94% 6.94% 82,678 274,994 357,672 — — 5,217,603 5,217,603Foreign Edelnor Peru AFP Prima Peru Soles 6.85% 6.56% 86,221 286,779 373,000 5,342,274 — — 5,342,274Foreign Edelnor Peru AFP Prima Peru Soles 7.13% 5.94% 3,382,087 — 3,382,087 — — — —Foreign Edelnor Peru AFP Integra Peru Soles 6.29% 5.94% 52,756 175,472 228,228 3,577,649 — — 3,577,649Foreign Edelnor Peru Mapfre Peru Cia de Seguros Peru Soles 6.82% 6.28% 71,523 237,891 309,414 570,628 4,283,441 — 4,854,069Foreign Edelnor Peru AFP Prima Peru Soles 7.13% 6.81% 74,804 248,804 323,608 596,804 — 1,147,374 1,744,178Foreign Edelnor Peru AFP Prima Peru Soles 32.27% 7.13% 62,993 3,415,752 3,478,745 — — — —Foreign Edelnor Peru AFP Prima Peru Soles 7.72% 7.50% 97,245 323,445 420,690 5,579,682 — — 5,579,682Foreign Edelnor Peru AFP Prima Peru Soles 8.32% 7.72% 45,381 150,941 196,322 2,331,681 — — 2,331,681Foreign Edelnor Peru AFP Profuturo Peru Soles 32.27% 8.25% 1,850,054 940,321 2,790,375 — — — —Foreign Edelnor Peru AFP Profuturo Peru Soles 32.27% 7.81% 83,531 4,519,744 4,603,275 — — — —Foreign Edelnor Peru AFP Profuturo Peru Soles 7.82% 7.81% 99,607 331,302 430,909 5,395,672 — — 5,395,672Foreign Edelnor Peru AFP Profuturo Peru Soles 7.91% 7.91% 84,342 280,527 364,869 672,899 — 14,378,772 15,051,671Foreign Edelnor Peru AFP Profuturo Peru Soles 8.07% 6.56% 81,231 270,181 351,412 648,082 — 28,621,219 29,269,301Foreign Edelnor Peru Fondo Mi Vivienda Peru Soles 6.57% 6.56% 88,558 294,551 383,109 706,538 — — 706,538Foreign Edelnor Peru Atlantic Security Bank Peru Soles 7.07% 6.16% 55,355 184,114 239,469 441,633 — — 441,633Foreign Edelnor Peru AFP Integra Peru Soles 7.45% 7.44% 130,063 432,600 562,663 1,037,675 2,539,051 — 3,576,726Foreign Edesur Argentinaoeds7 Argentina Ar$ 11.74% 8.00% 510,018 9,010,562 9,520,580 4,165,269 — — 4,165,269Foreign Emgesa ColombiaB10 Bonds Colombia CPs 32.27% 7.05% 925,274 46,241,341 47,166,615 — — — —Foreign Emgesa ColombiaA−10 Bonds Colombia CPs 8.22% 7.21% 928,950 3,089,767 4,018,717 7,411,403 — 58,531,760 65,943,163Foreign Emgesa ColombiaB−103 Bonds Colombia CPs 9.97% 5.11% — 3,417,457 3,417,457 — — 59,944,656 59,944,656Foreign Emgesa ColombiaA102 Bonds Colombia CPs 8.13% 6.34% 127,910 425,441 553,351 1,020,502 — — 1,020,502Foreign Emgesa ColombiaA2−5 Bonds Colombia CPs 5.43% 4.83% 920,115 3,060,381 3,980,496 7,340,914 — 12,326,963 19,667,877Foreign Emgesa ColombiaB105 Bonds Colombia CPs 9.27% 4.83% 631,089 16,269,543 16,900,632 — — — —Foreign Emgesa ColombiaB105 Bonds Colombia CPs 9.13% 5.33% 525,615 1,748,240 2,273,855 4,193,491 23,479,236 — 27,672,727Foreign Emgesa ColombiaA5 Bonds Colombia CPs 32.27% 7.77% 1,870,289 2,803,288 4,673,577 8,619,110 74,169,812 — 82,788,922Foreign Emgesa ColombiaB9 Bonds Colombia CPs 32.27% 6.07% 454,112 1,510,415 1,964,527 3,623,022 8,865,052 27,196,423 39,684,497Foreign Emgesa ColombiaB104 Bonds Colombia CPs 9.28% 7.94% 774,134 2,574,836 3,348,970 6,176,240 15,112,435 42,007,978 63,296,653Foreign Emgesa ColombiaB104 Bonds Colombia CPs 9.80% 9.80% — — — — — — —Foreign Emgesa ColombiaC10 Bonds Colombia CPs 32.27% 8.14% 278,613 926,691 1,205,304 2,222,846 5,439,008 20,133,297 27,795,151Foreign Emgesa ColombiaE105−5 Bonds Colombia CPs 9.33% 9.27% — — — — — — —Foreign Emgesa ColombiaB1 Bonds Colombia CPs 10.17% 7.76% — — — — — — —Foreign Emgesa ColombiaCommercial papers Colombia CPs 10.17% 4.00% 180,638 17,507,497 17,688,135 — — — —91,081,000−6 Endesa
ChileChile The Bank of New York Mellon
— First Issue S−1USA US$
7.88% 7.88% 3,258,258 — 3,258,258 — — 133,240,165 133,240,16591,081,000−6 Endesa
ChileChile The Bank of New York Mellon
— First Issue S−2USA US$
8.27% 7.33% 1,800,577 1,800,577 — — 67,013,806 67,013,80691,081,000−6 Endesa
ChileChile The Bank of New York Mellon
— First Issue S−3USA US$
9.21% 8.13% 1,995,692 6,202,409 8,198,101 — — 14,515,600 14,515,60091,081,000−6 Endesa
ChileChile Banco Santander Chile − 264
Series−FChile U.F.
10.59% 6.20% 1,277,966 2,083,536 3,361,502 6,435,714 19,069,273 23,877,508 49,382,49591,081,000−6 Endesa
ChileChile The Bank of New York Mellon
− 144 − AUSA US$
8.95% 8.35% — 13,893,834 13,893,834 86,790,375 143,546,561 157,010,138 387,347,07491,081,000−6 Endesa
ChileChile The Bank of New York Mellon
− 144 − AUSA US$
8.74% 8.63% 3,450,641 10,287,028 13,737,669 186,924,716 110,135,092 — 297,059,80891,081,000−6 Endesa
ChileChile Banco Santander Chile − 317
Series−HChile U.F.
10.66% 6.20% 1,436,610 10,440,417 11,877,027 21,414,704 53,101,972 61,491,208 136,007,88491,081,000−6 Endesa
ChileChile Banco Santander Chile − 318
Series−KChile U.F.
7.85% 3.80% 1,284,413 4,272,071 5,556,484 10,247,385 25,073,983 131,684,135 167,005,50391,081,000−6 Endesa
ChileChile Banco Santander Chile − 522
Series−MChile U.F.
8.95% 4.75% 3,759,700 12,505,089 16,264,789 29,995,867 73,395,881 304,052,705 407,444,45394,271,000−3 Enersis Chile Yankee bonds 2016 USA US$ 7.71% 7.40% 2,270,849 7,553,041 9,823,890 — — 143,190,238 143,190,23894,271,000−3 Enersis Chile Yankee bonds 2026 USA US$ 6.88% 6.60% 6,958 23,144 30,102 55,516 135,840 622,407 813,76394,271,000−3 Enersis Chile Yankee bonds 2014 USA US$ 7.68% 7.38% 7,443,894 6,277,688 13,721,582 25,305,631 175,387,549 — 200,693,18094,271,000−3 Enersis Chile UF 269 Bonds Chile U.F. 10.36% 5.75% 715,315 4,441,788 5,157,103 9,638,634 16,803,785 21,067,115 47,509,534
Total 104,988,948 345,191,870 450,180,818 771,692,033 925,972,628 1,597,779,8693,295,444,530
F−138

Table of Contents
c) Financial lease obligations
g. Financial lease obligations by company
12−2011Taxpayer Financial Current Non−CurrentID No,(RUT) Company Country
InstitutionID No. Financial Institution Country Currency
NominalInterest Rate
Less than 90Days
More than90 Days
TotalCurrent
One toThree Years
Three toFive Years
More thanFive Years
Total Non−Current
91,081,000−6 EndesaChile
Chile 87,509,100−K Leasing AbengoaChile
Chile US$6.40% 567,586 1,900,568 2,468,154 4,556,135 12,220,275 10,867,880 27,644,290
Foreign Edegel Peru Foreign Scotiabank Peru US$ 5.16% 2,137,134 6,953,795 9,090,929 11,858,222 27,292,271 — 39,150,49396,830,980−3 GasAtacamaChile 96,976,410−5 Gasred S.A. Chile US$ 9.38% — — — — — — —Foreign Edelnor Peru Foreign BBVA Peru Soles 6.40% 1,178,706 3,660,137 4,838,843 2,604,306 — — 2,604,306Foreign Edesur Argentina Foreign COMAFI Argentina Ar$ 3.54% 170,578 411,253 581,831 673,700 — — 673,700
Total 4,054,004 12,925,753 16,979,757 19,692,363 39,512,546 10,867,880 70,072,789
12−2010Taxpayer Financial Current Non−currentID No,(RUT) Company Country
InstitutionID No. Financial Institution Country Currency
NominalInterest Rate
Less than 90Days
More than90 Days
TotalCurrent
One toThree Years
Three toFive Years
More thanFive Years
Total Non−Current
91,081,000−6 EndesaChile
Chile 87,509,100−K Leasing AbengoaChile
Chile US$6.40% 514,759 1,713,147 2,227,906 4,107,030 10,200,414 11,875,674 26,183,118
Foreign Edegel Peru Foreign Scotiabank Peru US$ 5.16% 2,204,779 6,628,821 8,833,600 14,084,254 30,098,142 — 44,182,39696,830,980−3 GasAtacamaChile 96,976,410−5 Gasred S.A. Chile US$ 9.38% 65,489 195,946 261,435 — — — —Foreign Edelnor Peru Foreign BBVA Peru Soles 6.40% 450,157 909,184 1,359,341 2,470,766 — — 2,470,766Foreign Edesur Argentina Foreign COMAFI Argentina Ar$ 3.54% 174,909 581,159 756,068 917,985 225,762 — 1,143,747
Total 3,410,093 10,028,257 13,438,350 21,580,035 40,524,318 11,875,674 73,980,027
d) Other Liabilities
h. Other liabilities by company
12−2011Taxpayer Financial Nominal Current Non−currentID No,(RUT) Company Country
Institution IDNo, Financial Institution Country Currency
InterestRate
Less than 90days
More than90 days
TotalCurrent
One toThree Years
Three toFive Years
More thanFive Years
Total Non−current
Foreign EndesaCostanera
Argentina Foreign Mitsubishi (secureddebt)
Argentina US$16.08% 14,958,554 10,030,787 24,989,341 32,747,272 24,243,194 — 56,990,466
Foreign EndesaCostanera
Argentina Foreign Mitsubishi(unsecured debt)
Argentina US$16.08% 2,296,618 67,527 2,364,145 161,976 1,139,597 — 1,301,573
Foreign EndesaCostanera
Argentina Foreign Other Argentina Ar$17.17% 547,198 884,765 1,431,963 — — — —
96,827,970−K Endesa Eco Chile 96,601,250−1 Inversiones CentinelaS.A.
Chile US$9.90% — 3,930,734 3,930,734 — — — —
Foreign Endesa BrasilBrazil Foreign IFC Brazil US$ 24.09% — — — — — — —96,830,980−3 Inversiones
GasAtacamaHolding
Chile 96,963,440−6 SC GROUP Chile US$
7.50% 10,193,375 — 10,193,375 — — — —
Total 27,995,745 14,913,813 42,909,558 32,909,248 25,382,791 — 58,292,039
12−2010Taxpayer Financial Nominal Current Non−currentID No,(RUT) Company Country
Institution IDNo, Financial Institution Country Currency
InterestRate
Less than 90days
More than90 days
TotalCurrent
One toThree Years
Three toFive Years
More thanFive Years
Total Non−current
Foreign EndesaCostanera
Argentina Foreign Mitsubishi (secureddebt)
Argentina US$16.08% 9,372,718 10,439,827 19,812,545 28,222,904 26,997,497 — 55,220,401
Foreign EndesaCostanera
Argentina Foreign Mitsubishi(unsecured debt)
Argentina US$16.08% 56,194 1,181,656 1,237,850 1,164,650 1,117,531 — 2,282,181
Foreign EndesaCostanera
Argentina Foreign Other Argentina Ar$17.17% 968,330 1,855,135 2,823,465 866,537 — — 866,537
96,827,970−K Endesa Eco Chile 96,601,250−1 Inversiones CentinelaS.A.
Chile US$9.90% — — — 12,395,250 — — 12,395,250
Foreign Endesa BrasilBrazil Foreign IFC Brazil US$ 24.09% 51,831,581 — 51,831,581 — — — —96,830,980−3 Inversiones
GasAtacamaHolding
Chile 96,963,440−6 SC GROUP Chile US$
7.50% — — — — — — —
Total 62,228,823 13,476,618 75,705,441 42,649,341 28,115,028 — 70,764,369
F−139

Table of Contents
APPENDIX No. 5 ASSETS AND LIABILITIES IN FOREIGN CURRENCIES:
This appendix forms an integral part of the Enersis financial statements.The detail of assets and liabilities denominated in foreign currencies is the following:
12−31−2011 12−31−2010Foreign Currency Functional Currency ThCh$ ThCh$
ASSETSCURRENT ASSETS
Cash and cash equivalents 42,323,083 66,329,098U.S. dollar Chilean peso 22,805,258 46,804,371U.S. dollar Colombian peso 5,634 6,004U.S. dollar Peruvian sol 3,201,968 1,234,825U.S. dollar Argentine peso 16,310,223 18,283,898
Trade and other current receivables 10,100,793 17,592,080U.S. dollar Chilean peso 10,100,793 17,592,080
Accounts receivable from related companies 379,862 563,614U.S. dollar Chilean peso 379,862 563,614
Total current assets other than assetsclassified as held for sale anddiscontinued operations 52,803,738 84,484,792
TOTAL CURRENT ASSETS 52,803,738 84,484,792NON−CURRENT ASSETSInvestments accounted for using equity method 9,733,400 2,887,460
U.S. dollar Chilean peso 9,733,400 2,887,460
Goodwill 477,068,142 488,403,515Brazilian real Peruvian sol 10,361,690 10,502,214Brazilian real Chilean peso 313,990,020 327,477,479
Colombian peso Chilean peso 11,589,629 7,348,467Peruvian sol Chilean peso 128,304,143 118,949,428
Argentine peso Chilean peso 12,822,660 24,125,927TOTAL NON−CURRENT ASSETS 486,801,542 491,290,975
TOTAL ASSETS 539,605,280 575,775,767
12−31−2011 12−31−2010Current Liabilities Non−current Liabilities Current Liabilities Non−current Liabilities
Foreign Functional Up to 90 days 91 days to 1 year Total 1 to 3 years 3 to 5 yearsMore than 5
years TotalUp to 90
days91 days to 1
year Total 1 to 3 years 3 to 5 yearsMore than 5
years TotalCurrency Currency ThCh$ ThCh$ Current ThCh$ ThCh$ ThCh$ Non−current ThCh$ ThCh$ Current ThCh$ ThCh$ ThCh$ Non−current
Other currentfinancialliabilities
U.S.dollar 50,273,399 110,007,608 160,281,007 698,191,147 484,059,182 493,795,421 1,676,045,750 93,267,733 137,235,543 230,503,276 419,645,875 622,867,495 537,908,172 1,580,421,542U.S.dollar
Chileanpeso 23,913,216 58,161,835 82,075,051 595,227,849 359,668,296 436,744,073 1,391,640,218 21,623,823 65,061,393 86,685,216 318,781,111 523,230,097 467,468,028 1,309,479,236
U.S.dollar
Brazilianreal 644,936 12,599,186 13,244,122 17,532,685 17,877,446 6,352,599 41,762,730 52,596,722 11,617,821 64,214,543 19,990,693 18,600,098 10,681,077 49,271,868
U.S.dollar
Peruviansol 5,801,056 19,711,792 25,512,848 35,378,771 79,518,586 50,698,749 165,596,106 4,532,918 30,789,583 35,322,501 47,472,662 52,922,272 59,759,067 160,154,001
U.S.dollar
Argentinepeso 19,914,191 19,534,795 39,448,986 50,051,842 26,994,854 — 77,046,696 14,514,270 29,766,746 44,281,016 33,401,409 28,115,028 — 61,516,437
TOTALLIABILITIES 50,273,399 110,007,608 160,281,007 698,191,147 484,059,182 493,795,421 1,676,045,750 93,267,733 137,235,543 230,503,276 419,645,875 622,867,495 537,908,172 1,580,421,542
F−140

Table of Contents
SCHEDULE I
Rule 5−04 of the Securities and Exchange Commission requires presentation of condensed financial statements of the registrant (parent company) whenrestricted net asset, defined as assets not to be transferred to the parent company in the form of loans, advance or cash dividends of the subsidiary withoutthe consent of a third party, exceed of the 25% consolidated net assets of the parent and its subsidiaries.
Following are the Enersis separate statements of financial position as of December 31, 2011 and 2010 and the related statements of comprehensive income,changes in equity and cash flows for each of the three years in the period ended December 31, 2011, have been prepared in accordance with InternationalFinancial Reporting Standards.
ENERSIS S.A.
Separate Statement of Financial PositionAt December 31, 2011 and 2010(In thousands of Chilean pesos − ThCh$)
12−31−2011 12−31−2010ThCh$ ThCh$
ASSETSCURRENT ASSETSCash and cash equivalents 328,709,300 62,696,278Other current non−financial assets 432,477 189,330Trade and other current receivables 5,307,457 2,516,969Accounts receivable from related companies 45,295,153 39,517,364Inventories 5,651,622 4,928,358Current tax assets 10,746,284 9,628,948Total current assets other than assets classified as held for sale anddiscontinued operations 396,142,293 119,477,247
Non−current assets classified as held for sale and discontinued operations — 2,756,706
TOTAL CURRENT ASSETS 396,142,293 122,233,953
NON−CURRENT ASSETSOther non−current financial assets 20,793,960 29,461,230Non−current receivables — 146,500,704Investments in subsidiaries and associates companies 2,407,743,084 2,563,742,088Intangible assets other than goodwill 1,848,204 1,225,648Property, plant and equipment, net 6,831,258 7,186,515Deferred tax assets 39,818,448 42,203,457
TOTAL NON−CURRENT ASSETS 2,477,034,954 2,790,319,642
TOTAL ASSETS 2,873,177,247 2,912,553,595
F−141

Table of Contents
ENERSIS S.A.
Separate Statement of Financial PositionAt December 31, 2011 and 2010(In thousands of Chilean pesos − ThCh$)
12−31−2011ThCh$
12−31−2010ThCh$
LIABILITIES AND EQUITYCURRENT LIABILITIESOther current financial liabilities 12,336,371 11,755,506Trade and other current payables 49,990,132 63,408,992Accounts payable to related companies 79,076,032 111,156,625Other current provisions 13,485,579 14,443,439Current tax liabilities 302,633 194,195Current provisions for employee benefits —Other current non−financial liabilities 341,616 156,045Total current liabilities other than those associated with current assets classified as held for sale and
discontinued operations 155,532,363 201,114,802
Liabilities associated with current assets classified as held for sale and discontinued operations —
TOTAL CURRENT LIABILITIES 155,532,363 201,114,802
NON−CURRENT LIABILITIESOther non−current financial liabilities 553,642,026 550,938,961Deferred tax liabilities 1,833,765 2,092,367Non−current provisions for employee benefits 5,359,699 5,229,738
TOTAL NON−CURRENT LIABILITIES 560,835,490 558,261,066
TOTAL LIABILITIES 716,367,853 759,375,868
EQUITYIssued capital 2,824,882,835 2,824,882,835Retained earnings 486,707,243 495,967,789Share premium 158,759,648 158,759,648Other reserves (1,313,540,332) (1,326,432,545)
TOTAL EQUITY 2,156,809,394 2,153,177,727
TOTAL LIABILITIES AND EQUITY 2,873,177,247 2,912,553,595
F−142
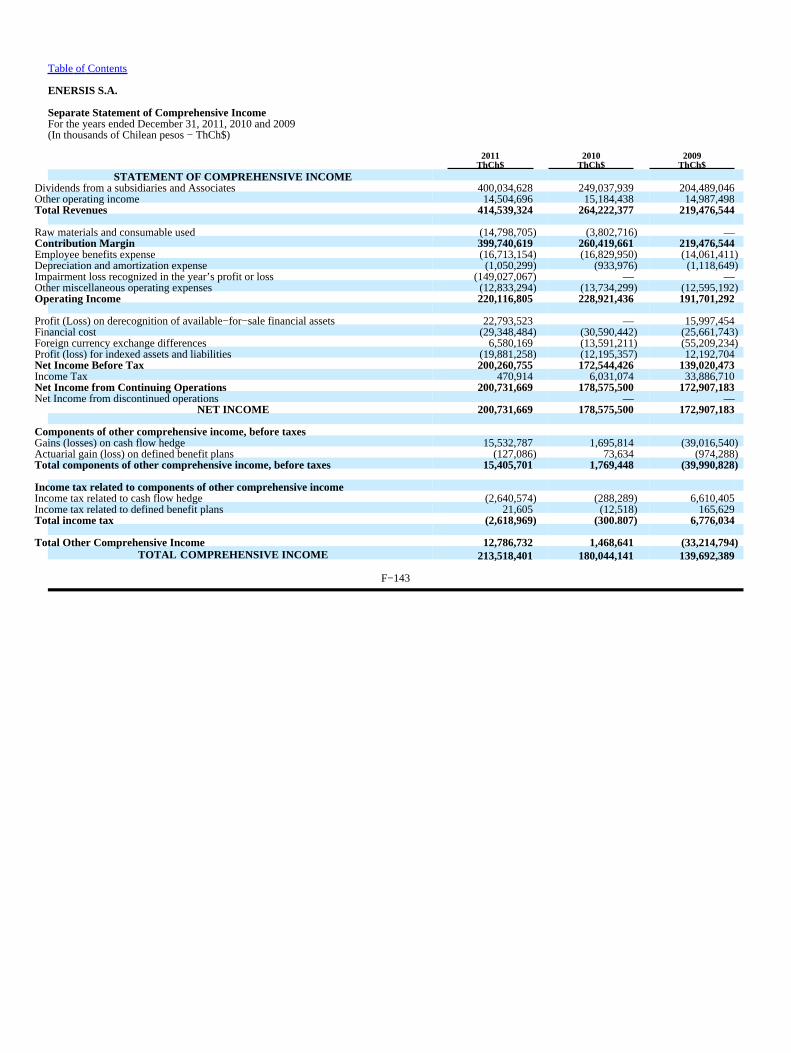
Table of Contents
ENERSIS S.A.
Separate Statement of Comprehensive IncomeFor the years ended December 31, 2011, 2010 and 2009(In thousands of Chilean pesos − ThCh$)
2011ThCh$
2010ThCh$
2009ThCh$
STATEMENT OF COMPREHENSIVE INCOMEDividends from a subsidiaries and Associates 400,034,628 249,037,939 204,489,046Other operating income 14,504,696 15,184,438 14,987,498Total Revenues 414,539,324 264,222,377 219,476,544
Raw materials and consumable used (14,798,705) (3,802,716) —Contribution Margin 399,740,619 260,419,661 219,476,544Employee benefits expense (16,713,154) (16,829,950) (14,061,411)Depreciation and amortization expense (1,050,299) (933,976) (1,118,649)Impairment loss recognized in the year’s profit or loss (149,027,067) — —Other miscellaneous operating expenses (12,833,294) (13,734,299) (12,595,192)Operating Income 220,116,805 228,921,436 191,701,292
Profit (Loss) on derecognition of available−for−sale financial assets 22,793,523 — 15,997,454Financial cost (29,348,484) (30,590,442) (25,661,743)Foreign currency exchange differences 6,580,169 (13,591,211) (55,209,234)Profit (loss) for indexed assets and liabilities (19,881,258) (12,195,357) 12,192,704Net Income Before Tax 200,260,755 172,544,426 139,020,473Income Tax 470,914 6,031,074 33,886,710Net Income from Continuing Operations 200,731,669 178,575,500 172,907,183Net Income from discontinued operations — —
NET INCOME 200,731,669 178,575,500 172,907,183
Components of other comprehensive income, before taxesGains (losses) on cash flow hedge 15,532,787 1,695,814 (39,016,540)Actuarial gain (loss) on defined benefit plans (127,086) 73,634 (974,288)Total components of other comprehensive income, before taxes 15,405,701 1,769,448 (39,990,828)
Income tax related to components of other comprehensive incomeIncome tax related to cash flow hedge (2,640,574) (288,289) 6,610,405Income tax related to defined benefit plans 21,605 (12,518) 165,629Total income tax (2,618,969) (300.807) 6,776,034
Total Other Comprehensive Income 12,786,732 1,468,641 (33,214,794)TOTAL COMPREHENSIVE INCOME 213,518,401 180,044,141 139,692,389
F−143

Table of Contents
ENERSIS S.A.
Separate Statement of Changes in EquityFor the years ended December 31, 2011, 2010 and 2009(In thousands of Chilean pesos − ThCh$)
Changes in other reserves
Statement of Changes in Equity, Net Issued capitalShare
Premium
Reserve ofcash flow
hedge
Reserve ofactuarial gains orlosses on defined
benefit plans
Othermiscellaneous
reserves Other reservesRetainedearnings Total Equity
Equity at beginning of period01/01/2011 2,824,882,835158,759,648(28,319,646) (1,298,112,899)(1,326,432,545)495,967,7892,153,177,727
Changes in equityComprehensive income 12,892,213 (105,481) 12,786,732 200,731,669 213,518,401Net income 200,731,669 200,731,669Other comprehensive income 12,892,213 (105,481) 12,786,732 12,786,732Comprehensive IncomeDividends (209,886,734)(209,886,734)Increase (decrease) through
transfers and other changes 105,481 105,481 (105,481) —Total changes in equity 12,892,213 — 12,892,213 (9,260,546) 3,631,667Equity at end of year 31/12/2011 2,824,882,835158,759,648(15.427.433) — (1,298,112,899)(1,313,540,332)486,707,2432,156,809,394
Changes in other reserves
Statement of Changes in Equity, Net Issued capital Share Premium
Reserve ofcash flow
hedge
Reserve ofactuarial gains orlosses on defined
benefit plans
Othermiscellaneous
reserves Other reservesRetainedearnings Total Equity
Equity at beginning of period01/01/2010 2,824,882,835 158,759,648(29,727,171) — (1,298,112,899)(1,327,840,070)496,953,1862,152,755,599
Changes in equity —Comprehensive income — — 1,407,525 61,116 — 1,468,641 178,575,500 180,044,141Net income 178,575,500 178,575,500Other comprehensive income 1,407,525 61,116 1,468,641 1,468,641Comprehensive Income —Dividends (179,622,013)(179,622,013)Increase (decrease) through
transfers and other changes (61,116) — (61,116) 61,116 —Total changes in equity — — 1,407,525 — — 1,407,525 (985,397) 422,128
Equity at end of year 31/12/2010 2,824,882,835 158,759,648(28,319,646) — (1,298,112,899)(1,326,432,545)495,967,7892,153,177,727
F−144

Table of Contents
ENERSIS S.A.
Separate Statement of Changes in EquityFor the years ended December 31, 2011, 2010 and 2009(In thousands of Chilean pesos − ThCh$)
Changes in others reserves
Statement of Changes in Equity, Net Issued capitalShare
Premium
Reserve ofcash flow
hedge
Reserve ofactuarial gains orlosses on defined
benefit plans
Othermiscellaneous
reserves Other reservesRetainedearnings Total Equity
Equity at beginning of year01/01/2009 2,824,882,835158,759,648 2,678,964 — (1,298,112,899)(1,295,433,935)552,784,9872,240,993,535
Changes in equity —Comprehensive income — — (32,406,135) (808,659) — (33,214,794)172,907,183 139,692,389Net income 172,907,183 172,907,183Other comprehensive income (32,406,135) (808,659) (33,214,794) (33,214,794)Comprehensive Income —Dividends (227,842,344)(227,842,344)Increase (decrease) through
transfers and other changes 808,659 — 808,659 (896,640) (87,981)Total changes in equity — — (32,406,135) — — (32,406,135) (55,831,801) (88,237,936)Equity at end of year 31/12/2009 2,824,882,835158,759,648(29.727.171) — (1,298,112,899(1,327,840,070)496,953,1862,152,755,599
F−145

Table of Contents
ENERSIS S.A.
Separate Statement of Cash FlowsFor the years ended December 31, 2011, 2010 and 2009(In thousands of Chilean pesos − ThCh$)
2011 2010 2009Indirect Statement of Cash Flow ThCh$ ThCh$ ThCh$
Cash flows from (used in) operating activities
Net Income 200,731,669 178,575,500 172,907,183
Adjustments to reconcile net incomeDividend income (381,119,694) (244,247,700) (204,489,046)Adjustments for income tax expense (470,914) (6,031,074) (33,886,710)Adjustments for depreciation and amortization expense 1,050,299 933,976 1,118,649loss (impairment loss) recognized in the year’s profit or loss 149,027,067 — —Loss (gain) on sales of non−current assets not held for sale (22,793,523) — (15,997,454)Adjustments for decrease (increase) in trade accounts receivable (4,025,010) 2,215,824 (1,420,929)Adjustments for decrease (increase) in other operating receivables (*) (11,590,639) 6,145,572 32,600,464Adjustments for increase (decrease) in trade accounts payable (14,364,828) (3,043,769) (32,444,127)Adjustments for increase (decrease) in other operating payables (*) 52,425,061 15,155,991 20,146,477
Total adjustments to reconcile net income (231,862,181) (228,871,180) (234,372,676)
Net cash flows provided by (used in) other operating activities (15,196,733) (18,450,371) (15,213,356)Income tax refund (paid) 636,356 419,096 629,778Other cash inflows (outflows) (**) (15,833,089) (18,869,467) (15,843,134)
Net cash flows from (used in) operating activities (46,327,245) (68,746,051) (76,678,849)
Cash flows from (used in) investing activitiesProceeds from the sale of Other Financial Assets 31,486,668 — 27,081,403Other cash flows provided by (used in) investing activities 161,163,996 17,031,549 89,147,305Proceeds from dividends received classified for investing purposes 374,143,660 211,194,885 289,576,311Purchase of property, plant and equipment (700,846) (236,768) (499,384)Investments in subsidiaries — — (81,549,336)Loans to related companies (2,067,881) (821,636) (4,074,609)Other investment disbursements — (6,356,992) (28,801,680)Net cash flows from (used in) investing activities 564,025,597 220,811,038 290,880,010
Cash flows from (used in) financing activitiesProceeds from loans obtained — 36,500,000Proceeds from loans from related companies 5,536,031 9,363,881Repayments of borrowings (1,943,349) (1,585,498) (148,935,949)Payments of finance lease liabilities — (7,895,140)Payments from loans to related companies (7,072,402)Dividends paid to Non−controlling interests (95,766,907) (59,198,027) (89,894,294)Dividend paid to shareholders of the parent (146,902,672) (61,446,535) (102,539,559)Net cash flows from (used in) financing activities (251,685,330) (116,694,029) (303,401,061)
Net Increase (Decrease) in Cash and Cash Equivalents 266,013,022 35,370,958 (89,199,900)
Cash and cash equivalents at beginning of year 62,696,278 27,325,320 116,525,220Cash and cash equivalents at end of year 328,709,300 62,696,278 27,325,320
(*) Includes accrued interest.(**) Includes interest paid of ThCh$ 25,659,530, ThCh$ 26,402,662 and ThCh$ 32,675,965, respectively.
F−146
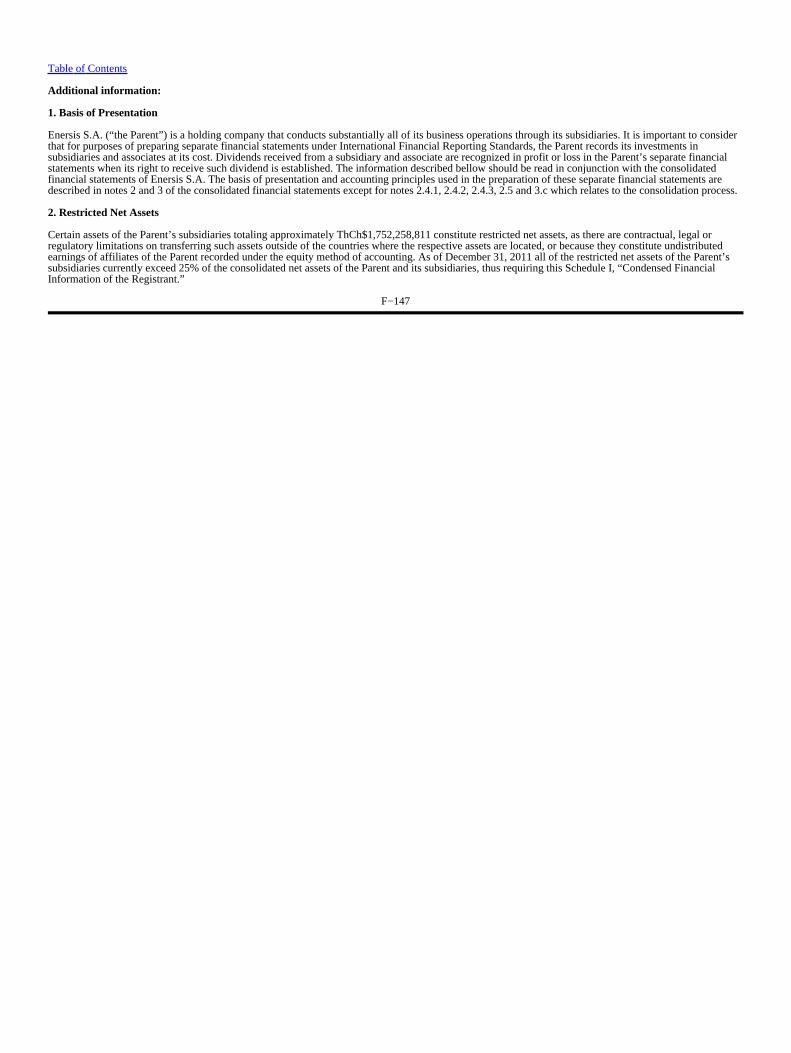
Table of Contents
Additional information:
1. Basis of Presentation
Enersis S.A. (“the Parent”) is a holding company that conducts substantially all of its business operations through its subsidiaries. It is important to considerthat for purposes of preparing separate financial statements under International Financial Reporting Standards, the Parent records its investments insubsidiaries and associates at its cost. Dividends received from a subsidiary and associate are recognized in profit or loss in the Parent’s separate financialstatements when its right to receive such dividend is established. The information described bellow should be read in conjunction with the consolidatedfinancial statements of Enersis S.A. The basis of presentation and accounting principles used in the preparation of these separate financial statements aredescribed in notes 2 and 3 of the consolidated financial statements except for notes 2.4.1, 2.4.2, 2.4.3, 2.5 and 3.c which relates to the consolidation process.
2. Restricted Net Assets
Certain assets of the Parent’s subsidiaries totaling approximately ThCh$1,752,258,811 constitute restricted net assets, as there are contractual, legal orregulatory limitations on transferring such assets outside of the countries where the respective assets are located, or because they constitute undistributedearnings of affiliates of the Parent recorded under the equity method of accounting. As of December 31, 2011 all of the restricted net assets of the Parent’ssubsidiaries currently exceed 25% of the consolidated net assets of the Parent and its subsidiaries, thus requiring this Schedule I, “Condensed FinancialInformation of the Registrant.”
F−147

Exhibit 8.1
List of Main Subsidiaries
Subsidiaries Jurisdiction Usual Name
Ampla Energia e Serviços S.A. Brazil AmplaCentrais Elétricas Cachoeira Dourada S.A. Brazil Cachoeira DouradaCentral Geradora Termelétrica Fortaleza S.A. Brazil Endesa FortalezaChilectra S.A. Chile ChilectraCodensa S.A. E.S.P. Colombia CodensaCompanhia de Interconexão Energética S.A. Brazil CIENCompañía Eléctrica San Isidro S.A. Chile San IsidroCompañía Eléctrica Tarapacá S.A. Chile CeltaCompanhía Energética de Ceará S.A. Brazil CoelceEdegel S.A.A. Peru EdegelEmgesa S.A. E.S.P. Colombia EmgesaEmpresa Distribuidora Sur S.A. Argentina EdesurEmpresa Eléctrica Pangue S.A. Chile PangueEmpresa Eléctrica Pehuenche S.A. Chile PehuencheEmpresa Nacional de Electricidad S.A. Chile Endesa ChileEndesa Brasil S.A. Brazil Endesa BrasilEndesa Costanera S.A. Argentina Endesa CostaneraEndesa Eco S.A. Chile Endesa EcoHidroeléctrica El Chocón S.A. Argentina El ChocónEmpresa de Distribución Eléctrica de Lima Norte S.A.A. Peru Edelnor

Exhibit 12.1
302 CERTIFICATION
I, Ignacio Antoñanzas A., certify that:
1. I have reviewed this annual report on Form 20−F of ENERSIS S.A.;
2. Based on my knowledge, this report does not contain any untrue statement of a material fact or omit to state a material fact necessary to makethe statements made, in light of the circumstances under which such statements were made, not misleading with respect to the period covered by this report;
3. Based on my knowledge, the financial statements, and other financial information included in this report, fairly present in all material respectsthe financial condition, results of operations and cash flows of the company as of, and for, the periods presented in this report;
4. The company’s other certifying officer and I are responsible for establishing and maintaining disclosure controls and procedures (as defined inExchange Act Rules 13a−15(e) and 15d−15(e)) and internal control over financial reporting (as defined in Exchange Act Rules 13a−15(f) and 15d−15(f))for the company and have:
(a) Designed such disclosure controls and procedures, or caused such disclosure controls and procedures to be designed under our supervision, to ensurethat material information relating to the company, including its consolidated subsidiaries, is made known to us by others within those entities, particularlyduring the period in which this report is being prepared;
(b) Designed such internal control over financial reporting, or caused such internal control over financial reporting to be designed under our supervision,to provide reasonable assurance regarding the reliability of financial reporting and the preparation of financial statements for external purposes inaccordance with generally accepted accounting principles;
(c) Evaluated the effectiveness of the company’s disclosure controls and procedures and presented in this report our conclusions about the effectivenessof the disclosure controls and procedures, as of the end of the period covered by this report based on such evaluation; and
(d) Disclosed in this report any change in the company’s internal control over financial reporting that occurred during the period covered by the annualreport that has materially affected, or is reasonably likely to materially affect, the company’s internal control over financial reporting; and
5. The company’s other certifying officer and I have disclosed, based on our most recent evaluation of internal control over financial reporting,to the company’s auditors and the audit committee of the company’s board of directors (or persons performing the equivalent functions):
(a) All significant deficiencies and material weaknesses in the design or operation of internal control over financial reporting which are reasonablylikely to adversely affect the company’s ability to record, process, summarize and report financial information; and
(b) Any fraud, whether or not material, that involves management or other employees who have a significant role in the company’s internal control overfinancial reporting.
Date: April 4, 2012.
/s/ Ignacio Antoñanzas A.
Ignacio Antoñanzas A.Chief Executive Officer

Exhibit 12.2
302 CERTIFICATION
I, Alfredo Ergas S., certify that:
1. I have reviewed this annual report on Form 20−F of ENERSIS S.A.;
2. Based on my knowledge, this report does not contain any untrue statement of a material fact or omit to state a material fact necessary to makethe statements made, in light of the circumstances under which such statements were made, not misleading with respect to the period covered by this report;
3. Based on my knowledge, the financial statements, and other financial information included in this report, fairly present in all material respectsthe financial condition, results of operations and cash flows of the company as of, and for, the periods presented in this report;
4. The company’s other certifying officer and I are responsible for establishing and maintaining disclosure controls and procedures (as defined inExchange Act Rules 13a−15(e) and 15d−15(e)) and internal control over financial reporting (as defined in Exchange Act Rules 13a−15(f) and 15d−15(f))for the company and have:
(a) Designed such disclosure controls and procedures, or caused such disclosure controls and procedures to be designed under our supervision, to ensurethat material information relating to the company, including its consolidated subsidiaries, is made known to us by others within those entities, particularlyduring the period in which this report is being prepared;
(b) Designed such internal control over financial reporting, or caused such internal control over financial reporting to be designed under our supervision,to provide reasonable assurance regarding the reliability of financial reporting and the preparation of financial statements for external purposes inaccordance with generally accepted accounting principles;
(c) Evaluated the effectiveness of the company’s disclosure controls and procedures and presented in this report our conclusions about the effectivenessof the disclosure controls and procedures, as of the end of the period covered by this report based on such evaluation; and
(d) Disclosed in this report any change in the company’s internal control over financial reporting that occurred during the period covered by the annualreport that has materially affected, or is reasonably likely to materially affect, the company’s internal control over financial reporting; and
5. The company’s other certifying officer and I have disclosed, based on our most recent evaluation of internal control over financial reporting,to the company’s auditors and the audit committee of the company’s board of directors (or persons performing the equivalent functions):
(a) All significant deficiencies and material weaknesses in the design or operation of internal control over financial reporting which are reasonablylikely to adversely affect the company’s ability to record, process, summarize and report financial information; and
(b) Any fraud, whether or not material, that involves management or other employees who have a significant role in the company’s internal control overfinancial reporting.
Date: April 4, 2012.
/s/ Alfredo Ergas S.Alfredo Ergas S.Chief Financial Officer

Exhibit 13.1
906 CERTIFICATION
The certification set forth below is being submitted in connection with the annual report on Form 20−F for the year ended December 31, 2011 (the“Report”) for the purpose of complying with Rule 13a−14(b) or Rule 15d−14(b) of the Securities Exchange Act of 1934 (the “Exchange Act”) andSection 1350 of Chapter 63 of Title 18 of the United States Code.
Ignacio Antoñanzas A., the Chief Executive Officer and Alfredo Ergas S., the Chief Financial Officer of ENERSIS S.A., each certifies that, to the bestof their knowledge:
1. the report fully complies with the requirements of Section 13(a) or 15(d) of the Exchange Act; and
2. the information contained in the report fairly presents, in all material respects, the financial condition and results of operations of Enersis.
Date: April 4, 2012.
/s/ Ignacio Antoñanzas A.
Name: Ignacio Antoñanzas A.Chief Executive Officer
/s/ Alfredo Ergas S.Name: Alfredo Ergas S.Chief Financial Officer