engaging with the community - parliament of western … directly employ approximately 2,650 people...
TRANSCRIPT

2016 annual report
Engaging with the community

Water Corporation 2016 annual report
About this reportThe 2016 annual report is a review of our performance for the financial year ended 30 June 2016.
This report is produced in accordance with the provisions of the Water Corporations Act 1995 and other relevant legislation, which governs our operations.
Provided to the Minister for Water; Sport and Recreation; Forestry the Hon Mia Davies MLA, the report is tabled in the Parliament of Western Australia.
The objective of this report is to provide our owner, the State Government, as well as our customers, community and stakeholders with information about our operational and financial performance and our contribution to the State’s economy for the 2015–16 financial year.
To provide feedback on this report please email [email protected]
Previous annual reports can be found at watercorporation.com.au
For customer enquiries or feedback about our services, visit watercorporation.com.au/contact
Chairman’s report 01CEO’s year in review 01
1. Who we areOrganisational profile 02Key capital projects 03Organisational structure 04
2. Sustainability performanceEconomic outcomes 09Environmental achievements 13Social responsibility 20Future thinking 28Our awards 28
Contents
How much water is that?
3. Corporate governanceCorporate governance report 29Directors’ report 34Performance summary 39Principal statistics 41Five-year statistical summary 44
4. Financial reportStatement of comprehensive income 46Statement of financial position 47Statement of changes in equity 48Statement of cash flows 49Notes to the financial report 50Directors’ declaration 76Auditor General’s report 77Glossary 78
1 gigalitre (GL) or one billion litres
Volume of Domain Stadium filled to the goal posts ≈ 1 GL
1 megalitre (ML) or one million litres
Volume of Olympic size swimming pool ≈ 2.5 ML
1 kilolitre (kL) or one thousand litres
Volume of four wheelie bins ≈ 1 kL

Water Corporation 2016 annual reportEngaging with the community
1
Chairman’s report CEO's year in review
January 1, 2016, marked the 20th anniversary of the corporatisation of our business – an eventful period that witnessed extensive change in the State’s water industry.
Dominating all of our activities were two broad phenomena: a drastically drying climate and strong State economic growth. These combined to severely test the new Corporation’s mettle, and it is gratifying to everyone involved in the journey so far that the job has been done very well.
In achieving this, the Corporation has attained ever higher levels of competency in operations and governance. This has been made clear to me having been a member of the Board in some of the formative years, then returning in 2011 to become Chairman in January, 2012.
The Corporation performs effectively in the key areas of governance, strategic planning, technology and innovation. While our fundamentals have not changed, our economic modelling is more sophisticated, we have a sounder decision making process, and our capital program is much improved. In addition, detailed planning of water services well into the future is clearly set out while our understanding of, and engagement with our customers continues to evolve.
How we handle continuous change over the next few years – let alone the next 20 – will be critical to the Corporation’s continued successful operation, which enables the growth of our State and helps maintain the highly valued Western Australian lifestyle.
That task is brought home when we consider the extent of our operations. For example, we now supply more than 370 billion litres of water annually to more than one million properties across the State, compared with about 315 billion litres to 728,000 properties when the Water Corporation began operating.
In that time we have built 7,000 kilometres of water and wastewater mains.
I acknowledge the commitment and diligence of my fellow directors during the year under review and thank our CEO Sue Murphy and her executive team for their continued excellent work. I also recognise the Minister for Water, Hon. Mia Davies MLA, for her continued leadership and guidance.
Ms Eva Skira, Chairman
The year under review can best be summed as “doing more with less” – less people, less operating cost and less water.
The implementation I forecast last year of the redesign of our organisation is now largely complete. This has not been simple, but is reinvigorating and streamlining our operations enabling us to lift our performance and respond better to our customers.
Like almost every business in the State, we continue to pursue financial efficiencies and look hard at all expenditure to keep our operating costs as low as possible.
The long and successful campaign we have run since 2001 to respond to a rapidly drying climate was dealt a monumental challenge in 2015 when Perth’s dams received their lowest inflow since records began more than 100 years ago.
This was compounded by the warmest and driest spring on record which sent consumption on the Integrated Water Supply Scheme soaring, with nearly nine billion litres used above target by December 2015.
In response, we launched a series of measures to curb demand and maximise production. These included the high-profile ‘Whatever you do, just drop 2’ marketing campaign and running our seawater desalination plants at full capacity.
The coordinated efforts and the strong response from our customers resulted in water use returning to predicted levels by the end of April, and as a bonus we achieved more than three billion litres of water savings by the end of May.
Once again, as occurred when our ‘big dry’ hit in 2001, our people worked together as one team to manage the situation.
We could not have achieved our successes throughout the year without unwavering support from our partners, especially the Department of Water with whom we worked hand-in-hand to optimise water outcomes for the people of Western Australia.
As we acknowledge the first 20 years of our corporatised existence, I reflect with gratitude on the efforts of our dedicated and talented employees. I thank them for their continued efforts as we begin the next 20 years and embrace the digital and social media revolution that will help us deliver the water utility of the future.
Mrs Sue MurphyChief Executive Officer
Water Corporation 2016 annual report
2
Serving our customers Water Corporation is the principal supplier of water, wastewater, drainage and bulk irrigation services in Western Australia to hundreds of thousands of homes, businesses and farms.
We directly employ approximately 2,650 people located in offices in Perth, Bunbury, Albany, Karratha, Geraldton, Northam and Kalgoorlie, and a number of depots, providing a high level of expertise and a strong commitment to communities across the State.
We manage $36 billion (replacement value) of assets to deliver water and wastewater services across the 2.6 million square kilometre expanse of the State, part of which is undertaken in alliances with the private sector.
Our environmentWe strive for Zero Footprint. We take water from the environment and return drainage water, treated wastewater and its by-products to the environment. We are committed to protecting and enhancing the environment.
Our ownerWater Corporation is owned by the State Government and accountable to the Minister for Water; Sport and Recreation;
Forestry, the Hon Mia Davies MLA, for the delivery of our services. Most of our financial surplus is returned to the State Government as a dividend to contribute to the development of the State, with the remainder reinvested in capital infrastructure.
Our stakeholders Our key stakeholders include relevant State and Federal Government agencies and regulators, local government and industry associations. The support and trust of our stakeholders and the broader community is critical to the achievement of our business objectives. We are proactive in ensuring that we engage our stakeholders and the community, as we work to effectively manage current and future water services.
Our regulators We deliver water to our customers and dispose of it within conditions set by the Departments of Water, Health, Environment Regulation, Parks and Wildlife, and the Environmental Protection Authority. The Economic Regulation Authority monitors our performance against its Water Services Licence. The State Government determines the prices of our regulated services each year through the State Budget process.
Who we are
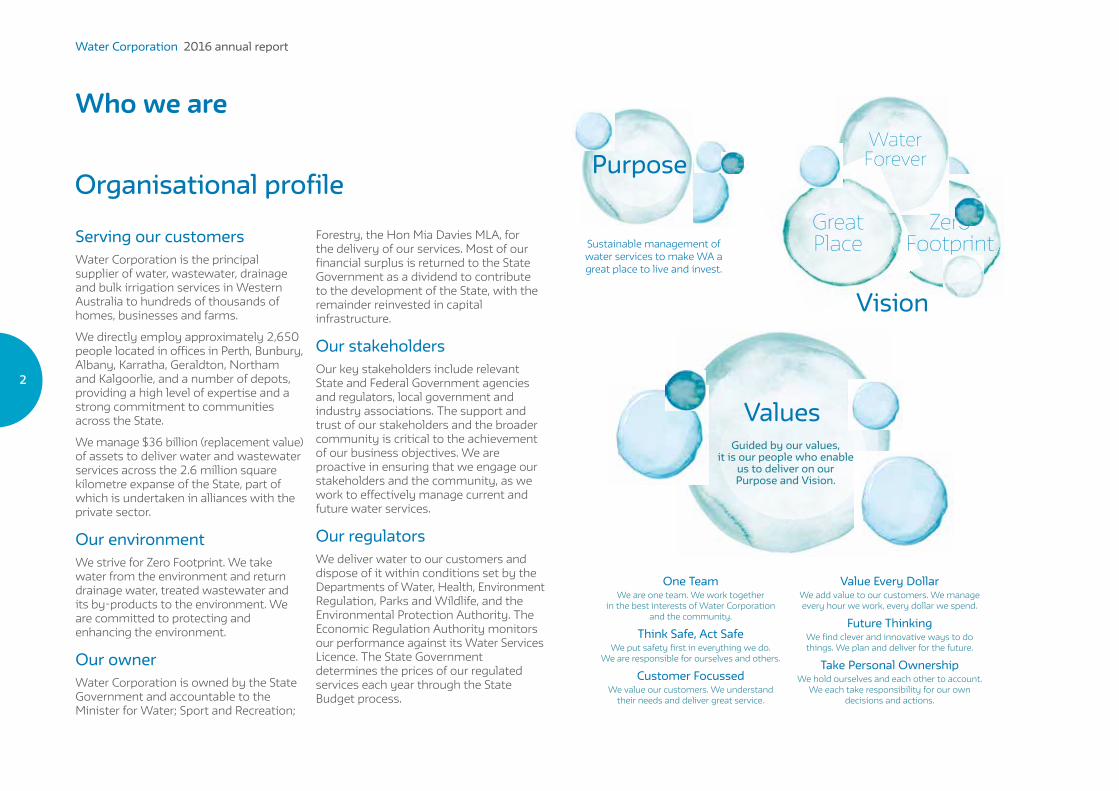
One TeamWe are one team. We work together
in the best interests of Water Corporation and the community.
Think Safe, Act SafeWe put safety first in everything we do.
We are responsible for ourselves and others.
Customer FocussedWe value our customers. We understand
their needs and deliver great service.
ValuesGuided by our values,
it is our people who enable us to deliver on our Purpose and Vision.
Vision
Water Forever
Great Place
Zero FootprintSustainable management of
water services to make WA a great place to live and invest.
Purpose
Value Every DollarWe add value to our customers. We manage every hour we work, every dollar we spend.
Future ThinkingWe find clever and innovative ways to do things. We plan and deliver for the future.
Take Personal Ownership We hold ourselves and each other to account.
We each take responsibility for our own decisions and actions.
Organisational profile

Water Corporation 2016 annual reportEngaging with the community
3
Karratha Bathgate Rd Wastewater Pump Station Upgrade
Denham Elevated Tanks Replacement
Geraldton Broome St Wastwater Pump Station and Pressure Main Replacement
Waddouring Water Storage Tank
Farmlands Project
Busselton Provence Wastewater Pump Station
Infill Sewerage - Busselton (areas 18A & 12C)
Albany Warrangoo Wastewater Pump Station and Pressure Main Renewal
Halls Creek Wastewater Pump Station Upgrade
East Rockingham Wastewater Treatment Plant
Kwinana Bertram Rd Wastewater Pump Station
Groundwater Replenishment Scheme stage 1
million square kilometres across the State
Our services, projects and activities span
2.6Key capital projectsOur capital investment program for 2015-16 was $579 million. Some of the projects with large financial contributions are profiled in the map below.

Water Corporation 2016 annual report
4
Organisational structure
Chairman of Board Eva Skira
Chairman of Board Eva Skira
Chairman of Board Eva Skira
Project Management Infrastructure Design Contracts Mechanical and Electrical Services
Asset Investment Planning Metro Asset Investment Planning Regional Asset Investment Asset Strategy Development Services
Great Southern Region Goldfields and
Agricultural Region South West Region North West Region
Strategy, Policy and Analytics Legal Services Infrastructure Markets Media and Government Relations Business Improvement
Contact Centre Customer Strategy and Engagement Customer and Industry Partnerships Customer Billing and Assurance Internal Communications
Water Quality Operations Centre Safety Environment and
Aboriginal Affairs Operations Integration
Mid West Region Field Services Operation Assurance Alliance Management
Risk and Assurance Financial Management Pricing and Evaluation
Procurement and Property Business and Technology Solutions Human Resources
Chairman of Board Eva Skira
Chairman of Board Eva Skira
Chairman of Board Eva Skira
Chairman of Board Eva Skira
Finance and Corporate Services Group
Mr Ross Hughes
Operations General Manager Mr Peter Moore
Customer and Community GroupMs Catherine Ferrari
Operations Services GroupDr Steve Capewell
Strategy and Stakeholder GroupMr Don Johnston
Assets Planning GroupMr Ashley Vincent
Assets Delivery GroupMr Mark Leathersich
Chief Executive Officer Ms Sue Murphy
Board of Directors
Minister Hon. Mia Davies MLA
Chairman of Board Ms Eva Skira

Water Corporation 2016 annual reportEngaging with the community
5
Ms Eva SkiraChairmanMBA, BA (Hons), SF Fin, FAICD, FAIM, FGIA, FCIS
Ms Eva Skira has more than two decades of experience as Chair and Board Member in business, government and not-for-profit sectors. She has Australian and overseas educational qualifications and a background in banking, stockbroking and finance. Ms Skira also has extensive experience in the engineering, construction, infrastructure, health and education industries. Ms Skira is a Non-Executive Director of RCR Tomlinson Ltd and Macmahon Holdings, and Chairman of Trustees of St John of God Health Care Group.
Appointed 4 October 2011, appointed Chairman 1 January 2012, term expires 31 December 2016.
Chair: Remuneration Committee
Member: Audit and Compliance Committee
Ms Sue MurphyChief Executive OfficerBEng (Hons), CP Eng, FIE Aust, GAICD
Ms Sue Murphy was appointed Chief Executive Officer of Water Corporation in November 2008. Ms Murphy is a Member of The University of Western Australia (UWA) Senate and Board Member of UWA’s Business School, Board Member of the Water Services Association of Australia, Chairman and Trustee of the Navy Clearance Diver Trust, Member of the General Council of the Chamber of Commerce and Industry and Fellow of the Australian Academy of Technological Sciences and Engineering.
Appointed 6 October 2008, term expires 31 December 2017.
Board profiles
Back row (l to r) Mr David Rowe, Mrs Nicole Lockwood, Mr David Lock, Mr Ross Holt and Mr Michael HollettSitting front row (l to r) Ms Eva Skira and Ms Sue Murphy

Water Corporation 2016 annual report
6
Mr Michael HollettDeputy ChairmanMAICD
Mr Michael Hollett has extensive water industry and property development experience and consults in both business and property development. Mr Hollett is a Director and Board Member of Ocean Gardens Inc and Director at H&H Development Enterprises Pty Ltd. Prior to this, he was the Chief Executive Officer of the National Lifestyle Villages Group. Mr Hollett is a qualified Hydrographer and worked in a variety of roles including regional and metropolitan land development. He forged new pathways in water recycling and efficiency and strategic planning for Water Corporation and its predecessors from 1982 to 2004.
Appointed 1 January 2012, appointed Deputy Chairman 1 March 2016, term expires 31 December 2017.
Chair: Safety Committee
Member: Remuneration Committee
Mr Ross HoltB.Econs (Hons)
Mr Ross Holt has been an integral part of the State Government finance and development landscape for almost 40 years. Previously the CEO of the Western Australian Land Authority (LandCorp), Mr Holt retired in 2014, and is currently the Deputy Chancellor of Murdoch University, Chair of Forest Products Commission, Non-executive Chair of Ralph & Beatty Bosworth and Non-executive Director of NS Projects.
Appointed 8 June 2016, term expires 31 December 2018.
Mr David LockB.Comm (UNSW); ACA; FAICD
Mr David Lock is CEO and Managing Director of Mareterram Limited, a listed agribusiness company. Mr Lock brings significant finance skills to the Board, as well as a deep understanding of the Australian agribusiness industry. He is also the Chairman of the Western Australian Meat Industry Authority and a member of the Advisory Council of the Curtin Business School. In 2012, Mr Lock was named NAB Agribusiness Leader of the Year and received the Australian Export Heroes Award in 2013.
Appointed 1 January 2014, term expires 31 December 2016.
Chair: Audit and Compliance Committee
Mrs Nicole LockwoodLLB; BBus (Environ); GAICD
Mrs Nicole Lockwood is owner and principal of Lockwood Advisory, providing advice to government and industry in the areas of regional development, infrastructure and stakeholder engagement. Prior to the establishment of Lockwood Advisory, Mrs Lockwood was a Director at KPMG. Currently a Board Member of Tourism WA, Infrastructure Australia and Leadership WA, Mrs Lockwood’s previous board roles include Pilbara Development Commission, WA Planning Commission and Horizon Power.
Appointed 1 March 2016, term expires 31 December 2017.
Member: Audit and Compliance Committee
Mr David RoweBA (Soc Sc) Curtin, GAICD
Mr David Rowe is Executive General Manager – Corporate Affairs of BGC (Australia) Pty Ltd. Prior to this role he was Managing Director of David Rowe Pty Ltd and Satterley Property Group Pty Ltd. Mr Rowe has also worked in executive positions for the Western Australian, Victorian and Commonwealth Governments. He is an Interim Board Member of the South Metropolitan Health Service and was previously Deputy Chairman of the Western Australian Land Authority (LandCorp) and a member of the South Metropolitan Health Service Governing Council.
Appointed 1 March 2016, term expires 31 December 2018.
Member: Safety Committee

Water Corporation 2016 annual reportEngaging with the community
7
Back row (l to r) Mr Ashley Vincent, Mr Ross Hughes, Mr Don Johnston, Mr Mark Leathersich, Mr Peter MooreSitting front row (l to r) Ms Sue Murphy, Dr Steve Capewell and Ms Catherine Ferrari
Executive profiles
Dr Steve CapewellGeneral Manager Operations ServicesBsc (Hons), PhD, GAICD
Dr Capewell is on the Perth Seawater Desalination Plant and Southern Seawater Desalination Plant Lead Teams, and is the Chairman of the Pilbara Clearwater Alliance.
Mr Mark LeathersichGeneral Manager Assets DeliveryBSc (Hons), MSc
Mr Leathersich is Chair of the KEP Recharge Alliance and a member of the Perth Region Alliance Lead Team.
Mr Peter Moore PSMGeneral Manager OperationsAssoc Civil Eng, GradDip Mgmt, CP Eng, FIE Aust, GAICD, MAWA
Mr Moore is the President of the Australian Water Association and Chair of their Succession Planning Committee. He is also a General Councillor with HBF.
Mr Ashley VincentGeneral Manager Assets Planning BE (Env), GradCert BusMgmt, MBA
Mr Vincent is a member of the KEP Recharge and Aroona Alliance Lead Teams.
Ms Catherine FerrariGeneral Manager Customer and CommunityBBus, PGradDipBus, MLM, FCPA, GAICD
Ms Ferrari is Deputy Chair of the West Australian Opera; a Board Member of Water Aid Australia (until May 2016); the John Curtin Gallery, ScreenWest WA (since January 2016); Energy and Water Ombudsman (since October 2015); a trustee of the Legal Contribution Trust; and Director of Water Corporation Superannuation Pty Ltd.
Mr Ross HughesChief Financial OfficerBBus, FCPA, FAICD
Mr Hughes is a member of the Water Services Association of Australia’s Customer and Industry Leadership Committee and Chair of its Commercial Performance Network. He is also Chairman of the East Rockingham Wastewater Treatment Plant Alliance Lead Team.
Mr Don JohnstonGeneral Manager Strategy and StakeholdersBSc/Comm (Hons), MBA
Mr Johnston draws on experience from a wide variety of industries, with a proven track record in strategy and performance improvement. He previously worked with Bain & Co, and was a co-founder of Azure Consulting.

Water Corporation 2016 annual report
8
As the principal supplier of water, wastewater and drainage services in Western Australia, our services are vital to maintaining the lifestyle of more than 2 million customers.
We are committed to meeting the expectations and needs of our customers, and supporting sustainable development through:
Economic outcomes
Environmental achievements
Social responsibility
This document broadly aligns with sustainability reporting principles.
Initiatives and projects outlined in this report are generally categorised into one of the above pillars.
Economic
Soci
al
Environmental
Sustainability performance
Environmental

Water Corporation 2016 annual reportEngaging with the community
9
Environmental
Economic
Economic outcomes
A significant proportion of our financial surplus is returned to the State Government as a dividend, contributing to a range of programs benefiting the Western Australian community. Our commitment to achieving economic outcomes serves our customers in their everyday lives, through the State Government’s reinvestment in infrastructure and support for programs and initiatives at a State and local level.
Alliance savings reinvestment planOur alliancing strategy adopted in 2012, sees Water Corporation working collaboratively with the private sector (our alliance partners) to deliver water, wastewater and drainage services across the Perth metropolitan area. This innovative approach has enabled us, together with our alliance partners, to deliver sustainable savings in operating expenses that have been reinvested into our metropolitan reticulation network for additional planned maintenance, providing a more efficient and reliable service for our customers.
Financial highlightsThe surplus we achieved in 2015-16 was influenced by the strong levels of housing development activity experienced across the State. Our operating business delivered a surplus of $520 million and contributions from developers towards infrastructure for new housing developments contributed a further $217 million. These contributions were received either as cash from developers’ fees or non-cash in the form of infrastructure handed over. In 2015-16, developers’ fees represented $135 million of the surplus, which will be invested in our future capital expenditure program, main and pump infrastructure assets handed over contributed a further $82 million of surplus.
In a year when we continued to invest heavily in infrastructure, with $579 million of new capital expenditure, the results featured total revenue of $2.7 billion and returns to the State Government by way of net accruals of $362 million.
Excluding the impact from development activity, total revenue grew by 3.7 per cent during the year driven by additional revenue from the State’s population growth. Drying climate has seen an increasing proportion of our water delivered from sources which are independent of rainfall such as recycling and desalination, which
increases the cost of supplying into the scheme and influences customer prices. Despite this, our customer tariffs continue to be among the lowest in Australia, and water in Western Australia remains one of the few commodities which can be delivered into our homes for less than $1.60 per tonne1,2.
Total expenditure increased by 4.7 per cent to $1.4 billion, reflecting the cost of operating and maintaining our increasing and diverse infrastructure. The increase also included a one off write-down to the value of water entitlements due to climate change. Excluding this write-down, on a per property basis, costs reduced 2.8 per cent reflecting savings from business transformation and continuous improvement activities. Our Operating Cost per Property remains one of the lowest in the Australian water industry for large scale supply1. A continuing focus on cost management supported the achievement of our long-term average annual efficiency target of 2 per cent.
1 Australian Government Bureau of Meteorology, 2016, National performance report 2014-15: Urban water utilities Part A
2 Based on water demand charges for a typical 200kL p.a. household

Water Corporation 2016 annual report
10
Net Accrual to Government (NATG) The figures in the graph above have been rounded to the nearest whole number.
Dividend Tax Equivalents Operating Subsidy NATG
$ Ms
0
(600)
200
(400)
400
(200)
600 562567
487
366 397346342 324
210 223
335362
245
140 169
-573-547 -566
-437 -450
2011-12 2012-13 2013-142014-15 2015-16
Returns to the StateThe Board approved dividend payments totalling $567 million to the State Government.
We are also required by the Australian Tax Office to lodge an income tax return and pay tax equivalents to the State. Inclusive of local government rates, and taxation payments made to the State in 2015-16, amounted to $342 million.
We received an operating subsidy payment from the Government of $547 million for the provision of non-profitable services, mostly in regional and remote areas of Western Australia, and concessions to customers.
When operating subsidies are offset against the dividends and taxes paid to Government, the resulting Net Accrual to Government (NATG) came to $362 million in 2015-16.
The net returns form part of the State’s consolidated revenue and are used to meet broader Government commitments.
Investing in infrastructureOur capital investment program benefits the community and the wide range of local private industry partners, who assist us in our construction, maintenance and operations. In doing so, we employ both
directly and indirectly, a significant number of Western Australians. The $579 million capital investment program for 2015-16 included $259 million in our water business, $172 million in our wastewater business, and the remainder on irrigation, drainage, property and facilities.
Supporting regional growthIn 2015-16, the value of our regional assets was in excess of $6 billion. During the year we spent over $212 million on the delivery of projects for regional Western Australia.

Water Corporation 2016 annual reportEngaging with the community
11
Summary of performanceOur corporate performance against financial outcomes and targets detailed in the Statement of Corporate Intent (SCI)
Units 2015-16 SCI target 2015-16 actual
Financial outcomes
Operating Surplus before income tax
Operating business before tax $m 729 744
Developer asset handover before tax $m 72 117
Developer cash contributions before tax $m 150 193
Operating Surplus after income tax
Operating business after tax $m 510 520
Developer asset handover after tax $m 50 82
Developer cash contributions after tax $m 105 135
Capital expenditure (including capitalised interest) $m 713 579
Borrowings taken (repaid) $m 215 82
Financial Performance Measures
Return on equity % 6.6 7.2
Return on assets % 5.8 5.8
Debt to total assets ratio % 35.2 34.0
Accruals to Government
Indirect tax equivalents $m 6 6
Income tax equivalents (net of deferred tax adjustments) $m 302 336
Dividends provided $m 520 567
Total $m 828 909
Payments from Government
Operating Subsidies
Non-commercial country services $m 411 390
Revenue concessions $m 142 144
Infill Sewerage Program $m 13 13
Total operating subsidies $m 566 547
Net Accrual to Government $m 262 362
Our community targets 2015-16 SCI target 2015-16 actual
Water Forever
Perth total per capita consumption 129 kL 127 kL
Great Place
Customer Performance Index 6.75 6.85
Total cost per property $1,981 $2,004
Safety Index (%) 80.0 88.1
579 million investment in capital works
212 million investment in regional projects
897 million in direct operating expenditure

Water Corporation 2016 annual report
12
Stakeholders and members of the Community Reference Group at a site tour of the East Rockingham Wastewater Treatment Plant.
Environmental

Water Corporation 2016 annual reportEngaging with the community
13
Environmental achievements
Improving metropolitan water servicesEast Rockingham Wastewater Treatment PlantIn February 2016, Perth’s newest wastewater treatment plant in East Rockingham was completed. The plant will play a vital role in catering for the rapidly growing population of Perth’s south west metropolitan corridor by treating up to 20 million litres of wastewater each day.
Engagement with the local community was a critical component to the success of building the plant on time and under budget. The latest wastewater and odour treatment technology was used, which will minimise any odours produced through the treatment process.
White Gum Valley (WGV) by LandCorp residential developmentIn October 2015, WGV by LandCorp in White Gum Valley became the latest development in Western Australia to be endorsed by Water Corporation as a Waterwise Development. Key water efficiency initiatives will include integrated stormwater management and rainwater harvesting systems, the use of water efficient fixtures, real time monitoring and low water use landscaping.
The water saving initiatives at WGV are the result of a collaborative effort by LandCorp, Water Corporation and Josh Byrne & Associates, working with the Department of Water, Urban Development Institute of Australia, the City of Fremantle and the Cooperative Research Centre for Water Sensitive Cities.
We supply
370 billion litres
of water to 1.25 million properties and collected 163 billion litres
of wastewater.
Consideration for the environment forms the foundation of our operations. Our work covers a range of areas, from water efficiency strategies and wastewater treatment, to upgrades of stormwater systems within the metropolitan area, and enhancements to water supply for farmlands in regional Western Australia.
Many key initiatives within this section of the report are wastewater improvements which work in harmony with the environment.
Environmental
Environmental

Water Corporation 2016 annual report
14
Kwinana wastewater system upgradeA suite of wastewater system upgrades totalling $15.2 million were completed during the year in the areas of Bertram, Parmelia and Orelia, located within the City of Kwinana. The work included 4.2 kilometres of new wastewater main, a storage tank and an upgrade to the Bertram Road pump station.
Secret Harbour and Port Kennedy wastewater system upgradeThe wastewater system in the City of Rockingham was the focus of a $10 million upgrade during the first half of 2016. The population of Secret Harbour and Port Kennedy is expected to double by 2025, and this improvement ensures our wastewater system can accommodate existing and future development. The project included construction of 6.2 kilometres of new wastewater main in Port Kennedy and Secret Harbour, and upgrades to the pump stations located on Warnbro Sound Avenue, Samson Way and Naples Place in Secret Harbour.
Victoria Park sewer reliningA $6 million project to renew 6 kilometres of wastewater main in the Town of Victoria Park was completed in April 2016. The eight month project refurbished mains in the suburbs of Victoria Park and East Victoria Park, extending the life of our vital infrastructure by at least 50 years. This work forms part of our ongoing wastewater main refurbishment program, which has successfully refurbished around 110 kilometres of wastewater main across Western Australia since 2006.
Beenyup energy recoveryIn 2015-16, planning started for a project to provide a significant reduction in operating costs and greenhouse gas emissions by offsetting most of the power consumed by the Beenyup Wastewater Treatment Plant. The new energy recovery facility demonstrates our ability to harness innovative and sustainable energy solutions. Delivery of this $19.3 million project is expected to be complete in 2018.
New water infrastructure for Perth’s growing suburbs In late 2015, we finished construction of a new 4 kilometre water main in Byford and a new 1.3 kilometre water main in Alkimos and Eglinton. These mains, which were delivered on time and under budget, represent important pieces of water infrastructure to allow continued development in these growing suburbs.
In Byford, we used trenchless technology to tunnel underneath major road crossings at Wungong Brook, Thomas Road and South Western Highway – minimising both environmental and community impacts.
Central Business District (CBD) mains renewal programWe renewed 13 water mains in and around the Perth CBD during 2015-16, including sections in Adelaide Terrace, Murray Street and Wellington Street. The mains were identified for renewal following a program of water main condition assessments, based on material, age and the potential for community inconvenience if a leak occurred. We worked closely with the City of Perth and other key stakeholders to deliver these projects efficiently, often coordinating this work with other utilities and streetscape projects, minimising inconvenience to the community. These upgrades improve the reliability and efficiency of water supply for Perth’s CBD, as we progressively renew all cast iron mains.
The water travels through
km
of water mains
of sewer mains
of drains
km
km
34,680
16,693
2,546

Water Corporation 2016 annual reportEngaging with the community
15
Enhancing services across regional Western Australia Our work in the Goldfields and Agricultural region In July 2015, we began a $32 million, three-year project to improve the Farmlands water supply located across the Goldfields and Agricultural region. The Farmland Project involves main replacements, increased preventative maintenance through an expanded repair program, smart water meters for all Farmlands customers, and a major main condition assessment program. Our objective is to minimise disruption to water supplies for customers and save water. A large number of suppliers are local contractors, and a joint venture between Underground Services Australia and AACT, a 50 per cent Aboriginal owned and operated company, has been successful in bidding for components of this work.
We have started work on an $8.8 million upgrade to improve the water supply for people living in the Shire of Narembeen, replacing 12.5 kilometres of the existing above ground main with an underground main.
We have started the construction of a new 6 million litre storage tank in Waddouring and a 5 million litre tank in Barbalin, to replace the existing water storage reservoirs at these sites. Both tanks will improve water quality and water pressure for more than 1,500 customers within the Shires of Mt Marshall, Mukinbudin, Nungarin, Trayning and surrounding farmlands connected to the scheme supply.
Customers in the Shire of Koorda and nearby farmlands will benefit from a $1.8 million project to upgrade 1.2 kilometres of water main.
Delivering improved services in the Great Southern region In January 2016, we completed a $9 million upgrade to Gnowangerup’s water supply scheme to improve water quality and provide a more secure water supply for the town. This included construction of two new water storage tanks with a combined capacity of 2.3 million litres of water – more than double the capacity of the previous water storage tanks.
We have improved Albany’s wastewater services with a $3.5 million upgrade to existing infrastructure. We replaced 2.5 kilometres of wastewater main, from Warrangoo Road pump station to the existing pressure main along Lower King Road.
Following Denmark’s driest year on record, we are planning to secure the town’s water supplies. In the short-term, portable desalination units have been installed at the Denmark Water Treatment Plant which can be used if the town’s secondary source, Denmark River, has high salinity levels. Work finished on a 3.4 kilometre main between the Denmark River Dam and Quickup Dam to allow more water to be used from Denmark River Dam in times of low rainfall.
We are working closely with the community while we investigate long- term planning options, through a series of community engagement forums.
Work is also progressing on a $15 million, Royalties for Regions funded, water recycling scheme in Denmark. Routes for the main will facilitate increased community use of recycled water.
Upgrades in our Mid West region In 2015, we completed a $2.8 million upgrade to double the capacity of the Jurien Bay Wastewater Treatment Plant. This upgrade allows the Plant to comfortably manage significant spikes in the town’s wastewater flows during peak summer tourist periods, and caters for future growth in the town to 2021.
We constructed a unique water tank in Denham, which is segmented to hold 100,000 litres of both drinking water and non-potable saline water. The tank provides a significant increase in water storage capacity for the town, replacing the existing 20,000 litre and 43,000 litre storage tanks, which were built in the 1970’s. This was the final stage of a $7.8 million investment over two years to upgrade Denham’s water supply.
In January 2016, we began a $7.2 million project to improve the supply capacity to the towns of Dongara and Port Denison. In March, we began duplication of a 13.6 kilometre water main from Allanooka Reservoir to Wyefarm Borefield, installing a main that is double the size of the existing main. Once complete, this new main will ensure peak demand periods can be adequately met without compromising reserve storage, while also catering for future population growth.
A $2.82 million project to upgrade wastewater mains in the Geraldton suburb of Spalding was completed in May, and will cater for future growth in the area.
Water Corporation 2016 annual report
16
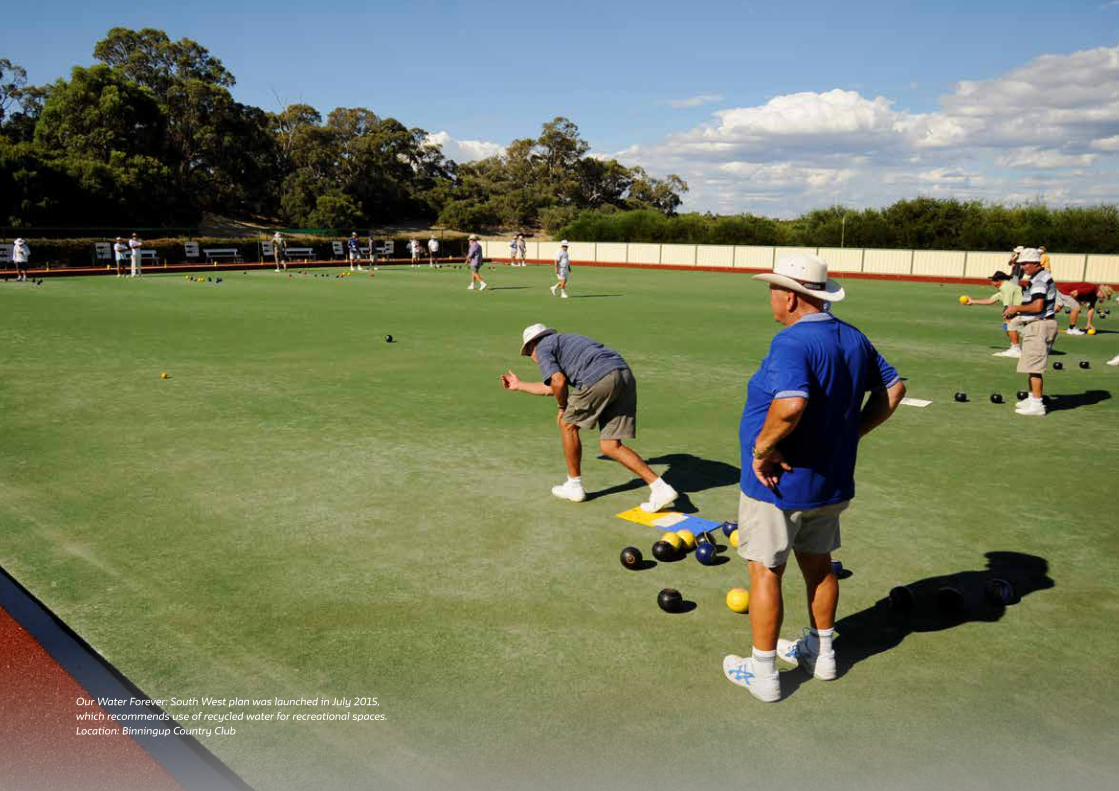
Our Water Forever: South West plan was launched in July 2015, which recommends use of recycled water for recreational spaces.Location: Binningup Country Club

Water Corporation 2016 annual reportEngaging with the community
17
Water is treated at
water treatment plants
and pumped through
pump stations
Our work in water supplySupply of safe drinking water Ensuring supply of safe drinking water is our core business. The drinking water we supply achieved full compliance with the requirements as set out by the Department of Health. In accordance with the Australian Drinking Water Guidelines (ADWG), we run an extensive drinking water quality monitoring program to ensure the safety of the water we provide to our customers. We take more than 66,000 water samples each year from water sources, treatment plants and main networks which supply our customers, and have in excess of 200,000 individual samples analysed by our contracted laboratories. We pride ourselves on the quality of water we provide and have rigorous processes in place to ensure the continued delivery of safe drinking water to our customers. We are continually working towards implementing the Framework as described in the current ADWG (2011). Our drinking water compliance is thoroughly regulated in accordance with our Memorandum of Understanding with the Department of Health. Annual reports for drinking water quality are available online.
We replaced 1.3 kilometres of water main in the centre of Bridgetown, along the South West Highway. We worked with local businesses and community members to minimise impact, including planning construction around the popular Bridgetown Blues Festival.
Work was completed on a $14.4 million project to upgrade Busselton’s wastewater system catering for increased growth in the area. Work included construction of a new wastewater main to connect the new wastewater pump station in Provence Estate to the Busselton Wastewater Treatment Plant.
Responding to emergenciesIn response to the devastating bushfires in the Shires of Waroona and Harvey, we worked closely with emergency management agencies to assist in maintaining water supply to towns impacted by the fire. Our crews were able to maintain supply to all towns in the fire zone with the exception of Yarloop, as the catastrophic nature of the fire in the town caused the power to be lost, and we were unable to pump water to the town’s tank. Immediately afterwards, we offered additional assistance to our customers impacted by the fire, including the cancellation of their most recent bill, a 20,000 litre allowance, and waiving service fees until January 2017.
Projects in the North West regionWe have invested $18 million for major wastewater upgrades in Halls Creek, Karratha, and Derby. This involved constructing new pump stations and wastewater mains to connect to existing infrastructure in these towns. In Karratha, the new pump station and main will divert flows to our new advanced wastewater treatment facility. This maximises the volume of high quality recycled water we can produce, which is used to irrigate the golf course, public open space, ovals and school grounds.
Meeting growth in the South West region In July 2015, we released Water Forever: South West. This is a comprehensive report that provides a long-term outlook on town scheme water supplies in the region, and recommends plans to develop new water sources, reduce water use and increase water recycling to achieve water security in the face of a drying climate.
The new $13.8 million Pemberton Wastewater Treatment Plant will use a multi-stage, advanced technology, biological treatment process. Recycled water from the facility is used to irrigate the Pemberton sports grounds in the summer months.
81483127
dams and weirs
around the State

Water Corporation 2016 annual report
18
Implementing innovative technology We are committed to ensuring we stay current with innovative technology.
In November 2015, we conducted a number of aerial surveys using Unmanned Aerial Vehicles (UAVs) along the Goldfields and Farmland mains. The surveys resulted in high resolution photographs which were uploaded into our corporate mapping system. The imagery was analysed for the indicators of main deterioration, enabling a greater understanding of the condition of the asset to be obtained. UAV technology is advancing at an impressive rate, and during 2016 this work will continue. The future of UAV technology will include the development of fully autonomous systems, allowing remote water mains to be examined in fine detail and at low cost. We will be making full use of this emerging technology.
Enhancing our focus on the service we provide to our customers, our integrated partner, Perth Region Alliance (PRA), introduced technology to reduce the inconvenience to customers during leak repairs and valve replacements. The specialised ‘no disruption technology’, allows maintenance to be carried out without interrupting supplies to nearby customers.
Other projectsPressure management programWe are continuing to deliver our water pressure management program, which once fully implemented will help save more than 10 billion litres of water each year. The program, which forms part of our water loss management strategy, works by creating separate water supply zones. This allows us to better monitor and manage each zone, and reduce pressure in areas where it is significantly higher than the Perth average. In June 2016, we selected suburbs throughout the State to be part of the program, after initial investigations of their suitability. Pressure management will be implemented in some remaining parts of Beckenham as well as Bentley, Cannington, East Cannington, Erskine, Falcon, Kenwick, Maddington, Martin, Queens Park, Wilson and Welshpool.
We will continue the program across 2016-17, working closely with our customers in the areas under investigation through a dedicated community consultation team.
Fire hydrant infill programWe are nearing completion of stage two of a $12.5 million, five-year program to deliver an additional 2,900 fire hydrants across the State. Once stage two is complete, we will have installed some 1,650 new fire hydrants across metropolitan and regional Western Australia. Planning for stage three is currently underway. We work closely with local government authorities, Main Roads WA and the Department of Fire and Emergency Services to determine locations for the new fire hydrants.
Once fully implemented the pressure management program
will help save more than
10 billion litres of water each year.
Integrated Water Supply SchemeThere was no let up from the drying climate over the past 12 months and during the winter of 2015, Perth’s dams received their lowest inflow since records began in 1911. Combined with our warmest spring on record, we saw a spike in water use to nearly 9 billion litres above target by December 2015. Our response included increasing our demand management and water loss management initiatives, maximising production from our desalination plants, and applying for temporary additional groundwater.
This consisted of:47 per cent
from desalinated water
46 per cent from groundwater
7 per cent from surface water
Our largest scheme, the Integrated Water Supply Scheme (IWSS) delivered
billion litres of water.298

Water Corporation 2016 annual reportEngaging with the community
19
Water recycling to achieve climate resilienceWe have set a target to recycle 30 per cent of WA’s wastewater by 2030. We operate 75 recycling schemes across the State, which supply recycled water for a range of purposes including industrial reuse, public open space and woodlot irrigation. Four of our largest metropolitan wastewater treatment plants use recycled water for most of their process water needs.
A variety of this specialised equipment has been purchased, including a type to enable the replacement of fire hydrants without affecting customers’ water supplies. They are also used when undertaking high priority maintenance in bushfire prone suburbs. These may reduce the occurrence of water main faults, as opening and closing valves can cause pressure surges when water in motion is forced to stop or change directions to travel through mains, potentially weakening them.
During the year, we also installed acoustic sensors on water mains and hydrants in the Perth CBD, designed to identify leaks in our mains early, enabling proactive repairs. By June 2016, 350 sensors were installed on around 110 kilometres of CBD water main. The sensors will listen for changes to noises in mains to detect a leak, reducing potential water losses and disruption to CBD traffic. The cutting edge technology will also ensure that should a break occur; repairs can be planned during off peak times.
Groundwater replenishment Australia’s first full-scale Groundwater Replenishment Scheme is nearing completion, with recycled water expected to be recharged into groundwater supplies in December 2016. Stage one of the Scheme will have the capacity to recharge 14 billion litres of water each year, and will provide a new climate independent water source to Perth’s drinking water supplies. Construction of the Advanced Water Recycling Plant, which forms part of the Scheme, was substantially completed in March, with the commissioning phase to be finalised by the end of 2016. Construction has achieved over 500,000 hours, lost time injury free to June 2016. The Minister for Water the Hon. Mia Davies MLA, announced in July 2016 the Scheme’s capacity will be doubled to 28 billion litres a year. Expanding the capacity will be subject to regulatory and environmental approvals.
We operate 75 water recycling schemes. Four of our largest wastewater treatment plants
use recycled water for most of their process water needs.
Stage one of the $125 million scheme will have the capacity to recharge
14 billion litres of water per year.
Infill Sewerage ProgramIn 2015-16, as part of the State Government’s Infill Sewerage Program, we completed work in parts of Bunbury, Busselton, Dawesville and Dunsborough. These projects allow more than 1,000 lots to connect to the central wastewater system. This work removes the need for septic tanks in environmentally sensitive areas, promotes development, and protects public health.
The Program is also delivering a Septic Tank Effluent Disposal (STED) scheme in Bruce Rock. The $6 million project will enable 250 residential lots to connect to a single scheme, reducing potential health and environmental impacts linked to the use of septic tanks and leach drains in the town. To date, the Infill Sewerage Program has provided more than 93,000 households in metropolitan and regional Western Australia with access to the central wastewater system.

Water Corporation 2016 annual report
20
Environmental
Customer Performance IndexWe know our customers’ perception of our overall performance is broader than just the delivery of customer service. In fact, our customers have told us it is defined by how we perform across eight key areas. These are all actively measured in our Customer Performance Index (CPI). The graph below provides an overview of how our customers believe we have performed in these eight key areas for 2015-16.
Customer service surveysOur customers’ experiences are driven through their transactions and interactions with us. We measure how well we perform in these interactions through our post-interaction surveys. Our survey results, have improved from 8.7 to 8.8 for over the phone experience, and from 7.3 to 7.4 in the way customers score their email experiences. Our customer score for the website has risen from 6.4 to 6.7.
Social responsibility
Enhancing the customer experienceWe know the value of engaging and listening to our customers and the wider communities they represent, and actively seek opportunities to involve them in our decision making. We work alongside our customers to meet their needs and expectations.
819,264 customer telephone
calls answered
1.65 million visitors to our website
We acknowledge the responsibility we have as a major service provider to the Western Australian community. During the year we have continued our commitment as a corporate citizen, as one of the managers of an important natural resource. Customer service has been improved, education and awareness campaigns have been delivered, and we have strengthened our connection with schools, businesses and local government to help us achieve water for all, forever.
Our operations cover 2.6 million square kilometres of Western Australia – from Wyndham in the north to Esperance in the south. Despite the challenges in the Perth metropolitan area of the lowest ever inflows to our drinking water dams, and the warmest spring on record in 2015, we have again provided consistent water, wastewater and drainage services to our customers. We supplied 370 billion litres of water to 1.25 million properties and collected 163 billion litres of wastewater.
Our customer experience performance
7.08 7.30
Customer experience
Scor
e ou
t of 1
0
7.12 7.16
Brand
2015 2016
7.10 7.19
Product quality
7.04 7.01
Long-term planning
6.83 6.83
Environmental responsibility
6.86 6.96
Customer & community engagement
6.34 6.405.91 6.01
Value for money
0
2
4
6
8
10
Communications Social

Water Corporation 2016 annual reportEngaging with the community
21
We have seen a 17.8 per cent increase in website visits and a 35.4 per cent increase in visits from a mobile or tablet device. We have continued a program of improvements to accessibility and usability of our digital content.
We also continue to grow our engagement with customers on social media, increasing the level of proactive content which has resulted in 137 per cent more impressions on Twitter and a 69 per cent increase in views on our YouTube channel over the last year. Reach to our Facebook audience has also increased by 113 per cent.
Continuing on our digital journeyWe continue to focus on delivering innovative digital solutions that support the business and are easy for our customers to use. Our focus has been on transitioning customer service options to channels that customers prefer, whilst also improving our cost to serve and internal efficiencies.
We have implemented new online forms which have allowed customers to engage with us at a time that suits them. This has driven a 27 per cent increase in online fault reports. There has also been a 57.9 per cent increase in use of the water use calculator.
Cost-effective and convenient ways to payWe have a strong focus on providing more cost-effective and convenient options for customers to pay their bills. We have continued to see a steady number of customers registering for My Water, our online self-service system and paperless bills. We have also moved customers to more cost-effective payment channels, including registering 177 more business customers for Electronic Funds Transfer (EFT) payments.
Investment in technologyWe have invested in future multi-channel capability by implementing the new Customer Interaction Centre (CIC) technology platform to replace our phone system. The CIC provides the infrastructure required to manage phone, email, web chat and social media customer enquiries through one platform, enabling a seamless customer service experience – regardless of the channel customers choose to interact with us.
Forging strong relationships with major customersOur key customer engagement program provides our top 300 non-residential customers across the State with direct access to a dedicated team who know their business and can tailor solutions to meet their needs. Organisations are included on the basis of the size and complexity of their business or the criticality of water to their operation. The majority of these customers also participate in the Water Efficiency Management Plan where we work together to save water and achieve better outcomes for the environment and the bottom line. During 2015-16, we reviewed the administration and management process across the State, and our pricing framework for our major regional agreements. This has resulted in better access to water use data through smart water metering, more efficient billing, credit management improvements and a revised approach to major consumer agreements, based on broad customer and industry consultation.
57.9 %Increase in use
of the water use calculator.
35.4% increase in visits from a mobile or tablet device.
↑
17.8% Increase in
website visits.
27% increase in online fault reports

Water Corporation 2016 annual report
Notes to the financial report
22
Jerome Wade, Operator harvesting the Rhodes grass crop at theBroome North Wastewater Treatment Plant.

Water Corporation 2016 annual reportEngaging with the community
23
We have entered into an exciting partnership with the Lions Club Broome, establishing the West Kimberley Community Grants Scheme. Funding for the Grants Scheme is generated by the sale of Rhodes grass hay, produced at our Broome North Wastewater Treatment Plant as an environmentally friendly means of using recycled water. The Grants Scheme aims to create real benefits in the West Kimberley by empowering communities to deliver local projects.
Water educationWe are committed to providing cutting-edge education services that are valued by our community and customers. In 2015, we celebrated the 20th anniversary of the Waterwise Schools Program, and our inaugural school, Hillarys Primary School was presented with the first 20 year recognition certificate.
5 – 10 years, as well as in the longer term, such as identifying alternative groundwater sources.
Community partnershipsOur community partnerships portfolio supports a range of programs across Western Australia that meet important community needs. They help us to demonstrate our commitment to the environment in which we operate, communicate waterwise messages and share our plans to deliver a sustainable water supply through fresh water thinking.
During the year, we worked in partnership with Wirrpanda Foundation, funding the implementation of the Deadly Sista Girlz program, designed for at risk Aboriginal and Torres Strait Islander girls aged 12-18 years. The program aims to inspire and empower through education and development activities.
Water Corporation continued a strong alliance with Clontarf Foundation during the year, with representation at employment forums across the State. We also host four year 11 students at our depot in Kelmscott.
We leased Mamabalunjin Aboriginal Corporation more than 17 hectares of land to carry out a trial using recycled water from the Broome North Wastewater Treatment Plant to establish a seedbank of native plants. Mamabalunjin will use the seedbank in their various land restoration programs in the Kimberley. The project redefines how recycled water can be used and will benefit the local community by providing employment and training opportunities.
Collaborating with the Department of WaterWe’ve been working with the Department of Water to investigate opportunities to better meet community expectations. In 2015-16 this has focussed on:
- Social licence and community engagement.
- Improving drainage outcomes.- Investigating options for improved
water supply planning and governance.- Facilitating regional aspirations and
development, where water is a perceived barrier.
- Identifying where treated wastewater management can be used for beneficial reuse.
Community involvement Community engagementThis year our Community Engagement team worked alongside our customers to minimise the impact of our construction or operational activities for nearly 250 projects, including Pressure Management, Farmlands Supply and Infill Sewerage.
We also worked to ensure our communities have the opportunity to be part of our decision making processes for our existing, emerging or planned major assets or initiatives. One example of how we work with communities is in Denmark, partnering with the community to find a solution to resolve water supply issues over the next
During 2015-16, we reached 28,000 students through our incursions program and redesigned 120 lesson plans for teachers, The lesson plans are available on our website, and cater for schools and the wider community.
Our drive to reduce water useIn tackling a drying climate, and to bring demand for water back to its usual level, we launched an extensive demand management campaign in November called “Whatever You Do, Just Drop 2.” This initially focussed on asking customers for just one small action - reduce watering times by two minutes per station on their watering days. This was based on the fact 40 per cent of water is used outside the home, so it provided the biggest opportunity to save. The integrated campaign comprised of television, radio, online advertising, press, outdoor advertising and social media. Post campaign research revealed 55 per cent of those exposed to the campaign had taken action to reduce water use as a result, and there were significant water savings. In addition, we sent letters to the top 20 per cent of water-using households in the Perth metropolitan area. The letters highlighted to our customers their higher than average water use, and encouraged them to take action to reduce it. A series of follow up letters were sent which updated these customers on the community’s water saving efforts as well as simple tips that they could implement to further reduce their water use. Over half of the customers contacted recorded a measurable reduction in water use over the four months since receiving the first letter.
563 Waterwise Schools recognised
and 28,000 students reached during 2015-16
28,000 students reached

Water Corporation 2016 annual report
24
Captain Waterwise with children from Westminster Primary School.

Water Corporation 2016 annual reportEngaging with the community
25
Improving safety around asbestosFollowing the potential exposure of employees and contractors to materials containing asbestos during a refurbishment of our Minnivale Reservoir, near Wyalkatchem in 2015, we carried out extensive reviews to understand the series of events that led to this occurring.
The investigation found there were multiple opportunities for asbestos to be identified at the site but contractors were not informed during the planning, design and construction phases of the refurbishment.
A re-enactment confirmed asbestos was not present at a concentration exceeding the Workplace Exposure Standard, set by the National Occupational Health and Safety Commission.
- Online water efficiency training - Water Efficiency Management Plan
Program
Thinking and acting safeWe are working towards Zero Harm – a culture where safety is a priority for all our employees and contractors, no injury is considered acceptable, and all activities are undertaken without compromising safety and health.
Our safety strategyOur strategy is to reduce the injury rate to our people by focussing on culture, accountability and systems. Full disclosure of all our workplace injuries is a key component of ensuring they do not reoccur. We have a comprehensive strategy designed to keep our people safe in our business by:
Whilst this year’s per person water use of 127 kilolitres is up from last year’s figure of 126 kilolitres per person, it is below our 2016 target of 129 kilolitres. Since 2001 Perth’s water use per person has reduced by more than 30 per cent. In regional areas, per capita water use continues to reduce, a trend which has been sustained for more than five years. During the year, we continued to work with the community and industry partners to reduce water use across the State through initiatives such as:- Waterwise Service Providers- Waterwise plants and products- Waterwise Partners- Showerhead Swap across WA - Waterwise Office and Aquatic Centre
programs - Waterwise Council Program - Waterwise Development Program - Data logging program
Measure Results 1
Target 2015-16 2015-16 2014-15
Significant Injury Frequency Rate (SIFR) 3.8 4.9 4.2
Number of fatalities 0 0 0
Percentage of injured workers returned to work(i) within 13 weeks
Greater than or equal to 80 per cent return to work within 26 weeks
91% 100%
(ii) within 26 weeks Greater than or equal to 80 per cent return to work within 26 weeks
100% 100%
1 Water Corporation employees (including operations and maintenance alliances) – includes persons on Water Corporation payroll, operations and maintenance alliances (Perth Region Alliance, Aroona Alliance, Pro-Alliance, Southern Seawater Desalination Operations & Maintenance, IBM and Kinetic IT staff working on a Water Corporation site).
- Building health and safety capability and resilience across the organisation to ensure safety leadership at all levels, and an empowered workforce committed to safety.
- Retaining the certification of our Safety Management System against the requirements of Australian Standard (AS/NZS 4801) ‘Occupational Health and Safety Management Systems’ and the OHSAS 18001: ‘Occupational Health and Safety Management System Requirements’.
- Undertaking activities to ensure all high risks with the potential to cause harm are identified and managed to prevent injuries from occurring.
- Focussing on investigations to prevent reoccurrence through utilising a systematic approach and training the workforce.
In Perth per person water use has reduced by over
30 per cent
since 2001 to 127 kilolitres in 2015-16.

Water Corporation 2016 annual report
26
Senior Career Consultant Andre Sequeira with some of the interns of our vacation program. Water Corporation took number one spot on the Australian Association of Graduate Employer’s national Top Internship Program list for 2016, for our work in this area.

Water Corporation 2016 annual reportEngaging with the community
27
- We deliver Aboriginal cultural awareness sessions to staff across the organisation and alliances. Currently, 28 per cent of employees have completed this training.
- The launch of ‘Water in Aboriginal culture’ for school students aims to help non-Aboriginal people understand the importance of water in Aboriginal culture. This program supports the mandatory Australian Curriculum priority area – ‘Aboriginal and Torres Strait Islander histories and cultures’.
- Continued partnerships with organisations such as Clontarf Foundation, David Wirrpanda Foundation, Yirra Yaakin Theatre Company and John Curtin Gallery supporting Aboriginal development and raising awareness of Aboriginal culture in our community.
- Progress on our procurement program to actively encourage the involvement of Aboriginal owned businesses in externally contracted projects. An example of this work is our joint venture with Mamabalunjin Aboriginal Corporation, employing local Aboriginals to deliver various land restorations programs in the Kimberley.
- In October 2015, we held our first Aboriginal businesses forum where suppliers were given the opportunity to showcase their trade.
Aboriginal engagementOur relationship with Aboriginal communities in Western Australia is important to us. Our Reconciliation Action Plan 2015-18 details actions designed to embed cultural change in our organisation and contribute to closing the unacceptable gap in life expectancy, education and economic opportunities that currently exist between Aboriginal people and other Australians.
Some of our achievements include:- There has been an increase of 21 per cent
in Aboriginal and Torres Strait Islander employees working within our organisation over the past 12 months. This increase has pushed us above the total workforce target of 2.68 per cent.
- An Aboriginal Recruitment Standard aims to increase Aboriginal recruitment and retention by creating an inclusive workplace, delivering career development and mentoring to Aboriginal employees.
- We participate in a range of Aboriginal traineeship programs which give young Aboriginal people realistic exposure to the water industry, and motivating them to work towards their goals. We currently have two trainee hydrographers and one trainee remote operation vehicle technician.
- We have nine trainees in our Aboriginal School-based traineeship program, where students work as paid employees one day per week and obtain nationally recognised qualifications while completing high school.
Our fresh water thinkersWe have approximately 2,650 direct employees performing a variety of roles across Western Australia.
Graduate development programWe deliver a range of career entry opportunities across the State to ensure we have the right people to run our business, while creating career opportunities for young Western Australians.
Our three-year Graduate Development Program enables participants to work in three different areas of our business appropriate to their discipline, in a variety of locations. In 2015-16, there were 30 graduates in our program, with 21 completing and moving into professional roles with Water Corporation.
We are among the most desirable employers in Australia for graduates, coming in at number 15 in the Association of Graduate Employers 2016 Top 75 Graduate Employer List. In addition, our program for undergraduate vacation students was rated by the same organisation at number one nationally.
Our Graduate Development Program builds our workforce capacity for the future, providing graduates with an opportunity to learn from our experienced professionals and develop a broad understanding of a range of business areas across the State.
Since Minnivale, we have made and continue to make significant improvements to our asbestos management framework to ensure the risks associated with asbestos on our sites are well managed and widely understood by staff and contractors.
We inspected 993 capital projects to ensure the presence of any asbestos had been appropriately captured in planning, design and project work, which it had in all cases.
We also inspected all of our sites to ensure appropriate signage and management is in operation where asbestos is present.
As part of our Asbestos Management Project, we are currently undertaking further inspections of our sites around the State.
This includes the development of an app which can be used on our employees and contractors’ smart phones or Personal Digital Assistants (PDAs) to obtain up to date information about a particular site if it has material containing asbestos. The app will be used to scan a unique code on the signage at the site to ensure anyone visiting the site will be informed of the nature of the asbestos on site and take any necessary precautions.
This will be another safeguard to minimise the risk of exposure to a material that has become a legacy issue for many agencies and businesses across the State.

Water Corporation 2016 annual report
28
Under the leadership of the Minister for Water Hon. Mia Davies MLA, we are working closely with the community and the Department of Water to focus on engagement and developing cross-agency strategies that deliver social and environmental outcomes for the long-term.
Business improvementOur business transformation was a portfolio of work which concluded in December 2015, and focussed on transforming our organisation to be more efficient, flexible and nimble to adapt to changing workloads and customer needs.
Complementing this transformation is the implementation of a continuous business improvement framework. Our absolute priority remains delivering core business to customers safely, and we will do this by planning our work and measuring our progress against that plan at every level of the organisation. Structured management systems continue to be implemented throughout Water Corporation, integrating and aligning our structure and processes and building the business improvement
capability of our people. This enables us to quickly identify changes in our operating environment, prioritise and deliver improvements according to our customers’ needs and to identify and overcome barriers to our productivity. This new way of working also fosters creative problem solving and innovation as part of a learning organisation, to efficiently deliver outcomes to our customers.
Engineering and Construction ServicesIn August 2015, we sold the Engineering Construction Services (ECS) branch to RCR Water Pty Ltd (a subsidiary of RCR Tomlinson Ltd) for $10.4 million. The sale was undertaken in the broader context of our business transformation, to ensure a more responsive organisation with the right people in the right jobs. The sale included guaranteed work with our organisation over three years to the value of $130 million to support the transition of the 114 transferring employees. Every Water Corporation employee from ECS who wanted a job received a job.
This year we saw award success in the following areas:- Peter Moore, General Manager
Operations, was awarded the Public Service medal in the 2016 Australia Day honours for outstanding public service to the water industry in Western Australia. In a long career, Mr Moore has played a key role in every major change in our business in recent times, from corporatisation to the introduction of desalination and groundwater replenishment, as well as our integrated alliances.
- Our online water use calculator was a joint winner of the Water Innovation Challenge at the Australian Water Association’s Ozwater16 conference in Melbourne. The calculator tells customers how waterwise their home is and encourages water saving. The judges found the product highly engaging and practical.
- Our Pilbara Clearwater Alliance, in which we are a partner with Downer, won the Infrastructure Project Innovation Award in the 2015 WA Water Awards for delivering wastewater treatment upgrade work and new advanced water recycling facilities to the Karratha and South Hedland wastewater treatment plants.
- We took number one spot on the Australian Association of Graduate Employer’s national Top Internship Program list for 2016 for the program we offer in the university student vacation and internship areas.
- Water Corporation was named Western Australia’s largest corporate blood donor in October 2015 for the third consecutive year. Over the past three years, our employees helped save 4,578 lives through more than 1,562 donations to the Australian Red Cross Blood Service.
Future thinking Our awards

Water Corporation 2016 annual reportEngaging with the community
29
Corporate Governance ReportStrong corporate governance is a fundamental part of our culture and business practices. This section includes a description of our main corporate governance practices, which form a framework to ensure we act with high standards of corporate behaviour and in the best interests of our owner.
The Board of DirectorsThe structure of the Board is subject to the following parameters:
• The Board must comprise of at least six and not more than seven directors (the Chief Executive Officer is the only Executive Director).
• The Directors are appointed for terms of up to three years and are eligible for re-appointment.
• The Board should comprise Directors with a broad range of skills and experience.
• Board meetings are generally held once a month at our head office in Leederville.
Key activities The Board, in consultation with management, develops our strategic direction for the immediate and long-term horizons. We have a Statement of Corporate Intent (SCI) covering 12 months, and a five-year Strategic Development Plan (SDP), which is updated every year.
The SCI is a public document, and is in the form of an agreement with the Minister for Water. It contains an outline of our objectives and performance targets for the year.
These plans were developed for the 2015-16 year and presented to the Minister.
The Board considerations include: • Safety performance. • Strategy and risk issues. • The capital program. • The award of contracts for major
projects. • Financial matters. • Key operational matters.
Appointment of Directors The Governor appoints non-executive Directors on the nomination of the Minister for Water. This is after consultation with, or on the recommendation of the Board.
Appointments are typically staggered to ensure that one third of the Directors retire each year. Subject to re-appointment, there is no limit on the time a Director may serve on the Board. Their duties are not full-time.
Chief Executive Officer appointments are made by the Board, subject to the Minister’s agreement. The Board can appoint a person to act in place of the Chief Executive Officer during a vacancy in that office.
Changes to the Board Mr Tony Iannello vacated his position on 31 December 2015.
Mr Peter McMorrow’s term expired on 31 December 2015.
Dr Vanessa Guthrie’s term expired on 31 December 2015 and she continued in the role until 31 March 2016 when a new appointment was made.
Mr Michael Hollett was appointed Deputy Chairman for a term expiring on 31 December 2017.
Mr David Rowe was appointed on 1 March 2016 for a term expiring 31 December 2018.
Mrs Nicole Lockwood was appointed on 1 March 2016 for a term expiring 31 December 2017.
Mr Ross Holt was appointed on 8 June 2016 for a term expiring 31 December 2018.
There were no other changes to the composition of the Board during the year.
Board committees Committees of the Board that operated during the year ending 30 June 2016 were:
• Audit and Compliance Committee• Safety Committee• Remuneration Committee• RCR Committee
From time to time the Board convenes working groups to deal with specific strategic issues.
Audit and Compliance Committee The Committee was chaired by Mr Tony Iannello (to 31 December 2015) and by Mr David Lock (from 1 January 2016) and includes Directors Ms Eva Skira and Mrs Nicole Lockwood (from 1 March 2016). Each member has substantial corporate and/or financial experience in private enterprise, and the necessary skills to undertake the Committee’s responsibilities.
The Audit and Compliance Committee invites management, auditors or others to attend meetings and provide information, as necessary.
External attendees at various meetings during the year include staff of the Office of the Auditor General (OAG) and the external auditors appointed by the OAG to undertake our annual audit, presently KPMG.
The Audit and Compliance Committee assists the Board in fulfilling its oversight responsibilities for the financial reporting process, the system of internal control, risk management, the audit process, and our process for monitoring compliance with applicable laws and regulations.
The Committee oversees the internal audit function and liaises with the external auditor.
Corporate governance

Water Corporation 2016 annual report
30
Boar
d
Aud
it a
nd
Com
plia
nce
Safe
ty
Rem
uner
atio
n
RCR
Number of meetings held
14 4 7 5 3
Atte
nded
Elig
ible
to
atte
nd
Atte
nded
Elig
ible
to
atte
nd
Atte
nded
Elig
ible
to
atte
nd
Atte
nded
Elig
ible
to
atte
nd
Atte
nded
Elig
ible
to
atte
nd
Ms Eva Skira (Chairman) 14 14 4 4 0 0 5 5 0 0
Mr Tony Iannello (Deputy Chairman)1
8 8 2 2 0 0 3 3 3 3
Mr Michael Hollett2 13 14 0 0 7 7 3 3 1 1
Mr Peter McMorrow3 8 8 0 0 4 4 0 0 0 0
Dr Vanessa Guthrie4 9 11 0 0 5 5 0 0 3 3
Mr David Lock 14 14 4 4 0 0 0 0 4 4
Ms Sue Murphy (Chief Executive Officer)
12 14 4 4 7 7 3 3 3 4
Mr David Rowe5 4 4 0 0 3 3 0 0 0 0
Mrs Nicole Lockwood6 4 4 2 2 0 0 0 0 0 0
Mr Ross Holt7 1 1 0 0 0 0 0 0 0 0
Safety Committee The Safety Committee was chaired by Mr Peter McMorrow (to 31 December 2015) and by Mr Michael Hollett (from 1 January 2016) and includes Directors Dr Vanessa Guthrie (to 31 March 2016) and Mr David Rowe (from 1 March 2016). Each member has extensive experience in the corporate sector at a senior level and brings the skills necessary for the Committee to undertake its role.
The Committee supports and assists the Board to review and oversee Occupational Safety and Health policies and performance including impacts on the public, employees and contractors.
Remuneration Committee The Remuneration Committee is chaired by Ms Eva Skira and includes Directors Mr Tony Iannello (to 31 December 2015) and Mr Michael Hollett (from 1 January 2016).
The Committee supports and assists the Board to ensure that remuneration and benefit arrangements support the strategic aims of the business whilst complying with regulatory requirements and satisfying the requirements of our owner.
RCR CommitteeThe RCR Committee was chaired by Mr Tony Iannello (to 31 December 2015) and by Mr David Lock (from 1 January 2016) and includes Directors Mr Michael Hollett and Dr Vanessa Guthrie (to 31 March 2016).
In August 2015, Water Corporation sold the internal Engineering and Construction Services (ECS) branch to RCR Tomlinson Ltd (RCR). The RCR Sub Committee was formed to oversee the responsibilities of Water Corporation and RCR under the sales agreement, and all contracts awarded to RCR and RCR’s performance under these awarded contracts. Due to an ongoing conflict of interest, Chairman Eva Skira has not been a member of the RCR Committee.
Directors’ meetings The number of Board meetings, Committees of the Board held, and the number of meetings attended by each Director during the 12 months ended 30 June 2016, are shown in the table.
1. Mr Tony Iannello’s tenure with the Board ended on 31 December 2015
2. Mr Hollett was appointed Deputy Chairman on 1 March 2016
3. Mr McMorrow’s tenure with the Board ended on 31 December 2015
4. Dr Vanessa Guthrie’s tenure with the Board ended on 31 March 2016
5. Mr David Rowe was appointed as a Director on 1 March 2016
6. Mrs Nicole Lockwood was appointed as a Director on 1 March 2016
7. Mr Ross Holt was appointed as a Director on 8 June 2016
Water Corporation 2016 annual reportEngaging with the community
31
Accountability and independence As prescribed in the Water Corporations Act 1995, Directors are to act honestly, exercise due care and diligence, and disclose all material personal interest in matters involving Water Corporation that are raised in Board meetings. The Board has complete independence to determine the policies and control the affairs of the business subject to restrictions imposed by the Water Corporations Act 1995.
Ministerial approval is required for transactions that are above a prescribed amount, currently $25 million, will result in a major initiative, or are likely to be of significant public interest.
Ministerial directions Under section 64 (1) of the Water Corporations Act 1995, the Minister may give us directions in writing, generally with respect to the performance of our functions and, subject to section 65, we are to give effect to any such direction. If the Minister gives a direction, it must be tabled in Parliament. During the period under review, no directions were received from the Minister.
Directors’ and Senior Executives’ remuneration For further disclosure of Directors’ and Senior Executives’ remuneration please refer to the Remuneration report on page 35.
Governance framework The Board has legislative authority under the Water Corporations Act 1995, to perform the functions and determine the policies that control our activities.
The Board is responsible for our overall corporate governance, approves strategic direction and budgets, ensures that legal compliance, ethical behavior and proper risk management processes are in place and operate effectively. Comprehensive monthly reports are provided to the Board to enable it to monitor performance.
We undertook a review of corporate governance to ensure there was full accountability, openness and transparency with the business. A number of key reforms were made including the introduction of a Company Secretary and the publication of Board and Committee charter, and key policies on our website.
Internal control The Board, through the Audit and Compliance Committee, has oversight responsibilities for the financial reporting process, the system of internal control, risk management, the audit process, and our process for monitoring compliance with applicable laws and regulations. We maintain an effective internal control structure.
It consists, in part, of organisational arrangements with clearly defined lines of responsibility and delegation of authority, and comprehensive systems and control procedures.
Management has the responsibility for establishing and maintaining the system of internal control that supports the achievement of our business objectives.
This system of internal control is designed to manage and mitigate rather than eliminate the risks of failure to achieve business objectives. The system of internal control can only provide reasonable and not absolute assurance of the effectiveness of the systems of internal control implemented by management. An important element of the control environment is an ongoing internal audit program, delivered by our Management Review and Audit team.
Management review and audit Our internal audit function is managed by the Risk and Assurance Branch’s Management Review and Audit team, which has the authority to examine any matters referred to it by the Audit and Compliance Committee, the Board of Directors or the Chief Executive Officer. The internal audit function supports the Audit and Compliance Committee and senior executives by independently and objectively reviewing the effectiveness of our internal control system.
External auditors In accordance with the Water Corporations Act 1995, we must have the financial report for a financial year audited by the Auditor General. The Auditor General has outsourced the audit to KPMG for a three-year period. Total auditor remuneration is shown in Note 19 to the Financial Statements on page 61.
Risk management Risk management is a key element of our governance framework. We have an established Risk Management Framework that provides a common understanding of risk and a set of processes for managing risk aligned with the International Standard on Risk Management AS/NZS ISO 31000:2009. The Framework ensures a formalised, structured and corporation-wide approach to the identification, evaluation and control of risks, which have the potential to threaten the achievement of our objectives and our ability to provide services.
All managers are responsible for the identification and management of risks that will impact upon their business processes and subsequent objectives. The management of risk within the business is embedded at all levels, with appropriate support and systems in place to ensure risks are managed to an acceptable level.
A comprehensive commercial insurance program is maintained covering insurable risks, which may have a significant impact on our assets, construction activities and legal liability.

Water Corporation 2016 annual report
32
Performance monitoring and reporting We provide three quarterly reports and this Annual Report to the Minister for Water detailing our performance and progress made in fulfilling the Statement of Corporate Intent. A written annual report on compliance with performance standards specified in the Operating Licence is also provided to the Economic Regulation Authority. In addition, the Board and Senior Executive receive monthly performance reports covering a diverse range of financial and non-financial matters.
Ethical standards We require all Directors, employees and contractors to exercise high standards of ethical behaviour in carrying out their duties.
Our Code of Conduct was revised in May 2016. We have ensured all employees are aware of their personal responsibilities according to this Code. Our Code of Conduct is available on both Water Corporation’s external and internal website. A report on compliance is forwarded to the Public Sector Commission.
There is a Board Charter that sets out the roles and responsibilities of the Board and management. Under the guidance of the Audit and Compliance Committee the Charter was drafted using the Water Corporations Act 1995, Australian Standards and other corporate governance resources.
Managing financial exposures We have a central Treasury function to manage financial exposures in accordance with our Treasury Risk Management Policy. Regular reporting ensures the Board can monitor financial risk management.
Information security management system We maintain an enterprise information security management framework that is based on the Australian Standard for Information Technology – Security Techniques – Code of Practice for Information Security Management AS/NZS ISO/IEC 27001:2013.
State Records Act 2000 In accordance with section 61 of the State Records Act 2000 and the State Records Commission Standards (Standard 2 - Principle 6), we have an approved Recordkeeping Plan. In accordance with section 28 (5) of the Act, an updated Plan was submitted to the Minister and endorsed in September 2014. The Plan describes how records are created, maintained, managed and disposed of in accordance with our Standards and Principles. We regularly conduct audits of recordkeeping practices and system use by our staff and alliance partners. Regular in-house records and document management training is conducted and
feedback and evaluation is sought from all attendees. The course is also available online for regional officers.
We have implemented an online induction process for all new staff, which includes information on employees’ roles and responsibilities, and how they comply with the approved Recordkeeping Plan. It also includes ‘Information on Record Keeping and Information Management Compliance for Water Corporation’ and ‘Information Security Awareness’.
Information management, including records management, is acknowledged as critical to the effectiveness and success of the business, and we are committed to continuously improving its management.
Public Interest Disclosure Statement The Public Interest Disclosures Act 2003 has been enacted to protect the privacy and confidentiality of both the individual making a public interest disclosure, and the subject of that disclosure. Public Interest Disclosure Officers have been appointed. Internal procedures relating to our obligations under the Act have been developed and implemented in accordance with the guidelines provided by the Public Sector Commission. There was one public interest disclosure in the period under review. It is currently being investigated.
Conflicts of interest We have established procedures to identify, prevent, or resolve conflicts of interest, which are outlined in our procurement standards and Code of Conduct.
All our personnel with duties related to the negotiation of contracts must disclose current or prospective interests to their immediate supervisor. If known, they must also disclose the interests of immediate family members.
In such cases, we will assess the appropriateness of the situation and determine if the basis of that interest should be discontinued, or if the person should cease the duties involved, or if it is proper and ethical to continue the transaction.
Water Corporation reviewed its Conflict of Interest and Related Party Transactions Policy during the 2015-16 year and strengthened its processes.

Water Corporation 2016 annual reportEngaging with the community
33
Advertising agency Amount paid
The Brand Agency $1,431,7161
303MullenLowe $375,9432
AdCorp $140,803
Media advertising Amount paid
Media Decisions $2,350,534
Carat $676,148
Market research Amount paid
Painted Dog $317,7883
Metrix $314,3974
IPSOS $79,7005
Quintessential Marketing
$67,7256
Competition and Consumer Act Compliance Program In accordance with the standards and guidelines recommended by the Australian Competition and Consumer Commission (ACCC), we conduct a Competition and Consumer Act Compliance Program to manage the risk of breaching the Act. To ensure that all employees are aware of their obligations, a state-wide program is conducted that includes mandatory training.
Freedom of information We met our obligations under the Freedom of Information Act 1992.
During 2015-16, we received 38 access applications, of which one was transferred in full to another agency. Six were provided full access, 25 were provided edited access, one had access refused. None of the applications had access deferred, and there were no instances where the document was not found or did not exist. Five were on hand at the end of the year. One was withdrawn and is not included in the total number of applications received.
One internal review was requested. Fees and charges totalling $2,018 were received for processing these applications with 24 days being the average processing time.
Under section 96 of the Freedom of Information Act 1992, we are required to produce an Information Statement. Its purpose is to provide a description of our procedures for giving members of the public access to our documents, as well as the types of documents we hold. This statement can be found at watercorporation.com.au.
Advertising codes We comply with the Communications Council’s Code of Ethics. In addition, our advertising agencies have full compliance policies with the ACCC. There were no breaches or complaints recorded in the reporting year.
Reportable expenditure The Electoral Act 1907 (section 175 ZE) requires the disclosure of certain categories of expenditure. Details of the organisations contracted and the amounts paid for the financial year are as follows:
2 This amount includes costs associated with Fresh Water Thinking demand management campaign, Winter Sprinkler Ban campaign and showerhead swap water efficiency program. 3 This amount relates to the costs for builders and developers website redesign, service disruptions research, non-residential segmentation and residential segmentation refresh.4 This amount relates to the costs for the Customer Performance Index, Pressure Management, Farmlands research, campaign testing, Customer Strategy research, partnerships research, dry season response research.5 This amount relates to costs for Questback customer feedback portal and Groundwater Replenishment tracking.6 This amount relates to the internal Voice of Customer and components of the external Voice of Customer program.
1 This amount includes costs associated with Whatever you do just drop 2 demand management campaign, paperless billing campaign, Water in Aboriginal Culture schools education campaign, and Captain Waterwise schools education program.

Water Corporation 2016 annual report
34
Directors’ report The Directors of Water Corporation present their report for the 12 months ended 30 June 2016.
Directors The following persons were Directors of Water Corporation at the date of this report:
Ms Eva Skira (Chairman) Director since 4 October 2011 Chairman since 1 January 2012
Ms Sue Murphy Chief Executive Officer since 6 November 2008
Mr Michael Hollett (Deputy Chairman)Director since 1 January 2012 Deputy Chairman since 1 March 2016
Mr David Lock Director since 1 January 2014
Mr David RoweDirector since 1 March 2016
Mrs Nicole LockwoodDirector since 1 March 2016
Mr Ross HoltDirector since 8 June 2016
Directors’ biographies are shown on page 5 and 6.
Directors’ meetings and attendance are shown on page 30.
Directors’ compensation details are shown on page 37.
Principal activities Water Corporation was established as a body corporate under the provisions of the Water Corporations Act 1995 and is the principal water utility in Western Australia. Water, wastewater, drainage and irrigation services are provided under this Act, other legislation and subsidiary legislation, which control the water industry.
Our principal functions are: • Acquire, store, treat, distribute, market
and otherwise supply water for any purpose.
• Collect, store, treat, market and dispose of wastewater and surplus water.
• Undertake, maintain and operate any works, system, facilities, apparatus or equipment required for any of these purposes.
There has been no significant change in the nature of our activities during 2015-16.
Dividends Dividends paid or declared by Water Corporation since the end of the previous financial year were:
Review of operations We operate in a regulatory framework comprising the Economic Regulation Authority, and Departments of Water, Health, Environment Regulation, and Parks and Wildlife.
Clear commercial objectives and strict environmental targets and accountabilities have been established through the Statement of Corporate Intent and a system of licences through the various regulators.
During the year, we supplied 370 billion litres of water and treated 163 billion litres of wastewater.
Risk management Our Risk Management Framework aims to improve the quality of information considered in delivering better informed assessments for the purpose of resource allocation, increasing transparency in decision making and clearly articulated accountability.
Date of Total amount $M
Date of payment
Final 2014-15 23 30/10/2015
Interim 2015-16 544 29/06/2016
Total 567
Dividend declared after end of year After the balance sheet date, the Directors have proposed a final dividend of $4 million for the 2015-16 year, payable on or before 31 October 2016.
The financial effect of this dividend has not been brought to account in the financial statements for the year ended 30 June 2016, and will be recognised in subsequent financial reports.

Water Corporation 2016 annual reportEngaging with the community
35
Remuneration report Remuneration of key management personnel is referred to as compensation throughout this report. Key management personnel comprise the Directors of the Board and Executives who are responsible for planning, directing and controlling the activities of Water Corporation.
Compensation levels for key management personnel are set at a level sufficient to attract and retain appropriately qualified and experienced Directors and Executives.
The compensation of the non-executive Directors of the Board is determined following independent advice from management remuneration consultants and the State Government’s Salaries and Allowances Tribunal on an ad-hoc basis and is agreed to by the Minister for Water. The compensation is in the form of salary and superannuation contributions. Other than compulsory superannuation contributions and superannuation via salary sacrifice, Water Corporation does not pay any post-employment benefits to non-executive Directors.
The compensation packages for the Chief Executive Officer (CEO) and Executives consist of a total reward that is a mix of fixed compensation, in the form of salary, non-monetary benefits and superannuation contributions, and variable compensation in the form of an ‘at risk’ amount payable as a lump sum under the Target Based Rewards (TBR) scheme which has been in place since 2007-08. Non-monetary benefits may include access to a fully maintained motor vehicle and fringe benefits tax. Other long-term benefits refer to long service leave. A payment occurs under the TBR scheme if predetermined key indicators of corporate and individual performance are met. The compensation of all staff is reviewed annually.
The Board, with the concurrence of the Minister for Water, is responsible for the compensation of the CEO, which is reviewed annually. The CEO, with the concurrence of the Remuneration Committee and the Board, sets Executive compensation based on annual salary survey data and advice from independent remuneration sources regarding compensation practices. Specifically, fixed compensation is benchmarked against comparative industry groups in order to remain competitive in the labour market.
Employees in management roles in our business, including Executives, are employed on individual employment contracts under common law and are referred to as Common Law Contract (CLC) employees. The compensation structure of CLC employees is centred on the market median for the fixed compensation for each of the identified levels. Employees engaged in high demand roles and/or are high performers can move up to 10 per cent beyond the median if they demonstrate sustained high performance.
The primary sources of remuneration data are Hay Group Australia and Mercer Consulting Australia. Water Corporation utilises the Hay Group job evaluation system to provide assurance that remuneration is similar to that for comparable positions in other organisations.
For 2015-16, the TBR scheme’s maximum payment was reduced from 12 per cent to 9 per cent of base salary. The Board and the CEO reserve the right to withhold the TBR payments, despite the achievement of the pre-determined performance targets, where an exceptional adverse event or significant series of events occur.
The corporate performance component of the TBR is determined by a scorecard, which is set annually and approved by the Board. The scorecard is based on five key performance indicators (KPIs) defined across the following key areas. Each KPI is identified in italics below:
Safety – based on the Safety Index, which includes the Significant Injury Frequency Rate, hazards addressed and incidents investigated on time.
Customer service – based on the Customer Performance Index, a survey-based measure of our customers’ perceptions of the effectiveness of Water Corporation.
Operations – based on the Operating Performance Index, a basket of indicators measuring performance in the areas of operating licence, regulatory, and environmental compliance, together with asset management effectiveness.
Finance – based on Operating Expenditure performance and the Capital Index, which included additional measures assessing the extent to which major projects are delivered on time and on budget.

Water Corporation 2016 annual report
36
These KPIs were chosen to align performance with our vision and purpose, and measure an appropriate mix of financial and non-financial outcomes across the business. Results are rated against a three-tier performance target comprising minimum acceptable performance, target and stretch target levels. It is a requirement of the TBR scheme that the target level is achieved on at least four of the five KPIs in order for any TBR payment to be payable. TBR measures and targets are reviewed annually and adjusted where appropriate to drive increasing levels of performance.
Such changes are approved by the Board. The 2016 TBR scorecard results for the corporate KPI’s are outlined below.
As the table below shows, the Corporation missed achieving target on four out of the five KPIs during 2015-16, and therefore did not make TBR payments to eligible staff and management. We do not provide any long-term incentives, loans, grant options, rights or shares to key management personnel.
Target levels
Key Performance Indicators Actual Minimum acceptable
performance
Target Stretch
Safety Index (%) 88.1 80.0 90.0 100.0
Customer Performance Index 6.85 6.75 6.85 7.00
Operating Performance Index (%) 81.1 80.0 90.0 100.0
Operating Expenditure ($m) 865.2 885.0 867.0 841.0
Capital Index (%) 92.7 89.0 92.4 95.5
Directors
E Skira Chairman (non-executive).Appointed Director 4 October 2011 and Chairman 1 January 2012
T Iannello Deputy Chairman (non-executive). Appointed 1 January 2013. Vacated 31 December 2015
V Guthrie Director (non-executive). Appointed 1 January 2013. Term expired 31 March 2016
M Hollett Deputy Chairman (non-executive). Appointed Director 1 January 2012 and Deputy Chairman 1 January 2016
R Holt Director (non-executive). Appointed 8 June 2016. No remuneration paid in 2015-16
D Lock Director (non-executive). Appointed 1 January 2014
N Lockwood Director (non-executive). Appointed 1 March 2016
P McMorrow Director (non-executive). Appointed 1 January 2013. Term expired 31 December 2015
D Rowe Director (non-executive). Appointed 1 March 2016
S Murphy Chief Executive Officer
Details of compensation provided to key management personnel are as follows:
The directors during the financial year were:

Water Corporation 2016 annual reportEngaging with the community
37
Total Remuneration Band ($)
Number of staff *
Short-term Post-employment Other long-term benefits Total
Salary & Fees Non-monetary Benefits ** TBR Superannuation
2015 2016
$’000 $’000 $’000 $’000 $’000 $’000
2015 2016 2015 2016 2015 2016 2015 2016 2015 2016 2015 2016
300,000-324,999 - 2 - 282 - - - - - 33 - 6 - 321325,000-349,999 1 - 290 - - - 9 - 30 - 14 - 343 -350,000-374,999 2 1 158 310 - - 19 - 169 30 22 21 368 361425,000-449,999 1 1 380 409 - - 20 - 35 35 - - 435 444525,000-549,999 - 1 - 3 - 17 - - - 513 - - - 533550,000-574,999 1 - 35 - 19 - 24 - 478 - - - 556 -
* Where there is more than one director in a remuneration band the average remuneration is shown. ** Private use of motor vehicle Please note: Mr Ross Holt is not reflected in the figures within the above table, as he did not receive remuneration during the 2015-16 year.
Total Remuneration Band ($)
Number of directors *
Short-term Post-employment Other long-term benefits Total
Salary & Fees Non-monetary benefits ** TBR Superannuation
2015 2016
$’000 $’000 $’000 $’000 $’000 $’000
2015 2016 2015 2016 2015 2016 2015 2016 2015 2016 2015 2016
0-25,000 - 2 - 19 - - - - - 2 - - - 2125,000-49,999 - 3 - 33 - - - - 3 - - - 3650,000-74,999 5 2 54 54 - - - - 5 5 - - 59 59100,000-124,999 1 1 82 83 - - - - 36 36 - - 118 119500,000-524,999 - 1 - 468 - 5 - - - 35 - - - 508525,000-549,999 1 - 466 - 14 - 25 - 35 - - 540 -
The names and positions of the executives receiving the highest emoluments were:
Five highest paid Executives1 Year ended 30 June 2015 Year ended 30 June 2016
S Capewell General Manager, Operations Services ✓
G Cargeeg General Manager, Metropolitan Customer Services ✓
R Hughes Chief Financial Officer ✓ ✓
M Leathersich General Manager, Assets Delivery ✓
D Luketina General Manager, Business Services ✓
P Moore General Manager, Operations ✓ ✓A Vincent General Manager, Assets Planning ✓ ✓
* Where there is more than one executive in a remuneration band the average remuneration is shown. ** Private use of motor vehiclePlease note: variations in salary can be caused by a wide variety of factors such as the individual’s leave arrangements, the TBR, and other smaller adjustments.
1 CEO’s remuneration is included in the table of Directors.
The number of executives whose total remuneration was within the following bands is:
During the reporting period, the composition of the Board changed. The number of directors whose total remuneration was within the following bands is:

Water Corporation 2016 annual report
38
Indemnification of Directors and auditors The Corporation provides a general indemnification for Directors, via a deed of indemnity, and we purchase Directors and Officers insurance. In the 12 months ending 30 June 2016, we have not made any payments in respect to this indemnity.
This statement is made in accordance with a resolution of the Board.
Eva SkiraChairman
S.L MurphyChief Executive OfficerPerth, [insert date]
Events subsequent to balance date Since the end of the financial year on 30 June 2016, and the date of the release of this report, the Directors are not aware of any matter or circumstance not otherwise dealt with in the report or financial statements that has significantly, or may significantly affect our operations, the results of those operations, or our state of affairs in subsequent financial periods.
Directors’ interests and benefits In the 12 months to 30 June 2016, no Director received, or became entitled to receive, any benefit (other than a benefit included in the total amount of remuneration received or due and receivable by Directors) by reason of a contract made by Water Corporation with the Director, or with a firm, of which the Director is a member, or with an entity in which the Director has a substantial interest.
Our environmental performance is underpinned by our Corporate Environment Policy and Carbon and Energy Policy. We also maintain an Environmental Management System, certified under the internal standard ISO 14001 that provides for the systematic identification of environmental risks, setting of performance targets and development of environmental improvement plans to reduce risks and ensure our activities are sustainable.
Based on an overall review of our business, in September 2015, our Environment & Aboriginal Affairs and Occupational Safety & Health branches were combined to form the Safety, Environment and Aboriginal Affairs Branch and are realising efficiency gains in our health, safety, environment and Aboriginal affairs processes.
State of affairs There were no significant changes during the year ended 30 June 2016 in the state of our affairs not otherwise disclosed in this report, or the financial statements.
Environmental performance Water Corporation is subject to particular and significant environmental legislation under both Commonwealth and State laws; in particular:
• Environment Protection and Biodiversity Conservation Act 1999 (Cth)
• Environmental Protection Act 1986 (WA)
• Contaminated Sites Act 2003 (WA)
Additionally, we comply with more than 40 other pieces of environment-related legislation, and we also track our compliance with various non-statutory commitments.
With the significant volume of wastewater conveyed across the State, it is possible unplanned discharges will occasionally occur and some of these may potentially affect the environment, public health and public amenity. Our incident management process provides a fast and effective response to these and other incidents. Consistent with the Environmental Protection Act 1986, we report any unplanned discharges of waste with the potential to harm the environment.

Water Corporation 2016 annual reportEngaging with the community
39
Performance SummaryPerformance against key indicators 2016
Units Target Actual 2015 2014 2013 2012
Social Performance
Employment and WorkforceEmployee initiated turnover % 7.00 6.20 5.8 6.4 6.4 7.5Women in senior management - tier 2 % 25.00 22.22 20.0 12.5 10.0 12.5Women in senior management - tier 3 % 25.00 27.50 20.0 23.8 15.0 9.5People from culturally diverse backgrounds % 14.00 13.60 13.6 14.8 13.5 14.0Indigenous Australians % 2.68 3.01 2.35 1.90 1.35 1.47People with disabilities % 2.80 1.05 1.20 1.20 1.30 1.40Youth (15-24) % 6.70 3.62 3.20 5.00 4.40 4.60Significant Injury Frequency Rate No. 3.80 4.90 4.2 6.0 7.3 9.5
Public Health - Safe Drinking WaterMetropolitan localities meeting requirements for E.coli % 100 100 100 100 100 100Metropolitan localities meeting requirements for amoebae (Thermophilic Naegleria) % 100 100 100 100 100 100Metropolitan localities meeting requirements for health-related chemical quality % 100 100 100 100 100 100Metropolitan localities meeting requirements for radiological performance % 100 100 100 100 100 100Country localities meeting requirements for E.coli % 100 100 100 100 100 100Country localities meeting requirements for amoebae (Thermophilic Naegleria) % 100 100 100 100 100 100Country localities meeting requirements for health-related chemical quality % 100 100 100 100 100 100Country localities meeting requirements for radiological performance % 100 100 100 100 100 100
Essential Service ProvisionContinuity – properties not affected by interruption > 1 hr % 75.0* 77.5 79.4 75.9 80.8 80.5Water pressure and flow standards % 99.80* 100.00 99.95 100.00 100.00 100.00Water quality faults responsiveness % 95.0 98.3 98.2 96.8 95.3 94.5Installation of new water connections % 90.0 98.6 97.4 97.0 96.2 96.1Properties without wastewater overflow % 99.8* 99.9 99.9 99.9 99.9 99.9
Demand-Supply BalanceNumber of waterwise schools (1) No. na 503 503 526 516 533Drought response (number of schemes on temporary restrictions) No. na 1 1 1 1 3
Environmental PerformanceEcosystem Protection
Overflows to Swan-Canning - conveyance system No. 0 3 2 3 1 2Overflows to Swan-Canning - pump stations only No. 0 0 1 0 0 1
Energy and Greenhouse GasesElectricity consumption per unit of output for water MWh/ML na 2.17 1.93 1.84 1.70 1.50Electricity consumption per unit of output for wastewater MWh/ML na 0.81 0.80 0.79 0.80 0.80Total energy consumption TJ na 3,633 3,346 3,294 3,000 2,733Reported greenhouse gas emissions (CO2 equivalent) kT na 784 717 718 692 664

Water Corporation 2016 annual report
40
2016
Units Target Actual 2015 2014 2013 2012
Materials Use EfficiencyBiosolids re-use (Perth metro) % 100 100 100 100 100 100
Demand-Supply BalanceWater supplied per capita (Perth metro) kL 129 127 126 131 132 135
Economic PerformanceFinancial Efficiency
Operating cost per property $ 801 796 819 800 805 740Total cost per property $ 1,981 2,004 1,982 1,989 1,949 1,876Surplus before income tax equivalent $m 950 1,053 1,118 947 722 749Return on assets % 5.8 5.8 5.8 5.5 4.4 4.2Return on equity % 6.6 7.2 7.9 7.0 5.4 5.7Interest cover Times 3.6 3.8 3.6 3.3 2.9 3.2Debt to Total Assets % 35.2 34.0 33.8 33.8 33.0 31.3
Asset PerformanceBlockages per 100km of sewer No. 40.0* 18.3 17.4 16.9 16.8 17.9Leaks and bursts per 100km of main No. 20.0* 17.8 17.8 17.5 17.2 16.2Drainage systems operating in accordance with guidelines % 100* 100 100 100 100 100
Stakeholder PerformanceCustomer Service
Customer complaints – total (2) No. na 1,340 1,269 1,390 1,040 11,065Written customer complaints (responsiveness) < 15 business days % 90.0* 98.4 100.0 98.8 100.0 100.0Telephone calls to '13' numbers answered within 30 seconds % 70.0* 71.1 72.8 72.6 73.1 73.3Telephone calls to '13' numbers abandoned after 30 seconds % 2.5 1.7 1.6Telephone calls to '13' numbers first call resolution % 90.0 92.0 97.5 96.9 97.3 96.9
Shareholder AccountabilityResponsiveness to priority one enquiries % 85.0 96.2 96.7 98.2 99.5 95.3
Ethical & Governance PerformanceCompliance
Number of legal sanctions for environmental breaches No. 0 0 0 0 0 0% Environment Non-Compliances Addressed % 85.0 94.9 98.7 98.6 95.4 NA
(1) The number of schools recognised into the program excluding closed/amalgamated schools, scout groups and early childhood centres.(2) The definition of complaints was changed in 2010/11 to align to industry standards.* These targets applied to our Operating Licence between 1 July 2013 - 17 November 2013. From 18 November 2013 the Licence was substituted by the introduction of the Water Services Act 2012.

Water Corporation 2016 annual reportEngaging with the community
41
Principal statistics
WastewaterRegion Properties
ServedProperties Connected
Total Length of Sewers
(kilometres)
Number of Pumping Stations
Number of Treatment Plants
Average Quantity ofWastewater Treated
Daily (megalitres)
Perth Metro 805,268 754,116 12,076 646 11 366
Mandurah-Murray 47,779 41,095 863 85 4 16
Perth Region1 853,047 795,211 12,939 731 15 382
Goldfields & Agricultural 11,288 9,564 315 28 19 4
Great Southern 29,301 24,936 730 84 21 11
Mid West 25,782 20,349 589 70 19 8
North West 34,058 30,737 672 74 18 16
South West 64,223 56,423 1,447 164 20 25
Total 1,017,699 937,220 16,693 1,151 112 446
1. Perth Region includes Mandurah-Murray District.
Water supplyRegion Properties
ServedProperties Connected
Water Supply Services
Length of Mains
(kilometres)
Water Supplied2
(megalitres)
Perth Metro 954,889 825,900 712,804 14,023 253,190
Mandurah-Murray 59,970 50,033 44,670 1,155 13,668
Perth Region1 1,014,859 875,933 757,474 15,178 266,858
Goldfields & Agricultural 43,147 38,330 42,137 9,605 22,643
Great Southern 47,261 40,747 40,096 4,064 12,554
Mid West 50,214 40,814 36,967 2,506 16,153
North West 43,033 35,298 28,793 1,526 36,573
South West 52,976 47,517 43,493 1,800 15,220
Total 1,251,490 1,078,639 948,960 34,680 370,001
1. Perth Region includes Mandurah-Murray District.2. Water supplied is the quantity recorded by master meters from 1 July to 30 June.

Water Corporation 2016 annual report
42
Metropolitan sources of supplySource Area of Catchment
(square km)Storage Capacity
(megalitres)Storage at
30/06/2016(megalitres)
Percentage of MaximumStorage (%)
Output to 30/06/2016 (megalitres)
Dams
Stirling 252 57,404 7,987 13.9 7,712
Samson WTP 192 8,003 1,934 24.2 123
South Dandalup 313 138,345 12,290 8.9 7,160
North Dandalup 151 60,791 26,656 43.8 15,774
Serpentine and Serpentine Pipehead 693 140,292 32,851 23.4 44,942
Canning 728 90,353 22,276 24.7 13,516
Wungong 128 59,796 29,365 49.1 8,932
Churchman 18 2,241 533 23.8 508
Victoria 37 9,463 4,196 44.3 2,537
Total Hills Sources Output Gross 566,688 138,088 24.4 101,204
Total Hills Transfers Input 81,104
Total Hills Sources Output Nett 20,100
Groundwater
Artesian Bores 32,899
Mirrabooka 15,317
Gwelup 11,919
Wanneroo 30,268
Jandakot 16,234
Neerabup 26,017
Lexia 2,729
Yanchep/Two Rocks 1,495
Total Groundwater Output 136,879
Desalination
Perth Seawater Desalination Plant 45,948
Southern Seawater Desalination Plant 92,697
Total Desalination Output 138,645
Water Received from Bulk Supplier
GAWS supply to Perth 1,953
Total 1,953

Water Corporation 2016 annual reportEngaging with the community
43
Source Area of Catchment(square km)
Storage Capacity(megalitres)
Storage at 30/06/2016(megalitres)
Percentage of MaximumStorage (%)
Output to 30/06/2016(megalitres)
Bulk Water Exported
to Mundaring Dam for GAWS 26,594
Mandurah Murray 13,668
South-West Region 1,329
Total 41,591
Total Water Sourced
Net Output from Surface Water 20,100
Groundwater 136,879
Desalination 138,645
Received from Bulk Supplier 1,953
Total Sources 297,577
Riparians (from Distribution System)
Riparians from Distribution System 2,136
Total Potable Water Supplied
Total Water Sourced 297,577
Bulk Water Exported (41,591)
Riparians (from Distribution System) (2,136)
Operational Use & Service Reservoir Vol Change (661)
Total Water Supplied 253,190
DrainageRegion Properties
ServedLength of Drains
Controlled(Kilometres)
Perth 398,844 1,134
Great Southern n/a 129
South West n/a 1,283
Total 398,844 2,546
IrrigationRegion Water Supplied
(Megalitres)
Mid West 1 5,569
North West 2 133,699
South West 3 n/a
Total 139,268
1. Mid West irrigation district was transferred to the Gascoyne Water Co-operative on 1 July 2003.
2. North West irrigation is managed by the Ord Irrigation Co-operative (established in 2002). However, the Water Corporation maintains responsibility for a number of customers.
3. Water Corporation owns and maintains the dams that supply Harvey Water and PrestonValley Irrigation but they have the water allocation directly with the Department of Water.

Water Corporation 2016 annual report
44
Five-year statistical summary Units 2016 2015 2014 2013 2012
Financial DataTotal Revenue $'000 2,714,630 2,736,154 2,522,814 2,180,721 2,057,470Operating Subsidy $'000 546,813 573,232 565,924 436,702 450,383Direct Operating Expenses $'000 897,217 880,452 851,032 805,931 740,019Depreciation / Amortisation $'000 459,727 459,732 444,081 414,764 367,459Net Interest Expense $'000 256,263 274,032 256,013 233,706 200,819Income Tax Expense $'000 315,589 334,305 266,773 215,626 221,941Operating Surplus After Tax $'000 736,885 784,146 677,765 506,596 527,232Transfer to / (from) Reserves $'000 (939,388) 130,699 79,486 53,753 48,878Long-term Debt $'000 5,679,437 5,592,772 5,444,502 5,105,000 4,630,775New Works Investment (excluding developers take-over works) $'000 579,365 765,927 984,226 967,348 903,013Short-term Liquidity/Working Capital Facility $'000 7,000 20,000 1,150 0 25,000New Borrowings $'000 82,000 175,000 85,000 449,225 480,775Operating DataWater Supply ServicesAnnual Volume of Water Supplied ML 370,001 366,495 371,384 357,390 359,180Number of Properties Served No. 1,251,490 1,226,248 1,195,682 1,166,366 1,148,692Number of Properties Connected No. 1,078,639 1,057,388 1,032,186 1,001,362 982,401Length of Mains km 34,680 34,424 34,156 33,823 33,562Wastewater ServicesAverage Volume of Wastewater Treated Daily ML 446 449 458 428 431Number of Properties Served No. 1,017,699 994,344 967,892 945,944 928,940Number of Properties Connected No. 937,220 910,167 885,920 865,612 847,393Length of Sewers km 16,693 16,416 16,080 15,782 15,552Drainage ServicesNumber of Properties Served (Metropolitan) No. 398,844 391,408 382,833 377,962 372,239Length of Drains km 2,546 2,546 2,545 2,544 2,835Irrigation ServicesVolume of Water Delivered ML 139,268 150,147 135,481 154,042 216,174EmployeesTotal number of employees No. 2,654 2,852 3,098 3,113 3,062Total number of full-time equivalents (FTEs)1 No. 2,533 2,703 2,934 2,967 2,910
All financial figures are expressed in dollars of the day.
1 FTE (Full Time Equivalent) - A time-based measure of a person’s participation in the workforce, calculated as the number of standard hours paid during a week divided by full-time standard weekly hours. For Water Corporation, the standard weekly hours is set at 38 reflecting the current Enterprise Agreement.

Water Corporation 2016 annual reportFinancial report
45
Statement of comprehensive income 46 Statement of financial position 47Statement of changes in equity 48Statement of cash flows 49
Notes to the financial reportNote 1 Reporting entity 50Note 2 Basis of accounting 50Note 3 Functional and presentation currency 50Note 4 Use of estimates and judgements 50Note 5 Other revenue 50Note 6 Expenses 50Note 7 Net finance costs 51Note 8 Income tax equivalent expense 51Note 9 Trade and other receivables 52Note 10 Property, plant and equipment 52Note 11 Intangible assets 53Note 12 Interest-bearing loans and borrowings 55Note 13 Deferred tax equivalent liabilities 56Note 14 Provisions 57Note 15 Employee benefits 57Note 16 Other liabilities 60Note 17 Equity 60Note 18 Reconciliation of cash flows from operating activities 61Note 19 Auditor’s remuneration 61Note 20 Related parties 62Note 21 Operating leases 63Note 22 Capital commitments 63Note 23 Contingent liabilities 63Note 24 Subsequent events 63Note 25 Financial instruments 64Note 26 Significant accounting policies 70
Directors’ Declaration 76
Financial Reportfor the year ended 30 June 2016

Water Corporation 2016 annual report
Notes to the financial report
46
Statement of comprehensive incomefor the year ended 30 June 2016
Note 2016 2015 $M $M
RevenueAnnual service charges 1,056 986Volume charges 681 641Operating subsidies 547 573Developers’ contributions 309 415Other revenue 5 122 121
Total revenue 2,715 2,736
ExpensesDepreciation 10 (443) (441)Employee benefits expense 6(a) (247) (272)Hired and contracted services (241) (233)Energy (148) (117)Other expenses 6(b) (328) (281)
Total expenses (1,407) (1,344)
Results from operating activities 1,309 1,392
Net finance costs 7 (256) (274)
Surplus before income tax equivalent 1,053 1,118 Income tax equivalent expense 8 (316) (334)
Surplus for the year 737 784
Note 2016 2015 $M $M
Other comprehensive income – Re-measurement of defined benefit liability (2) (4)Related income tax equivalent 8 1 1
Other comprehensive income, net of tax equivalent (1) (3)
Total comprehensive income for the year 736 781
The above Statement of Comprehensive Income is to be read in conjunction with the accompanying notes.

Water Corporation 2016 annual reportFinancial report
Notes to the financial report
47
Statement of financial positionas at 30 June 2016
Note 2016 2015 $M $M
Current assets Cash and cash equivalents 10 22 Trade and other receivables 9 211 215 Inventories 22 17
Total current assets 243 254
Non-current assets Trade and other receivables 9 16 15 Property, plant and equipment 10 16,419 16,208 Intangible assets 11 75 144
Total non-current assets 16,510 16,367
Total assets 16,753 16,621
Current liabilities Trade and other payables 278 287 Interest-bearing loans and borrowings 12 15 28 Income tax equivalent payable 44 90 Provisions 14 2 2 Employee benefits 15 88 120 Other liabilities 16 24 36
Total current liabilities 451 563
Non-current liabilities Interest-bearing loans and borrowings 12 5,679 5,593 Deferred tax equivalent liabilities 13 267 288 Provisions 14 12 10 Employee benefits 15 46 53 Other liabilities 16 5 4
Total non-current liabilities 6,009 5,948
Total liabilities 6,460 6,511
Net assets 10,293 10,110
Note 2016 2015 $M $M
Equity Contributed equity 17 7,561 7,547 Reserves 17 - 939 Accumulated surplus 2,732 1,624
Total equity 10,293 10,110
The above statement of financial position is to be read in conjunction with the accompanying notes.

Water Corporation 2016 annual report
Notes to the financial report
48
Statement of changes in equityfor the year ended 30 June 2016
Contributed Equity Reserves Accumulated surplus Total $M $M $M $M
Opening balance at 1 July 2015 7,547 939 1,624 10,110Total comprehensive income for the yearSurplus for the year - - 737 737Other comprehensive income (net of tax equivalent) - - (1) (1)Transfer from developers’ contribution reserve - (939) 939 -
Total comprehensive income for the year - (939) 1,675 736
Transactions with owners, recorded directly in equityContributions by and distributions to ownersEquity contributions 14 - - 14Dividends paid - - (567) (567)
Total transactions with owners 14 - (567) (553)
Closing balance at 30 June 2016 7,561 - 2,732 10,293
for the year ended 30 June 2015
Contributed Equity Reserves Accumulated surplus Total $M $M $M $M
Opening balance at 1 July 2014 7,438 808 1,536 9,782Total comprehensive income for the yearSurplus for the year - - 784 784Other comprehensive income (net of tax equivalent) - - (3) (3)Transfer to developers’ contribution reserve (net of tax equivalent) - 131 (131) -
Total comprehensive income for the year - 131 650 781
Transactions with owners, recorded directly in equityContributions by and distributions to ownersEquity contributions 109 - - 109Dividends paid - - (562) (562)
Total transactions with owners 109 - (562) (453)
Closing balance at 30 June 2015 7,547 939 1,624 10,110
The above statement of changes in equity is to be read in conjunction with the accompanying notes.

Water Corporation 2016 annual reportFinancial report
Notes to the financial report
49
Statement of cash flowsfor the year ended 30 June 2016
Note 2016 2015 $M $M
Cash flows from operating activities Cash receipts from customers 1,728 1,627 Interest received 3 2 Interest paid (288) (292) Cash paid to suppliers and employees (976) (974) Income tax equivalents paid (381) (349) Government grants 13 24 Operating subsidies 547 573 Developers’ contributions 193 229 GST received 96 106 Other fees and charges 103 106
Net cash from operating activities 18 1,038 1,052
Cash flows from investing activities Acquisition of property, plant and equipment (569) (668) Acquisition of intangible assets (12) (18) Proceeds from sale of property, plant and equipment 13 4 Deposits (3) 3
Net cash used in investing activities (571) (679)
Cash flows from financing activities Net proceeds from borrowings 82 175 Dividends paid (567) (562) Payment of finance lease liabilities (8) (8) Equity contributions 14 12
Net cash used in financing activities (479) (383)
Net decrease in cash and cash equivalents (12) (10)
Cash and cash equivalents at 1 July 22 32
Cash and cash equivalents at 30 June 10 22
The above statement of cash flows is to be read in conjunction with the accompanying notes.

Water Corporation 2016 annual report
50
Note 1 Reporting entity
Water Corporation (the “Corporation”) is domiciled in Australia and its registered office is at 629 Newcastle St Leederville WA 6007. The Corporation is a not-for-profit entity primarily involved in the provision of water and wastewater services.
Note 2 Basis of accounting
2.1 Statement of complianceThe financial report is a general purpose financial report which has been prepared in accordance with the Water Corporations Act 1995 and Australian Accounting Standards (including Australian Interpretations) adopted by the Australian Accounting Standards Board (AASB) except for AASB 124 Related Party Disclosures (which is not applicable to not-for-profit entities).
The financial report was approved by the Board of Directors on 25 August 2016.
2.2 Basis of measurementThe financial report is prepared on the accrual accounting basis and in accordance with the historical cost convention, except for certain financial assets and financial liabilities which are stated at their fair value. The methods used to measure fair values are discussed further in Note 26.1(a).
Note 3 Functional and presentation currency
The financial report is presented in Australian dollars, which is the Corporation’s functional currency.
All financial information has been rounded to the nearest million, unless otherwise stated.
Note 4 Use of estimates and judgements
In preparing this financial report, management has made judgements, estimates and assumptions that affect the application of the Corporation’s accounting policies and the reported amounts of assets, liabilities, income and expenses. Actual results may differ from these estimates.
Estimates and underlying assumptions are reviewed on an ongoing basis. Revisions to estimates are recognised in the year in which the estimate is revised and any future years affected.
The areas where estimates and judgements are significant to the financial report, or a higher degree of judgement or complexity is involved, are listed below and described in more detail in the related notes:
• Note 9 - Calculation of unbilled revenue• Note 11 - Impairment of intangible asset with an indefinite useful life• Note 12 - Leases: whether an arrangement contains a lease• Note 14 - Provision for site restoration
Notes to the financial report
Note 5 Other Revenue
2016 2015 $M $MOther fees and charges 89 90Government grants 17 22Rental income 7 7Net gain on disposal of property, plant and equipment 9 2
122 121
Other fees and charges - Other fees and charges include design fees, building fees, industrial waste charges, plumbing inspection fees, sewerage testing fees, fire service charges and other miscellaneous revenue.
Government grants - Government grants are recognised as revenue when evidence exists to support the passing of control of the benefit and there is reasonable assurance that they will be received.
Note 6 Expenses
note 6(a) Employee benefits expense includes the following: 2016 2015 $M $MSalaries, wages and other employee expenses 220 244Contributions to the Water Corporation Superannuation Plan 27 28
247 272
Obligations for contributions to defined contribution plans are recognised as an employee benefit expense in the Statement of Comprehensive Income in the financial year during which services are rendered by employees.
The Corporation sponsors the Water Corporation Superannuation Plan (WCSP), which is managed by Water Corporation Superannuation Pty Ltd, a trustee company. The trustee company has six directors, three of whom are nominated by the Corporation and the other three are elected by the WCSP’s members.

Water Corporation 2016 annual reportFinancial report
Notes to the financial report
51
note 6(b) Other expenses includes the following:
2016 2015 $M $MAmmortisation 17 18Information technology 39 37Equipment hire charges 25 26Corporate charges 35 33Materials 26 22Chemicals 24 22Derecognised assets 52 8Discontinued capital projects 16 21Other 94 94
328 281
Note 7 Net Finance Costs 2016 2015 $M $MFinance income
Interest income (2) (3)
Finance costs Interest expense 286 298Capitalised interest (note a) (28) (21)
Total finance costs 258 277
Net finance costs 256 274
note (a) The average interest rate used to capitalise interest expenses related to major works was:
2016 2015 4.14% 4.46%
Note 8 Income tax equivalent expense
8.1 Recognised in surplus or deficit 2016 2015 $M $MCurrent income tax equivalent expense Current year 337 341
Deferred income tax equivalent expense Reversal of temporary differences (21) (7)
Total income tax equivalent expense 316 334
8.2 Recognised in other comprehensive income Before Tax Net of Before Tax Net of tax expense tax tax expense tax 2016 2016 2016 2015 2015 2015 $M $M $M $M $M $MRe-measurement of defined benefit liability (2) 1 (1) (4) 1 (3)
8.3 Reconciliation of effective tax equivalent rate 2016 2015 $M $MSurplus for the year 737 784Total income tax equivalent expense 316 334
Surplus before income tax equivalent expense 1,053 1,118
Income tax equivalent using the Corporation’s tax equivalent rate (30%) 317 335Non-taxable income (1) (1)
Effective tax equivalent expense 316 334

Water Corporation 2016 annual report
Notes to the financial report
52
Note 10 Property, Plant and Equipment Accumulated Carrying Cost Depreciation Amount 2016 2016 2016 $M $M $MSystem Assets 19,776 5,019 14,757Land and Buildings 788 131 657Support Assets 297 198 99Works in Progress 906 - 906
Carrying amount of property, 21,767 5,348 16,419plant and equipment
Comparative figures for 2015 are as follows: Accumulated Carrying Cost Depreciation Amount 2015 2015 2015 $M $M $MSystem Assets 19,052 4,618 14,434Land and Buildings 750 119 631Support Assets 293 188 105Works in Progress 1,038 - 1,038
Carrying amount of property, 21,133 4,925 16,208plant and equipment
Note 9 Trade and Other Receivables 2016 2015 $M $MCurrentTrade and other receivables (note a) 208 211Provision for impairment losses (2) (1)Prepayments 5 5
211 215
Non-currentPensioner rates deferrals (note b) 16 15
16 15
Total trade and other receivables 227 230
note a Trade and other receivables includes unbilled revenue, which is calculated using a combination of actual and estimated monthly water usage and revenue. Estimated monthly water usage is based on historical usage patterns adjusted to account for unusual weather conditions. The average price increase relating to volumetric water usage is applied to the estimated water volumes.
note b In accordance with The Rates and Charges (Rebates and Deferments) Act, eligible pensioners are permitted to defer their annual service charges, which will be realised on sale of property or from the estate. Interest is not charged to customers on the deferred amounts, but is recouped from the State Government in the form of Operating Subsidies (see Note 26.1b).
The Corporation’s exposures to credit risk and impairment losses related to trade and other receivables are disclosed in Note 25.

Water Corporation 2016 annual reportFinancial report
Notes to the financial report
53
ReconciliationsReconciliations of the carrying amounts of each class of property, plant and equipment at the beginning and end of the current and previous financial year are set out below.
System Land and Support Works in Assets Buildings Assets Progress Total 2016 2016 2016 2016 2016 $M $M $M $M $MBalance at 1 July 14,434 631 105 1,038 16,208Additions 133 - - 545 678Disposals (6) (1) (4) - (11)Depreciation expense (411) (13) (19) - (443)Transfers between classes 607 40 17 (664) -Transfer to Intangible Assets (Note 11) - - - (13) (13)
Balance at 30 June 14,757 657 99 906 16,419
Comparative figures for 2015 are as follows:
System Land and Support Works in Assets Buildings Assets Progress Total 2015 2015 2015 2015 2015 $M $M $M $M $M 13,918 581 90 1,158 15,747Additions 200 1 - 728 929Disposals (8) - (1) - (9)Depreciation expense (411) (12) (18) - (441)Transfers between classes 735 61 34 (830) -Transfer to Intangible Assets (Note 11) - - - (18) (18)
Balance at 1 July 14,434 631 105 1,038 16,208
Leased Assets – Mundaring Water Treatment PlantThe Corporation previously entered into an arrangement that is not in the legal form of a lease, but is accounted for as a lease based on the terms and conditions of the arrangement (see Note 12). The net carrying amount of the capitalised leased assets as at 30 June 2016 was $253 million (2015: $260 million).
Note 11 Intangible Assets Accumulated Carrying Cost Amortisation Amount 2016 2016 2016 $M $M $MComputer software 242 206 36Intellectual property 2 2 -Water entitlement 31 - 31Renewable energy certificates 2 - 2Property easements 6 - 6
Total intangible assets 283 208 75
Comparative figures for 2015 are as follows: Accumulated Carrying Cost Amortisation Amount 2015 2015 2015 $M $M $MComputer software 229 189 40Intellectual property 1 1 -Water entitlement 77 - 77Renewable energy certificates 21 - 21Property easements 6 - 6
Total intangible assets 334 190 144

Water Corporation 2016 annual report
Notes to the financial report
54
ReconciliationsReconciliations of the carrying amounts of intangible assets at the beginning and end of the current and previous financial year are set out below. Renewable Computer Intellectual Water Energy Property Software Property Entitlements Certificates Easements Total 2016 2016 2016 2016 2016 2016 $M $M $M $M $M $MBalance at 1 July 40 - 77 21 6 144Additions - - - 1 - 1Derecognitions - - (46) (20) - (66)Amortisation expense (Note 6) (17) - - - - (17)Transfer from Works in Progress (Note 10) 13 - - - - 13
Balance at 30 June 36 - 31 2 6 75
Comparative figures for 2015 are as follows: Renewable Computer Intellectual Water Energy Property Software Property Entitlements Certificates Easements Total 2015 2015 2015 2015 2015 2015 $M $M $M $M $M $MBalance at 1 July 40 - 77 7 6 130Additions - - - 15 - 15Derecognitions - - - (1) - (1)Amortisation expense (Note 6) (18) - - - - (18)Transfer from Works in Progress (Note 10) 18 - - - - 18
Balance at 30 June 40 - 77 21 6 144
Impairment test for water entitlements The Corporation acquired a number of water entitlements from a third party between 2006 and 2010. These entitlements are recorded at historical cost. They are considered to have an indefinite life and are therefore not amortised but tested annually for impairment by comparing the carrying value with the recoverable amount. The recoverable amount has been determined by assessing the replacement cost of the asset as outlined below. During the year, acquired water entitlements with a carrying value of $46 million were derecognised as they no longer provide economic benefits to the Corporation, due to reduced rainfall in the relevant catchment area.
The cost to replace the water entitlements is determined with reference to the cost of other current potential water sources, such as bore extraction, desalination or water catchment. The Corporation’s Long Run Marginal Cost of new sources of water is used to calculate the notional replacement cost of the water entitlements.

Water Corporation 2016 annual reportFinancial report
Notes to the financial report
55
Note 12 Interest-bearing Loans and Borrowings
2016 2015 $M $MCurrent Unsecured:
Western Australian Treasury Corporation Liquidity Facility - 20Western Australian Treasury Corporation Working Capital Facility 7 -Finance lease liabilities (note b) 8 8
15 28
Non-currentUnsecured:
Western Australian Treasury Corporation Term Fixed Rate Lending (note a) 3,521 2,981Western Australian Treasury Corporation Term Floating Rate Lending 1,919 1,564Western Australian Treasury Corporation Fixed Rate Aligned (note a) - 800Finance lease liabilities (note b) 239 248
5,679 5,593
Total interest-bearing loans and borrowings 5,694 5,621
note a Western Australian Treasury Corporation Term Fixed Rate Lending and Term Fixed Rate Aligned
The non-current amounts of the Term Fixed Rate Lending and Term Fixed Rate Aligned, totalling $3,521 million (2015: $3,781 million), include $371 million (2015: $1,143 million) that will become due and payable during the 2016-17 year. It is the Corporation’s expectation that these amounts will be refinanced under contractual arrangements in place with the Western Australian Treasury Corporation, rather than repaid, and therefore they are not recognised as current borrowings. This is supported by:
i. An agreement with the Western Australian Treasury Corporation, an entity owned by the Western Australian State Government, where the Corporation’s borrowings are refinanced at regular intervals between 2016 and 2026.
ii. The approval of the Corporation’s forecast borrowing requirements for the next four years, including no requirement for repayment of the amounts classified as non-current above, within the 2016 Western Australian State Budget.
note b Finance lease liabilities Finance lease liabilities are payable as follows:
2016 2015 $M $M
Less than one year 8 8Between one and five years 33 34More than five years 206 214
247 256
Leases under which the Corporation assumes substantially all the risks and rewards of ownership are classified as finance leases. Upon initial recognition, the leased asset is measured at an amount equal to the lower of its fair value and the present value of the minimum lease payments. Minimum lease payments made under finance leases are apportioned between the finance expense and the reduction of the outstanding liability. The finance expense is allocated to each period during the lease term so as to produce a constant periodic rate of interest on the remaining balance of the liability. Contingent lease payments are expensed in the periods in which they are incurred.
Lease of system assets not in the legal form of a leaseDuring 2012, the Corporation entered into an arrangement with a third party to build and operate the Mundaring Water Treatment Plant for a period of 35 years. Although the arrangement is not in the legal form of a lease, the Corporation concluded that the arrangement contains a lease of the plant. The lease was classified as a finance lease. At inception of the arrangement, payments were split into lease payments and payments that related to other elements. The imputed finance costs on the liability were determined based on the interest rate implicit in the arrangement.

Water Corporation 2016 annual report
Notes to the financial report
56
Note 13 Deferred Tax Equivalent Liabilities
13.1 Recognised deferred tax equivalent assets and liabilities Deferred tax equivalent assets and liabilities are attributable to the following:
Assets Liabilities Net 2016 2016 2016 $M $M $MProperty, plant and equipment - 306 306Provisions (45) - (45)Other items (8) 14 6
Deferred tax equivalent (assets) / liabilities (53) 320 267Set off of tax equivalents 53 (53) -
Net deferred tax equivalent liabilities - 267 267
Comparative figures for June 2015 are as follows: Assets Liabilities Net 2015 2015 2015 $M $M $MProperty, plant and equipment - 345 345Provisions (53) - (53)Other items (9) 5 (4)
Deferred tax equivalent (assets) / liabilities (62) 350 288Set off of tax equivalents 62 (62) -
Net deferred tax equivalent liabilities - 288 288
13.2 Movement in temporary differences during the year
Balance Recognised Balance 1 July 15 in income 30 June 16 $M $M $MProperty, plant and equipment 345 (39) 306Provisions (53) 8 (45)Other items (4) 10 (6)
288 (21) 267
Comparative figures for June 2015 are as follows: Balance Recognised Balance 1 July 14 in income 30 June 15 $M $M $MProperty, plant and equipment 354 (9) 345Provisions (50) (3) (53)Other items (9) 5 (4)
295 (7) 288

Water Corporation 2016 annual reportFinancial report
Notes to the financial report
57
Note 15 Employee Benefits
The provision for employee benefits comprises: 2016 2015 $M $MCurrentLong service leave 52 61Annual leave 30 33Other employee benefits 2 21Defined benefit superannuation (note a) 4 5
88 120
Non-currentLong service leave 2 3Defined benefit superannuation (note a) 44 50
46 53
Total employee benefits 134 173
note a Defined benefit superannuation The Corporation sponsors the following defined benefit plans:
• State Superannuation Pension Fund (Pension Scheme), which closed to contributory members on 15 August 1986; and
• Gold State Superannuation Scheme (GSSS) lump sum scheme, which was opened to contributory members on 1 July 1987 and closed on 29 December 1995.
The Corporation’s net obligation in respect of defined benefit plans is calculated separately for each plan by estimating the amount of future benefit that employees have earned in the current and prior periods and discounting that amount. The calculation of defined benefit obligations is performed annually by a qualified actuary using the projected unit credit method.
Re-measurements of the net defined liability, which comprise actuarial gains and losses, are recognised immediately in Other Comprehensive Income. The Corporation determines the net interest expense on the net defined benefit liability for the period by applying the discount rate, used to measure the defined benefit obligation at the beginning of the annual period, to the net benefit liability, taking into account any changes in the net defined benefit liability during the period as a result of contributions and benefit payments. Net interest expense and other expenses related to the defined benefit plans are recognised in profit or loss.
Note 14 Provisions
2016 2015 $M $MCurrentSite restoration 2 2
Non-currentWorkers’ compensation 1 2Site restoration 11 8
12 10
Total provisions 14 12
Reconciliations of the carrying amount of provisions for 2016 are set out below: Workers’ Site Compensation Restoration Total $M $M $MCarrying amount at 1 July 2015 2 10 12Provisions made (reversed) during the year (1) 3 2
Carrying amount at 30 June 2016 1 13 14
Provision for site restorationThe provision for site restoration costs is calculated based on a probability weighted estimate of costs to investigate and remediate each site. The timing and extent of restoration work required is based on the classification allocated by the Department of Environment Regulation and the findings of preliminary and detailed investigations.

Water Corporation 2016 annual report
Notes to the financial report
58
Description of significant eventsThere were no Scheme amendments affecting the defined benefits payable, curtailments or settlements during the year.
Reconciliation of the net defined benefit liability 2016 2015 $M $MPension Scheme 38 36Gold State Superannuation Scheme (GSSS) 10 19
Net defined benefit liability 48 55
Reconciliation of the defined benefit obligation 2016 2015 $M $MPresent value of defined benefit obligations at beginning of the year 55 56Current service cost - -Interest cost 1 2Actuarial gains/(losses) arising from changes in financial assumptions 2 4Actuarial gains/(losses) arising from liability experience - -Benefits paid (10) (7)
Present value of defined benefit obligations at end of the year 48 55
Fair value of scheme assetsThere are no assets in the Pension Scheme to support the State Share of the benefit or in the Gold State Superannuation Scheme for current employees to support the transferred benefits.
Significant actuarial assumptions at the reporting date 2016 2015Assumptions to determine start of year defined benefit obligation and defined benefit cost for the current yearDiscount rate (pensioners and active members) 2.7% 3.5%Expected salary increase rate 4.0% 4.1% for the first 4 years and 4.5% thereafterExpected pension increase rate 2.5% 2.5%Assumptions to determine defined benefit obligation at the valuation dateDiscount rate (pensioners and active members) 2.3% 2.7%Expected salary increase rate 3.5% 4.0%Expected pension increase rate 2.5% 2.5%
Nature of the benefits provided by the SchemesPension Scheme – The employer-financed benefit is a pension benefit payable on retirement, death or invalidity, or a lump sum benefit on resignation.GSSS – Some former Pension Scheme members transferred to the GSSS. In respect of their transferred benefit, the members receive a lump sum benefit at retirement, death or invalidity which is related to their salary during their employment and indexed during any deferral period after leaving public sector employment.
Description of the regulatory frameworkThe schemes operate under the State Superannuation Act 2000 (Western Australia) and the State Superannuation Regulations 2001 (Western Australia). Although the schemes are not formally subject to the Superannuation Industry (Supervision) (SIS) legislation, the Western Australian government has undertaken (in a Heads of Government Agreement) to operate the schemes in accordance with the spirit of the SIS legislation. As exempt public sector superannuation schemes (as defined by the SIS legislation), the schemes are not subject to any minimum funding requirements. As constitutionally protected schemes, the schemes are not required to pay tax.
Description of other entities’ responsibilities for the governance of the SchemesThe Government Employees Superannuation Board (GESB) is the Schemes’ Trustee and is responsible for the governance of the Schemes. As Trustee, GESB has a legal obligation to act solely in the best interests of Scheme beneficiaries. GESB has the following roles:• Administration of the Schemes and payment to the beneficiaries when required in
accordance with the Scheme rules;
• Compliance with the Heads of Government Agreement referred to above.
Description of risksThere are a number of risks to which the Schemes expose the Corporation. The more significant risks relating to the defined benefits are: • Legislative risk – The risk is that legislative changes could be made which increases the
cost of providing the defined benefits.
• Pensioner mortality risk – The risk is that pensioner mortality with be lighter than expected, resulting in pensions being paid for a longer period.
• Inflation risk -
• Pension Scheme - The risk that inflation is higher than anticipated, increasing pension payments, and the associated employer contributions.
• GSSS - The risk that wages or salaries (on which future benefit amounts will be based) will rise more rapidly than assumed, and/or that inflation (which affects the indexation of deferred benefits) will be higher than assumed, increasing the defined benefit amounts and the associated employer contributions.

Water Corporation 2016 annual reportFinancial report
Notes to the financial report
59
Base Case Scenario A Scenario B Scenario C Scenario D -0.5% pa +0.5% pa -0.5% pa +0.5% pa discount discount increase rate increase rate rate rate & indexation & indexation rate rateDiscount rate 2.3% pa 1.8% pa 2.8% pa 2.3% pa 2.3% paSalary increase rate 3.5% pa 3.5% pa 3.5% pa 3.0% pa 4.0% paDefined benefit obligation ($M) 10 11 10 10 11
The defined benefit obligation has been recalculated by changing the assumptions as outlined above, whilst retaining all other obligations.
Funding arrangementsThe employer contributes, as required, to meet the benefits paid.
Expected contributionsExpected employer contributions for the financial year ending 30 June 2017 are $4m.
Maturity profile of defined benefit obligation• Pension Scheme - The weighted average duration of the Corporations defined
benefit obligation is 15.8 years.• GSSS - The weighted average duration of the Corporation’s defined benefit
obligation is 3.8 years.
The discount rate is based on the Government bond maturing in April 2025. The decrement rates used (e.g. mortality and retirement rates) are based on those used at the last actuarial valuation for the Schemes.
The expected salary increase rate above is the long-term rate. The salary increase rate for the first three years is assumed to be 2.5% Sensitivity analysisThe defined benefit obligation as at 30 June 2016 under several scenarios is presented below.
Pension SchemeScenario A and B relate to discount rate sensitivity. Scenario C and D relate to expected pension increase rate sensitivity.• Scenario A: 0.5% pa lower discount rate assumption• Scenario B: 0.5% pa higher discount rate assumption• Scenario C: 0.5% pa lower expected pension increase rate assumption• Scenario D: 0.5% pa higher expected pension increase rate assumption
Base Case Scenario A Scenario B Scenario C Scenario D -0.5% pa +0.5% pa -0.5% pa +0.5% pa discount discount pension pension rate rate increase increase rate rateDiscount rate 2.3% pa 1.8% pa 2.8% pa 2.3% pa 2.3% paPension increase rate 2.5% pa 2.5% pa 2.5% pa 2.0% pa 3.0% paDefined benefit obligation ($M) 38 41 35 35 40
GSSSScenario A and B relate to discount rate sensitivity. Scenario C and D relate to expected salary increase rate and indexation sensitivity.• Scenario A: 0.5% pa lower discount rate assumption• Scenario B: 0.5% pa higher discount rate assumption• Scenario C: 0.5% pa lower expected salary increase rate and indexation assumption• Scenario D: 0.5% pa higher expected salary increase rate and indexation assumption

Water Corporation 2016 annual report
Notes to the financial report
60
Note 17 Equity
17.1 Contributed equity 2016 2015 $M $MOwner’s initial contribution (note a) 7,327 7,327Equity contributions (note b) 234 220
7,561 7,547
note a Owner’s initial contribution Owner’s initial contribution is the portion of the residual interest in the Water Authority of Western Australia’s assets, after deducting the liabilities that were transferred from the Water Authority of Western Australia to the Water Corporation on 1 January 1996.
note b Equity contributions Equity contributions represent assets and amounts received from the State Government in relation to funding for the construction of projects.
17.2 Reserves 2016 2015 $M $MDevelopers’ contribution reserve - 939
The developers’ contribution reserve was previously used to record the non-cash developer contributions, net of the tax equivalent, that form part of the funding of new assets acquired by the Corporation. During the year, the balance of the reserve was transferred to retained earnings.
17.3 DividendsThe following dividends were declared and paid by the Corporation for the year ended 30 June. 2016 2015 $M $MInterim dividend payment 544 516Final dividend payment for the prior year 23 46
567 562
After 30 June 2016, the Directors proposed a final dividend of $4 million for the 2015-16 year, payable on or before 31 October 2016. The dividend has not been provided for and there are no tax consequences.
Note 16 Other Liabilities
2016 2015 $M $MCurrentDevelopers’ deferred liabilities (note a) 16 23Deposits 8 13
24 36
Non-currentDevelopers’ deferred liabilities (note a) - 1Deposits 5 3
5 4
Total other liabilities 29 40
note a Developers’ deferred liabilities Developers’ deferred liabilities are the amounts payable to developers as reimbursements for the costs of headworks, constructed under Developer Constructed Work Agreements, where developers have self-funded the construction of certain headworks to enable a development, at a time that was earlier than planned by the Corporation.

Water Corporation 2016 annual reportFinancial report
Notes to the financial report
61
Note 18 Reconciliation of Cash Flows from Operating Activities
18.1 Cash and cash equivalentsFor the purposes of the Statement of Cash Flows, cash includes cash on hand and in banks.
Cash held at bank earns interest at rates determined by the Department of Treasury. For the year ended 30 June 2016 the average interest rate was 2.3% (2015: 2.6%).
The Corporation’s exposure to interest rate risk for financial assets and liabilities is disclosed in note 25.
18.2 Reconciliation of cash flows from operating activities 2016 2015 $M $M
Surplus for the year 737 784Gain on disposal of assets (9) (2)Derecognised assets 52 8Developers’ contributions (non-cash) (116) (187)Capitalisation of interest expense (28) (21)Impairment loss on receivables 1 -Employee benefits:
Superannuation - net (7) (1)Long service leave - net (10) (1)Annual leave - net (3) 1Other employee benefits – net (19) 12
Provisions: Site restoration - net 3 (1)
Depreciation 443 441Amortisation 17 18GST paid for property, plant and equipment 34 37(Increase)/Decrease in trade and other receivables 4 (9)Decrease in income tax equivalent (67) (15)Decrease in inventories (5) (3)Increase/(Decrease) in trade and other payables and other liabilities 11 (9)
Net cash from operating activities 1,038 1,052
Note 19 Auditor’s Remuneration
The total fees paid or due and payable to the Office of the Auditor General for the year are as follows:
2016 2015 $’000 $’000
Audit and review of financial reports 297 290

Water Corporation 2016 annual report
Notes to the financial report
62
Note 20 Related Parties
While the Corporation is not required to comply with AASB 124 Related Party Disclosures, as it is a not-for-profit public sector entity, the following relevant voluntary information is provided.
The Directors of the Corporation, or their Director-related entities, conduct transactions with the Corporation within normal employee and customer relationships, on terms and conditions no more favourable than those that it is reasonable to expect the Corporation would have adopted if dealing with the Director or Director-related entity at arm’s length in similar circumstances.
During the financial year under review, the Corporation, after a public tender process, sold its Engineering and Construction Services branch, to RCR Tomlinson Ltd, for a total cash consideration of $10.4 million. Pursuant to the terms of the sale the Corporation guaranteed to procure goods and services from RCR Tomlinson Ltd to the value of $130 million over three years. The Corporation’s Chairman, Eva Skira, declared a conflict of interest in the sale and subsequent transactions, as she was and is a non-executive Director of RCR Tomlinson Ltd and did not participate in deliberations or voting by the Board on this matter. Mr Peter McMorrow declared a conflict of interest with respect to the award of the Samson Brook Dam Remedial Works Spillway Upgrade as he was Chairman of SRG Civil Pty Ltd, and did not participate in deliberation or voting by the Board on this matter.
The Corporation transacts with a number of Western Australian State Government authorities, agencies and government trading enterprises. Transactions with these entities include, but are not limited to: depositing and borrowing money; sales and purchases of goods, property and other assets; use of utilities; vehicle licensing; other government fees and charges. Total annual transactions with these entities, in excess of $10 million, include:
Transaction value year ended 2016 2015 $M $MTransactions with Department of Treasury, Department of Finance and Western Australian Treasury Corporation ReceiptsDepartment of Treasury – Operating Subsidies 562 573Western Australian Treasury Corporation- Proceeds from borrowings 597 397- Foreign currency 8 5
PaymentsDepartment of Treasury - Dividends 567 562- Income tax equivalent 381 349- Local government rates equivalent 6 6Department of Finance- Payroll tax 20 21- Vehicle leases and stamp duty 12 12Western Australian Treasury Corporation - Repayment of borrowings 515 222- Interest on borrowings 224 230- Guarantee fees 39 36- Purchase of foreign currency 8 5
Other TransactionsPaymentsGovernment Employees’ Superannuation Board 25 22Synergy 23 25Horizon Power 11 12
The above list excludes annual service charges and volume charges received by the Corporation.

Water Corporation 2016 annual reportFinancial report
Notes to the financial report
63
Note 22 Capital Commitments
Total capital expenditure contracted for at reporting date but not provided for in the financial report is $154 million (2015: $153 million).
Note 23 Contingent liabilities
Currently the Corporation is a party to, or is potentially affected by a number of legal claims. Until proceedings relating to these claims are finalised, uncertainty exists regarding the impact, if any, on the operations of the Corporation.
The Directors are of the opinion that provisions are not required in respect of these matters, as it is not probable that a future sacrifice of economic benefits will be required or the amount is not capable of reliable measurement.
The following identifiable contingencies exist at 30 June 2016:
2016 2015 $M $MBank guarantees (note a) 7 6
note a: Bank guarantees are issued in the normal course of business to guarantee the performance of the Water Corporation under contracts and the period of each guarantee varies by contract agreement.
Note 24 Subsequent Events
There have been no events subsequent to balance date which would have a material effect on the Corporation’s financial statements at 30 June 2016.
Note 21 Operating Leases
21.1 Leases as lessee Non-cancellable operating lease rentals are payable as follows: 2016 2015 $M $MLess than one year 48 48Between one and five years 173 171More than five years 293 335
514 554
The Corporation leases property, plant and motor vehicles under non-cancellable operating leases.
During the financial year ended 30 June 2016, $43 million was recognised as an expense in the Statement of Comprehensive Income in respect of non-cancellable operating leases (2015: $47 million).
21.2 Leases as lessor The future minimum lease payments under non-cancellable leases are as follows:
2016 2015 $M $MLess than one year 7 5Between one and five years 14 10More than five years 10 5
31 20
The Corporation leases out property under operating leases.
During the financial year ended 30 June 2016, $7 million was recognised as rental income in the Statement of Comprehensive Income (2015: $7 million).

Water Corporation 2016 annual report
Notes to the financial report
64
Note 25 Financial Instruments
25.1 OverviewThe Corporation has exposure to the following risks from its use of financial instruments:
• Credit risk• Liquidity risk• Market risk
This note presents information about the Corporation’s exposure to each of the above risks, objectives, policies and processes for measuring and managing risk, as well as quantitative disclosures.
The Board of Directors has overall responsibility for the establishment and oversight of the risk management framework.
Risk management policies are established to identify and analyse the risks faced by the Corporation, to set appropriate risk limits and controls, and to monitor risks and adherence to limits. Risk management policies and systems are reviewed regularly to reflect changes in market conditions and the Corporation’s activities. The Corporation has a disciplined and constructive control environment in which all employees are clearly advised of their roles and obligations.
The Corporation’s Audit and Compliance Committee oversees how management monitors compliance with the Corporation’s risk management policies and procedures and reviews the adequacy of the risk management framework in relation to the risks faced by the Corporation. The Audit and Compliance Committee is assisted in its oversight role by the Risk and Assurance Branch, which undertakes both regular and ad-hoc reviews of risk management controls and procedures, the results of which are reported to the Corporation’s Audit and Compliance Committee.
25.2 Credit riskCredit risk is the risk of financial loss to the Corporation if a customer or counterparty to a financial instrument fails to meet its contractual obligations, and arises principally from the Corporation’s receivables from customers.
Management has a credit policy in place and the exposure to credit risk is monitored on a regular basis. The credit risk on financial assets, which have been recognised on the statement of financial position, other than cash and other financial assets is generally the carrying amount, net of any impairment loss for doubtful debts. Most receivables relating to annual service charges and water charges are secured on the rated property. Other receivables are regularly reviewed and allowance is made for debts deemed to be doubtful.
The Corporation has established an allowance for impairment that represents its estimate of incurred losses in respect to trade and other receivables and comprises individually significant exposures.
At reporting date, there were no significant concentrations of credit risk.
Exposure to credit riskThe carrying amount of the Corporation’s financial assets represents the maximum credit exposure. The Corporation’s maximum exposure to credit risk at reporting date was: 2016 2015 $M $MCash and cash equivalents 10 22Trade and other receivables (Note 9) 227 230
237 252
The Corporation is not materially exposed to any individual customer.

Water Corporation 2016 annual reportFinancial report
Notes to the financial report
65
Impairment lossesThe ageing of the Corporation’s trade and other receivables at reporting date was:
Gross Impairment Gross Impairment 2016 2016 2015 2015 $M $M $M $MNot past due 179 - 182 -Past due 0-30 days 22 - 23 -Past due 31-60 days 6 - 6 -Past due 61-90 days 3 - 4 -More than 90 days 19 2 16 1
229 2 231 1
The movement in the allowance for impairment in respect of trade and other receivables during the year was as follows:
2016 2015 $M $MBalance 1 July 1 1Impairment loss recognised 1 -
Balance 30 June 2 1
Impairment losses are recognised when recovery of the debt is considered to be unlikely or of high risk due to circumstances such as the value of any security held is or becomes less than the value of the debt, the cost of recovery is approximate to or becomes greater than the value of the debt, the customer’s financial position is unfavourable or the customer is deceased or whereabouts is unknown.
Based on historical default rates, the Corporation believes that no impairment allowance is necessary in respect of trade and other receivables not past due or past due by up to 90 days.
During the year ended 30 June 2016, the Corporation renegotiated the terms of trade and other receivables of $29 million (2015: $22 million) from customers. If it had not been for these renegotiations, the receivables would have been overdue by more than 90 days. The impairment loss recognised was $1 million (2015: nil).
The allowance account, in respect of trade and other receivables, is used to record impairment losses unless the Corporation is satisfied that no recovery of the amount owing is possible; at that point the amounts considered irrecoverable are written off against the financial asset directly. At 30 June 2016, the Corporation does not have any collective impairments on its trade and other receivables (2015: nil).
25.3 Liquidity riskLiquidity risk is the risk that the Corporation will not be able to meet its financial obligations as they fall due. The Corporation’s approach to managing liquidity is to ensure, as far as possible, that it will always have sufficient liquidity to meet its liabilities when due, under both normal and stressed conditions, without incurring unacceptable losses or risking damage to the Corporation’s reputation.
On an annual basis, the Board approves the forward five-year forecast of cash flows incorporated in the Strategic Development Plan (SDP). On an annual basis, the Board also approves the projected cash flows, for the current and next financial years, derived from the Statement of Corporate Intent (SCI). The SDP and SCI convey the liquidity risk by reporting projected net debt levels with committed facilities. During the financial year, any significant divergence from the projected cash flows is reported to the Board.
The Corporation ensures that it maintains a liquidity buffer of $4 million on a daily basis in approved liquidity instruments to cover cash flow volatility over the short-term and to provide time to arrange additional funding facilities in the event of a cash flow emergency. Funds held in excess of liquidity requirements may be used to retire debt, invest in approved liquidity instruments, or invest in approved financial instruments other than approved liquidity instruments in a manner consistent with the approved liquidity and funding strategy.
At 30 June 2016 the current liabilities of the Corporation exceeded its current assets by $208 million (2015: $309 million). The Corporation will meet its current liability obligations, as and when they fall due for payment, by drawing down on its unused lines of credit. The lines of credit are detailed below.
The Corporation has in place arrangements for Western Australian Treasury Corporation (WATC) to provide finance, currently limited to $6,025 million (2015: $6,025 million) for the repayment of maturing debt and ongoing capital expenditure. Included in the limit of $6,025 million is a liquidity facility currently limited to $500 million (2015: $500 million) that can be drawn down to meet short-term financing needs. At 30 June 2016, $5,440 million was drawn under the overall debt facility (2015: $5,365 million), including nil (2015: $20 million) of liquidity facility. The remaining amount available under the facility, with the relevant approval was $585 million (2015: $660 million).
In addition to the $6,025 million limit, the Corporation has access to $80 million (2015: nil) of short-term credit through a working capital facility with WATC, to assist with daily cash flow management. As at 30 June 2016, $7 million (2015: nil) was drawn under the working capital facility.
Outstanding lines of credit are regularly discussed and agreed with WATC. The type, currency and term of any new finance are determined at the time of draw-down between the Corporation and WATC.

Water Corporation 2016 annual report
Notes to the financial report
66
Exposure to liquidity risk
The following are the contractual maturities of financial liabilities, including estimated interest payments and excluding the impact of netting arrangements:
30 June 2016 Carrying Contractual 6 mths 6-12 1-2 2-5 More amount cash or less mths years years than 5 flows years $M $M $M $M $M $M $M
Non-derivative financial liabilitiesTrade and other payables* 277 (277) (277) - - - -Interest-bearing loans and borrowings:- WATC liquidity facility - - - - - - -- WATC working capital facility 7 (7) (7) - - - -- WATC Term Floating Rate Lending 1,919 (2,101) (30) (31) (564) (1,476) -- WATC Term Fixed Rate Aligned - - - - - - -- WATC Term Fixed Rate Lending 3,521 (4,404) (292) (264) (517) (1,412) (1,919)
Derivative financial liabilitiesOther forward exchange contracts- Outflow 1 1 1 - - - -- Inflow (1) (1) (1) - - - - 5,724 (6,789) (606) (295) (1,081) (2,888) (1,919)

Water Corporation 2016 annual reportFinancial report
Notes to the financial report
67
Exposure to liquidity risk continued
30 June 2015 Carrying Contractual 6 mths 6-12 1-2 2-5 More amount cash or less mths years years than 5 flows years $M $M $M $M $M $M $M
Non-derivative financial liabilitiesTrade and other payables* 279 (279) (279) - - -Interest-bearing loans and borrowings:- WATC liquidity facility 20 (20) (20) - - - -- WATC Term Floating Rate Lending 1,564 (1,748) (23) (27) (51) (1,454) (193)- WATC Term Fixed Rate Aligned 800 (837) (16) (821) - - -- WATC Term Fixed Rate Lending 2,981 (3,752) (260) (255) (492) (1,343) (1,402)
Derivative financial liabilitiesOther forward exchange contracts- Outflow 8 8 8 - - - -- Inflow (8) (8) (8) - - - - 5,644 (6,636) (598) (1,103) (543) (2,797) (1,595)
* Excludes derivatives (shown separately)
The gross inflows/(outflows) disclosed in the previous table represent the contractual undiscounted cash flows relating to derivative financial liabilities held for risk management purposes and which are usually not closed out prior to contractual maturity. The disclosure shows net cash flow amounts for derivatives that are net cash settled and gross cash inflow and outflow amounts for derivatives that have simultaneous gross cash settlement, e.g. forward exchange contracts.

Water Corporation 2016 annual report
Notes to the financial report
68
25.4 Market riskMarket risk is the risk that changes in market prices, such as foreign exchange rates and interest rates, will affect the Corporation’s income or the value of its holdings of financial instruments. The objective of market risk management is to manage and control market risk exposures within acceptable parameters, while optimising return.
The Corporation enters into derivatives, and also incurs financial liabilities, in order to manage market risks. All such transactions are carried out in line with risk management policies. Generally, the Corporation seeks to apply hedge accounting in order to manage volatility in surplus or deficit.
25.4.1 Currency riskThe Corporation makes purchases that are denominated in currencies other than Australian dollars. The currencies in which these transactions primarily are denominated in are Euro and USD.
In accordance with risk management policies, non-material exposures to an aggregate value of $200,000 for any one project may be left unhedged. At any one time, unhedged exposures in a specific foreign currency cannot exceed an aggregate value of $500,000 and unhedged exposures in all foreign currencies cannot exceed an aggregate value of $1,000,000.
The Corporation uses forward exchange contracts to hedge its currency risk, most with a maturity of less than one year from reporting date. When necessary, forward exchange contracts are rolled over at maturity.
The Corporation has no material exposure to foreign currency risk. 25.4.2 Interest rate risk The Corporation is exposed to interest rate risk through financial assets and financial liabilities and adopts a policy of ensuring the majority of its exposure to changes in interest rates on borrowings is on a fixed rate basis.
ProfileAt reporting date the interest rate profile of the Corporation’s interest bearing financial instruments was: 2016 2015 $M $MFixed rate instrumentsWATC Liquidity facility - 20WATC Working capital facility 7 -WATC Term Floating Rate Lending (Interest rate fixed for six months) 1,919 1,564WATC Term Fixed Rate Aligned (Interest rate fixed for three years) - 800WATC Term Fixed Rate Lending (note a) 3,521 2,981
5,447 5,365
note a Structured into 40 lines spread over 40 quarters (10 years), with one fortieth of the portfolio maturing each quarter, refinanced at an interest rate fixed for 10 years.
Fair value sensitivity analysis for fixed rate instrumentsThe Corporation does not account for any fixed rate financial assets and liabilities at fair value through surplus or deficit, and the Corporation does not designate the forward points component of derivatives as hedging instruments under a fair value hedge accounting model. Therefore, a change in interest rates at reporting date would not affect equity.
Cash flow sensitivity analysis for fixed rate instrumentsBorrowings under the Term Fixed Rate Lending are structured into various debt lines with maturities ranging from six months to 10 years. $371 million of existing borrowings under this facility will mature over the next 12 months, of which $196 million will be refinanced at an interest rate fixed for six months and $175 million will be refinanced at a rate fixed for 10 years. Interest rates for the $1,919 million under the Term Floating Rate Lending facility are reset every six months. None of the borrowings under the Term Floating Rate Lending facility will mature in the next 12 months. A change of 100 basis points in interest rates at the reporting date would have increased or decreased interest expense (before capitalised interest) by $18 million. This analysis assumes that all other variables remain constant.

Water Corporation 2016 annual reportFinancial report
Notes to the financial report
69
25.5 Fair values
Fair values versus carrying amountsThe fair values of financial assets and liabilities, together with the carrying amounts shown in the statement of financial position, are as follows:
Carrying Fair Carrying Fair Amount Value Amount Value 2016 2016 2015 2015 $M $M $M $MAssets carried at amortised costCash and cash equivalents 10 10 22 22Trade and other receivables 227 227 230 230
Liabilities carried at amortised costTrade and other payables* 277 277 279 279Interest-bearing loans and borrowings:- WATC liquidity facility - - 20 20- WATC working capital facility 7 7 - -- WATC Term Floating Rate Lending 1,919 1,940 1,564 1,579- WATC Term Fixed Rate Aligned - - 800 816- WATC Term Fixed Rate Lending 3,521 3,834 2,981 3,255
Liabilities carried at fair valueOther forward exchange contracts 1 1 8 8
* Excludes derivatives (shown separately)
The basis for determining fair values is disclosed in Note 26.19.
Interest rates used for determining fair valueThe average interest rates used to discount estimated cash flows, where applicable, are based on the WA Treasury Corporation yield curve at the reporting date, plus a margin which represents the buy sell spread, and were as follows: 2016 2015Interest-bearing loans and borrowings 1.9%-2.8% 2.1%-3.7%
25.6 Fair value hierarchy
The table below analyses financial instruments carried at fair value, by valuation method. The different levels have been defined as follows:• Level 1: quoted prices (unadjusted) in active markets for identical assets or liabilities.• Level 2: inputs other than quoted prices included within Level 1 that are observable
for the asset or liability, either directly (i.e. as prices) or indirectly (i.e. derived from prices).
• Level 3: inputs for the asset or liability that are not based on observable market data (unobservable inputs).
Level 1 Level 2 Level 3 Total $M $M $M $M30 June 2016Derivative financial liabilities 1 - - 1
30 June 2015Derivative financial liabilities 8 - - 8

Water Corporation 2016 annual report
Notes to the financial report
70
Note 26 Significant accounting policies
The accounting policies set out below have been applied consistently to all periods presented in this financial report.
26.1 Revenue(a) Revenue from annual service charges
and volume charges is recognised in the Statement of Comprehensive Income at the amounts levied and billed for the period, including interest on overdue amounts, less rebates/concessions allowed to entitled customers. Revenue also includes an estimate for the value of water consumed but not billed at reporting date.
(b) Operating Subsidies (OS) are recognised as revenue when there is reasonable assurance that they will be received and the Corporation has complied with the conditions attached to them. OS are received from the State Government for:
• costs in respect of country water, sewerage, drainage and irrigation services;
• infill sewerage program; and
• revenue foregone, plus agreed administration costs, from rebates and concessions to Pensioners, Seniors and various exempt bodies on annual service charges, water consumption charges and other fees and charges.
(c) Developers’ contributions are recognised as revenue at fair value when received. The Corporation receives capital contributions from external parties in the form of either assets or cash. These are commonly referred to as Developers’ Contributions and consist of:
• headworks contributions - developers are required to make standard contributions towards the cost of headworks necessary to provide reticulation services within a subdivision;
• handover works - as a condition of subdivision, developers are required to provide water, and in most areas sewerage services, to individual blocks. These services are connected to the existing system and handed over to the Corporation free of charge;
• work performed for developers - as an alternative to developers arranging for the installation of reticulation services, the Corporation may be requested to provide these with the developer paying the cost at an agreed quotation; and
• notional capital surcharge - companies supplied water through special agreements are required to make additional capital payments if they exceed the quota of water they have paid for.
The after-tax equivalent value of handover works is excluded from the base used to calculate dividend payments.
26.2 LeasesLeases under which the Corporation assumes substantially all the risks and rewards of ownership are classified as finance leases. Other leases are classified as operating leases.
26.2.1 Finance leasesUpon initial recognition, the leased asset is measured at an amount equal to the lower of its fair value and the present value of the minimum lease payments. Minimum lease payments made under finance leases are apportioned between the finance expense and the reduction of the outstanding liability. The finance expense is allocated to each period during the lease term so as to produce a constant periodic rate of interest on the remaining balance of the liability. Contingent lease payments are accounted for by revising the minimum lease payments over the remaining term of the lease when the lease adjustment is confirmed.
26.2.2 Operating leasesPayments made under operating leases are recognised in the Statement of Comprehensive Income on a straight-line basis over the term of the lease.
26.3 Net finance costs26.3.1 Finance incomeFinance income comprises interest income on funds invested. Interest income is recognised as it accrues, using the effective interest method.
26.3.2 Finance costsFinance costs comprise interest expense on borrowings calculated using the effective interest method. The interest expense component of finance lease payments is recognised in the Statement of Comprehensive Income using the effective interest method.
Borrowing costs are expensed as incurred except where they relate to the financing of projects under construction, with an estimated cost of more than $5 million, where they are capitalised up to the date of commissioning.
Foreign currency gains and losses are reported on a net basis.
26.4 Income Tax equivalentThe Corporation is exempt from the Commonwealth of Australia’s Income Tax Assessment Act 1936 but makes income tax equivalent payments to the Western Australian Government. The Corporation entered into the National Taxation Equivalent Regime (NTER) environment on 1 July 2001 having previously operated under the state-based Taxation Equivalent Regime. While tax equivalent payments are remitted to the Department of Treasury, the Corporation’s tax equivalent is subject to Australian Tax Office (ATO) administration. The calculation of the liability in respect of these tax equivalents is governed by the Income Tax Administration Acts and the NTER guidelines as agreed by the State Government.

Water Corporation 2016 annual reportFinancial report
Notes to the financial report
71
Income tax equivalent expense comprises current and deferred tax equivalents. Current tax equivalent and deferred tax equivalent is recognised in the Statement of Comprehensive Income.
Current tax equivalent is the expected tax equivalent payable on the taxable income for the year, using tax rates enacted or substantively enacted at reporting date, and any adjustment to tax equivalent payable in respect of previous years.
Deferred tax equivalent is recognised in respect of temporary differences between the carrying amounts of assets and liabilities for financial reporting purposes and the amounts used for taxation purposes.
Deferred tax equivalent is measured at the tax rates that are expected to be applied to the temporary differences when they reverse, based on the laws that have been enacted or substantively enacted by reporting date.
In determining the amount of current and deferred tax equivalent, the Corporation takes into account the impact of uncertain tax positions and whether additional tax equivalents and interest may be due. The Corporation believes that its accruals for tax equivalent liabilities are adequate for all open tax years based on its assessment of many factors, including interpretations of tax law and prior experience. This assessment relies on estimates and assumptions and may involve a series of judgements about future events. New information may become available that causes the Corporation to change its
judgement regarding the adequacy of existing tax equivalent liabilities; such changes to tax equivalent liabilities will impact tax equivalent expense in the period that such a determination is made.
Deferred tax equivalent assets and liabilities are offset if there is a legally enforceable right to offset current tax equivalent liabilities and assets, and they relate to income tax equivalents levied by the same tax authority on the same taxable entity.
A deferred tax equivalent asset is recognised to the extent that it is probable that future taxable surpluses will be available against which the temporary difference can be utilised. Deferred tax equivalent assets are reviewed at each reporting date and are reduced to the extent that it is no longer probable that the related tax equivalent benefit will be realised.
26.5 Cash and cash equivalentsCash and cash equivalents comprise cash on hand and in banks.
26.6 Trade and other receivablesTrade and other receivables are stated at their amortised cost less provision for impairment losses (see Note 26.10.1) and are normally settled within 30 days.
26.7 InventoriesInventories consist of consumable engineering supplies and spares required for maintenance and operation of systems and general construction works. Inventories are measured at cost and adjusted when applicable for any loss of service potential.
An allowance is maintained for the diminution in the value of inventories due to obsolescence and items being surplus to requirements.
26.8 Property, plant and equipment26.8.1 Recognition and measurementProperty, plant and equipment represent the capital works and plant required for the operation of the Corporation and comprises:
(a) works carried out under the capital investment program, which are initially recorded at cost. Cost includes direct materials and labour together with a proportion of management expenses directly related to bringing the asset to its working condition, and capitalisation of interest directly attributable to major works with an estimated cost greater than $5 million;
(b) works carried out by developers, which are taken over by the Corporation free of charge are recorded at deemed cost, being the fair value at the date of acquisition; and
(c) other property, plant and equipment, which are initially recorded at cost of acquisition plus incidental costs directly attributable to the acquisition.
Items of property, plant and equipment are stated at cost or deemed cost less accumulated depreciation (see Note 26.8.3) and impairment losses (see Note 26.10.1).
26.8.2 Subsequent costsThe Corporation recognises in the carrying amount of an item of property, plant and equipment the following:
(a) the cost of replacement parts of an item is included when that cost is incurred, if it is probable that the future economic benefits embodied within the item will flow to the Corporation and the cost of the item can be measured reliably. The carrying amounts of those parts that are replaced are derecognised.
(b) the cost of regular major inspection if it is probable that the future economic benefits embodied within the item will flow to the Corporation and the cost of the item can be measured reliably. Any remaining carrying amount of the cost of the previous inspection is derecognised.
All other costs are recognised in the Statement of Comprehensive Income as an expense when incurred.
Water Corporation 2016 annual report
Notes to the financial report
72
26.8.3 DepreciationIn order to recognise the loss of service potential of property, plant and equipment, depreciation is recognised in the Statement of Comprehensive Income on a straight-line basis over the estimated useful lives of each part of an item of property, plant and equipment, making allowance where appropriate for residual values. Leased assets are depreciated over the shorter of the lease term and their useful lives unless it is reasonably certain that the Corporation will obtain ownership at the end of the lease term. Land is not depreciated. The asset lives are reviewed annually, taking into account commercial and technical obsolescence, as well as normal wear and tear.
The estimated useful lives of the different classes of property, plant and equipment for current and comparative years are as follows:
Life (years)Tunnels - water 150Dams and associated civil works 120Pipes - water and wastewater (other than galvanised steel) 75 - 110Ocean outfalls and associated pipes 40 - 100Bridges (other than timber) 50 - 80Reservoirs and tanks 50 - 70Fire hydrants and reticulation valves 50 - 55Civil works - pump stations and treatment plants 50Buildings (other than temporary) 30 - 50Pipes - water (galvanised steel) 30Drains and channels 20 - 30Wells and bores 20 - 30Mechanical and electrical installations 25Telemetry equipment, instruments and revenue meters 10Furniture, office and laboratory equipment 7Vehicles and mobile plant 3 - 7Computer equipment 3 - 5
26.9 Intangible assets26.9.1 Computer softwareComputer software consists of software which is not integral to the hardware, such as SAP and Grange. Computer software is stated at cost less accumulated amortisation (see Note 26.9.4) and accumulated impairment losses (see Note 26.10.1).
26.9.2 Water entitlementsWater entitlements purchased by the Corporation have been recognised initially at the cost of acquiring the entitlements plus incidental costs directly attributable to the acquisition (see Note 26.10).
26.9.3 Renewable energy certificatesRenewable energy certificates are recognised initially at market valuation. These certificates are considered to have an indefinite useful life and are tested annually for impairment (see Note 26.10).
26.9.4 AmortisationAmortisation is calculated using the cost of the asset, or its deemed cost, less its residual value.
Amortisation of computer software and intellectual property is recognised in the Statement of Comprehensive Income on a straight-line basis over the estimated useful lives of intangible assets, unless such lives are indefinite. Intangible assets with indefinite useful lives are not amortised and are systematically tested for impairment at each reporting date.
Intangible assets are amortised over the following useful lives:
Life (years)Computer software 3 - 10Intellectual property 10
Amortisation methods, useful lives and residual values are reviewed at each financial year-end and adjusted if appropriate.
26.10 Impairment26.10.1 Financial assetsA financial asset is assessed at each reporting date to determine whether there is any objective evidence that it is impaired. A financial asset is impaired if objective evidence indicates that a loss event has occurred after the initial recognition of the asset, and that the loss event had a negative effect on the estimated future cash flows of that asset that can be estimated reliably.
Objective evidence that financial assets are impaired can include default or delinquency by a debtor, restructuring of an amount due to the Corporation on terms that the Corporation would not consider otherwise and indications that a debtor will enter bankruptcy.
The Corporation considers evidence of impairment for financial assets at both a specific asset and collective level. All individually significant financial assets are assessed for specific impairment. All individually significant financial assets found not to be specifically impaired are then collectively assessed for any impairment that has been incurred but not yet identified. Financial assets that are not individually significant are collectively assessed for impairment by grouping together financial assets with similar risk characteristics.
In assessing collective impairment the Corporation uses historical trends of the probability of default, timing of recoveries and the amount of loss incurred, adjusted for management’s judgement as to

Water Corporation 2016 annual reportFinancial report
Notes to the financial report
73
whether current economic and credit conditions are such that the actual losses are likely to be greater or less than suggested by historical trends.
An impairment loss in respect of a financial asset measured at amortised cost is calculated as the difference between its carrying amount, and the present value of the estimated future cash flows discounted at the original effective interest rate.
All impairment losses are recognised in the Statement of Comprehensive Income.
26.10.2 Non-financial assetsThe carrying amounts of the Corporation’s non-financial assets, other than inventories and deferred tax equivalent assets, are reviewed at each reporting date to determine whether there is any indication of impairment. If any such indication exists then the asset’s recoverable amount is estimated. For intangible assets that have indefinite lives or that are not yet available for use, recoverable amount is estimated at each reporting date.
An impairment loss is recognised if the carrying amount of an asset exceeds its recoverable amount. Impairment losses are recognised in the Statement of Comprehensive Income.
The recoverable amount of an asset is the greater of its value in use and its fair value less costs to sell. Value in use for not–for-profit entities is determined using the depreciated replacement cost of the asset when the future economic benefits of the asset are not primarily dependent on the asset’s ability to generate net cash inflows and where the Corporation would, if deprived of the asset, replace its remaining future economic benefits.
26.11 Trade and other payablesTrade and other payables are stated at amortised cost and are normally settled within 30 days.
26.12 Interest-bearing borrowingsInterest-bearing borrowings are recognised initially at fair value less attributable transaction costs. Subsequent to initial recognition, interest-bearing borrowings are recognised at amortised cost with any difference between cost and redemption value being recognised in the Statement of Comprehensive Income over the period of the borrowings on an effective interest basis.
26.13 ProvisionsA provision is recognised if, as a result of a past event, the Corporation has a present legal or constructive obligation that can be measured reliably, and it is probable that an outflow of economic benefits will be required to settle the obligation. Provisions are determined by discounting the expected future cash flows at a pre-tax rate that reflects current market assessments of the time value of money and the risks specific to the liability. The unwinding of the discount is recognised as a finance cost.
26.13.1 InsuranceA provision for uninsured loss events is recognised when a claim is received from an external party after an incident occurs, and it is probable that a payment to the external party will be required to settle the financial obligation associated with the incident. The amount provided for is up to the Corporation’s insurance deductible level.
26.13.2 Workers’ compensationThe Corporation self-insures for risks associated with workers’ compensation for claims relating to pre 1 July 1997 events. Outstanding claims are recognised when an incident occurs that may give rise to a claim and are measured at the cost that the Corporation expects to incur in settling the claims, discounted using a government bond rate with a maturity date approximating the terms of the Corporation’s obligation.
26.13.3 Site restorationA provision for site restoration costs is recognised when: there is either a legal or constructive obligation to restore a site; the land is contaminated; it is probable a restoration expense will be incurred; and the costs can be estimated reasonably.
26.14 Employee benefits26.14.1 Long service leave and
annual leaveProvisions for long service leave and annual leave are maintained to provide for employee benefits which are assessed on the basis of calculated leave liabilities for employee service to reporting date.
The value of long service leave and annual leave is calculated using expected future increases in wage and salary rates including related on-costs and expected settlement dates, and are discounted using the rates attached to the Commonwealth Government bonds at reporting date which have maturity dates approximating the terms of the Corporation’s obligations.
26.14.2 Purchased leaveA provision for purchased leave is maintained to provide for purchased leave benefits which are assessed on the basis of calculated leave entitlements at reporting date.
This scheme allows employees to purchase up to 12 additional weeks leave per annum by agreeing to a reduced salary rate over 52 weeks of the year. The minimum amount of leave available to be purchased is 1 week.
This scheme also allows employees to take reduced salary of eighty percent for four years and have paid leave for the whole of the fifth year at eighty percent of their salary.
Values are calculated at undiscounted amounts based on wage and salary rates that the Corporation expects to pay as at reporting date including related on-costs.
26.14.3 Termination benefitsTermination benefits are recognised as an expense when the Corporation is demonstrably committed, without realistic possibility of withdrawal, to a formal detailed plan to terminate employment before the normal retirement date. Termination benefits for voluntary redundancies are recognised if the Corporation has made an offer encouraging voluntary redundancy, it is probable that the offer will be accepted, and the number of acceptances can be estimated reliably.

Water Corporation 2016 annual report
Notes to the financial report
74
26.14.4 Non-monetary benefitsNon-accumulating non-monetary benefits, such as medical care, housing, cars and free or subsidised goods and services, are expensed based on the net marginal cost to the Corporation as the benefits are taken by the employees.
26.15 Foreign currency transactionsTransactions in foreign currencies are translated to Australian dollars at exchange rates at the dates of the transactions. Monetary assets and liabilities denominated in foreign currencies are translated to the functional currency at the exchange rate at the reporting date. Non-monetary assets and liabilities that are measured at fair value in a foreign currency are translated to the functional currency at the exchange rate when the fair value was determined. Foreign currency differences are generally recognised in the Statement of Comprehensive Income. Non-monetary items that are measured based on historical cost in a foreign currency are not translated.
26.16 Derivative financial instrumentsThe Corporation uses derivative financial instruments to hedge its exposure to foreign exchange risks arising from operational activities. In accordance with the Treasury Risk Management policy, the Corporation does not hold or issue derivative financial instruments for trading purposes. However, derivatives that do not qualify for hedge accounting are accounted for as trading instruments through surplus or deficit.
On initial designation of the hedge, the Corporation formally documents the relationship between the hedging instrument and hedged item, including the risk management objectives and strategy in undertaking the hedge transaction, together with the methods that will be used to assess the effectiveness of the hedging relationship. The Corporation makes an assessment, both at the inception of the hedge relationship as well as on an ongoing basis, whether the hedging instruments are expected to be “highly effective” in offsetting the changes in the fair value or cash flows of the respective hedged items during the period for which the hedge is designated, and whether the actual results of each hedge are within a range of 80-125 per cent. For a cash flow hedge of a forecast transaction, the transaction should be highly probable to occur and should present an exposure to variations in cash flows that could ultimately affect the reported surplus or deficit.
Derivatives are recognised initially at fair value and attributable transaction costs are recognised in the Statement of Comprehensive Income when incurred. Subsequent to initial recognition, derivatives are measured at fair value, and changes therein are accounted for as described below.
26.16.1 Cash flow hedges Changes in the fair value of the derivative hedging instrument designated as a cash flow hedge are recognised directly in equity to the extent that the hedge is effective. To the extent that the hedge is ineffective, changes in fair value are recognised in the Statement of Comprehensive Income.
If the hedging instrument no longer meets the criteria for hedge accounting, expires or is sold, terminated or exercised, then hedge accounting is discontinued prospectively. The cumulative gain or loss previously recognised in equity remains there until the forecast transaction occurs. When the hedged item is a non-financial asset, the amount recognised in equity is transferred to the carrying amount of the asset when it is recognised. In other cases the amount recognised in equity is transferred to the Statement of Comprehensive Income in the same period that the hedged item affects the Statement of Comprehensive Income.
26.17 Goods and services taxRevenue, expenses and assets are recognised net of the amount of goods and services tax (GST), except where the amount of GST incurred is not recoverable from the taxation authority. In these circumstances, the GST is recognised as part of the cost of acquisition of the asset or as part of the expense.
Receivables and payables are stated with the amount of GST included. The net amount of GST recoverable from, or payable to, the ATO is included as a current asset or current liability in the statement of financial position.
Cash flows are included in the statement of cash flows on a gross basis. The GST components of cash flows arising from investing and financing activities which are recoverable from, or payable to, the ATO are classified as operating cash flows.
26.18 New standards and interpretations not yet adopted
A number of new standards, amendments to standards and interpretations are effective for annual reporting periods beginning after 1 January 2016, and have not been applied in preparing this financial report. Those which may be relevant to the Corporation are set out below.
26.18.1 AASB 9 Financial InstrumentsAASB 9 includes revised guidance on the classification and measurement of financial instruments, including a new expected credit loss model for calculating impairment on financial assets, and the new general hedge accounting requirements. It also carries forward the guidance on recognition and de-recognition of financial instruments from AASB 139.
AASB 9 is effective for annual reporting periods beginning on or after 1 January 2018, with early adoption permitted.
The Corporation has not assessed the impact of this standard and does not plan to adopt it early.
26.18.2 AASB 16 Leases AASB 16 introduces a single lessee accounting model and requires a lessee to recognise assets and liabilities for all leases within a term of more than 12 months, unless the underlying asset is of low value.
This Standard is applicable to annual reporting periods beginning on or after 1 January 2019, with early adoption permitted.
The Corporation has not assessed the impact of this standard, and does not plan to adopt it early.

Water Corporation 2016 annual reportFinancial report
Notes to the financial report
75
26.1.8.3 AASB 15 Revenue from Contracts with Customers
AASB 15 establishes a comprehensive framework for determining whether, how much and when revenue is recognised. It replaces existing revenue recognition guidance, including AASB 118 Revenue, AASB 111 Construction Contracts and IFRIC 13 Customer Loyalty Programs.
AASB 15 is effective for annual reporting periods beginning on or after 1 January 2017, with early adoption permitted.
The Corporation has not assessed the impact of this standard and does not plan to adopt it early.
26.19 Determination of fair valuesA number of the Corporation’s accounting policies and disclosures require the measurement of fair value, for both financial and non-financial assets and liabilities. Fair values have been determined for measurement and/or disclosure purposes based on the following methods. Where applicable, further information about the assumptions made in determining fair values is disclosed in the notes specific to that asset or liability.
26.19.1 DerivativesThe fair value of forward exchange contracts is based on their listed market price, if available. If a listed market price is not available, then fair value is estimated by discounting the difference between the contractual forward price and the current forward price for the residual maturity of the contract using a risk-free interest rate (based on government bonds).
26.19.2 Interest-bearing loans and borrowings
Fair value is calculated based on discounted expected future principal and interest cash flows.
26.19.3 Finance lease liabilitiesThe fair value is estimated as the present value of future cash flows, discounted at market interest rates for homogeneous lease agreements. The estimated fair values reflect changes in interest rates.
26.19.4 Trade and other receivables/payables
For receivables/payables with a remaining life of less than one year, the notional amount is deemed to reflect the fair value. The fair value of all other receivables/payables is estimated as the present value of future cash flows, discounted at the market rate of interest at reporting date.
26.20 ComparativesWhere appropriate, comparative amounts have been re-presented and re-classified to ensure comparability with the current reporting year.

Water Corporation 2016 annual report
Notes to the financial report
76
In the opinion of the Directors of the Water Corporation (the “Corporation”):
(a) the financial statements and notes are in accordance with the Water Corporations Act 1995, including:
(i) giving a true and fair view of the Corporation’s financial position as at 30 June 2016 and of its performance, for the financial year ended on that date; and
(ii) complying with Australian Accounting Standards (including the Australian Accounting Interpretations) and the Corporations Regulations 2001.
(b) there are reasonable grounds to believe that the Corporation will be able to pay its debts as and when they become due and payable.
Signed in accordance with a resolution of the Directors:
E. SkiraChairman
S.L. MurphyChief Executive OfficerPERTH, 25 August 2016.
Directors’ declaration

Water Corporation 2016 annual report
77
Water Corporation 2016 annual report

78
GlossaryAquiferAn underground layer of water-bearing permeable rock or consolidated materials (clay, sand, silt or gravel), from which groundwater can be extracted.
CatchmentArea of land, which collects rainfall and contributes to surface water or to groundwater.
DesalinationThe process that removes salt from saline water to produce fresh water.
Drinking waterWater that is safe to use for drinking.
Gigalitre (GL)A metric unit of volume or capacity equal to 1 billion (a thousand million) litres of water. This volume would fill 444 Olympic-sized swimming pools.
Greenhouse gases
Atmospheric gases that absorb and re-radiate the sun’s energy, rather than letting it escape back into space. Water vapour, carbon dioxide, nitrous oxide, methane and ozone are the primary greenhouse gases. Human activities have increased the levels of these gases in the atmosphere, leading to more energy being trapped and so raising Earth’s temperatures.
GroundwaterWater in the soil below the surface of the ground, typically found in an aquifer.
Groundwater replenishmentThe process where treated wastewater is further treated to drinking water standards and recharged into groundwater supplies.
InfrastructureServices and equipment needed to support urban communities.
Integrated Water Supply Scheme (IWSS)Supplies water to more than 2 million people, serving towns in the South West, metropolitan Perth and from Mundaring Weir to towns and farmlands in the Central Wheatbelt out to Kalgoorlie-Boulder.
Kilolitre (kL)A metric unit of volume or capacity equal to 1,000 litres.
Megalitre (ML)A metric unit of volume or capacity equal to 1 million litres.
Surface water
All water naturally open to the atmosphere (rivers, lakes, dams, streams, oceans, etc).
WastewaterWastewater is 99.97 per cent water and comes mostly from showers, baths and washing machines.
Engaging with the community
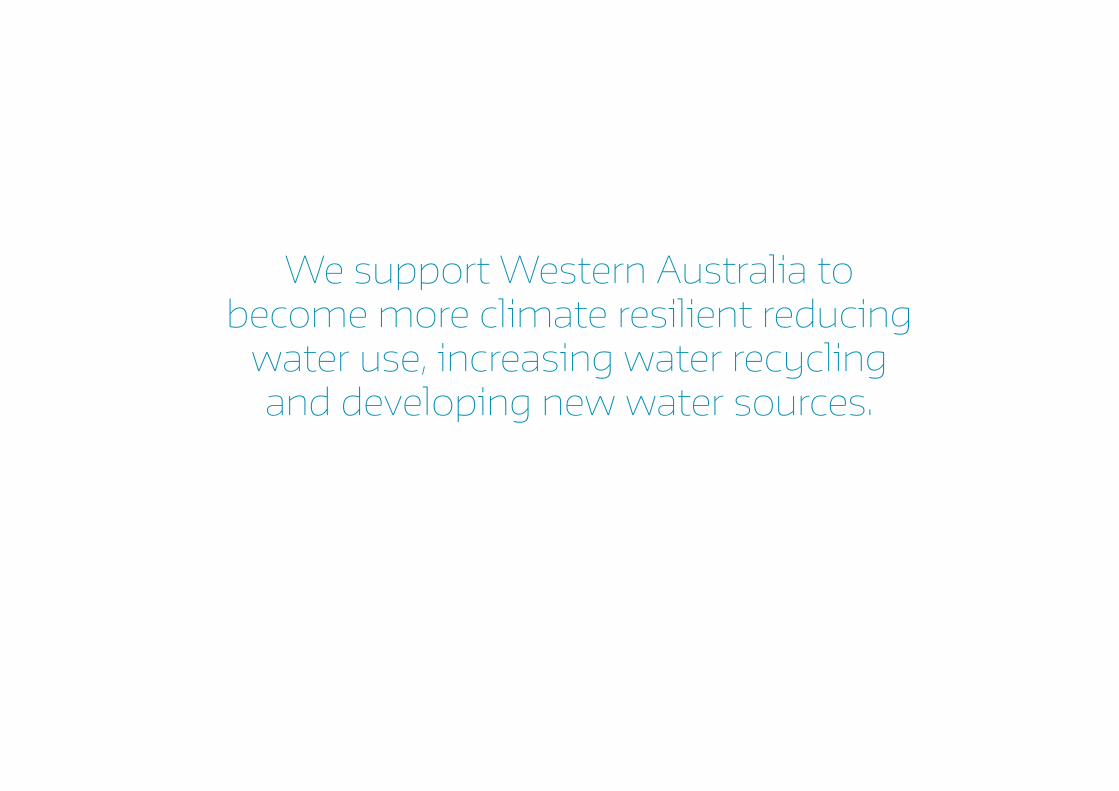
We support Western Australia to become more climate resilient reducing
water use, increasing water recycling and developing new water sources.

13 13 85 Account Enquiries (8am – 5pm weekdays) 13 36 77 National Relay Service
watercorporation.com.au/contact
ISSN 1447-4212