engineering and economic challenges in shale gas production
TRANSCRIPT
Engineering and Economic Challenges in Shale Gas Production
2011 Gas/Electric Partnership Conference
Feb 10th, 2011Rob Sutton

2
US Gas Well Locations
Source: IHS
MS Streets & Trips
3
4
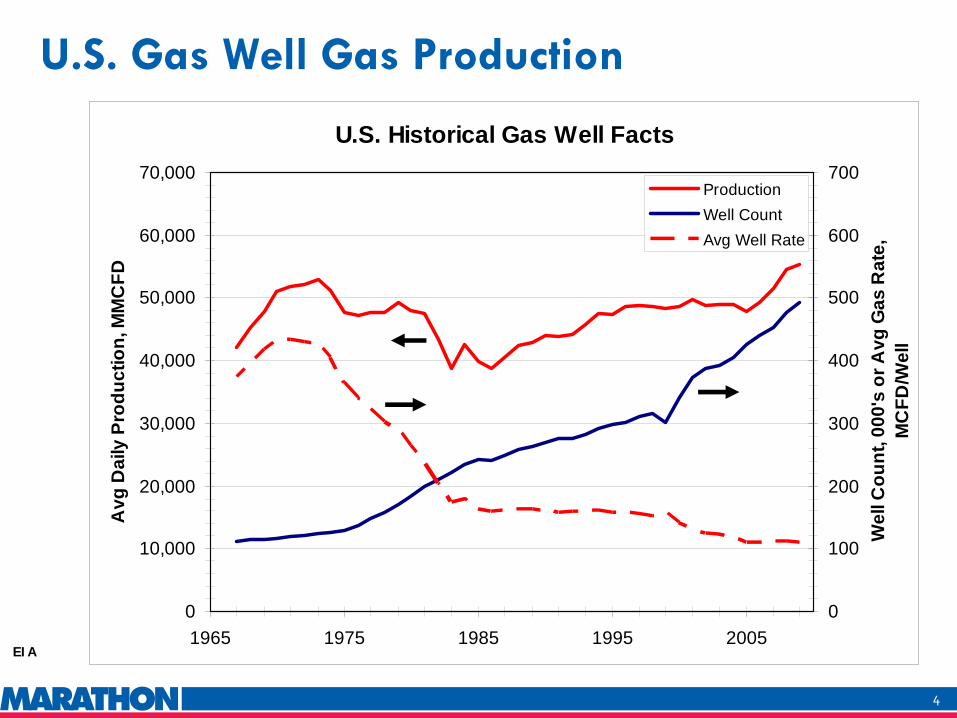
U.S. Historical Gas Well Facts
0
10,000
20,000
30,000
40,000
50,000
60,000
70,000
1965 1975 1985 1995 2005
Avg
Dai
ly P
rodu
ctio
n, M
MC
FD
0
100
200
300
400
500
600
700
Wel
l Cou
nt, 0
00's
or A
vg G
as R
ate,
M
CFD
/Wel
l
ProductionWell CountAvg Well Rate
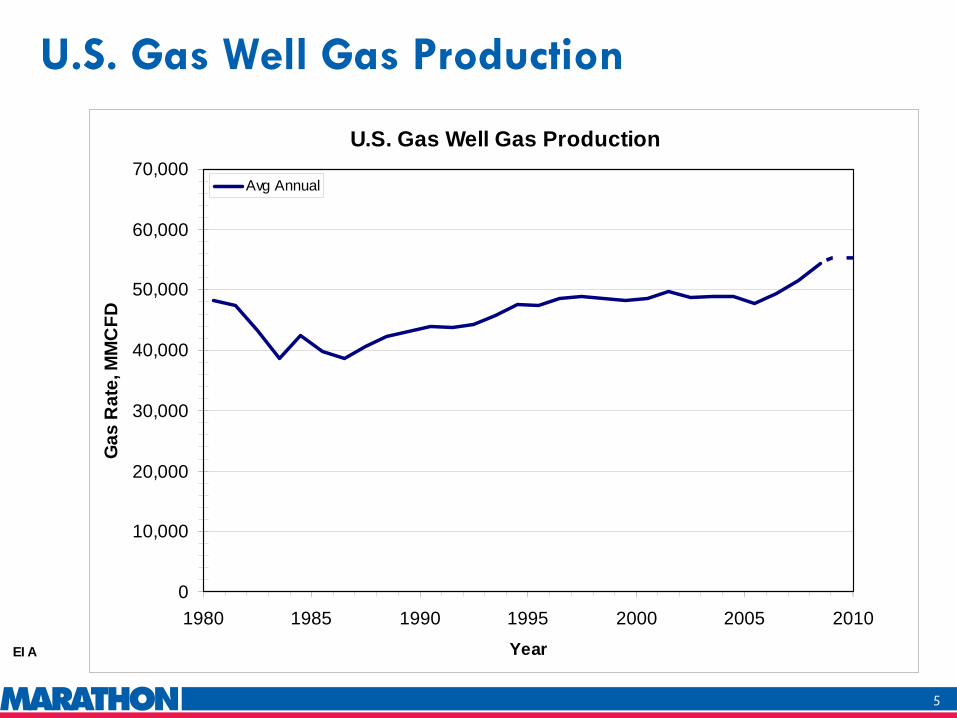
U.S. Gas Well Gas Production
EIA
5
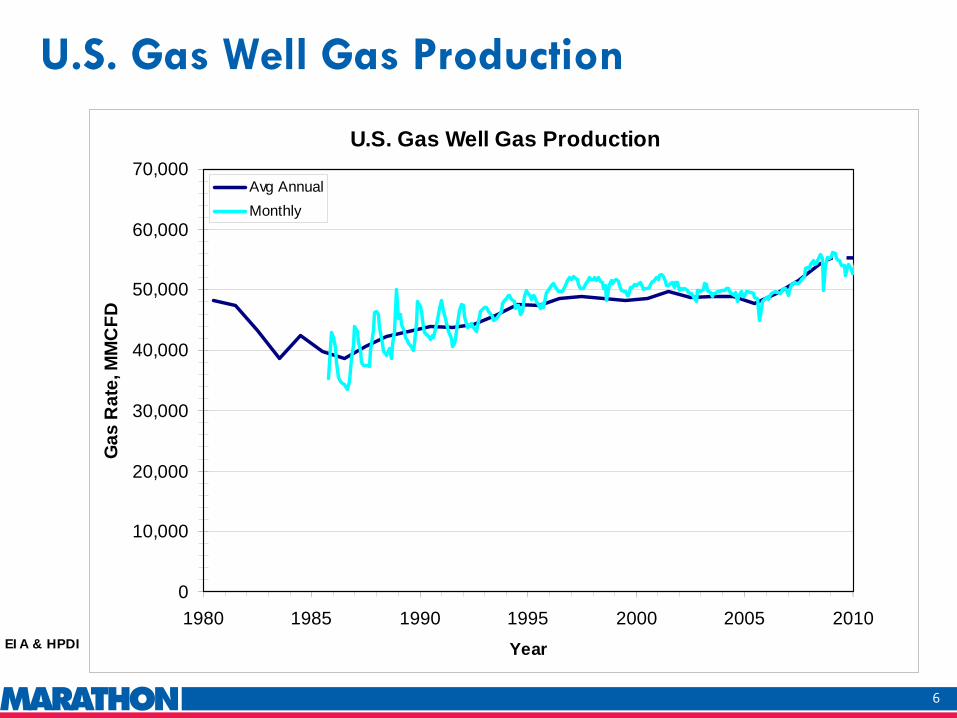
U.S. Gas Well Gas Production
0
10,000
20,000
30,000
40,000
50,000
60,000
70,000
1980 1985 1990 1995 2000 2005 2010Year
Gas
Rat
e, M
MC
FD
Avg Annual
U.S. Gas Well Gas Production
EIA
6
U.S. Gas Well Gas Production
0
10,000
20,000
30,000
40,000
50,000
60,000
70,000
1980 1985 1990 1995 2000 2005 2010Year
Gas
Rat
e, M
MC
FD
Avg AnnualMonthly
U.S. Gas Well Gas Production
EIA & HPDI
7
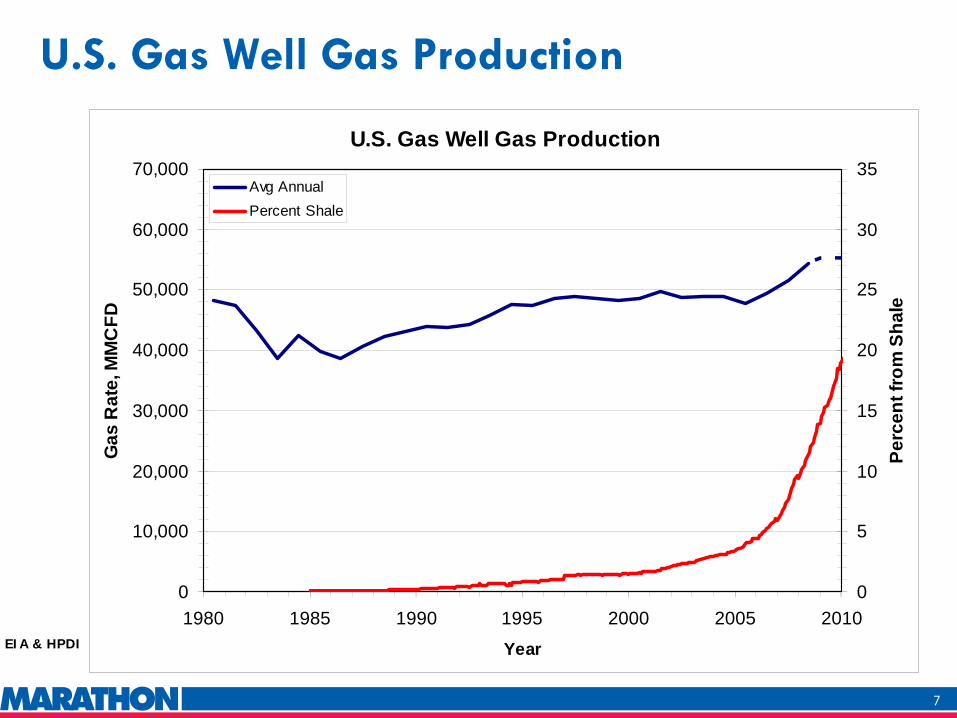
U.S. Gas Well Gas Production
0
10,000
20,000
30,000
40,000
50,000
60,000
70,000
1980 1985 1990 1995 2000 2005 2010Year
Gas
Rat
e, M
MC
FD
0
5
10
15
20
25
30
35
Perc
ent f
rom
Sha
le
Avg AnnualPercent Shale
U.S. Gas Well Gas Production
EIA & HPDI
8
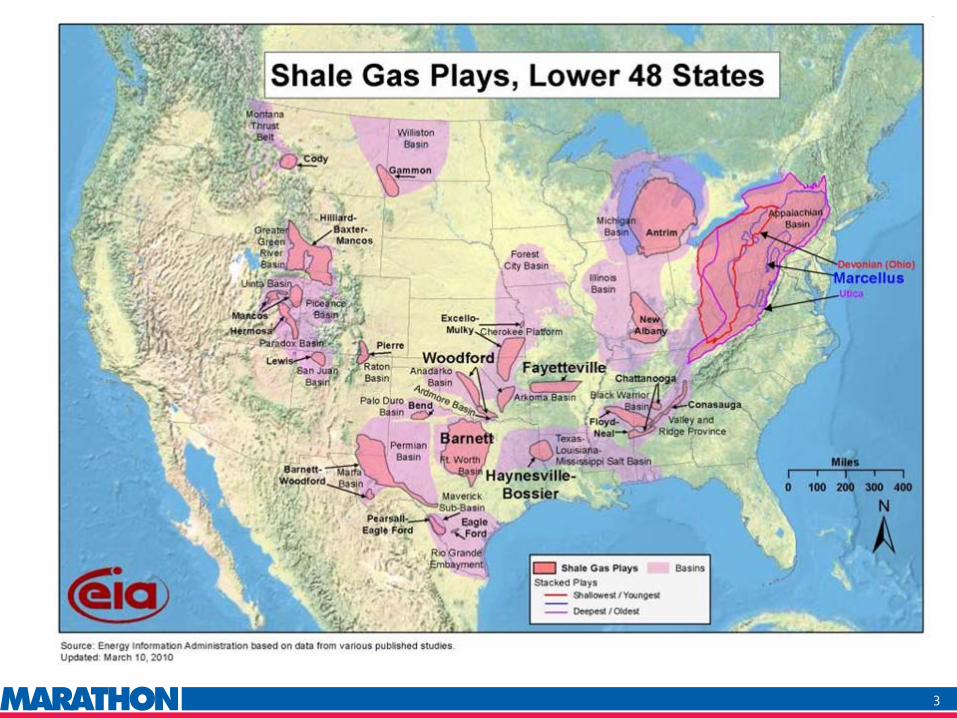
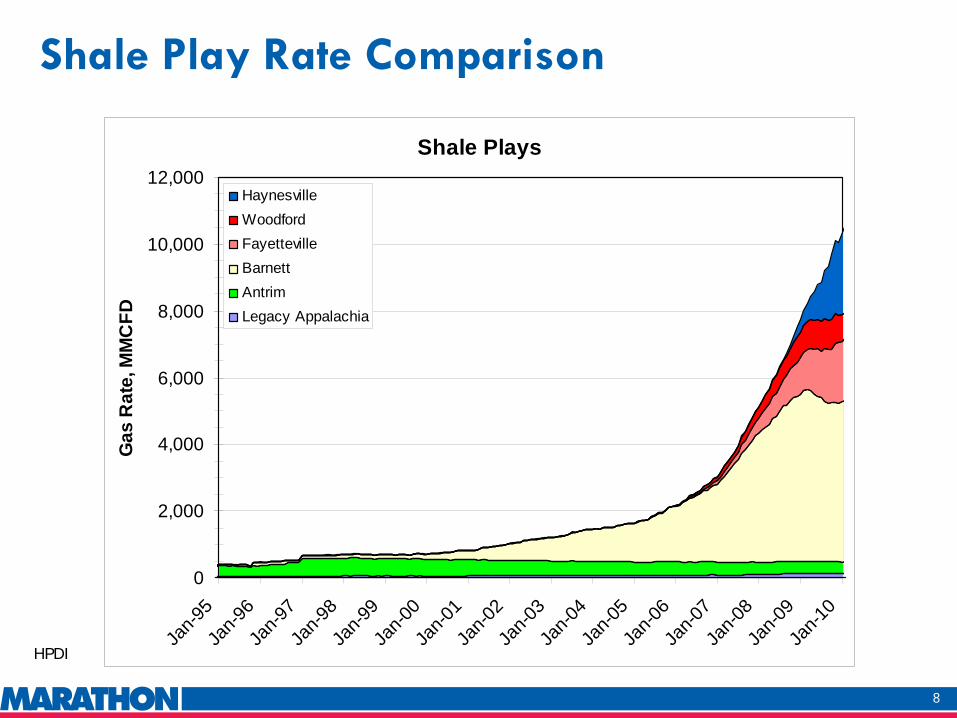
Shale Plays
0
2,000
4,000
6,000
8,000
10,000
12,000
Jan-9
5Ja
n-96
Jan-9
7Ja
n-98
Jan-9
9Ja
n-00
Jan-0
1Ja
n-02
Jan-0
3Ja
n-04
Jan-0
5Ja
n-06
Jan-0
7Ja
n-08
Jan-0
9Ja
n-10
Gas
Rat
e, M
MC
FD
HaynesvilleWoodfordFayettevilleBarnettAntrimLegacy Appalachia
Shale Play Rate Comparison
HPDI
9
Location
2009 Avg Daily Rate,
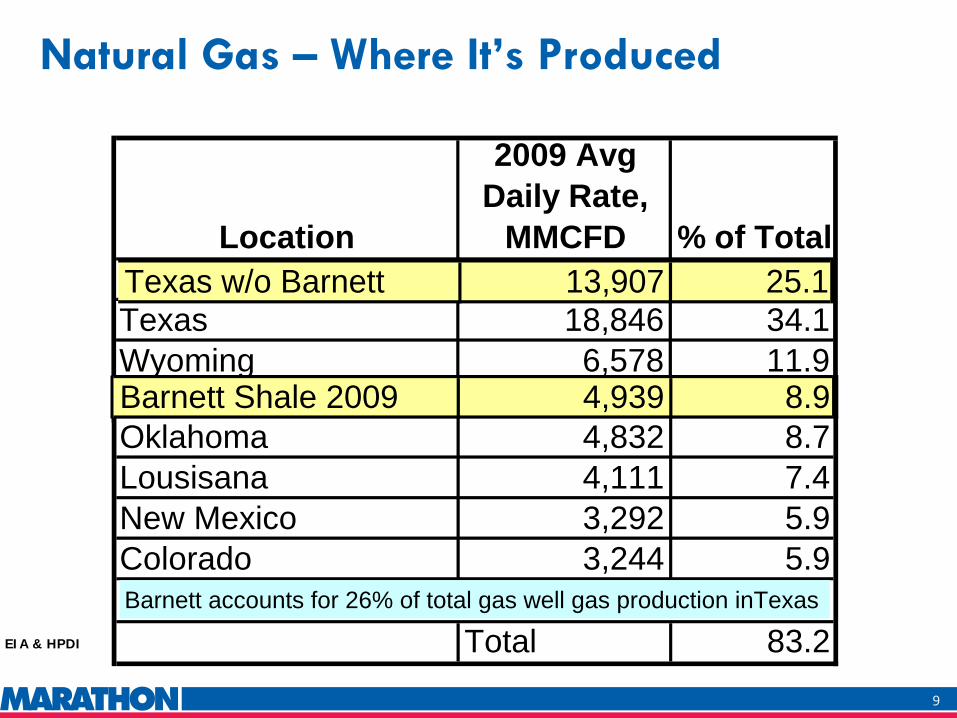
MMCFD % of TotalTotal USA Gas Wells 55,342Texas 18,846 34.1Wyoming 6,578 11.9Gulf of Mexico 5,144 9.3
Natural Gas –
Where It’s Produced
Oklahoma 4,832 8.7Lousisana 4,111 7.4New Mexico 3,292 5.9Colorado 3,244 5.9
Total 83.2EIA & HPDI
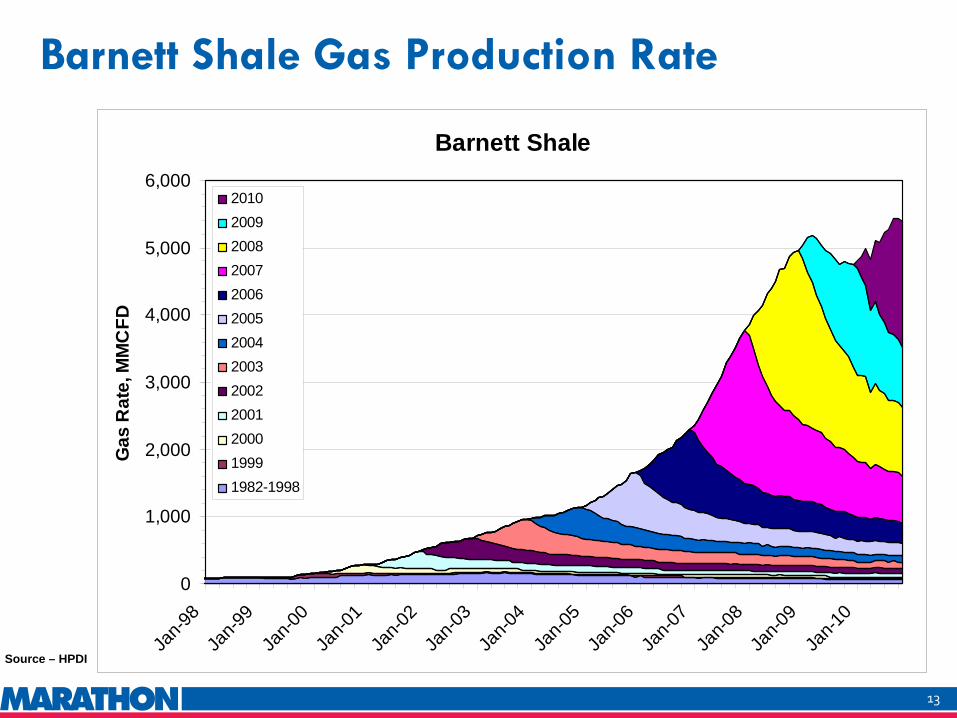
Barnett accounts for 26% of total gas well gas production inTexas
Barnett Shale 2009 4,939 8.9
Texas w/o Barnett 13,907 25.1
10
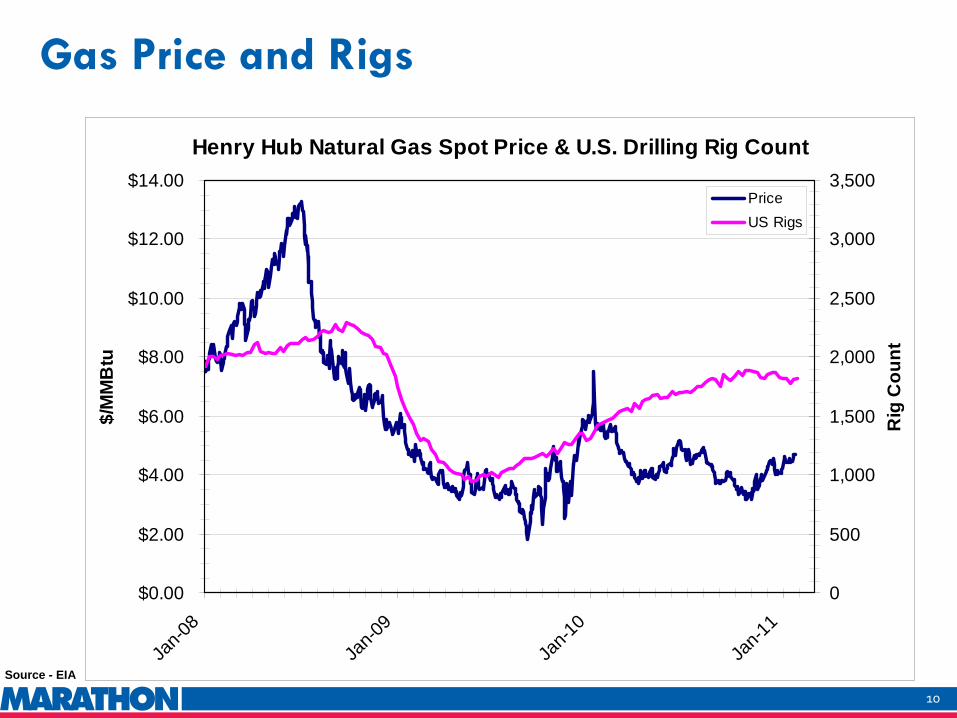
Henry Hub Natural Gas Spot Price & U.S. Drilling Rig Count
$0.00
$2.00
$4.00
$6.00
$8.00
$10.00
$12.00
$14.00
Jan-0
8
Jan-0
9
Jan-1
0
Jan-1
1
$/M
MB
tu
0
500
1,000
1,500
2,000
2,500
3,000
3,500
Rig
Cou
nt
PriceUS Rigs
Gas Price and Rigs
Source - EIA
11
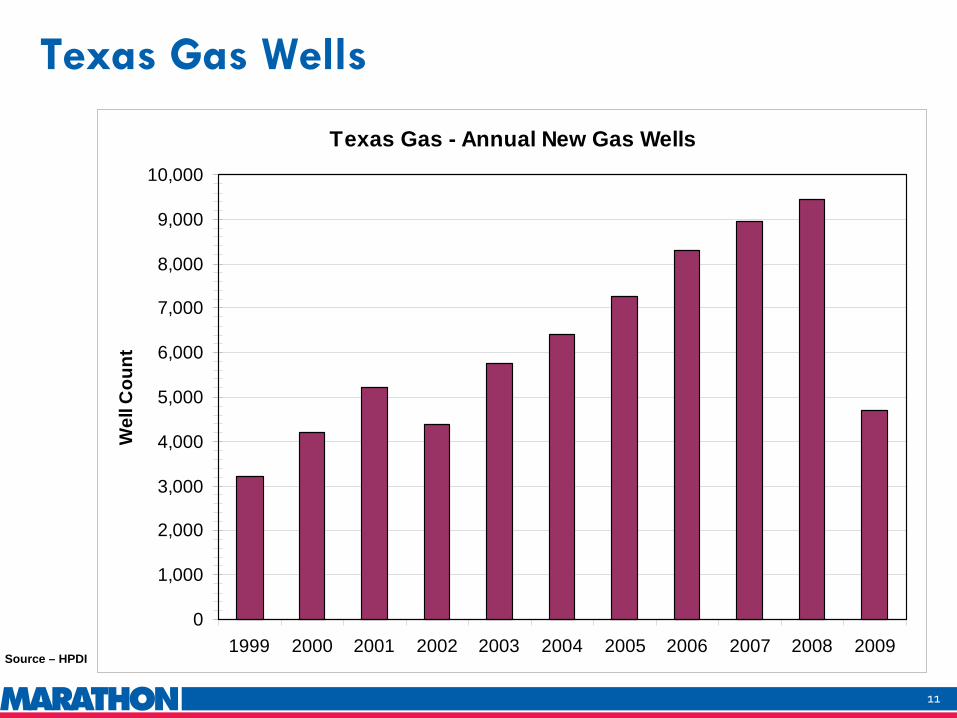
Texas Gas - Annual New Gas Wells
0
1,000
2,000
3,000
4,000
5,000
6,000
7,000
8,000
9,000
10,000
1999 2000 2001 2002 2003 2004 2005 2006 2007 2008 2009
Wel
l Cou
nt
Texas Gas Wells
Source – HPDI
12
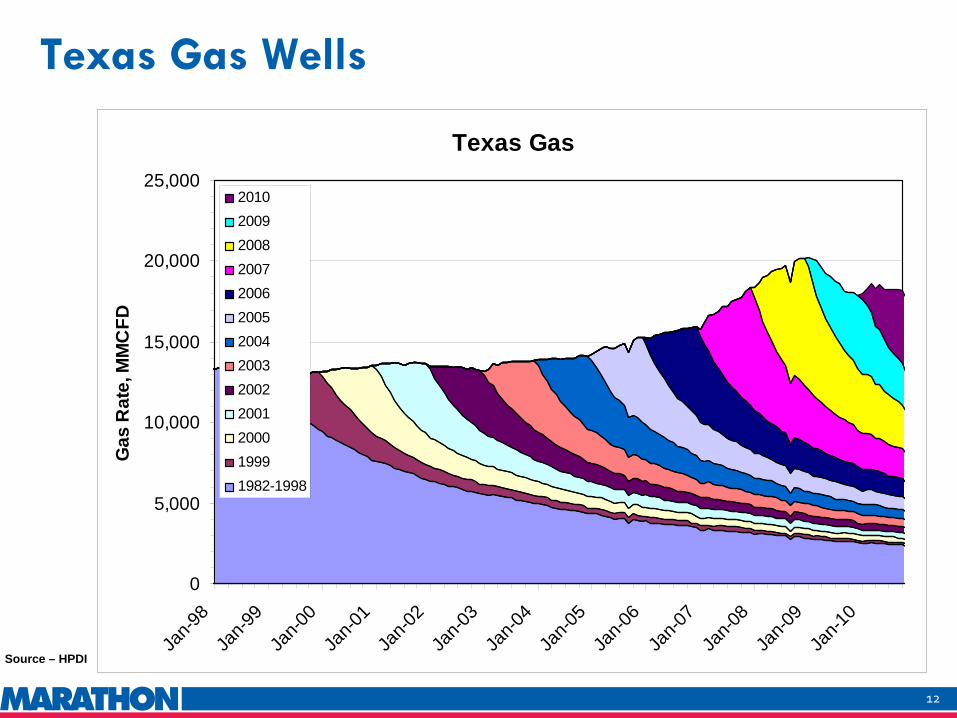
Texas Gas
0
5,000
10,000
15,000
20,000
25,000
Jan-9
8Ja
n-99
Jan-0
0Ja
n-01
Jan-0
2Ja
n-03
Jan-0
4Ja
n-05
Jan-0
6Ja
n-07
Jan-0
8Ja
n-09
Jan-1
0G
as R
ate,
MM
CFD
2010200920082007200620052004200320022001200019991982-1998
Texas Gas Wells
Source – HPDI
13
Barnett Shale
0
1,000
2,000
3,000
4,000
5,000
6,000
Jan-9
8Ja
n-99
Jan-0
0Ja
n-01
Jan-0
2Ja
n-03
Jan-0
4Ja
n-05
Jan-0
6Ja
n-07
Jan-0
8Ja
n-09
Jan-1
0G
as R
ate,
MM
CFD
2010200920082007200620052004200320022001200019991982-1998
Barnett Shale Gas Production Rate
Source – HPDI
14
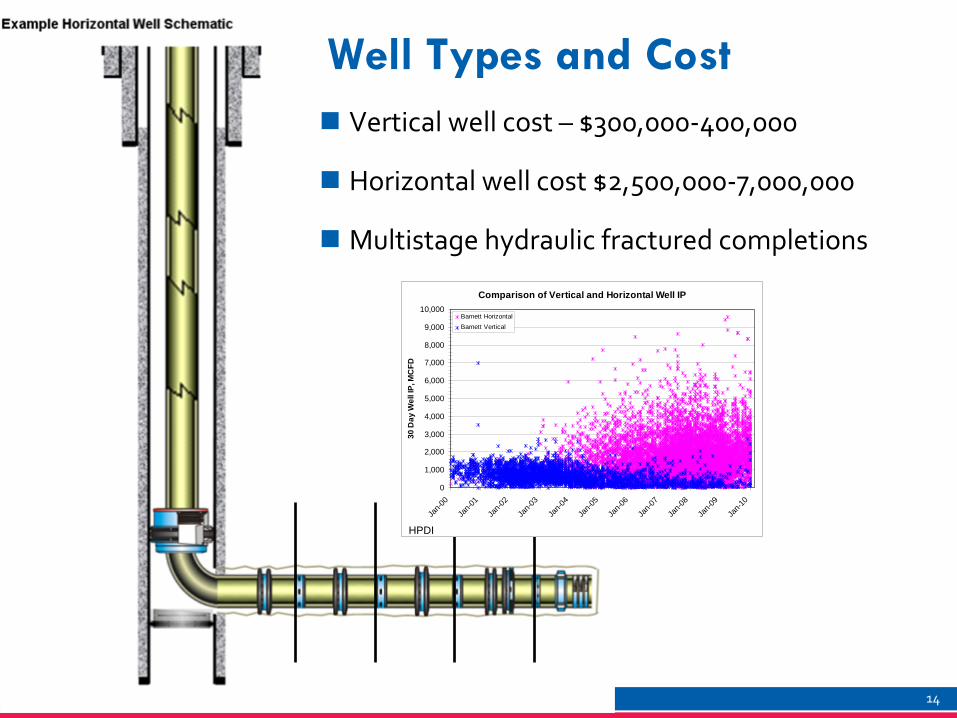
Well Types and Cost
Vertical well cost –
$300,000-400,000
Horizontal well cost $2,500,000-7,000,000
Multistage hydraulic fractured completions
Comparison of Vertical and Horizontal Well IP
0
1,000
2,000
3,000
4,000
5,000
6,000
7,000
8,000
9,000
10,000
Jan-0
0
Jan-0
1
Jan-0
2
Jan-0
3
Jan-0
4
Jan-0
5
Jan-0
6
Jan-0
7
Jan-0
8
Jan-0
9
Jan-1
0
30 D
ay W
ell I
P, M
CFD
Barnett HorizontalBarnett Vertical
HPDI
15
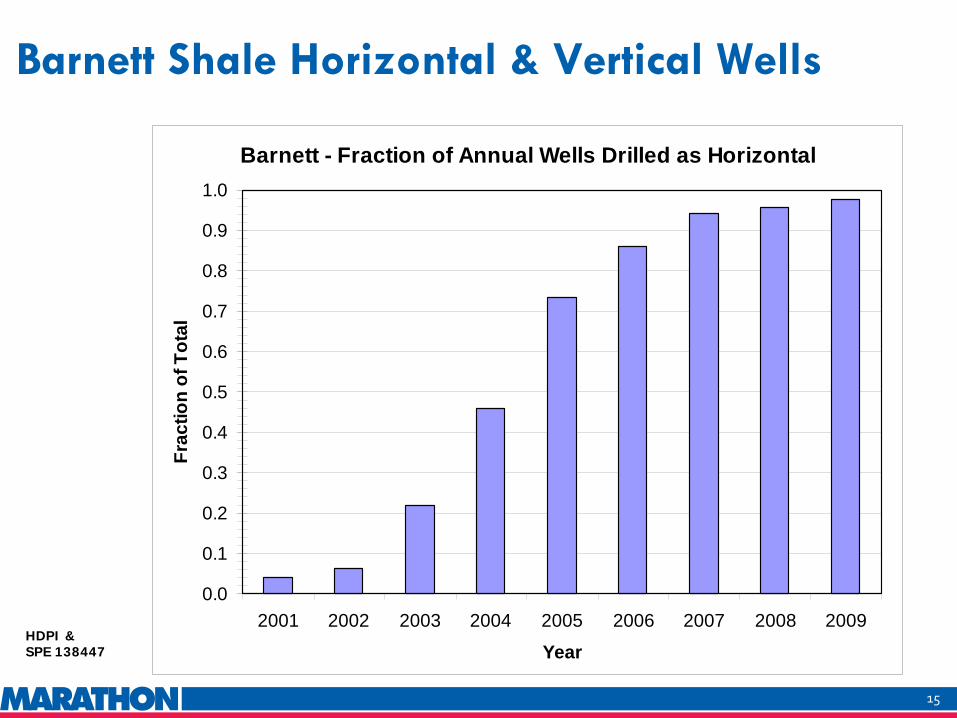
Barnett - Fraction of Annual Wells Drilled as Horizontal
0.0
0.1
0.2
0.3
0.4
0.5
0.6
0.7
0.8
0.9
1.0
2001 2002 2003 2004 2005 2006 2007 2008 2009
Year
Frac
tion
of T
otal
Barnett Shale Horizontal & Vertical Wells
HDPI & SPE 138447
16
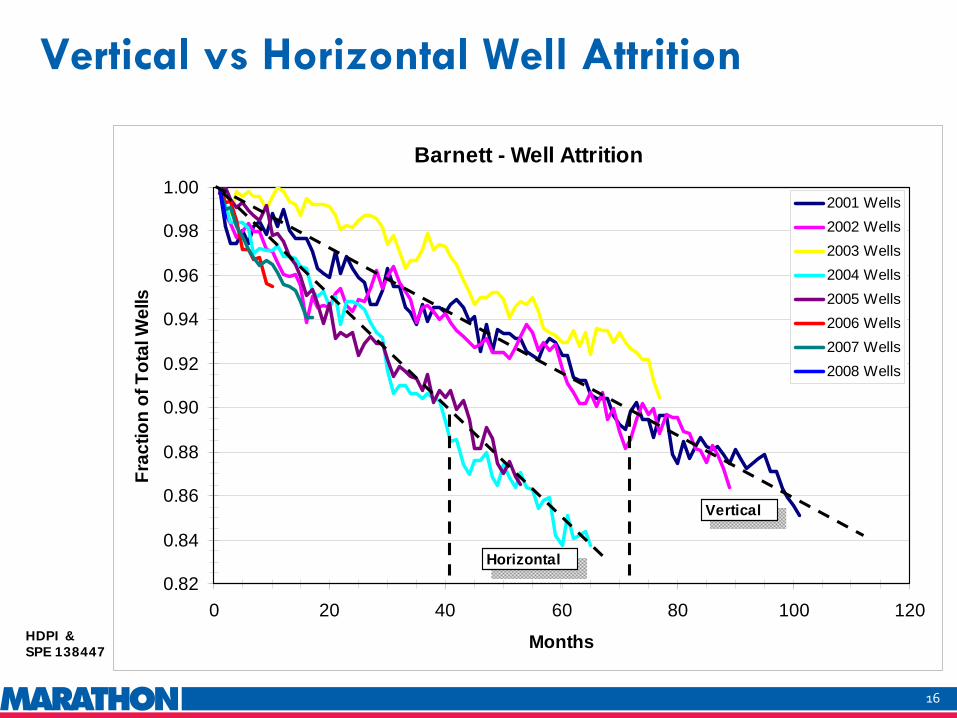
Barnett - Well Attrition
0.82
0.84
0.86
0.88
0.90
0.92
0.94
0.96
0.98
1.00
0 20 40 60 80 100 120
Months
Frac
tion
of T
otal
Wel
ls
2001 Wells2002 Wells2003 Wells2004 Wells2005 Wells2006 Wells2007 Wells2008 Wells
Vertical
Horizontal
Vertical vs Horizontal Well Attrition
HDPI & SPE 138447
17
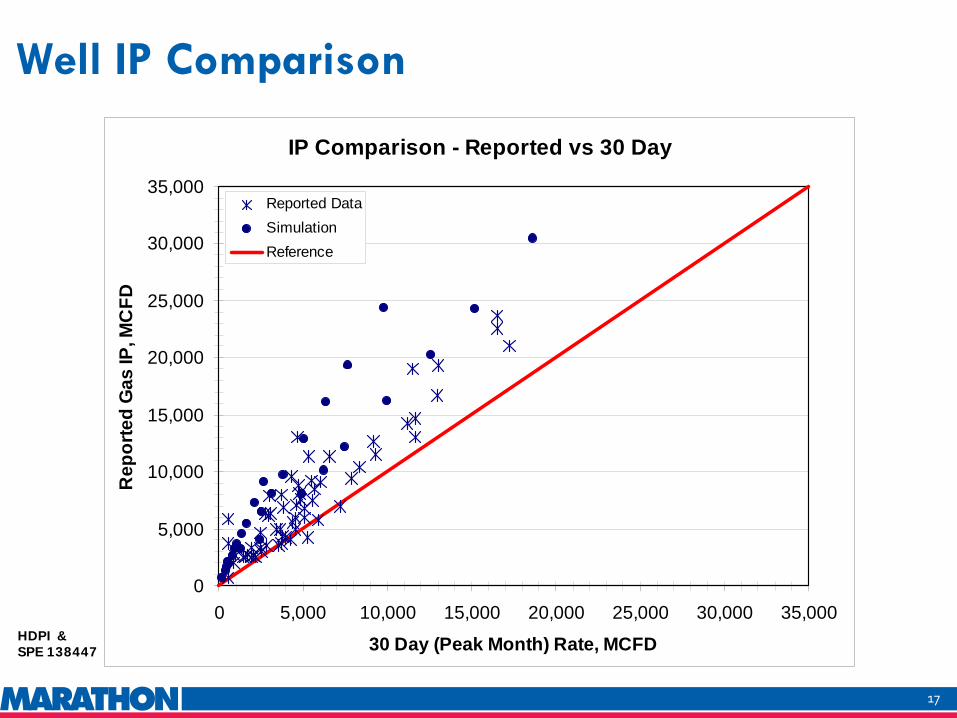
IP Comparison - Reported vs 30 Day
0
5,000
10,000
15,000
20,000
25,000
30,000
35,000
0 5,000 10,000 15,000 20,000 25,000 30,000 35,000
30 Day (Peak Month) Rate, MCFD
Rep
orte
d G
as IP
, MC
FD
Reported DataSimulationReference
Well IP Comparison
HDPI & SPE 138447
18
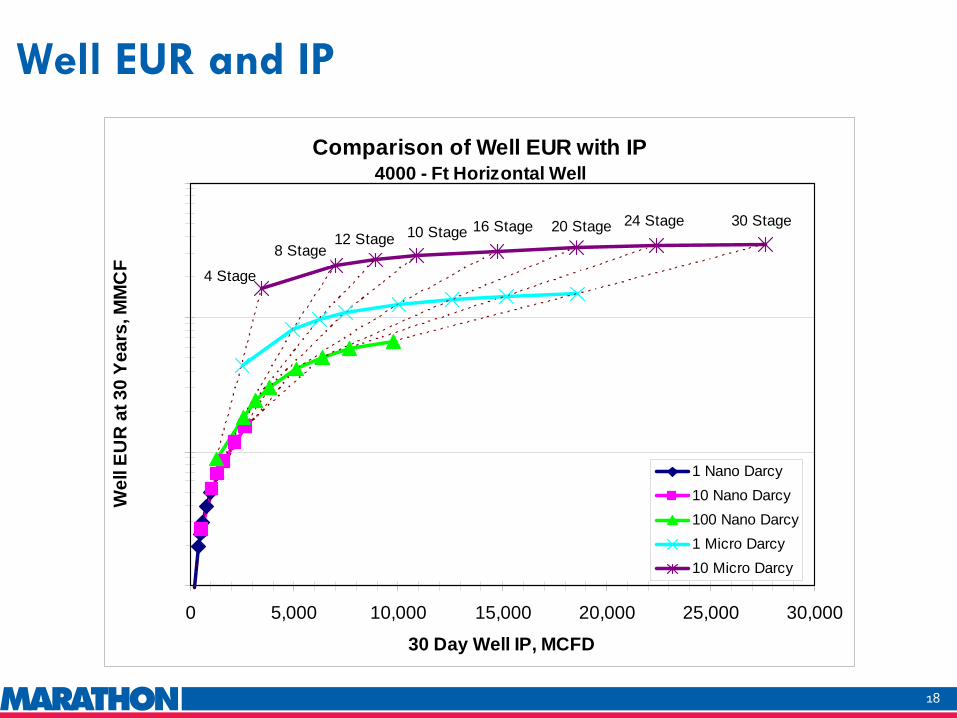
Comparison of Well EUR with IP4000 - Ft Horizontal Well
100
1,000
10,000
100,000
0 5,000 10,000 15,000 20,000 25,000 30,000
30 Day Well IP, MCFD
Wel
l EU
R a
t 30
Year
s, M
MC
F
1 Nano Darcy10 Nano Darcy100 Nano Darcy1 Micro Darcy10 Micro Darcy
4 Stage
8 Stage10 Stage12 Stage
16 Stage 20 Stage 24 Stage 30 Stage
Well EUR and IP

19
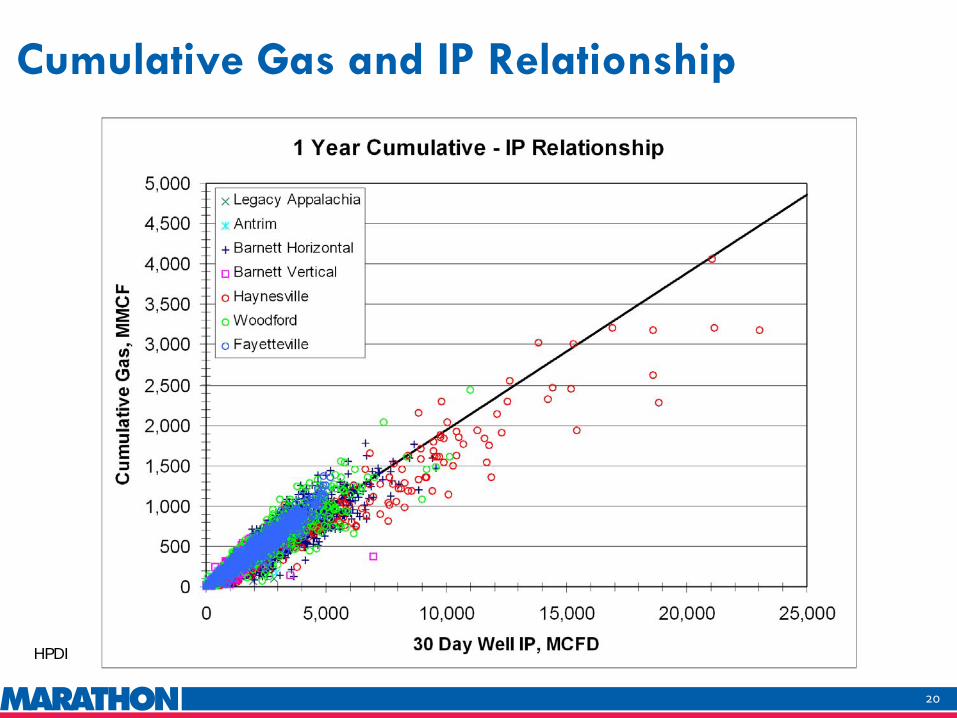
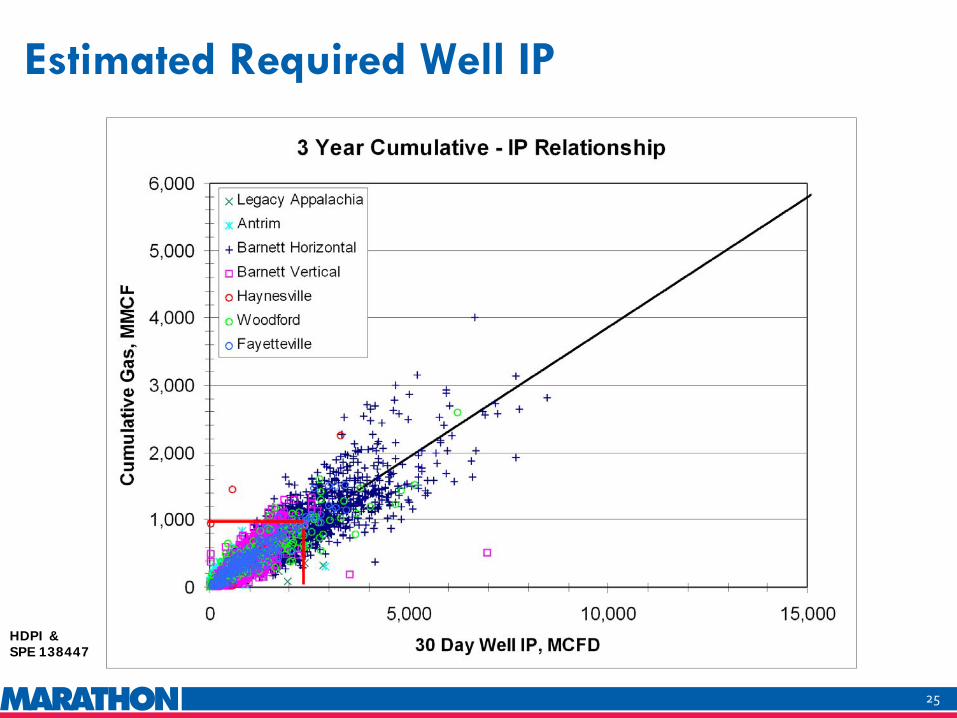
Cumulative Gas and IP Relationship
HPDI
20
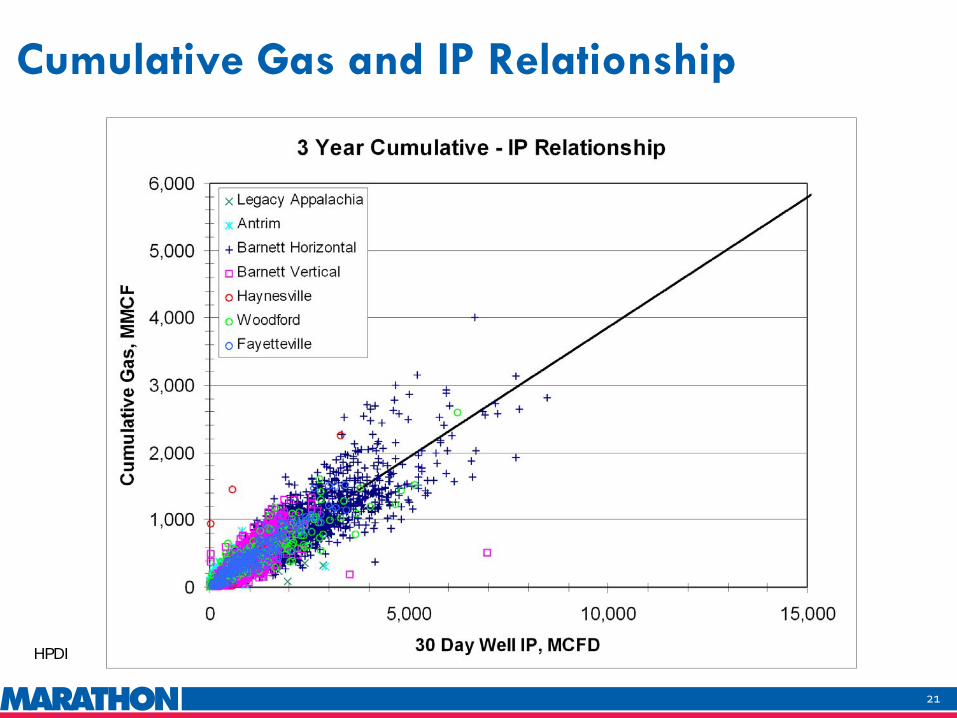
Cumulative Gas and IP Relationship
HPDI
21
Cumulative Gas and IP Relationship
HPDI
22
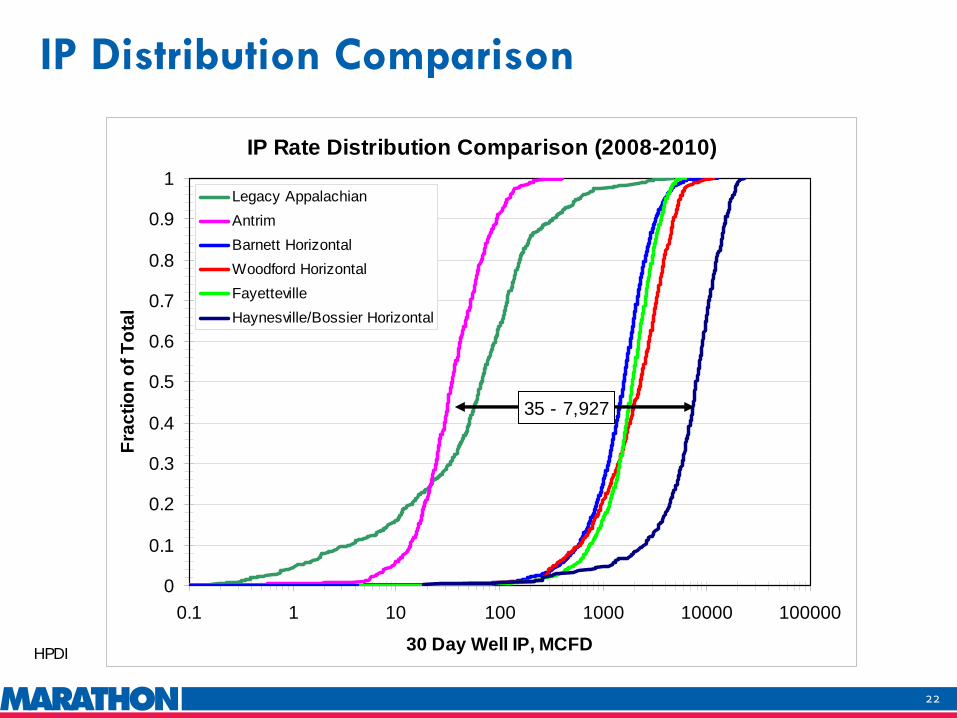
IP Distribution Comparison
IP Rate Distribution Comparison (2008-2010)
0
0.1
0.2
0.3
0.4
0.5
0.6
0.7
0.8
0.9
1
0.1 1 10 100 1000 10000 100000
30 Day Well IP, MCFD
Frac
tion
of T
otal
Legacy AppalachianAntrimBarnett HorizontalWoodford HorizontalFayettevilleHaynesville/Bossier Horizontal
35 - 7,927
HPDI
23
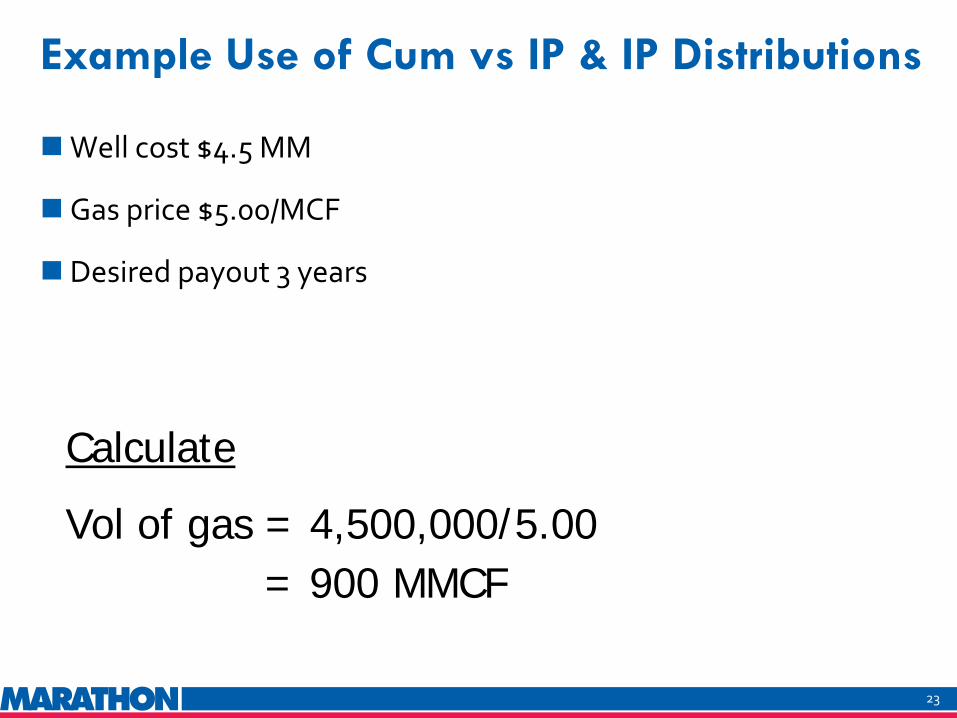
Example Use of Cum vs IP & IP Distributions
Well cost $4.5 MM
Gas price $5.00/MCF
Desired payout 3 years
Calculate
Vol of gas = 4,500,000/5.00= 900 MMCF
24
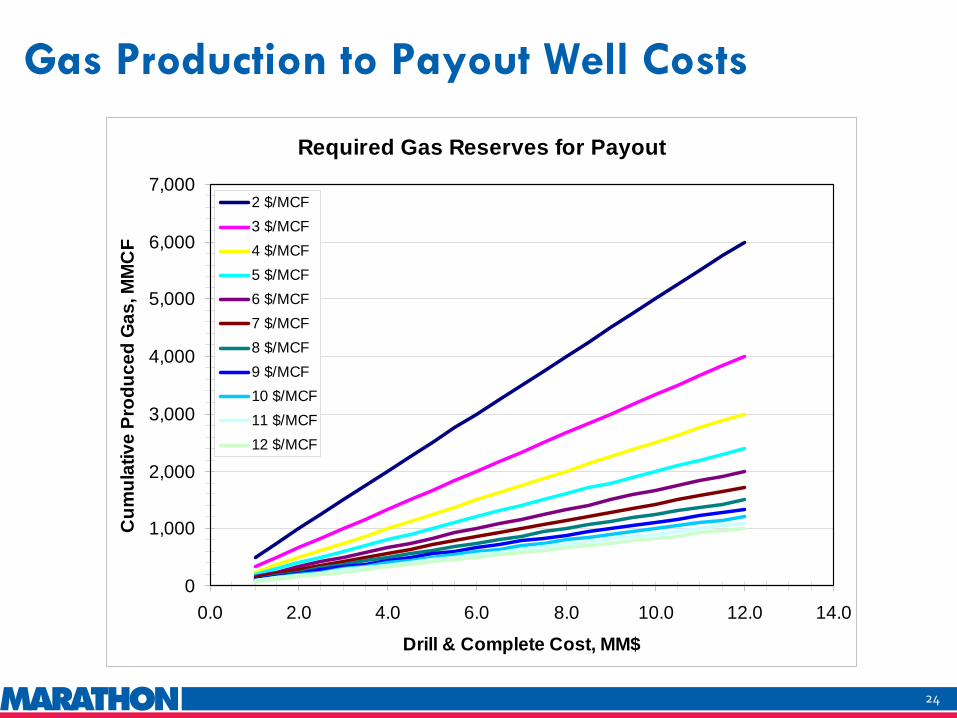
Gas Production to Payout Well Costs
Required Gas Reserves for Payout
0
1,000
2,000
3,000
4,000
5,000
6,000
7,000
0.0 2.0 4.0 6.0 8.0 10.0 12.0 14.0
Drill & Complete Cost, MM$
Cum
ulat
ive
Prod
uced
Gas
, MM
CF
2 $/MCF3 $/MCF4 $/MCF5 $/MCF6 $/MCF7 $/MCF8 $/MCF9 $/MCF10 $/MCF11 $/MCF12 $/MCF
25
Well IP for 3 Year Payout(Barnett Average)
0
2,000
4,000
6,000
8,000
10,000
12,000
14,000
16,000
18,000
0.0 2.0 4.0 6.0 8.0 10.0 12.0 14.0
Drill & Complete Cost, MM$
30 D
ay W
ell I
P, M
CFD
2 $/MCF3 $/MCF4 $/MCF5 $/MCF6 $/MCF7 $/MCF8 $/MCF9 $/MCF10 $/MCF11 $/MCF12 $/MCF
Estimated Required Well IP
HDPI & SPE 138447
26
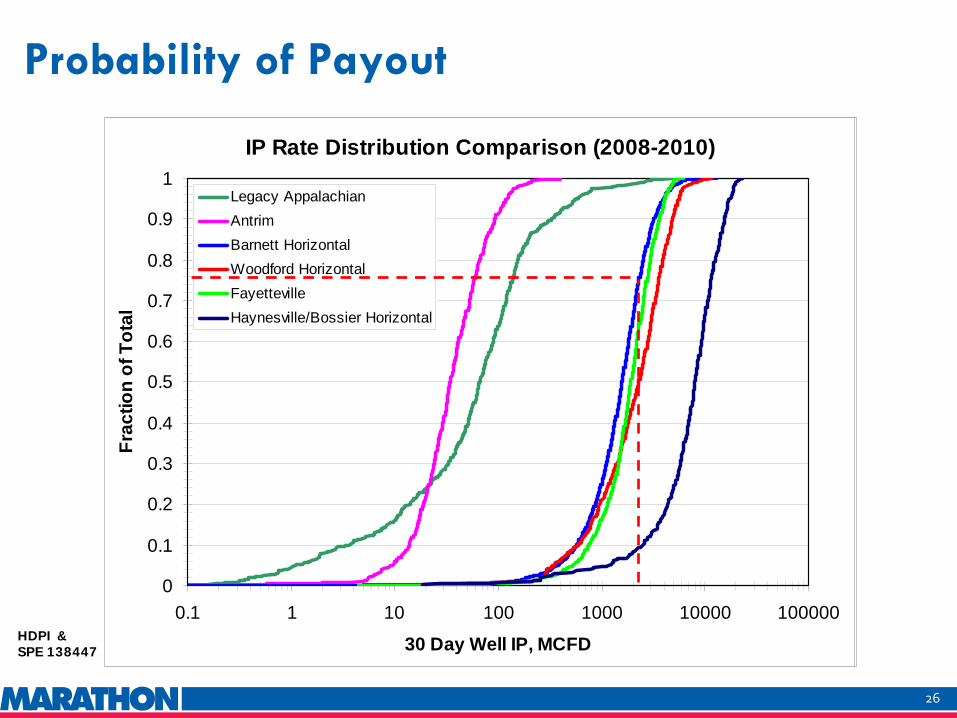
Probability of Payout
Probability of 3 Year Payout
0.0
0.1
0.2
0.3
0.4
0.5
0.6
0.7
0.8
0.9
1.0
0 2 4 6 8 10 12
Drill & Complete Cost, MM$
Cha
nce
of S
ucce
ss
2 $/MCF3 $/MCF4 $/MCF5 $/MCF6 $/MCF7 $/MCF8 $/MCF9 $/MCF10 $/MCF11 $/MCF12 $/MCF
IP Rate Distribution Comparison (2008-2010)
0
0.1
0.2
0.3
0.4
0.5
0.6
0.7
0.8
0.9
1
0.1 1 10 100 1000 10000 100000
30 Day Well IP, MCFD
Frac
tion
of T
otal
Legacy AppalachianAntrimBarnett HorizontalWoodford HorizontalFayettevilleHaynesville/Bossier Horizontal
HDPI & SPE 138447
27
Summary
Shales provide a significant amount of the natural gas produced in the U.S.
Approximately 20% of U.S. gas well gas production
Premier plays currently Barnett, Fayetteville, Haynesville/Bossier & Woodford
Use care when looking at well IP’s
Use 30 day IP rates
Cumulative gas vs IP relationships
Viable means to rank wells using early time data
IP can be manipulated by completion techniques
Not recommended for estimates of EUR
Application to short time periods
Putting it all together
Cumulative gas vs IP relationships
IP rate distribution
Simple economic evaluation (probability of payout)

28
Questions