engineering and technology for the · pdf fileengineering and technology for the development...
TRANSCRIPT
ENGINEERING AND TECHNOLOGY FOR THE
DEVELOPMENT OF PORTUGAL:
Technology Foresight, 2000 – 2020
- SYNTHESIS -
L. Valadares Tavares
CESUR – Centre of Urban and Regional Systems – Dept. of Civil Engineering and
Architecture – Instituto Superior Técnico (IST), LISBON - PORTUGAL
http:\\www.civil.ist.utl.pt/~et2000
Abstract
The Project Engineering and Technology 2000 (ET 2000) was launched by three institutions, the Academy of
Engineering (AE), the Society of Engineers (OE) and the Portuguese Industrial Association (AIP) on late
1999 and was completed on the end of 2000.
A foresight project is always a process of analysis, conception and development searching for a more clear
perspective about problems, tensions or woes, and oriented to design and to propose better approaches and
strategies. ET 2000 was no exception. Still, as a Technology Foresight Project, specific questions were raised
before being launched:
A – Does Portugal, as a small economy, need a Technology Foresight Project?
B – Should it be a Top-Down project or a Bottom-Up process?
C – Which goals?
D – Which approach?
The developed project was based on clear answers to these questions:
A – Yes, but not to “rediscover”, once again, the most promising key technologies. That has been already
studied, several times, from US to France, and the frontiers of knowledge are universal. The answer to this
question is yes, but to produce an updated diagnosis of the use of our Engineering and Technology (E&T) know-
how, for a more sustainable and competitive economy, during coming decades, and to develop a strategic vision
about our future.
B – A major challenge is the integration of experiences, opinions and know-how distributed through many
professionals and institutions and therefore the basic “infra-structure” of this project should be a network based
on an initial group and developed by diversified bottom-up processes.
C – Major goals are the identification of strong and weak points of our E&T system, to build up scenarios for the
next 10-20 years and to propose strategies to improve its contribution to the sustainability and competitiveness of
portuguese society.
D – Therefore, the adopted approach was demand-driven, starting from needs and trends of the studied economic
sectors and looking for the major potential contribution of knowledge to achieve a better performance.
The main results were published in a book presented and discussed by 400 participants, last November, during a
Conference carried out at INETI (27-28 November 2000), and major contributions are included in this synthetic
description. They cover:
a) the adopted process and methodology including some new instruments like the model of impact matrices
applied to the 17 economic sectors;
b) a diagnostic perspective about how Portugal can meet the challenges of a knowledge-based society
emphasizing six major “horizontal” issues:
c) major scenarios and strategic proposals.
Finally, specific initiatives are discussed and presented herein.
L. Valadares Tavares
NOTE
This book presents major analyses and proposals developed by the FORESIGHT PROJECT
“ENGINEERING AND TECHNOLOGY 2000 (ET 2000)” promoted by Academia de Engenharia
(Academy of Engineering), Ordem dos Engenheiros (Society of Engineers) and Associação Industrial
Portuguesa (Portuguese Industrial Association) during 1999 and 2000. The final report of this project was
published as a book, Tavares, L. V., “A Engenharia e a Tecnologia ao Serviço do Desenvolvimento em Portugal:
Prospectiva e Estratégia 2000 – 2020”, VERBO, Lisbon, 2000 (in portuguese).
This synthetic presentation is based on that book and on the specialized reports written by several colleagues
from firms and universities:
Abel Mateus, António Antunes e Maria Filomena Medes
Paulo Ferrão, Ascenso Pires e Ângela Canas
Manuel Heitor e Pedro Conceição
Amado Silva e Francisco Mendes Palma
José Paulo Esperança
Maria da Conceição Santos
Gaspar Nero e Silvia Nereu
Fernando Branco e Adriana Garcia
Jaime Melo Baptista e Eduarda Beja Neves
Alberto Moreno e Francisco Mendes Palma
Xavier Malcata e F. Gomes Silva
Epifânio da Franca
Ruy Mesquita, Paulo Peças e Sales Gomes
Rui Felizardo, Alexandre Videira e Luís Palma Féria
Luís Almeida
Joaquim Leandro de Melo e Fortunato Frederico
Ramôa Ribeiro e Clemente Pedro Nunes
José Manuel Viegas
José Filipe Rafael e António M. Beja
Altamiro Machado e Eduardo Beira
João Bento, Rui Gonçalves Henriques, Cristina Gouveia e Beatriz Condessa
Manuel João Pereira
Ricardo Oliveira e Luís Maltez
Carlos Henggeler Antunes, Carla Oliveira, Luís Lapão.
The participation of several colleagues during the November Conference was also particularly important,
namely: António Alfaiate, Luís Mira Amaral, F. Nunes Correia, Sousa Gomes, Mário Lino, M. Athayde
Marques, P. Norton de Matos, Maximiano Martins, Carlos Campos Morais, Manuel Norton, Maria João
Rodrigues, João Salgueiro, J. Gomes Simão, Sérgio Trindade,
Special thanks are due to the cooperation of Manuel Heitor, João Bártolo, C. Henggeler Antunes and Luís Lapão.
Our foreign colleagues were a source of useful inspiration but special thanks are due to Prof. James Kahan from
RAND Europe for his innovative and friendly suggestions.
The project ET 2000 was carried out by CESUR – Centre of Urban and Regional Systems of the Department
of Civil Engineering and Architecthure (DEC) of IST (Instituto Superior Técnico) under a contract with the
Portuguese Industrial Association. Thanks are due to Patrícia Nunes for processing this document.
The author is responsible for any deficiency or limitation of this book.
L. Valadares Tavares

iii
INDEX
1 THE PROJECT: ET 2000 ............................................................................................................................ 2
1.1 OBJECTIVES ......................................................................................................................................... 2
1.2 METHODOLOGY .................................................................................................................................. 2
1.3 THE PROCESS ....................................................................................................................................... 6
2 PORTUGAL 2000: WHAT ECONOMIC, BUSINESS, TECHNOLOGICAL AND
ENVIRONMENTAL DIAGNOSIS? ................................................................................................................. 10
2.1 DEVELOPMENT AND KNOWLEDGE ............................................................................................. 10
2.2 DEVELOPMENT AND ENVIRONMENT.......................................................................................... 14
2.2.1 Environment and Industrial Ecology ............................................................................................ 14
2.2.2 Thematic Challenges ..................................................................................................................... 15
2.2.3 Growth with more pollution and consumption of materials .......................................................... 16
2.3 ECONOMIC DEVELOPMENT AND INNOVATION ....................................................................... 17
2.4 DEVELOPMENT, INTERNATIONALIZATION AND TECHNOLOGICAL MARKETING .......... 19
2.5 DEVELOPMENT AND HUMAN CAPITAL ...................................................................................... 20
2.5.1 Higher Education .......................................................................................................................... 21
2.5.2 Research and Development (RD) .................................................................................................. 22
2.6 PORTUGAL BENCHMARKING ........................................................................................................ 24
3 WHICH FUTURE SCENARIOS? ............................................................................................................ 31
3.1 EUROPE ............................................................................................................................................... 31
3.2 TECHNOLOGICAL FUTURE ............................................................................................................. 33
3.3 THE PORTUGUESE SOCIETY .......................................................................................................... 34
3.4 STUDIED SECTORS ........................................................................................................................... 35
3.4.1 Building Materials ........................................................................................................................ 35
3.4.2 Construction .................................................................................................................................. 36
3.4.3 Environment .................................................................................................................................. 36
3.4.4 Energy ........................................................................................................................................... 36
3.4.5 Food and Beverages ...................................................................................................................... 37
3.4.6 Electronics .................................................................................................................................... 37
3.4.7 Metal and Plastic Production........................................................................................................ 38
3.4.8 Automobile Industry ...................................................................................................................... 38
3.4.9 Textiles and Clothes ...................................................................................................................... 39
3.4.10 Shoes ............................................................................................................................................. 39
3.4.11 Chemical Industry ......................................................................................................................... 40
3.4.12 Transportation............................................................................................................................... 41
3.4.13 Telecommunications ...................................................................................................................... 41
3.4.14 Information Technologies ............................................................................................................. 42
3.4.15 Geographical Information Systems (GIS) ..................................................................................... 43
3.4.16 Financial Services ......................................................................................................................... 43
3.4.17 Engineering Services ..................................................................................................................... 44
4 STRATEGIES AND POLICIES................................................................................................................ 46
4.1 ENVIRONMENT AND INNOVATION .............................................................................................. 46
4.2 COMPETITIVENESS AND KNOWLEDGE ...................................................................................... 46
4.3 KNOWLEDGE AND COMPETITIVENESS FOR THE 17 STUDIED SECTORS ............................ 49
4.4 A STRATEGIC VISION FOR ENGINEERING AND TECHNOLOGY IN PORTUGAL ................. 52
4.4.1 Conditions ..................................................................................................................................... 52
4.4.2 Guidelines ..................................................................................................................................... 53
4.5 PROPOSALS ........................................................................................................................................ 55
4.6 FINAL WORDS.................................................................................................................................... 60
5 REFERENCES ............................................................................................................................................ 61
ANNEX: The network of the Human Capital

iv
“A NEW STRATEGIC GOAL FOR THE NEXT DECADE: TO BECOME THE MOST COMPETITIVE
AND DYNAMIC KNOWLEDGE – BASED ECONOMY IN THE WORLD”
Lisbon Council of the European Union
23-24 March 2000
“IN MY VILLAGE, WE WERE POOR, EVEN THE RICH PEOPLE, BECAUSE WE HAD NO SENSE
OF FUTURE”
Salvador Caetano, CEO of the automobile sector
Portugal, June 2000
“THE MISSION OF FORESIGHT IS NOT PLANNING THE FUTURE BUT RATHER PLANNING
FOR THE FUTURE AS IT IS BECOMING MORE UNCERTAIN AND UNPREDICTABLE”
L. Valadares Tavares
November 2000
v
INSTITUTIONAL PERSPECTIVES:
“… we have to boost technology and innovation with the purpose of increasing competitiveness and productivity
of portuguese firms.
I have accepted to be the Chairman of the Honour Committee of ET 2000 to underline the merits of its
objectives and methodology.
We have to share experiences, woes and expectations in order that easy turnkey solutions will be rejected and a
new more promising future will be invented”
Jorge Sampaio, Presidente da República
“… We hope that the results of ET 2000 will contribute to the mission of Academia de Engenharia: “PRO
HOMINIS DIGNITATE INGENIUM”
Armando Lencastre, Presidente da Academia de Engenharia
“… Engineering and technological qualifications are essential to cope with economic growth and increasing
societal complexity. Therefore, Engineering and Technology are key factors for a development model towards
the Knowledge Society”
Francisco Sousa Soares, Bastonário da Ordem dos Engenheiros
“… The main reason to launch this project stems from the awareness about the nature of the key challenges for
the future of Portugal: strategic development and use of Engineering and Technology know-how to improve
sustainability and competitiveness of our firms”
João Bártolo, Presidente do Conselho Orientador

1
1. THE PROJECT: ET 2000
“The void o’th’ world must with an arch be spanned
The ways of Nature must be read aright
That there may be a wise and friendly hand
To make this dark world better and more bright
Oh, with what joy and love I understand
These master-souls that ache for truth and light”
Fernando Pessoa*, 1907
* Fernando Pessoa is a portuguese poet born in South Africa and considered as one of the most important
european poets of the 20th
century. He has a complex heteronymic structure and a vast collection of poems,
written in portuguese, french and english with deep insights about the identity and the future of Portugal and of
Europe.
2
1 THE PROJECT: ET 2000
1.1 OBJECTIVES
The challenges of economic development are requiring a new conception of corporation, opening wider
perspectives on strategy, market relationship, reengineering, benchmarking and human capital.
However, during the last years, the crucial role of the engineer or of the technologist in many portuguese firms
is being faded gradually and is been replaced by more attractive and popular profiles based on Management,
Business, Commerce.
An well known portuguese CEO when asked about technology gave a clear answer: if required, we will buy it!
Therefore, a central and open question to be examined is: what is the role of Engineering and Technology (E&T)
to increase the competitiveness of our firms and to improve the pace of development for Portugal.
This is the research question of ET 2000 aiming to propose specific actions to boost the contribution of
Engineering and Technology for the development of our country.
The specific goals of ET 2000 are:
A – Discussion of major scenarios for portuguese firms
B – Competitiveness analysis
C – Diagnosis of human capital
D – Study of knowledge and innovation networks
E – Enhancing the contribution of E&T role for major value chains
F – Design of E&T profiles and evaluation of strategic options
G –Strategic analysis about the role of Research and Development (RD), Education and Training
H – Promotion of debates.
1.2 METHODOLOGY
ET 2000 concerns Engineering Technology and Competitiveness and hence basic definitions have been
proposed:
Engineering: Conception, design and implementation of systems or the production of goods or services devoted
to the fulfilment of society’s needs, founded on scientific and technological knowledge and developed according
to paradigms of ethics, effectiveness and efficiency as well as environmental sustainability and equilibrium.
Technology: Capacity to develop artefacts through operational applications of scientific knowledge with the
same paradigms of Engineering.
Competitiveness: ability to promote sustainable and profitable sales in markets with strict requirements.
The adopted methodology has been based on several scientific contributions and on original interdisciplinary
models. Such contributions include proposals by (Godet, 1991), OECD (OECD, 1977) and Rand (Kahan and
Cave, 2000). They emphasize the open and process oriented nature of Foresight, the belief that we can construct
a better future and the commitment to support a strategic vision about the role of E&T. The proposed models
include:

3
I – A cross-disciplinary networking based on ISSUES and SECTORS:
ISSUES:
Macro-Societal Scenarios, Macro-Economic Scenarios, Business Dynamics, Environment, Innovation,
Technological Marketing, Internationalization
SECTORS:
Building Materials, Construction, Environment, Energy, Food Industry, Electronics, Metal and Plastic Products
and Manufacturing, Automobile Industry, Textiles and Fashion, Shoes Industry, Chemical Industry, Transports
and Distribution, Telecommunications, Information Technologies, Geographic Information Systems, Financial
Services, Engineering Services.
II – A specification of major Areas of Knowledge for ET 2000
After several debates, the following list was selected (each area is subdivided in 4 to 6 sub-areas):
Process Technologies (PR)
Biotechnology (BT)
Materials (MT)
Discrete Production (DP)
Energy (EN)
Opto – Electronics (OE)
Information and Communication
Systems Engineering (SE)
Infra-Structuring and Construction (ICT)
Environmental Technologies (ET)
Transportation Technologies (TT)
III – a taxonomy of knowledge
This classification has a key role in ET 2000 as it is not based on traditional schemes but rather on the strategic
functionality of each type of knowledge:
A – Planning and Evaluation
B – Procurement
C – Conception and Design
D – Production
E – Integration and Management
F – Maintenance
G – Rehabilitation
H – Use and Operation
I – Training
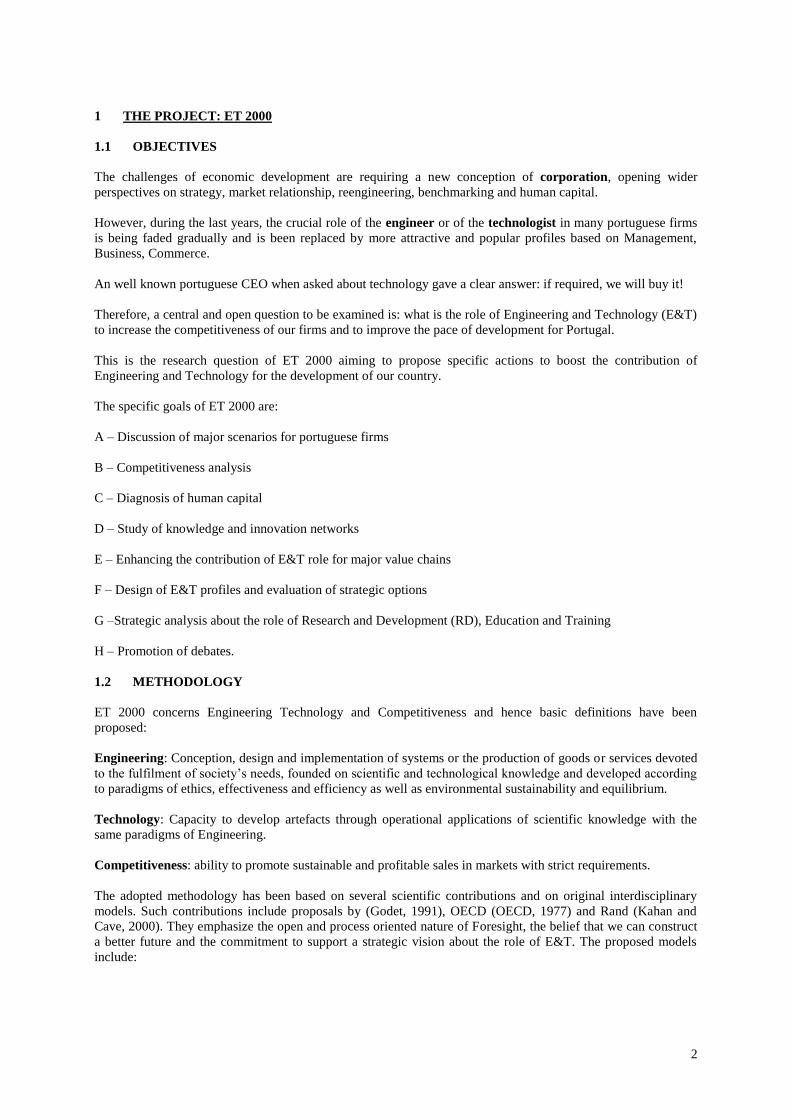
IV – A firm’s value chain for knowledge
The adopted model is presented in Fig. 1.1.
4
Value Chain for Knowledge
Fig. 1.1
Policies Strategic
Development
Tactical and Operational
Management
Driving and Leadership
Process Supply Products
Technological Infra-structure
RD Skills (Human Resources) Equipments
Materials
Equipment
Patents
And Rights
X
X X
Channels
Competitors
Markets
X
X X
5
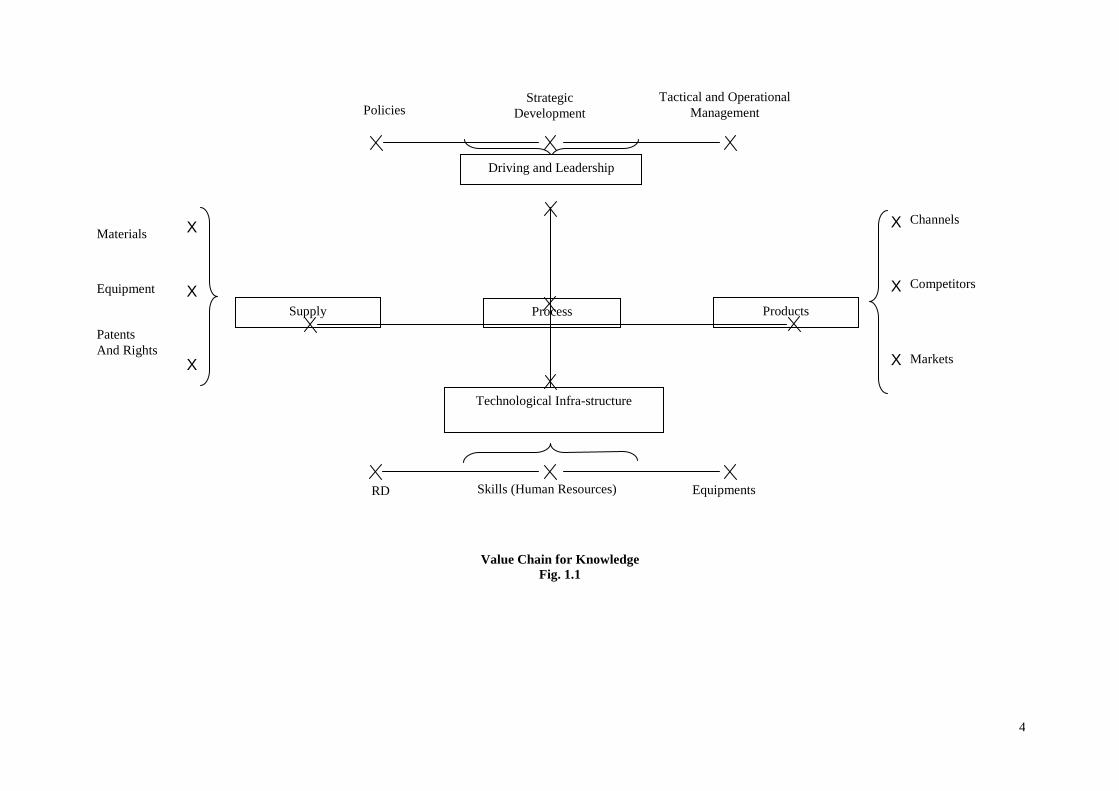
V – Impact Matrices
These matrices describe the impact of each area of knowledge (i = 1, …, M = 11) I on each type product (j=1,
…, Nk) of each economic sector of activity (k=1, …, K=17).
Thus, for each sector k, a survey was carried out to estimate the impact level of i on j:
)k(Xij
where )k(Xij is a measure of the relevance of area i for j in sector k
The following indicators can be computed in terms of Xij:
Average Relevance of Area i for Sector k
)k(J)k(X)k(Y)k(J
1jiji
where J(k) is the number of products for sector k.
Technological Intensity of Sector k
)k(I
)k(Y
)k(YS
)k(I
1ii
where I (k) is the number of areas with Yi (k)0.
Technological Dispersion of Sector k
11M
2kYN)k(DS i
Areas
i=1, …, M
0 – No impact
1 – Small impact
2 – High impact
3 – Very high impact
Products
j = 1, …, Nj
)k(Xij
for each k
6
Global Relevance of Area i
K
)k(Y
Z
K
1ki
i
Construction of Scenarios
The construction of Scenarios was based on the combination of different types of evolution for key
morphological features of Europe and of Portugal.
The following features were identified:
a) Europe:
Competitiveness Social Protection
Integration Fragmentation
b) Portugal:
Civil Society State
Transformation Stagnation
International Openness Closeness
Sustainability Unstability
1.3 THE PROCESS
The development of a Foresight Project is useful not just for its results but also for the developed process.
The ET 2000 process was based on a rich and diversified system of networks involving multiple actors with
different motivations:
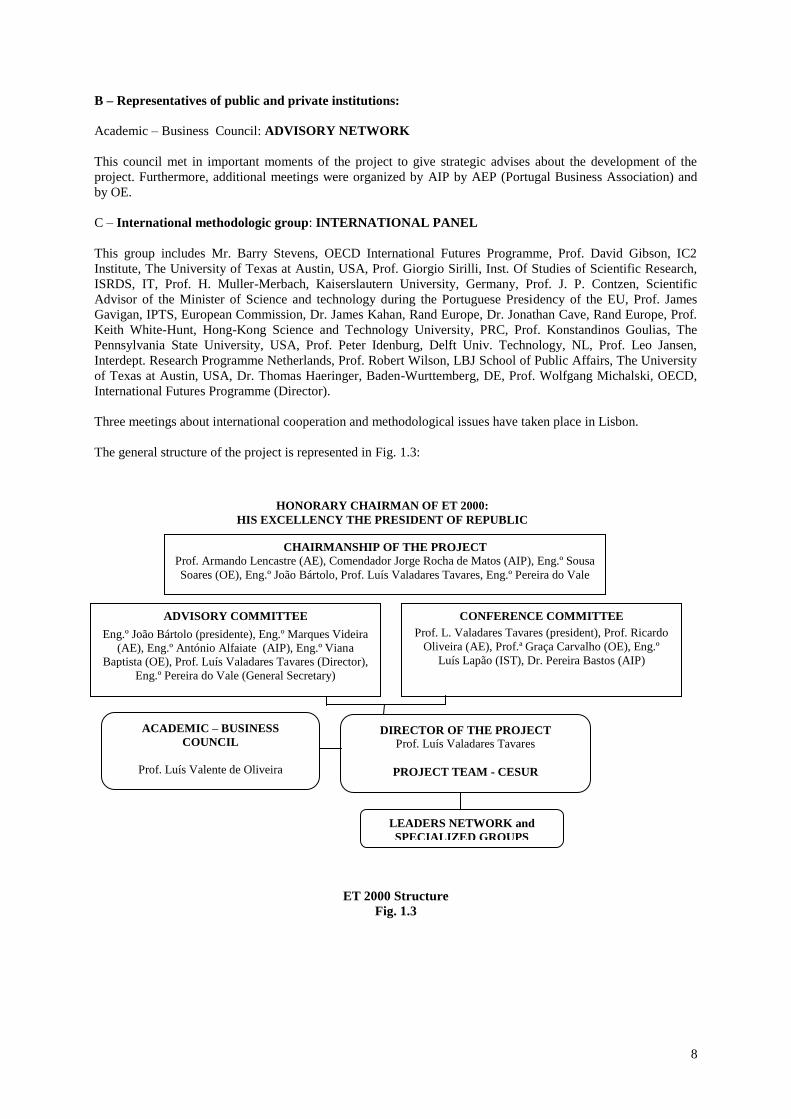
A – Coordinators and Co-coordinators of specialized groups: LEADERS – NETWORK
Each issue or analysed sector had a specialized group which was chaired by a coordinator (“pilot”) and co-
coordinator (“co-pilot”). The former was an academic and the latter coming from a related business.
This network brought to the project a vast and diversified ground of experiences and knowledge. In Fig. 1.2 the
main academic and business institutions are represented.
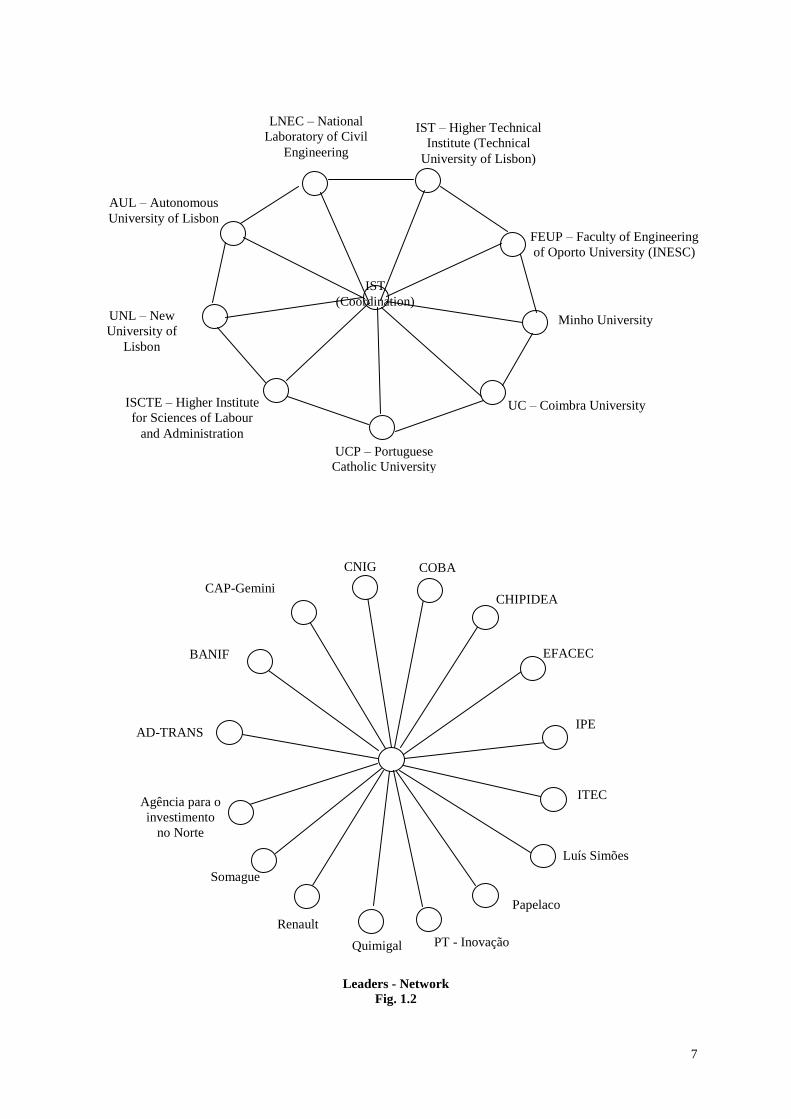
7
Leaders - Network
Fig. 1.2
AUL – Autonomous
University of Lisbon
IST – Higher Technical
Institute (Technical
University of Lisbon)
LNEC – National
Laboratory of Civil
Engineering
UNL – New
University of
Lisbon
ISCTE – Higher Institute
for Sciences of Labour
and Administration
Minho University
UC – Coimbra University
UCP – Portuguese
Catholic University
IST
(Coordination)
FEUP – Faculty of Engineering
of Oporto University (INESC)
CNIG COBA
CHIPIDEA
EFACEC
IPE
ITEC
Luís Simões
Papelaco
PT - Inovação Quimigal
Renault
Somague
Agência para o
investimento
no Norte
AD-TRANS
BANIF
CAP-Gemini
8
B – Representatives of public and private institutions:
Academic – Business Council: ADVISORY NETWORK
This council met in important moments of the project to give strategic advises about the development of the
project. Furthermore, additional meetings were organized by AIP by AEP (Portugal Business Association) and
by OE.
C – International methodologic group: INTERNATIONAL PANEL
This group includes Mr. Barry Stevens, OECD International Futures Programme, Prof. David Gibson, IC2
Institute, The University of Texas at Austin, USA, Prof. Giorgio Sirilli, Inst. Of Studies of Scientific Research,
ISRDS, IT, Prof. H. Muller-Merbach, Kaiserslautern University, Germany, Prof. J. P. Contzen, Scientific
Advisor of the Minister of Science and technology during the Portuguese Presidency of the EU, Prof. James
Gavigan, IPTS, European Commission, Dr. James Kahan, Rand Europe, Dr. Jonathan Cave, Rand Europe, Prof.
Keith White-Hunt, Hong-Kong Science and Technology University, PRC, Prof. Konstandinos Goulias, The
Pennsylvania State University, USA, Prof. Peter Idenburg, Delft Univ. Technology, NL, Prof. Leo Jansen,
Interdept. Research Programme Netherlands, Prof. Robert Wilson, LBJ School of Public Affairs, The University
of Texas at Austin, USA, Dr. Thomas Haeringer, Baden-Wurttemberg, DE, Prof. Wolfgang Michalski, OECD,
International Futures Programme (Director).
Three meetings about international cooperation and methodological issues have taken place in Lisbon.
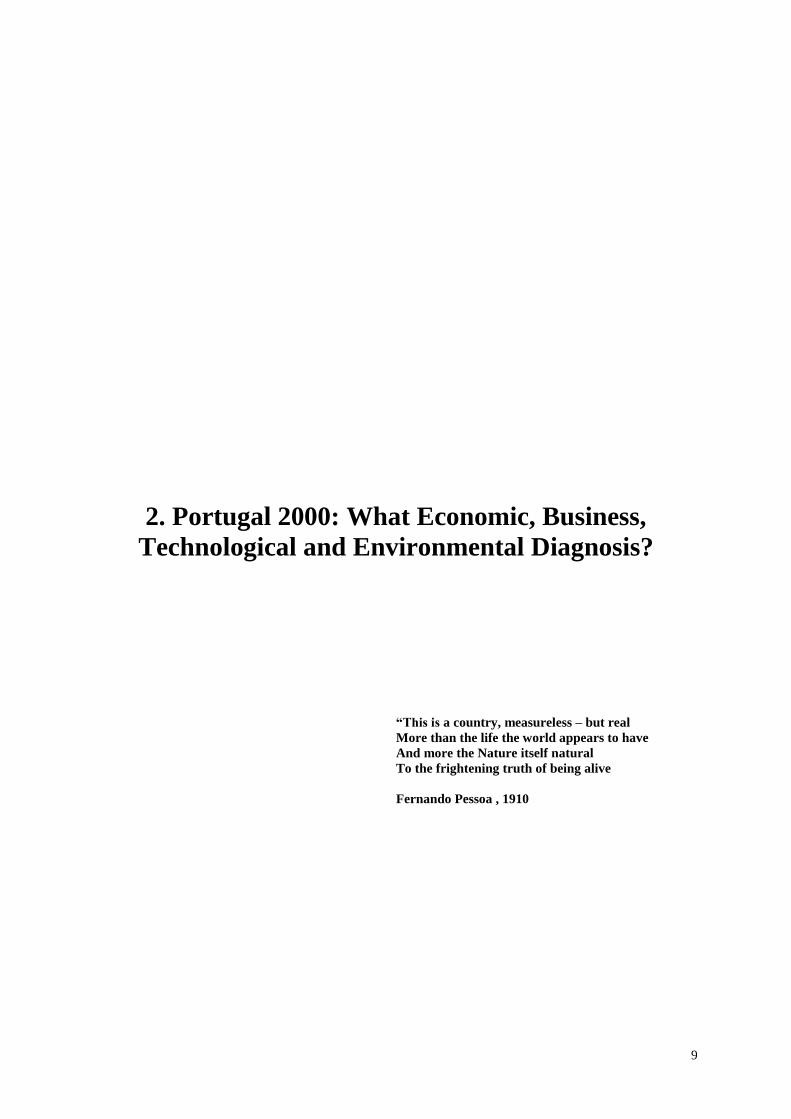
The general structure of the project is represented in Fig. 1.3:
ET 2000 Structure
Fig. 1.3
HONORARY CHAIRMAN OF ET 2000:
HIS EXCELLENCY THE PRESIDENT OF REPUBLIC
CHAIRMANSHIP OF THE PROJECT
Prof. Armando Lencastre (AE), Comendador Jorge Rocha de Matos (AIP), Eng.º Sousa
Soares (OE), Eng.º João Bártolo, Prof. Luís Valadares Tavares, Eng.º Pereira do Vale
ADVISORY COMMITTEE
Eng.º João Bártolo (presidente), Eng.º Marques Videira
(AE), Eng.º António Alfaiate (AIP), Eng.º Viana
Baptista (OE), Prof. Luís Valadares Tavares (Director),
Eng.º Pereira do Vale (General Secretary)
CONFERENCE COMMITTEE
Prof. L. Valadares Tavares (president), Prof. Ricardo
Oliveira (AE), Prof.ª Graça Carvalho (OE), Eng.º
Luís Lapão (IST), Dr. Pereira Bastos (AIP)
DIRECTOR OF THE PROJECT
Prof. Luís Valadares Tavares
PROJECT TEAM - CESUR
ACADEMIC – BUSINESS
COUNCIL
Prof. Luís Valente de Oliveira
LEADERS NETWORK and
SPECIALIZED GROUPS
9
2. Portugal 2000: What Economic, Business,
Technological and Environmental Diagnosis?
“This is a country, measureless – but real
More than the life the world appears to have
And more the Nature itself natural
To the frightening truth of being alive
Fernando Pessoa , 1910
10
2 PORTUGAL 2000: WHAT ECONOMIC, BUSINESS, TECHNOLOGICAL AND
ENVIRONMENTAL DIAGNOSIS?
2.1 DEVELOPMENT AND KNOWLEDGE
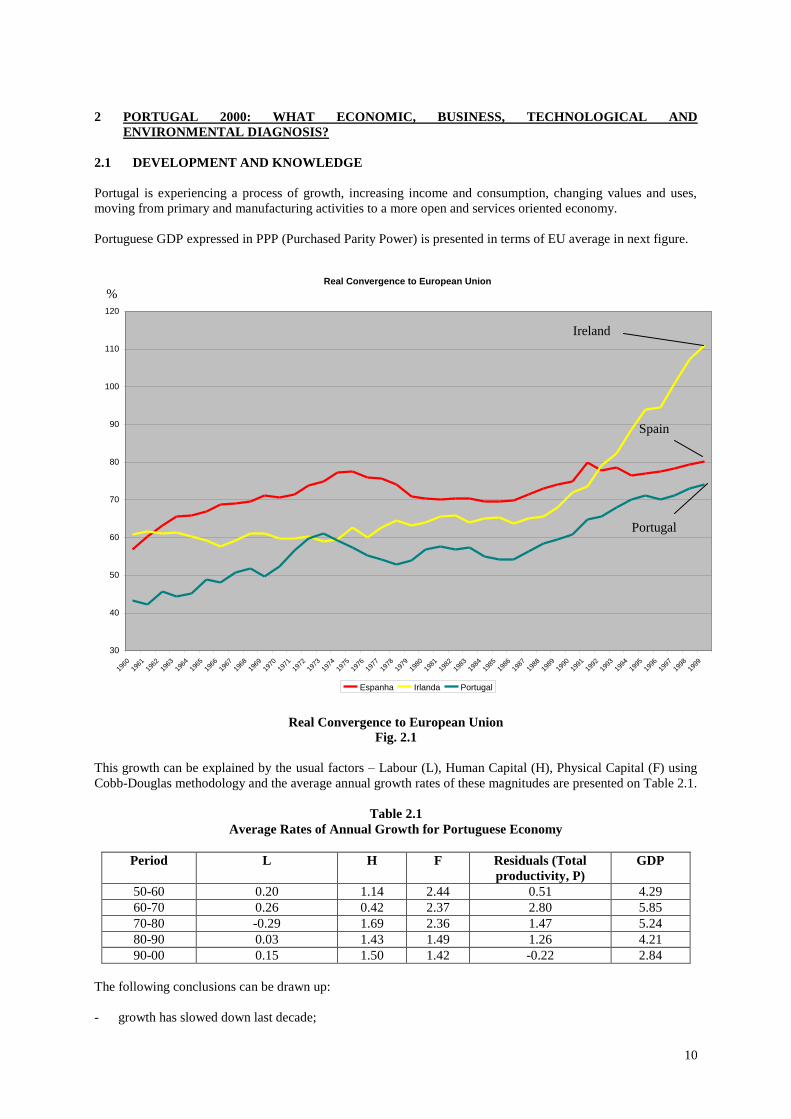
Portugal is experiencing a process of growth, increasing income and consumption, changing values and uses,
moving from primary and manufacturing activities to a more open and services oriented economy.
Portuguese GDP expressed in PPP (Purchased Parity Power) is presented in terms of EU average in next figure.
Real Convergence to European Union
30
40
50
60
70
80
90
100
110
120
1960
1961
1962
1963
1964
1965
1966
1967
1968
1969
1970
1971
1972
1973
1974
1975
1976
1977
1978
1979
1980
1981
1982
1983
1984
1985
1986
1987
1988
1989
1990
1991
1992
1993
1994
1995
1996
1997
1998
1999
Espanha Irlanda Portugal
Real Convergence to European Union
Fig. 2.1
This growth can be explained by the usual factors – Labour (L), Human Capital (H), Physical Capital (F) using
Cobb-Douglas methodology and the average annual growth rates of these magnitudes are presented on Table 2.1.
Table 2.1
Average Rates of Annual Growth for Portuguese Economy
Period L
H F Residuals (Total
productivity, P)
GDP
50-60 0.20 1.14 2.44 0.51 4.29
60-70 0.26 0.42 2.37 2.80 5.85
70-80 -0.29 1.69 2.36 1.47 5.24
80-90 0.03 1.43 1.49 1.26 4.21
90-00 0.15 1.50 1.42 -0.22 2.84
The following conclusions can be drawn up:
- growth has slowed down last decade;
Ireland
Spain
Portugal
%
11
- during eighties, H and P have a similar growth, near 1/3 of the total;
- during the nineties, the total productivity growth is negative and the growth of L and F is similar
This analysis is consistent with the low productivity existing in Portugal (1997) around 58% of OECD average:
Country GDP for working hour (% of OECD average)
Australia 96 Austria 102 Belgium 128 Canada 97 Denmark 92 Finland 93 France 123 Germany 105 Greece 75 Ireland 108 Italy 106 Japan 82 Netherlands 121 New Zealand 69 Norway 126 Portugal 56 Spain 84 Sweden 93 Switzerland 94 Turkey 36 UK 100 US 120 EU=14 103
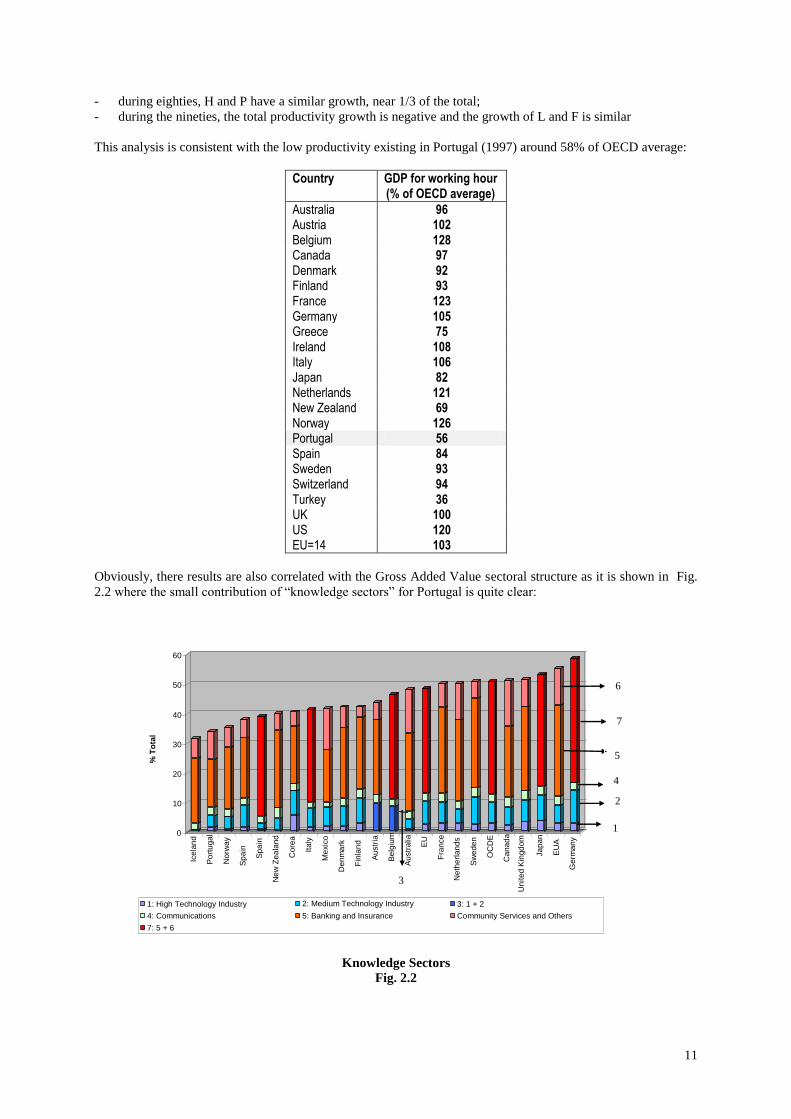
Obviously, there results are also correlated with the Gross Added Value sectoral structure as it is shown in Fig.
2.2 where the small contribution of “knowledge sectors” for Portugal is quite clear:
0
10
20
30
40
50
60
% T
ota
l
Ice
lan
d
Po
rtu
gal
No
rwa
y
Sp
ain
Sp
ain
Ne
w Z
ea
lan
d
Co
rea
Ita
ly
Me
xic
o
De
nm
ark
Fin
lan
d
Au
str
ia
Be
lgiu
m
Au
str
alia
EU
Fra
nce
Ne
the
rla
nd
s
Sw
ed
en
OC
DE
Ca
na
da
Un
ite
d K
ingd
om
Ja
pa
n
EU
A
Ge
rma
ny
1: High Technology Industry 2: Medium Technology Industry 3: 1 + 2
4: Communications 5: Banking and Insurance Community Services and Others
7: 5 + 6
Knowledge Sectors
Fig. 2.2
3
1
2
4
5
7
6
12
35
55
75
95
115
135
155
30.00 35.00 40.00 45.00 50.00 55.00 60.00 65.00
% of knowledge sectors in total GAV (1997)
GD
P (P
PP
) as
% o
f U
E a
ver
age
(19
97
)
Portugal
Norway
Denmark
FinlandItaly
SpainNew Zealand
Mexico
Hungary
Belgium
Australia
France
U. K.Sweden
Netherlands
GreeceCorea
Japan
Canada
EUA
Germany
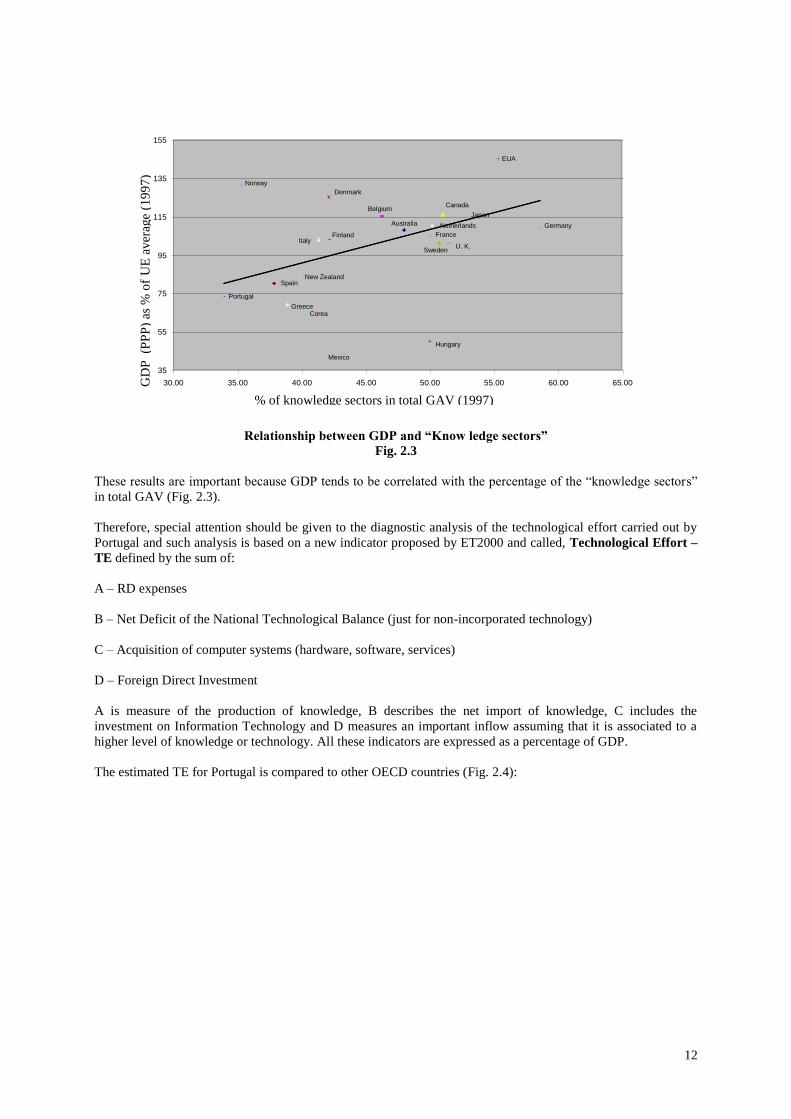
Relationship between GDP and “Know ledge sectors”
Fig. 2.3
These results are important because GDP tends to be correlated with the percentage of the “knowledge sectors”
in total GAV (Fig. 2.3).
Therefore, special attention should be given to the diagnostic analysis of the technological effort carried out by
Portugal and such analysis is based on a new indicator proposed by ET2000 and called, Technological Effort –
TE defined by the sum of:
A – RD expenses
B – Net Deficit of the National Technological Balance (just for non-incorporated technology)
C – Acquisition of computer systems (hardware, software, services)
D – Foreign Direct Investment
A is measure of the production of knowledge, B describes the net import of knowledge, C includes the
investment on Information Technology and D measures an important inflow assuming that it is associated to a
higher level of knowledge or technology. All these indicators are expressed as a percentage of GDP.
The estimated TE for Portugal is compared to other OECD countries (Fig. 2.4):

13
-2
0
2
4
6
8
10
12
14
16
Exp
en
dit
ure
as a
% o
f G
DP
I&D Intensity IDE Débitos Balança Tecnológica Hardware Software & Serv.
Countries
1 2 3 4 5 6 7 8 9 10 11 12 13 14 15 16 17 18 19 20 21 22 23 24 25 26 27
Technological Effort
Fig. 2.4
1 A 2 D 3 C 4 Hardware 5 Software and Services
This comparative analysis shows that Portugal is making a reasonable effort, higher than other countries such as
Spain. However, other peripheral or small successful European countries such as Finland, Ireland or Netherlands
have a much higher effort level.
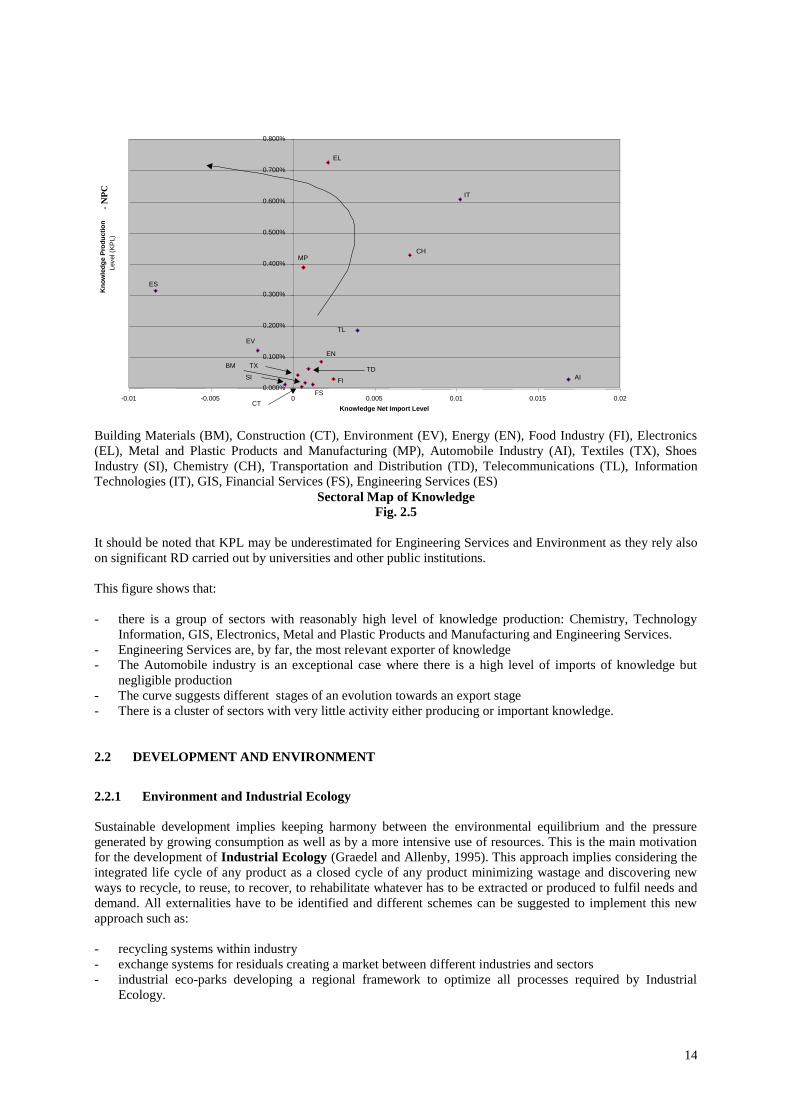
The studied 17 sectors have been analysed in terms of KPL (Knowledge Production Level) and KNIL
(Knowledge Net Import Level) defined by:
S
BKNILand
S
AKPL
where S represents the total sales of each sector.
These two indicators can be used to produce a SECTORAL MAP of KNOWLEDGE for the 17 sectors (Fig.
2.5)
5
4
3
2
1
1 ID Intensity 2 IDE 3 Technological Balance Deficit 4 Hardware 5 Software & Serv.
1 – Sweden 4 – U.K 7 – Denmark 10 – Cheek Republic 13 – Finland 16 – Japan 19 – Austria 22 – New Zealand 25 – Italy
2 – Belgium 5 – Switzerland 8 – Ireland 11 – Canada 14 – Australia 17 – Germany 20 – Chorea 23 – Mexico 26 – Greece
3 – Netherlands 6 – USA 9 – France 12 – Hungary 15 – Norway 18 – Poland 21 – Portugal 24 – Spain 27 – Turkey
14
0.000%
0.100%
0.200%
0.300%
0.400%
0.500%
0.600%
0.700%
0.800%
-0.01 -0.005 0 0.005 0.01 0.015 0.02
Knowledge Net Import Level
Kn
ow
led
ge P
rod
ucti
on
Level (K
PL)
EL
IT
FS
CHMP
TL
EV
EN
TD
FI
ES
TX
SI
CT
BM
AI
Building Materials (BM), Construction (CT), Environment (EV), Energy (EN), Food Industry (FI), Electronics
(EL), Metal and Plastic Products and Manufacturing (MP), Automobile Industry (AI), Textiles (TX), Shoes
Industry (SI), Chemistry (CH), Transportation and Distribution (TD), Telecommunications (TL), Information
Technologies (IT), GIS, Financial Services (FS), Engineering Services (ES)
Sectoral Map of Knowledge
Fig. 2.5
It should be noted that KPL may be underestimated for Engineering Services and Environment as they rely also
on significant RD carried out by universities and other public institutions.
This figure shows that:
- there is a group of sectors with reasonably high level of knowledge production: Chemistry, Technology
Information, GIS, Electronics, Metal and Plastic Products and Manufacturing and Engineering Services.
- Engineering Services are, by far, the most relevant exporter of knowledge
- The Automobile industry is an exceptional case where there is a high level of imports of knowledge but
negligible production
- The curve suggests different stages of an evolution towards an export stage
- There is a cluster of sectors with very little activity either producing or important knowledge.
2.2 DEVELOPMENT AND ENVIRONMENT
2.2.1 Environment and Industrial Ecology
Sustainable development implies keeping harmony between the environmental equilibrium and the pressure
generated by growing consumption as well as by a more intensive use of resources. This is the main motivation
for the development of Industrial Ecology (Graedel and Allenby, 1995). This approach implies considering the
integrated life cycle of any product as a closed cycle of any product minimizing wastage and discovering new
ways to recycle, to reuse, to recover, to rehabilitate whatever has to be extracted or produced to fulfil needs and
demand. All externalities have to be identified and different schemes can be suggested to implement this new
approach such as:
- recycling systems within industry
- exchange systems for residuals creating a market between different industries and sectors
- industrial eco-parks developing a regional framework to optimize all processes required by Industrial
Ecology.
- N
PC

15
This new domain is a source of business innovation creating new opportunities for the “green” business and for
SMEs (Small and Medium Enterprises) as it is shown by (Esty and Porter, 1998).
2.2.2 Thematic Challenges
Several organizations have focused major thematic challenges for environment, namely:
- Environment European Agency, (EEA, 1999)
- Direcção – Geral do Ambiente, (DGA, 1999) and the following list can be quoted:
I Greenhouse effect
II Ozone decay
III Air quality
IV Water resources scarcity
V Soils
VI Waste
VII Natural and technological risks
VIII Biodiversity
IX Genetical modified organisms
The study of these 9 issues requires appropriate indicators and they can be classified according to their meaning
to understand environmental processes:
DF Driving forces
P Pressure
S State
I Impact
R Response
The present situation of these indicators for Portugal can be described in terms of three different alternative
situations:
A Availability of Indicators and Data
B Availability of Indicators but Unavailability Data
C Unavailability of Indicators and of Data.
1 2 3 4 5 6
Building Materials Construction Environment Energy Food Industry Electronics
DF P S I R DF P S I R DF P S I R DF P S I R DF P S I R DF P S I R
I C A B C B C A B C C A A B C A C C B C C
II C B B C B C C B C C
III C C B C B C C B C B A A B B B C B B C C
IV A A B C B C C B C B
V A C B C B
VI C A C C C C A C B B B B C C C A A C B B C C C C C C A C C B
VII A B C C C
VIII A B A C B
16
7 8 9 10 11 12
Metal and Plastic
Products and
Manufacturing
Automobile Industry Textiles Shoes Industry Chemistry Transportation and
Distribution
DF P S I R DF P S I R DF P S I R DF P S I R DF P S I R DF P S I R
I C B C C C A A B C A A A B C A
II
III C A B C C A A B C A C A B C B A A B B B
IV C C C B C C B C B C C B B B C
V C B B C C A A B C C C C B C B C B B C B A A C C C
VI C A C C C A A C C C C A C C C C
VII C C B C C C B C C C
VIII A A A C C
2.2.3 Growth with more pollution and consumption of materials
The overall level of pollution per inhabitant is lower in Portugal than the EU average as we have a lower
industrial production. However, the analysis of the pollution load generated in each GDP unit shown that its
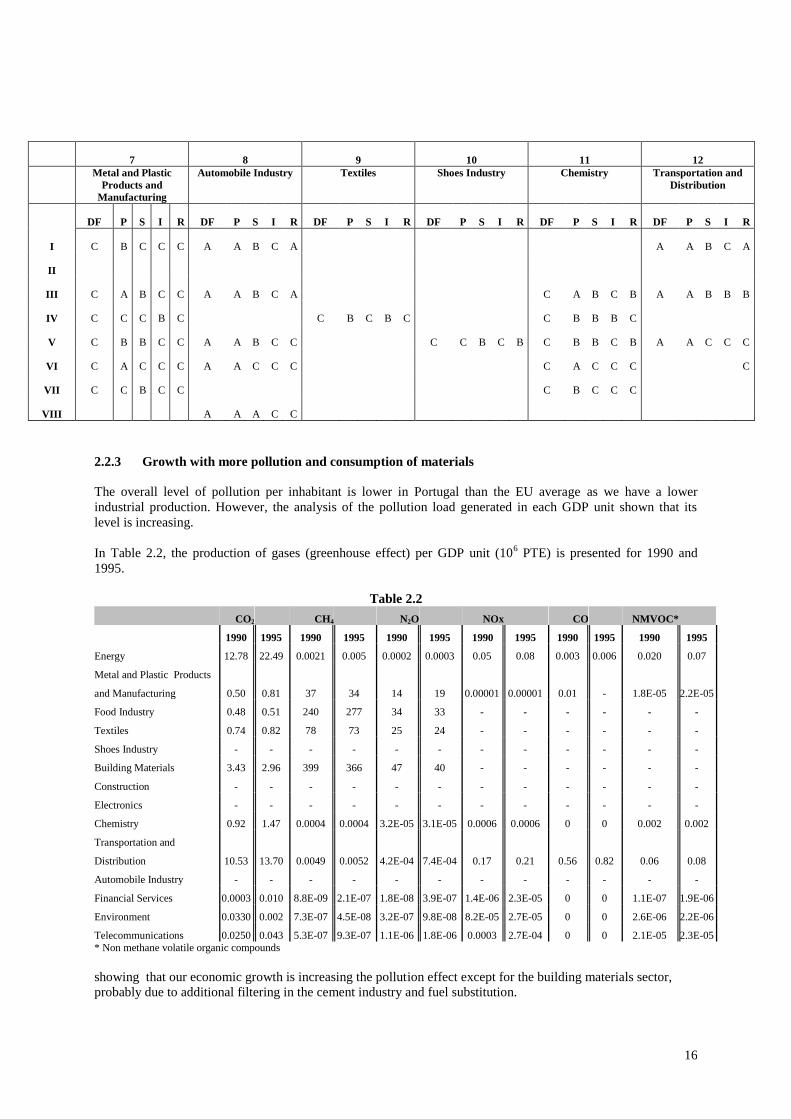
level is increasing.
In Table 2.2, the production of gases (greenhouse effect) per GDP unit (106 PTE) is presented for 1990 and
1995.
Table 2.2
CO2 CH4 N2O NOx CO NMVOC*
1990 1995 1990 1995 1990 1995 1990 1995 1990 1995 1990 1995
Energy 12.78 22.49 0.0021 0.005 0.0002 0.0003 0.05 0.08 0.003 0.006 0.020 0.07
Metal and Plastic Products
and Manufacturing 0.50 0.81 37 34 14 19 0.00001 0.00001 0.01 - 1.8E-05 2.2E-05
Food Industry 0.48 0.51 240 277 34 33 - - - - - -
Textiles 0.74 0.82 78 73 25 24 - - - - - -
Shoes Industry - - - - - - - - - - - -
Building Materials 3.43 2.96 399 366 47 40 - - - - - -
Construction - - - - - - - - - - - -
Electronics - - - - - - - - - - - -
Chemistry 0.92 1.47 0.0004 0.0004 3.2E-05 3.1E-05 0.0006 0.0006 0 0 0.002 0.002
Transportation and
Distribution 10.53 13.70 0.0049 0.0052 4.2E-04 7.4E-04 0.17 0.21 0.56 0.82 0.06 0.08
Automobile Industry - - - - - - - - - - - -
Financial Services 0.0003 0.010 8.8E-09 2.1E-07 1.8E-08 3.9E-07 1.4E-06 2.3E-05 0 0 1.1E-07 1.9E-06
Environment 0.0330 0.002 7.3E-07 4.5E-08 3.2E-07 9.8E-08 8.2E-05 2.7E-05 0 0 2.6E-06 2.2E-06
Telecommunications 0.0250 0.043 5.3E-07 9.3E-07 1.1E-06 1.8E-06 0.0003 2.7E-04 0 0 2.1E-05 2.3E-05
* Non methane volatile organic compounds
showing that our economic growth is increasing the pollution effect except for the building materials sector,
probably due to additional filtering in the cement industry and fuel substitution.
17
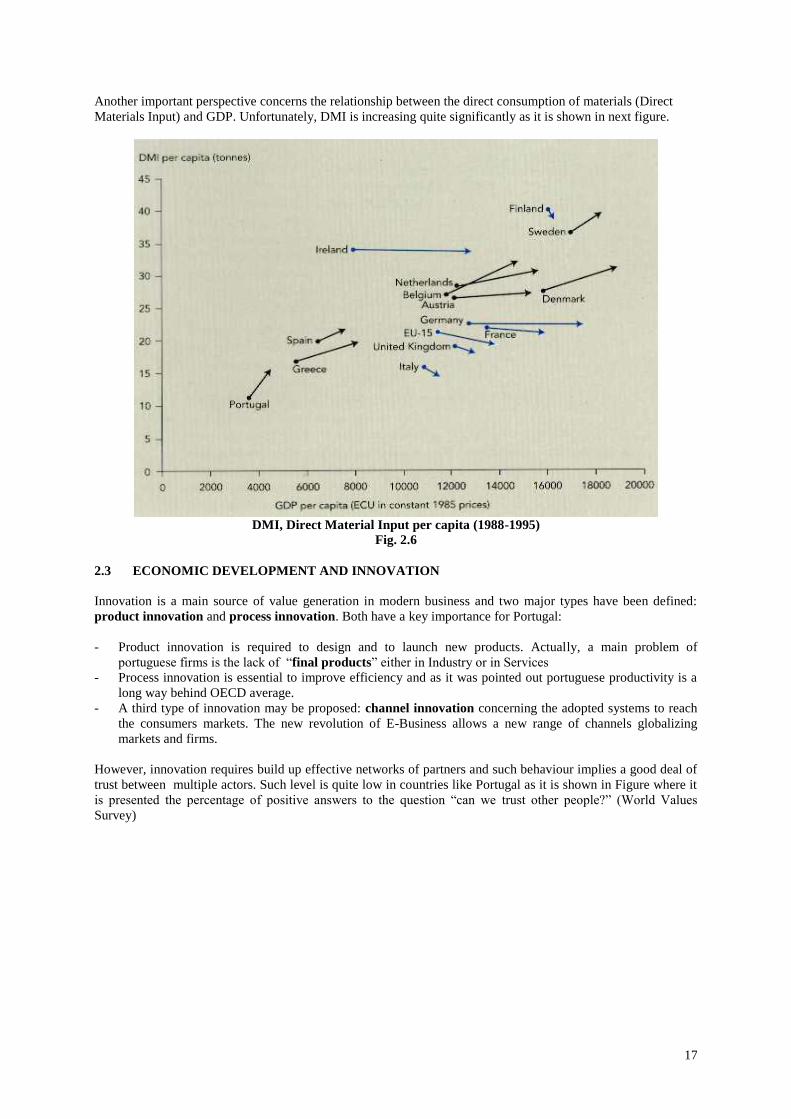
Another important perspective concerns the relationship between the direct consumption of materials (Direct
Materials Input) and GDP. Unfortunately, DMI is increasing quite significantly as it is shown in next figure.
DMI, Direct Material Input per capita (1988-1995)
Fig. 2.6
2.3 ECONOMIC DEVELOPMENT AND INNOVATION
Innovation is a main source of value generation in modern business and two major types have been defined:
product innovation and process innovation. Both have a key importance for Portugal:
- Product innovation is required to design and to launch new products. Actually, a main problem of
portuguese firms is the lack of “final products” either in Industry or in Services
- Process innovation is essential to improve efficiency and as it was pointed out portuguese productivity is a
long way behind OECD average.
- A third type of innovation may be proposed: channel innovation concerning the adopted systems to reach
the consumers markets. The new revolution of E-Business allows a new range of channels globalizing
markets and firms.
However, innovation requires build up effective networks of partners and such behaviour implies a good deal of
trust between multiple actors. Such level is quite low in countries like Portugal as it is shown in Figure where it
is presented the percentage of positive answers to the question “can we trust other people?” (World Values
Survey)
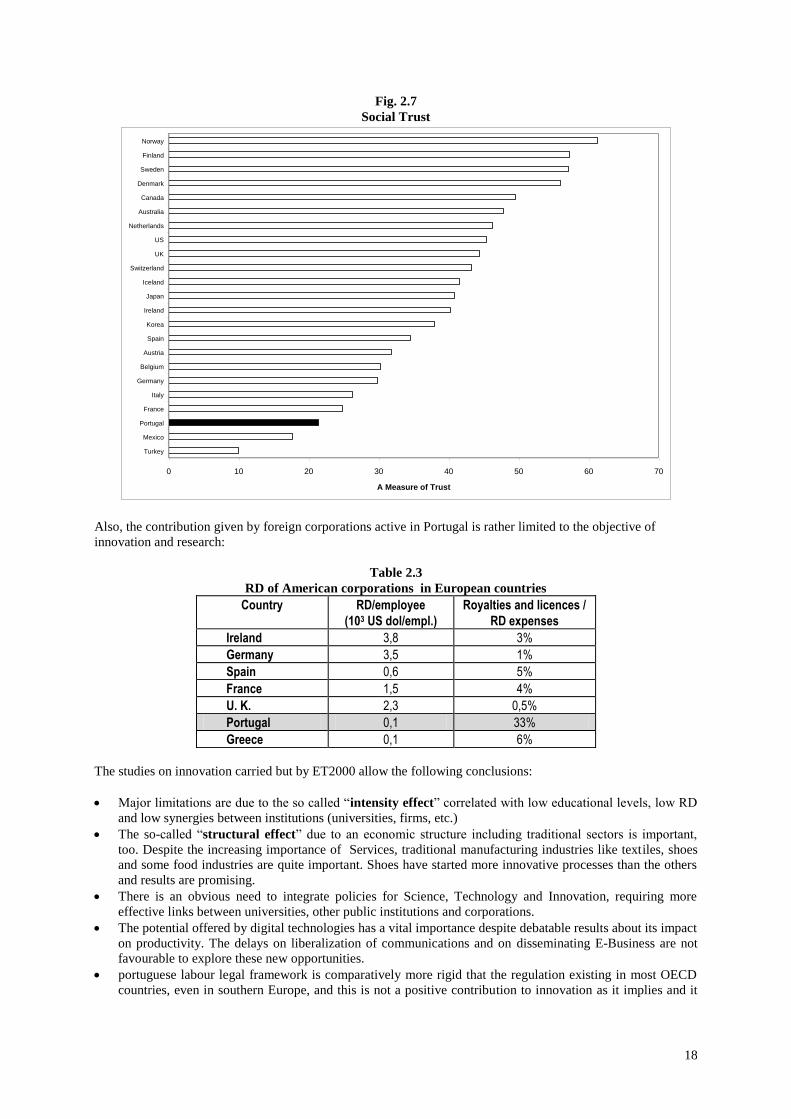
18
Fig. 2.7
Social Trust
0 10 20 30 40 50 60 70
Turkey
Mexico
Portugal
France
Italy
Germany
Belgium
Austria
Spain
Korea
Ireland
Japan
Iceland
Switzerland
UK
US
Netherlands
Australia
Canada
Denmark
Sweden
Finland
Norway
A Measure of Trust
Also, the contribution given by foreign corporations active in Portugal is rather limited to the objective of
innovation and research:
Table 2.3
RD of American corporations in European countries
Country RD/employee
(103 US dol/empl.)
Royalties and licences /
RD expenses
Ireland 3,8 3%
Germany 3,5 1%
Spain 0,6 5%
France 1,5 4%
U. K. 2,3 0,5%
Portugal 0,1 33%
Greece 0,1 6%
The studies on innovation carried but by ET2000 allow the following conclusions:
Major limitations are due to the so called “intensity effect” correlated with low educational levels, low RD
and low synergies between institutions (universities, firms, etc.)
The so-called “structural effect” due to an economic structure including traditional sectors is important,
too. Despite the increasing importance of Services, traditional manufacturing industries like textiles, shoes
and some food industries are quite important. Shoes have started more innovative processes than the others
and results are promising.
There is an obvious need to integrate policies for Science, Technology and Innovation, requiring more
effective links between universities, other public institutions and corporations.
The potential offered by digital technologies has a vital importance despite debatable results about its impact
on productivity. The delays on liberalization of communications and on disseminating E-Business are not
favourable to explore these new opportunities.
portuguese labour legal framework is comparatively more rigid that the regulation existing in most OECD
countries, even in southern Europe, and this is not a positive contribution to innovation as it implies and it

19
generates changes. After all, the words of Schumpeter can be quoted: “Innovation is a process of creative
destruction”.
Finally, an analysis of innovation would remain incomplete without looking at its major contributor: the
entrepreneur.
However, the process of decision making of the entrepreneur or manager to overcome problems and difficulties
tends to look for innovation just after several other attempts as it is presented in the following “staircase” of
decision stages:
Fig. 2.8
The “staircase” of the portuguese manager
Innovation?
Cost reduction
Market “protection” to increase revenues
Demand for State subsidies
2.4 DEVELOPMENT, INTERNATIONALIZATION AND TECHNOLOGICAL MARKETING
The process of progressive international openness of portuguese economy has been crucial to the increase of our
national income despite obvious problems for the less competitive economic sectors (namely, primary sector).
New digital and communication technologies are globalizing markets allowing not just the distribution and sales
of products, far way from their production sites, but also a similar trend for personal and commercial services.
The small size of our economy has been partially overcome through processes of merging and concentration
ignoring alternative strategies based on cooperation, partnership and networking.
Internationalization tends to be inevitable for small economies as it is the case of Portugal and benchmarking for
competitiveness is urgent within a globalized market framework.
Globalized markets imply intensive use of technology and, particularly, of technologic marketing tools. The
concept of technologic marketing applies either to the sales of technologic products such as computers or mobile
phones or to the use of technology to market any product or service (ATM, Internet, etc.).
Assuming that portuguese economy is focusing on services, technological marketing becomes crucially
important. However, data about computers (just 11% of families have a PC against an average of 18% in EU)
and, even more, about E-Business show a clear delay. Fortunately, the reduced use of computers at home is
compensated by an wider access at workplaces or universities.
Table 2.4
Access to computers and internet
% of individuals ( 15 years)
1997 (Sept. – Dec.) 1999 (Apr. – Jun)
- having access to a computer 47.8% 51.4%
- having access to internet 13.0% 21.6%
(4.3%)* (9%)*
*in Spain
The comparison of internet use with Spain is favourable to Portugal and the place selected for that use is quite
different: in Portugal, 20% of users do it from home and 40% from work or from study places but in Spain 40%
of users do it from home, 40% form the work place and 20% from study place.
Decisional
Options

20
In Portugal, e-shopping is still rather small (about 106 contos around 1999) and more peripheral regions like
Azores and Madeira lead this business.
B2B is in an infant stage but several leading economic groups are now heavily investing on this new area
(Trade.com, Forum B to B, etc.).
The activity to interconnect these market places with portuguese firms, namely SMEs will be a key condition for
success.
Of course, all this new age of technology in E-Business is an excellent opportunity for Engineering and
Technology in Portugal . Several priority areas include computer and communication systems, management
information systems (namely to interconnect SMEs with marketplaces), datamining and CRS (customer
relationship systems), website engineering, decision systems, etc.
A less developed know-how on Engineering and Technology for these new areas will condemn Portugal to be
an economy oriented for low added value services, loosing competitiveness in international markets.
2.5 DEVELOPMENT AND HUMAN CAPITAL
The educational qualification of portuguese population (25 64 years old) has a much lower level than most
OECD countries as it is shown in next Figure: just around 20% have completed upper secondary education or
higher, against about 30%, 50%, 60% or 65% for Spain, Ireland, Netherlands and Finland, respectively.
The evolution of the population having completed upper secondary education (level 3 according to ISCED
and in Portugal 12th
grade) can be simulated for the horizon of 2020 in terms of the educational achievement
for age group:
1577 1397 1238 908 Population
(103 inhab)
Year 2000: % level 3 18%
30 %
20%
10%
5%
% level 3
25
35
45
55
65
Age group
(years)
1497 (present age group 15-25)
Year 2010: % level 3 30%
55%
30%
20%
10%
1198 (present age group 5-14)
Year 2020: 39%
% level 3
48%
X
55%
30%
20%
X
Fig. 2.9
Simulation of the evolution of portuguese population with level 3
This model shows that Portugal will not exceed 40% if there is no significant jump in the achievements from
present rate
60%*
Nowadays X is around 50%
100%
21
2.5.1 Higher Education
a) Trends
The improvement of Higher Education in quantitative and qualitative terms is essential to develop Engineering
and Technology. In Portugal, the percentage of the active population with higher education is around 10%
(1996) against an average of 23% in OECD (OECD, 1998) and levels of 18%m 23%, 21% and 23% for Spain,
Ireland, Finland and Netherlands, respectively.
During the last decade the inflow of Portugal students to Higher Education had an huge increase reaching a
population of around 351 000 students on 1996/7 but since then the inflow has been decreasing due to the
decrease of birth rate (since 1978) and also due to the stagnation (or even reduction) of participation rates above
21 years old:
Table 2.5
Participation Rate (ME, 1999)
Age Year 96/97 97/98
16 83% 85%
19 63% 66%
21 35% 33%
23 26% 23%
25 15% 14%
Therefore, the forecast of 229000 students for 2005/6 can be even an overestimation of the population of
students in Higher Education.
b)
b) Comparative analysis
The graduation rate (number of students completing higher education in terms of their population group) for
Portugal has increased but is lower than in other reference countries (OECD, 1998):
Table 2.6
Country Graduation rate (%)
- 1996 -
Portugal 16%
Spain 27%
Ireland 26%
Netherlands 20%
Finland 24%
showing that we still have a deficit between 5 and 10%.
The percentage of portuguese students completing long programs (“licenciatura”, 4-5 years) has increased as the
percentage of those completing a B. Sc has fallen down from 40% to 26% between 1992 and 1996.
This is quite negative for Engineering and Technology as the increasing scarcity of technologists qualified with
an intermediate level is a very serious shortcoming to the competitiveness of our Economy.
The distribution of graduates per subject can be compared also with other countries

22
Table 2.7
% candidates % graduates
Portugal
98
Portugal
96
Ireland
96
Netherlands
96
Finland
96
Sciences, Mathematics,
Computers, Engineering and
Architecture
23% 21% 30% 25% 38%
Law, Social Sciences,
Education, Humanities,
Economics, Management
and Arts
56%
72%
65%
62%
50%
Health 19% 7% 5% 13% 12%
The case of Ireland is a very interesting example as there has been during last decade a strong commitment to
increase the education in Science and Technology, jumping the previous rate of candidates to more than 50%.
(information received from the F. Kauppinen, European Foundation for the Improvement of Living and Working
Conditions, Dublin, 2001, March).
This Table shows the obvious strong deficit of Health and a small one in Sciences and Technology if compared
to Finland and Ireland (Recently, Ireland has increased significantly the 30% share).
Unfortunately, present trends are not very favourable:
- the renewal of active population is around 2% per year and the number of annual graduates is around 20000.
Therefore, even if the rate of graduation for present cohort reaches 60%, this means that the percentage of
active population with this level will be around 18% on still below present average for OECD.
- Increasing that graduation rate would imply a significant reduction of present drop out which is quite high
(40% - 50%) but this rate seems rather stable.
- The percentage of students choosing Science or Technology in Secondary Education is decreasing: 63%
52% from 1990 to 1997.
Summing up, it seems that:
- Higher Education has a rather low level of efficiency due to high dropping-out and retention levels. This
means that Portugal will not reach the average level of qualification of OECD – 1996 on the target year of
2020, unless radical changes will be pursued.
- There is a growing scarcity of graduates in Engineering and Technology, particularly for the intermediate
level (B Sc or certificate level)
- This scarcity will spread over most Engineering and Technology areas but it is already quite high for
domains like Computers, Systems, Communication, Multimedia, Environmental, Services, Infra-structures
(Civil Engineering)
2.5.2 Research and Development (RD)
RD effort of the portuguese State has increased significantly during last years:
Table 2.8
Public RD as % of GDP
1988 1997
Portugal 0.29% 0.54%
Spain 0.42% 0.50%
Finland 0.75% 1.16%
Netherlands 0.94% 0.76%
Ireland 0.36% 0.32%
becoming higher than in other countries like Ireland or Spain.

23
However, private RD is still very low (about 22% of total) compared to the others: 69% (Ireland), 47% (Spain)
and average EU 64%.
Obviously, the total RD effort (as % of GDP), q, is given by f1
pq
where p is the public RD (also as % of
GDP) and f the fraction due to private RD. Thus, one has q = 2.8 p for average EU but for Portugal just q =
1.25p, obtaining q 0.7%, quite below the target of 1% often praised by politicians.
The distribution of RD per subject areas was studied by Contzen (Contzen, 2000):
Table 2.9
Distribution of RD per subject areas
Agro-Sciences Humanities Technologies Others
Portugal 13% 20% 14% 53%
E.U 4% 13% 20% 63%
Ireland 21% 14% 39% 36%
showing that technologies deserve in Portugal much less attention.
The number of scholarships to support PhD students had a very positive growth but those for MSc have been
reduced (OCT, 1999)
Table 2.10
Distribution of scholarships
Scholarships 1994 1998
PhD 520 677
MSc 776 186
The distribution of PhDs per subjects has been lead by students’ choice (Bonfim, 2000):
Table 2.11
Distribution of scholarships per domain
Subject %
Electrical and Computer Engineering 27
Chemistry 25
Civil Engineering 15
Chemical Engineering and Biotechnology 13
Mechanical Engineering 13
Materials 7
and the area of Information and Communication Technologies is quite below reasonable levels.
Unfortunately, around 95% of PhDs stay at the university system and the example of Chemical Engineering can
be quoted: between 70 and 97, 290 PhDs were produced but just about 20 or 25 PhDs were found in industry.
Other indicators can be used but the following conclusions seem quite obvious:
- the strong public effort during last decade has developed a basic public RD infrastructure, although more
oriented for Sciences than for Technologies.
- Most of public RD effort has been allocated in terms of demand without considering specific policy
priorities;
- Most of the existing public RD system is based on traditional classification of subjects and it is not oriented
to support the new RD paradigm: the so-called “Mode 2 research” (Gibbons et al, 1994).
24
- New challenges will require substantial changes, namely:
- Higher Education cannot go on absorbing more than 90% of new PhDs;
- The EU contribution to our RD effort is quite substantial but it will be much smaller after 2006;
- Setting up priorities and major options for our Science and Technology policy should be not delayed;
- RD effort in Defence should be increased developing synergies with other civilian areas making a better
use of compensation policies for important procurement decisions;
- The urgent development of private RD requires not just priorities but a new “problem oriented” approach
supporting networks and innovative programs. EU is also moving in this direction through the “Key
Actions” approach and the new ERA (European Research Area).
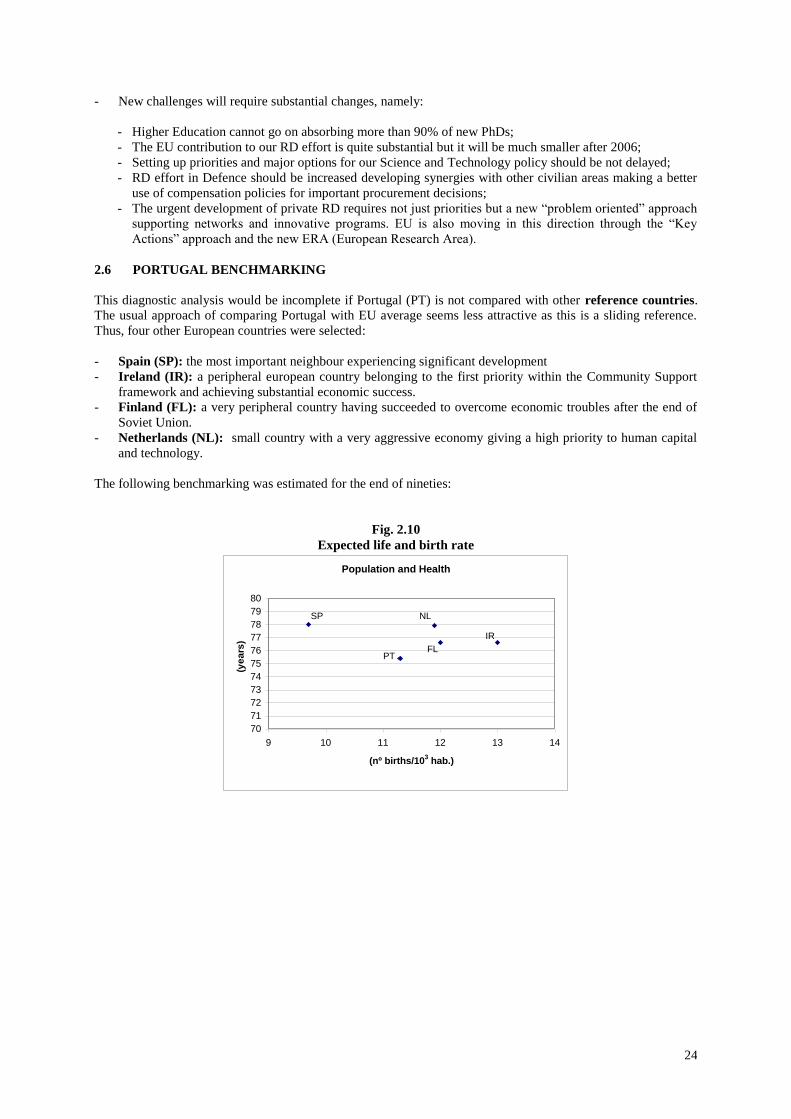
2.6 PORTUGAL BENCHMARKING
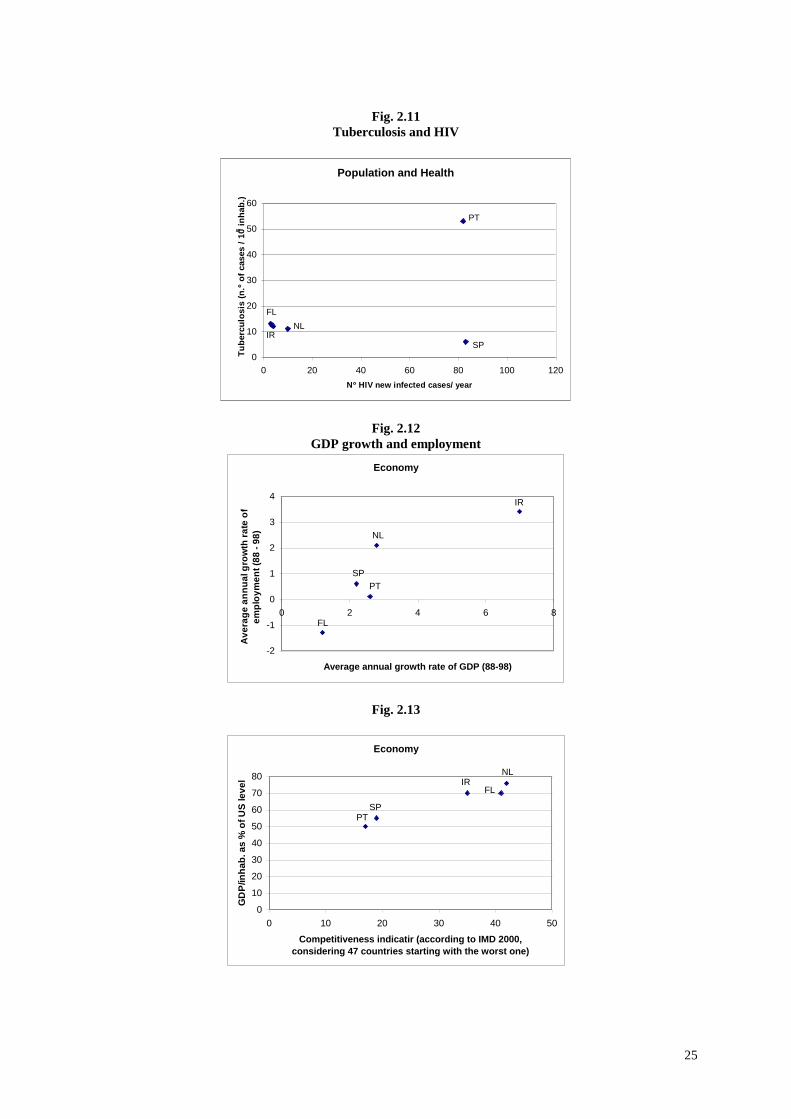
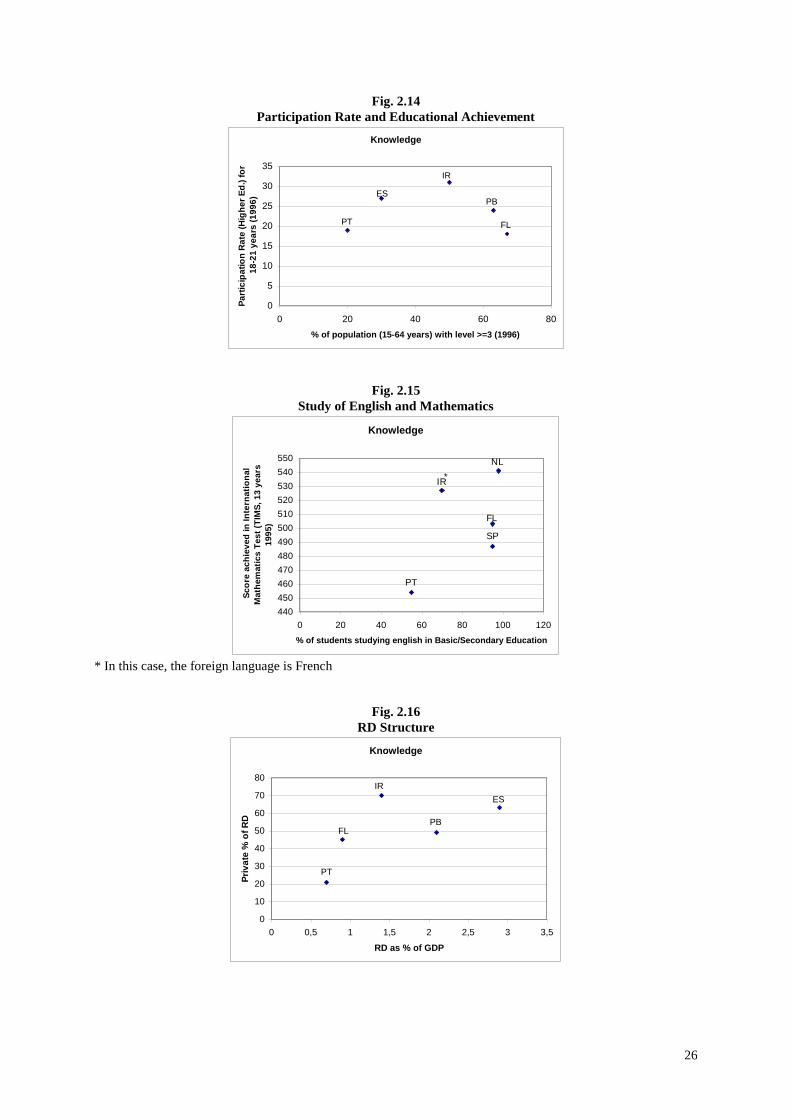
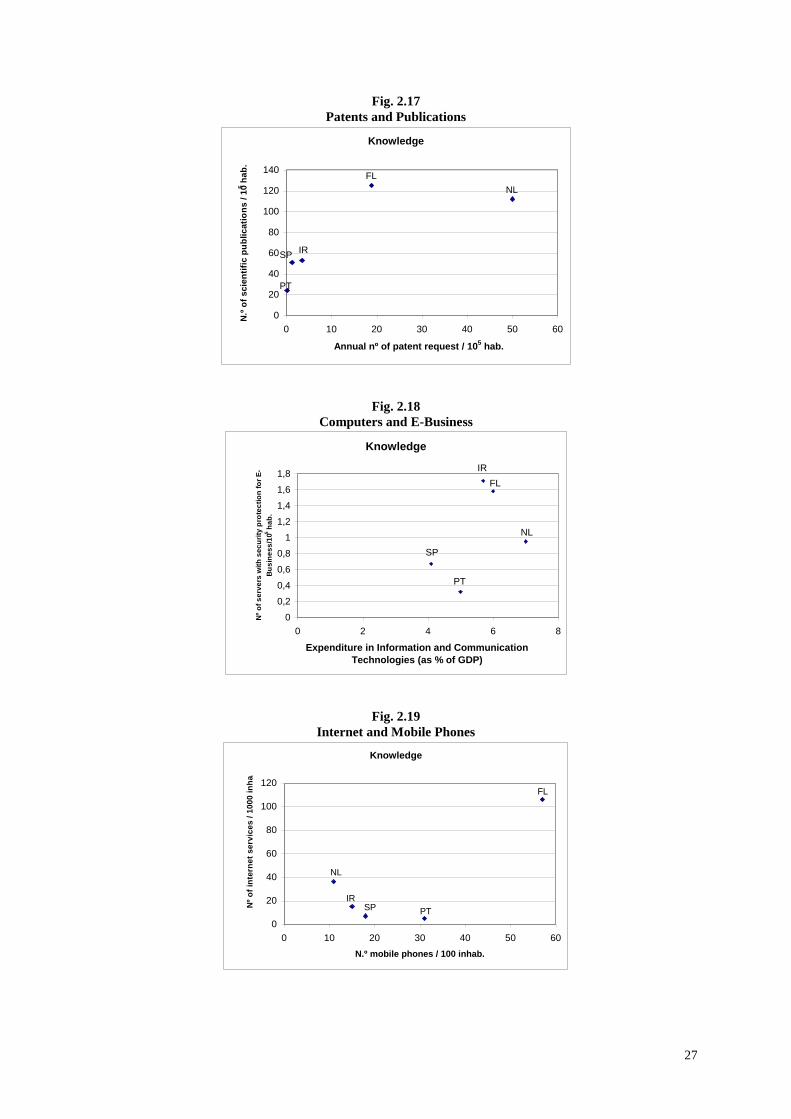
This diagnostic analysis would be incomplete if Portugal (PT) is not compared with other reference countries.
The usual approach of comparing Portugal with EU average seems less attractive as this is a sliding reference.
Thus, four other European countries were selected:
- Spain (SP): the most important neighbour experiencing significant development
- Ireland (IR): a peripheral european country belonging to the first priority within the Community Support
framework and achieving substantial economic success.
- Finland (FL): a very peripheral country having succeeded to overcome economic troubles after the end of
Soviet Union.
- Netherlands (NL): small country with a very aggressive economy giving a high priority to human capital
and technology.
The following benchmarking was estimated for the end of nineties:
Fig. 2.10
Expected life and birth rate
Population and Health
70
71
72
73
74
75
76
77
78
79
80
9 10 11 12 13 14
(nº births/103 hab.)
(ye
ars
)
PT
NL
FL
IR
SP
25
Fig. 2.11
Tuberculosis and HIV
Population and Health
0
10
20
30
40
50
60
0 20 40 60 80 100 120
Nº HIV new infected cases/ year
Tu
berc
ulo
sis
(n
.º o
f cas
es
/ 1
05 i
nh
ab
.)
PT
FL
IRNL
SP
Fig. 2.12
GDP growth and employment
Economy
-2
-1
0
1
2
3
4
0 2 4 6 8
Average annual growth rate of GDP (88-98)
Av
era
ge
an
nu
al g
row
th r
ate
of
em
plo
ym
en
t (8
8 -
98
)
PT
NL
FL
IR
SP
Fig. 2.13
Economy
0
10
20
30
40
50
60
70
80
0 10 20 30 40 50
Competitiveness indicatir (according to IMD 2000,
considering 47 countries starting with the worst one)
GD
P/in
ha
b. a
s %
of
US
le
ve
l
PT
NL
FLIR
SP
26
Fig. 2.14
Participation Rate and Educational Achievement
Knowledge
0
5
10
15
20
25
30
35
0 20 40 60 80
% of population (15-64 years) with level >=3 (1996)
Pa
rtic
ipa
tio
n R
ate
(H
igh
er
Ed
.) f
or
18
-21
ye
ars
(1
99
6)
PT
PB
FL
IR
ES
Fig. 2.15
Study of English and Mathematics
Knowledge
440
450
460
470
480
490
500
510
520
530
540
550
0 20 40 60 80 100 120
% of students studying english in Basic/Secondary Education
Sc
ore
ac
hie
ve
d i
n I
nte
rna
tio
na
l
Ma
the
ma
tic
s T
es
t (T
IMS
, 1
3 y
ea
rs,
19
95
)
PT
NL
FL
IR
SP
*
* In this case, the foreign language is French
Fig. 2.16
RD Structure
Knowledge
0
10
20
30
40
50
60
70
80
0 0,5 1 1,5 2 2,5 3 3,5
RD as % of GDP
Pri
va
te %
of
RD
PT
PBFL
IR
ES
27
Fig. 2.17
Patents and Publications
Knowledge
0
20
40
60
80
100
120
140
0 10 20 30 40 50 60
Annual nº of patent request / 105 hab.
N.º
of
sc
ien
tifi
c p
ub
lic
ati
on
s /
105 h
ab
.
PT
NL
FL
IRSP
Fig. 2.18
Computers and E-Business
Knowledge
0
0,2
0,4
0,6
0,8
1
1,2
1,4
1,6
1,8
0 2 4 6 8
Expenditure in Information and Communication
Technologies (as % of GDP)
Nº
of
se
rve
rs w
ith
se
cu
rity
pro
tec
tio
n f
or
E-
Bu
sin
es
s/1
05 h
ab
.
PT
NL
FL
IR
SP
Fig. 2.19
Internet and Mobile Phones
Knowledge
0
20
40
60
80
100
120
0 10 20 30 40 50 60
N.º mobile phones / 100 inhab.
Nº
of
inte
rne
t s
erv
ice
s /
10
00
in
ha
.
PT
NL
FL
IRSP

28
Fig. 2.20
Investment on Technology and Infra-Structures (according to Schwab et al, 1999)
Knowledge
0
10
20
30
40
50
60
70
80
90
100
0 10 20 30 40 50 60
Infra-Structure
Te
cn
olo
gy
PT
NL
FLIR
SP
Fig. 2.21
COx and NOx
Environment
0
20
40
60
80
100
120
140
0 10 20 30 40 50 60
Nox (kg/inhab.)
Co
x k
g/in
ha
b.
PT
PB
FL
IR
ES
Fig. 2.22
Regional Development
0
10
20
30
40
50
60
70
80
90
100
0 0,2 0,4 0,6 0,8 1
Nº of Regions (A+B)* / Total of Regions
% P
op
ula
tio
n in
Re
gio
ns
(A
+B
)
PT
NLFL
IR
SP
* according to the classification by the European Commission, 1998.

29
All these analysis and the study of recent trends of these indicators can be synthetized by the following graph
displaying the areas where Portugal has achieved stronger advances but also those with an weaker position:
Expected life
Communications
Income per capita
Participation Rate and public RD
Qualification of Active Population
Productivity
Pollution impact of economic activity
Educational achievements
Competitiveness and technological effort (Private RD and
exports of High-Tec industries)
Economic use of new technologies (E-Business, etc)
Higher Advance
Weaker situation
Improvement
Stagnation
30
3. Which Future Scenarios?
“Men to to-day, to-morrow’s dust
when years have past where shall ye go?
What vulgar daub or hurried lust
Shall chronicle your joy and woe?
Wave on the crest of life’s swift sea
After to-day who’ll think of ye?”
Fernando Pessoa, 1904
31
3 WHICH FUTURE SCENARIOS?
3.1 EUROPE
The fast development of Portugal during last decades is strongly linked to the process of integration in the
European Union and therefore debating future scenarios for Portugal leads us inevitably to discuss the future of
Europe. And Europe is in a process of fast change, too.
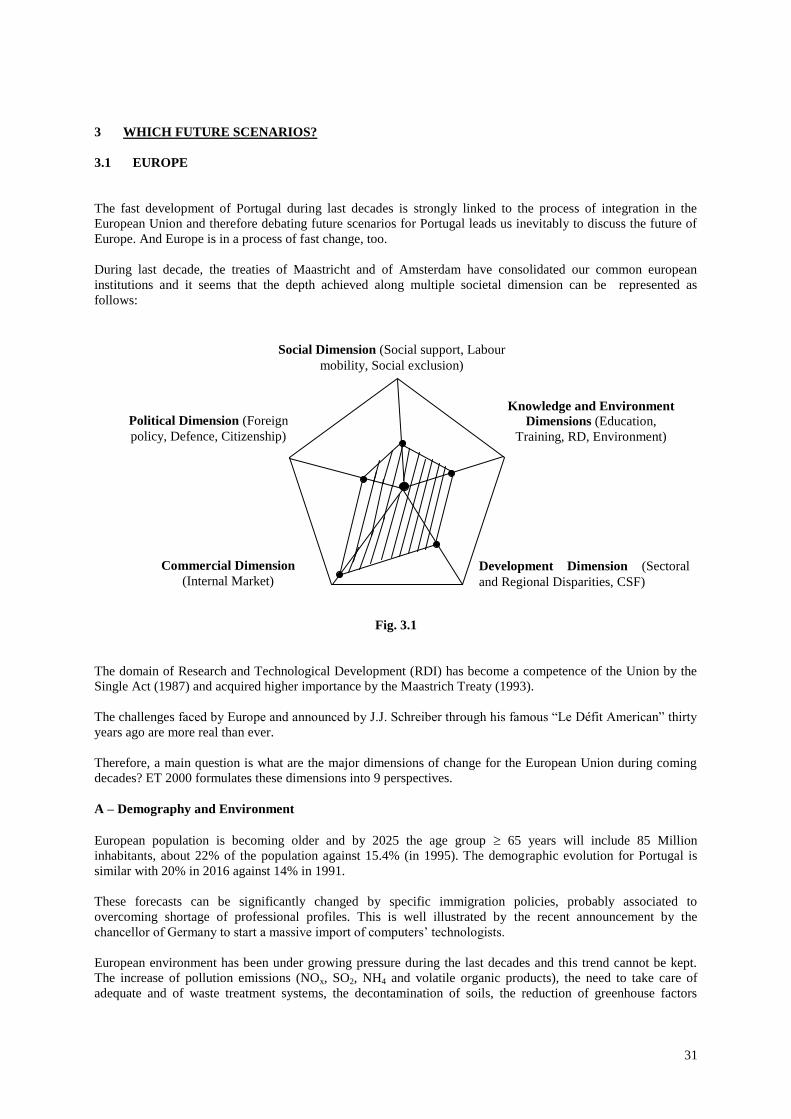
During last decade, the treaties of Maastricht and of Amsterdam have consolidated our common european
institutions and it seems that the depth achieved along multiple societal dimension can be represented as
follows:
Fig. 3.1
The domain of Research and Technological Development (RDI) has become a competence of the Union by the
Single Act (1987) and acquired higher importance by the Maastrich Treaty (1993).
The challenges faced by Europe and announced by J.J. Schreiber through his famous “Le Défit American” thirty
years ago are more real than ever.
Therefore, a main question is what are the major dimensions of change for the European Union during coming
decades? ET 2000 formulates these dimensions into 9 perspectives.
A – Demography and Environment
European population is becoming older and by 2025 the age group 65 years will include 85 Million
inhabitants, about 22% of the population against 15.4% (in 1995). The demographic evolution for Portugal is
similar with 20% in 2016 against 14% in 1991.
These forecasts can be significantly changed by specific immigration policies, probably associated to
overcoming shortage of professional profiles. This is well illustrated by the recent announcement by the
chancellor of Germany to start a massive import of computers’ technologists.
European environment has been under growing pressure during the last decades and this trend cannot be kept.
The increase of pollution emissions (NOx, SO2, NH4 and volatile organic products), the need to take care of
adequate and of waste treatment systems, the decontamination of soils, the reduction of greenhouse factors
Social Dimension (Social support, Labour
mobility, Social exclusion)
Knowledge and Environment
Dimensions (Education,
Training, RD, Environment)
Political Dimension (Foreign
policy, Defence, Citizenship)
Development Dimension (Sectoral
and Regional Disparities, CSF)
Commercial Dimension
(Internal Market)

32
(Kyoto agreement) will require a change of EU policies and huge investments higher than 3% of the european
annual GDP.
B –Enlargement of EU
After the Helsinki Council (Dec 99) the list of state candidates includes Bulgaria, Cyprus, Check Republic,
Estonia, Hungary, Latvia, Lithuania ,Malta, Poland, Romania, Slovenia, Slovakia and Turkey (European
Commission, 1999a). The treaty of Nice signed up early 2001 confirms the commitment to enlarge EU,
including the majority of candidates in a near future. However, the disparities of private consumption per capita
are quite significant as it is shown in Fig. 3.2 (in European Commission, 1999 b).
Private Consumption per capita (in PPP, US dol 1987)
Fig. 3.2
The EU experience of developing measures to strength internal cohesion following the inspired concept of
Structural Funds proposed by J. Delors has achieved reasonable success but it seems that the rate of real
convergence is slowing down: the convergence of GDP for the richest and poorest regions in EU has grown at an
annual rate of 2% during seventies, 1.3% during eighties and probably less during last decade (European
Commission, 1998). However, the degree of success is not uniform ranging from quite accomplished cases as
Ireland to stagnating examples in some regions of Southern Italy or Greece.
The enlargement will create new pressures for innovative and powerful instruments demanding a significant
increase of the cohesion budget.
C – Decisional Structure
The decisional structure of EU has to be adapted to its new composition and dimension. The Treaty of Nice is a
clear expression of this change but the degree of cohesion achieved by the new decisional systems is still
uncertain.
33
D – Global Competitiveness
The growing liberalization of the world trade, namely after the Seattle Conference of WTO, last year, will
require new policies in Europe which will be difficult to implement with a large fraction of the national income
allocated to the State (in Portugal, this percentage is already around 50%). Within EU, the acceptance of new
members (outside Euro region) will attract for these new regions low-salary industries and more traditional
activities. Therefore, countries at an intermediate level of development as it is the case of Portugal have to speed
up their commitment to focus on more advanced services and industries
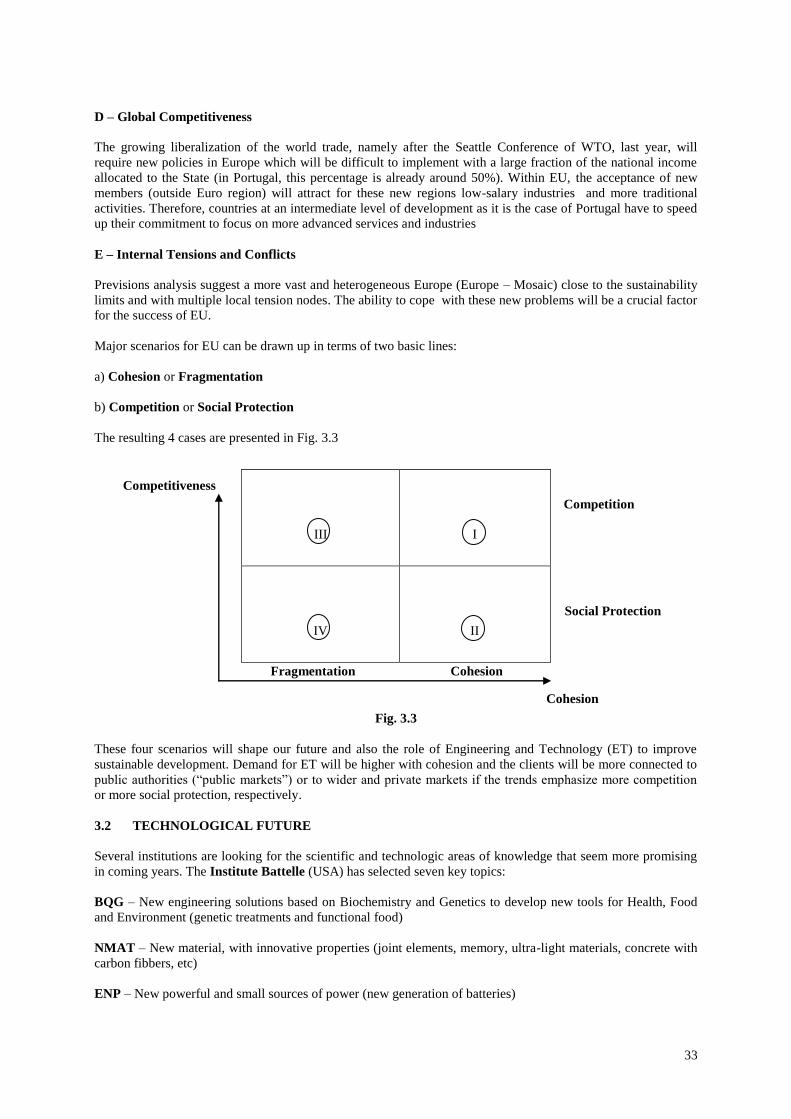
E – Internal Tensions and Conflicts
Previsions analysis suggest a more vast and heterogeneous Europe (Europe – Mosaic) close to the sustainability
limits and with multiple local tension nodes. The ability to cope with these new problems will be a crucial factor
for the success of EU.
Major scenarios for EU can be drawn up in terms of two basic lines:
a) Cohesion or Fragmentation
b) Competition or Social Protection
The resulting 4 cases are presented in Fig. 3.3
III
I
IV
II
Fig. 3.3
These four scenarios will shape our future and also the role of Engineering and Technology (ET) to improve
sustainable development. Demand for ET will be higher with cohesion and the clients will be more connected to
public authorities (“public markets”) or to wider and private markets if the trends emphasize more competition
or more social protection, respectively.
3.2 TECHNOLOGICAL FUTURE
Several institutions are looking for the scientific and technologic areas of knowledge that seem more promising
in coming years. The Institute Battelle (USA) has selected seven key topics:
BQG – New engineering solutions based on Biochemistry and Genetics to develop new tools for Health, Food
and Environment (genetic treatments and functional food)
NMAT – New material, with innovative properties (joint elements, memory, ultra-light materials, concrete with
carbon fibbers, etc)
ENP – New powerful and small sources of power (new generation of batteries)
Competitiveness
Fragmentation Cohesion
Cohesion
Social Protection
Competition
34
INF – New information and communication systems distributing computational power by common commodities
and networks (home systems, transportation controls, E-urban areas, etc.)
TRA – New cableless transmission systems (infra-red for industries, etc) and superconductors working at room
temperature
ERT – New integrated systems for environmental control and natural resources management (Sewage treatment
systems, water purification, industrial ecology, etc.)
NAN - Nanomachines (molecular tools)
The duration of the innovation cycles associated to these new achievements will condition strongly the
technological “landscape” of the next two decades.
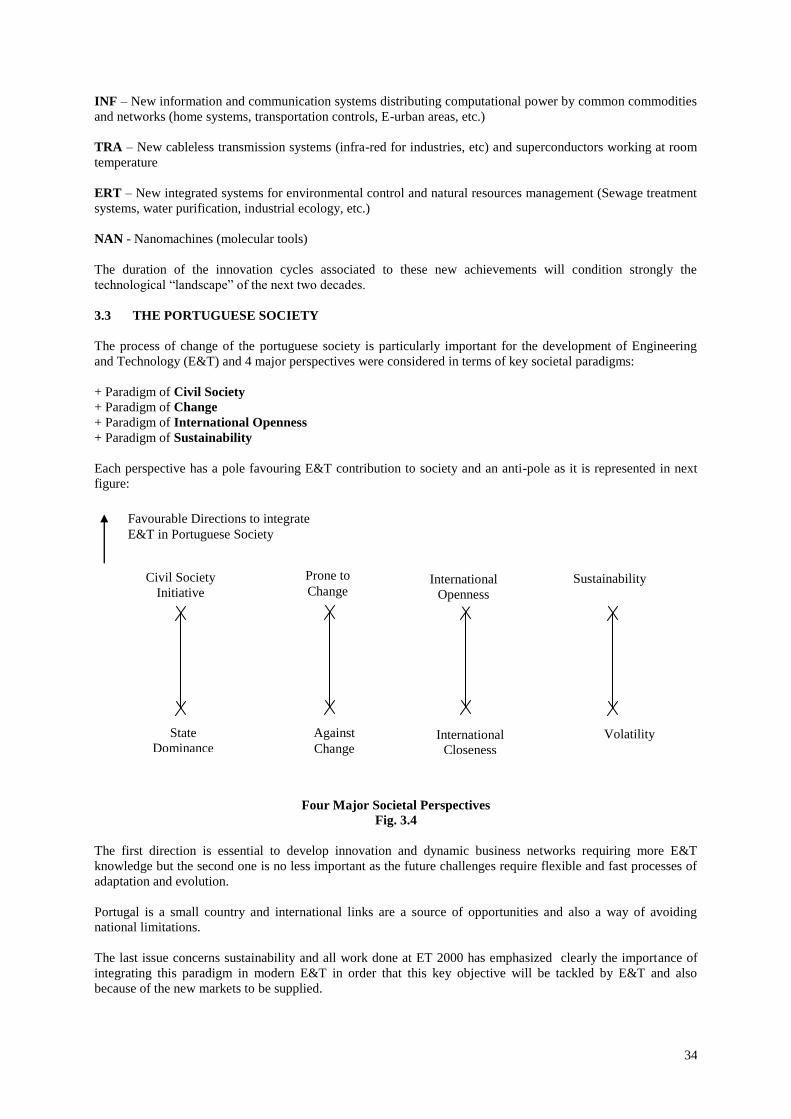
3.3 THE PORTUGUESE SOCIETY
The process of change of the portuguese society is particularly important for the development of Engineering
and Technology (E&T) and 4 major perspectives were considered in terms of key societal paradigms:
+ Paradigm of Civil Society
+ Paradigm of Change
+ Paradigm of International Openness
+ Paradigm of Sustainability
Each perspective has a pole favouring E&T contribution to society and an anti-pole as it is represented in next
figure:
Four Major Societal Perspectives
Fig. 3.4
The first direction is essential to develop innovation and dynamic business networks requiring more E&T
knowledge but the second one is no less important as the future challenges require flexible and fast processes of
adaptation and evolution.
Portugal is a small country and international links are a source of opportunities and also a way of avoiding
national limitations.
The last issue concerns sustainability and all work done at ET 2000 has emphasized clearly the importance of
integrating this paradigm in modern E&T in order that this key objective will be tackled by E&T and also
because of the new markets to be supplied.
Favourable Directions to integrate
E&T in Portuguese Society
Civil Society
Initiative
State
Dominance
Prone to
Change
Against
Change
International
Openness
International
Closeness
Sustainability
Volatility
35
Two alternative evolutions have been drawn and of course I will be much more favorable than II (Fig. 3.5).
Scenarios for Portugal
Fig. 3.5
Scenario I requires a strong effort to transfer to civil society a good deal of power and resources managed by the
State (First Paradigm) and this radical burst will have strong impacts on other dimensions.
The author has no doubts on the vital importance about these societal scenarios to shape the future of our country
and the use of E&T to boost competitiveness and development.
3.4 STUDIED SECTORS
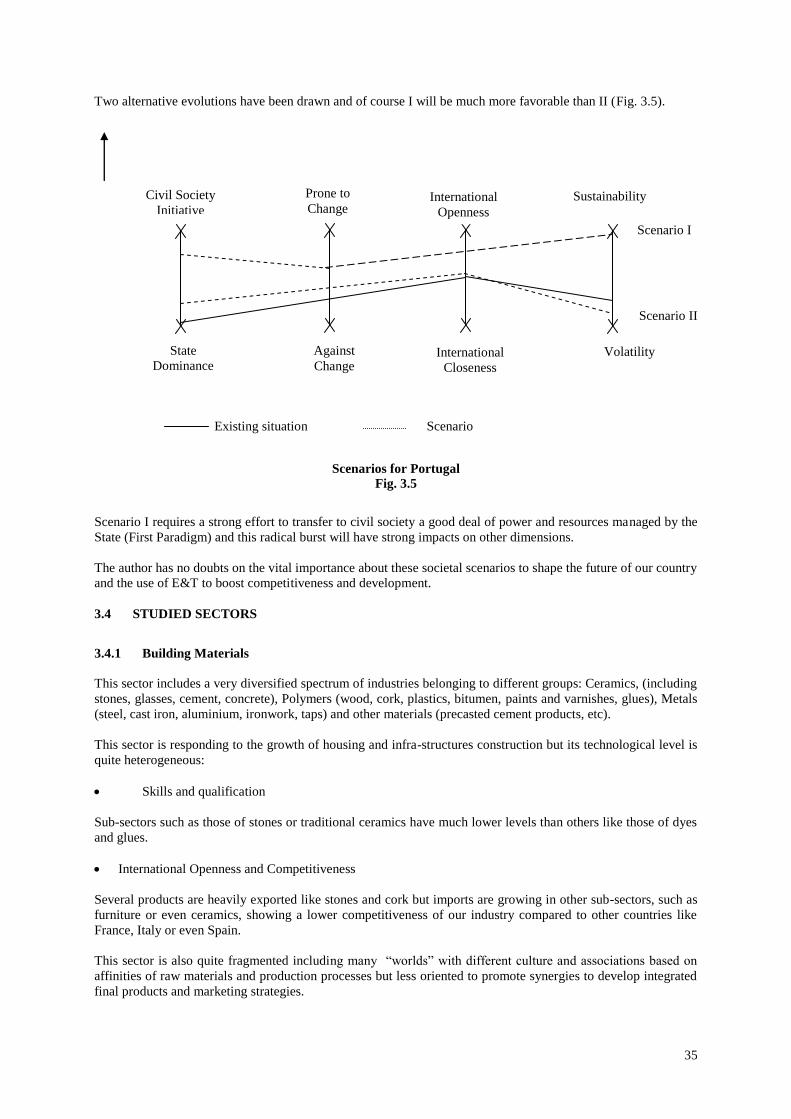
3.4.1 Building Materials
This sector includes a very diversified spectrum of industries belonging to different groups: Ceramics, (including
stones, glasses, cement, concrete), Polymers (wood, cork, plastics, bitumen, paints and varnishes, glues), Metals
(steel, cast iron, aluminium, ironwork, taps) and other materials (precasted cement products, etc).
This sector is responding to the growth of housing and infra-structures construction but its technological level is
quite heterogeneous:
Skills and qualification
Sub-sectors such as those of stones or traditional ceramics have much lower levels than others like those of dyes
and glues.
International Openness and Competitiveness
Several products are heavily exported like stones and cork but imports are growing in other sub-sectors, such as
furniture or even ceramics, showing a lower competitiveness of our industry compared to other countries like
France, Italy or even Spain.
This sector is also quite fragmented including many “worlds” with different culture and associations based on
affinities of raw materials and production processes but less oriented to promote synergies to develop integrated
final products and marketing strategies.
Civil Society
Initiative
State
Dominance
Prone to
Change
Against
Change
International
Openness
International
Closeness
Sustainability
Volatility
Scenario I
Scenario II
Existing situation Scenario

36
The foresight analysis recommends the following strategies:
- priority to increase competitiveness within EU
- development of product innovation integrating contributions from sub-sectors: from a “materials” culture
towards a “building solution” approach
- improvement of design and quality standards. This requires intensive training and new qualification
structures and centres
- reorientation of professional and business associations to stimulate new product and marketing cultures.
3.4.2 Construction
This is a major sector of portuguese economy accounting for about 7% of our GNP and a high multiplier effects
as it is estimated than each unit of revenue of this sector generates another 0.75 of revenues in other sectors.
Unfortunately, the level of qualification of most workforces is rather low and its actual size is undetermined as it
includes a significant number of illegal immigrants.
The following strategies can be recommended from the developed analysis:
- increasing the market segmentation for products and services;
- complementing major products with related services;
- achieving a significant increase of quality should be assessed by the final client rather than by the producers
themselves;
- hence, clients’ surveys and quality panels should be generalized, which is also a requirement of the new
standards for quality control;
- developing an integrated strategy to improve qualification and productivity not just in terms of technological
solutions but also using other contributions from Psychology and Industrial Sociology;
- supporting joint international developments associated to portuguese investment abroad (Environment,
Telecommunications, etc);
- promoting new markets like rehabilitation of housing and of structures;
- stimulating product and process innovation;
- contributing to the identity and dynamics of real estate sector;
3.4.3 Environment
This sector includes an wide variety is sub-systems such as water, soil, ecosystems, waste, urban environment
and noise.
These sub-sectors require a long list of skills and problem areas to be studied such as coastal or estuarine
protection, water supply and treatment, water or waste recycling, air quality control, emission reduction,
biodiversity and natural areas conservation, urban planning, green areas and urban equipment, noise monitoring
and control.
Several strategies were proposed:
- priority to the training of middle level technologists and specialized experts;
- development of management information systems to monitor environmental systems
- promotion of innovation, stimulating new clusters of SMEs developing synergies with other technologies
such as ICT, GIS, etc.
- partnerships between the State and private sector to coordinate the regional development of better solutions
without disturbing the development of nature markets
- strong investment in specific “niches” to achieve international competitiveness and to develop synergies
with portuguese investment in foreign countries
3.4.4 Energy
Portugal has a low final energy consumption per inhabitant ( 2 toes, tones of oil equivalent, 1996) against an
European average of 3.8. Our country has no oil or gas but hydroelectricity is a valuable resources and other
sources like wind can have a significant development in the future. Natural gas and mini-hydropower stations
are improving our national balance.

37
Three major strategic objectives should be considered:
I – Reduction of foreign dependency, increasing security and reliability
II – Increasing sectoral competitiveness
III – Improving environmental standards and fulfilling Kyoto objectives.
Several areas of development have to be pursued to achieve these objectives:
a) management of resources, I, III
b) rational use of energy, I, II, III
c) efficiency of the energy systems, I
d) competition and regulation, II
e) pollution emission, III
The following guidelines can be suggested:
- Promotion of a culture of competition and regulation
- Development of technological education and training for the most relevant areas
- Promotion of a culture of energy conservation, namely for designers and managers
- Monitoring prices and differentiating those technologies avoiding externalities related to pollution effects
(water, wind, etc).
- Promoting of RD oriented to increase the efficiency of energy use
- Promotion of co-generation and other clean technologies
- Supporting the use of natural gas in specific industries
- Supporting SMEs for better energy options
- Promotion of better energy options for large national projects
3.4.5 Food and Beverages
This sector accounts for about 3% of the total value of national industrial output and it is quite important not just
because this sector fulfils essential needs but also because it is rather stable across highs and lows of economic
cycles.
The following groups of products have to be considered:
- groceries
- dairy products
- frozen food
- canned
- hot beverages
- biscuits and sweets
- “charcuteries”
Four major strategies are proposed:
a) focusing products with a higher growth rate such as functional products and pre-prepared food
b) promotion of products innovation as a key condition for success through partnerships between
universities and corporations
c) developing horizontal and vertical integration of firms within the main processes of internationalisation
d) improvement of supply chains and other logistic conditions developing partnerships with agricultural
production
3.4.6 Electronics
The production of this sector corresponds to about 3.5% of GDP on 1998, employing 1% of the active
population. Major sub-sectors include machinery and industrial equipment, wires and cables, measuring
equipment, automation and control, telecommunication computers, electronic components, batteries, lamps and
other equipment, consumer electronics.

38
Most of the recent portuguese development was based on cables, electronic components and consumer
electronics using low qualified labour and suffering the challenge of other regions with lower salaries.
Several strategies should be pursued:
- transfer of technological know-how to improve our knowledge bases;
- increase of applied RD;
- searching for new market “niches” with promising trends in international markets;
- acquisitions or mergers increasing competitiveness;
- modernization of production processes;
- clustering of technological SMEs;
- Stimulation of innovation.
3.4.7 Metal and Plastic Production
This is a main component of portuguese industry accounting for ¼ of its firms and generating 15% of its GAV
(about 18% of total industrial employment). This sector includes basic metallurgy, metal products, machinery
and non-electric equipment, transportation equipment.
Unfortunately, the qualification level is low and competitiveness is limited. The following strategies are
suggested:
- Focusing four critical issues: environment, quality, security and maintenance
- Globalization and “crashing” supply chains
- Improving intangible factors for competitiveness such as innovation design, flexibility and post-sale services
- Priority to the training of technologist in the areas of measurement, digital operation and control.
3.4.8 Automobile Industry
This industry has grown recently through the development of the new VW factory, Auto Europa, and has
increased the total sales from 85 x 109 to 736 x 10
9 PTEs (1986 1998). This last development had a very
strong and positive impact on a large “palette” of industries due to a very well structured process of procurement.
The evaluation of sales is presented in the following graph.
Fig. 3.6
Facturação por Grupos de Actividade
(milhões de contos)
0
50
100
150
200
250
1992 1993 1994 1995 1996 1997 1998
Interiors
Engines
Electric Components
Structure
Buses
Pneumatics
Others (moulds,
tools, etc.)
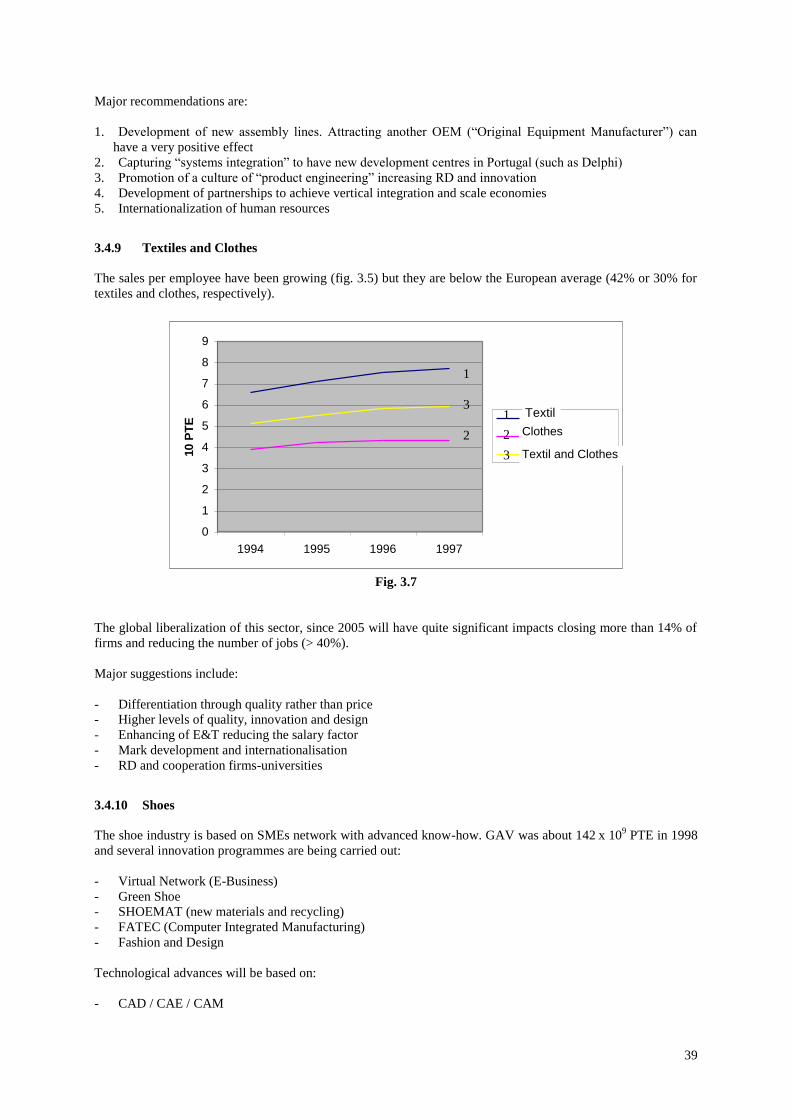
39
Major recommendations are:
1. Development of new assembly lines. Attracting another OEM (“Original Equipment Manufacturer”) can
have a very positive effect
2. Capturing “systems integration” to have new development centres in Portugal (such as Delphi)
3. Promotion of a culture of “product engineering” increasing RD and innovation
4. Development of partnerships to achieve vertical integration and scale economies
5. Internationalization of human resources
3.4.9 Textiles and Clothes
The sales per employee have been growing (fig. 3.5) but they are below the European average (42% or 30% for
textiles and clothes, respectively).
0
1
2
3
4
5
6
7
8
9
1994 1995 1996 1997
10 P
TE Têxtil
Vestuário
Têxtil e Vestuário
Textil
Clothes
Textil and Clothes
Fig. 3.7
The global liberalization of this sector, since 2005 will have quite significant impacts closing more than 14% of
firms and reducing the number of jobs (> 40%).
Major suggestions include:
- Differentiation through quality rather than price
- Higher levels of quality, innovation and design
- Enhancing of E&T reducing the salary factor
- Mark development and internationalisation
- RD and cooperation firms-universities
3.4.10 Shoes
The shoe industry is based on SMEs network with advanced know-how. GAV was about 142 x 10
9 PTE in 1998
and several innovation programmes are being carried out:
- Virtual Network (E-Business)
- Green Shoe
- SHOEMAT (new materials and recycling)
- FATEC (Computer Integrated Manufacturing)
- Fashion and Design
Technological advances will be based on:
- CAD / CAE / CAM
1
3
2
1
2
3

40
- Management and Logistic Systems
- Automation
- E-Business
- Telework
Recommendations include:
- Incentives to pursue policies of innovation and internationalisation
- RD and cooperation firms-universities
- Higher competitiveness through design, quality, environment and energy management, marketing and
security
- Clustering and training
3.4.11 Chemical Industry
The Chemical Industry includes the following sectors: inorganic products (industrial gases, bases, chlorine,
sulphuric acid, phosphoric acid, ammonia, hydrogen peroxide, soluble silicates, oxides and explosives); organic
products (basic organic chemicals, intermediary products and organic derivatives);
Fertilizers, agrochemicals and protection agents; synthetic resins and plastics; artificial as well as synthetic
fibbers; elastomers and rubber manufactured products; pharmaceutical industry; rosin derivatives; paints and
varnishes, surface active agents, soaps and detergents; glues, adhesives and sealants; essential oils, perfumes and
cosmetics, oils and fats for non-food application; diverse chemical production, crude refining, pulp and paper
industry, environmental related industries, food industry, glass industry, ceramic industry.
Chemical Industry generates a GAV of 109 x 109 PTE and employs around 27200 people (1998). Investment
exceeds 40 x 109 PTE. Chemical products are consumed by several sectors as it is shown in Fig. 3.8
Estrutura do consumo da Indústria Química na UE
28%
18%9%5%
15%
4%5%
8%8%
Consumo Final
Serviços
Agricultura
Construção
Outros
Papel
Automóvel
Têxtil e Vestuário
Metais, Engenharia mecânicae eléctrica
Chemical Industry
Fig. 3.8
This industry is capital RD intensive and includes 3 major clusters:
- Forest / paper’s pulp / cellulose products
- Chemical specialities, Biotechnology and Pharmaceutical Industry
Strategic areas for priority developments:
- Catalysis
- Process and Reactions’ Engineering
- Integration and optimisation of Industrial processes
- Recycling and reprocessing of effluents and sub products
- Bio technologic processes
Final Consumption
Services
Agriculture
Construction
Others
Paper
Automobile
Textiles and Clothes
Metals. Mechanical and
Electrical Engines
41
- Separation processes
New opportunities are being offered by the new accesses to areas of Matosinhos – Aveiro, Sines – Lisbon.
3.4.12 Transportation
This sector was subdivided into: rail, road, water and air.
On 1998, about 3.7% of the active population was working in this sector accounting for 3.4% of GDP. Final
consumption of energy was about 32.7% of the total.
Technological advances are requiring more standard solutions and much more sophisticated tools to manage and
to operate transportation and interface systems.
Globalization of markets for transportation equipment is advancing rapidly and extending also to controlling and
security systems.
Priority should be given to the development of national advanced know-how in areas where Portugal can achieve
high competitive levels.
Major opportunities are:
- Management Information Systems to provide flexible adjustment between demand and supply (B2C –
Business to Consumer)
- Optimization of coordination between suppliers (B2B – Business to Business)
- Optimization of multimodal paths for freight transportation subdivided into manageable packages (B2C with
special interactive control)
- Optimization of calendar and mode selection (B2B)
- Safety increase systems
- Development of innovation programs connected to important technological procurement carried out by
major operators
- Participation in international consortia to develop advanced networking and know-how
- Development of innovative added value services to improve final value offered to the consumer
3.4.13 Telecommunications
This is a fast growing sector including networks (public, cable, private and fixed access by radio), services (fixed
and mobile phones, data, internet, closed domain voice communication and satellites), audio text and radio
communication.
The market for fixed phones is stable but mobile phones and cables had a fast growth.
Major technological advances will have a strong impact:
- Wireless local access
- Cellular local access
- Satellite communication
- Voice and data (possibly, video) through electrical network
- Wireless cable (as a local satellite providing wide band services to a restricted area)
- Asymmetric digital subscriber line (technology using traditional pairs of copper cables of existing phones
lines to provide 8.5 M bits/s downstream and 64 –640 kbits/s upstream allowing asymmetric service like
internet and video-on-demand)
- GSM – phase 2 (to achieve levels of 768 Kbits/s)
- Universal Mobile Telecommunications Systems (UMTS) to provide wide band mobile communication until
2 Mbits/s, global roaming, etc.)
- Web TV platforms (Internet through TV using a set-top box)
- Cable Modems (high speed communications for clients of cable TVs achieving)
- Voice and fax over internet protocol
- HSCD – High speed circuit – switched data service (mobile phones until 56 Kbits/s)

42
- Frame-relay (for E-mail of corporations using heavy attachments)
- ISDN
Major trends are:
- Private or mobile voice operators will be licensed for fixed networks
- Internet providers will sell other services (data, TV, etc)
- Progressive internationalization of major players
The following strategies are suggested:
- Structuring market competition avoiding oligopolies or undesirable externalities
- Promotion of partnerships between major players to achieve critical mass for technological procurement,
innovation and applied RD
- To stimulate the development of intermediate and advanced training through specialization and post-
graduation initiatives envolving corporation and higher education institutions (this sector may be a good
example to develop a Corporate University)
3.4.14 Information Technologies
On 1998, the sales of this sector were area 230 x 109 PTE (about 1.2% of GDP) envolving 12 000 people and
2 000 firms. Nowadays, hardware accounts for just 45% instead of 80%, ten years ago. Services increased
exponentially jumping from 4% on 1990 to around 30% and software followed this trend.
Critical knowledge areas include:
- management of local and global networks
- software for integration of wideband systems with internet and UMTS
- tools based on Operational Research, Expert Systems, Neural Nets and Artificial Intelligence to support and
to develop decision and knowledge bases
- international and technological procurement and marketing skills
Major trends can be identified:
- Progressive integration of computers and communication networks
- Development of software on the web to search for information useful for decision making on real time
- Progressive use of datamining tools and Customer Relationship Management (CRM) to create and to
develop new businesses
- Generalization of operating systems and applications for LAN and WAN networks
- Voice and character identification and new voice-based operating systems
- Progressive interconnection between media, contents, communication and computers industries
- Driving needs coming from B2B B2C
- Progressive integration of chips in any common products with smaller dimension and higher performance
- Flexible integration of robots and man-machine intelligent systems for industrial and non-industrial domain
(home, environment, etc)
- Critical scarcity of qualified human resources
The following guidelines can be proposed:
- Public policies should be oriented to stimulate demand (public administration, etc) rather than disturbing
supply
- Supply support should be restricted to critical cases fighting against regional disparities or social exclusion
(special groups, handicapped people, etc)
- Our firms should innovative through the use of advanced integration and interface systems as well as
communication and management information systems
- Priority should be given to markets based on the portuguese language.
43
3.4.15 Geographical Information Systems (GIS)
On 1998, the Gross Added Value of GIS was around 139 x 109 PTEs and there has been a rapid expansion of
GIS in Engineering, Municipal and Environmental domains.
GIS can be a powerful infra-structure for the competitiveness of our economic activities, from Agriculture or
Forest to Real Estate or Industry.
Four types of GIS firms can be identified: agents of foreign software, consulting services, producers of GIS and
heavy users of GIS (engineering firms, public utilities, etc).
Several programs can be suggested such as:
- Support to clusters of portuguese SMEs to reach “global niches” through risk capital and a favourable
framework
- Promotion of partnerships and consortia, namely based on the iberic market
- Priority to non-tangible assets and training
- RD programs including firms and Higher Education institutions
- Modernization of public demonstration
Major suggestions are:
- consolidating national infra-structure of geographical information
- promotion of GIS for central and local administration
- completion of data bases with the axes of roads
- qualification of human resources
- RD programs with Higher Education, Administration and Firms
- Production and free-access concerning all relevant “public domain” information
3.4.16 Financial Services
There are significant changes in our financial sector: deregulation, competition, investment on human resources
and on Information and Communication Technologies.
In this last area, four stages can be identified: “systems centric” (64 81); “PC centric” (81 94); “network
centric” (94 05) and, hopefully, in the future, “contents centric (05 20)
Major Scenarios include:
I. Sectoral consolidation achieving european scale
II. Sectoral decomposition an higher role to be played by intermediate services, information providers,
dealers, etc.
III. Mixed scenario a composition of I and II
Strategies for the future should consider the following lines:
Enhancing the technological potential of Telecommunications, Computers, Software, Systems’ Engineering
and Operational Research, Financial Products Development, International Management;
Integration of multiple channels into the banking value chain;
Migration to lower cost channels;
Improvement of the operations’ scope;
Better use of infrastructures
Redesign of CRM and cooperation with non-competitive actors with comparative advantages for “network
centric” and “content centric models”.

44
3.4.17 Engineering Services
This sector includes more than 200 firms ( 5 employees) and a large number of liberal professionals. The
estimated GAV is about 50 x 109 PTE for firm ( 5 employees) and 20 x 10
9 PTE due to other activities (total
70 x 109 PTEs). About 20 x 10
9 PTE are due to project monitoring and control. Major products include planning
and design, project management, procurement, management and control, training and organization.
These outputs are distributed over more traditional sectors like housing and public works and also multiple
domains like industry, environment, leisure, etc.
New markets are blossoming such as environmental studies for golf fields, soundproof designs for multimedia
activities, security systems, rehabilitation, urban equipment and landscape, integration of communication
networks.
The productivity (annual GAV / worker 14 x 106 PTE) seems about 20 or 30% below international
competitors but a very advanced level of engineering know-how reputation explains a net surplus of our national
balance for this sector.
New trends can be identified:
- progressive liberalization of services, making using of E-Business to fulfill local needs by global providers
- higher integration of European public markets
- increasing importance being given to the quality requirements and options preferences judged by the final
clients rather than by the suppliers
- wider variety of technologies to be integrated in most Engineering Services
- increasing integration of Engineering Services with project finance and systems management
Major strategic considerations about the future include the following perspectives:
- Engineering Services will have an higher added value if integrating Information and Communication
Technologies as well as Systems Engineering with other disciplines
- Social and economic development requires new Engineering Services where planning and assessment studies
will be quite important
- Project revision, management and control will require stronger contributions from Engineering
- Monitoring and technical assistance concerning projects and works of public administration are a growing
market
- The need to balance specialization and multidisciplinarity suggests new partnerships or fusions between
firms to increase their level of competitiveness
- Successful strategies to compete in international markets will require new cooperative and specialization
models.

45
4. Strategies and Policies
“Genius alone can rouse the fire
That in your glorious nature lies”
Fernando Pessoa, 1904
46
4 STRATEGIES AND POLICIES
4.1 ENVIRONMENT AND INNOVATION
Although pollution indicators for Portugal tend to be lower than for other European countries due to the smaller
industrial output, three perspectives deserve special concern:
- pollution control has been focusing “end of the chain” treatments with negative environmental impacts (e.g.,
co-incineration, waste landfills, etc)
- low efficient use of energy increasing greenhouse effect
- agricultural production too much based on chemical products
Therefore, several strategic lines should be pursued:
- implementation of the industrial ecology approach, considering the whole product cycle and a new
environmental solutions right from the initial stage of industrial product conception;
- the increase use of natural gas and wind energy can improve significantly present situation. New
technological advances such as hydrogen energy cells may reduce the high pollution effect of cars and trucks
before 2020;
- The organization of services to provide efficiency solutions (for instance, treatment of fields for agricultural
production instead of the conventional sales of fertilizers) can change objective functions for such providers,
attempting to achieve economic solutions instead of the maximization of product sales.
These new strategies illustrate the need to develop a society frame to conceive and to implement innovation.
This requires stability and continuity of policies to provide a stable framework for market economy forces but
also new policies to integrate the support to the growth of human capital and to the generation of innovation as
an integrated cycle (conception, assessment, risk capital, development and marketing). These new policies have
to contribute not just to the appropriate physical infra-structuring but also to a legal and commercial framework
favouring flexible, fast and non-bureaucratic procedures.
4.2 COMPETITIVENESS AND KNOWLEDGE
The concept of competitiveness has a central importance within ET 2000 and it has been a main source of
concern during the discussion held by the panels.
The traditional definition applies to firms showing stable and profitable performances but recently it has been
extended to regions or countries where “clusters of local firms” are considered as engines of competitiveness
(Porter, 1990). The measurement of competitiveness has been studied beyond the usual balance revenues –
expenses through parametric models assessing the total value of outputs in terms of the best available
experiences for a similar level of inputs (Oral, 1993):
*jj
jj
where is the achieved level of efficiency and
j weight for output j
j or *j level of output j for existing system or for the most efficient system, respectively.
Data Envelopment Analysis – DEA (see, e.g., Charnes and Cooper, 1978, Sexton, 1986) and non-linear
optimisation methods (Tavares and Correia, 1999 and Antunes and Tavares, 2000) have been used to apply and
to generalize this formulation.
Stronger criticisms have been raised to the application of the concept of competitiveness to regions or countries
(Krugman, 1994b) and the Porter’s assumption that clusters of “local firms” are the key for success in the
competitiveness battle has been hardly proved in many regions where multinational corporations play a no less
important role.
47
According to the general approach of ET2000, competitiveness is an useful concept to formulate the balance
between the value given by markets to our goods or services and the cost of all required inputs
Major policies to improve this balance can rely on:
- product segmentation and innovation
- search for markets giving better appreciation to out products
- improvement of the supply chain to reduce inputs cost
- reengineering and streamlining of the production process increasing efficiency, reliability, cost and quality
control, time span.
Of course, multiple public policies can contribute to a social and economic environment more prone to
competitiveness.
The pace for a more integrated and competitive economy seems a clear political objective for the European
Union, as it was expressed by the Lisbon Council, but criticisms have been raised about the lack of reforms by
European Governments (European Round Table of Industrialists, Financial Times, 20Mar, 01). The comparative
analysis of national structural policies to boost competitiveness (structural reforms) has been studied by
independent institutions but Portugal fails to get a good relative score.
- Knowledge
Knowledge is the main source of economic growth (according to IPTS, more than 70% can be explained by
creation and by a better use of knowledge, European Commission, 1999a) and the European Union has strong as
well as weak areas of compared to US and Japan
Strong and Weak Areas for EU
Strong Areas Weak Areas
Software Visual Interfaces
Mobile phones Chips
Sensors Automation
Consumer electronics Biotechnology
Digital TV Photovoltaic systems
Pharmaceutics Batteries
Energy New ceramic materials
Waste recycling
Telematics
Multiple indicators have been proposed to describe human capital but it seems they tend to be strongly correlated
with:
a) Percentage of population (20-64 years) having completed upper secondary education, at least (Tavares,
1994 and 1995) In fig. 4.2 the comparison of Portugal with other OECD countries is presented.
b) Number of scientific and technologic publications per capita (Data Bases (Compumath” and “Science
Citation Index”) and number of patents per capita.
The European Commission (European Commission, 1998) has classified EU regions in terms of GDP / capita, nº
of patents / capita and nº of scientific publications / capita.
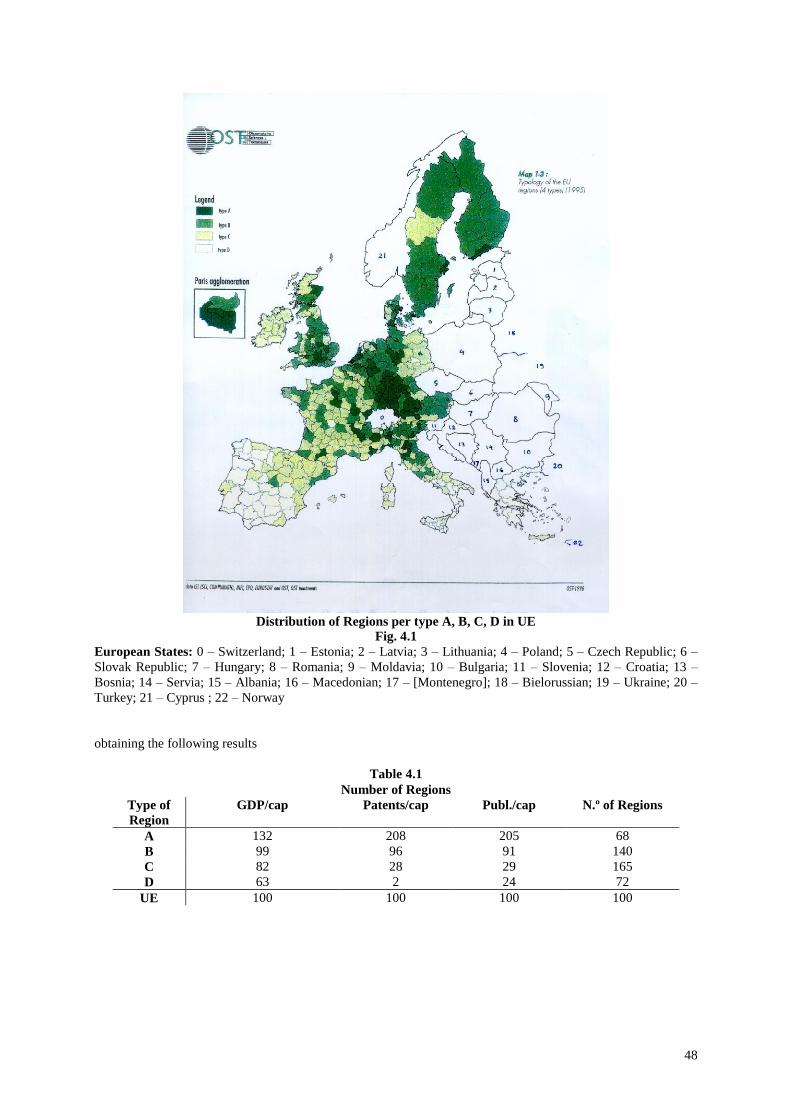
48
Distribution of Regions per type A, B, C, D in UE
Fig. 4.1
European States: 0 – Switzerland; 1 – Estonia; 2 – Latvia; 3 – Lithuania; 4 – Poland; 5 – Czech Republic; 6 –
Slovak Republic; 7 – Hungary; 8 – Romania; 9 – Moldavia; 10 – Bulgaria; 11 – Slovenia; 12 – Croatia; 13 –
Bosnia; 14 – Servia; 15 – Albania; 16 – Macedonian; 17 – [Montenegro]; 18 – Bielorussian; 19 – Ukraine; 20 –
Turkey; 21 – Cyprus ; 22 – Norway
obtaining the following results
Table 4.1
Number of Regions
Type of
Region
GDP/cap Patents/cap Publ./cap N.º of Regions
A 132 208 205 68
B 99 96 91 140
C 82 28 29 165
D 63 2 24 72
UE 100 100 100 100

49
Table 4.2
State A B C D Total
France 13 27 54 3 97
Germany 16 14 7 1 38
United Kingdom 13 36 16 0 65
Italy 11 25 41 26 103
Netherlands 4 6 2 0 12
Spain 0 3 24 25 52
Belgium 2 6 3 0 11
Luxembourg 0 1 0 0 1
Denmark 4 7 4 0 15
Greece 0 0 2 11 13
Portugal 0 0 1 6 7
Ireland 0 1 7 0 8
Austria 3 4 2 0 9
Sweden 1 6 1 0 8
Finland 1 4 1 0 6
Total 68 140 165 72 445
This comparison shows not just Portugal situation but also that knowledge disparities are much higher than
economic ones as the ratio between advanced and depressed regions is equal to 132/63; 208/2; 205/24 for GDP,
patents and publications, respectively. This analysis supports the strategic goal of developing more regions of
type B and C for Portugal during next decades.
4.3 KNOWLEDGE AND COMPETITIVENESS FOR THE 17 STUDIED SECTORS
According to ET 2000 methodology, a detailed analysis was carried out for each sector with the purpose of:
- identifying major “products”. This is a non trivial analysis and such taxonomy for each sector was found a
very useful analytical too. Commercialization and Marketing was added up to each list as deserves special
attention in modern business.
- estimating the impact matrix expressing how much relevant is each area of knowledge to each product. The
adopted scores were:
0 – No impact
1 – Small impact
2 – High impact
3 – Very High Impact
These matrices were estimated, through panels’ discussions and surveys.
The synthetic results are presented in the following table using the following notation:
Areas Sectors
Process Technologies (PR) Building Materials (BM)
Biotechnology (BT) Construction (CT)
Materials (MT) Environment (EV)
Discrete Production (DP) Energy (EN)
Energy (EN) Food Industry (FI)
Opto – Electronics (OE) Electronics (EL)
Communication and Information Technologies (CIT) Metal and Plastic Products and Manufacturing (MP)
Systems Engineering (SE) Automobile Industry (AI)
Infra-Structuring and Construction (ISC) Textiles (TX)
Environmental Technologies (ET) Shoes Industry (SI)
Transportation Technologies (TT) Chemistry (CH),
Transportation and Distribution (TD)
Telecommunications (TL),
Information Technologies (IT)
Financial Services (FS)
Engineering Services (ES)
GIS
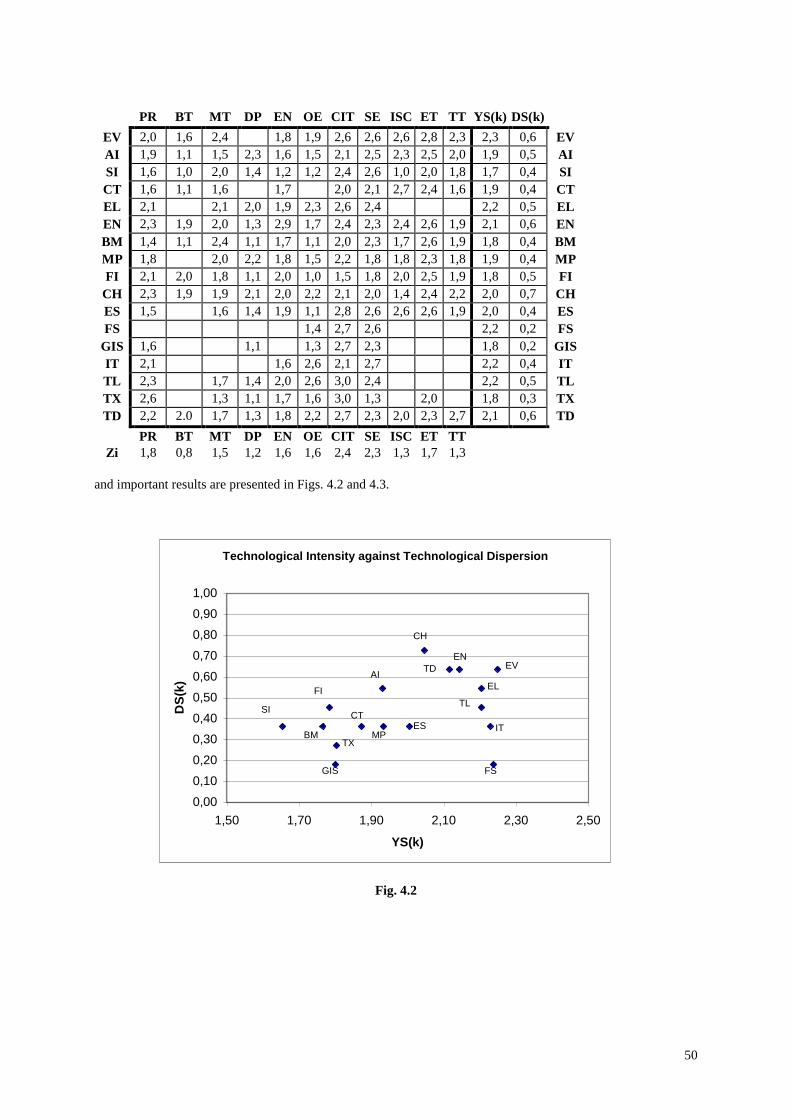
50
PR BT MT DP EN OE CIT SE ISC ET TT YS(k) DS(k)
EV 2,0 1,6 2,4 1,8 1,9 2,6 2,6 2,6 2,8 2,3 2,3 0,6 EV
AI 1,9 1,1 1,5 2,3 1,6 1,5 2,1 2,5 2,3 2,5 2,0 1,9 0,5 AI
SI 1,6 1,0 2,0 1,4 1,2 1,2 2,4 2,6 1,0 2,0 1,8 1,7 0,4 SI
CT 1,6 1,1 1,6 1,7 2,0 2,1 2,7 2,4 1,6 1,9 0,4 CT
EL 2,1 2,1 2,0 1,9 2,3 2,6 2,4 2,2 0,5 EL
EN 2,3 1,9 2,0 1,3 2,9 1,7 2,4 2,3 2,4 2,6 1,9 2,1 0,6 EN
BM 1,4 1,1 2,4 1,1 1,7 1,1 2,0 2,3 1,7 2,6 1,9 1,8 0,4 BM
MP 1,8 2,0 2,2 1,8 1,5 2,2 1,8 1,8 2,3 1,8 1,9 0,4 MP
FI 2,1 2,0 1,8 1,1 2,0 1,0 1,5 1,8 2,0 2,5 1,9 1,8 0,5 FI
CH 2,3 1,9 1,9 2,1 2,0 2,2 2,1 2,0 1,4 2,4 2,2 2,0 0,7 CH
ES 1,5 1,6 1,4 1,9 1,1 2,8 2,6 2,6 2,6 1,9 2,0 0,4 ES
FS 1,4 2,7 2,6 2,2 0,2 FS
GIS 1,6 1,1 1,3 2,7 2,3 1,8 0,2 GIS
IT 2,1 1,6 2,6 2,1 2,7 2,2 0,4 IT
TL 2,3 1,7 1,4 2,0 2,6 3,0 2,4 2,2 0,5 TL
TX 2,6 1,3 1,1 1,7 1,6 3,0 1,3 2,0 1,8 0,3 TX
TD 2,2 2.0 1,7 1,3 1,8 2,2 2,7 2,3 2,0 2,3 2,7 2,1 0,6 TD
PR BT MT DP EN OE CIT SE ISC ET TT
Zi 1,8 0,8 1,5 1,2 1,6 1,6 2,4 2,3 1,3 1,7 1,3
and important results are presented in Figs. 4.2 and 4.3.
Fig. 4.2
Technological Intensity against Technological Dispersion
0,00
0,10
0,20
0,30
0,40
0,50
0,60
0,70
0,80
0,90
1,00
1,50 1,70 1,90 2,10 2,30 2,50
YS(k)
DS
(k)
BM
SI
FI
TX
GIS
CT
MP
AI
ES
CH
TD
ENEV
FS
IT
TL
EL

51
0,000%
0,100%
0,200%
0,300%
0,400%
0,500%
0,600%
0,700%
0,800%
-0,01 -0,005 0 0,005 0,01 0,015 0,02
Net Import of Knowledge
Net
Pro
du
cti
on
of
Kn
ow
led
ge
EL
IT
FS
CHMP
TL
EV
EN
TD
FI
ES
TX
SI
CON
BM
AI
HIGH
LOW
TECHNOLOGICAL INTENSITY
Technology Intensity
Fig. 4.3
Several strategic conclusions can be drawn up:
- The contribution of E&T areas for the competitiveness of sector’s activities is clearly presented showing how
these areas are important for such development. Of course, other contributions could be foreseen if other
clusters of business activities would be launched. This is particularly true for the case of Biotechnology if a
cluster of new firms connected to pharmaceuticals or health will start up.
- There are three major groups areas in terms of their impact and relevance:
Group A : CIT, SE and PR
(Zi 1.75)
Group B: ET, EN, OE, MT, ISC, TT
(1.25 Zi <1.75)
Group C: DP, BT
(Zi < 1.25)
The first group includes nor just well known information and Communication Technologies but also Systems
Engineering and Process Engineering quite essential to the reengineering of our firms.
The third group includes technologies more oriented to a different type of manufacturing (DP) or to a new
cluster of firms not yet existing (BT)
- The intensity and dispersion analysis shows the different relative position of sectors:

52
High
AI
CH, EV,
EL, EN,
TD
Low
SI, CT
BM, MP
FI, GIS
TX
ES, FS,
IT, TL
where
- traditional industries and sectors with “easy” technologies (SIG)
- High added value services
- more complex industries with a high services component (namely, EV and EN)
This means that, nowadays, Services are no less technological than Industries but that they are more
concentrated on a short “palette” of technologies (not just information and communication technologies).
These results can be crossed with the previous sector analysis in terms of net import and production of
knowledge:
The following strategic conclusions can be drawn up:
a) Engineering and Technology should focus on Services as they all come with high technological
intensity
b) High intensity sectors are spread over three distinct groups:
- equilibrium between production and import of knowledge
- ES and AMB as main knowledge exporters
- EL with much stronger production than import of knowledge
- The axe FS TD EN TL CH IT with a growing import of knowledge seems to indicate
potential markets for E&T
- EL seems to be close to a net exporter if additional effort is allocated to this sector
- Just three sectors show an high technological intensity but a very low import and production of
knowledge: FS, TD, EN
All these results contain specific strategic suggestion to improve the incorporation of E&T in the development of
the 17 studied sectors.
4.4 A STRATEGIC VISION FOR ENGINEERING AND TECHNOLOGY IN PORTUGAL
4.4.1 Conditions
The previous analysis show that there are two major conditioning factor for the development of E&T in Portugal.
Lack of Social Image
The national heritage of E&T in Portugal is particularly high and more developed than it could be expected
given the size of the country. A clear confirmation is the quite high ability of Engineering Services to export
expertise worldwide in very competitive markets.
0.5
2.0 Average High
Dispersion
Intensity

53
Still, social image of E&T does not represent this high value of knowledge and the promising future of many
professional profiles. Media tend to focus E&T if a disaster or a negative impact was generated by a project
either on environment or on urban and rural lives.
The political power has been emphasizing other areas of competence and young people are not exposed to the
world of E&T in Basic and Secondary Education.
Mathematics and Physics teaching is a barrier for these vocations and basic technological subjects like
Information are not widespread offered even for those selecting E&T.
The shortage of human resource is now a critical factor for E&T but it will increase dramatically in a near future.
Know – how changes
This project has identified a large and prestigious body of national knowledge in E&T but also the types of
knowledge with a strongest and a weakest score:
Intensity Knowledge Function
++ Planning and Assessment
+ Procurement
++++ Conception and Design
+++ Production
++ Integration and Management
++ Maintenance
+ Rehabilitation
+ Operation and Training
This analysis helps understanding why those sectors where design or production engineering is more important
receive a high contribution from our E&T (CH, EV, EL, EN, ES, FS, IT, TL, TD) but others where procurement,
integration and management have a dominant importance are receiving less important contributions. The
growing importance of these new types of knowledge is quite obvious and sectors as telecommunications show a
fast change of needs from switchboard design, no longer taking place in Portugal, to vast and complex processes
of know-how transfer, technologies integration and procurement.
4.4.2 Guidelines
Six major strategic lines should be pursued:
I – Social Image, Human Resources, Qualification
Social image of E&T should be improved emphasizing their essential contribution to development, to
environment, to quality of life and to job opportunities during the next two decades.
The educational and training systems should be transformed to expose young people to E&T professional
opportunities and to develop advanced and specialized know-how at several levels, namely at the intermediate
level (herein called “specialization diploma” and equivalent to the UK certificate level or the US associate
degree). Those types of knowledge with lower scores should receive an higher priority.
II – Systems Engineering, Information and Communication Technologies, Process Technologies
All these areas have deserved top priority from our assessments and they should be developed using an inter-
disciplinary problem – oriented approach. Their application to all Services, to modern manufacturing and to
enable our firms to profit new opportunities such as E-Business should be considered as national priorities.
III – New Opportunities: Environment, Natural Resources, Energy, Internationalization, Rehabilitation
New societal challenges are creating new and wide markets for E&T:

54
a) Environment, Natural Resources, Energy
The shift from a polluting industry to new types of activities under an industrial ecological conception and the
development of a clean urban environment require huge investments using E&T intensively.
Natural resources, namely, water, marine, forest and agricultural resources require E&T not just to build infra-
structures but also to develop better information, integration, operation and control systems. Shortage of
databases and information systems can become quite critical to move along more ambitious objectives.
The expansion of the natural gas network and of new sources of energy (namely, water and wind) are promising
perspectives for a cleaner future with less oil dependence.
The modernization of trucks and cars as well as the development of railways are key instruments to reduce oil
dependence and roads pollution.
b) Internationalization
Globalization may be an important opportunity but several policies should be pursued:
Higher incorporation of E&T in processes of portuguese investment abroad (water, communication,
distribution, etc)
Higher contribution from multinational firms developing activities in Portugal to our innovation and RD
systems
Intensive participation of portuguese know-how in European consortia, in new priority domains of ERA
(European Research Area) and new projects (6th
Framework Programme)
c) Rehabilitation
An wide spectrum of domains from Housing and Transportation to Industrial infra-structures is requiring and
will require heavier investments on rehabilitation, demanding specialized E&T know-how and firms.
The liberalization of housing rents will create an immediate demand for these skills as housing rehabilitation in
Portugal has a much lower importance than in most European countries.
IV – Innovation, Quality, Procurement and Marketing
The innovation cycle requires a favourable legal environment as well as integrated support to full development
of new products and services. New policies should be adopted with this purpose and to support innovation
initiatives per sector (transportation, communications, etc).
The development of final products is a key condition for success in modern industry.
Technological Procurement can play a dominant rule to stimulate innovative solutions and better E&T
contributions as the State is a main buyer for infra-structures, equipment and services. Special structures should
be adopted for new important projects (acquisition of military equipment, development of a new airport, TGV,
etc) following examples of good practices as it was the case of Auto Europa factory.
V – Cost Reduction
Most managers and firms are pressing E&T to help them through the development of a lower cost solution
without quality decreasing.
This is particularly true for six types of cost:
- Information
- Energy
- Mobility
- Telecommunications
- Space
55
- Bureaucracy
VI – Research, Development and Technological Options
RD budget and its component due to the private sector should increase. Setting up priorities and developing a
problem oriented interdisciplinary approach to RD is essential to increase national E&T know-how and to give a
better contribution to promising economic sectors. Participation in and support to problem – oriented programs
will be consistent with present strategy of EU.
RD effort of Defence should increase and make a better use of synergies with RD of civilian areas and with the
negotiation of compensation schemes for important public acquisitions.
4.5 PROPOSALS
Six initiatives can be now proposed
Initiative I
Social Image of Engineering and Technology
Action I-1
OBJECTIVE: Identification of major contributions of E&T the development of Portugal during last
decades
DESCRIPTION: Production of a catalogue with major achievements
ACTORS: Academy of Engineering, Society of Engineers, National Laboratories and Business
Associations
Action I-2
OBJECTIVE: Integration of E&T within the image of Portugal for foreign countries
DESCRIPTION: Inclusion of E&T achievements in all material produced to promote Portugal in foreign
markets
ACTORS: Instituto de Comércio Externo - ICEP, Instituto de Apoio às Pequenas e Médias Empresas - IAPMEI,
Fundação de Ciência e Tecnologia - FCT, Business Associations.
Action I-3
OBJECTIVE: Promotion of Technology and Experimentation in Basic and Secondary Education
DESCRIPTION: Inclusion of technologies and experimental classes in Basic and Secondary Education.
Teaching Informatics should become compulsory. Presentation of job profiles and labour
expectation for E&T.
ACTORS: Ministry of Education, Ministry of Science and Technology, Ministry of Labour and Solidarity
Initiative II
Education and Training for Engineering and Technology
Action II-1
OBJECTIVE: Development of 1.5 – 2 years programmes for students completing secondary education in
technological specific areas and awarding the Diploma of Specialization

56
DESCRIPTION: These programs can be carried out by higher education institutions but their curriculum
development should deserve special attention considering foreign experiences such as the
certificate level at UK, courses offered by the Institutes Universitaires de Technologie – IUT in
France, Associate degrees in USA. A list of priorities areas is included in (Tavares, 2000).
ACTORS: Ministries of Education, of Economy and Higher Education Institutions
Action II-2
OBJECTIVE: Promotion of Master and Doctoral programmes for Industry and Services (Technology,
Master and Doctoral Degrees)
DESCRIPTION: Development of programs focusing specific needs of Industries and Services and based on
University – Business networks, inclusion of training periods and of colleagues from outside
Universities to co-coordinate and to assess these activities.
ACTORS: FCT, IAPMEI, Agência de Inovação - ADI, Higher Education Institutions, National Laboratories,
Business Associations and Corporations.
Action II-3
OBJECTIVE: National Debate about Education in Engineering and Technology
DESCRIPTION: Organization of a National Conference on this subject based on previous work carried out by
specialized groups.
ACTORS: Academy of Engineering, Society of Engineers, Ministries of Education, of Science and
Technology, of Economy, Higher Education Institutions.
Initiative III
Research and Development
Action III-1
OBJECTIVE: Development of Inter-disciplinary Programmes focusing sectoral priorities or large national
projects
DESCRIPTION: Setting up these new RD programmes evolving institutions outside Universities and
representing the stakeholders and the main players of sectors or projectors. These partnerships
should be stable, from 3 to 9 years.
Those sectors with a stronger interest on these initiatives include EV, TD, GIS, IT, TX, SI, AI,
EL, MP, EN.
ACTORS: Ministries of Science and Technology, of Economics and of different sectors
Action III-2
OBJECTIVES: Mobility of PhDs between Higher Education Institutions, Corporations and
Administration
DESCRIPTION: Organization of programmes stimulating mobility of PhDs for periods from 1 to 5 years
helping to develop RD in corporations and to renovate RD agendas in universities.
ACTORS: FCT, IAPMEI, Higher Education Institutions, National Laboratories, ADI.

57
Action III-3
OBJECTIVES: Capital Fund to support Patents’ Registration and Commercialization of rights, marks and
patents.
DESCRIPTION: Development of a fund to support the registration and the commercialization of rights, marks
and patents.
ACTORS: Instituto Nacional da Propriedade Intelectual - INPI, IAPMEI, Instituto Nacional de
Engenharia e Tecnologia Industrial - INETI, Instituto das Participações do Estudo - IPE.
Initiative IV
Procurement of Innovation and Technology
Action IV-1
OBJECTIVE: Innovation Procurement
DESCRIPTION: Identification of major needs for innovation (solutions, ,products, processes) in several sectors
and large projects. Organization of public competitions and tenders. Support to compensation
schemes for large acquisitions in foreign countries.
ACTORS: Ministries of Social Equipment, Economy, Planning, Science and Technology, ADI, IAPMEI.
Action IV-2
OBJECTIVE: Technology Public Procurement
DESCRIPTION: Identification of major public acquisitions of technological goods and services and organization
of accreditation and certification schemes. E-trade.
Development of a Bank for Compensation Schemes.
ACTORS: IAPMEI, National Laboratories, Business Associations, Sectoral Ministries.
Initiative V
Partnership Networking, Centres of Competence and Continuous Training
Action V-1
OBJECTIVE: Assessment and Development of Partnership Networks
DESCRIPTION: Assessment of existing centres and selection of the most qualified ones to promote the
clustering of firms and of other institutions.
ACTORS: IAPMEI, National Laboratories, Higher Education Institutes, Business Associations.
Action V-2
OBJECTIVE: Corporate Technological University – E-Learning
DESCRIPTION: Organization of E-Learning and other flexible education and training activities based on a
partnership between public and private institutions.
ACTORS: INETI, IAPMEI, Higher Education Institutions, Business Associations.
Action V-3
OBJECTIVE: Human Capital Network of ET 2000
58
DESCRIPTION: Generation of added-value contributions through the developed network of ET 2000.
Initiative VI
Reduction of External Costs for Corporations
Action VI-1
OBJECTIVE: Reduction of Information Costs
DESCRIPTION: Application of the principles expressed in the Green Book for Information Society. The State
should produce free information, information for development and added value information
under free of charge, production’s cost charge or added value price, respectively.
ACTORS: Ministry of Planning, Instituto Nacional de Estatística – INE and other offices of public
administration.
Action VI-2
OBJECTIVES: Reduction of Energy Costs
DESCRIPTION: Multiannual contracts for price reduction of energy and intelligent management of energy
(active and passive systems).
Actors: Ministries of Economy, Environment and Land, National Laboratories, Regulation Institutes, Higher
Education Institutions.
Action VI-3
OBJECTIVES: Reduction of Mobility Costs
DESCRIPTION: Multiannual contracts to reduce mobility costs, helping to streamline multimodal interfaces and
logistic chains. Use of E-Business.
ACTORS: Ministries of Social Equipment, Economy, Regulation Institutes, National Laboratories, Higher
Education Institutes.
Action VI-4
OBJECTIVES: Reduction of Communication Costs
DESCRIPTION: Multi-annual contracts to reduce image, voice and data communication costs, particularly in
terms of internet, videoconferencing and E-Business.
ACTORS: Ministries of Social Equipment, Economy, Regulation Institutes, National Laboratories and Higher
Education Institutions.
Action VI-5
OBJECTIVES: Reduction of Space Costs.
DESCRIPTION: Promotion of land planning helping to develop technology parks and industrial areas with a
high quality of access.
ACTORS: Ministries of Environment, and Land Planning, Social Equipment and Municipalities.

59
Action VI-6
OBJECTIVES: Reduction of Bureaucracy Cost
DESCRIPTION: Bureaucratic simplification, particularly for the links between firms and Administration as well
as for public tenders.
ACTORS: Ministries of Economy, Social Equipment, Justice.

60
4.6 FINAL WORDS
Physical Capital and Natural Resources were considered as key factors for development by most authors of the
Theory of Economic Development after 2nd
World War when new countries started their pace to independence
and growth. However, nowadays, such factors are much less important than knowledge and innovation. These
are the new generators of value and of more stable and competitive clusters of economic activities.
Therefore, the issue of how to manage knowledge, namely scientific and technological knowledge, as well as
innovation, becomes the main agenda for governments committed to development. However, this new type of
management has to overcome major shortcomings as it concerns intangible assets, more connected to the future
than to the past and this explains why Technology Foresight as a diagnostic and decision aid to support
knowledge policies has become so important either in small or in large countries. This is the “raizon d’être” of
ET 2000.
The presented results show clearly the essential contribution of E&T to achieve a more sustainable and
competitive development of Portugal and how deceptive and illusory can be giving a smaller priority to the
development of technological human capital, to the support of RD oriented to tackle priorities and applied
problems or to the implementation of “horizontal” policies stimulating innovation.
Therefore, technology is not a commodity and the answer given to the manager quoted in the beginning of this
book, “I will buy it” is not right. Before buying it, Technology has to be created and to be learned.
Furthermore, the process of learning technology and how to use it effectively and efficiently implies an
interdisciplinary approach covering an wide spectrum of domains, from Engineering to Sociology, from
Economics to Psychology and this is the major challenge to achieve significant advances in areas so different as
education, environment or competitiveness and quality.
Nevertheless, the use of technology is a function of the nature of each society, of its values and culture. The next
20 years will be no exception.
Unfortunately, major existing global problems such as famines, regional wars, segregation or social exclusion
are not being significantly alleviated by modern Sciences, Engineering and Technology but the ethics and the
main values guiding E&T are evolving and the participants of ET2000 hope that solidarity will be found not less
important than sustainability or than efficiency, along the two coming decades.
Luís Valadares Tavares
IST, March 2001
61
5 REFERENCES
- Antunes, C.H. and L. V. Tavares ,(ed.), 2000, Investigação Operacional: Casos de Aplicação, Mc Graw-
Hill.
- Bonfim, 2000 National R&D challenges: the engineering and technology impact (2000-2006), International
Workshop ET 2000.
- Charnes, C., W.W. Cooper and E. Rhodes, 1978, Measuring the efficiency of decision making units,
European Journal of Operational Research, 2, 429-444.
- Contzen, J.P., 2000, ID em Portugal, International Workshop ET2000.
- Direcção Geral do Ambiente, 1999, Relatório do Estado do Ambiente 1998, Ministério do Ambiente.
- Esty, D. and Porter, M., 1998, Industrial Ecology and Competitiveness, Journal of Industrial Ecology, Vol.2,
Number 1, pp 35-43.
- European Commission, 1998, Strategic Analysis for European S&T Policy Intelligence, DGXII, European
Commission.
- European Commission, 1999a, The Futures Project: Synthesis Report, IPTS, European Commission.
- European Commission, 1999b, The Futures Project: the Competitiveness Map, IPTS, European
Commission.
- European Environment Agency, 1999, Environment in the European Union at the turn of the century, EEA.
- Gibbons, M., Limoges C. Nowotny H., Schwartzman, S. Scott, P., Trow, M., 1994, The new production of
knowledge: the dynamics of science and research in contemporary societies, SAGE.
- Godet, M., 1991, Prospective et planification stratégique, Economica.
- Graedel, C. and Allenby, 1995, Industrial Ecology, Prenctice Hall.
- Kahan, J. and Cave J., 2000, Experiences at Rand Europe, International Workshop ET 2000, Lisboa.
- Observatório de Ciência e Tecnologia, (OCT), 1999, Programmes of advanced training of human resources
in S&T, 1999
- OECD, 1997, 21st Century Technologies: Balancing Economic, Social and Environmental Goals, OCDE.
- OECD, 1998, Education at a Glance, OCDE.
- Oral, M., 1993, A methodology for competitiveness analysis and strategy formulations in glass industry,
European Journal of Operational Research, 68, 9-22.
- Porter, M., 1990, The competitive advantage of nations, Macmillan.
- Schwab, Porter, Sachs, Warner e Levinson, 1999, The Global Competitiveness Report, World Economic
Forum, Oxford University Press.
- Sexton, TR, ed., 1986, Measuring efficiency: an assessment of data envelopment analysis, Jossey-Bass.
- Tavares, L. V., 1994, The strategic development of human resources: the challenge of OR, International
Transactions of OR, 1, 4, 465-477.
- Tavares, L. V., 1995, On the development of educational policies, European Journal of Operational
Research, 82, 409-421.
- Tavares, L.V. e F. Nunes Correia, 1999, Optimização Linear e Não Linear, Fundação Calouste Gulbenkian,
2ª ed.
- Tavares, L. V., 2000, A Engenharia e a Tecnologia ao Serviço do Desenvolvimento de Portugal -
Prospectiva e Estratégia 2000 – 2020, Editorial Verbo

62
Annex
Network of Human Capital
- ET 2000 -
A) Chairmanship and Coordination
Chairmanship
Prof. Armando Lencastre, AE
Eng.º F. Sousa Soares, OE
Com. Jorge Rocha de Matos, AIP
Eng.º João Bártolo, AE
Prof. Luís Valadares Tavares, IST
Advisory Committee
Eng.º João Bártolo, Presidente
Eng.º F. Marques Videira, AE
Eng.º Alfaiate, AIP
Eng.º J. Viana Baptista, OE
Prof. Luís Valadares Tavares, Director Eng.º H. Pereira do Vale, General Secretary
Coordination
Prof. Luís Valadares Tavares, Director do Projecto
Dr. Manuel João Pereira Eng.º Luís Lapão
Dr.ª Sofia Madureira Dr.ª Cláudia Gonçalves
Eng. Luís Ferreira
Patrícia Nunes
B) Issues
Societal Scenarios
Prof. Luís Valadares Tavares, IST
Prof. João Ferreira de Almeida, ISCTE
Prof. M. Braga da Cruz, ICS e UCP
Prof. João Ferreira do Amaral, Pres. da República Prof. Jorge Gaspar, Univ. de Lisboa
Dr. Francisco Sarsfield Cabral, RR
Prof. Manuel Heitor, IST Prof. João Caraça, ISEG, FCG e Pres. da República
Prof. Diogo Lucena, FCG e UNL Prof. João Confraria, ICP
Prof. Abel Mateus, Banco de Portugal e UNL
Eng.º João Cravinho, Dep Assemb. da República Prof. Carlos Salema, IST
Profa. Maria João Rodrigues, ISCTE
Eng.º Paulo Ramos, COMPAQ
Macro Economics
Prof. Abel Mateus, Banco de Portugal e UNL
Eng.º António Antunes, UNL
Prof. António Borges, INSEAD Prof. João César das Neves, UCP
Prof. Pedro Telhado Pereira, UNL
Prof. João Ferreira do Amaral, Pres. da República Dr.ª Antónia Ascenção Rato, CTT
Eng.ª Ângela Lobo, GEPE
Dr. Rui Guimarães, INETI Dr.ª Teresinha Duarte, GEPE
Industrial Investment
Prof. José Manuel Amado Silva, UAL
Dr. Francisco Palma, Instituto Regulador da Energia
Eléctrica
Eng.º José Mota Maia, INPI
Dr. Rui Madaleno, AIP
Eng.º Hortense Martins, INETI
Eng.º Pedro Sena da Silva, AUTOSIL Eng.º António Pinheiro, Direcção Geral Indústria
Eng.ª Ângela Lobo, GEPE
Dr.ª Teresinha Duarte, GEPE
Environment
Prof. Paulo Ferrão, IST
Eng.º Artur Ascenso Pires, IPE - Águas de Portugal
Prof. Fernando Santana, Univ. Nova
Prof. Roland Clift, University Surrey
Prof. Humberto Rosa, Faculdade Ciências, UL Eng.ª Ângela Lobo, GEPE
Dr. Francisco Quintela, José Mello, Quimitécnica
Dr.ª Teresinha Duarte, GEPE Eng.º Francisco Van Zeller, CIP e Metal Portuguesa
Eng.º Sá Nogueira, INAPA
Eng.º Macieira Antunes, Dir. Geral do Ambiente Prof. Carlos Borrego, Univ. Aveiro
Prof. John Ehrenfeld, MIT
Prof. J. Delgado Domingos, IST Eng.ª Teresa Ribeiro, Agência Europeia Ambiente
Prof. Cremilde Azevedo, DG XI
Innovation, Technological Marketing and
Internationalization
Prof. Manuel Heitor, IST
Prof. José Paulo Esperança, UCP
Profa. Conceição Santos, ISCTE
Dr. Henrique Neto, Sociedade de Engenharia e
Transformação
Prof. Miguel Athayde Marques, Jerónimo Martins
Prof. João Caraça, ISEG/FCG
Prof. Vítor Corado Simões, ISEG Profa. Regina Salvador, Univ. Nova de Lisboa
Prof. Alberto Castro, UCP Porto
Prof. Jorge Alves, Univ. Aveiro Prof. Abel Mateus, Banco de Portugal
Prof. Pedro Guedes de Oliveira, FEUP
Dr.Jean-Pierre Contzen, European Commission Prof. João Sentieiro, IST – ISR
Dr. Hierry Gaudin, Membro da Comissão de Investigação e da
Tecnologia, França Eng.º Pedro Sena e Silva, AUTOSIL
Dr. David Gibson, IC2 Institute The University of Texas at
Austin, USA Prof. Konstadinos Goulias,The Pennsylvania State University,
USA
Dr. Charles Buchanan, FLAD
Prof. Keith Pavitt, SPRU University of Sussex, UK
Eng.º Paulo Nordeste, PT Inovação
Prof. Giogio Sirilli, Institute of Studies on Scientific Research ISRDS, IT
Eng.º Manuel Moura, SIEMENS
Dr. Barry Stevens, OECD International Futures Programme Dr. Diogo Vasconcelos, Ideias e Negócios
Prof. Robert H. Wilson, LBJ School of Public Affairs, The University of Texas at Austin USA
Dr. José Pedro Vieira, Abril Jornal
Dr. Félix Ribeiro, MEPAT Dr. Pedro Pissarra, Biotecnol
Prof. A. Castro Guerra, IAPMEI
Dr. João Carreira, Critical Sofware Prof. Luís Magalhães, FCT
Dr.ª Margarida Fontes, INETI
Dr. José A.B. Assis, FCT Eng.º José Rui Felizardo, Inteli
Prof. Mª Lurdes Rodrigues, OCT
Eng.º Pedro Borges de Almeida, CPIN

63
Eng.ª Paula Fonseca, OCT
Eng.º Vasco Varela, Taguspark
Dr. Lino Fernandes, Agência de Inovação
Doutor. Manuel Laranja, Agência de Inovação Eng.º José Amaro Nunes, José Mello Quimigest
Eng.º Nuno Soares, CTT
Dr. Alberto Pimenta, CTT Dr.ª Mª Helena Camacho, CTT
YET – Young Engineers and Technologists
Prof. António Gouveia Portela, IST
Eng. Luís Lapão, IST
Eng.ª Catarina Queiroga, ISQ
Dr.ª Céu Mateus, Ministério da Saúde
Dr. Avelino Ribeiro, SIBS Dr. Diogo Vasconcelos, Ideias e Negócios
Eng.º Duarte Braga, INSEAD
Eng.º Pedro Conceição, Univ. Austin
Dr. Filipe Santos, Univ. Stanford
Eng.º Duarte Lopes, Optimus
Eng.º Miguel Sousa Lobo, Univ. Stanford Engº. José Coutinho, Neurónio
Eng.º Francisco Veloso, MIT
Eng.º Luís Oliveira e Silva, UCLA Eng.º Júlio Mateus, Associação dos Municípios
Dr. Pedro Pissarra, Biotecnol
C) Sectoral Studies
Environment
Eng.º Jaime Melo Baptista, LNEC
Prof.ª Eduarda Beja Neves, LNEC
Prof. Francisco Nunes Correia, IST
Eng.º António Amaro, IPE-Regia
Eng.º Adelino Silva Soares, Associação Portuguesa de
Distribuição e Drenagem de Água
Dr. Aníbal Santos, EGF Eng.º Artur Cabeças, EGF
Eng.º António Almeida Rocha, Hidroprojecto
Eng.º Manuel Piedade, Hidroprojecto Eng.º António Barahona d'Almeida, Sumolis
Eng.º Carlos Pássaro, Ponto Verde
Prof. António Betâmio de Almeida, IST Eng.º António Branco, Parque das Nações
Prof. António Lobato de Faria, Instituto dos Resíduos
Prof. Carlos Borrego, Universidade de Aveiro Eng.º Miguel Conceição, Universidade de Aveiro
Prof. Delgado Domingos, IST
Prof. Fernando Santana, UNL Eng.º Francisco Ferreira, Quercus
Eng.º Rui Berkemeier, Quercus
Dr. Francisco Quintela, Quimitécnica Eng.º Frederico Melo Franco, Luságua
Prof. Humberto Rosa, Gabinete do Primeiro Ministro e
Faculdade de Ciências da Universidade de Lisboa Eng.º João Bau, IPE-Águas de Portugal
Eng.º Manuel Ramos Motta, IPE-Águas de Portugal
Prof. João Quinhones Levy, IST Prof. João Ribeiro da Costa, UNL
Eng.º João Sá Nogueira, Comissão da Associação Industrial
Portuguesa para o Ambiente Eng.º Joaquim Poças Martins, Águas de Gaia E.M.
Eng.º Manuel da Fonseca, Águas de Gaia E.M.
Eng.º Luís Catarino, IPE – Águas de Portugal Eng.º Luís Rebello da Silva, Sanest
Eng.º Macieira Antunes, Direcção Geral do Ambiente
Eng.º Alberto Marcolino, Direcção Geral do Ambiente Eng.º Manuel Abecasis, Sétal Dégremont
Eng.º Manuel Pinheiro, Instituto Português do Ambiente Eng.ª Maria Rafaela Matos, LNEC
Eng.º Mineiro Aires, Instituto da Água
Eng.º Pedro Falcão e Cunha, Somague/Ambiente
Eng.º Pedro Martins da Silva, LNEC
Eng.º Pedro Miranda, Siemens
Eng.º Jorge Pires, Siemens
Eng.º Pedro Serra, IRAR
Eng.º Rui Godinho, Câmara Municipal de Lisboa
Cristina Pereira, LNEC
Energy
Engº. Alberto Moreno, DGE
Dr. Francisco Palma, Instituto Regulador de Energia
Eléctrica
Eng.º Ricardo Cruz Filipe, Ministério das Finanças
Eng.º Luís Filipe Pereira, ADP Adubos de Portugal
Profa. Teresa Correia de Barros, IST Eng.º Manuel Ferreira de Oliveira, Petrogal
Eng.º Jorge Vasconcelos, ERSE
Eng.º Ângelo Correia, Lusitaniagas Eng.º Miguel Freitas de Oliveira, COGEN
Dr. Mário Cristina de Sousa, EDP
Dr. Álvaro Martins, CEEETA
Dr. António Mexia, GDP
Prof. José Pedro Sucena Paiva, IST Eng.º Jorge Guimarães, EDP
Eng.º. João de Jesus Ferreira, Climaespaço
Eng.º Luís Mira Amaral, BPI Prof. Aníbal Traça de Almeida, Univ. Coimbra
Eng.º João Nascimento Baptista, REN
Eng.º Carlos Oliveira, Cimpor Eng.º António Ferreira da Costa, EDP – PROET
Engº. José Montalvão e Silva, ABB
Eng.ª Ana Cristina Nunes, CPPE Eng.º João Paulo Silva Marques, Siemens
Eng.º António Gonçalves, CPPE
Eng.º Luís Reis, FINERTEC Eng.º José Pombo Duarte, REN
Food Industry
Prof. Xavier Malcata, Esc. Sup. Biot. UCP
Prof. Miguel Athayde Marques, Jerónimo Martins
Eng.º Fernando Gomes Silva, IPE
Dr. António Pires de Lima, Presidente COMPAL Dr. José Rodrigues Gomes, SONAE
Dr. António Simões, Nutrinveste
Dr. Luís Cantarel, Nestlé Sr. Casimiro de Almeida, Lactogal
Dr. Luís Mesquita Dias, FIMA
Eng.º Fernando Guedes, Sogrape Eng.º Luís San Miguel Bento, I&D da RAR
Dr. Jorge Pires, Nacional
Eng.º Vasco da Gama, Presidente da Conf. do Com. e Serv. de Portugal
Eng.º José Aníbal Soares, UNICER
Construction
Prof. Fernando Branco, IST
Dr. Diogo Vaz Guedes, SOMAGUE
Eng.º Rui Liberal, ANA Dr. Henrique Valadares, Bento Pedroso Const
Eng.º Luís Machado, BRISA
Dr.ª Vera Pires Coelho, Edifer Eng.º Eduardo Soveral, CML
Dr. Joaquim Fortunato, MSF, SA
Eng.º Sérgio Manuel, EDP Dr. Luís Marques Santos, Abrantina SA
Eng.º António Grima, EPAL
Dr. Manuel F Cachorro, Ramalho Rosa SA Eng.º Luís Loureiro, GATTEL
Dr. José Francisco Silva Fonseca, Const do Tâmega SA
Eng.º Manuel Furtado, GDP Eng.º Domingos Serpa Santos, Somafel
Prof. António Lamas, IEP
Prof. António Tadeu, FCTUC Eng.º Carlos Aires, INAG
Eng.º Rui Nogueira Simões, AECOPS

64
Eng.ª Maria Anjos, INH
Eng.º António V da Mota, ANEOP
Eng.º Eduardo Zúquete, Metro
Eng.º Rui Correia, LNEC Dr. Laurindo C da Costa, Soares da Costa SA
Eng.º Rui Loureiro, ANIPC
Dr. P Teixeira Duarte, Teixeira Duarte SA Eng.º António Ramos Pires, IPQ
Dr. Diogo Vaz Guedes, Soconstroi
Eng.º António Pinheiro, DGI Dr. Fernando Manuel Fernandes, Engil SA
Engº. António Grima, EPAL
Dr. António Manuel Mota, Mota & Companhia
Building Materials
Prof. José Manuel Gaspar Nero, IST
Eng.º João Pinto de Sousa, Assoc. Port. Fab. Tintas e Vernizes
Eng.º Rodrigo da Fonseca, CIMPOR – ATIC
Eng.º António Monteiro, Assoc. Ind. Colas e Similares
Dr. Mário Valadas Fernandes, SECIL – ATIC Engº. Jorge Santos, Corticeira AMORIM
Eng.º Jorge Manuel Santos Pato, APEB
Eng.º António Esteves, Assoc. Ind. Madeira e Mobiliário de Portugal
Dr. Luís Sotto Mayor, Assoc. Port. Ind. Mármores e Granitos,
Ramos Afins Eng.º. Fernando Carvalho, Sonae
Dr.ª Isabel Beja, Assoc. Port. Ind. Mármores e Granitos, Ramos
Afins Eng.ª Mª Clotilde Cabral, Assoc. P. Ind. Plást.
Dr. Álvaro Alvarez, Siderurgia Nacional
Eng.º Sónia Sphor, Cerâmicas Valadares Sr. António F. Saraiva, Metal. Luso-Alemã
Eng.º Vaz Serra, Centro Tecnológico Cerâmica e Vidro
Dr. Jorge Morgado, Assc. Pt. Ind. Ferrag. Eng.º Serpa Oliva, C. Barbosa Coimbra
Dr. Filipe Carvalho, Assc. Pt. Ind. Ferrag.
Eng.º Fernando Perpétuo, SPAL e APOLO Eng.º José Braga, RMC, Lda
Eng.º Girão Pereira, SPAL e APOLO
Dr. Filipe dos Santos, Assc. Nac. Ind. Mat. Elect. e Electrónico Eng.º. Artur Brandão, COVINA
Eng.ª Cristina Oliveira, Assc. Nac. Ind. Prod. Cimento
Eng.º. Sequeira Martins, CIMPOR – ATIC Eng.º Luís Loureiro, Assc. Nac. Ind. Prod. Cimento
Eng.º Álvaro Gomes, CIMPOR – ATIC
Eng.º Carlos Oliveira, CIMPOR – ATIC Eng.º Álvaro Gomes, CIMPOR
Electronics
Prof. Epifânio de Franca, IST
Eng.º Renato Morgado, EFACEC
Prof. José Ferreira da Rocha, Univ. Aveiro
Eng.º José Martinho, NETIE
Prof. Augusto Casaca, IST
Dr. Miguel Cruz, DGI
Prof. Afonso Barbosa, IST Dr.ª Manuela Loureiro, MCT
Prof. Artur Pimenta Alves, FEUP
Gen. Adriano Portela, EID Prof. Adolfo Steiger Garção, UNL
Eng.º Francisco Padinha, PT
Prof. Carlos Costa, UM Eng.º Paulo Nordeste, PT
Dr. João Mota Pinto, ICEP
Eng.º João Teixeira, AJ Fonseca Eng.º José Pedro Jesus, OCTAL
Eng.º António de Paiva e Pona, ABB
Chemistry
Prof. Fernando Ramôa Ribeiro, Reitoria UTL
Prof. Clemente Pedro Nunes, QUIMIGEST
Eng. Eduardo Lopes Rodrigues, Finibanco
Eng.ª Lubélia Penedo, APEQ
Eng.º Carlos Lopes Vaz, BPI Prof. Augusto Medina, FEUP/UP
Eng.º Salvador Pinheiro, PETROGAL
Eng.ª Mª João Benoliel, EPAL Dr. Luís Portela, Bial
Eng.º Filipe Constant, Solvay
Prof. João Bordado, IST Prof. Sebastião Feyo de Azevedo, FEUP/UP
Prof. Júlio Novais, IST
Engº. Henrique Marques Pereira, QUIMIGEST Dr. Pedro Brito Correia, Herbex
Eng.º João Villax, Hovione
Eng.º Manuel Gil Mata, PORTUCEL José de Mello – QUIMIGEST
Eng. José Bonfim – IICTI, MCT
Metal and Plastic Products and Manufacturing
Prof. Rui Mesquita, IST
Eng.º Manuel Norton, AD tranz
Eng.º Paulo Peças, IST
Engº. Jorge Sales Gomes, Papelaco
Eng.º Pedro Reis, OGMA
Eng.º Joaquim Menezes, Grupo Ibermoldes Eng.º Manuel Cruz, AD Tranz
Prof. Luís Braga Campos, IST
Eng.º Manuel Santos Silva, ANEM Eng.º Casimiro Pinto, Metropolitano
Eng.º José Afonso Figueiredo da Costa, José de Mello – ATM
Textiles
Prof. Luís Almeida, CITEVE
Eng.º. Ana Amorim, Riopele
Eng.º Ana Amorim, Fábrica Têxtil Riopele
Eng.º Carlos Manuel Pontes Bento, Lameirinho
Eng.º Francisco Queiroz, Têxtil Manuel Gonçalves
Eng.º Gaspar Sousa Coutinho, Têxtil João Duarte Eng.º Lucília Sampaio, Tint Acab Tecidos V de Tábuas Lda
Eng.º Mário Duarte de Araújo, Univ. Minho
Eng.º Mário Jorge Machado, Estamparia Adalberto Eng.º Mário Nunes, Univ. Beira Interior
Eng.º Paulo Castro, Malhas Sonix,
Eng.º Francisco Gomes, Fab Tecidos Carvalho Lda Eng.º João Manuel Prata de Sousa, Paulo de Oliveira SA
Automobile Industry
Eng.º Rui Felizardo, Inteli
Eng. Alexandre Videira, Inteli
Dr. Luís Palma Féria, Acecia
Eng.º Vístulo de Abreu, Renaultgest
Prof. Paulo Ferrão, IST
Dr. José Abreu, DPIE – IAPMEI
Prof. José Manuel Barata Marques, UCP Eng.º Rogério Martins, Consultor
Eng.º Luís Fernando Mira Amaral, Pres. BFE - Investimentos,
SA Eng.º. Luís de Montellano, CC Luso-Coreana
Drª. Ana Vaz de Almeida, Rel. Públicas ACECIA, ACE
Eng.º Jorge Lopes Moura, Adm. IPETEX, SA Eng.º Alfredo Azevedo, Sunviauto, SA
Sr. Henrique Neto, Pres. do Grº. Iberomoldes
Dr. António Barradas, Consultor Dr. Álvaro de Oliveira, Alfamicro
Prof. Daniel Bessa, FECUP
Dr. José da Costa Pereira, Dir.Deptº.Control. Plasfil, Lda. Eng.º Octávio Carmo-Costa, Auto Europa Automóveis, Lda.
Eng.º Saúl Pereira, Simoldes, Lda.
Eng.º José Carola, Consultor DGI Eng.º Jorge Pinho de Moreira, S. Sunviauto, SA
Prof. Guilherme Costa, Pres. ICEP

65
Eng.º Pedro Ramalho, Dir. Prod. Simoldes Lda
Drª. Maria Jorge Costa, Jornal “Diário Económico”
Dr. José Félix Ribeiro, S. Dir. Geral DPP/MPAT
Dr. Alexandre Coutinho, Jornal “Expresso” Sr. José Sousa Ribeiro, Pres. AFIA
Eng.º Manuel Delgado, SimTec
Eng.º Jorge Rosa, Dir.Ger. Mitsubishi Tramagauto Drª. Helena Duarte, DPIE – IAPMEI
Mr. Ralph Rossignollo, Dir. Exec. Auto Europa
Prof. António T. Marques, Pres. INEGI Eng.º Rui Sá, INEGI
Dr. João Abel Freitas, Dir. GEPE/ME
Dr. Victor Santos, Dir. Geral do V.P. IAPMEI Dr. Manuel Gameiro, Pres. Plasfil, Lda
Eng.º António Nogueira da Silva, Coorden. IAPMEI – GAPIE
Dr. António João Lavrador, Adm. IPETEX SA Eng.º Pedro Sena da Silva, Pres. Acumulador. AUTOSIL
Eng.º José Costa Lima, OPEL de Portugal
Engº. Rainer Taschner, Dir.Eng.ª Prod. Auto Europa
Eng.º Lourenço Maia, Adm. SODIA, SA
Eng.º Hildebrando Vasconcelos, CATIM
Eng.º Afonso Tello Baptista, CTT
Shoes Industry
Eng.º Joaquim Leandro de Melo, C Tecn Calçado
Sr Fortunato Frederico, APICCAPS
Dr.ª Maria José Ferreira, CTC
Dr. Manuel Carlos Costa e Silva, APICCAPS
Eng.ª Maria José Teixeira, CTC Dr. Alfredo Jorge, APICCAPS
Dr. Ricardo Jorge, Consultor
Dr. Pedro Silva, APICCAPS Eng.º Manuel Resende, LIREL
Eng.º Joaquim Leandro de Melo, CTC
Eng.º Agostinho Silva, CEI Dr. Rui Moreira, CTC
Dr. Laurindo Oliveira, Expandindústria
Eng.ª Cândida Medon, CTC Sr. Paulo Costa, Expandindústria
Engineering Services
Prof. Luís Maltez , Tagus Park
Prof. Ricardo Oliveira, COBA
Prof. Diamantino Durão, IST
Eng.º Nuno Leandro, REFER Prof. Leopoldo Guimarães, FCT/UNL
Engº. Alberto Wanderley Soares, BCP
Prof. Carlos Sá Furtado, FCT Eng.º Ferreira da Costa, PROET
Prof. Manuel de Oliveira Duarte, Univ. Aveiro
Eng.º Artur Ravara, GAPRES Dr. Guilherme Costa, ICEP
Eng.º António Almeida Rocha, Hidroprojecto
Eng.º Joaquim Silva Dias, ICP
Eng.º Fernando Pereira, HP
Eng.º Rui Correia, LNEC
Eng.º José Vieira da Costa, Procesl Prof. Henrique Machado Jorge, INETI
Eng.º Ilídio Serôdio, Profabril
Eng.º F. Silveira Ramos, APPC Eng.º Úlpio Nascimento,
Dr. Manuel Moura, ADFER
Engª Maria Helena Carvalho, Hidrorumo Prof. José Luís Teixeira, IHERA
Dr. Adérito Serrão, EDIA – Beja
Eng.ª Isabel Pinto Correia, FCE Eng.º Carlos Alberto Mineiro Aires, INAG
Eng.º Luís Fernandes, ENGIL - Lisboa
Dr. Luís Madureira, Mota & Cia - Porto Eng.º Pedro Teixeira Duarte, Teixeira Duarte
Engº. Adão da Fonseca, AFA
Eng.º Monteiro Nunes, Consulgal
Prof. António Reis, GRID
Eng.º Eduardo Sobral, Siemens
Eng.º José Miguel Leal da Silva, José de Melo-Quimigest
Eng.º Frederico Melâneo, Metropolitano
Transportation and Distribution
Prof. José Manuel Viegas, IST
Dr. José Costa Faria, Luís Simões
Dr. Pedro Gonçalves, Metropolitano Lx
Eng. José Pedro de Jesus, CP Dr. Fernando Barreto Braga, ANA
Dr. José Costa Faria, Luís Simões
Dr. Helder Oliveira, Carris Eng.º João Pinto e Sousa, Pararede
Eng.º João Francisco Reis Simões, Carris
Eng.º José Carlos Gonçalves Viana, Consultor Dr. Helder Correia Sampaio, Rodoviária Lisboa
Eng.º José Falcão e Cunha, Dep. Assemb. República
Dr. António Crisóstomo Teixeira, CP
Eng.º Nuno Soares, CTT
Dr. Fernando Barreto Braga, ANA Eng.º João Mello Franco, José Mello-Soponata
Eng.º Francisco Seabra Ferreira, Metropolitano
Eng.º Paulo Santos, Siemens
Telecommunications
Dr. José Filipe Rafael, UCP
Sr. António M. Beja, McKinsey
Eng.º Paulo Nordeste, PT
Eng.º Luís Barata, Siemens
Eng.º Graça Bau, TV Cabo
Eng.º José Manuel Coutinho, CTT Sr. Guy Laflamme, Cabovisão
Eng.º Francisco Padinha, PT
Eng.º Rui Candeias Fernandes, Alcatel Prof. João Confraria, ICP
Dr. Francisco Velez Roxo, Easysoft
Engª Clara Janeira, PT
Dr. Gonçalo Sequeira Braga, Maxitel
Eng.º Iriarte Esteves, TMN Prof. Carlos Salema, Inst. Telecom.
Dr. António Carrapatoso, Telecel
Prof. Augusto Casaca, INESC Dr. José Manuel Ferrari Careto, Optimus/Novis
Prof. Pedro Veiga, FCCN
Eng.º Carlos Marques, E3G Eng.º Nelson Tomaz, CTT
Eng.ª Isabel Rebelo, ANA
Eng.ª Maria do Carmo Lopes, CP Eng.º José Pombo Duarte, REN
Eng.º João Picoito, Siemens
Information Technologies
Eng.º Eduardo Beira, Univ. Minho e Agência para o
Investimento no Norte
Eng.º Domingos Soares de Oliveira, CAPGEMINI
Prof. Altamiro Machado, Univ Minho
Eng. Filipe Sá Soares, Univ. Minho
Engª Delfina Sá Soares, Univ. Minho Dr. José Carlos Nascimento, Univ. Minho
Eng. António Gomes Miguel, Univ. Minho
Drª Anabela Sarmento, ISCAP Prof. João Nuno Oliveira, Univ. Minho
Dr. Mário Lousã, ISCAP
Dr. Beja Carneiro, Pedip Dr. Castro Correia, Instituto de Informática do Min. Finanças
Engª Júlia Ladeira, Direcção Geral de Serviços Informáticos do
Min. Justiça Drª Margarida Pires, Cª Portuguesa Time Sharing
Dr. Pedro Norton de Matos, Unysis
Prof. Themudo de Castro, Ineti Dr. João Rebello de Andrade, PriceWaterchouse Coopers
Drª Maria Céu Resende, Sonae
66
Eng. António Daniel, CPCdi
Dr. Jorge Carneiro, Sage Infologia
Eng. Carlos Sardo, Cª IBM Portuguesa
Eng. Joaquim Cunha, Caso Eng. Jorge Baptista, Primavera
Eng. Pedro Ferreira, Edinfor
Eng. Queiroz Machado, CPCsi Prof. José Tribolet, Inesc
Eng. Luís Paupério, I2S
Eng. António Murta, Enabler Dr. Cabral Menezes, BPI
Dr. Puerta da Costa, BPI
Dr. Reis Abreu, IGIF do Min. Saúde Dr. Ricardo Seara, BPI
Dr. José Henriques, Novabase
Eng. José Renito, Novabase Dr. Santos Carneiro, Imediata
Eng. Luis Costa, IBS
Eng. Silva Santos, Edinfor
Eng. José Barbosa, Efacec
Eng. Rui Melo, Quattro
Drª Helena Monteiro, Ernst & Young Dr. Lino Fernandes, Agência de Inovação
Dr. Manuel dos Santos, Instituto de Informática
Eng. Roberto Carneiro, UCP
Financial Services
Dr. Manuel João Pereira, UCP
Prof. José Alegria, BANIF
Dr. José Miguel Pessanha, BCP – Atlântico
Eng.º Domingos Soares de Oliveira, CAPGEMINI
Eng.º João Leite, Grupo BPSM Dr. Filipe Santos, SIBS
Eng.ª Isabel Ferreira, Montepio Geral
Dr. Amadeu Paiva, UNICRE Dr. Paulo Rodrigues da Silva, BPI
Dr. Miguel Torres Baptista, BES
Dr. Nuno Afonso Henriques Santos, Sanest Eng.º José Carlos Rodrigues, Assoc Gestores de Fortunas
Eng.º Paulino Magalhães Correa, BP
Eng.º Luís Vaz, AXA Portugal Dr. Álvaro Faria de Oliveira, SAS
Dr. Vasco Sousa Ribeiro, Inst. Gestão Crédito Público
(Ministério Economia e Finanças) Eng.º Jorge Ferreira Pinto, BVL
Eng.º Sérvulo Rodrigues, BES
Eng.º Carlos Madeira, GEMINI Consulting Dr. Rui Mendes, CGD
Dr. Pedro Orvalho, Assoc. Portuguesa de Bancos
Eng.º Raul Galamba, Mckinsey International Engº. António Moreira Lopes, CGD
Dr. Rui Bana e Costa, CAPGEMINI
Dr. Pedro Brandão Rodrigues, Banco Melo Inv Prof. Miguel Athayde Marques, CGD
Eng. Aristides Meneses, INSAT
Dr. Fernando Nunes, Price Waterhouse Coopers Dr. Joaquim Pinto Matos, CTT
Geographical Information Systems
Prof. João Bento, IST
Prof. Rui Gonçalves Henriques, CNIG
Prof. António Câmara, FCT/UNL
Dr. Nelson Neves, Imersiva Prof. António Lamas, IEP
Prof. Rui Gonçalves Henriques, INAG
Prof. João Matos, IST Dr. António Fernandes, CM Oeiras
Gen.ª Mourato Rodrigues, Ex-IGEOE
Dr.ª Mafalda Reis, CM Loures Dr. Luís Barruncho, Edinfor
Eng.º João Brandão Soares, CCR Centro
Eng.º Fernando Malha, Intergraph
Eng.º António Vidigal, APRITEL
Eng.º Rui Oliveira, Micrograph
Eng.º Francisco Padinha, PT
Eng.º Carlos Coucelo, Octopus
Eng.º José Luís de Carvalho, Portucel Eng.º Nuno Colaço, Coba
Eng.º João Marnoto, Nova Geo
Prof. Eduardo Ribeiro de Sousa, Aquasis Eng.º Clemente dos Reis, EPAL
Prof. João Ribeiro da Costa, Chiron
Eng.ª Mª Conceição Granger, Sanest Eng.º José Rayara/Rui Coelho, Profabril/Agripro
Dr. Manuel Torres Silva, Sanest
Eng.º José Coutinho, CTT Eng.ª Marta Araújo, Metropolitano
D) Academic – Business Council
Prof. Luís Valente de Oliveira (Presidente)
Prof. Altamiro Machado
Dr. António Crisóstomo Teixeira Eng.º António de Sousa Gomes
Prof. António Gouvêa Portela
Eng.º António Martins Eng.º António Pinheiro
Prof. António Torres Marques
Prof. Augusto Mateus Prof. Carlos A. V. Costa
Prof. Carlos Alberto Castro Couto
Dr. Carlos de Melo Ribeiro Eng.º Carlos Dias
Prof. Carlos Moreira da Silva
Prof. Carlos Salema Prof. Clemente Pedro Nunes
Prof. Daniel Bessa
Prof. Diamantino Durão Prof. Diogo de Lucena
Dr. Diogo Vasconcelos
Prof. Eduardo Arantes e Oliveira Eng.º Emílio Rosa
Eng.º F. Silveira Ramos
Eng.º Fernando A. de Melo Antunes Dr. Fernando Barreto Braga
Eng.º Fernando Faria de Oliveira
Dr. Francisco Teixeira Pereira Soares Prof. Henrique Machado Jorge
Eng.º Henrique Neto
Dr. João Abel Freitas Dr. João Álvaro Bau
Prof. João Bessa Sousa
Prof. João Caraça Prof. João Levy
Eng.º João Vaz Guedes
Prof. Jorge Alves Prof. José Carlos Marques dos Santos
Prof. José de Melo Torres Campos
Eng.º José Domingo Vistulo de Abreu
Prof. José Manuel Ferreira Lemos
Prof. José Soeiro Ferreira Prof. José Tribolet
Prof. Luís Andrade Ferreira
Eng.º Luís Fernando Mira Amaral Eng.º Luís Filipe de Moura Vicente
Dr. Luís Filipe Pereira
Prof. L T Almeida Prof. Luiz de Sousa Lobo
Prof. Manuel Barata Marques
Dr. Manuel Fernandes Tomás Eng.º Manuel Ferreira de Oliveira
Doutor Manuel Laranja
Prof. Manuel Leal da Costa Lobo Eng.º Manuel Santos Silva
Profa. Maria da Graça Carvalho
Drª Maria Idalina Salgueiro
Dr. Mário Cristina de Sousa
Eng.º Mário Lino Correia
67
Prof. Miguel Athayde Marques
Dr. Norberto Pilar
Prof. Paulo Tavares de Castro
Prof. Pedro Guedes de Oliveira Prof. Pedro Lynce de Faria
Eng.º Pedro Pontes
Gen. Pelágio Manuel Castelo Branco Eng.º Ricardo da Cruz Filipe
Prof. Ricardo de Oliveira
Eng.º Rodrigo de Sande e Lemos Prof. R. Salcedo
Dr. Rui Chanceller de Machete
Eng.º Rui Manuel Correia Eng.º Rui Neves
Eng.º Rui Sabino Marques
Prof. Sebastião Feyo de Azevedo Prof. Sérgio Machado dos Santos
Eng.º Vasco Coucello
Dr. Vasco de Mello
E) National Conference Committee
Prof. Luís Valadares Tavares, (Presidente)
Eng.º António Alfaiate
Prof. João Ferreira de Almeida Prof. João Ferreira do Amaral
Eng.º Carlos Henggeler Antunes
Eng.º Jaime Melo Baptista Dr. Viana Baptista
Eng.º João Bártolo
Dr. Pereira Bastos Dr. F. Sarsfield Cabral
Prof. João Caraça
Dr. António Carrapatoso Profª Graça Carvalho
Prof. Augusto Casaca
Eng.º Mário Lino Correia
Eng.º Rui Correia
Eng.º João Cravinho Prof. José Soeiro Ferreira
Eng.º Ricardo Cruz Filipe
Prof. Manuel Heitor
Prof. Machado Jorge
Eng.º Luís Lapão Doutor Manuel Laranja
Prof. Altamiro Machado
Prof. Virgílio Machado Dr. Rui Machete
Prof. Luís Magalhães
Dr. Carlos Magno Prof. Abel Mateus
Dr. Pedro Norton de Matos
Eng.º Maximiano Martins Prof. Carlos Morais
Eng.º Alberto Moreno
Dr. Henrique Neto Dr. Luís Neto
Prof. Maranha das Neves
Eng.º Paulo Nordeste
Prof. Clemente Pedro Nunes
Prof. Luís Valente de Oliveira
Prof. Ricardo Oliveira Dr. Manuel João Pereira
Dr. Horácio Periquito
Prof. Gouvêa Portela Prof. Ramôa Ribeiro
Prof. António Guimarães Rodrigues
Eng.º Eduardo Lopes Rodrigues Profª Maria João Rodrigues
Profª Maria de Lurdes Rodrigues
Prof. Carlos Salema Eng.º Albertino Santana
Prof. Marques dos Santos
Dr. Nicolau Santos Eng.º Pedro Serra
Prof. Gomes da Silva