engineering entrance examinations kerala …cee-kerala.org/docs/keam2011/res/highlights11.pdf ·...
TRANSCRIPT
ENGINEER ING ENTRANCE EXAMINATIONS KERALA – 2011
Dates of Exam : April 18-19, 2011
RESULTS ‐ HIGHLIGHTS July 10, 2011
OFFICE OF THE COMMISSIONER FOR ENTRANCE EXAMINATIONS HOUSING BOARD BUILDINGS, SANTHI NAGAR,
THIRUVANANTHAPURAM – 695 001 Telephone: 0471-2332120, 2338487
Fax: 0471-2337228
Website: www.cee-kerala.org
No. CEE/1717/2010/KEAM_2011/TA1
Government of Kerala
Office of the Commissioner for Entrance Examinations Housing Board Buildings, Santhi Nagar, Thiruvananthapuram - 695 001
NOTIFICATION
Engineering Rank list, Kerala 2011 – Published
The rank list for admission to Engineering Courses 2011, are published herewith. The results will be published through media. It will be available at the Office of the Commissioner for Entrance Examinations and on the websites :
www.cee.kerala.gov.in
http://results.kerala.nic.in
The Entrance Examination for Engineering courses 2011 was conducted on 18th (Paper-I Physics & Chemistry) and 19th (Paper – II Mathematics) April 2011. The marks secured by the candidates in the Entrance Examination were published on 24.05.2011.
Those candidates who have qualified in the Engineering Entrance Examination were directed to submit the marks obtained for Mathematics, Physics and Chemistry/Computer Science/Biotechnology/Biology in the Second year Plus Two or equivalent qualifying examination through the website www.cee.kerala.gov.in from 06.06.2011 to 17.06.2011 and to submit the duly signed copy of Mark Submission Data and attested copies of Plus Two mark sheets on or before 20.06.2011 to the Commissioner for Entrance Examinations. The marks submitted by the candidates were subsequently published on the web site for verification on 24.06.2011 and the candidates were directed to inform changes, if any, in the published data on or before 30.06.2011. Out of 65632 candidates qualified in the Engineering Entrance Examination 56336 candidates have submitted their marks in the qualifying examination to the Commissioner for Entrance Examinations till 30.06.2011. The data submitted by candidates till 30.06.2011 has been considered for the preparation of rank list.
For the preparation of Engineering Rank list, equal weightage was given to the marks obtained in the Entrance Examination for Engineering (Paper I & Paper II put together) and the grade/marks obtained for Mathematics, Physics and Chemistry/Computer Science/Biotechnology/Biology put together in the Second year of the qualifying examination (Plus Two or equivalent), after effecting the normalization procedure as described in Clause 9.7.4 (b)(ii) of the Prospectus.
The statistical parameters used for normalization of marks of various boards are given in Appendix-I. Some of the Boards/Authorities did not provide the statistical parameters/data essential for the process of normalization of marks of those candidates who studied for the qualifying examination under their stream. The marks of candidates from such Boards have been normalized based on the criteria decided upon by the Committee constituted vide G.O.(Rt) No.2426/2010/H.Edn. dated 22.12.2010 and the decision is final and binding on the applicant.
Marks obtained by the candidate in the Engineering Entrance Examination (Paper I & Paper II put together) is computed out of 500, and added to the total normalized marks of Mathematics, Physics and Chemistry/Computer Science/ Biotechnology/Biology as the case may be in the Qualifying Examination computed out of 500, both corrected to 4 places of decimals. The rank list for Engineering Courses is thus prepared based on the total marks obtained out of 1000, computed as above.
The results of a few candidates are withheld for the reason of not submitting the duly signed printout of Mark Submission Data/attested copies of mark sheets of qualifying examination. The marks submitted online by these candidates as such is taken for the preparation of Engineering rank list considering it as the marks obtained in the Second year of qualifying examination. Their results will be released only on submission of the duly signed declaration along with attested copies of the original mark sheets of the qualifying examination. In case, the marks submitted by the candidate which have been used for the preparation of the rank list differ from the actual marks secured by that candidate, he/she will be disqualified. No further communication will be entertained in this regard. Such candidates will also be liable for penal action in accordance with law.
The inclusion of roll number of any candidate in this list does not entitle him/her for admission unless he/she satisfies all the conditions of eligibility as prescribed in the Prospectus. The Rank list published is subject to the result of the Orders of the Hon. High Court in Writ Petitions filed in this regard.
The category/community-wise list based on the rank list will also be published in due course. Separate notification for the Centralized Allotment Process (CAP) for allotment to various colleges/courses will be issued in due course.
Candidates will be admitted to the courses only if the academic eligibility conditions as prescribed in the Prospectus under clause 6.2 are fulfilled at the time of admission. This will be verified at the time of admission.
Thiruvananthapuram B.S. Mavoji IAS 10.07.2011 Commissioner for Entrance Examinations
RESULTS OF THE ENGINEERING ENTRANCE EXAMINATION KERALA – 2011
HIGHLIGHTS
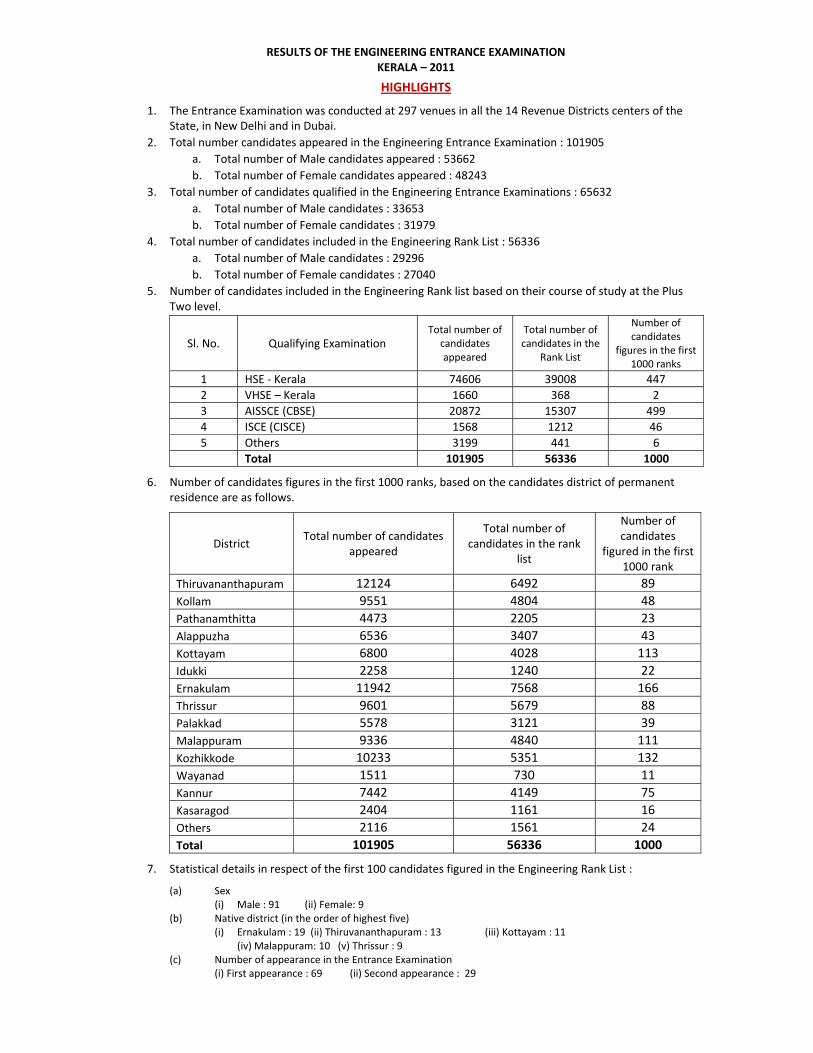
1. The Entrance Examination was conducted at 297 venues in all the 14 Revenue Districts centers of the State, in New Delhi and in Dubai.
2. Total number candidates appeared in the Engineering Entrance Examination : 101905 a. Total number of Male candidates appeared : 53662 b. Total number of Female candidates appeared : 48243
3. Total number of candidates qualified in the Engineering Entrance Examinations : 65632 a. Total number of Male candidates : 33653 b. Total number of Female candidates : 31979
4. Total number of candidates included in the Engineering Rank List : 56336 a. Total number of Male candidates : 29296 b. Total number of Female candidates : 27040
5. Number of candidates included in the Engineering Rank list based on their course of study at the Plus Two level.
Sl. No. Qualifying Examination Total number of
candidates appeared
Total number of candidates in the
Rank List
Number of candidates
figures in the first 1000 ranks
1 HSE ‐ Kerala 74606 39008 4472 VHSE – Kerala 1660 368 23 AISSCE (CBSE) 20872 15307 4994 ISCE (CISCE) 1568 1212 465 Others 3199 441 6 Total 101905 56336 1000
6. Number of candidates figures in the first 1000 ranks, based on the candidates district of permanent residence are as follows.
District Total number of candidates appeared
Total number of candidates in the rank
list
Number of candidates
figured in the first 1000 rank
Thiruvananthapuram 12124 6492 89 Kollam 9551 4804 48 Pathanamthitta 4473 2205 23Alappuzha 6536 3407 43 Kottayam 6800 4028 113 Idukki 2258 1240 22 Ernakulam 11942 7568 166Thrissur 9601 5679 88 Palakkad 5578 3121 39 Malappuram 9336 4840 111 Kozhikkode 10233 5351 132Wayanad 1511 730 11 Kannur 7442 4149 75 Kasaragod 2404 1161 16 Others 2116 1561 24Total 101905 56336 1000
7. Statistical details in respect of the first 100 candidates figured in the Engineering Rank List :
(a) Sex (i) Male : 91 (ii) Female: 9
(b) Native district (in the order of highest five) (i) Ernakulam : 19 (ii) Thiruvananthapuram : 13 (iii) Kottayam : 11
(iv) Malappuram: 10 (v) Thrissur : 9 (c) Number of appearance in the Entrance Examination (i) First appearance : 69 (ii) Second appearance : 29
DETAILS OF STATE WIDE TOP 10 RANK HOLDERSENGINEERING ENTRANCE EXAMINATIONS 2011
Roll No. : 145145
DILIP K KAINIKKARA
Score : 961.5122
KAINIKKARA HOUSE
PAIPPAD
CHANGANACHERRY
PALLICKALCHIRA KAVALA P O
PHONE : 9497931835
Rank : 1
Roll No. : 193494
JAHFAR THATTARUTHODI
Score : 950.1344
S/O. KUNHARA KUTTY T.T
MATTATHUR P O
OTHUKKUNGAL
THATTARUTHODI HOUSE
MALAPPURAM
PHONE : 9746128470
Rank : 2
Roll No. : 157792
VISWAJITH V
Score : 945.8348
FLAT 4 D
VIDYA NAGAR
COCHIN
ABAD CLOUD NINE
PHONE : 9847424747
Rank : 3
Roll No. : 219479
SARATH KRISHNAN E V
Score : 938.8972
HEMANTHAM
PAYYANUR VIA
KANNUR DISTRICT
EDAT P O
PHONE : 9496357090
Rank : 4
Roll No. : 109424
SONIA V MATHEW
Score : 938.8452
VADAKKEMURY
KAIMANAM P O
TVM
AMBANADU ROAD
PHONE : 9446901243
Rank : 5
Roll No. : 162169
KRISHNA DUTT
Score : 936.2434
SREESYLAM
MEVELLOOR P O
KOTTAYAM
THONNALLOOR
PHONE : 9446713694
Rank : 6
Roll No. : 164973
DANIEL GEORGE
Score : 935.6242
KIDANGETH
MARADU P O
NBRRA 185
PHONE : 9495427327
Rank : 7
Roll No. : 109543
AMAL JOY
Score : 932.9923
HOUSE NO 15
PONGUMMOODU
MEDICAL COLLEGE P O
ANUPAMA NAGAR
TRIVANDRUM
PHONE : 9497592438
Rank : 8
Roll No. : 144771
ANUP TEEJO MATHEW
Score : 932.3195
MAMMOOTIL T EJO NIVAS
KOTTAYAM DISTRICT
ERUMELI P.O
PHONE : 9447091326
Rank : 9
Roll No. : 109695
JAYANTH RAMESH
Score : 927.4013
S/O MR S RAMESH
DOORDARSHAN KENDRA
KUDAPPANAKUNNU
C/O SUPERINTENDING ENGINEER
TRIVANDRUM
PHONE : 9447019772
Rank : 10
TOP 2 RANK HOLDERS FROM SC AND ST CATEGORYENGINEERING ENTRANCE EXAMINATIONS 2011
Roll No. : 137176
SUMITH K S
Score : 812.0338
KUTTIYIL HOUSE
CHENGANNUR
ALAPPUZHA
PUTHENCAVE P O
PHONE : 9961550017
Rank : 235Category : SC
Roll No. : 103947
ARUN KRISHNA S S
Score : 809.7457
ARAMAM
MALAYINKIL P O
THIRUVANANTHAPURAM
MADATHINGALKARA
PHONE : 9388195985
Rank : 251Category : SC
Roll No. : 152666
GEORLY GEORGE DANIEL
Score : 692.5825
KUDAMPULICKAL HOUSE
THODUPUZHA
THALUK
MUTTOM P O
IDUKKI
PHONE : 9447025112
Rank : 1746Category : ST
Roll No. : 213181
GEETHU DIVAKAR
Score : 671.0849
KUKKUS
MUNDERI
KALPETTA
POLICE HOUSING COLONY
WYANAD
PHONE : 9447219530
Rank : 2370Category : ST
TOP ONE AMONG THOSE WHO APPEARED IN EACH DISTRICT, NEW DELHI & DUBAIENGINEERING ENTRANCE EXAMINATIONS 2011
THIRUVANANTHAPURAMRoll No. : 109424
SONIA V MATHEW
Score : 938.8452
VADAKKEMURY
KAIMANAM P O
TVM
AMBANADU ROAD
PHONE : 9446901243
Rank : 5
KOLLAMRoll No. : 116674
NELLAI KRISHNAN S
Score : 924.7837
PARVATHI BHAVAN
KADAPPAKKADA P O
KOLLAM
258 BHAVANA NAGAR
PHONE : 9495732547
Rank : 11
PATHANAMTHITTARoll No. : 130751
ATHIRA JANE JACOB
Score : 865.4758
C/O P C SAMUELKUTTY
THOTTAMON
RANNI P O
KUTTIMURUPPEL HOUSE
PHONE : 9445035758
Rank : 67
ALAPPUZHARoll No. : 138293
ABY VARGHESE ALEX
Score : 822.5398
PULIMOOTTIL PUTHEN PURACKAL
KAYAMKULAM
ALAPPUZHA
PERUNGALA P O
PHONE : 9447424141
Rank : 192
KOTTAYAMRoll No. : 145145
DILIP K KAINIKKARA
Score : 961.5122
KAINIKKARA HOUSE
PAIPPAD
CHANGA
PALLICKALCHIRA KAVALA P O
PHONE : 9497931835
Rank : 1
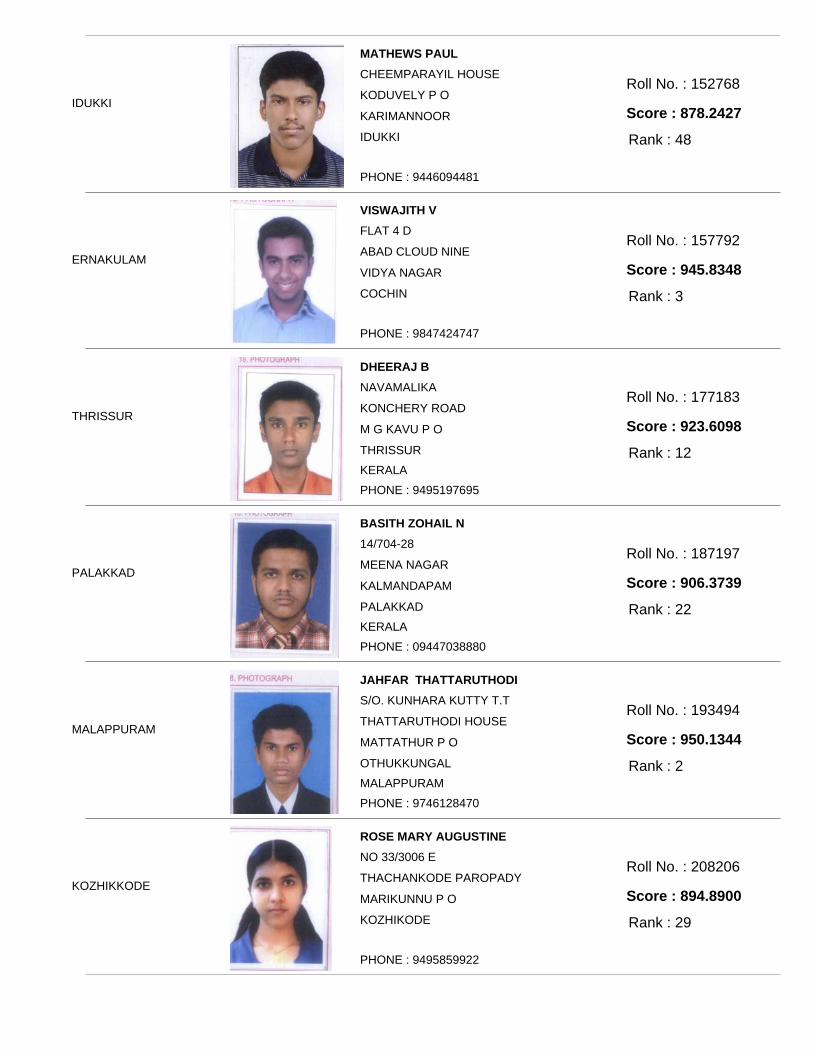
IDUKKIRoll No. : 152768
MATHEWS PAUL
Score : 878.2427
CHEEMPARAYIL HOUSE
KARIMANNOOR
IDUKKI
KODUVELY P O
PHONE : 9446094481
Rank : 48
ERNAKULAMRoll No. : 157792
VISWAJITH V
Score : 945.8348
FLAT 4 D
VIDYA NAGAR
COCHIN
ABAD CLOUD NINE
PHONE : 9847424747
Rank : 3
THRISSURRoll No. : 177183
DHEERAJ B
Score : 923.6098
NAVAMALIKA
M G KAVU P O
THRISSUR
KONCHERY ROAD
KERALA
PHONE : 9495197695
Rank : 12
PALAKKADRoll No. : 187197
BASITH ZOHAIL N
Score : 906.3739
14/704-28
KALMANDAPAM
PALAKKAD
MEENA NAGAR
KERALA
PHONE : 09447038880
Rank : 22
MALAPPURAMRoll No. : 193494
JAHFAR THATTARUTHODI
Score : 950.1344
S/O. KUNHARA KUTTY T.T
MATTATHUR P O
OTHUKKUNGAL
THATTARUTHODI HOUSE
MALAPPURAM
PHONE : 9746128470
Rank : 2
KOZHIKKODERoll No. : 208206
ROSE MARY AUGUSTINE
Score : 894.8900
NO 33/3006 E
MARIKUNNU P O
KOZHIKODE
THACHANKODE PAROPADY
PHONE : 9495859922
Rank : 29
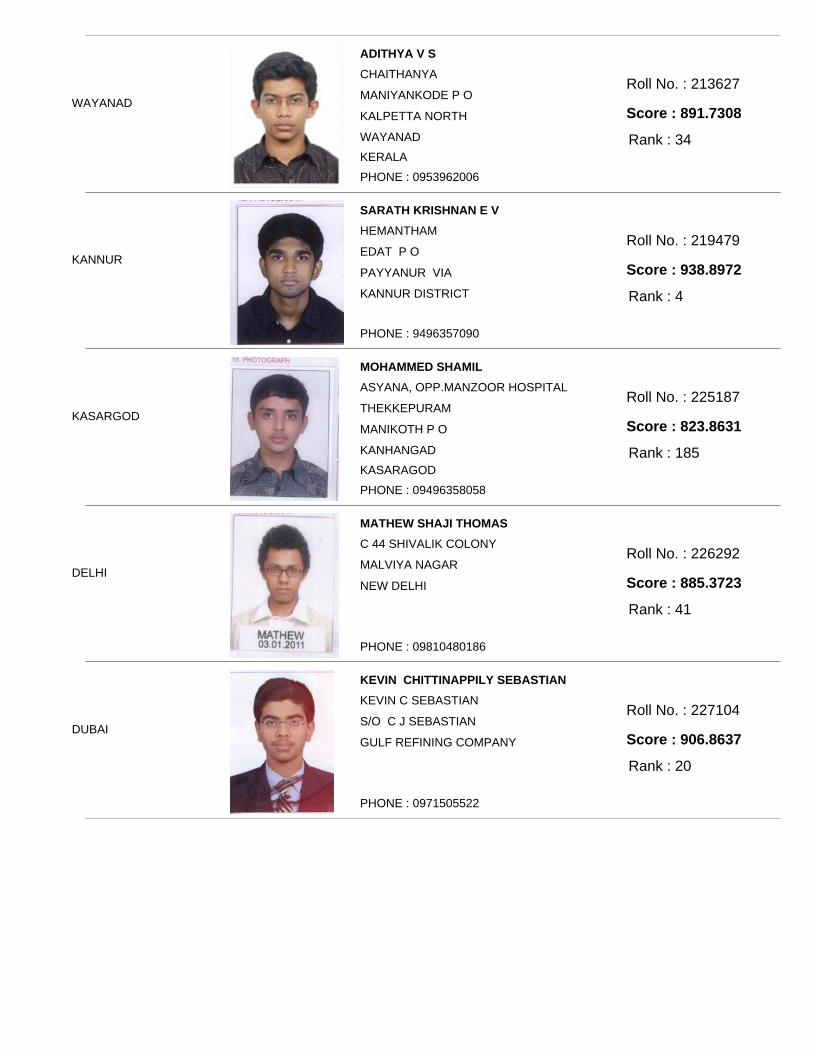
WAYANADRoll No. : 213627
ADITHYA V S
Score : 891.7308
CHAITHANYA
KALPETTA NORTH
WAYANAD
MANIYANKODE P O
KERALA
PHONE : 0953962006
Rank : 34
KANNURRoll No. : 219479
SARATH KRISHNAN E V
Score : 938.8972
HEMANTHAM
PAYYANUR VIA
KANNUR DISTRICT
EDAT P O
PHONE : 9496357090
Rank : 4
KASARGODRoll No. : 225187
MOHAMMED SHAMIL
Score : 823.8631
ASYANA, OPP.MANZOOR HOSPITAL
MANIKOTH P O
KANHANGAD
THEKKEPURAM
KASARAGOD
PHONE : 09496358058
Rank : 185
DELHIRoll No. : 226292
MATHEW SHAJI THOMAS
Score : 885.3723
C 44 SHIVALIK COLONY
NEW DELHI
MALVIYA NAGAR
PHONE : 09810480186
Rank : 41
DUBAIRoll No. : 227104
KEVIN CHITTINAPPILY SEBASTIAN
Score : 906.8637
KEVIN C SEBASTIAN
GULF REFINING COMPANY
S/O C J SEBASTIAN
PHONE : 0971505522
Rank : 20
Page 1 of 6
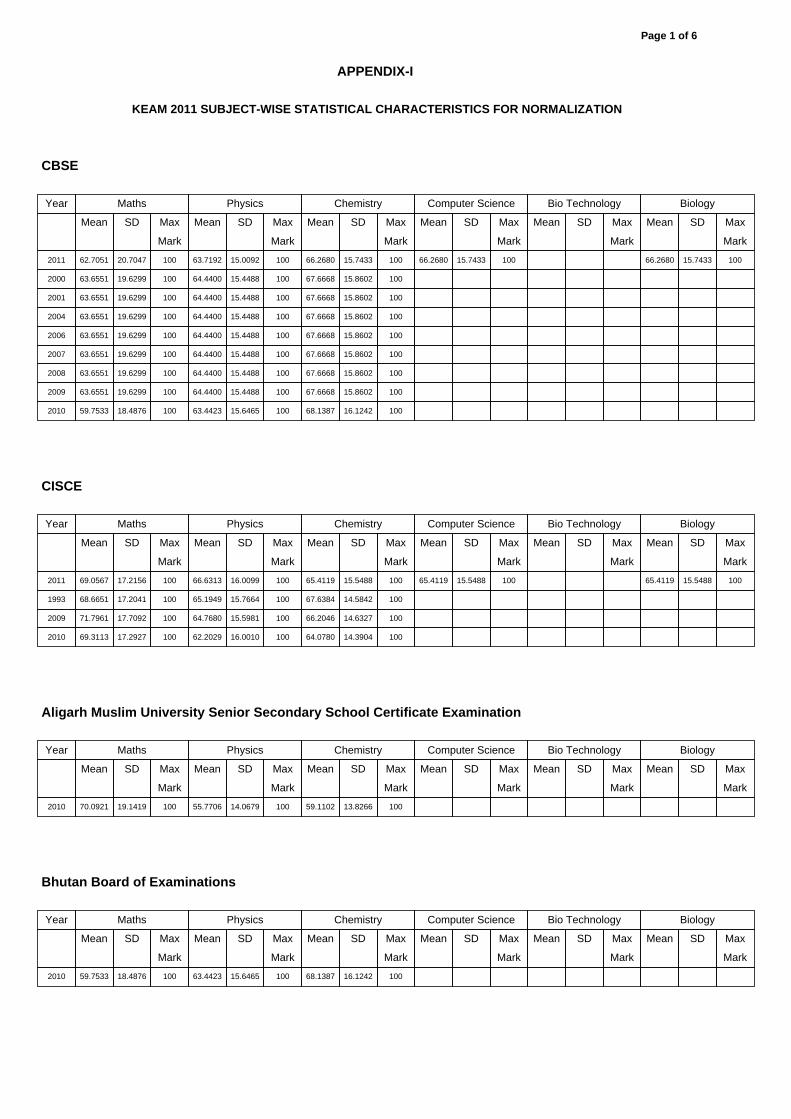
APPENDIX-I
KEAM 2011 SUBJECT-WISE STATISTICAL CHARACTERISTICS FOR NORMALIZATION
CBSE
Year Maths Physics Chemistry Computer Science Bio Technology Biology
Mean SD Max
Mark
Mean SD Max
Mark
Mean SD Max
Mark
Mean SD Max
Mark
Mean SD Max
Mark
Mean SD Max
Mark
2011 62.7051 20.7047 100 63.7192 15.0092 100 66.2680 15.7433 100 66.2680 15.7433 100 66.2680 15.7433 100
2000 63.6551 19.6299 100 64.4400 15.4488 100 67.6668 15.8602 100
2001 63.6551 19.6299 100 64.4400 15.4488 100 67.6668 15.8602 100
2004 63.6551 19.6299 100 64.4400 15.4488 100 67.6668 15.8602 100
2006 63.6551 19.6299 100 64.4400 15.4488 100 67.6668 15.8602 100
2007 63.6551 19.6299 100 64.4400 15.4488 100 67.6668 15.8602 100
2008 63.6551 19.6299 100 64.4400 15.4488 100 67.6668 15.8602 100
2009 63.6551 19.6299 100 64.4400 15.4488 100 67.6668 15.8602 100
2010 59.7533 18.4876 100 63.4423 15.6465 100 68.1387 16.1242 100
CISCE
Year Maths Physics Chemistry Computer Science Bio Technology Biology
Mean SD Max
Mark
Mean SD Max
Mark
Mean SD Max
Mark
Mean SD Max
Mark
Mean SD Max
Mark
Mean SD Max
Mark
2011 69.0567 17.2156 100 66.6313 16.0099 100 65.4119 15.5488 100 65.4119 15.5488 100 65.4119 15.5488 100
1993 68.6651 17.2041 100 65.1949 15.7664 100 67.6384 14.5842 100
2009 71.7961 17.7092 100 64.7680 15.5981 100 66.2046 14.6327 100
2010 69.3113 17.2927 100 62.2029 16.0010 100 64.0780 14.3904 100
Aligarh Muslim University Senior Secondary School Certificate Examination
Year Maths Physics Chemistry Computer Science Bio Technology Biology
Mean SD Max
Mark
Mean SD Max
Mark
Mean SD Max
Mark
Mean SD Max
Mark
Mean SD Max
Mark
Mean SD Max
Mark
2010 70.0921 19.1419 100 55.7706 14.0679 100 59.1102 13.8266 100
Bhutan Board of Examinations
Year Maths Physics Chemistry Computer Science Bio Technology Biology
Mean SD Max
Mark
Mean SD Max
Mark
Mean SD Max
Mark
Mean SD Max
Mark
Mean SD Max
Mark
Mean SD Max
Mark
2010 59.7533 18.4876 100 63.4423 15.6465 100 68.1387 16.1242 100

Page 2 of 6
Andhra Pradesh Board of Intermediate Education
Year Maths Physics Chemistry Computer Science Bio Technology Biology
Mean SD Max
Mark
Mean SD Max
Mark
Mean SD Max
Mark
Mean SD Max
Mark
Mean SD Max
Mark
Mean SD Max
Mark
2010 78.1732 17.1543 150 76.2520 13.5457 90 77.3182 13.3972 90
2011 78.0882 16.9447 150 74.5621 13.7806 90 79.7504 12.1429 90
Bihar Board of School Education
Year Maths Physics Chemistry Computer Science Bio Technology Biology
Mean SD Max
Mark
Mean SD Max
Mark
Mean SD Max
Mark
Mean SD Max
Mark
Mean SD Max
Mark
Mean SD Max
Mark
2009 63.6551 19.6299 100 64.4400 15.4488 100 67.6668 15.8602 100
2010 59.7533 18.4876 100 63.4423 15.6465 100 68.1387 16.1242 100
2011 62.7051 20.7047 100 63.7192 15.0092 100 66.2680 15.7433 100
Board of School Education Haryana
Year Maths Physics Chemistry Computer Science Bio Technology Biology
Mean SD Max
Mark
Mean SD Max
Mark
Mean SD Max
Mark
Mean SD Max
Mark
Mean SD Max
Mark
Mean SD Max
Mark
2010 64.0314 12.3145 100 69.3974 9.0749 100 70.9029 9.2067 100
2011 64.0314 12.3145 100 69.3974 9.0749 100 70.9029 9.2067 100
Board of Secondary Education (Indian School) Indonesia
Year Maths Physics Chemistry Computer Science Bio Technology Biology
Mean SD Max
Mark
Mean SD Max
Mark
Mean SD Max
Mark
Mean SD Max
Mark
Mean SD Max
Mark
Mean SD Max
Mark
2011 62.7051 20.7047 100 63.7192 15.0092 100 66.2680 15.7433 100
Chhattisgarh Board of Secondary Education
Year Maths Physics Chemistry Computer Science Bio Technology Biology
Mean SD Max
Mark
Mean SD Max
Mark
Mean SD Max
Mark
Mean SD Max
Mark
Mean SD Max
Mark
Mean SD Max
Mark
2011 57.4953 18.5014 100 55.5922 10.8549 100 56.2326 11.1635 100
University of Cambridge
Page 3 of 6
Year Maths Physics Chemistry Computer Science Bio Technology Biology
Mean SD Max
Mark
Mean SD Max
Mark
Mean SD Max
Mark
Mean SD Max
Mark
Mean SD Max
Mark
Mean SD Max
Mark
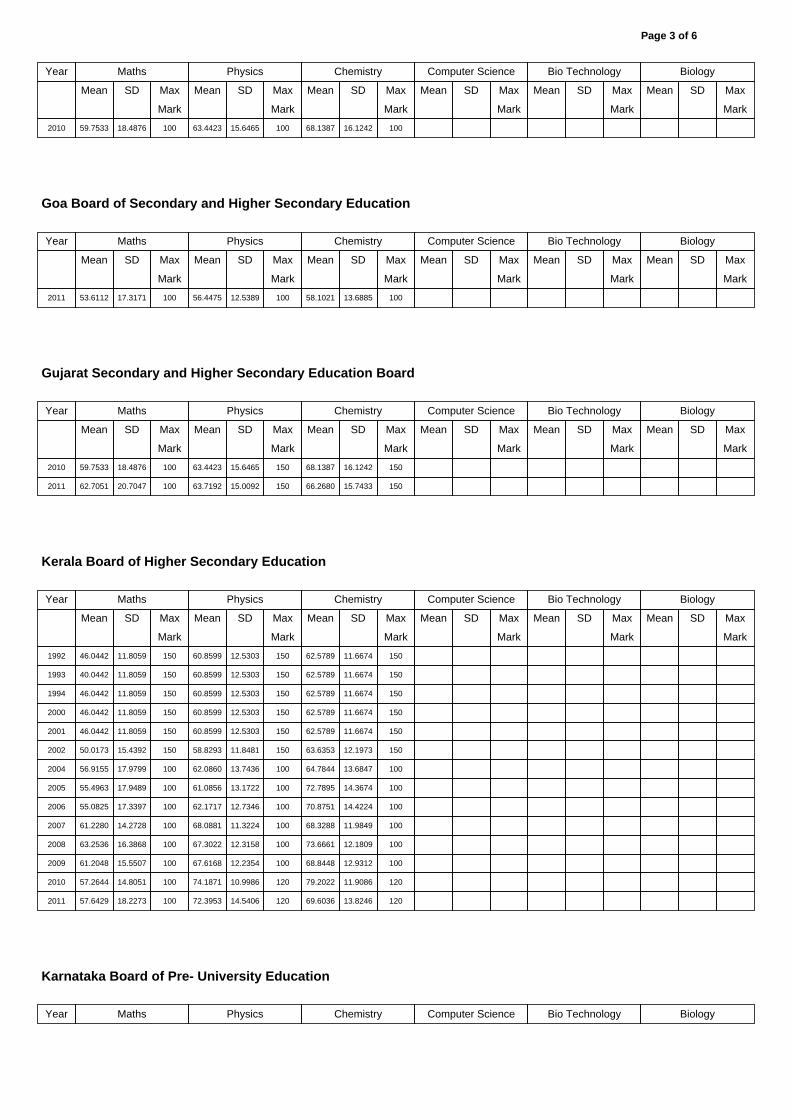
2010 59.7533 18.4876 100 63.4423 15.6465 100 68.1387 16.1242 100
Goa Board of Secondary and Higher Secondary Education
Year Maths Physics Chemistry Computer Science Bio Technology Biology
Mean SD Max
Mark
Mean SD Max
Mark
Mean SD Max
Mark
Mean SD Max
Mark
Mean SD Max
Mark
Mean SD Max
Mark
2011 53.6112 17.3171 100 56.4475 12.5389 100 58.1021 13.6885 100
Gujarat Secondary and Higher Secondary Education Board
Year Maths Physics Chemistry Computer Science Bio Technology Biology
Mean SD Max
Mark
Mean SD Max
Mark
Mean SD Max
Mark
Mean SD Max
Mark
Mean SD Max
Mark
Mean SD Max
Mark
2010 59.7533 18.4876 100 63.4423 15.6465 150 68.1387 16.1242 150
2011 62.7051 20.7047 100 63.7192 15.0092 150 66.2680 15.7433 150
Kerala Board of Higher Secondary Education
Year Maths Physics Chemistry Computer Science Bio Technology Biology
Mean SD Max
Mark
Mean SD Max
Mark
Mean SD Max
Mark
Mean SD Max
Mark
Mean SD Max
Mark
Mean SD Max
Mark
1992 46.0442 11.8059 150 60.8599 12.5303 150 62.5789 11.6674 150
1993 40.0442 11.8059 150 60.8599 12.5303 150 62.5789 11.6674 150
1994 46.0442 11.8059 150 60.8599 12.5303 150 62.5789 11.6674 150
2000 46.0442 11.8059 150 60.8599 12.5303 150 62.5789 11.6674 150
2001 46.0442 11.8059 150 60.8599 12.5303 150 62.5789 11.6674 150
2002 50.0173 15.4392 150 58.8293 11.8481 150 63.6353 12.1973 150
2004 56.9155 17.9799 100 62.0860 13.7436 100 64.7844 13.6847 100
2005 55.4963 17.9489 100 61.0856 13.1722 100 72.7895 14.3674 100
2006 55.0825 17.3397 100 62.1717 12.7346 100 70.8751 14.4224 100
2007 61.2280 14.2728 100 68.0881 11.3224 100 68.3288 11.9849 100
2008 63.2536 16.3868 100 67.3022 12.3158 100 73.6661 12.1809 100
2009 61.2048 15.5507 100 67.6168 12.2354 100 68.8448 12.9312 100
2010 57.2644 14.8051 100 74.1871 10.9986 120 79.2022 11.9086 120
2011 57.6429 18.2273 100 72.3953 14.5406 120 69.6036 13.8246 120
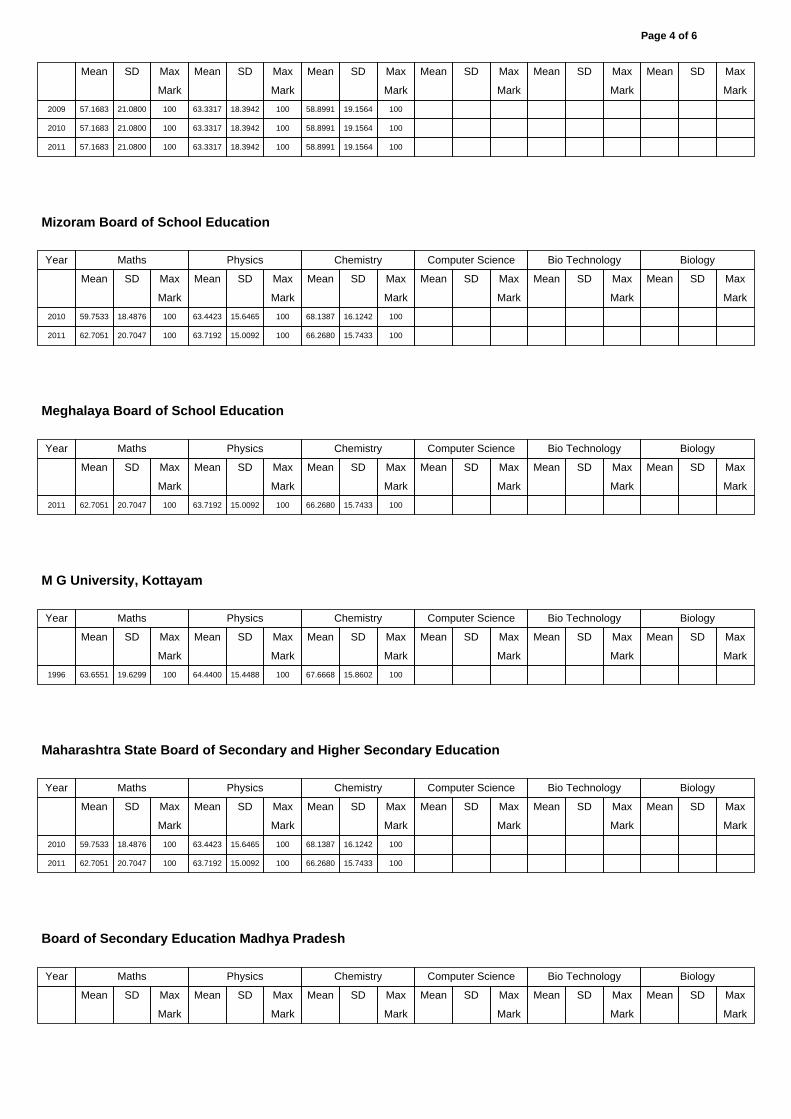
Karnataka Board of Pre- University Education
Year Maths Physics Chemistry Computer Science Bio Technology Biology
Page 4 of 6
Mean SD Max
Mark
Mean SD Max
Mark
Mean SD Max
Mark
Mean SD Max
Mark
Mean SD Max
Mark
Mean SD Max
Mark
2009 57.1683 21.0800 100 63.3317 18.3942 100 58.8991 19.1564 100
2010 57.1683 21.0800 100 63.3317 18.3942 100 58.8991 19.1564 100
2011 57.1683 21.0800 100 63.3317 18.3942 100 58.8991 19.1564 100
Mizoram Board of School Education
Year Maths Physics Chemistry Computer Science Bio Technology Biology
Mean SD Max
Mark
Mean SD Max
Mark
Mean SD Max
Mark
Mean SD Max
Mark
Mean SD Max
Mark
Mean SD Max
Mark
2010 59.7533 18.4876 100 63.4423 15.6465 100 68.1387 16.1242 100
2011 62.7051 20.7047 100 63.7192 15.0092 100 66.2680 15.7433 100
Meghalaya Board of School Education
Year Maths Physics Chemistry Computer Science Bio Technology Biology
Mean SD Max
Mark
Mean SD Max
Mark
Mean SD Max
Mark
Mean SD Max
Mark
Mean SD Max
Mark
Mean SD Max
Mark
2011 62.7051 20.7047 100 63.7192 15.0092 100 66.2680 15.7433 100
M G University, Kottayam
Year Maths Physics Chemistry Computer Science Bio Technology Biology
Mean SD Max
Mark
Mean SD Max
Mark
Mean SD Max
Mark
Mean SD Max
Mark
Mean SD Max
Mark
Mean SD Max
Mark
1996 63.6551 19.6299 100 64.4400 15.4488 100 67.6668 15.8602 100
Maharashtra State Board of Secondary and Higher Secondary Education
Year Maths Physics Chemistry Computer Science Bio Technology Biology
Mean SD Max
Mark
Mean SD Max
Mark
Mean SD Max
Mark
Mean SD Max
Mark
Mean SD Max
Mark
Mean SD Max
Mark
2010 59.7533 18.4876 100 63.4423 15.6465 100 68.1387 16.1242 100
2011 62.7051 20.7047 100 63.7192 15.0092 100 66.2680 15.7433 100
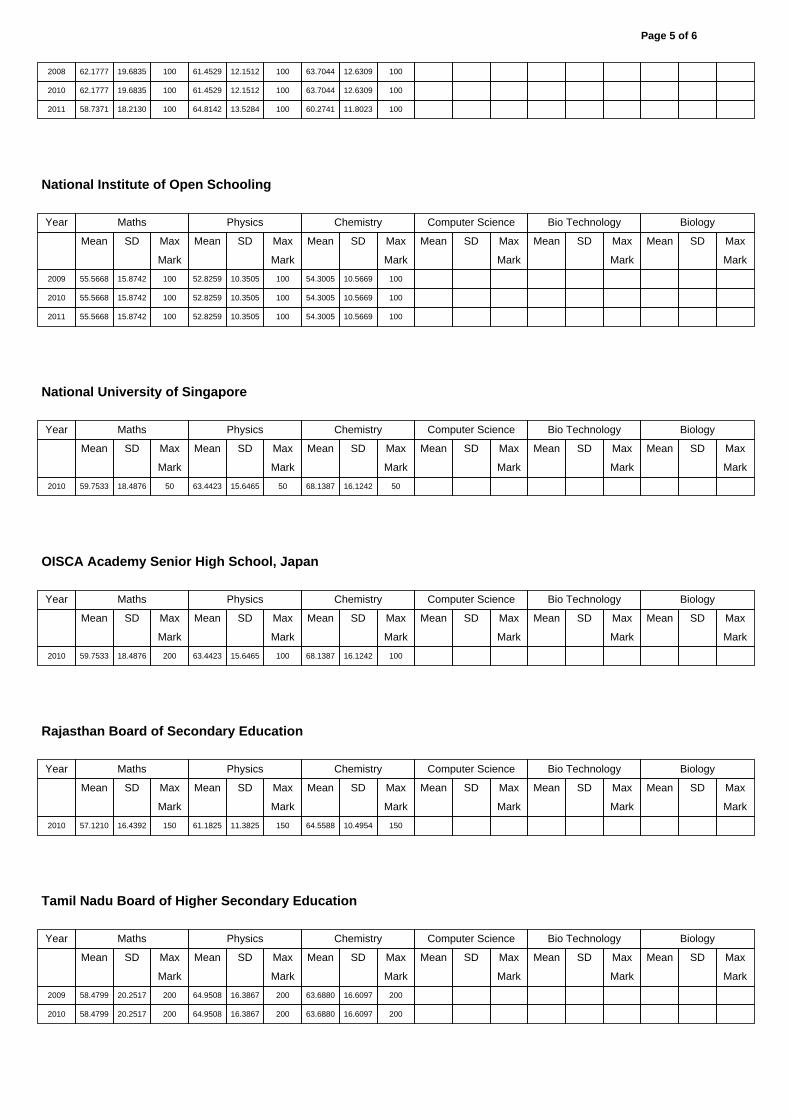
Board of Secondary Education Madhya Pradesh
Year Maths Physics Chemistry Computer Science Bio Technology Biology
Mean SD Max
Mark
Mean SD Max
Mark
Mean SD Max
Mark
Mean SD Max
Mark
Mean SD Max
Mark
Mean SD Max
Mark
Page 5 of 6
2008 62.1777 19.6835 100 61.4529 12.1512 100 63.7044 12.6309 100
2010 62.1777 19.6835 100 61.4529 12.1512 100 63.7044 12.6309 100
2011 58.7371 18.2130 100 64.8142 13.5284 100 60.2741 11.8023 100
National Institute of Open Schooling
Year Maths Physics Chemistry Computer Science Bio Technology Biology
Mean SD Max
Mark
Mean SD Max
Mark
Mean SD Max
Mark
Mean SD Max
Mark
Mean SD Max
Mark
Mean SD Max
Mark
2009 55.5668 15.8742 100 52.8259 10.3505 100 54.3005 10.5669 100
2010 55.5668 15.8742 100 52.8259 10.3505 100 54.3005 10.5669 100
2011 55.5668 15.8742 100 52.8259 10.3505 100 54.3005 10.5669 100
National University of Singapore
Year Maths Physics Chemistry Computer Science Bio Technology Biology
Mean SD Max
Mark
Mean SD Max
Mark
Mean SD Max
Mark
Mean SD Max
Mark
Mean SD Max
Mark
Mean SD Max
Mark
2010 59.7533 18.4876 50 63.4423 15.6465 50 68.1387 16.1242 50
OISCA Academy Senior High School, Japan
Year Maths Physics Chemistry Computer Science Bio Technology Biology
Mean SD Max
Mark
Mean SD Max
Mark
Mean SD Max
Mark
Mean SD Max
Mark
Mean SD Max
Mark
Mean SD Max
Mark
2010 59.7533 18.4876 200 63.4423 15.6465 100 68.1387 16.1242 100
Rajasthan Board of Secondary Education
Year Maths Physics Chemistry Computer Science Bio Technology Biology
Mean SD Max
Mark
Mean SD Max
Mark
Mean SD Max
Mark
Mean SD Max
Mark
Mean SD Max
Mark
Mean SD Max
Mark
2010 57.1210 16.4392 150 61.1825 11.3825 150 64.5588 10.4954 150
Tamil Nadu Board of Higher Secondary Education
Year Maths Physics Chemistry Computer Science Bio Technology Biology
Mean SD Max
Mark
Mean SD Max
Mark
Mean SD Max
Mark
Mean SD Max
Mark
Mean SD Max
Mark
Mean SD Max
Mark
2009 58.4799 20.2517 200 64.9508 16.3867 200 63.6880 16.6097 200
2010 58.4799 20.2517 200 64.9508 16.3867 200 63.6880 16.6097 200
Page 6 of 6
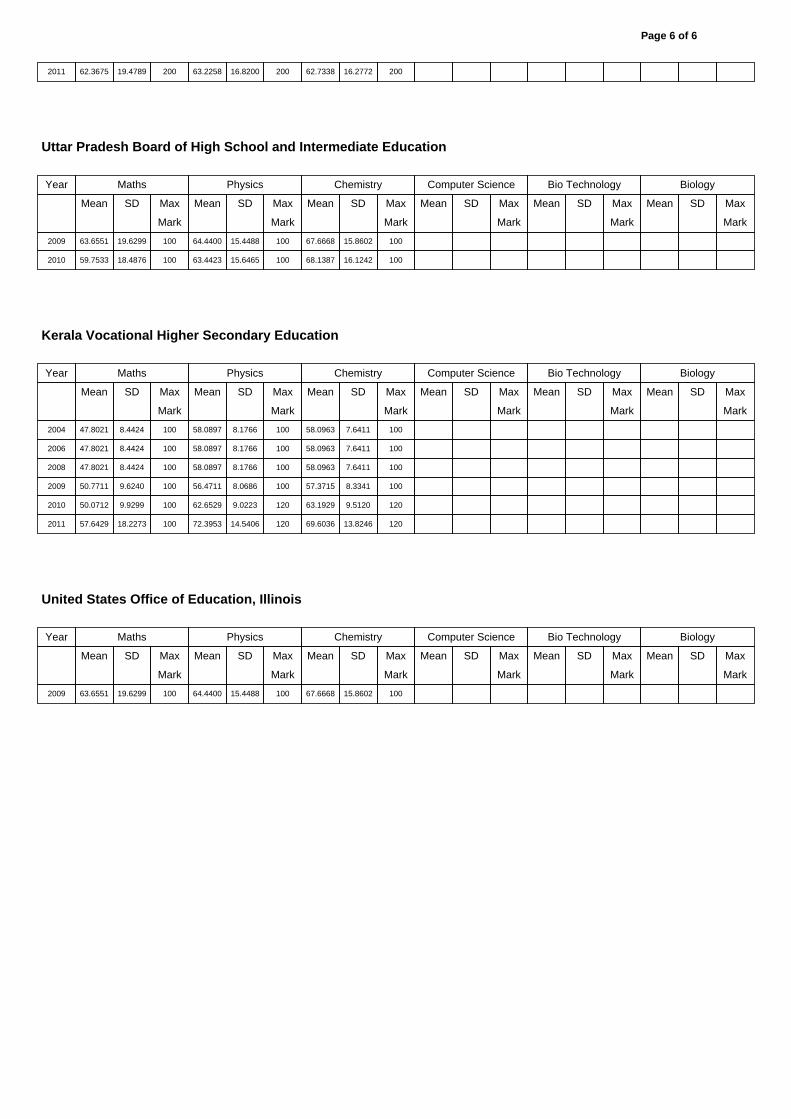
2011 62.3675 19.4789 200 63.2258 16.8200 200 62.7338 16.2772 200
Uttar Pradesh Board of High School and Intermediate Education
Year Maths Physics Chemistry Computer Science Bio Technology Biology
Mean SD Max
Mark
Mean SD Max
Mark
Mean SD Max
Mark
Mean SD Max
Mark
Mean SD Max
Mark
Mean SD Max
Mark
2009 63.6551 19.6299 100 64.4400 15.4488 100 67.6668 15.8602 100
2010 59.7533 18.4876 100 63.4423 15.6465 100 68.1387 16.1242 100
Kerala Vocational Higher Secondary Education
Year Maths Physics Chemistry Computer Science Bio Technology Biology
Mean SD Max
Mark
Mean SD Max
Mark
Mean SD Max
Mark
Mean SD Max
Mark
Mean SD Max
Mark
Mean SD Max
Mark
2004 47.8021 8.4424 100 58.0897 8.1766 100 58.0963 7.6411 100
2006 47.8021 8.4424 100 58.0897 8.1766 100 58.0963 7.6411 100
2008 47.8021 8.4424 100 58.0897 8.1766 100 58.0963 7.6411 100
2009 50.7711 9.6240 100 56.4711 8.0686 100 57.3715 8.3341 100
2010 50.0712 9.9299 100 62.6529 9.0223 120 63.1929 9.5120 120
2011 57.6429 18.2273 100 72.3953 14.5406 120 69.6036 13.8246 120
United States Office of Education, Illinois
Year Maths Physics Chemistry Computer Science Bio Technology Biology
Mean SD Max
Mark
Mean SD Max
Mark
Mean SD Max
Mark
Mean SD Max
Mark
Mean SD Max
Mark
Mean SD Max
Mark
2009 63.6551 19.6299 100 64.4400 15.4488 100 67.6668 15.8602 100
ENG INEER ING ENTRANCE EXAMINAT IONS