engineering fracture mechanics - mines...
TRANSCRIPT

Engineering Fracture Mechanics 141 (2015) 95–110
Contents lists available at ScienceDirect
Engineering Fracture Mechanics
journal homepage: www.elsevier .com/locate /engfracmech
Influence of static strain aging on the cleavage fractureof a C–Mn steel
http://dx.doi.org/10.1016/j.engfracmech.2015.04.0350013-7944/� 2015 Elsevier Ltd. All rights reserved.
⇑ Corresponding author.E-mail address: [email protected] (M. Mazière).
A. Marais a,b, M. Mazière a,⇑, S. Forest a, A. Parrot b, P. Le Delliou b
a Mines ParisTech, Centre des Matériaux, CNRS UMR7633, BP 87, 91003 Evry Cedex, Franceb EDF R&D/MMC, Site des Renardières, 77818 Moret s/Loing Cedex, France
a r t i c l e i n f o
Article history:Received 17 June 2014Received in revised form 21 January 2015Accepted 30 April 2015Available online 14 May 2015
Keywords:Lüders bandCleavage fractureCharpy impact testPiobert–LüdersNumerical modeling
a b s t r a c t
Recent advances in the constitutive modeling of strain aging effects in elastoviscoplasticityare used to predict the ductile-to-brittle transition curve for a C–Mn steel depending onpre-straining and heat treatment. The parameters of the Beremin model are identified froma large experimental basis of Charpy tests. 3D finite element simulations of CharpyV-notched specimens based on a constitutive model accounting for static strain aging,are performed for the first time to predict the fracture behavior of the pre-strained andaged material. The constitutive model includes the strain localization phenomena occur-ring in the notch due to Lüders effects. Good agreement between experiment and modelingis demonstrated. The introduction of kinematic hardening improves the prediction of thelower part of the ductile-to-brittle transition region. The proposed approach aims at opti-mizing pre-strain values and heat treatments for nuclear steels.
� 2015 Elsevier Ltd. All rights reserved.
1. Introduction
The local approach to fracture is based, first, on a detailed metallurgical description of deformation and fracture mecha-nisms in metals and alloys, second, on a precise constitutive modeling of the elastoviscoplastic material behavior and, third,on coupled or uncoupled fracture criteria [13,39]. One major recent success of this approach has been to reconcile the inter-pretation in terms of fracture toughness of Charpy test results and fracture of Compact Tension specimens. In particular,some of the difficulties in the experimental and computational analysis of the Charpy test have been overcome in a seriesof works [45,43,44,27,26,52,53,47,49]. These works address in particular the Charpy tests at low temperature and theductile-to-brittle transition in nuclear steels.
At low temperature and in the transition, cleavage is the main mechanism for brittle fracture in the ferritic nuclear steels,even though cleavage is always accompanied locally by intragranular plastic slip which becomes dominant with increasingtemperature [41]. The fracture properties in the low temperature and transition regimes are statistical by nature due to thedistribution of defects including inclusions or second phase in the material. They are very often satisfactorily described bymeans of the Beremin model which relates the Weibull distribution of fracture probability to a power-law distribution ofdefects and plasticity phenomena [10,11]. Such statistical fracture models can be applied to fracture mechanics samples likeCT specimens [60], Charpy tests and structural components. They benefit from a detailed knowledge of the distribution ofdefects [51] and can incorporate the influence of loading rate [42]. More elaborate statistical models of fracture can be foundin Bordet et al. [15].
Nomenclature
CVN Charpy V-notch impact energy (J)D � strain rate tensorEa activation energy (eV)J2ðr�Þ von Mises equivalent stresskB Boltzmann constant (1.38e�23 J/K)L�
gradient of velocity fieldm Weibull exponentp cumulated plastic strain_p cumulated plastic strain rate (s�1)Pr failure probabilityQ�
material rotation
ta current aging time (s)ta0 initial aging time (s)T temperature (K)T�
Cauchy stress tensor (MPa)
Va activation volumeX�
kinematic hardening stress tensor (MPa)
a�
hardening internal variable
K�
tensor of elastic moduli (MPa)q current dislocation density (m�2)q0 initial dislocation density (m�2)q5% dislocation density for the 5% pre-strained state (m�2)_e�
observer invariant strain rate tensor_e�e elastic strain rate tensor_e�p plastic strain rate tensor
r�
observer invariant stress tensor (MPa)
rw Weibull stress (MPa)rI maximum principal stress (MPa)
96 A. Marais et al. / Engineering Fracture Mechanics 141 (2015) 95–110
Strain aging characterizes the mechanical behavior of most nuclear steels due to the interaction of solute atoms present inthe alloys and dislocations [16,54]. Static strain aging (SSA) is observed at lower temperature for instance in the form ofLüders peak stress and plateau accompanied by the propagation of plastic strain localization bands along the sample orat geometrical singularities in structural components. In service conditions at higher temperatures very often correspondto the domain of dynamic strain aging (DSA) which can be associated with the Portevin–Le Chatelier effect, i.e. the formationand propagation of plastic strain rate localization bands. In the context of fracture mechanics, the Lüders and Portevin–LeChatelier effects are usually not taken into account in the computational modeling of fracture processes. Heuristic rulesare chosen to fix the initial yield stress and the strain localization phenomena are not incorporated. DSA effects are smoothedout and the possible negative strain rate sensitivity is usually not accounted for. However, reliable constitutive equationshave been available for more than ten years that include the strain aging effects in the elastoviscoplastic material laws.The associated instabilities have been investigated by Mesarovic [35], Benallal [6], and Benallal et al. [8,7]. Finite element(FE) simulations of plastic strain and strain rate phenomena in tensile or fracture mechanics samples were first performedby Zhang et al. [63] and Graff et al. [20,21] for aluminum alloys and mild steel. The constitutive models are mature for full 3Dimplicit FE computations and detailed comparison with experimental data like strain field measurements, as done for theLüders effect by Ballarin et al. [4,3], Hallai and Kyriakides [23,24], Marais et al. [30], and Hallai and Kyriakides [25]. The sim-ulations include the local stress and strain rate concentration induced by the development of spatio-temporal instabilities.
The importance of strain aging on the fracture properties of engineering steels is well recognized in the mechanical met-allurgy community. DSA effects in C–Mn steels were investigated by Wagner et al. [55–57], for CT specimens but also inwelded zones, taking heat treatments into account. More recent works are based on constitutive modeling of dynamic strainaging and explicit modeling of PLC bands in notched and CT specimens [5,58,59,9]. In the latter work, it was shown that areduction of ductility is observed in the DSA domain of material behavior. The impact of static strain aging on fracture tough-ness was first addressed in Houssin et al. [28] and Amar and Pineau [1] in the case of CT specimens. Recent contributionsmake use of Zhang and McCormick’s model for the computation of the elastoviscoplastic response of a CT specimen, includ-ing a detailed 3D analysis of strain localization phenomena at the crack tip by Wenman and Chard-Tuckey [61].
What is missing in the literature is the direct use of strain aging constitutive models for the prediction of brittle-to ductiletransition curves. This is the objective of the present work in the case of a C–Mn nuclear steel. For that purpose, the proposedmethodology combines the tools of local approach to fracture as presented in Pineau [40] and the detailed elastoviscoplastic
A. Marais et al. / Engineering Fracture Mechanics 141 (2015) 95–110 97
constitutive modeling of static strain aging in this alloy, as established by Marais et al. [30]. Novel aspects of the work includethe direct simulation of Charpy tests at different temperatures and the identification of a statistical fracture model deliveringthe ductile-to-brittle transition curve as a function of SSA induced by pre-straining, heat treatment and loading path history.
The outline of the paper is as follows. The experimental methods and mechanical test results are presented in Section 2.They include the Charpy V-notch (CVN) test results for three different material strain aging states over a range of temper-atures from �100 �C to 100 �C. The equations and material parameters of the constitutive model accounting for strain agingdependent elastoviscoplasticity are given in Section 3. In the same section, the finite element results of the CVN simulationsare used to identify the Beremin model for the base material state. Predictions of the constitutive and fracture models arethen provided for other aging states and compared to experimental results. The influence of the Bauschinger effect onCVN predictions at the lower part of the ductile-to-brittle transition region is also investigated. The results are finally dis-cussed in Section 4.
2. Experimental procedure
2.1. Material
All experiments were conducted on a C–Mn steel used for pipes of the secondary circuit in power plants, called here A42,whose chemical composition is given in Table 1. This alloy is very sensitive to strain aging due to the small Al content. Thematerial is extracted from a seamless secondary coolant pipe obtained by a circular rolling process. The microstructure iscomposed of ferrite and pearlite in alternate bands along planes parallel to the axial and circumferential directions. The crys-tallographic texture was not analyzed. However, the cross-section of cylindrical tensile specimens remains circular up tofracture strain. This indicates a quasi-isotropic mechanical behavior at least in the long and short transverse plane. By exten-sion, we considered the mechanical behavior as fully isotropic, weakly affected by the morphological texture, nor by thecrystallographic texture, thus following Belotteau et al. [5].
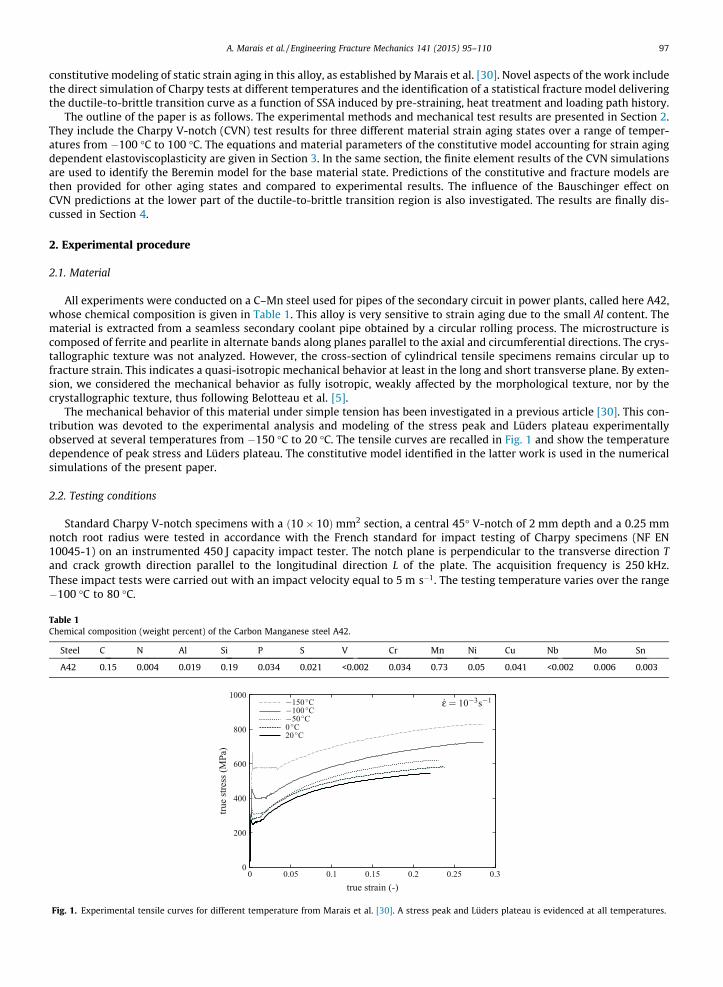
The mechanical behavior of this material under simple tension has been investigated in a previous article [30]. This con-tribution was devoted to the experimental analysis and modeling of the stress peak and Lüders plateau experimentallyobserved at several temperatures from �150 �C to 20 �C. The tensile curves are recalled in Fig. 1 and show the temperaturedependence of peak stress and Lüders plateau. The constitutive model identified in the latter work is used in the numericalsimulations of the present paper.
2.2. Testing conditions
Standard Charpy V-notch specimens with a ð10� 10Þmm2 section, a central 45� V-notch of 2 mm depth and a 0.25 mmnotch root radius were tested in accordance with the French standard for impact testing of Charpy specimens (NF EN10045-1) on an instrumented 450 J capacity impact tester. The notch plane is perpendicular to the transverse direction Tand crack growth direction parallel to the longitudinal direction L of the plate. The acquisition frequency is 250 kHz.These impact tests were carried out with an impact velocity equal to 5 m s�1. The testing temperature varies over the range�100 �C to 80 �C.
Table 1Chemical composition (weight percent) of the Carbon Manganese steel A42.
Steel C N Al Si P S V Cr Mn Ni Cu Nb Mo Sn
A42 0.15 0.004 0.019 0.19 0.034 0.021 <0.002 0.034 0.73 0.05 0.041 <0.002 0.006 0.003
20 ◦C0 ◦C−50 ◦C−100 ◦C−150 ◦C ε̇ = 10−3s−1
true strain (-)
true
stre
ss(M
Pa)
0.30.250.20.150.10.050
1000
800
600
400
200
0
Fig. 1. Experimental tensile curves for different temperature from Marais et al. [30]. A stress peak and Lüders plateau is evidenced at all temperatures.

Table 2Number of specimens tested for each state and each temperature. Dispersion of results is determined using the numerous experiments at �20 �C.
Charpy impact tests Temperature (�C)
�100 �50 �20 0 20 40 60 80
BS 2 2 20 3 3 � 2 25% pre-strained 2 2 18 3 5 2 2 25% pre-strained + aged 2 2 18 3 5 2 2 2
98 A. Marais et al. / Engineering Fracture Mechanics 141 (2015) 95–110
Three different states for the C–Mn steel were tested using the same procedure. The first state is denoted ‘‘BS’’ and cor-responds to the as-received material without any additional heat treatment or pre-straining. The second material statedenoted ‘‘5% pre-strained’’ was designed in order to study the influence of pre-straining on fracture. Numerous Charpy spec-imens were then cut in a 5% pre-strained 710 mm � 40 mm � 40 mm bar. This pre-straining was carried out along the trans-verse orientation (T) of the plate. The third material state is denoted ‘‘5% pre-strained + aged’’. Half of the specimens cut fromthe pre-strained bar were subjected to an aging heat treatment (30 min at 250 �C) in order to generate this last materialstate. The influence of the aging heat treatment on fracture is investigated by comparison of these specimens with the‘‘5% pre-strained’’ ones. The number of Charpy tests performed for each material state and each temperature is given inTable 2.
2.3. Fracture tests
Representative Charpy experimental load displacement curves for the three aforementioned material states are shown inFig. 2 for temperature T = 0 �C and T = 20 �C. The load level is higher for the 5% pre-strained and 5% pre-strained + aged statesthan for the base state because of hardening. The height of the second peak is also higher for the 5% pre-strained + aged thanfor the 5% pre-strained as expected due to the aging effect. At both temperatures, the energy required to break the specimensseems to be smaller in the 5% pre-strained + aged state than for the 5% pre-strained, than for the state BS.
(a)
5% strain + aged 30min 250◦C5% strain
BS
T=0◦C
Displacement (mm)
Load
(kN
)
543210
18
16
14
12
10
8
6
4
2
0
(b)
5% strain + aged 30min 250◦C5% strain
BS
T=20◦C
Displacement (mm)
Load
(kN
)
1086420
18
16
14
12
10
8
6
4
2
0
Fig. 2. Load–displacement curves for Charpy test on the 3 material states: (a) at 0 �C and (b) at 20 �C.

5% strain + aged5% strain
BS
temperature (◦C)
Cha
rpy
impa
cten
ergy
CV
N(J
)
-100 -80 -60 -40 -20 0 20 40 60 80 100
100
80
60
40
20
0
Fig. 3. Charpy fracture energy transition curves of C–Mn steel for Charpy specimens tested at different states, BS, 5% pre-strained and 5% pre-strained + aged.
Table 3Parameters of the CVN energy fitting function and index TK7 for different material states.
Material state A (J) B (J) T0 (�C) C TK7 (�C)
BS 48.4 42.4 8.67 30.29 13.25% pre-strained 54.2 45.4 27.39 13.67 285% pre-strained + aged 52.96 48.4 35.17 28.65 37
A. Marais et al. / Engineering Fracture Mechanics 141 (2015) 95–110 99
The material state significantly affects the dependence of experimental Charpy impact energies on temperature, as shownin Fig. 3. The energies of the Charpy V-notch (CVN) tests obtained from Table 2 were fitted for each state with an hyperbolictangent function of temperature as proposed by Oldfield [38]:
CVNðJÞ ¼ Aþ B tanh ðT � T0Þ=Cð Þ ð1Þ
Parameters A;B;C; T0 of Eq. (1) are given in Table 3. For each condition, only the three first experiments were taken intoaccount at �20 �C in the parameter identification in order to give to this temperature the same weight as the other ones.The temperature denoted TK7 is also reported in Table 3 since this temperature is currently used in Charpy impact tests anal-
ysis. It is defined as the temperature for which the CVN energy is 56 J (CVN=Sr ¼ 7 da J=cm2 with Sr the fracture surface,Sr ¼ 0:8 cm2).
The ductile-to-brittle transition is shifted towards higher temperatures for the 5% pre-strained state. This shift isincreased for the 5% pre-strained + aged state, as shown by the corresponding value of the TK7 parameter from Table 3.
The scatter of CVN energies at �20 �C for the three material states is plotted in Fig. 4 for the three material states. Themean value of this energy decreases from 18.1 J to 10.5 J for the base and 5% pre-strained states respectively, and to7.29 J for the 5% pre-strained + aged state. This result is consistent with the transition curves plotted in Fig. 3. A large numberof experiments were carried out at this temperature (almost 20 for each state) so as to obtain a reliable estimation of thescatter which is high at this temperature. The standard deviation follows the same trend as the mean value and decreasesfrom 7.8 J for the based state to 2.57 J for the 5% pre-strained state and to 1.43 J for the 5% pre-strained + aged state. The scat-ter of experimental results is therefore significantly affected by the pre-strain and by the aging treatment.
Based on all these results (Figs. 3 and 4), it can be concluded that at �20 �C, the material in its as-received state still is inthe ductile-to-brittle transition. In contrast at the same temperature for the two other conditions, the material is below thetransition in the brittle fracture domain and the ductile-to-brittle transition is then shifted towards higher temperatures. Theshift in the transition domain is emphasized by the aging treatment applied to the prestrained material, and can lead tounexpected failure of the material.
3. Numerical modeling
3.1. Constitutive equations
The simulation of strain aging requires a suitable choice of an elastoviscoplasticity model including the physical mech-anisms of pinning and unpinning of dislocations. The model retained in this work and initially proposed by Kubin, Estrin,McCormick [29,34] is based on the introduction of an internal variable ta called aging time with a suited evolution law cou-pled with plastic flow. It has been implemented in the finite element code Zset and used in several previous studies

Fig. 4. CVN energies at �20 �C (scatter temperature) for the 3 material states, including the corresponding average values and standard deviations.
100 A. Marais et al. / Engineering Fracture Mechanics 141 (2015) 95–110
[5,31,58,32]. For more details about the model, its implementation and the identification process, the reader is referred to aprevious article by the same authors [30].
A finite strain formulation for isotropic nonlinear material behavior is adopted in this work based on the concept of localobjective frame as proposed in Sidoroff and Dogui [48], Bertram [12], and Besson et al. [14]. Observer invariant stress andstrain rate measures r
�and _e
�are defined by transport of the Cauchy stress tensor T
�and the strain rate tensor D
�into the coro-
tational frame characterized by the rotation Q�ðx; tÞ. This change of frame takes place at each material point:8
r�¼ Q��T��Q�
T
_e�¼ Q��D��Q�
T
Q�
such as _Q�
T� Q�¼ X�ðcorotationalÞ
>>>>><>>>>>:
ð2Þ
where X�
is the skew-symmetric part of the gradient L�
of the velocity field, and D�
its symmetric part [48,14].
The strain rate tensor _e�
is split into elastic and plastic contributions, the evolution of the latter being given by the plastic
flow rule. The stress is computed from the elastic strain e�e through Hooke’s law:
_e�¼ _e�e þ _e
�p; r�¼ K�
: e�e ð3Þ
The plastic strain is computed from the normality rule
_e�p ¼ _p n
�; n
�¼ @f@ r�
ð4Þ
and the equivalent plastic strain rate _p follows a thermal activation law defined as:
_p ¼ _p0 sinhhf iK
� �¼ _e0 exp � Ea
kBT
� �sinh
Va f r�;q; ta
� �� �kBT
0BB@
1CCA ð5Þ
where T is the temperature in Kelvin, kB is the Boltzmann constant and _e0; Ea and Va respectively are a strain rate parameter,the activation energy and the activation volume of the physical mechanisms of plasticity.
The function f in Eq. (4) is the yield function which is based on a von Mises criterion with isotropic hardening:
f r�;q; ta
� �¼ J2ðr�Þ � RðqÞ � RaðtaÞ ð6Þ
RðqÞ ¼ r0 þ clbffiffiffiffiqp
; _q ¼ A 1� qB
� �_p; R0 ¼ r0 þ clb
ffiffiffiffiffiffiq0p ð7Þ

A. Marais et al. / Engineering Fracture Mechanics 141 (2015) 95–110 101
where J2ðr�Þ is the von Mises equivalent stress. The dislocation density q is introduced in the model (initial value q0). The
classical strain hardening is given by the term RðqÞ which follows the evolution law defined in Eq. (7), the multiplicationand dynamic recovery parameters characterizing the evolution law of this variable being A and B, respectively. The disloca-tion density evolution rule is driven by the cumulative plastic strain rate _p, as done for instance in Fressengeas et al. [19]. Theyield stress R0 is the ‘‘virtual’’ initial microscopic yield stress that would be measured in the same steel in the absence ofstatic strain aging.
The second contribution to the yield stress, RaðtaÞ, is due to strain aging, following [63,20,31]. It depends on an additionalinternal variable ta called the aging time, and takes the form
Table 4Constitu
T (�CE (GmR0 (Mr0 (Mq0 (mA (mB (m_e0 (sEa (eVa (bP1 (Mt0 (sta0 (xn
Bold w
RaðtaÞ ¼ P1CsðtaÞ; with Cs ¼ 1� exp � ta
t0
� �n ð8Þ
_ta ¼ 1� ta _px
ð9Þ
The strain aging term Ra is proportional to the variable Cs that is related to the over-concentration of solute atoms aroundpinned dislocations. This variable increases with the aging time ta, the condition corresponding to fully pinned dislocationsbeing given by Cs ¼ 1. The unpinned state corresponds to Cs ¼ 0. The parameter P1 corresponds to the maximal additionalstress needed to switch from unpinned to pinned conditions. The parameter t0 and the power n control the kinetics of thepinning and unpinning processes. Another parameter labeled x appears in the evolution law of the aging time. It is related tothe incremental strain resulting from the freeing of unpinned dislocations.
The identification of this model over a large range of temperatures (from �150 �C up to 20 �C) and strain rate (from1e�5 s�1 up to 1e�1 s�1) was carried out using numerous simple tensile experiments as described in Marais et al. [30].The identification procedure which takes into account the characteristics of the Lüders phenomenon is not recalled. Theparameters for the five temperatures of interest in the present work are given in Table 4.
3.2. Cleavage fracture prediction
The constitutive material model is associated with a non-coupled brittle (cleavage) fracture model according to Mudry[36,37], Beremin [11], and François et al. [18], which is one of the most popular local approach models in this area, denotedBeremin model. It is based on the hypothesis of a (temperature-independent) critical cleavage stress, and on weakest linktheory. The failure probability Pr is given as:
Pr ¼ 1� exp � rw
ru
� �m ð10Þ
with rw, the ‘‘Weibull stress’’
rw ¼ffiffiffiffiffiffiffiffiffiffiffiffiffiffiffiffiffiffiffiffiffiffiffiffiffiffiffiffiffiffiffiffiffiffiffiffiffiffiffiffiffiffiffiffiffiffiZ
Vpmax06s6tðrs
I Þm dV
V0
m
sð11Þ
where rsI denotes the maximum principal stress (here defined as its maximum value with time), m the Weibull exponent
which is related to the scatter in the distribution of defects responsible for fracture, and ru is closely linked to the intrinsiccleavage stress. The integral denotes the summation of rs
I over the entire plastified volume Vp of the structure (i.e., all
tive parameters describing elasticity, viscoplasticity, hardening and aging.
) �150 �100 �50 0 20Pa) 214 220 219 221 218
0.3 0.3 0.3 0.3 0.3Pa) 360 225 145 147 150Pa) 340 205 124 126 130�2) 1e13 1e13 1e13 1e13 1e13�2) 2.26e16 3.5e16 4.15e16 3.87e16 3.09e16�2) 1.47e16 9.2e15 8.08e15 5.12e15 5.11e15�1) 1e�7 1e�7 1e�7 1e�7 1e�7V) 0.0022 0.0022 0.0022 0.0022 0.00223) 27 59 90 121 133Pa) 396.6 316 285 220 183.2
) 3.49e13 1.24e12 2.81e8 1.01e5 1.59e4s) 3.49e13 1.24e12 2.81e8 1.01e5 1.59e4
5e�4 5e�4 5e�4 5e�4 5e�40.137 0.144 0.199 0.306 0.334
as a way to highlight the temperatures.
102 A. Marais et al. / Engineering Fracture Mechanics 141 (2015) 95–110
elements that have undergone plastic deformation), since plastic deformation is a necessary precursor to slip-induced cleav-age (e.g., by a dislocation pile-up mechanism). Two independent parameters are required: m and V0rm
u .The fracture criterion is thus based on one mechanical variable, i.e., namely the maximum positive principal stress.
Fracture is assumed to occur as soon as this quantity reaches a critical value for unstable propagation of a cleavagemicro-crack. There are some guidelines for the choice of V0. On the one hand, V0 should be large enough in order to allowfor the presence of a critical defect. On the other hand, V0 should be small enough in order to resolve strong stress gradients,as they occur ahead of a crack tip. In ‘‘local’’ FEM computations (i.e. if no averaging over several finite elements is carried out)the size of V0 is related to the mesh size, see [13]. Thus the choice of the mesh size is important for ductile crack growthmodeling, as well as for cleavage fracture modeling. V0 was chosen equal to (50 lm)3 [18].
The model parameters ru and m are first identified using Charpy impact tested at temperature �20 �C for the base state.Twenty tests were performed. The parameters are identified using an automatic identification procedure which minimizesthe quadratic difference between the theoretical and experimental failure probabilities [53] described briefly below:
1. For each Charpy experiment, the CVN energy is computed from the load vs. displacement curves, and experiments aresorted in ascending order.
2. The failure probability associated to the stress reached by specimen at rank i is evaluated using the following formula:Pexp
f ;i ¼ iNþ1 where N is the total number of specimens and i ¼ 1; . . . ;N the rank of the specimen.
3. The displacement (of the striker) at failure is evaluated for each experiment.4. A finite element simulation of the Charpy test at �20 �C is carried out beyond the maximal experimental displacement
reached by the 20 experiments. The corresponding finite element model is detailed in Section 3.3.5. For each calculation step corresponding to an experimental failure displacement, the experimental Weibull stress rexp
w isestimated from the finite element results.
6. The experimental evolution of Pexpf ;i as a function of rexp
w is compared to the Beremin model Pmodf ðrwÞ given by Eq. (10).
7. If both evolutions are in agreement, the iterative process is stopped. Otherwise, m and ru are modified and the algorithmgoes to step 5.
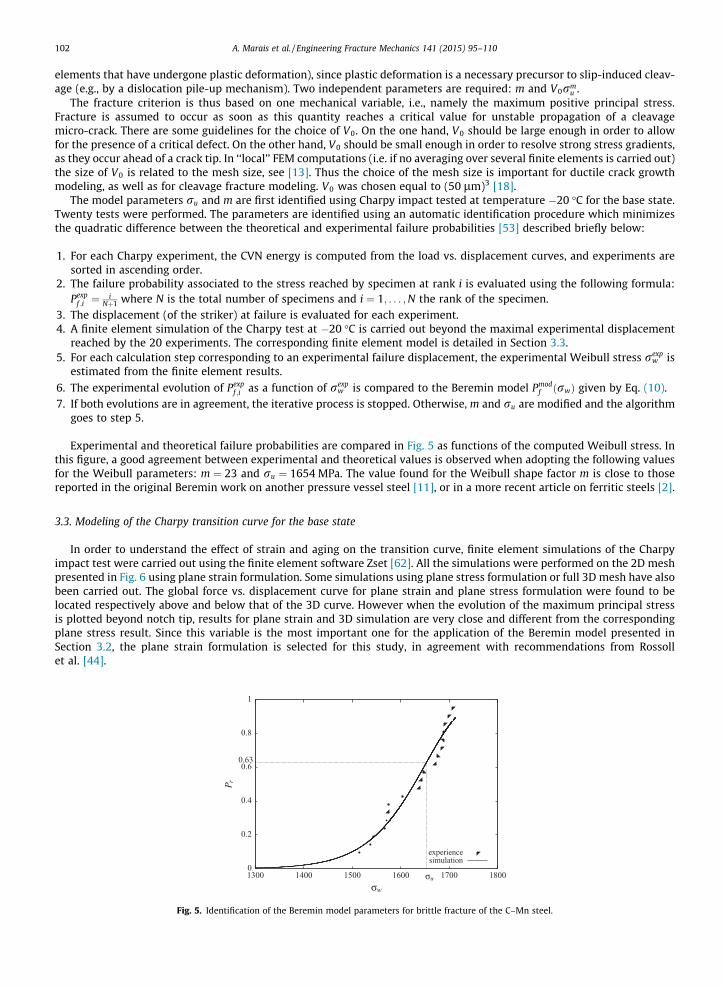
Experimental and theoretical failure probabilities are compared in Fig. 5 as functions of the computed Weibull stress. Inthis figure, a good agreement between experimental and theoretical values is observed when adopting the following valuesfor the Weibull parameters: m ¼ 23 and ru ¼ 1654 MPa. The value found for the Weibull shape factor m is close to thosereported in the original Beremin work on another pressure vessel steel [11], or in a more recent article on ferritic steels [2].
3.3. Modeling of the Charpy transition curve for the base state
In order to understand the effect of strain and aging on the transition curve, finite element simulations of the Charpyimpact test were carried out using the finite element software Zset [62]. All the simulations were performed on the 2D meshpresented in Fig. 6 using plane strain formulation. Some simulations using plane stress formulation or full 3D mesh have alsobeen carried out. The global force vs. displacement curve for plane strain and plane stress formulation were found to belocated respectively above and below that of the 3D curve. However when the evolution of the maximum principal stressis plotted beyond notch tip, results for plane strain and 3D simulation are very close and different from the correspondingplane stress result. Since this variable is the most important one for the application of the Beremin model presented inSection 3.2, the plane strain formulation is selected for this study, in agreement with recommendations from Rossollet al. [44].
simulationexperience
σu
0.63
σw
P r
180017001600150014001300
1
0.8
0.6
0.4
0.2
0
Fig. 5. Identification of the Beremin model parameters for brittle fracture of the C–Mn steel.

Fig. 6. Two-dimensional finite element mesh of the Charpy specimen, including the anvil and the striker parts. The mesh size beyond notch tip is 60 lm.
A. Marais et al. / Engineering Fracture Mechanics 141 (2015) 95–110 103
The finite elements chosen were four node linear square elements with selective integration [14] in the contact zones andeight node quadratic squares in the rest of the specimen, using a continuous interface condition between both zones. Theinfluence of mesh size was investigated in order to reach convergence of the maximal principal stress beyond notch tip.As a result of this analysis, the element size was fixed equal to 60 lm.
The boundary conditions of the finite element simulations are the following. A velocity of V = 5 m s�1 is prescribed to thestriker, while the anvil remains fixed. The friction coefficient between these two parts and the specimen is equal to 0.1. Thiscoefficient is particularly significant in case of ductile failure propagation (i.e. for high level of CVN energy), but less impor-tant in our case where the lower part of the ductile-to-brittle transition is investigated. The striker and the anvil are modeledas rigid bodies in order to improve the convergence of the contact algorithm. It has been shown in Rossoll et al. [44] thataccounting for the elasticity of these parts does not modify significantly the results.
The simulations were carried out using a quasi-static isothermal formulation as suggested in Rossoll et al. [44]. This pointmay be reconsidered in future work especially at low temperature for which inertial effects may play a more significant role.
The material model described in Section 3.1 was used at 6 different temperatures (�150 �C, �100 �C, �50 �C, �20 �C, 0 �C,20 �C) to simulate the Charpy impact tests using the numerical model presented above. At each temperature, the CVN ener-gies for a fracture probability of 10%, 50%, and 90% are evaluated using the area under the force vs. displacement curve at thecorresponding calculation steps. These steps are defined after applying the Beremin model with the parameters identified inSection 3.2.
The results are plotted in Fig. 7 giving the energy at 10%, 50%, and 90% as a function of temperature. At�20 �C, the numer-ical prediction is in exact agreement with experimental results due to the fact that the Beremin model parameters wereidentified at this temperature for this material state. At all other temperatures the experimental points remain inside the10–90% bounds, even at higher temperature (20 �C), thus showing the predictive capabilities of the model. Note that at thistemperature the fracture of the material is probably not fully brittle and that the Beremin model should be associated with a
Pr = 10%Pr = 50%Pr = 90%
exp.
temperature (◦C)
ener
gy(J
)
011- 001- 09- 08- 07- 06- 05- 04- 03- 02- 01- 0 01 02 03
100
80
60
40
20
0
Fig. 7. Prediction of the Charpy transition curve at cleavage initiation assuming a constant value for ru for the base state (BS).

104 A. Marais et al. / Engineering Fracture Mechanics 141 (2015) 95–110
coupled ductile damage model as done in some previous work [53]. However, in this study we are focusing on the influenceof pre-straining and aging on the lower part of the ductile-to-brittle transition curve.
The parameter ru remains constant for all temperatures. The predictions of the model can be improved if a temperaturedependence of ru is introduced. In this study, the Beremin parameter values are kept constant for all temperatures and allmaterial states in order to highlight the ability of the model to describe the observed phenomena.
3.4. Simulation of the Charpy transition curve for the 5% pre-strained and 5% pre-strained + aged states
The Charpy experiments for the 5% pre-strained state were simulated by changing, in the material model, the initial val-ues of the internal variables, namely the dislocation density q and the aging time ta. The initial values to be prescribed werecalculated after simulating a tensile test up to 5% (see [30] for details). They are given as q5% and ta0 in Fig. 9 and can becompared to the base state values.
The same approach was applied to the 5% pre-strained + aged state simulation of Charpy impact tests. The initial value ofq is the same as for the 5% pre-strained state based on the assumption that the aging treatment (30 min at 250 �C) does notmodify the dislocation density. This assumption could be reconsidered accounting for the influence of static recovery due totime driven and thermally activated dislocation annihilation. In order to evaluate the impact of the aging treatment at 5%pre-strained on the mechanical behavior and particularly of the aging part of this model related to the internal variableta, an original specific experiment was performed. It is presented in Fig. 8.
The strain stress curve denoted ‘‘ST’’ on this figure is a simple tensile experiment from Marais et al. [30] at 20 �C and aprescribed strain rate 1 � e�3 s�1. The second curve denoted ‘‘ST 0–5%/30 min at 250 �C/ ST 5–10%’’ is the mechanicalresponse of a specimen made of the same material with slightly different dimensions submitted to the followingthermo-mechanical path:
� Simple tension up to 5% of global strain at 20 �C and a prescribed strain rate 1 � e�3 s�1.� Unloading to zero force.� Aging treatment 30 min at 250 �C.� Reloading up to 10% of global strain at 20 �C and a prescribed strain rate 1 � e�3 s�1.
Both curves slightly differ in the first stage before 5% because of the difference of specimen dimension and experimentalscatter. After 5% the aging treatment gives rise to a stress peak and a Lüders plateau. After the Lüders stage, the curve is par-allel but not superimposed to the ST curve. This means that the unpinning did not free all dislocations so that the stress levelis higher. Note that this feature, although frequent in steels, is not reproduced by the constitutive model of this work. Theprecise modeling of the amount of unpinning remains an open question from the constitutive modeling point of view. Sincethe size of the stress peak is close to the initial one, the initial value of ta for the 5% pre-strained + aged state is then pre-scribed at each temperature at the same value as for the base state (see Fig. 9).
The numerical procedure of Section 3.3 has been applied to the modified material behaviors presented in Fig. 9. For bothstates the Charpy experiments were simulated at 6 different temperatures (�150 �C, �100 �C, �50 �C, �20 �C, 0 �C, 20 �C).The Beremin model was applied to evaluate the CVN energy vs. temperature curves for three fracture probability values(10%, 50%, and 90%). The Beremin parameters m and ru identified at �20 �C for the base state were kept constant in orderto highlight the influence of strain and aging on fracture through the material behavior. The results of this analysis are plot-ted in Fig. 10. The predictions for both states are in good agreement with the corresponding experimental results since
ST 0-5% / 30min at 250 ◦C / ST 5-10%Simple Tension (ST)
Nominal Strain ΔL/L0
Nom
inal
Stre
ssF
/S 0
0.10.080.060.040.020
600
500
400
300
200
100
0
Fig. 8. Comparison between a monotonic simple tensile experiment at 20 �C and a prescribed strain rate 1 � e�3 s�1, and the same experiment interruptedat 5% of global strain to carry out an aging treatment of 30 min at 250 �C at zero force. The aging treatment gives rise to a Lüders peak and plateau when thespecimen is reloaded.

num–5% strain + agednum–5% strain
num–BSexp–BS
Plastic Strain
True
stre
ss
0.140.120.10.080.060.040 20.0
600
500
400
300
200
100
0
Fig. 9. Initial values of the internal variables for the three material states at 20 �C. q0 controls the level of prestraining while ta0 sets the level of dislocationpinning and allows to switch between aged and non-aged states. The stress vs. plastic strain responses of the model on a material point associated with eachinitial condition are plotted above the table.
(a)
Pr = 10%Pr = 50%Pr = 90%
exp.
temperature (◦C)
ener
gy(J
)
-110 -100 -90 -80 -70 -60 -50 -40 -30 -20 -10 0 10 20 30
50
40
30
20
10
0
(b)
Pr = 10%Pr = 50%Pr = 90%
exp.
temperature (◦C)
ener
gy(J
)
-110 -100 -90 -80 -70 -60 -50 -40 -30 -20 -10 0 10 20 30
40
35
30
25
20
15
10
5
0
Fig. 10. Prediction of the Charpy transition curve at cleavage initiation assuming a constant value for ru: (a) 5% pre-strained material state and (b) 5% pre-strained + aged material state.
A. Marais et al. / Engineering Fracture Mechanics 141 (2015) 95–110 105
almost all experimental points are included inside the 10–90% fracture probability interval, even if most of them are abovethe 50% fracture probability curve. However, at �100 �C the model turns out to be too conservative since the numerical pre-diction is half that of the experimental results. Some tensile experiments at �100 �C on specimens pre-strained at 5% andprestrained at 5% + aged should be carried out in order to validate if the hypothesis made for the initial values of q0 andta0 remain valid at this temperature.
Pr = 50%, 5% strain + aged 250◦C 30 minPr = 50%, 5% strain
Pr = 50%, BSexp. 5% strain + aged 250◦C 30 min
exp. 5% strainexp. BS
temperature (◦C)
ener
gy (J
)
-110 -100 -90 -80 -70 -60 -50 -40 -30 -20 -10 0 10 20 30
80
70
60
50
40
30
20
10
0
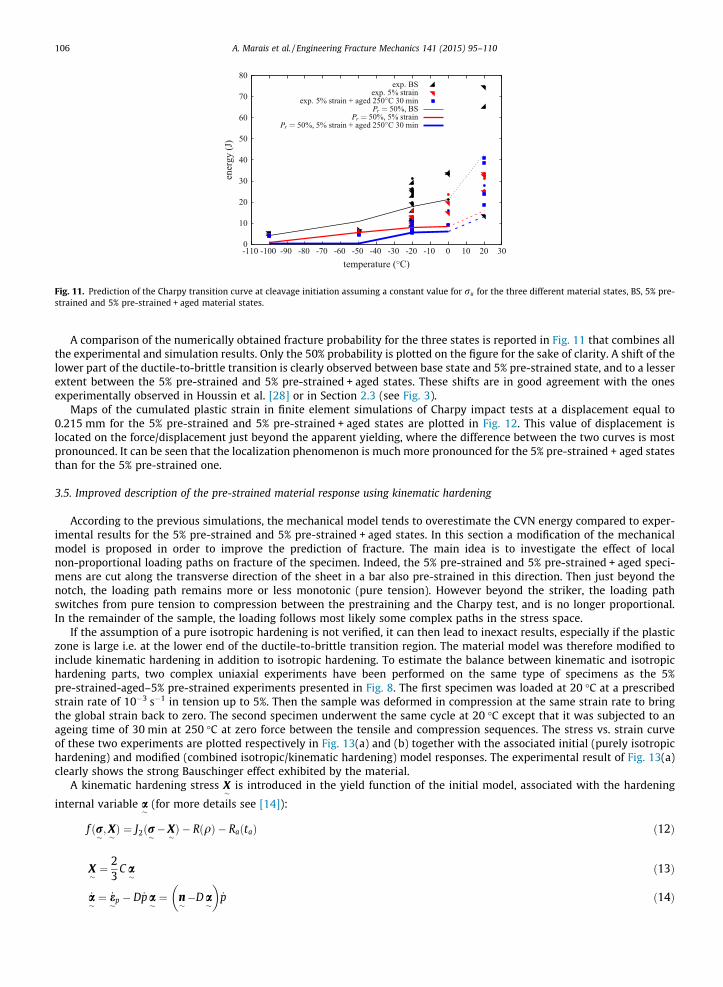
Fig. 11. Prediction of the Charpy transition curve at cleavage initiation assuming a constant value for ru for the three different material states, BS, 5% pre-strained and 5% pre-strained + aged material states.
106 A. Marais et al. / Engineering Fracture Mechanics 141 (2015) 95–110
A comparison of the numerically obtained fracture probability for the three states is reported in Fig. 11 that combines allthe experimental and simulation results. Only the 50% probability is plotted on the figure for the sake of clarity. A shift of thelower part of the ductile-to-brittle transition is clearly observed between base state and 5% pre-strained state, and to a lesserextent between the 5% pre-strained and 5% pre-strained + aged states. These shifts are in good agreement with the onesexperimentally observed in Houssin et al. [28] or in Section 2.3 (see Fig. 3).
Maps of the cumulated plastic strain in finite element simulations of Charpy impact tests at a displacement equal to0.215 mm for the 5% pre-strained and 5% pre-strained + aged states are plotted in Fig. 12. This value of displacement islocated on the force/displacement just beyond the apparent yielding, where the difference between the two curves is mostpronounced. It can be seen that the localization phenomenon is much more pronounced for the 5% pre-strained + aged statesthan for the 5% pre-strained one.
3.5. Improved description of the pre-strained material response using kinematic hardening
According to the previous simulations, the mechanical model tends to overestimate the CVN energy compared to exper-imental results for the 5% pre-strained and 5% pre-strained + aged states. In this section a modification of the mechanicalmodel is proposed in order to improve the prediction of fracture. The main idea is to investigate the effect of localnon-proportional loading paths on fracture of the specimen. Indeed, the 5% pre-strained and 5% pre-strained + aged speci-mens are cut along the transverse direction of the sheet in a bar also pre-strained in this direction. Then just beyond thenotch, the loading path remains more or less monotonic (pure tension). However beyond the striker, the loading pathswitches from pure tension to compression between the prestraining and the Charpy test, and is no longer proportional.In the remainder of the sample, the loading follows most likely some complex paths in the stress space.
If the assumption of a pure isotropic hardening is not verified, it can then lead to inexact results, especially if the plasticzone is large i.e. at the lower end of the ductile-to-brittle transition region. The material model was therefore modified toinclude kinematic hardening in addition to isotropic hardening. To estimate the balance between kinematic and isotropichardening parts, two complex uniaxial experiments have been performed on the same type of specimens as the 5%pre-strained-aged–5% pre-strained experiments presented in Fig. 8. The first specimen was loaded at 20 �C at a prescribedstrain rate of 10�3 s�1 in tension up to 5%. Then the sample was deformed in compression at the same strain rate to bringthe global strain back to zero. The second specimen underwent the same cycle at 20 �C except that it was subjected to anageing time of 30 min at 250 �C at zero force between the tensile and compression sequences. The stress vs. strain curveof these two experiments are plotted respectively in Fig. 13(a) and (b) together with the associated initial (purely isotropichardening) and modified (combined isotropic/kinematic hardening) model responses. The experimental result of Fig. 13(a)clearly shows the strong Bauschinger effect exhibited by the material.
A kinematic hardening stress X�
is introduced in the yield function of the initial model, associated with the hardening
internal variable a�
(for more details see [14]):
f ðr�;X�Þ ¼ J2ðr� �X
�Þ � RðqÞ � RaðtaÞ ð12Þ
X�¼ 2
3C a�
ð13Þ
_a�¼ _e�p � D _pa
�¼ n
��D a
�
� �_p ð14Þ

(a)
(b)
Fig. 12. Cumulated plastic strain for a displacement of 0.215 mm. (a) 5% pre-strained state and (b) 5% pre-strained + aged state.
A. Marais et al. / Engineering Fracture Mechanics 141 (2015) 95–110 107
The parameters C and D were identified from the experimental curve of Fig. 13(a) together with a modification of the param-eters A and B to balance the isotropic hardening contribution with the kinematic one. The parameter r0 has also been mod-ified in order to reproduce at least partially the Bauschinger effect experimentally observed. Finally the parameter P1 ismodified to correctly describe the level of the initial stress peak (for more details on the role of r0 and P1 on the stress peakmodeling, the interested reader should refer to Marais et al. [30]). The initial and modified values for all these parameters aregiven in Table 5.
It can be seen from Fig. 13(a) that the purely isotropic model fails at describing the reverse path, while using the modifiedone improves the description of the compressive part. The second experiment presented in Fig. 13(b) reveals another strikingphenomenon already investigated in some Refs. [17,46] with dissimilar results: the existence of the Lüders stress peak andplateau after aging at zero force and reversal of the applied stress. This experiment has been repeated twice under the sameconditions with very similar results. The results of Fig. 13(b) show that tension followed by aging at zero force and compres-sion leads to a stress peak in the compression regime with a stress drop amplitude comparable to the one observed in thefirst tension. The strong Bauschinger effect and the higher final stress level are also observed for this loading sequence.Neither the initial model nor the modified one are able to accurately describe the reverse path for this experiment becauseof the overstress due to partial unpinning already observed in Fig. 8. However in order to remain consistent with the rest ofthe study, the modified model is used to investigate the effect of kinematic hardening introduction on prediction of the frac-ture of Charpy specimens.
The influence of the introduction of kinematic hardening on fracture of Charpy specimens was investigated at 20 �C, sincethe reverse tensile experiments were only carried out at this temperature. Five Charpy specimens were tested at 20 �C for the5% pre-strained and the 5% pre-strained + aged states. Following the approach proposed in part Section 3.2 at the tempera-ture of �20 �C at which fracture stress scatter was studied, the smallest CVN energy experimental values are associated witha fracture probability equal to 16.7% (1=ð1þ 5Þ). These experimental values are compared in Table 6 with the correspondingnumerical predictions provided by the initial and modified models for both states.

(a)
Experimental curveModified model
Initial model
strain (-)
Nom
inal
stre
ss(M
Pa)
0.050.040.030.020.010
400
200
0
-200
-400
-600
(b)
Experimental curveModified model
Initial model
strain (-)
Nom
inal
stre
ss(M
Pa)
0.050.040.030.020.010
400
200
0
-200
-400
-600
Fig. 13. (a) 5% tension–5% compression and (b) 5% tension–30 min at 250 �C–5% compression experiments at 20 �C and a prescribed strain rate of1 � e�3 s�1. Comparison between the stress–strain curves generated using the initial and modified models.
Table 5Modified and initial sets of parameters at 20 �C for non-linear isotropic and kinematic hardening.
Modified model Initial model
A (m�2) 2.15e16 3.086e16B (m�2) 4.80e15 5.115e15r0 (MPa) 55 130C (MPa) 3140 �D 49.5 �P1 (MPa) 350 183.2
Table 6Experimental (5% pre-strained state, 20 �C) and numerical CVN energies for a fracture probability equal to 16.6%.
Initial model (J) Modified model (J) Experimental value (J)
5% pre-strained 6.7 19.4 255% pre-strained + aged 4.9 5.7 18.7
108 A. Marais et al. / Engineering Fracture Mechanics 141 (2015) 95–110
As it was already observed in the previous part, the initial model tends to underestimate the CVN energies for both states.The modified model prediction for the 5% pre-strained state is more accurate by increasing the CVN energy close to theexperimental value, even though at this temperature the ductile failure propagation should also be accounted for in additionto the brittle failure model. Nevertheless, at this temperature and for this state the average ductile fracture surface fractionmeasured on the five specimens does not exceed 35%. The brittle fracture is then still the prevailing mode. The estimation ofCVN energy is significantly modified by the introduction of the kinematic hardening term. Kinematic hardening tends to‘‘weaken’’ the area located close to the striker. By a structural effect, this ‘‘softening’’ will modify (i) the stress field beyond

A. Marais et al. / Engineering Fracture Mechanics 141 (2015) 95–110 109
the notch, (ii) the global force vs. displacement evolution; which will both be lower than using the initial model. Both effectslead to a significant increase of the predicted CVN energies given by the Beremin model.
The modified model prediction for the 5% pre-strained + aged state is less affected by the introduction of the kinematicterm. Indeed the plastic zone is smaller than for the 5% pre-strained and consequently the ‘‘softening’’ in the area locatedclose to the striker is less pronounced. The inclusion of kinematic hardening is then important in the prediction of accurateCVN at the lower end of the ductile-to-brittle transition region (5% pre-strained state) but less important in the very begin-ning of this transition (5% pre-strained + aged state).
4. Discussion and conclusion
A good agreement was found between the predicted ductile-to-brittle transition curve for the pre-strained and agedmaterial state showing the interest of using a constitutive model including strain aging effects. The advantage of theapproach is that the optimal magnitude of pre-straining and duration of heat treatments can be determined computationallyin a systematic way. Zhang and McCormick’s model turns out to be a simple and efficient approach to the constitutive mod-eling of strain aging, even though several limitations have been evidenced. In particular, the current knowledge on diffusionof solute atoms in steels in relation to dislocation densities, as discussed in Ballarin et al. [4], should be incorporated in themodel to allow for a reliable simulation of heat treatments. The experimental results provided in this work confirm that thefreeing of dislocations at obstacles at the yield point is generally not complete so that the stress drop remains a quantity thatis difficult to predict. The model used in this work invariably leads to complete release of dislocation and maximum stressdrop. Improvements require a detailed account of dislocation populations evolution in the model, like a separation into for-est and mobile dislocation densities as done by Fressengeas et al. [19].
This work must be followed by efforts to address the ductile part of the ductile-to-brittle transition curve. Such anattempt can be found in Berdin and Wang [9] for uncoupled ductile damage models. Existing fully coupled ductile fracturemodels like Gurson and Rousselier potentials should be combined with the strain aging model by introducing the relevantinternal variable ta [50]. FE simulations of ductile tearing are usually associated with mesh dependence that can be overcomeby the introduction of intrinsic length scales in the continuum model. The use of strain gradient plasticity in the context ofLüders band formation and propagation was recently examined by Mazière and Forest [33], following initial ideas by Hähner[22].
The main contributions of the present work are the following:
1. The first FE simulations of a Charpy test involving a strain aging elastoviscoplastic model were reported in this work.2. The Beremin fracture model was identified for a nuclear C–Mn steel from a large set of experimental data including the
scatter distribution at �20 �C for the base material state.3. The prediction of the ductile-to-brittle transition curve was then possible for the pre-strained material and pre-strained
and aged material states. Aging was shown to be associated with a translation of the ductile-to-brittle transition temper-ature towards higher temperatures.
4. The importance of kinematic hardening for an improved description of the pre-strained material’s behavior was pointedout, leading to a better prediction of CVN energy at the lower end of the ductile-to-brittle transition region.
5. The existence of a Lüders peak and plateau after tension followed by unloading, aging and reverse loading was evidencedexperimentally for the considered C–Mn steel.
Acknowledgements
The authors would like to acknowledge Professors A. Pineau and J. Besson for helpful discussions.
References
[1] Amar E, Pineau A. Interpretation of ductile fracture-toughness temperature-dependence of a low strength steel in terms of a local approach. EngngFract Mech 1985;22(6):1061–71.
[2] Andrieu A, Pineau A, Besson J, Ryckelynck D, Bouaziz O. Beremin model: methodology and application to the prediction of the euro toughness data set.Engng Fract Mech 2012;95:102–17.
[3] Ballarin V, Perlade A, Lemoine X, Bouaziz O, Forest S. Mechanisms and modeling of bake-hardening steels: Part II. Complex loading paths. Metall MaterTrans A 2009;40:1375–84.
[4] Ballarin V, Soler M, Perlade A, Lemoine X, Forest S. Mechanisms and modeling of bake-hardening steels: Part I. Uniaxial tension. Metall Mater Trans A2009;40:1367–74.
[5] Belotteau J, Berdin C, Forest S, Parrot A, Prioul C. Mechanical behavior and crack tip plasticity of strain aging sensitive steel. Mater Sci Engng A2009;526:156–65.
[6] Benallal A. Perturbation and stability of rate-dependent solids. Eur J Mech A/Solids 2000;19:S45–60.[7] Benallal A, Berstad T, Borvik T, Clausen A, Hopperstad S. Dynamic strain aging and related instabilities: experimental, theoretical and numerical
aspects. Eur J Mech A/Solids 2006;25:397–424.[8] Benallal A, Borvik T, Clausen A, Hopperstad O. Dynamic strain aging, negative strain-rate sensitivity and related instabilities. Tech Mech
2003;23:160–6.[9] Berdin C, Wang H. Local approach to ductile fracture and dynamic strain aging. Int J Fract 2013;182:39–51.
110 A. Marais et al. / Engineering Fracture Mechanics 141 (2015) 95–110
[10] Beremin F. Cavity formation from inclusions in ductile fracture of A508 steel. Metall Mater Trans 1981;12(5):723–31.[11] Beremin FM. A local criterion for cleavage fracture of a nuclear pressure vessel steel. Metall Trans A 1983;14:2277–87.[12] Bertram A. Elasticity and plasticity of large deformations. Springer; 2005.[13] Besson J. Local approach to fracture. Ecole des Mines de Paris–Les Presses; 2004.[14] Besson J, Cailletaud G, Chaboche J-L, Forest S. Non linear mechanics of materials. Springer; 2009.[15] Bordet S, Tanguy B, Besson J, Bugat S, Moinereau D, Pineau A. Cleavage fracture of RPV steel following warm pre-stressing: micromechanical analysis
and interpretation through a new model. Fatigue Fract Engng Mater Struct 2006;29:799–816.[16] Cottrell AH, Bilby BA. Dislocation theory of yielding and strain ageing of iron. Proc Phys Soc 1949;A62(1):49–62.[17] Elliot RA, Orowan E, Udoguchi T, Argon AS. Absence of yield points in iron on strain reversal after aging, and the Bauschinger overshoot. Mech Mater
2004;36:1143–53.[18] François F, Pineau A, Zaoui A. Mechanical behaviour of materials. Fracture mechanics and damage. Solid mechanics and its applications, vol.
191. Springer; 2013.[19] Fressengeas C, Beaudoin A, Lebyodkin M, Kubin L, Estrin Y. Dynamic strain aging: a coupled dislocation-solute dynamic model. Mater Sci Engng
2005;A400:226–30.[20] Graff S, Forest S, Strudel JL, Prioul C, Pilvin P, Béchade JL. Strain localization phenomena associated with static and dynamic strain ageing in notched
specimens: experiments and finite element simulations. Mater Sci Engng A 2004:181–5.[21] Graff S, Forest S, Strudel J-L, Prioul C, Pilvin P, Béchade J-L. Finite element simulations of dynamic strain ageing effects at V-notches and crack tips. Scr
Mater 2005;52:1181–6.[22] Hähner P. Modelling the spatio-temporal aspects of the Portevin–Le Chatelier effet. Mater Sci Engng A 1993;164:23–34.[23] Hallai J, Kyriakides S. On the effect of Lüders bands on the bending of steel tubes. Part I: Experiments. Int J Solids Struct 2011;48:3275–84.[24] Hallai J, Kyriakides S. On the effect of Lüders bands on the bending of steel tubes. Part II: Analysis. Int J Solids Struct 2011;48:3285–98.[25] Hallai J, Kyriakides S. Underlying material response for Lüders-like instabilities. Int J Plast 2013;47:1–12.[26] Haušild P, Berdin C, Bompard P. Prediction of cleavage fracture for a low-alloy steel in the ductile-to-brittle transition temperature range. Mater Sci
Engng A 2005;391:188–97.[27] Haušild P, Nedbal I, Berdin C, Prioul C. The influence of ductile tearing on fracture energy in the ductile-to-brittle transition temperature range. Mater
Sci Engng 2002;A335:164–74.[28] Houssin B, Slama G, Moulin P. In: Steele LE, Stahlkopf KE, editors. Assuring structural integrity of steel reactor pressure vessels. London: Applied
Science Publishers; 1980. p. 57.[29] Kubin LP, Estrin Y. The Portevin–Le Chatelier effect in deformation with constant stress rate. Acta Metall 1985;33:397–407.[30] Marais A, Mazière M, Forest S, Parrot A, Le Delliou P. Identification of a strain-aging model accounting for Lüders behavior in a C-Mn steel. Philos Mag
2012;92(28–30):3589–617.[31] Mazière M, Besson J, Forest S, Tanguy B, Chalons H, Vogel F. Numerical aspects in the finite element simulation of the Portevin–Le Chatelier effect.
Comput Methods Appl Mech Engng 2010;199:734–54.[32] Mazière M, Dierke H. Investigations on the Portevin Le Chatelier critical strain in an aluminum alloy. Comput Mater Sci 2012;52(1):68–72.[33] Mazière M, Forest S. Strain gradient plasticity modeling and finite element simulation of Lüders band formation and propagation. Continuum Mech
Thermodyn 2015;27(1–2):83–104.[34] McCormick P. Theory of flow localization due to dynamic strain ageing. Acta Metall 1988;36:3061–7.[35] Mesarovic S. Dynamic strain aging and plastic instabilities. J Mech Phys Solids 1995;43:671–700.[36] Mudry F. Etude de la rupture ductile et de la rupture par clivage d’aciers faiblement alliés. PhD thesis, Université de Technologie de Compiègne; 1982.[37] Mudry F. A local approach to cleavage fracture. Nucl Engng Des 1987;105:65–76.[38] Oldfield W. Curve fitting impact test data: a statistical procedure. ASTM Stand News 1975:24–9.[39] Pardoen T, Pineau A. Comprehensive structural integrity. In: Milne I, Ritchie RO, Karihaloo B, editors. Failure mechanisms of metals, vol. 2. Elsevier;
2007. p. 684–797 [chapter 6].[40] Pineau A. Modeling ductile to brittle fracture transition in steels—micromechanical and physical challenges. Int J Fract 2008;150:129–56.[41] Pineau A, Tanguy B. Advances in cleavage fracture modelling in steels: micromechanical, numerical and multiscale aspects. CR Phys 2010;11:316–25.[42] Rittel D, Tanguy B, Pineau A, Thomas T. Impact fracture of a ferritic steel in the lower shelf regime. Int J Fract 2002;117:101–12.[43] Rossoll A, Berdin C, Forget P, Prioul C, Marini B. Mechanical aspects of the Charpy impact test. Nucl Engng Des 1999;188:217–29.[44] Rossoll A, Berdin C, Prioul C. Determination of the fracture toughness of a low alloy steel by instrumented Charpy impact test. Int J Fract
2002;115:205–26.[45] Rossoll A, Tahar M, Berdin C, Piques R, Forget P, Prioul C, et al. Local approach of the Charpy test at low temperature. J Phys IV 1996;6:279–86
[EUROMECH – MECAMAT 96/1st European mechanics of materials conference on local approach to fracture 86–96, Fontainebleau, France, September09–11, 1996].
[46] Saada G, Kruml T. Removal of plastic instabilities by reversal of the applied stress. Philos Mag 2012;93(1-3, SI):256–71.[47] Shterenlikht A, Howard IC. The CAFE model of fracture – application to a TMCR steel. Fatigue Fract Engng Mater Struct 2006;29(9–10):770–87.[48] Sidoroff F, Dogui A. Some issues about anisotropic elastic–plastic models at finite strain. Int J Solids Struct 2001;38:9569–78.[49] Strnadel B, Hausild P. Statistical scatter in the fracture toughness and Charpy impact energy of pearlitic steel. Mater Sci Engng A-Struct Mater Prop
Microstruct Process 2008;486(1–2):208–14.[50] Tanguy B, Besson J. An extension of the Rousselier model to viscoplastic temperature dependent materials. Int J Fract 2002;116:81–101.[51] Tanguy B, Besson J, Pineau A. Comment on ‘‘Effect of carbide distribution on the fracture toughness in the transition temperature region of an SA 508
steel’’. Scr Mater 2003;49:191–7.[52] Tanguy B, Besson J, Piques R, Pineau A. Ductile–brittle transition of a A508 steel characterized by the Charpy impact test. Part-I: Experimental results.
Engng Fract Mech 2005;72:49–72.[53] Tanguy B, Besson J, Piques R, Pineau A. Ductile–brittle transition of a A508 steel characterized by the Charpy impact test. Part-II: Modelling of the
Charpy transition curve. Engng Fract Mech 2005;72:413–34.[54] Van den Beukel A. Theory of the effect of dynamic strain aging on mechanical properties. Phys Status Solidi a 1975;30:197.[55] Wagner D, Moreno J, Prioul C. Influence of post weld heat treatment on the dynamic strain aging of C–Mn steels. J Phys IV 1996;6:159–62.[56] Wagner D, Moreno J, Prioul C. Dynamic strain aging sensitivity of heat affected zones in C–Mn steels. J Nucl Mater 1998;252:257–65.[57] Wagner D, Moreno J, Prioul C, Frund J, Houssin B. Influence of dynamic strain aging on the ductile tearing of C–Mn steels: modelling by a local approach
method. J Nucl Mater 2002;300:178–91.[58] Wang H, Berdin C, Mazière M, Forest S, Prioul C, Parrot A, et al. Portevin–Le Chatelier (PLC) instabilities and slant fracture in C–Mn steel round tensile
specimens. Scr Mater 2011;64:430–3.[59] Wang H, Berdin C, Mazière M, Forest S, Prioul C, Parrot A, et al. Experimental and numerical study of dynamic strain ageing and its relation to ductile
fracture of a C–Mn steel. Mater Sci Engng A 2012;547:19–31.[60] Wenman M. Fitting small data sets in the lower ductile-to-brittle transition region and lower shelf of ferritic steels. Engng Fract Mech 2013;98:350–64.[61] Wenman MR, Chard-Tuckey PR. Modelling and experimental characterisation of the Lüders strain in complex loaded ferritic steel compact tension
specimens. Int J Plast 2010;26:1013–28.[62] Z-set package. Non-linear material & structure analysis suite; 2013. <www.zset-software.com>.[63] Zhang S, McCormick P, Estrin Y. The morphology of Portevin–Le Chatelier bands: finite element simulation for Al–Mg–Si. Acta Mater 2001;49:1087–94.