engineering graphics - landmark university
TRANSCRIPT

ENGINEERING GRAPHICS 1.0 Introduction
Engineering is the profession in which the knowledge of mathematics and science gained by
study, experience and practice is applied with good judgment to develop a functional,
economical and satisfactory solution to a given problem in tandem with codes and standards for
the benefit of mankind.
Graphics are drawings or pictures designed to represent objects or facts.
Drawing as an art is the pictorial representation of the imagination of a scene in its totality by
an individual called Artist. Such drawings do not have standard guidelines and boundaries.
Graphic design is the art of combining pictures, words, and decoration in the production of
books, magazines, etc.
Engineering graphics is the geometric representation of solutions, engineering systems and
components according to required national and international standards of practice. It can be read
and understood by all who have the knowledge of drawing principles. These drawings are
produced with the purpose of solving specific human needs. Examples of such needs include
agricultural (food), energy, shelter, transportation, health care, education, etc. Engineering
graphic is technically referred to as engineering drawing.
Like every other language, engineering graphics is primarily the language of engineers
for conveying ideas on technical issues to others. Since engineering graphics are standardized
(i.e. furnished with standard symbols, national and international standard practice as well as
codes), they display the exact picture of an object and convey the same ideas to every trained
personnel across the nations of the world. Despite the social or economic or cultural or language
barriers, drawings can be effectively used in other countries, in addition to the country where
they are prepared. Hence, engineering drawing is the universal language of all engineers.
Therefore, engineering drawings must be correctly drawn.
1.2 Need for correct drawings
Irrespective of the significant of drawings in engineering applications, incorrect drawing
can be misleading or misinterpreted. This can cause danger to the expected product and other
personnel. For example, in winning contracts, drawing is an official document required. The
success or failure of a structure depends on the clarity of the details provided on the drawing.

Thus, engineering drawings must be clear, unmistakable in meaning and should not by any mean
gives more than one interpretation, or else litigation could result.
Therefore, the engineer must gain a thorough knowledge of both the principles and
conventional practice of draughting. If these are not achieved and practiced, the drawings
prepared by one may convey different meaning to others, causing unnecessary delays and
expenses in production shops.
1.3 Importance of engineering graphics
i. Engineers use graphics to communicate technical information without ambiguity to
executives, fabricators, customers, and each other.
ii. For systems, plants and facilities maintenance.
iii. Engineering graphics are essential documents for product development as well as for
regular production.
iv. The knowledge of engineering graphics is significant in innovative design projects.
v. Engineering graphics is used in industries as guide for assembly of separate parts into a
unit.
1.4 Classification of drawings
1.4.1 Machine drawing
It is concern with drawing of machine parts or components. Machine drawing is usually
drawn through a number of orthographic views, so that the size and shape of the part is fully
understood. Component drawings and assembly drawings belong to this class. An example of a
machine drawing is given in Fig. 1.1.
1.4.2 Working drawing
Working drawing is also called production drawing. It contains all the dimensions, limits
and special finishing processes such as heat treatment, surface finish, to guide the craftsman on
the shop floor in producing the part. The material used for the product, number of parts required
for the assembled unit, etc are also specified. Figure 1.2 shows an example of a production
drawing.

Fig 1.1 Machine drawing
Fig 1.2 Working drawing
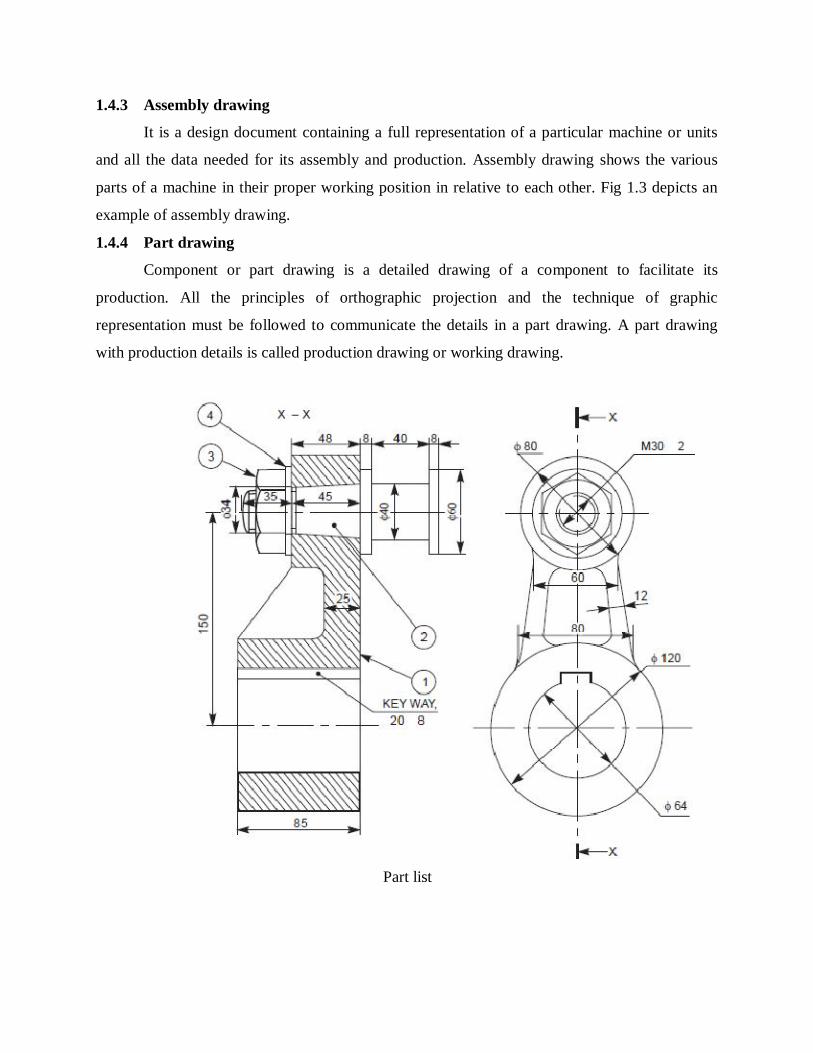
1.4.3 Assembly drawing
It is a design document containing a full representation of a particular machine or units
and all the data needed for its assembly and production. Assembly drawing shows the various
parts of a machine in their proper working position in relative to each other. Fig 1.3 depicts an
example of assembly drawing.
1.4.4 Part drawing
Component or part drawing is a detailed drawing of a component to facilitate its
production. All the principles of orthographic projection and the technique of graphic
representation must be followed to communicate the details in a part drawing. A part drawing
with production details is called production drawing or working drawing.
Part list

Fig 1.3 Assembly drawing
1.5 Applications of Engineering Graphics
1. Mechanical : Design of machine elements, CNC machine tools, Robotics.
2. Automotive : Kinematics, Hydraulics, Steering.
3. Electrical : Circuit layout, Panel design, control system.
4. Electronics : Schematic diagrams of PCs, Ics, etc.
5. Communication: Communication network, satellite transmitting pictures, TV Telecasting
6. Civil : Mapping, contour plotting, building drawing, structural design.
7. Architectural: Town planning, interior decorations, multistoried complex.
8. Aerospace : Design of spacecraft, flight simulator, lofting
1.6 Engineering Standards and Codes
Codes are collection of laws and rules that assists government agency in meeting its
obligation to protect the general welfare by preventing damage to property or injury or loss of
life to persons. Codes tell the engineer what to do and when and under what circumstances to do
it. Codes usually are legal requirements, as in the building code or the fire code. Standards tell
the engineer how to do it and are usually regarded as recommendations that do not have the force
of law. Codes often incorporate national standards into them by reference, and in this way
standards become legally enforceable.
Standards are generally acceptable uniform procedures, criteria, dimensions, materials, or
parts that affect the design, drawings, production, installation, operation and maintenance of
equipment or facilities. They may describe the dimensions and sizes of small parts like screws
and bearings, the minimum properties of materials, or an agreed-upon procedure to measure a
property like fracture toughness, draughting procedure approved by BS or ISO.
Objectives of standardization
i. To make available the best practice to everyone, thereby ensuring efficiency and
safety.

ii. To provide interchangeability and compatibility between similarly functional
products manufactured by different organizations.
iii. To establish performance criteria for products, materials or systems.
iv. To establish a common basis for testing the performance and characteristics of
products, materials or systems.
v. To promote uniformity of practice among countries of the world.
vi. To increase the efficiency of engineering effort.
Examples of Stand organizations:
1. BSI: British Standards Institute.
2. ISO: International Organization for Standards.
3. SON: Standards Organization of Nigeria.
4. SAE: Society of Automotive Engineering.
2.0 DRAWING PRINCIPLES 2.1 Introduction
The correct shape and size of the object can be visualized from the understanding of not
only the views but also from the various types of lines used, dimensions, notes, scale, etc. To
provide the correct information about the drawings to all the people concerned, the drawings
must be prepared following certain standard practices as recommended by British Standard 8888
published in 2011.
2.2 Drawing sheet
Engineering drawings are drawn on standard drawing sheets sizes. The use of standard
sheet sizes save papers and facilitate convenient storage of drawings. According to BS EN ISO
5457, the different drawing sheet size and their dimension are given in table 2.1
Table 2.1: sheet sizes
Designation Dimension
(mm)
A0 841 x 1189
A1 595 x 841
A2 420 x 594
A3 297 x 420

A4 210 x 297
2.3 TITLE BLOCK
It contains all the information for identification and interpretation of the drawing. The
information contain in title block includes:
(i) Title of the drawing
(ii) Sheet number
(iii) Scale
(iv) Symbol, denoting the method of projection
(v) Name of the firm
(vi) Initials of staff, who prepared, checked and approved the drawing.
According to BS EN ISO 7200, a standard title block should have a maximum length of
180 mm and width 60 mm and should be placed within the drawing space at the bottom right
hand corner of the drawing sheet as shown in figure fig 2.1.

Fig 2.1 Details in title block
2.4 LINE WORK
Lines of different types and thicknesses are used for graphical representation of objects.
The types of lines and their applications are shown in Table 2.2 and fig. 2.2.
Fig 2.2 Line rule

Table 2.2 Types of lines and their applications
2.4.1 LINE THICKNESS
The thickness of lines is chosen according to the size and type of the drawing from the
following range: 0.18, 0.25, 0.35, 0.5, 0.7, 1, 1.4 and 2 mm. It is recommended that the space
between two parallel lines, including hatching, should not be less than 0.7 mm.

2.4.2 LINE WORK RULES
I. All chain lines must begin and end with long dash.
II. Centre lines should extend beyond the object to which they refer, for a short distance
only, unless required for dimensioning.
III. They must not end at another line of the drawing.
IV. They must not cross each other at solid parts of the lines.
V. Chain lines having angles formed in them should be drawn with long dashes meeting at
the angles. Arcs should join at tangent points.
2.4.3 BORDERS AND FRAMES
Border is the space between the edges of the trimmed sheet and the frame. The frame is
referred to as borderline. It is recommended that borders should have a minimum width of 20
mm for the sizes A0 and A1 and a minimum width of 10 mm for A2, A3 and A4 paper sizes as
shown in Fig. 2.3.
Fig 2.3 Drawing sheet layout

2.5 SCALES
Scale is the ratio of the linear dimension of a component of an object as represented in
the drawing to the real linear dimension of the same component of the object itself. It is always
advisable to make full size drawings, so as to represent true shapes and sizes. If this is not
practicable, the largest possible scale should be used. When drawing very small objects, such as
watch components and other similar objects, it is advisable to use enlarging scales.
The complete designation of a scale should consist of the word scale, followed by the
indication of its ratio as:
SCALE 1:1 for full size,
SCALE 2:1 for twice full size
SCALE 1:2 for half full size.
Note: The designation of the scale used on the drawing should be shown in the title block.
2.6 LETTERING
Lettering is the technique of writing letters, numerals and other character in engineering
drawing. It is use to provide detailed specification for an object. The essential features of
lettering in engineering drawings are legibility, uniformity and suitability for reproductions.
2.6.1 Guide to good lettering:
I. Use guidelines to ensure that the letters are of equal height and parallel.
II. The size of the numbers and figures depends on the available space and the size of the
drawing.
III. Print with a pointed HB pencil sharpened to avoid blunt.
IV. Straight or inclined lettering is acceptable but both should not be mixed.
V. Small or capital letters can be used, depending on which one is recommended.
Figures 2.4a and 2.4b show inclined and vertical letters respectively. They are given only
as a guide to illustrate the principles of lettering.

Fig 2.4a Inclined lettering

Fig 2.4b Vertical lettering
3.0 DIMENSIONING
Dimensions are measures by which a physical variable is expressed quantitatively. They
include length, height, width, depth, or diameter of an object. A good engineering drawing must
contain information required to describe the size and complete shape of the object. These are
provided through the distances between the surfaces, location of holes, nature of surface
finishing, type of material used, etc. The expression of these features on a drawing, using lines,
symbols, figures is called dimensioning. It also involves the selection of dimensions to ensure the
correct functioning of the part, and to enable the workman to make it without having to calculate
any sizes. Fig 3.1 shows the dimensioning of a machine part.

Fig 3.1: Dimensioning of bearing housing
3.1 RULES OF DIMENSIONING
1. Dimensions should be placed outside the outline of the view as far as possible.
2. Dimension lines should be placed on view which shows the features they defined.
3. Projection and dimension lines should be thin continuous.
4. Dimensions should be taken from visible outlines rather than from hidden lines.
5. Centre line should not be used as dimension line.
6. A complete circle should be dimension by the diameter either across the circle or projecting
the diameter outside the outline. The dimension must be preceded by the symbol ᶲ, meaning
diameter.
7. Radius is dimensioned using dimension line which passes through or a line with arc centre.
The symbol R is used to precede the radius.
8. The dimension line for an angle is circular arc having its centre on the point of the angle. The
dimension must be placed so that it can be read from the bottom or right-hand side of the
drawing.
9. Each feature should be dimensioned once only on a drawing.
10. Dimensions should be placed on the view or section that relates most clearly to the
corresponding features.
11. Each drawing should use the same unit for all dimensions, but without showing the unit
symbol.
12. Dimensions other than necessary to define a part should not be shown on a drawing.
13. No features of a part should be defined by more than one dimension in any one direction.
Figure 3.2a is an example of the violations of some of the dimension rules in drawing
while Fig. 3.2b gives corrected version of the same. The reasons are given below:

Fig 3.2 (a) Incorrect dimension and (b) Correct dimension
1. Dimension should follow the shape symbol.
2. and 3. As far as possible, features should not be used as extension lines for dimensioning.
4. Extension line should touch the feature.
5. Extension line should project beyond the dimension line.
6. Writing the dimension is not as per the aligned system.
7. Hidden lines should meet without a gap.
8. Centre line representation is wrong. Dot should be replaced by a small dash.
9. Horizontal dimension line should not be broken to insert the value of the dimension.
10. Dimension should be placed above the dimension line.
11. Radius symbol should precede the dimension.
12. Centre lines should cross at long dashes.
13. Dimension should be written by symbol (not abbreviation) followed by its value.
14. Note with dimensions should be written in capitals.
15. Elevation is not the correct usage.
16. Usage of the term ‘‘plan’’ is obsolete in graphic language.

4.0 Conventional Representations
Many engineering components such as screws true projection are difficult and tedious to
draw. They are therefore represented by standard conventions on drawings. These conventions
are design to save time and should be use wherever and whenever possible.
Fig 4.1 Conventional representation of machine components.

Figure 4.1 shows typical examples of conventional representation of various machine
components used in engineering drawing.
5.0 PRINCIPLES OF PROJECTIONS 5.1 Introduction
Every engineering system or component has three dimensions, namely, length, width and thickness. However, drawings are prepared on plane sheets which are usually two dimensional. This has several limitations. For these reasons, projections are required for complete description of the engineering component.
Projection is defined as the representation of a three-dimensional object on a two dimensional plane. This can be achieved with either orthographic or isometric or oblique projection. The projections of any system or part must clearly express all the three dimensions as other details.
Generally, the elements to consider while obtaining projections are: (i) The object (ii) The plane of projection (iii) The point in space or point of sight (iv)The projector or rays of sight 5.2 Orthographic projection
An orthographic projection is one in which the projectors are parallel to each other and intersect the plane of projection at right angle to it as shown in fig 5.1. This is obtained by viewing the object from a point in space and tracing in correct sequence, the points of intersection between the projectors and the plane on to which the object is projected.
Fig 5.1 Projection of views on planes.

Orthographic projection mainly uses the horizontal and vertical planes. These planes intersect to produce four quadrants or angles. The object to be drawn is imagined to be placed in one these quadrants and orthographic views of it are projected on to the planes. The object may have any orientation to the planes, but normally it is positioned so that its main faces are parallel to them. This is to ensure that views of the faces are true size and shape.
In engineering practice, only the First and Third Angles forms of orthographic projection are used because views in the Second and Fourth Quadrants may overlap.
Advantages of Orthographic Projection 1. It presents a true picture of each face: circles remain as circles etc. 2. There is no limit to the number of view that can be drawn. 3. The views drawn are related to each others in position.
5.2.1 First Angle Orthographic Projection In first angle projection, the object is imagined to be positioned in the first quadrant. The
view from the front of the object is obtained by looking at the object from the right side of the quadrant and tracing in correct sequence, the points of intersection between the projection plane and the rays of sight extended. The object is between the observer and the plane of projection (vertical plane). Here, the object is imagined to be transparent and the projection lines are extended from various points of the object to intersect the projection plane as shown in fig 5.1. Hence, in first angle projection, any view is so placed that it represents the side of the object away from it.
In terms of conventional representation, first angle projection is usually denoted by the symbol depicted in figure 5.2.
Fig 5.2 First angle projection convention
5.2.11 Arrangement of views in 1st angle projection
With reference to the front view (a) shown in fig.5.3, the other views shall be arranged as follows: The view from above (b) shall be placed underneath. The view from below (e) shall be placed above. The view from the left (c) shall be placed on the right. The view from the right (d) shall be placed on the left. The view from the rear (f) shall be placed on the left or right, as convenient.

Figure 5.3: Arrangement of views in 1st angle projection.
5.2.2 Third Angle Orthographic Projection
In third angle projection, the object is imagined to be positioned in the third quadrant. The plan comes between the observer and object. Since the plans are between the observer and the object, they are imagined to be transparent and the object is view from them. An elevation and plan is projected on to the vertical and horizontal planes respectively, using parallel projectors normal to the planes as in first angle projection.
In terms of conventional representation, third angle projection is usually denoted by the symbol depicted in figure 5.4.
Fig 5.4 Third angle projection convention
5.2.22 Arrangement of views in 3rd angle projection
With reference to the front view (a) fig 5.5, the other views shall be arranged as follows: 1. The view from above (b) shall be placed above. 2. The view from below (e) shall be placed underneath. 3. The view from the left (c) shall be placed on the left. 4. The view from the right (d) shall be placed on the right. 5. The view from the rear (f) shall be placed on the left or right, as convenient.

Fig 5.5: 3rd angle projection
5.3 Spacing of Views 1. Leave enough space between the views on drawing to accommodate dimensions and notes without overcrowding. 2. A minimum number of views (i.e three) should be consistently used to completely describe the object. 3. Hidden detail should only be used where it is essential for complete description of the object. 4. Build up all the views together.
5.4 Selection of views
In order to completely describe any object in orthographic projections, it is important to
select a number of views. The number of views required to describe any object will depend upon
the extent of complexity involved in it. The higher the symmetry, the lesser the number of views
required.
In general, most of the objects consisting of either a single component or an assembly of
a number of components are described with the help of three views. In such cases, the views
normally selected are the views from the front, above and left or right side. For symmetrical
objects two views are enough to completely define them.
Example
Draw in First Angle projection the following views of the machine block details shown.
1. Front elevation in the direction of arrow T.
2. End view in the direction of arrow S.
3. Plan view projected from the front elevation.


Solution
ASSIGNMENT Choose a suitable scale of your own and show all hidden details. 1. Draw in First angle projection the following view in fig Q1. (a) Front elevation from the direction of arrow. (b) The end elevation. (c) The plan.

Fig Q1
Fig Q2

2. Draw in Third angle projection the following view in fig Q2. (a) Front elevation from the direction of arrow. (b) The end elevation. (c) The plan. 6.0 SECTIONS
Sections are used in engineering drawing to reveal hidden details of a machine or
structure which can be shown by full lines instead of hidden detail lines. A sectional view is
obtained by imagining the object to be cut by a cutting plane and the portion between the
observer and the section plane being removed. The areas of sections are represented by hatching.
The simplest form of hatching in engineering drawing involve the use of continuous thin lines
inclined at angle 45° to the principal outlines or lines of symmetry of the sections as depicted in
Fig. 6.1.
Fig 6.1 Preferred hatching angles
Sectioned views can be projected from either the front or end elevations or the plan.
Thus, a sectioned front elevation (F.E) is projected from either the plan or end elevation. A
sectioned end elevation (E.E) is projected from the front elevation and a sectioned plan is
projected from the front elevation.
It should be noted there are some engineering details that, if sectioned will loss their
identity or create wrong impression and these items are never sectioned. Examples of such
components are studs, screws, shafts, ball bearings, roller bearings, keys, pins, gear teeth.
6.1 FULL SECTION
A full sectional view is obtained by assuming that the object to be completely cut by a
plane into two equal halves as shown in fig 6.2. The sectioned view provides all the hidden
details, better than the un-sectioned view with hidden lines for representing hidden details.

Fig. 6.2: Full section
Draw in first angle projection the following view of the shaft support shown in fig 6.3
1. The sectional view looking in the direction of arrow.
2. The end elevation looking from the right view.
3. The plan view

Fig 6.3: Shaft support.
7.0 Development of Missing Views
When two views of an object are given, the third view may be developed by the use of a
mitre line.
To construct end elevation given the front elevation and plan views
1. Draw the given views.
2. Draw the projection lines to the right of the view from above.
3. Decide the distance, from the view from the front at which, the side view is to be drawn.

4. Construct a mitre line at 45°.
5. From the points of intersection between the mitre line and the projection lines, draw
vertical projection lines.
6. Draw the horizontal projection lines from the view from the front to intersect the above
lines.
7. The require view is obtained by joining the points of intersection.
Example: Draw the missing view of the bolster block given in 1st projection

Solution
7.0 ISOMETRIC PROJECTION 7.1 Introduction
Engineering drawings are usually drawn in orthographic projections for detailed presentation. This advantage made orthographic projection preferred to other methods of drawing. However, it has the disadvantage of being very difficult to understand by people not trained in its usage. It is therefore mandatory that an engineer be able to communicate his ideas to anybody, especially people who are not engineers. This can be achieved by using a system of projection called isometric projection or oblique projection. Among these two, isometric presents the more natural looking view of an object.
Isometric projection is a method of producing a pictorial view showing the three faces of an object simultaneously. It can also be define as a 2D drawing make to 3D drawing.

7.2 CONVENTIONAL ISOMENTRIC PROJECTION
Fig 7.1 Shaped block in conventional isometrics projection Isometric drawings are drawn on three axes inclined at angle 1200 to each other as shown
in fig 7.1. One of the axes is vertical while the other two are at 300 to the horizontal. Dimensions measured along these axes or parallel to them are true lengths of the object.
The faces of the shaped block shown in fig 7.1 are all at 900 to each other. It shows that all lines are parallel to the isometric axes. If the lines are not parallel to the isometric axes, they will no longer represent true length.
7.3 DRAWING OF OBJECTS IN ISOMETRIC PROJECTION
7.3.1 Objects composed of only isometric lines

Fig 7.2 Isometric drawing of object composed of isometric lines with corner A at the bottom
These objects can easily be drawn because all measurements in the orthographic views can be scaled directly on to the isometric view. It is unnecessary to drawn the orthographic views since the object lines are not inclined at any angle. The view outline is obtained by drawing a box that will contain the object and the building up the shape of the object in the box as illustrated in fig 7.2.
7.2.2 Objects with non-isometric lines Lines on an object which are inclined at angles are non-isometric lines. Angles cannot be
laid off directly on an isometric drawing as they do not appear as their true sizes. Lines inclined at an angle can be drawn by fixing their ends with ordinates which are isometric lines. The part of the orthographic view which shows the line positioned by the angle is drawn first and the ordinates are transferred to the isometric view. This method is illustrated in fig 7.3.

Fig 7.3 Isometric drawing of object with non-isometric lines and corner A at the bottom 7.2.3 Curves in isometric projection
Curves are drawn by selecting a number of points on the cured surface in orthographic view and the ordinates of each point are transferred to the isometric view as shown in fig 7.4. Parallel curve can also be obtained by drawing parallel lines through the points on the first curve in the appropriate direction and marking off on them the width of the detail. 7.2.4 Circles in isometric projection
The faces of a cube are square. If a cube is drawn in isometric projection each square side becomes a rhombus. When circles are drawn on the face of cube, they appear as an ellipse in isometric projection as shown in fig 7.5.
The circle is first drawn as a plane figure and then divided into an equal number of strips. The face of the cube is then divided into the same number of equal strips. Centre lines are added and measurement from the centre line of the circle to the point where the strip crosses the circle on plane drawing is transferred to the isometric projection with a pair of dividers. The measurement is then applied above and below the centre line. This process is repeated for strips 2, 3, etc.

Fig 7.4 Isometric drawing of curved object with corner A at the bottom

Fig 7.5 Circle construction by ordinates
The ellipse shape is completed with a French curve. It should be noted that the dimension transferred from the plane circle to isometric view are called ordinates. Also, this system can be use for any regular or irregular shape.
Circles can also be drawn in isometric projection by approximate method. In this method of construction, circular arc is used to draw ellipse in isometric drawing. The illustration is shown in fig 7.6. The centre lines EF and GH are first drawn and their intersection becomes the centre of an isometric square ABCD with sides equal to the diameter of the required circle. The long diagonal AC of the square is drawn and either B or D is joined to the mid-points of the opposite sides. Where these two lines cross the long diagonal (point a & b) are the two arc centre.
Fig 7.6 also shows a cylinder drawn in isometric projection. When drawing the cylinder, the above construction is only required one end. The length is measured with a pair of dividers and then mark off from the point s, t, w, G and F. This same procedure can be used to draw a hole, if both ends are visible.

Fig 7.6 Approximate circle and cylinder construction
8.0 OBLIQUE PROJECTION 8.1 INTRODUCTION
Oblique projection is another system for producing pictorial view of an object. It is simpler than isometric but it does not present so realistic picture. Oblique lines are neither vertical nor horizontal but inclined at an angle. In practice, angle 450 is widely used. The receding lines in oblique drawing are usually vertical or horizontal. 8.2 OBJECT ANGLES AND SHAPES IN OBLIQUE PROJECTION
Fig 8.1 shows a shaped block drawn in oblique projection. The front face is drawn on the plane and the side and top faces are receding at 300, 600 and 450.

Fig 8.1 Shaped block in oblique projection Although measurements on oblique drawings are all true length, but distorted effect in the
view occurs as illustrated in fig 8.1. This means that the drawing of object in oblique view appear to be out of proportion when compared with isometric views.
In order to overcome distortion of view, the oblique lengths have to be altered as shown in fig 8.2. The degree of alteration is determined by the oblique angle.
An oblique angle of 600 causes a large distortion and the oblique length is reduce to ଵଷ x
True length. 300 causes less distortion and the oblique length is reduced to ଶଷ x True length. At
450 the true length is reduced by half. Oblique drawing made without reduction in oblique length is known as cavalier
projection while that drawn with reduction in length is called cabinet projection. Note: All oblique projection should be drawn at an oblique angle of 450 and the true
length reduced by half unless or otherwise given specific instruction.

Fig 8.2 Distorted effect reduction 8.3 CIRCLES AND CURVES IN OBLIQUE PROJECTION
Most often, the front face of an object is drawn in the plane of paper; any circles on this face are true circles and not ellipses as in isometric projection. There are cases when circles or curves appear on the oblique face. If these situations arise they are drawn using method that was used for circles on isometric drawings. Since the oblique length has been scaled down, the ordinates on the oblique length must also be scaled down in the same proportion.

Example: Draw the stepped pulley on oblique projection.
Solutions:
a. When the circle is on non-oblique face, we obtain

b. When the circle in on oblique face, we have