engineering interfacial charge transfer in cspbbr
TRANSCRIPT

S1
SUPPORTING INFORMATION
Engineering Interfacial Charge Transfer in CsPbBr3 Perovskite Nanocrystals by Heterovalent Doping
Raihana Begum†,§, Manas R. Parida†,§, Ahmed L. Abdelhady†, Banavoth Murali†, Noktan M. Alyami†, Ghada H. Ahmed†, Mohamed Nejib Hedhili‡, Osman M. Bakr †* and Omar F. Mohammed †*
†King Abdullah University of Science and Technology, KAUST Solar Center, Division of Physical Sciences
and Engineering, Thuwal 23955-6900,Kingdom of Saudi Arabia ‡ King Abdullah University of Science and Technology, Imaging and Characterization Laboratory, Thuwal
23955-6900, Kingdom of Saudi Arabia
Chemicals
Cesium carbonate (99%), lead bromide (≥98%), bismuth bromide (≥98%), oleic acid (OA, Alpha Aesar, technical
grade 90%),), oleylamine (OLA technical grade 70%), octadecene (ODE, technical grade 90%), toluene
(anhydrous, 99.8%), acetonitrile (anhydrous, 99.8%), were used as purchased. All chemicals except oleic acid are
procured from Sigma Aldrich.
Scheme S1 A pictorial representation of in situ doping of perovskite nanocrystals using hot-injection method.

S2
Figure S1. TEM image of (A) 0.2% (B) 0.8% Bi-doped CsPbBr3 NCs.
Figure S2. Particle size distribution plot of (A) 0%, (B) 0.25%, (C) 0.8% and (D) 2.1% Bi-doped CsPbBr3 NCs, calculated from TEM images. Sizes have been calculated considering sizes of 100 such particles. The reported value is average of those numbers.

S3
Figure S3. Powder XRD patterns of CsPbBr3 NCs doped with different percentage of Bi3+.

S4
Figure S4. XPS spectra corresponding to Bi- doped CsPbBr3 NCs (a) Survey X‐ray photoelectron spectrum and high‐resolution XPS analysis corresponding to (b) Bi 4f and Cs 4p, (c) Cs 3d, (d) Pb 4f and (e) Br 3d. The high resolution spectra were also recorded corresponding to the core levels of Cs 3d, Cs 4P, Pb 4f and Br 3d for the undoped NCs and the peak positions are found to be same as of doped NCs.
Figure S5. Relative percentage of Bi and Pb (as estimated by ICP-OES). A relative decrease in lead concentration was observed in the Bi-doped CsPbBr3 NCs, compared to undoped NCs, which could be due to accompanied replacement of lead with bismuth.

S5
Calculation of Bi atoms per nanocrystals
Bi atoms per nanocrystals was calculated based on the assumption that the NCs are of cubic shape (a= 0.58
nm, space group Pm-3m) and uniform sized (average size estimated by TEM). Considering, number of unit
cells per nanocrystal = Total volume of one nanocrystal/ Volume of one unit cell. Since each unit cell has one
Pb2+ atom, so number of unit cells=total number of Pb2+ per nanocrystal
No. of Bi atoms (in Feed solution)
No. of Bi atoms (ICP-OES)-1st wash
No. of Bi atoms (ICP-OES)-2nd wash
0 0 0 67.5 20.25 8.4375
168.75 60.75 27 337.5 101.5875 70.875
Table S1. Calculation of number of Bi atoms per nanocrystals.
Table S2. Bi/Pb ratio used during synthesis, that measured by ICP-OES from which Bi atoms per nanocrystal was calculated. Given the change in quantum yield upon doping.
Figure S6. Bi atoms per NC, determined by ICP against the number of Bi atoms in the feed solution.

S6
Figure S7. Tauc Plot of CsPbBr3 NCs doped with different percentage of Bi
Figure S8. Energy difference, ΔE (meV) versus number of Bi atoms per NC (based on ICP).

S7
Quantum yield measurement of NCs samples were done as described below:
QY standard is the quantum yield of fluorescein dye, which is known to be 95% in a 0.1 M NaOH solution at
excitation wavelength 492 nm (emission at 512 nm). Absorbance values of the fluorescein and NCs samples at 492
nm and 365 nm, respectively were recorded and adjusted close to 0.1. PL spectra for the standard and the samples
were recorded at the respective excitation wavelength and integrated area is calculated. Refractive index (Ƞ) of
water is 1.33 (for standard) and for the NCs sample dispersed in toluene, it is 1.49.
Figure S9. Fermi energy levels (dashed line) of the NCs, measured by Kelvin Probe.
QY = QYstandard (Absorbance of standard
Absorbance of sample) (
Area of sample
Area of standard) (
Ƞsample2
Ƞstandard2)
S8
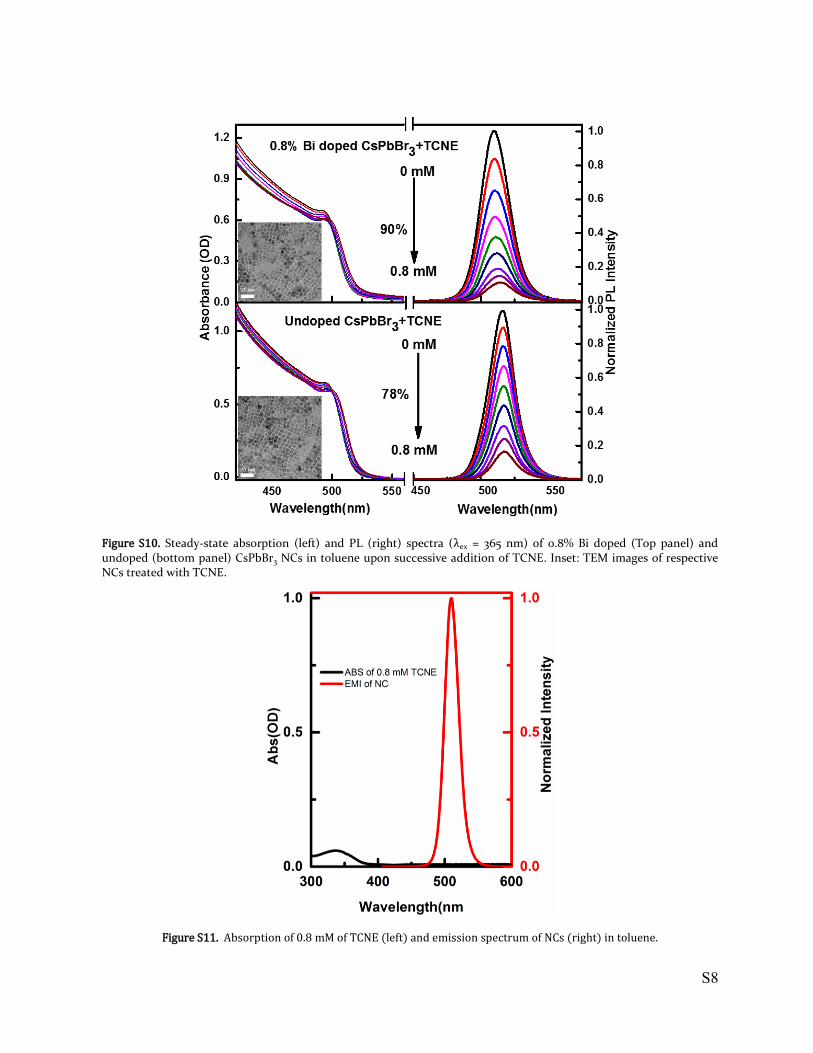
Figure S10. Steady-state absorption (left) and PL (right) spectra (λex = 365 nm) of 0.8% Bi doped (Top panel) and undoped (bottom panel) CsPbBr3 NCs in toluene upon successive addition of TCNE. Inset: TEM images of respective NCs treated with TCNE.
Figure S11. Absorption of 0.8 mM of TCNE (left) and emission spectrum of NCs (right) in toluene.

S9
Figure S12. Stern-Volmer plot of undoped and 0.8% of Bi-doped CsPbBr3 NCs.
A1 t1(ps) A2 t2(ns)
CsPbBr3 44% 82±24 56% 2.9±1.9
CsPbBr3+TCNE 48% 26±16 52% 1.5±1.1
Bi:CsPbBr3 43% 128±27 57% 3.5±2.5
Bi:CsPbBr3+TCNE 46% 17±8 54% 1.1±1.1
CsPbBr3+PC61BM 43% 71±31 57% 2.1±1.4
Bi:CsPbBr3+PC61BM 48% 53 ±11 52% 1.8±1.1
Table S3. Fitted kinetic data of ground state bleaching recovery (GSB) of CsPbBr3 NCs – undoped and 0.8% doped- in the absence and presence of TCNE and PC61BM.

S10
Figure S13. Steady state absorption (right) and PL (left) spectra (λex = 800 nm) of undoped CsPbBr3 NCs (top panel) and 0.8% Bi-doped NCs (bottom panel) in toluene upon the addition of increasing concentration of PCBM.

S11
Figure S14. Photoelectron spectroscopy in air (PESA) of (A) undoped, (C) 0.25% (C) 0.8% and (D) 2.1% Bi-doped CsPbBr3 NCs.