engineering management (ge 404) - ksufac.ksu.edu.sa/sites/default/files/ge_404-lecture-6... ·...
TRANSCRIPT

LECTURE #6
Precedence Diagramming and Time Scaled Network
January 24, 2020GE 404 (Engineering Management)
1
ENGINEERING MANAGEMENT
(GE 404)
بسم هللا الرحمن الرحيم

Objectives of the Present lecture
January 24, 2020GE 404 (Engineering Management)
2
To explain how to draw Precedence network
diagrams
To discuss how to calculate Early/Late
Start/Finish Times in Precedence Network
diagrams.
To discuss steps involved in drawing the Time-
scaled network diagrams
Precedence Diagramming
January 24, 2020GE 404 (Engineering Management)
3
Precedence diagramming is an extension to the original Activity-On-Nodeconcept.
Precedence diagramming includes precedence relationships among theactivities.
In addition, one may specify a “lag time” associated with any of theprecedence relationships.
A successor "lags" a predecessor, but a predecessor "leads" a successor.
Lag time can be designated on a dependency line with a positive, negative, orzero value.
The prime relationship used in PERT/CPM network is Finish-to-start type ofdependency, with FSij = 0 .

Activity Relationships
January 24, 2020GE 404 (Engineering Management)
4
Finish-to-Start (FS)
In a finish-to-start relationship, the start of an activity depends on the completion of its
preceding activity.
Example: Footing excavation must be completed prior to placing concrete for the footing
Start-to-Start (SS)
In a start-to-start relationship, an activity can not start before its preceding activity starts
Example: Project management activities can not start before the Project work starts
Finish-to-Finish (FF)
In a finish-to-finish relationship, the two activities are related by the fact that they must be
completed at the same time
Example: In a simple task of setting a flagpole, the backfilling task and the positioning the
pole task will be finished at the same time.
Start-to-Finish (SF)
In start-to-finish relationship, the finish of an activity depends on the start of its preceding
activity (A rare relationship)
Example: In a Hospital emergency, the previous shift can not finish before the new shift starts Say you’re building a new gas pipeline. You would first finish construction and implementation of the new pipeline before you would
begin shutting down and breaking down the old pipeline.

Lag
January 24, 2020GE 404 (Engineering Management)
5
The amount of time that exists between the early finish of an
activity and the early start of a specified succeeding activity
Calculate lags for each link by determining the difference
between the ES of each activity following a link line and the EF
of the activity that precedes it
Limitations and Disadvantages of Lag:
Lag would complicate the scheduling process
Lags are not extensively used except where the time effects
are substantial for special project type

Finish-to-Start Activity Precedence Relationships with Lag Values
January 24, 2020GE 404 (Engineering Management)
6
ijij FSEFES
jjj DESEF
iii DLFLS
ijji FSLSLF
Activity i Activity j Activity kFSij FSjk
jkjkijij FSFS lag and lag :Note

Start-to-Start Activity Precedence Relationships with Lag Values
January 24, 2020GE 404 (Engineering Management)
7
ijij SSESES
jjj DESEF
ijji SSLSLS
iijjiii DSSLSDLSLF
Activity i
Activity j
Activity k
SSij
SSjk
jkjkijij SSSS lag and lag :Note

Finish-to-Finish Activity Precedence Relationships with Lag Values
January 24, 2020GE 404 (Engineering Management)
8
jjjijij DEFDFFEFES
ijij FFEFEF
iiiijji DLFDFFLFLS
ijji FFLFLF
Activity i
Activity j
Activity k
FFij
FFjk
jkjkijij FFFF lag and lag :Note

Start-to-Finish Activity Precedence Relationships with Lag Values
January 24, 2020GE 404 (Engineering Management)
9
jjjijij DEFDFESES S
ijij SFESEF ijji SFLFLS
iiiijji DLSDSFLFLF
Activity i
Activity j
Activity k
SFij
SFjk
jkjkijij SFSF lag and lag :Note

Note on SFij
January 24, 2020GE 404 (Engineering Management)
10
Activity j cannot finish till i
starts (rare)
SFij is equal to the minimum
number of time units that
must transpire from the start
of the predecessor i to the
completion of the successor
j.
Example
For the shown diagram
calculate total lag if
SFij'
i
j
SFij''
1064''' ijijij SFSFSF
The finish of j must lag 10
units after the start of i
6 and 4 ''' ijij SFSF

Summary
January 24, 2020GE 404 (Engineering Management)
11
Finish-to-Start Relationships with Lag Values FSij :
ijij FSEFES
Start-to-Start Relationships with Lag Values SSij :
ijij SSESES
Finish-to-Finish Relationships with Lag Values FFij :
jijij DFFEFES
Start-to-Finish Relationships with Lag Values SFij :
jijij DFESES S
ijji FSLSLF
iijji DSSLSLF
ijji FFLFLF
iijji DSFLFLF

Generalized Equations
January 24, 2020GE 404 (Engineering Management)
12
jiji
jiji
iji
iji
ij
DSFES
DFFEF
SSES
FSEF
ES
Time Initial
)Max(all
jjj DESEF
FORWARD PASS COMPUTATIONS BACKWARD PASS COMPUTATIONS
iijj
iijj
ijj
ijj
ji
DSFLF
DSSLS
FFLF
FSLS
LF
Time Terminal
)Min(all
iii DLFLS

Composite Start-to-Start and Finish-to-Finish (ZZij)Activity Precedence Relationships with Lag Values
January 24, 2020GE 404 (Engineering Management)
13
ZZij is a combination of two constraints, i.e., a start-to-start and
finish-to-finish relationship. It is written with the SSij time units
first, followed by the FFij time units.
Example: ZZij =5, 6
The start of activity j must lag 5 units after the start of activity i & The finish of
activity j must lag 6 units after the finish of activity i

Representation
January 24, 2020GE 404 (Engineering Management)
14
ES Duration EF
Activity (i)
LS Total Float LF
ES Duration EF
Activity (j)
LS Total Float LFConstraints with lag/lead Durations
)( ijijij
ij
ij
ij
ij
FFSSZZ
SF
FS
FF
SS

Free and Total Floats in Overlapping Networks
January 24, 2020GE 404 (Engineering Management)
15
Free Float of an activity can be defined as time span in which the completion of the controlling date of an activity may occur and not delay the termination of the project nor delay the early status of the following activity.
Total float (TF) equation is same as it was developed for the single relationship network.
ijij
ijij
ijij
ijij
ji
SFESEF
FFEFEF
SSESES
FSEFES
FF )Min(all

Problem-1
January 24, 2020GE 404 (Engineering Management)
16
For the given precedence diagram, complete the forward and backward pass calculations.
Assume the project starts at T=0, and no splitting on activities is allowed. Also assume that
the project latest allowable completion time (project duration) is scheduled for 30 working
days.
FS 0
SS 3
FF 4
SS 6
SF 12
FS 0A
Develop
system spec.
(D=8)
C
Collect
system data
(D=4)
D
Test & debug
program
(D=6)
E
Run
program
(D=6)
F
Document
program
(D=12)
B
Write comp.
program
(D=12)
EFDES
Activity ID
LFTFLS

SolutionStep-1: Network diagram
January 24, 2020GE 404 (Engineering Management)
17
A
8
B
12
D
6
C
4
END
0
E
6
F
12
EFDES
Activity ID
LFTFLS

Step-2: Forward Pass Computations
January 24, 2020GE 404 (Engineering Management)
18
Activity A
880
0Time Initial
AD
AES
AEF
AES
Activity B
15123
01248
330
0Time Initial
)(
BBB
BABA
ABAB
DESEF
DFFEF
SSESMaxES A
Activity C
1349
963
0Time Initial)(
CD
CES
CEF
BCSS
BES
MaxES BC
jjj
jiji
jiji
iji
iji
ij
DESEF
DSFES
DFFEF
SSES
FSEF
allMaxES
]2[
Time Initial
)(]1[

January 24, 2020GE 404 (Engineering Management) 19
Activity D21615
15015
0
DD
DES
DEF
BDFS
BEF
meInitial TiMax(B)
DES
Activity E27621
13013,
210210Time Initial
),(
ED
EES
EEF
CEFS
CEFOR
DEFS
DEF
DCMaxE
ES
Activity F271215
13013,
151212150Time Initial
)(
FFF
CFC
FDFDF
DESEF
FSEFOR
DSFESMaxES D
jjj
jiji
jiji
iji
iji
ij
DESEF
DSFES
DFFEF
SSES
FSEF
allMaxES
]2[
Time Initial
)(]1[

Contd.
January 24, 2020GE 404 (Engineering Management)
20
A
8
B
12
D
6
C
4
END
0
E
6
F
12
0 8 3 15
9 13
15 21
21 27
15 27
27 27
FS 0
SS 3
FF 4 SS 6
SF 12
FS 0

January 24, 2020GE 404 (Engineering Management) 21
Step-3 Backward Pass Computations
Activity F 181230
30Time Terminal
FD
FLF
FLS
FLF
Activity E24630
30Time Terminal
EEE
E
DLFLS
LF
Activity D
18624
2461230
or
2402430Time Terminal
)( ,
DDD
DDFF
DEE
FED
DLFLS
DSFLF
FSLSMinLF
iii
iijj
iijj
ijj
ijj
ji
DLFLS
DSFLF
DSSLS
FFLF
FSLS
allMinLF
]4[
Time Terminal
)(]3[
A
8
B
12
D
6
C
4
END
0
E
6
F
12
0 8 3 15
9 13
15 21
21 27
15 27
27 27
3030 3
30
30
18 3
24 3
2418 3
FS 0
SS 3
FF 4 SS 6
SF 12
FS 0

January 24, 2020GE 404 (Engineering Management) 22
iii
iijj
iijj
ijj
ijj
ji
DLFLS
DSFLF
DSSLS
FFLF
FSLS
allMinLF
]4[
Time Terminal
)(]3[Activity C
14418
18018
or
2402430Time Terminal
),(
CCC
CFF
CEE
C
DLFLS
FSLS
FSLSFEMinLF
Activity B
61218
2012614
1801830Time Terminal
),
(
BD
BLF
BLS
BD
BCSS
CLS
OR
BDFS
DLS
DCMin
BLF
Activity A
3811
11836
14418
30Time Terminal
)(
AD
ALF
ALS
AD
ABSS
BLS
ABFF
BLF
BMin
ALF
A
8
B
12
D
6
C
4
END
0
E
6
F
12
0 8 3 15
9 13
15 21
21 27
15 27
27 27
3030 3
30
30
18 3
24 3
2418 3
1814 5
186 3113 3
FS 0
SS 3
FF 4 SS 6
SF 12
FS 0

Step 4: Slack time (Float time)
January 24, 2020GE 404 (Engineering Management)
23
Earliest Earliest Latest Latest OnStart Finish Start Finish Slack Critical
Activity ES EF LS LF LS – ES Path
A 0 8 3 11 3 Yes
B 3 15 6 18 3 Yes
C 9 13 14 18 5 No
D 15 21 15 21 3 Yes
E 21 27 24 30 3 Yes
F 15 27 18 30 3 Yes
Critical path is the path with the least total float = The longest path through the
network.
CP1: A-B-D-E, CP2: A-B-D-F ;
Critical Activities: A, B, D, E, and F

Problem-2
January 24, 2020GE 404 (Engineering Management)
24
Given the precedence network for a small engineering project with activity durations in
working days, it is required to compute the activity times (ES, EF, LS, and LF) and total
floats (TF) and then indicate the critical activities.
58 3
FS 3FF 5
SS 8
106105
5FFFS 2
FS 4SF 3,4
7134SS 5
FS 0
L
C
D
E
F
H
I
J
K
ZZ 3,2A

SolutionStep-1: Calculate ES and EF
January 24, 2020GE 404 (Engineering Management)
25
2451916881138
FS 3FF 5
SS 8
3410241961317107550
5FFFS 2
FS 4SF 3,4
167922139945SS 5
FS 0
L
C
D
E
F
H
I
J
K
ZZ 3,2A

Step-2: Calculate LS and LF
January 24, 2020GE 404 (Engineering Management)
26
2451916881138
FS 3FF 5
24 1916 811 8
SS 8
3410241961317107550
5FFFS 2
34 2429 2327 175 0
FS 4SF 3,4
167922139945SS 5
FS 0
20 1326 1313 9
L
C
D
E
F
H
I
J
K
ZZ 3,2A

Step-3: Calculate Total float
January 24, 2020GE 404 (Engineering Management)
27
2451916881138
FS 3FF 5
2401916081108
SS 8
3410241961317107550
5FFFS 2
34024291023271017500
FS 4SF 3,4
167922139945SS 5
FS 0
20413264131349
K
ZZ 3,2A L
C
D
E
F
H
I
J

Step 4: Indicate critical activities
January 24, 2020GE 404 (Engineering Management)
28
2451916881138
FS 3FF 5
2401916081108
SS 8
3410241961317107550
5FFFS 2
34024291023271017500
FS 4SF 3,4
167922139945SS 5
FS 0
20013264131349
K
ZZ 3,2A L
C
D
E
F
H
I
J

Problem-3
January 24, 2020GE 404 (Engineering Management)
29
Given below the precedence network for a small engineering project with activity
durations in working days. Compute the activity times (ES, EF, LS, and LF), total floats
(TF) and free floats. Also indicate the critical activities and find the critical path.
LEGENDS
ES D EF
3 SF,2 2 Act FF
B D LS TF LF
3
SS, 2 F
5
A
FF,1
6 6
C FS,1 E
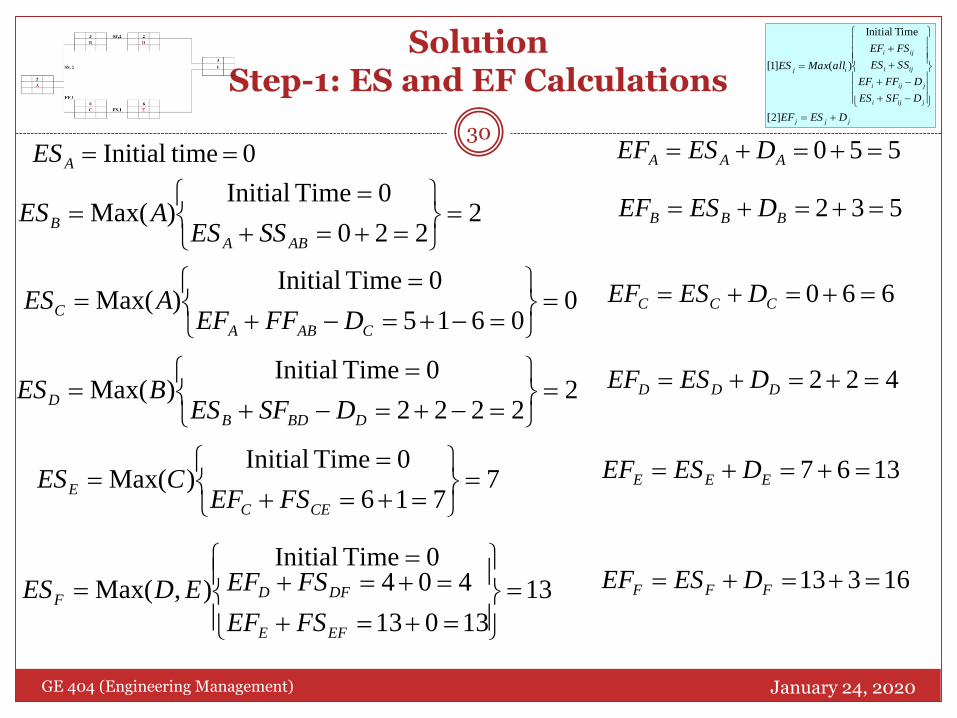
SolutionStep-1: ES and EF Calculations
January 24, 2020GE 404 (Engineering Management)
300 timeInitial AES
jjj
jiji
jiji
iji
iji
ij
DESEF
DSFES
DFFEF
SSES
FSEF
allMaxES
]2[
Time Initial
)(]1[
2220
0Time Initial)Max(
ABA
BSSES
AES
00615
0Time Initial)Max(
CABA
CDFFEF
AES
7716
0Time Initial)Max(
CEC
EFSEF
CES
22222
0Time Initial)Max(
DBDB
DDSFES
BES
532 BBB DESEF
550 AAA DESEF
660 CCC DESEF
422 DDD DESEF
1367 EEE DESEF
13
13013
4040Time Initial
),Max(
EFE
DFDF
FSEF
FSEFEDES 16313 FFF DESEF

Step-2: LF and LS Calculations
January 24, 2020GE 404 (Engineering Management)
31
13 13013
16Time Terminal)(Min
EFF
EFSLS
FLF 7613 EEE DLFLS
112-13 DDD DLFLS
iii
iijj
iijj
ijj
ijj
ji
DLFLS
DSFLF
DSSLS
FFLF
FSLS
allMinLF
]4[
Time Terminal
)(]3[
6 617
16Time Terminal)(Min
CEE
CFSLS
ELF 066 CCC DLFLS
13 13013
16Time Terminal)(Min
DFF
DFSLS
FLF
14 143213
16Time Terminal)(Min
BBDD
BDSFLF
DLF 113-14 BBB DLFLS
5
516
14521116Time Terminal
),(Min
ACC
AABBA
FFLF
DSSLSCBLF05-5 AAA DLFLS
16 timeTerminal FLF 13316 FFF DLFLS

Contd.
January 24, 2020GE 404 (Engineering Management)
32
2 3 5 SF,2 2 2 4
B D
11 9 14 11 9 13
13 3 16
SS, 2 F
13 0 16
0 5 5
A
0 0 5
FF,1
0 6 6 7 6 13
C FS,1 E
0 0 6 7 0 13

Step-3: FF Calculations
January 24, 2020GE 404 (Engineering Management)
33
02-2-4 BDBDB SFESEFFF
0 0156
0202),(Min
ACAC
ABAB
AFFEFEF
SSESESCBFF
ijij
ijij
ijij
ijij
ji
SFESEF
FFEFEF
SSESES
FSEFES
FF )Min(all
90-4-13 DFDFD FSEFESFF
01-6-7 CECEC FSEFESFF
00-13-13 EFEFE FSEFESFF

Final Answer
January 24, 2020GE 404 (Engineering Management)
34
2 3 5 SF,2 2 2 4
B 0 D 9
11 9 14 11 9 13
13 3 16
SS, 2 F 0
13 0 16
0 5 5
A 0
0 0 5
FF,1
0 6 6 7 6 13
C 0 FS,1 E 0
0 0 6 7 0 13
Critical Activities: A; C; E; and FCritical Path: A-C-E-F

Hammock Activity
January 24, 2020GE 404 (Engineering Management)
35
An activity that extends from one activity to another, but which has noestimated duration of its own.
It is time-consuming and requires resources, but its duration iscontrolled, not by its own nature, but by the two activities betweenwhich it spans. Example: activity “A” ends on day 3 and activity “C” begins on day 10 and there is
a set of activities that are summarized as activity “B” (the hammock activity) thatmust be done between activity “A” and activity “C.”
Activity “B” doesn’t have a specific duration—it has the duration of the timebetween day 3 and day 10.
If activity “A” takes longer than expected and ends on day 4, then the duration ofactivity “B” is now the duration of time between day 4 and day 10.
Its ES and LS times are determined by the activity where it begins andits EF and LF times are dictated by the activity at its conclusion.

Time-Scaled Networks
January 24, 2020GE 404 (Engineering Management)
36
Time-scaled networks are merely extension of bar charts
Each activity is shown as a one dimensional line rather than as a
two dimensional box
The horizontal length is equal to its estimated time duration
(beginning at its ES and ending with its EF values)
Vertical solid (or dashed) lines indicate sequential dependence
of one activity on another
Float times are shown as horizontal dashed lines

Free Float or activity Float Total Float or Path Float
January 24, 2020GE 404 (Engineering Management)
Free float is the amount of time
that an activity’s completion
time may be delayed without
affecting the earliest start of
succeeding activity
Free float is “owned” by an
individual activity
Total float is the amount of time
that an activity’s completion
may be delayed without affecting
the earliest start of any activity
on the network critical path
Total float is shared by all
activities along a slack path
Total path float time for activity
(i-j) is the total float associated
with a path
37
Free and Total Floats

Advantages and Disadvantages
January 24, 2020GE 404 (Engineering Management)
38
Advantages
Very suitable device for checking daily project needs of different
resources, and for the advance detection of conflicting demands among
activities for the same resource
Useful for project financial management applications
Disadvantages
Because it is drawn by manual drafting methods, the level of effort
needed to modify and update them is very large
Dependencies among activities are not always so obvious as they are
on the activity on node network.

Problem-1
January 24, 2020GE 404 (Engineering Management)
39
The following activity list represents the job logic and the durations of activities for a
market survey project. Draw a time- scaled network for the project, determine project
time and calculate the activities float times.
Activity Description predecessors Duration, week
A Plan survey — 1
B Hire personnel A 1
C Design questionnaire A 3
D Train personnel B, C 2
E Select samples of customers C 1
F Print questionnaire C 1
G Conduct survey D,E,F 3
H Analyze results G 2

Solution
January 24, 2020GE 404 (Engineering Management)
40
• Project completion time = 11 working days
• Critical Path: A-C-D-G-H.
Activity A B C D E F G H
Total float 0 2 0 0 1 1 0 0
Free float 0 2 0 0 1 1 0 0

1 2 3 4 5 6 7 8 9 10 11 12 13 14 15 16 17 18
Project completion time = 18 working days
Critical Path: A, D, F, I, J.
Activity A B C D E F G H I J
Total float 0 0 0 5 2 0 0
Free float 0 0 0 5 2 0 0
Activity Depends on Duration (day)
E
B
C
G
F
A
H
D
I
J
B, C
A
A
E
C, D
None
E, F
A
F
G, H, I
2
3
4
3
5
2
2
5
4
2
A D
C
B
F I
E G
H
J
Problem-2

Shortening of Project Duration
January 24, 2020GE 404 (Engineering Management)
42
Reducing scope (or quality)
Adding resources
Concurrency (perform tasks in parallel)
Substitution of activities

Further Reading
January 24, 2020GE 404 (Engineering Management)
43
1. Moder J., Phillips, C., and Davis, E. Project Management with CPM, PERT, and Precedence Diagramming, 3rd Edition.
2. Jimmie W. Hinze. “Construction Planning and Management,” Fourth Edition, 2012, Pearson.
Read more about the scheduling network models from:

Thank You
January 24, 2020GE 404 (Engineering Management)
44