engineering properties and carbon footprint of ground ... · engineering properties and carbon...
TRANSCRIPT
Construction and Building Materials 101 (2015) 503–521
Contents lists available at ScienceDirect
Construction and Building Materials
journal homepage: www.elsevier .com/locate /conbui ldmat
Engineering properties and carbon footprint of ground granulated blast-furnace slag-palm oil fuel ash-based structural geopolymer concrete
http://dx.doi.org/10.1016/j.conbuildmat.2015.10.0260950-0618/� 2015 Elsevier Ltd. All rights reserved.
⇑ Corresponding author.E-mail address: [email protected] (U.J. Alengaram).
Azizul Islam, U. Johnson Alengaram ⇑, Mohd Zamin Jumaat, Iftekhair Ibnul Bashar, S.M. Alamgir KabirDepartment of Civil Engineering, Faculty of Engineering, University of Malaya, 50603 Kuala Lumpur, Malaysia
h i g h l i g h t s
� Normal weight and lightweight structural green concrete could be produced by using POFA and GGBS with low binder content.� Manufactured sand could be used as an ideal replacement for conventional mining sand.� In ambient cured conditions, 96% of the compressive strength of OPSGC could be achieved in 7 days.� The usage of OPSGC could reduce the density by 20% compared to NWGC.
a r t i c l e i n f o
Article history:Received 13 April 2015Received in revised form 11 October 2015Accepted 12 October 2015
Keywords:Palm oil fuel ashGround granulated blast-furnace slagOil palm shellMechanical propertiesGeopolymer lightweight structural concreteCarbon footprint
a b s t r a c t
Engineering properties of geopolymer concrete developed using palm oil fuel ash and slag as binders,manufactured sand and quarry dust as replacement materials for fine aggregate, and oil palm shell(OPS) as coarse aggregate were investigated along with carbon footprint. The use of binder content of425 kg/m3 with OPS based lightweight concrete produced the highest compressive strength of 33 MPa.Ultrasonic pulse velocity of normal weight geopolymer concrete (NWGC) shows it as ‘‘good quality”.The development of structural grade OPS geopolymer concrete comparable to NWGC shows its potentialapplication for structural purposes. OPS geopolymer concrete has lower carbon footprint of 50–60% com-pared to conventional concrete.
� 2015 Elsevier Ltd. All rights reserved.
1. Introduction
The term structural concrete indicates any type of concrete thatis used in structural applications, which may be plain, reinforced,pre-stressed, or partially pre-stressed concrete [1]. For structuralconcrete, generally, the pragmatic requirement is that anylightweight aggregate that is suitable with a crushing strength suf-ficient to have reasonable resistance to fragmentation whileenabling concrete strengths in excess of 20 N/mm2 [2]. The densityof structural lightweight aggregate concrete can range fromapproximately 1200–2000 kg/m3 compared to 2300–2500 kg/m3
for normal weight concrete (NWC) [2]. The oven-dry density range,as specified in EN 206-1 [3] for lightweight concrete and NWC are800–2000 kg/m3 and 2000–2600 kg/m3, respectively. Concretewith a density that exceeds 2600 kg/m3 is known as heavyweight
concrete. The minimum strengths for structural lightweight con-crete, as identified by several codes, are shown in Table 1 [2].
As known, concrete is the most widely used constructionmaterial in the world, with the current consumption of 1 m3 perperson per year [4]. The concrete industry is said to be one of thecontributors to global warming due to the use of ordinary Portlandcement (OPC), which is the main component in the production ofconcrete and other cement based construction materials. The car-bon dioxide (CO2) emissions from the production of OPC constituteapproximately 5% to 7% of global anthropogenic emissions [5,6]. Ithas been reported [7] that 1 tonne of cement produces about1 tonne of CO2.
Every year millions of tons of industrial waste are generated ofwhich most are either unutilised or underutilised. Furthermore,these wastes cause environmental issues due to storage problemsand pollution of the surrounding fields. In recent years, there hasbeen increasing awareness concerning the quantity and diversityof hazardous solid waste generation and its impact on humanhealth. The quarrying of natural sand has a sizeable and

Table 1Minimum strengths for structural lightweight concrete [2].
Code Reinforced Prestressed
BS 8110 20 30a and 40b
BS 5400 25 Not permittedACI 318 30 30ENV 1992-1-4 12 25a and 30b
AS 3600 25 25NS 3473 25 35JASS 5 25 25
a Post-tensioned.b Pre-tensioned.
504 A. Islam et al. / Construction and Building Materials 101 (2015) 503–521
irreversible environmental impact [8], as it causes a reduction inthe groundwater, which affects the moisture content of the soil.Due to the drop in river water level, drinking water is badlyaffected, especially during the dry season, and saltwater intrusionbecomes a potential problem. In addition, sand mining causesthe erosion of nearby land leading to instability in the ecosystem[9].
Currently, the need for environmentally friendly constructionmaterials for sustainable development is an important environ-mental issue in the construction industry. An alternative cementi-tious binder, termed ‘‘geopolymer”, comprising alkali-activatedpalm oil fuel ash (POFA) and ground granulated blastfurnace slag(GGBS) binders could be considered as a substitute for OPC.Geopolymer was first described by Davidovits [10] as an inorganicmaterial that is rich in silicon (Si) and aluminium (Al), and reacts
Fig. 1. (a) Queensland’s University GCI building with 3 suspended floors made from strfloor parts, Australia [13].
with alkaline activators to become cementitious. Yusuf et al. [11]investigated the microstructure analysis of POFA–GGBS basedgeopolymer paste and found that the optimum content of GGBSwas about 20% in POFA, which could produce a compressivestrength of 44.57 MPa at 28 days. Geopolymer concrete is well-suited to manufacture precast concrete products that can be usedin both infrastructure developments [12] and main building struc-tures [13]. The University of Queensland’s Global Change Institute(GCI), Australia, is the world’s first building to successfully useslag/fly ash-based geopolymer concrete for structural purposesFig. 1 [13].
The recent research works on the utilisation of palm oil fuelash (POFA) as the source material opens a new avenue in thedevelopment of geopolymer concrete [14–16] as well as normalconcrete [17–19]. Aldahdooh et al. [18] reported that POFA couldbe used to produce high strength fibre reinforced concrete ofabout 158 MPa at 90 days. Mijarsh et al. [14] developed geopoly-mer mortar using 65 wt.% of POFA and found a compressivestrength of 47 MPa after 7 days of curing. It is reported [19] thatthe smaller size of POFA particles is more potential than that ofthe larger size of POFA particles due to the filler effect. Kupaeiet al. [20] developed fly ash based lightweight geopolymerconcrete using OPS as lightweight coarse aggregate. OPS basedstructural lightweight cement-concrete has also been developed[21] in the recent years. Kanadasan and Razak [22] reported thatanother potential waste from palm oil mill called palm oilclinker, which can be directly incorporated into concrete asreplacement for natural aggregates.
(a)
(b)
uctural geopolymer concrete, (b) precast slag/fly ash – based geopolymer concrete

A. Islam et al. / Construction and Building Materials 101 (2015) 503–521 505
To the best knowledge of the authors, no research work hasbeen carried out using GGBS–POFA as the source materials andOPS as the lightweight coarse aggregate to develop structural con-crete. The aim of this research, therefore, was to develop a struc-tural lightweight geopolymer concrete using POFA and GGBS asthe binder with OPS as coarse aggregate. The effect of different fineaggregates, such as mining sand (NS), manufactured sand (MS) andquarry dust (QD) was also investigated and reported by keepingother parameters, such as water and activator contents, constant.
2. Experimental programme
2.1. Materials
2.1.1. BinderPOFA (Fig. 2a) with a specific surface area and specific gravity of 172 m2/kg and
2.14, respectively, was used in this investigation. The grinding of POFA was carriedout for 30,000 cycles over 16 h to obtain the desired level of fineness (>66%). ASTM:C618-12a stipulates that the mass of fly ash and natural pozzolan passing through a45-lm by wet sieving should be at least 66%; POFA exceeded this target as 87%passed through the sieve.
Ground granulated blast-furnace slag (GGBS) (Fig. 2b) obtained from YTLCement Marketing Sdn Bhd, Malaysia, was used along with POFA as the sourcematerial in the development of geopolymer concrete. The slag activity index ofGGBS was 62% and 108% for 7 and 28 days, respectively. The specific gravity, speci-fic surface area and the soundness were 2.9 g/cm3, 405 m2/kg and 1 mm, respec-tively. The slag should consist of at least two-thirds by mass of the sum of CaO,MgO and SiO2 and its total content was found to be about 80%. The remainder con-tains Al2O3 together with small amounts of other oxides, as shown in Table 2. Theratio by mass (CaO + MgO)/(SiO2) exceeded 1.0 [23]. The particle size distribution,chemical composition and physical properties of POFA and GGBS are shown inFig. 3, Tables 2 and 3, respectively. The binder contents for normal weight geopoly-mer concrete (NWGC) and lightweight geopolymer concrete (LWGC) were 220 kg/m3 and 425 kg/m3, respectively. Fig. 4 shows the particle size distribution of miningsand, manufactured sand and quarry dust.
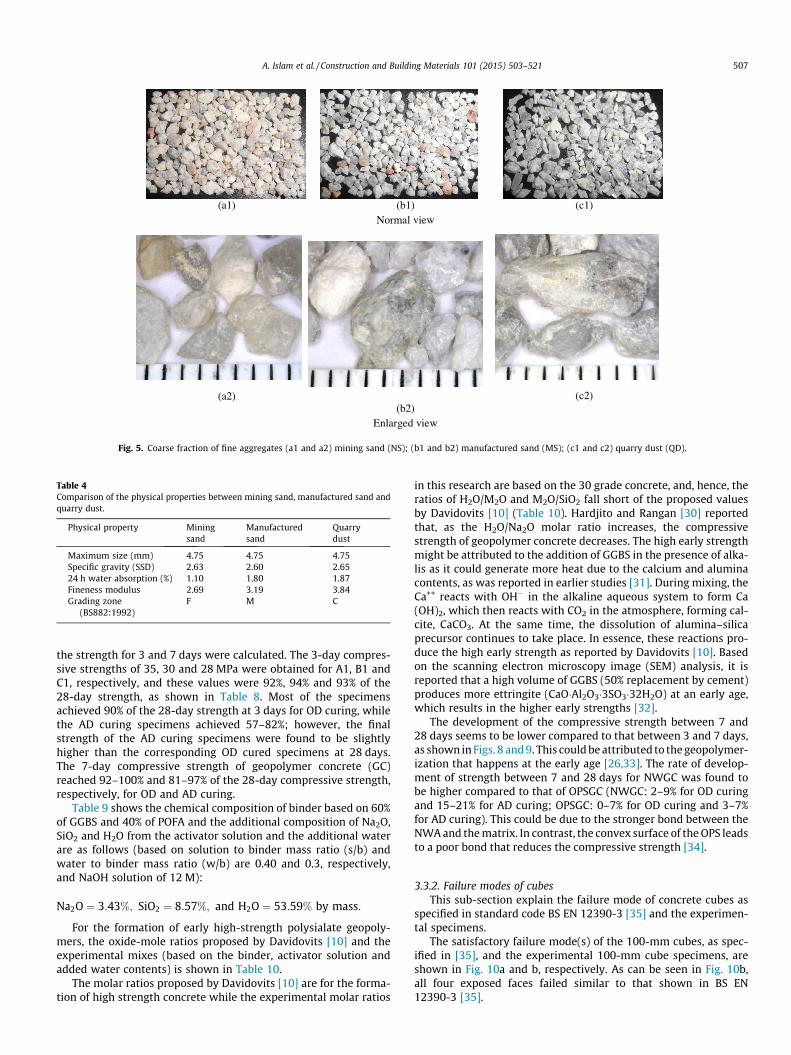
2.1.2. Fine aggregateThree different fine aggregates (Fig. 5) were used to produce concrete mixtures.
Conventional local mining sand (NS) with a maximum nominal size, specific gravityand fineness modulus of 4.75 mm, 2.63 and 2.69, respectively was used forcomparison purpose.
Two other local waste materials, namely, manufactured sand (MS) and quarrydust (QD) were used to study the feasibility of these materials in the developmentof sustainable lightweight geopolymer concrete; their physical and mechanicalproperties were investigated and compared with the conventional mixes usingmining sand. The maximum nominal size of 4.75 mm was kept constant for all fine
(a)
Fig. 2. Binders (a) palm oil fuel ash (POFA), (b) g
Table 2Chemical compositions of raw materials as determined by X-ray fluorescence (XRF) (wt.%
Chemical compounds CaO SiO2 Al2O3 MgO Na2O SO3
GGBS 45.83 32.52 13.71 3.27 0.25 1.80POFA 4.34 63.41 5.55 3.74 0.16 0.91
aggregates. The specific gravity and fineness modulus of MS were found to be 2.60and 3.19, respectively; however, QD with irregular and flaky particles had a higherspecific gravity and fineness modulus of 2.64 and 3.84, respectively. The particlesize distribution and physical properties of all three fine aggregates are shown inFig. 4 and Table 4, respectively.
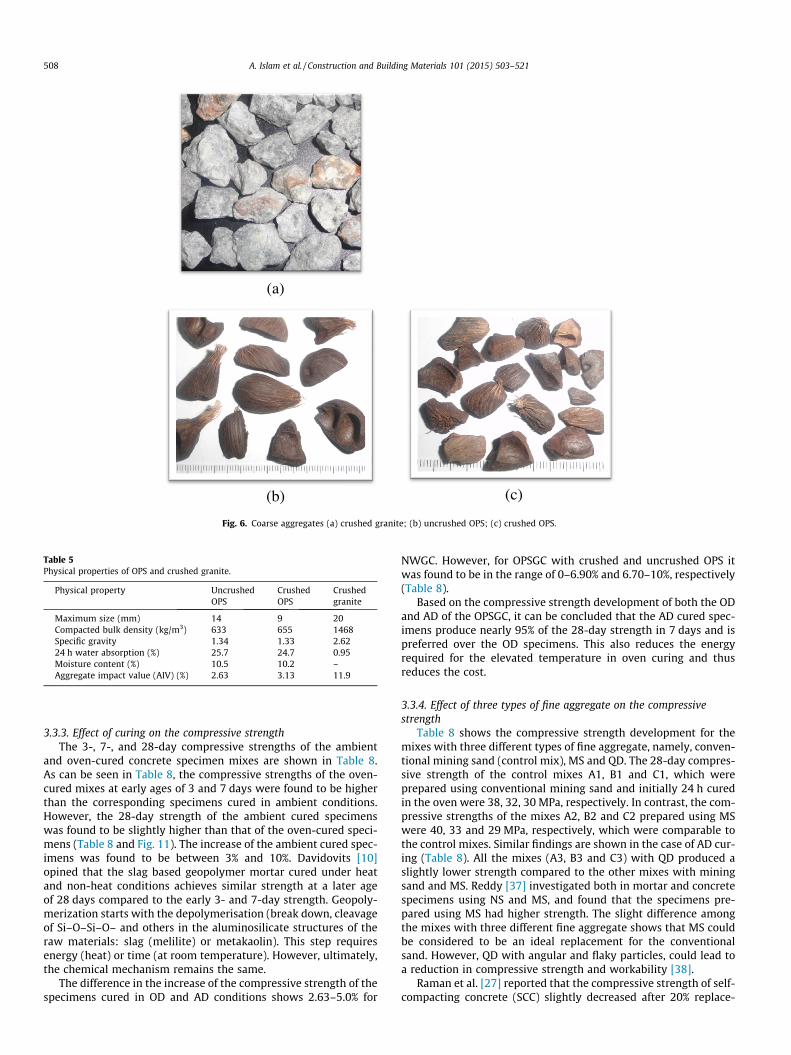
2.1.3. Coarse aggregateConventional crushed granite aggregate as shown in Fig. 6(a) was used for com-
parison purpose. The other coarse aggregate, OPS used in this study was collectedfrom the local palm oil factory with maximum size of 14 mm (Table 5). Generally,the raw OPS collected from the factory has an oily surface that could affect thebond. Hence, the OPS was washed and then air-dried in the laboratory to a satu-rated surface dry (SSD) condition; for the crushed OPS, the cleaned OPS was crushedto the required size.
The uncrushed OPS (Fig. 6(b)) have more concave and convex surfaces of whichthe outer convex surface is smoother compared to the concave surface. The crushedOPS as shown in Fig. 6(c) has more spiky edges than the uncrushed OPS (Fig. 6(b))[24]. The physical properties of the uncrushed and crushed OPS, along with the con-ventional crushed granite aggregate are given in Table 5. Both the crushed and theuncrushed OPS have a lower aggregate impact value (AIV) and bulk density than thecrushed granite aggregate. The OPS content in all the OPSGC mixes was kept con-stant at 255 kg/m3; while for the NWGC, crushed granite of 994 kg/m3 was used.The 24 h water absorption of OPS was found to be about 25%.
2.1.4. Alkaline activatorsA combination of sodium silicate (Na2O = 12%, SiO2 = 30%, and water = 57% by
mass) and sodium hydroxide solution (NaOH) was used as the alkaline activator.The solution of 12 molarity (M) NaOH prepared with 99% purity, such that 361 gof pellets were dissolved in 1 kg of solution [25]. The ratio of Na2SiO3/NaOH waskept constant at 2.5 for all the mixtures and the mixture containing additionalwater.
The specific gravity of the combined alkaline activators was found to be about1.57; while the specific gravities for Na2SiO3 and NaOH were 1.65 and 1.38, respec-tively. The specific gravity of the NaOH solution varied depending on the molarity ofthe solution. An increase in concentration of NaOH solution increased the specificgravity and vice-versa. The formula for the combined specific gravity is as follows:
GNaOH � 11þ 2:5
þ GNa2SiO3 � 2:51þ 2:5
¼ 1:57 ð1Þ
where GNaOH and GNa2SiO3 are the specific gravities of NaOH and Na2SiO3, respectively.
2.2. Mix proportions
A total of nine mixes were prepared using variables of three different coarseaggregates (crushed granite, uncrushed and crushed OPS), three fine aggregates(NS, MS and QD) and two different curing conditions, namely, oven and ambientcuring. The effect of the three fine aggregates on the fresh and hardened concreteproperties was observed. In addition, a comparison of the mechanical properties
(b)
round granulated blast-furnace slag (GGBS).
).
P2O5 K2O TiO2 MnO Fe2O3 SrO Cl CuO LOI
0.04 0.48 0.73 0.35 0.76 0.08 0.02 – 0.603.78 6.33 0.33 0.17 4.19 0.02 0.45 6.54 6.20

Legend: (P) - Passing, (R) – Retained
0
10
20
30
40
50
0
20
40
60
80
100
0.01 0.1 1 10 100 1000
% R
etai
ned
% P
assi
ng
Particle size (µm) (log scale)
POFA (P)
GGBS (P)
POFA (R)
GGBS (R)
Fig. 3. Particle size distribution of GGBS and POFA.
Table 3Physical properties of GGBS and POFA.
Label Specificgravity
Specific surface area,(m2/kg)
Soundness,(mm)
Colour
GGBS 2.90 405 (min 275 m2/kg,BS6699:1992)
1.00 Off-white
POFA 2.14 172 – Dark
0
20
40
60
80
100
0 1 10
% P
assi
ng
Particle size (mm) (log scale)
N-sand
M-sand
Q-dust
Fig. 4. Particle size distribution of mining sand, manufactured sand and quarrydust.
506 A. Islam et al. / Construction and Building Materials 101 (2015) 503–521
from the experimental results with the code of practice and published results wasalso performed. A normal weight geopolymer concrete (NWGC) using crushed gran-ite aggregate was prepared as a control mix to compare the mechanical propertiesof the OPSGC.
The mix proportions and experimental parameters of all the concrete mixes areshown in Tables 6 and 7, respectively. A graphical representation of fresh concretemixes is shown in Fig. 7. Initially the coarse and fine aggregates were mixed in therotary mixer followed by GGBS and POFA for about 5 min. This was followed by theaddition of water and alkaline activators and the mixing continued for another4 min. As the polycarboxylic-based superplasticizer (SP) reduces the fluidity ofthe mixture in the geopolymer concrete [26], free water was added to enhancethe workability. The alkaline solution/binder ratio (s/b) of 0.40 was kept constantfor all the mixes; the water/binder ratio (w/b) of 0.64 and 0.30 was used for NWGCand OPSGC, respectively.
2.3. Specimen moulding and testing
The concrete was cast in 100 mm cubes, Ø150 � 300 mm cylinders,Ø100 � 200 mm cylinders and 100 � 100 � 500 mm prisms for testing the com-pressive strength, modulus of elasticity, splitting tensile strength and flexuralstrength test, respectively. The compressive strength, modulus of elasticity, tensilesplitting strength and flexural strength tests were done in accordance with BS 1881:Part 118, ASTM: C469/C469M, BS EN 12390-6:2009 and BS EN 12390-5:2009,
respectively. The cube compressive test was carried out at 3, 7 and 28 days, whilethe modulus of elasticity, splitting tensile strength and flexural strength weretested at 28 days.
2.4. Curing of test specimens
After casting, the test specimens were covered with plastic sheeting to min-imise the evaporation of water. Two types of curing were used in this study, i.e.oven-dry curing and ambient curing. For oven-dry curing, the specimens were firstkeep in the laboratory for about 1 h and then cured in an oven for 24 h at 65 �C. Thespecimens were then demoulded and kept in ambient conditions until the age oftesting. The ambient cured specimens were kept in the laboratory at a temperatureand humidity of 26–29 �C and 75–80%, respectively, until the age of testing.
3. Results and discussion
The following sections describe the fresh and hardened con-crete properties of POFA–GGBS based geopolymer concrete devel-oped using OPS as coarse aggregate. The OPS used had two forms –crushed and uncrushed – the sizes of which varied in the range of5–10 mm and 5–14 mm, respectively.
3.1. Workability
As mentioned in Table 7, the solution to binder ratio was keptconstant at 0.4 for all mixes; the water/binder ratios were 0.64and 0.30 for NWGC and OPSGC, respectively. The workability ofthe concrete measured using the slump test shows the values of5–12 mm and 50–63 mm, respectively, for NWGC and OPSGC(Table 8). The mixtures using fine aggregate as quarry dust (QD)produced slightly lower workability compared to the mixes withconventional mining sand and MS, which might be attributed tothe angular edges of the aggregate, coarser particle size, high siltand dust content in the QD [27]. The setting of NWGC was foundto be faster compared to OPSGC, which could be attributed to thedry condition of NWA; it should be noted that the OPS was pre-soaked for about 24 h in water before use; the workability of theOPSGC mixes was found to be medium [28]. Although most ofthe mixes did not produce high workability, the cohesive concretemixes achieved sufficient compaction upon vibration using vibra-tion table. The smooth surface of the OPS aggregate also enhancedthe workability compared to the conventional coarse aggregate, asreported in previous studies [29]. It is important to note that theworkability test using a slump cone for the sticky and cohesivegeopolymer concrete might not be an appropriate test. Thus, itcan be concluded that the slump values do not reflect the actualworkability for the cohesive geopolymer concrete, and that suit-able workability tests as designed for self-compacting concrete(SCC) have to be formulated.
3.2. Density
Table 8 shows the test results for the 24 h oven dry density(ODD) for all mixes from which it can be seen that the OPSGC pro-duced a density in the range of 1900–1935 kg/m3. EN 206-1 [3]defines lightweight concrete (LWC) as concrete having an oven-dry density (ODD) of not less than 800 kg/m3 and not more than2000 kg/m3 that is produced using lightweight aggregate for allor part of the total aggregate. As seen in Table 8, all the OPSGC inthis investigation produced ODD of less than 2000 kg/m3 and thuscould be categorised as LWC.
3.3. Development of compressive strength in geopolymer concrete
3.3.1. Development of compressive strength between 3 and 28 daysTable 8 shows the compressive strength developed between 3
and 28 days expressed as a percentage. The 28-day compressivestrength was taken as the reference and the ratios achieved in
(a1)
(a2)
)1c()1b(Normal view
(b2) (c2)
Enlarged view
Fig. 5. Coarse fraction of fine aggregates (a1 and a2) mining sand (NS); (b1 and b2) manufactured sand (MS); (c1 and c2) quarry dust (QD).
Table 4Comparison of the physical properties between mining sand, manufactured sand andquarry dust.
Physical property Miningsand
Manufacturedsand
Quarrydust
Maximum size (mm) 4.75 4.75 4.75Specific gravity (SSD) 2.63 2.60 2.6524 h water absorption (%) 1.10 1.80 1.87Fineness modulus 2.69 3.19 3.84Grading zone
(BS882:1992)F M C
A. Islam et al. / Construction and Building Materials 101 (2015) 503–521 507
the strength for 3 and 7 days were calculated. The 3-day compres-sive strengths of 35, 30 and 28 MPa were obtained for A1, B1 andC1, respectively, and these values were 92%, 94% and 93% of the28-day strength, as shown in Table 8. Most of the specimensachieved 90% of the 28-day strength at 3 days for OD curing, whilethe AD curing specimens achieved 57–82%; however, the finalstrength of the AD curing specimens were found to be slightlyhigher than the corresponding OD cured specimens at 28 days.The 7-day compressive strength of geopolymer concrete (GC)reached 92–100% and 81–97% of the 28-day compressive strength,respectively, for OD and AD curing.
Table 9 shows the chemical composition of binder based on 60%of GGBS and 40% of POFA and the additional composition of Na2O,SiO2 and H2O from the activator solution and the additional waterare as follows (based on solution to binder mass ratio (s/b) andwater to binder mass ratio (w/b) are 0.40 and 0.3, respectively,and NaOH solution of 12 M):
Na2O ¼ 3:43%; SiO2 ¼ 8:57%; and H2O ¼ 53:59% by mass:
For the formation of early high-strength polysialate geopoly-mers, the oxide-mole ratios proposed by Davidovits [10] and theexperimental mixes (based on the binder, activator solution andadded water contents) is shown in Table 10.
The molar ratios proposed by Davidovits [10] are for the forma-tion of high strength concrete while the experimental molar ratios
in this research are based on the 30 grade concrete, and, hence, theratios of H2O/M2O and M2O/SiO2 fall short of the proposed valuesby Davidovits [10] (Table 10). Hardjito and Rangan [30] reportedthat, as the H2O/Na2O molar ratio increases, the compressivestrength of geopolymer concrete decreases. The high early strengthmight be attributed to the addition of GGBS in the presence of alka-lis as it could generate more heat due to the calcium and aluminacontents, as was reported in earlier studies [31]. During mixing, theCa++ reacts with OH� in the alkaline aqueous system to form Ca(OH)2, which then reacts with CO2 in the atmosphere, forming cal-cite, CaCO3. At the same time, the dissolution of alumina–silicaprecursor continues to take place. In essence, these reactions pro-duce the high early strength as reported by Davidovits [10]. Basedon the scanning electron microscopy image (SEM) analysis, it isreported that a high volume of GGBS (50% replacement by cement)produces more ettringite (CaO�Al2O3�3SO3�32H2O) at an early age,which results in the higher early strengths [32].
The development of the compressive strength between 7 and28 days seems to be lower compared to that between 3 and 7 days,as shown inFigs. 8 and9. This couldbeattributed to thegeopolymer-ization that happens at the early age [26,33]. The rate of develop-ment of strength between 7 and 28 days for NWGC was found tobe higher compared to that of OPSGC (NWGC: 2–9% for OD curingand 15–21% for AD curing; OPSGC: 0–7% for OD curing and 3–7%for AD curing). This could be due to the stronger bond between theNWAand thematrix. In contrast, the convex surface of theOPS leadsto a poor bond that reduces the compressive strength [34].
3.3.2. Failure modes of cubesThis sub-section explain the failure mode of concrete cubes as
specified in standard code BS EN 12390-3 [35] and the experimen-tal specimens.
The satisfactory failure mode(s) of the 100-mm cubes, as spec-ified in [35], and the experimental 100-mm cube specimens, areshown in Fig. 10a and b, respectively. As can be seen in Fig. 10b,all four exposed faces failed similar to that shown in BS EN12390-3 [35].
(a)
(b) (c)
Fig. 6. Coarse aggregates (a) crushed granite; (b) uncrushed OPS; (c) crushed OPS.
Table 5Physical properties of OPS and crushed granite.
Physical property UncrushedOPS
CrushedOPS
Crushedgranite
Maximum size (mm) 14 9 20Compacted bulk density (kg/m3) 633 655 1468Specific gravity 1.34 1.33 2.6224 h water absorption (%) 25.7 24.7 0.95Moisture content (%) 10.5 10.2 –Aggregate impact value (AIV) (%) 2.63 3.13 11.9
508 A. Islam et al. / Construction and Building Materials 101 (2015) 503–521
3.3.3. Effect of curing on the compressive strengthThe 3-, 7-, and 28-day compressive strengths of the ambient
and oven-cured concrete specimen mixes are shown in Table 8.As can be seen in Table 8, the compressive strengths of the oven-cured mixes at early ages of 3 and 7 days were found to be higherthan the corresponding specimens cured in ambient conditions.However, the 28-day strength of the ambient cured specimenswas found to be slightly higher than that of the oven-cured speci-mens (Table 8 and Fig. 11). The increase of the ambient cured spec-imens was found to be between 3% and 10%. Davidovits [10]opined that the slag based geopolymer mortar cured under heatand non-heat conditions achieves similar strength at a later ageof 28 days compared to the early 3- and 7-day strength. Geopoly-merization starts with the depolymerisation (break down, cleavageof Si–O–Si–O– and others in the aluminosilicate structures of theraw materials: slag (melilite) or metakaolin). This step requiresenergy (heat) or time (at room temperature). However, ultimately,the chemical mechanism remains the same.
The difference in the increase of the compressive strength of thespecimens cured in OD and AD conditions shows 2.63–5.0% for
NWGC. However, for OPSGC with crushed and uncrushed OPS itwas found to be in the range of 0–6.90% and 6.70–10%, respectively(Table 8).
Based on the compressive strength development of both the ODand AD of the OPSGC, it can be concluded that the AD cured spec-imens produce nearly 95% of the 28-day strength in 7 days and ispreferred over the OD specimens. This also reduces the energyrequired for the elevated temperature in oven curing and thusreduces the cost.
3.3.4. Effect of three types of fine aggregate on the compressivestrength
Table 8 shows the compressive strength development for themixes with three different types of fine aggregate, namely, conven-tional mining sand (control mix), MS and QD. The 28-day compres-sive strength of the control mixes A1, B1 and C1, which wereprepared using conventional mining sand and initially 24 h curedin the oven were 38, 32, 30 MPa, respectively. In contrast, the com-pressive strengths of the mixes A2, B2 and C2 prepared using MSwere 40, 33 and 29 MPa, respectively, which were comparable tothe control mixes. Similar findings are shown in the case of AD cur-ing (Table 8). All the mixes (A3, B3 and C3) with QD produced aslightly lower strength compared to the other mixes with miningsand and MS. Reddy [37] investigated both in mortar and concretespecimens using NS and MS, and found that the specimens pre-pared using MS had higher strength. The slight difference amongthe mixes with three different fine aggregate shows that MS couldbe considered to be an ideal replacement for the conventionalsand. However, QD with angular and flaky particles, could lead toa reduction in compressive strength and workability [38].
Raman et al. [27] reported that the compressive strength of self-compacting concrete (SCC) slightly decreased after 20% replace-
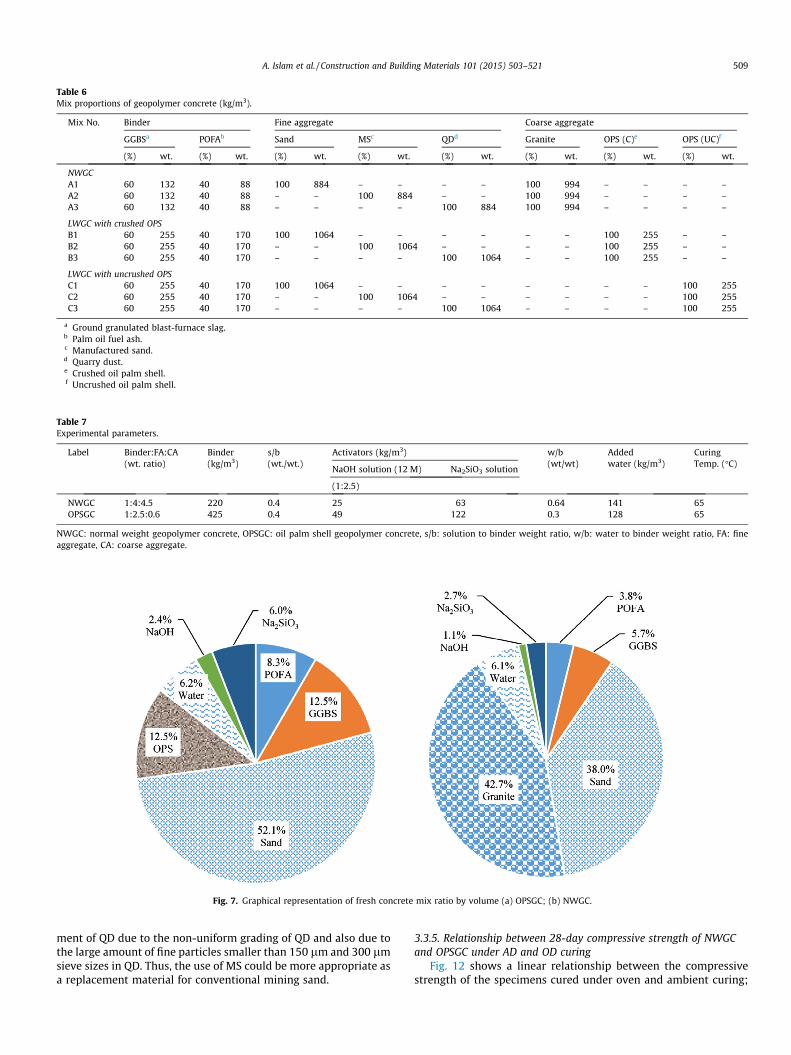
Table 6Mix proportions of geopolymer concrete (kg/m3).
Mix No. Binder Fine aggregate Coarse aggregate
GGBSa POFAb Sand MSc QDd Granite OPS (C)e OPS (UC)f
(%) wt. (%) wt. (%) wt. (%) wt. (%) wt. (%) wt. (%) wt. (%) wt.
NWGCA1 60 132 40 88 100 884 – – – – 100 994 – – – –A2 60 132 40 88 – – 100 884 – – 100 994 – – – –A3 60 132 40 88 – – – – 100 884 100 994 – – – –
LWGC with crushed OPSB1 60 255 40 170 100 1064 – – – – – – 100 255 – –B2 60 255 40 170 – – 100 1064 – – – – 100 255 – –B3 60 255 40 170 – – – – 100 1064 – – 100 255 – –
LWGC with uncrushed OPSC1 60 255 40 170 100 1064 – – – – – – – – 100 255C2 60 255 40 170 – – 100 1064 – – – – – – 100 255C3 60 255 40 170 – – – – 100 1064 – – – – 100 255
a Ground granulated blast-furnace slag.b Palm oil fuel ash.c Manufactured sand.d Quarry dust.e Crushed oil palm shell.f Uncrushed oil palm shell.
Table 7Experimental parameters.
Label Binder:FA:CA(wt. ratio)
Binder(kg/m3)
s/b(wt./wt.)
Activators (kg/m3) w/b(wt/wt)
Addedwater (kg/m3)
CuringTemp. (�C)
NaOH solution (12 M) Na2SiO3 solution
(1:2.5)
NWGC 1:4:4.5 220 0.4 25 63 0.64 141 65OPSGC 1:2.5:0.6 425 0.4 49 122 0.3 128 65
NWGC: normal weight geopolymer concrete, OPSGC: oil palm shell geopolymer concrete, s/b: solution to binder weight ratio, w/b: water to binder weight ratio, FA: fineaggregate, CA: coarse aggregate.
Fig. 7. Graphical representation of fresh concrete mix ratio by volume (a) OPSGC; (b) NWGC.
A. Islam et al. / Construction and Building Materials 101 (2015) 503–521 509
ment of QD due to the non-uniform grading of QD and also due tothe large amount of fine particles smaller than 150 lm and 300 lmsieve sizes in QD. Thus, the use of MS could be more appropriate asa replacement material for conventional mining sand.
3.3.5. Relationship between 28-day compressive strength of NWGCand OPSGC under AD and OD curing
Fig. 12 shows a linear relationship between the compressivestrength of the specimens cured under oven and ambient curing;
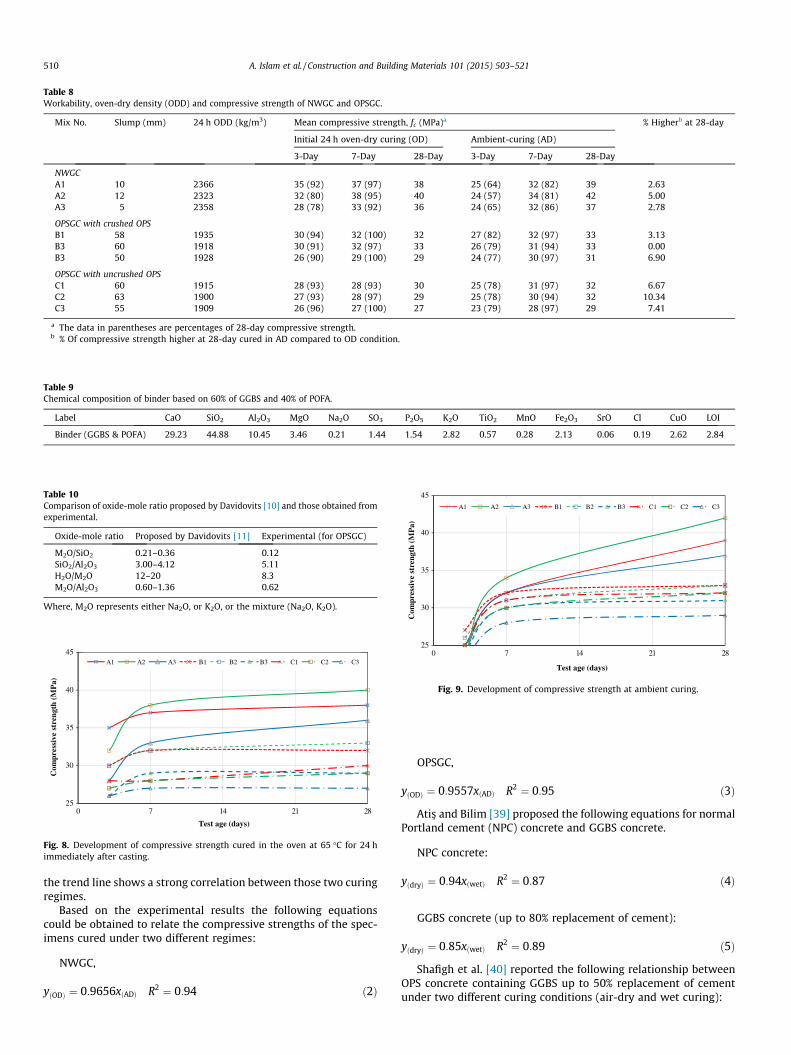
Table 8Workability, oven-dry density (ODD) and compressive strength of NWGC and OPSGC.
Mix No. Slump (mm) 24 h ODD (kg/m3) Mean compressive strength, fc (MPa)a % Higherb at 28-day
Initial 24 h oven-dry curing (OD) Ambient-curing (AD)
3-Day 7-Day 28-Day 3-Day 7-Day 28-Day
NWGCA1 10 2366 35 (92) 37 (97) 38 25 (64) 32 (82) 39 2.63A2 12 2323 32 (80) 38 (95) 40 24 (57) 34 (81) 42 5.00A3 5 2358 28 (78) 33 (92) 36 24 (65) 32 (86) 37 2.78
OPSGC with crushed OPSB1 58 1935 30 (94) 32 (100) 32 27 (82) 32 (97) 33 3.13B3 60 1918 30 (91) 32 (97) 33 26 (79) 31 (94) 33 0.00B3 50 1928 26 (90) 29 (100) 29 24 (77) 30 (97) 31 6.90
OPSGC with uncrushed OPSC1 60 1915 28 (93) 28 (93) 30 25 (78) 31 (97) 32 6.67C2 63 1900 27 (93) 28 (97) 29 25 (78) 30 (94) 32 10.34C3 55 1909 26 (96) 27 (100) 27 23 (79) 28 (97) 29 7.41
a The data in parentheses are percentages of 28-day compressive strength.b % Of compressive strength higher at 28-day cured in AD compared to OD condition.
Table 9Chemical composition of binder based on 60% of GGBS and 40% of POFA.
Label CaO SiO2 Al2O3 MgO Na2O SO3 P2O5 K2O TiO2 MnO Fe2O3 SrO Cl CuO LOI
Binder (GGBS & POFA) 29.23 44.88 10.45 3.46 0.21 1.44 1.54 2.82 0.57 0.28 2.13 0.06 0.19 2.62 2.84
Table 10Comparison of oxide-mole ratio proposed by Davidovits [10] and those obtained fromexperimental.
Oxide-mole ratio Proposed by Davidovits [11] Experimental (for OPSGC)
M2O/SiO2 0.21–0.36 0.12SiO2/Al2O3 3.00–4.12 5.11H2O/M2O 12–20 8.3M2O/Al2O3 0.60–1.36 0.62
Where, M2O represents either Na2O, or K2O, or the mixture (Na2O, K2O).
25
30
35
40
45
82124170
Com
pres
sive
str
engt
h (M
Pa)
Test age (days)
A1 A2 A3 B1 B2 B3 C1 C2 C3
Fig. 8. Development of compressive strength cured in the oven at 65 �C for 24 himmediately after casting.
25
30
35
40
45
82124170
Com
pres
sive
str
engt
h (M
Pa)
Test age (days)
A1 A2 A3 B1 B2 B3 C1 C2 C3
Fig. 9. Development of compressive strength at ambient curing.
510 A. Islam et al. / Construction and Building Materials 101 (2015) 503–521
the trend line shows a strong correlation between those two curingregimes.
Based on the experimental results the following equationscould be obtained to relate the compressive strengths of the spec-imens cured under two different regimes:
NWGC,
yðODÞ ¼ 0:9656xðADÞ R2 ¼ 0:94 ð2Þ
OPSGC,
yðODÞ ¼ 0:9557xðADÞ R2 ¼ 0:95 ð3ÞAtis� and Bilim [39] proposed the following equations for normal
Portland cement (NPC) concrete and GGBS concrete.
NPC concrete:
yðdryÞ ¼ 0:94xðwetÞ R2 ¼ 0:87 ð4Þ
GGBS concrete (up to 80% replacement of cement):
yðdryÞ ¼ 0:85xðwetÞ R2 ¼ 0:89 ð5ÞShafigh et al. [40] reported the following relationship between
OPS concrete containing GGBS up to 50% replacement of cementunder two different curing conditions (air-dry and wet curing):

Fig. 10. Failure mode of 100-mm cubes (a) satisfactory failure [35,36]; and (b) experimental specimen failure.
3840
36
32 33
29 30 2927
39
42
37
33 3331 32 32
29
20
25
30
35
40
45
A1 A2 A3 B1 B2 B3 C1 C2 C3
Com
pres
sive
str
engt
h (M
Pa)
Mix no.
OD AD
Fig. 11. Compressive strength at 28 days of age of geopolymer concrete subjectedto initial 24 h OD in relative to those of AD curing.
OPSGCy (OD) = 0.96 x(AD)
R² = 0.95
NWGCy (OD) = 0.97 x (AD)
R² = 0.94
25
28
31
34
37
40
43
25 28 31 34 37 40 43
28-d
ay c
ompr
essi
ve s
tren
gth
of in
itia
l 24
-h O
D c
urin
g (M
Pa)
28-day compressive strength under AD curing (MPa)
Fig. 12. Relationship between 28-day compressive strength of NWGC and OPSGCunder AD and OD curing conditions.
25
27
29
31
33
35
NS MS QD
Com
pres
sive
stre
ngth
(M
Pa)
Fine aggregate
OPS (C) OPS (UC)
Fig. 13. 28-Day compressive strength of OPSGC (initial 24 h OD curing).
25
27
29
31
33
35
NS MS QD
Com
pres
sive
stre
ngth
(MPa
)
Fine aggregate
OPS (C) OPS (UC)
Fig. 14. 28-Day compressive strength of OPSGC (ambient curing).
A. Islam et al. / Construction and Building Materials 101 (2015) 503–521 511
yðdryÞ ¼ 0:80xðwetÞ R2 ¼ 0:94 ð6ÞA similar type of equation proposed by Shafigh et al. [40] shows
that a good correlation could be established between the compres-sive strengths of specimens cured under two different environ-ments. The following equation is proposed for predicting thecompressive strength for OPS concrete containing fly ash up to50% replacement of cement:
fcðdryÞ ¼ 0:81fcðwetÞ R2 ¼ 0:93 ð7ÞBased on the above equations for two different lightweight con-
cretes–OPSGCandOPSC– the relationshipbetween theovenandaircured specimens of OPSGC shows a stronger relationship comparedto the air and wet cured specimens. This could be attributed to thegeopolymerization of the specimens cured in the oven and ambientconditions. For OPSC, the compressive strength depends on thehydration of cement and subsequent formation of C-S-H gel, while
for theOPSGC, the strengthdevelopment is dependent on the forma-tion of calcium–silicate–hydrate (C-S-H) and aluminosilicate-hydrate (A-S-H), which enhances the compressive-strength[26,41]. In the presence of an alkaline activator and calcium fromthe GGBS, the additional SiO2 and Al2O3 could react and formC-S-H or C-A-S-H and N-A-S-H gels and lead to a higher strengthgeopolymer [42].
3.3.6. Effect of uncrushed and crushed OPS on compressive strengthFigs. 13 and 14 show the 28-day compressive strengths of
OPSGC prepared using crushed and uncrushed OPS and curedunder OD and AD conditions. The results show that OPSGC withcrushed OPS achieved a slightly higher compressive strength com-pared to the corresponding mixes prepared using uncrushed OPScured in OD and AD conditions, and in the ranges of about 7–14%and 3–7%, respectively.
Previous studies [24,43] reported that OPSC with crushedaggregate produced a higher compressive strength compared to
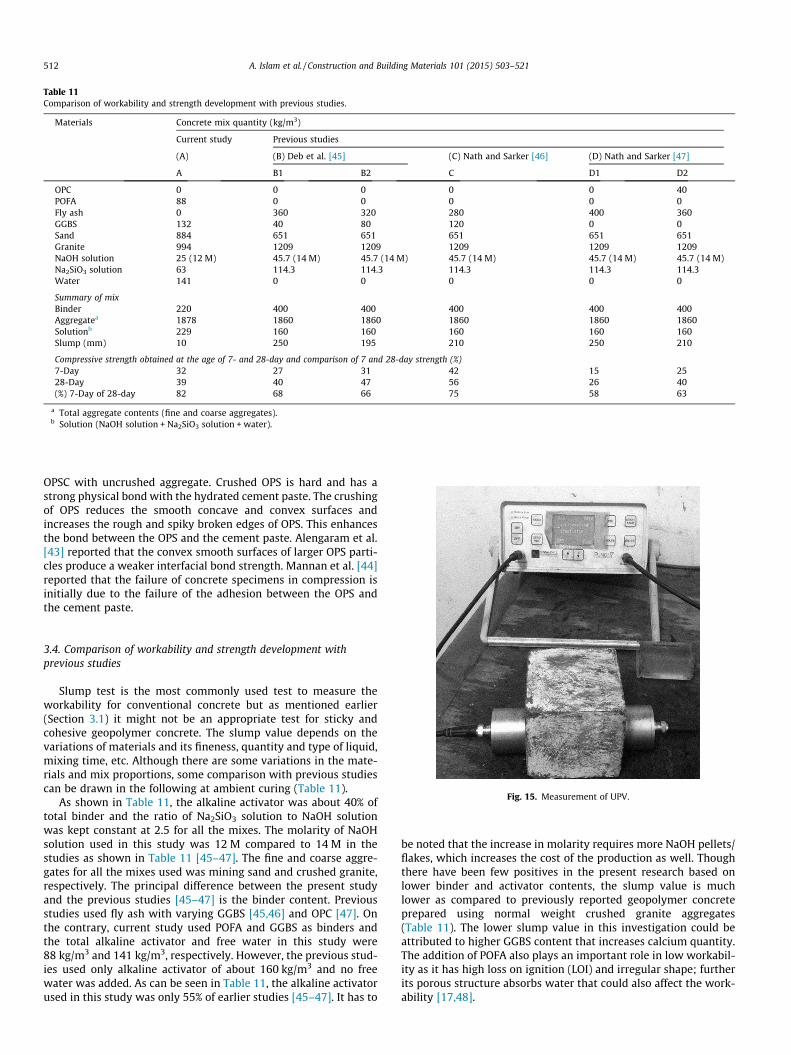
Table 11Comparison of workability and strength development with previous studies.
Materials Concrete mix quantity (kg/m3)
Current study Previous studies
(A) (B) Deb et al. [45] (C) Nath and Sarker [46] (D) Nath and Sarker [47]
A B1 B2 C D1 D2
OPC 0 0 0 0 0 40POFA 88 0 0 0 0 0Fly ash 0 360 320 280 400 360GGBS 132 40 80 120 0 0Sand 884 651 651 651 651 651Granite 994 1209 1209 1209 1209 1209NaOH solution 25 (12 M) 45.7 (14 M) 45.7 (14 M) 45.7 (14 M) 45.7 (14 M) 45.7 (14 M)Na2SiO3 solution 63 114.3 114.3 114.3 114.3 114.3Water 141 0 0 0 0 0
Summary of mixBinder 220 400 400 400 400 400Aggregatea 1878 1860 1860 1860 1860 1860Solutionb 229 160 160 160 160 160Slump (mm) 10 250 195 210 250 210
Compressive strength obtained at the age of 7- and 28-day and comparison of 7 and 28-day strength (%)7-Day 32 27 31 42 15 2528-Day 39 40 47 56 26 40(%) 7-Day of 28-day 82 68 66 75 58 63
a Total aggregate contents (fine and coarse aggregates).b Solution (NaOH solution + Na2SiO3 solution + water).
512 A. Islam et al. / Construction and Building Materials 101 (2015) 503–521
OPSC with uncrushed aggregate. Crushed OPS is hard and has astrong physical bond with the hydrated cement paste. The crushingof OPS reduces the smooth concave and convex surfaces andincreases the rough and spiky broken edges of OPS. This enhancesthe bond between the OPS and the cement paste. Alengaram et al.[43] reported that the convex smooth surfaces of larger OPS parti-cles produce a weaker interfacial bond strength. Mannan et al. [44]reported that the failure of concrete specimens in compression isinitially due to the failure of the adhesion between the OPS andthe cement paste.
Fig. 15. Measurement of UPV.
3.4. Comparison of workability and strength development withprevious studies
Slump test is the most commonly used test to measure theworkability for conventional concrete but as mentioned earlier(Section 3.1) it might not be an appropriate test for sticky andcohesive geopolymer concrete. The slump value depends on thevariations of materials and its fineness, quantity and type of liquid,mixing time, etc. Although there are some variations in the mate-rials and mix proportions, some comparison with previous studiescan be drawn in the following at ambient curing (Table 11).
As shown in Table 11, the alkaline activator was about 40% oftotal binder and the ratio of Na2SiO3 solution to NaOH solutionwas kept constant at 2.5 for all the mixes. The molarity of NaOHsolution used in this study was 12 M compared to 14 M in thestudies as shown in Table 11 [45–47]. The fine and coarse aggre-gates for all the mixes used was mining sand and crushed granite,respectively. The principal difference between the present studyand the previous studies [45–47] is the binder content. Previousstudies used fly ash with varying GGBS [45,46] and OPC [47]. Onthe contrary, current study used POFA and GGBS as binders andthe total alkaline activator and free water in this study were88 kg/m3 and 141 kg/m3, respectively. However, the previous stud-ies used only alkaline activator of about 160 kg/m3 and no freewater was added. As can be seen in Table 11, the alkaline activatorused in this study was only 55% of earlier studies [45–47]. It has to
be noted that the increase in molarity requires more NaOH pellets/flakes, which increases the cost of the production as well. Thoughthere have been few positives in the present research based onlower binder and activator contents, the slump value is muchlower as compared to previously reported geopolymer concreteprepared using normal weight crushed granite aggregates(Table 11). The lower slump value in this investigation could beattributed to higher GGBS content that increases calcium quantity.The addition of POFA also plays an important role in low workabil-ity as it has high loss on ignition (LOI) and irregular shape; furtherits porous structure absorbs water that could also affect the work-ability [17,48].
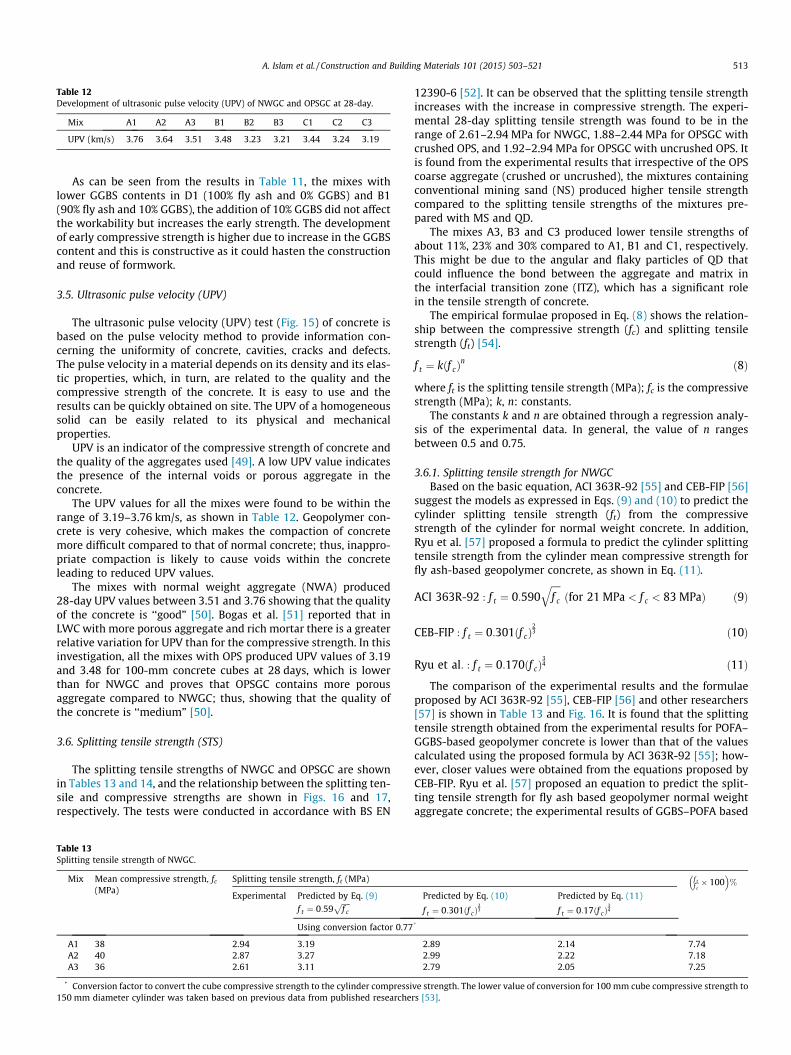
Table 12Development of ultrasonic pulse velocity (UPV) of NWGC and OPSGC at 28-day.
Mix A1 A2 A3 B1 B2 B3 C1 C2 C3
UPV (km/s) 3.76 3.64 3.51 3.48 3.23 3.21 3.44 3.24 3.19
A. Islam et al. / Construction and Building Materials 101 (2015) 503–521 513
As can be seen from the results in Table 11, the mixes withlower GGBS contents in D1 (100% fly ash and 0% GGBS) and B1(90% fly ash and 10% GGBS), the addition of 10% GGBS did not affectthe workability but increases the early strength. The developmentof early compressive strength is higher due to increase in the GGBScontent and this is constructive as it could hasten the constructionand reuse of formwork.
3.5. Ultrasonic pulse velocity (UPV)
The ultrasonic pulse velocity (UPV) test (Fig. 15) of concrete isbased on the pulse velocity method to provide information con-cerning the uniformity of concrete, cavities, cracks and defects.The pulse velocity in a material depends on its density and its elas-tic properties, which, in turn, are related to the quality and thecompressive strength of the concrete. It is easy to use and theresults can be quickly obtained on site. The UPV of a homogeneoussolid can be easily related to its physical and mechanicalproperties.
UPV is an indicator of the compressive strength of concrete andthe quality of the aggregates used [49]. A low UPV value indicatesthe presence of the internal voids or porous aggregate in theconcrete.
The UPV values for all the mixes were found to be within therange of 3.19–3.76 km/s, as shown in Table 12. Geopolymer con-crete is very cohesive, which makes the compaction of concretemore difficult compared to that of normal concrete; thus, inappro-priate compaction is likely to cause voids within the concreteleading to reduced UPV values.
The mixes with normal weight aggregate (NWA) produced28-day UPV values between 3.51 and 3.76 showing that the qualityof the concrete is ‘‘good” [50]. Bogas et al. [51] reported that inLWC with more porous aggregate and rich mortar there is a greaterrelative variation for UPV than for the compressive strength. In thisinvestigation, all the mixes with OPS produced UPV values of 3.19and 3.48 for 100-mm concrete cubes at 28 days, which is lowerthan for NWGC and proves that OPSGC contains more porousaggregate compared to NWGC; thus, showing that the quality ofthe concrete is ‘‘medium” [50].
3.6. Splitting tensile strength (STS)
The splitting tensile strengths of NWGC and OPSGC are shownin Tables 13 and 14, and the relationship between the splitting ten-sile and compressive strengths are shown in Figs. 16 and 17,respectively. The tests were conducted in accordance with BS EN
Table 13Splitting tensile strength of NWGC.
Mix Mean compressive strength, fc(MPa)
Splitting tensile strength, ft (MPa)
Experimental Predicted by Eq. (9)
f t ¼ 0:59ffiffiffiffiffif c
p
Using conversion factor 0.77
A1 38 2.94 3.19A2 40 2.87 3.27A3 36 2.61 3.11
* Conversion factor to convert the cube compressive strength to the cylinder compressi150 mm diameter cylinder was taken based on previous data from published researche
12390-6 [52]. It can be observed that the splitting tensile strengthincreases with the increase in compressive strength. The experi-mental 28-day splitting tensile strength was found to be in therange of 2.61–2.94 MPa for NWGC, 1.88–2.44 MPa for OPSGC withcrushed OPS, and 1.92–2.94 MPa for OPSGC with uncrushed OPS. Itis found from the experimental results that irrespective of the OPScoarse aggregate (crushed or uncrushed), the mixtures containingconventional mining sand (NS) produced higher tensile strengthcompared to the splitting tensile strengths of the mixtures pre-pared with MS and QD.
The mixes A3, B3 and C3 produced lower tensile strengths ofabout 11%, 23% and 30% compared to A1, B1 and C1, respectively.This might be due to the angular and flaky particles of QD thatcould influence the bond between the aggregate and matrix inthe interfacial transition zone (ITZ), which has a significant rolein the tensile strength of concrete.
The empirical formulae proposed in Eq. (8) shows the relation-ship between the compressive strength (fc) and splitting tensilestrength (ft) [54].
f t ¼ k f cð Þn ð8Þwhere ft is the splitting tensile strength (MPa); fc is the compressivestrength (MPa); k, n: constants.
The constants k and n are obtained through a regression analy-sis of the experimental data. In general, the value of n rangesbetween 0.5 and 0.75.
3.6.1. Splitting tensile strength for NWGCBased on the basic equation, ACI 363R-92 [55] and CEB-FIP [56]
suggest the models as expressed in Eqs. (9) and (10) to predict thecylinder splitting tensile strength (ft) from the compressivestrength of the cylinder for normal weight concrete. In addition,Ryu et al. [57] proposed a formula to predict the cylinder splittingtensile strength from the cylinder mean compressive strength forfly ash-based geopolymer concrete, as shown in Eq. (11).
ACI 363R-92 : f t ¼ 0:590ffiffiffiffif c
qðfor 21 MPa < f c < 83 MPaÞ ð9Þ
CEB-FIP : f t ¼ 0:301 f cð Þ23 ð10Þ
Ryu et al: : f t ¼ 0:170 f cð Þ34 ð11ÞThe comparison of the experimental results and the formulae
proposed by ACI 363R-92 [55], CEB-FIP [56] and other researchers[57] is shown in Table 13 and Fig. 16. It is found that the splittingtensile strength obtained from the experimental results for POFA–GGBS-based geopolymer concrete is lower than that of the valuescalculated using the proposed formula by ACI 363R-92 [55]; how-ever, closer values were obtained from the equations proposed byCEB-FIP. Ryu et al. [57] proposed an equation to predict the split-ting tensile strength for fly ash based geopolymer normal weightaggregate concrete; the experimental results of GGBS–POFA based
f tf c� 100
� �%
Predicted by Eq. (10)
f t ¼ 0:301 f cð Þ23Predicted by Eq. (11)
f t ¼ 0:17 f cð Þ34*
2.89 2.14 7.742.99 2.22 7.182.79 2.05 7.25
ve strength. The lower value of conversion for 100 mm cube compressive strength tors [53].
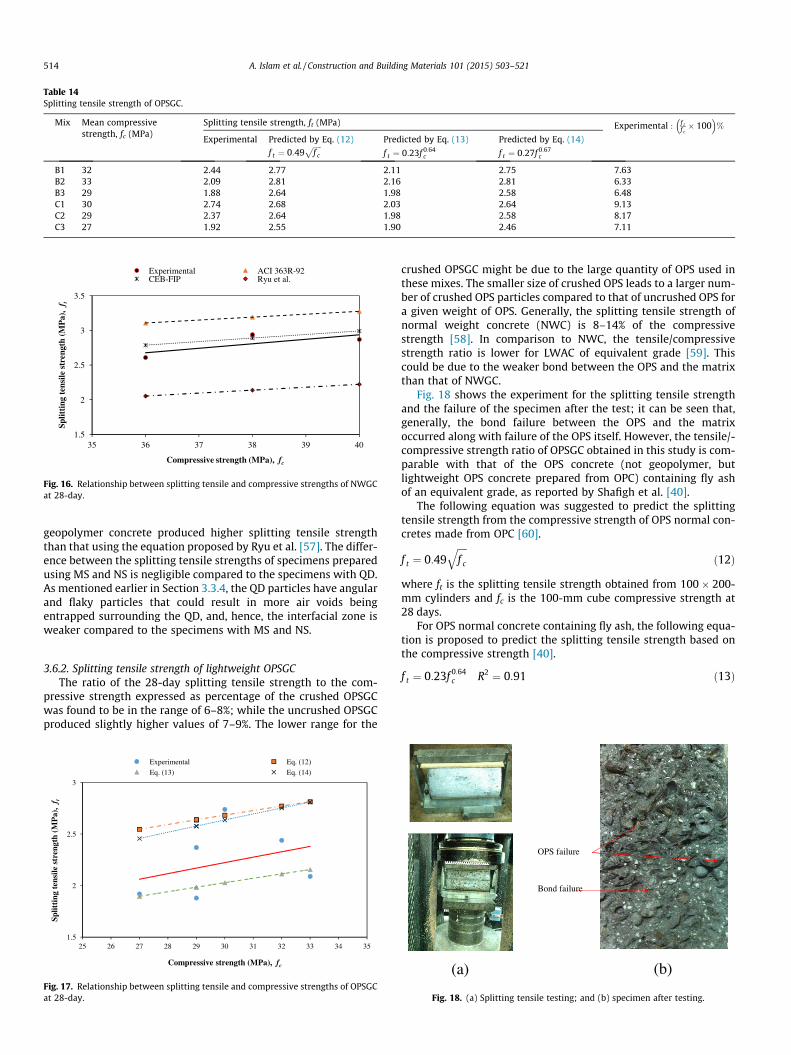
Table 14Splitting tensile strength of OPSGC.
Mix Mean compressivestrength, fc (MPa)
Splitting tensile strength, ft (MPa) Experimental : f tf c� 100
� �%
Experimental Predicted by Eq. (12)
f t ¼ 0:49ffiffiffiffiffif c
p Predicted by Eq. (13)
f t ¼ 0:23f 0:64c
Predicted by Eq. (14)
f t ¼ 0:27f 0:67c
B1 32 2.44 2.77 2.11 2.75 7.63B2 33 2.09 2.81 2.16 2.81 6.33B3 29 1.88 2.64 1.98 2.58 6.48C1 30 2.74 2.68 2.03 2.64 9.13C2 29 2.37 2.64 1.98 2.58 8.17C3 27 1.92 2.55 1.90 2.46 7.11
1.5
2
2.5
3
3.5
35 36 37 38 39 40
Split
ting
ten
sile
str
engt
h (M
Pa)
, f t
Compressive strength (MPa), fc
Experimental ACI 363R-92CEB-FIP Ryu et al.
Fig. 16. Relationship between splitting tensile and compressive strengths of NWGCat 28-day.
514 A. Islam et al. / Construction and Building Materials 101 (2015) 503–521
geopolymer concrete produced higher splitting tensile strengththan that using the equation proposed by Ryu et al. [57]. The differ-ence between the splitting tensile strengths of specimens preparedusing MS and NS is negligible compared to the specimens with QD.As mentioned earlier in Section 3.3.4, the QD particles have angularand flaky particles that could result in more air voids beingentrapped surrounding the QD, and, hence, the interfacial zone isweaker compared to the specimens with MS and NS.
3.6.2. Splitting tensile strength of lightweight OPSGCThe ratio of the 28-day splitting tensile strength to the com-
pressive strength expressed as percentage of the crushed OPSGCwas found to be in the range of 6–8%; while the uncrushed OPSGCproduced slightly higher values of 7–9%. The lower range for the
1.5
2
2.5
3
25 26 27 28 29 30 31 32 33 34 35
Split
ting
ten
sile
str
engt
h (M
Pa)
, f t
Compressive strength (MPa), fc
Experimental Eq. (12)
Eq. (13) Eq. (14)
Fig. 17. Relationship between splitting tensile and compressive strengths of OPSGCat 28-day.
crushed OPSGC might be due to the large quantity of OPS used inthese mixes. The smaller size of crushed OPS leads to a larger num-ber of crushed OPS particles compared to that of uncrushed OPS fora given weight of OPS. Generally, the splitting tensile strength ofnormal weight concrete (NWC) is 8–14% of the compressivestrength [58]. In comparison to NWC, the tensile/compressivestrength ratio is lower for LWAC of equivalent grade [59]. Thiscould be due to the weaker bond between the OPS and the matrixthan that of NWGC.
Fig. 18 shows the experiment for the splitting tensile strengthand the failure of the specimen after the test; it can be seen that,generally, the bond failure between the OPS and the matrixoccurred along with failure of the OPS itself. However, the tensile/-compressive strength ratio of OPSGC obtained in this study is com-parable with that of the OPS concrete (not geopolymer, butlightweight OPS concrete prepared from OPC) containing fly ashof an equivalent grade, as reported by Shafigh et al. [40].
The following equation was suggested to predict the splittingtensile strength from the compressive strength of OPS normal con-cretes made from OPC [60].
f t ¼ 0:49ffiffiffiffif c
qð12Þ
where ft is the splitting tensile strength obtained from 100 � 200-mm cylinders and fc is the 100-mm cube compressive strength at28 days.
For OPS normal concrete containing fly ash, the following equa-tion is proposed to predict the splitting tensile strength based onthe compressive strength [40].
f t ¼ 0:23f 0:64c R2 ¼ 0:91 ð13Þ
(a) (b)
OPS failure
Bond failure
Fig. 18. (a) Splitting tensile testing; and (b) specimen after testing.

Table 15Comparison of compressive strength, splitting tensile strength, flexural strength and elastic modulus.
Mix Mean compressive strength, fc(MPa)
Splitting tensile strength, ft(MPa)
Flexural strength, fr(MPa)
Elastic modulus, E(GPa)
f tf c� 100
� �% f r
f c� 100
� �% f r
f t
� �
A1 38 2.94 3.62 16.86 7.74 9.53 1.231A2 40 2.87 3.83 14.80 7.18 9.58 1.334A3 36 2.61 3.20 13.74 7.25 8.89 1.226B1 32 2.44 3.00 11.12 7.63 9.38 1.229B2 33 2.09 3.03 8.93 6.33 9.18 1.450B3 29 1.88 2.79 8.51 6.48 9.62 1.485C1 30 2.74 3.10 10.08 9.13 10.33 1.131C2 29 2.37 3.19 8.05 8.17 11.00 1.346C3 27 1.92 2.94 7.36 7.11 10.89 1.532
(a)
(b)
OPS failure
Bond failure
Bond failure
Fig. 19. (a) Flexural strength testing; and (b) specimen after testing.
A. Islam et al. / Construction and Building Materials 101 (2015) 503–521 515
Gesoglu et al. [61] suggested the following equation for structurallightweight aggregate normal concrete made of an artificial light-weight aggregate, namely, cold-bonded fly ash, to predict the split-ting tensile strength from the compressive strength (compressivestrength in the range of 21–47 MPa):
f t ¼ 0:27f 0:67c ð14ÞTable 14 and Fig. 17 show the comparison among the experimentalresults with the formulae proposed by other researchers
Table 16Flexural strength of OPSGC.
MixNo.
Mean compressivestrength, fc (MPa)
Flexural strength, fr (MPa)
Experimental Predicted by Eq. (15)
f r ¼ 0:30ffiffiffiffiffif 2c
3q Predicted
f r ¼ 0:69p
B1 32 3.00 3.02 3.90B2 33 3.03 3.08 3.96B3 29 2.79 2.83 3.72C1 30 3.10 2.89 3.78C2 29 3.19 2.83 3.72C3 27 2.94 2.70 3.59
(Eqs. (12)–(14)). The results show that the splitting tensile strengthproduced by the POFA–GGBS-based OPSGC based on the compres-sive strength is lower than that provided by the formulae in Eqs.(12) and (14) and is comparable with the formulae in Eq. (13). Itshould be noted that the specimens prepared in this investigationhas two variables, namely, the crushed and uncrushed OPS andthree different types of sand (NS, MS and QD). The equations pro-posed by researchers are for the lightweight concrete prepared withOPC, conventional sand, OPS and cold bonded lightweight fly ashaggregate.
It is worth noting that, according to ASTM: C330, a minimumsplitting tensile strength of 2.0 MPa is a requirement for structuralgrade lightweight aggregate concrete. It can be seen that accordingto this criteria, all mixes, except B3 and C3, fulfilled the criterionfor minimum splitting tensile strength.
3.7. Flexural strength
The flexural strength of NWGC and OPSGC and the comparisonwith the compressive strength are shown in Table 15. The flexuraltest was conducted in accordance with BS EN 12390-5 [62]. Gener-ally, for conventional concrete having a compressive strength ofmore than 25 MPa, the ratio of flexural strength to compressivestrength, expressed as a percentage, is in the range of 8–11%[63]. As can be seen in Table 15, this ratio was found to be withinthis range for all the mixes.
In this investigation, the flexural/splitting tensile strength ratiosfor the A1, A2 and A3 mixes were found to be 1.23, 1.33 and 1.23,respectively; while for the B1, B2, B3, C1, C2 and C3 mixes, theratios were 1.23, 1.45, 1.48, 1.13, 1.35 and 1.53, respectively.
Alengaram et al. [64] reported that the ratio f rf t
� �for OPC based
OPS concrete was between 1.4 and 1.7. In general, as reported byZheng et al. [65], the flexural strength of concrete is 35% higherthan the splitting tensile strength.
The mixes A1, B1 and C1 using conventional mining sand showflexural strengths of 3.62, 3.00 and 3.10 MPa, respectively. In con-trast, the flexural strengths of the mixes using MS (A2, B2, C2)and QD (A3, B3, C3) were 3.83, 3.03, 3.19 and 3.20, 2.79, 2.94,
Experimental :f rf c� 100
� �%by Eq. (16)ffiffiffiffiffi
f c
Predicted by Eq. (17)
f r ¼ 0:58ffiffiffiffiffif c
p Predicted by Eq. (18)f r ¼ 0:09f c
3.28 2.88 9.383.33 2.97 9.183.12 2.61 9.623.18 2.7 10.333.12 2.61 11.003.01 2.43 10.89

2.25
2.50
2.75
3.00
3.25
3.50
3.75
4.00
25 27 29 31 33 35
Fle
xura
l str
engt
h (M
Pa)
, f r
Compressive strength (MPa), fc
Experimental
Alengaram et al.
Lo et al.
Smadi & Migdady
Shafigh et al.
Fig. 20. Relationship between flexural strength and compressive strengths of OPSGC.
NWGC:y = 0.7889x
OPSGC:y = 0.7463x
1.5
1.7
1.9
2.1
2.3
2.5
2.7
2.9
3.1
2.5 2.7 2.9 3.1 3.3 3.5 3.7 3.9
Split
ting
tens
ile s
tren
gth
(MP
a), ft
Flexural strength (MPa), fr
NWGC OPSGC
Fig. 21. Relationship between splitting tensile and flexural strengths.
516 A. Islam et al. / Construction and Building Materials 101 (2015) 503–521
respectively. The results show that the mixes A2, B2 and C2 are 6%,1% and 3%, respectively, higher than the corresponding mixes usingconventional mining sand. In contrast, the corresponding mixesusing QD show 12%, 7% and 5% lower flexural strength comparedto the correspondingmixes using conventionalmining sand. Hence,it can be concluded that the use of MS could be considered as anideal replacement for conventional mining sand. Fig. 19 shows thatbond failure occurred between the OPS and themortar, which couldbe due to the smooth surface of the OPS. In addition, as explained inSection 3.6.2, OPS failure along the failure plane is visible, which isdue to theweaker stiffness of OPS. The weaker bond and OPS failureresult in lower value for the flexural strength of OPSGC compared toNWGC.
Previous researchers have proposed the following relationshipsto predict the flexural strength from the compressive strength ofOPS concrete.
Table 17Elastic moduli and Poisson’s ratios of concrete at 28-days.
MixNo.
Mean compressivestrength, fc (MPa)
q28-d
(kg/m3)Poisson’sratio
Elasticmodulus, E(GPa)
PredicteEc,28 = 20
A1 38 2341 0.19 16.86 27.60A2 40 2285 0.27 14.80 28.00A3 36 2320 0.20 13.74 27.20B1 32 1970 0.15 11.12 NAB2 33 1949 0.16 8.93 NAB3 29 1957 0.16 8.51 NAC1 30 1948 0.16 10.08 NAC2 29 1934 0.17 8.05 NAC3 27 1940 0.17 7.36 NA
Note: NA – not applicable.
Alengaram et al. [64] have reported OPS concrete with compres-sive strength ranging from 15 to 37 MPa and the relationship withthe flexural strength can be expressed as follows:
f r ¼ 0:30ffiffiffiffiffif 2c
3q
ð15ÞMeanwhile, Lo et al. [66] have reported expanded clay light-
weight aggregate concrete with cube compressive strength rangingfrom 29 to 43 MPa and the relationship with the flexural strengthcan be expressed as follows:
f r ¼ 0:69ffiffiffiffif c
qð16Þ
Smadi and Migdady [67] reported high strength lightweightconcrete with compressive strength of 60 MPa, which was pre-pared with Tuff lightweight aggregate and the relationship withthe flexural strength can be expressed as follows:
f r ¼ 0:58ffiffiffiffif c
qð17Þ
Shafigh et al. [40] investigated OPS concrete with compressivestrength ranging from 30 to 44 MPa, with 0–50% fly ash replace-ment with cement and the above relationship expressed asfollows:
f r ¼ 0:09f c ð18ÞTable 16 and Fig. 20 show the comparison of flexural strengths
for the experimental results with the formulae proposed by otherresearchers [40,64–67]. The results show that the flexural strengthproduced by the POFA–GGBS-based OPSGC, based on the compres-sive strength is lower than that provided by the formulae Eq. (16)[66] and comparable with the formulae Eqs. (15) and (17) andslightly higher than the Eq. (18). The higher difference betweenthe formulae in Eq. (16) and the experimental results could be
d by Eq. (19)+ 0.2 f0c,28
Predicted by Eq. (20)Ec,28 = q2pfc � 10�6
Predicted by Eq. (21)
Ec ¼ q2400
� �2 � f cð Þ1=3 � 5:0
NA NANA NANA NA21.95 10.7021.82 10.5820.62 10.2120.78 10.2420.14 9.9819.56 9.80
y = 0.0095x2.0195
R² = 0.8639
5
10
15
20
25 30 35 40
Mod
ulus
of
Ela
stic
ity
(MO
E),
GP
a
Compressive strength of 100-mm cube (MPa), fc
Fig. 22. The relationship of MOE and compressive strength at 28-day.
A. Islam et al. / Construction and Building Materials 101 (2015) 503–521 517
attributed to the formula proposed for high strength concrete (Eq.(16)) (cube compressive strength ranging from 29 to 43 MPa). Inaddition, the aggregate used in this study was crushed anduncrushed OPS and three different types of sand (NS, MS andQD), as discussed earlier in Section 3.6, while the equationsproposed by the researchers [66] are for the lightweight concreteprepared with OPC, conventional sand, and expanded claylightweight aggregate.
3.8. Relationship of splitting tensile strength to flexural strength
In the splitting tensile strength test the failure can be initiatedanywhere in the portion of the diametric plane that is in tension;however, in the flexural strength tests, failure is controlled bythe strength of the concrete at the tension surface of the beam.Hence, based on the size effect principle, it is expected that thesplitting tensile strengths would be lower than the flexuralstrength. In this study (Fig. 21) for POFA–GGBS based lightweightOPSGC and NWGC, it was found that the splitting tensile strengthis about 75% and 79% of the flexural strength, respectively, for acentre-point loading. It is specified in ASTM STP 169D that thisvalue for conventional concrete is about 65%. Alengaram et al.[64] found that the splitting tensile strength of OPS based cementconcrete is about 60–70% of its flexural strength.
0
5
10
15
20
25
30
0 0.002 0.004 0.006
Stre
ss (
MP
a)
Strain
Fig. 23. Stress–s
3.9. Modulus of elasticity (E-value)
The modulus of elasticity (MOE) or E-value of concrete is one ofthe most important parameters for structural concrete as it isrequired when assessing deflections and cracking of a structure.Table 17 shows the experimental and predicted static moduli ofelasticity (E) for all mixes. The Young’s modulus test was con-ducted in accordance with ASTM: C469/C469M-10.
The moduli of LWA particles are generally lower than NWA andalthoughmost LWA concretes contain higher cement content it fol-lows that the overall moduli of lightweight aggregate concreteswill be lower than that of normal weight concretes [2]. Generally,for LWAC with natural and artificial LWA, the value of the staticMOE ranges between 10 and 24 kN/mm2 [68].
The experimental E-values for the OPSGC and NWGC vary in therange of 7.4–11.12 GPa and 13.74–16.86 GPa, respectively(Table 17), and the MOE increases as the compressive strengthincreases (Fig. 22). The E-values of OPSGC are lower than the valuesobtained for NWGC; as stated, NWA has higher stiffness and estab-lishes a stronger bond between the aggregate surface and thematrix compared to the OPS. The E-values of OPSGC depend onthe stiffness of the aggregate, the hardened cement matrix, thebond between the OPS and the cement matrix and the quantityof OPS. A higher LWA content lowers the modulus value, becausethe concrete stiffness decreases [8,68]. Alengaram et al. [34]opined that the use of higher OPS content in mixes reduces theE-values. They reported values ranging between 5.5 and 7.1 kN/mm2. The E-values reported in this investigation were higher thanthe values reported by Alengaram et al. [34] for OPSC, which couldbe attributed to reasons such as water to binder (w/b) ratio, sand tobinder (s/b) ratio and the quantity of OPS in the OPSGC.
3.9.1. Effect of aggregates on E-value of geopolymer concreteIt can be seen in Table 17 that the E-values obtained using con-
ventional mining sand are 16.86, 11.2 and 10.08 GPa for mixes A1,B1 and C1, respectively. In comparison, the E-values obtained usingMS to the corresponding mixes are 14.80, 8.93 and 8.05, which are12%, 19% and 20% lower than the values obtained for mixes withNS. One possible explanation for this difference could be due tothe low stiffness of OPS and the bond between the aggregate and
0.008 0.01
NWGC-NS
NWGC -MS
NWGC -QD
OPSGC-NS-C
OPSGC-MS-C
OPSGC-QD-C
OPSGC-NS-UC
OPSGC-MS-UC
OPSGC-QD-UC
train curve.
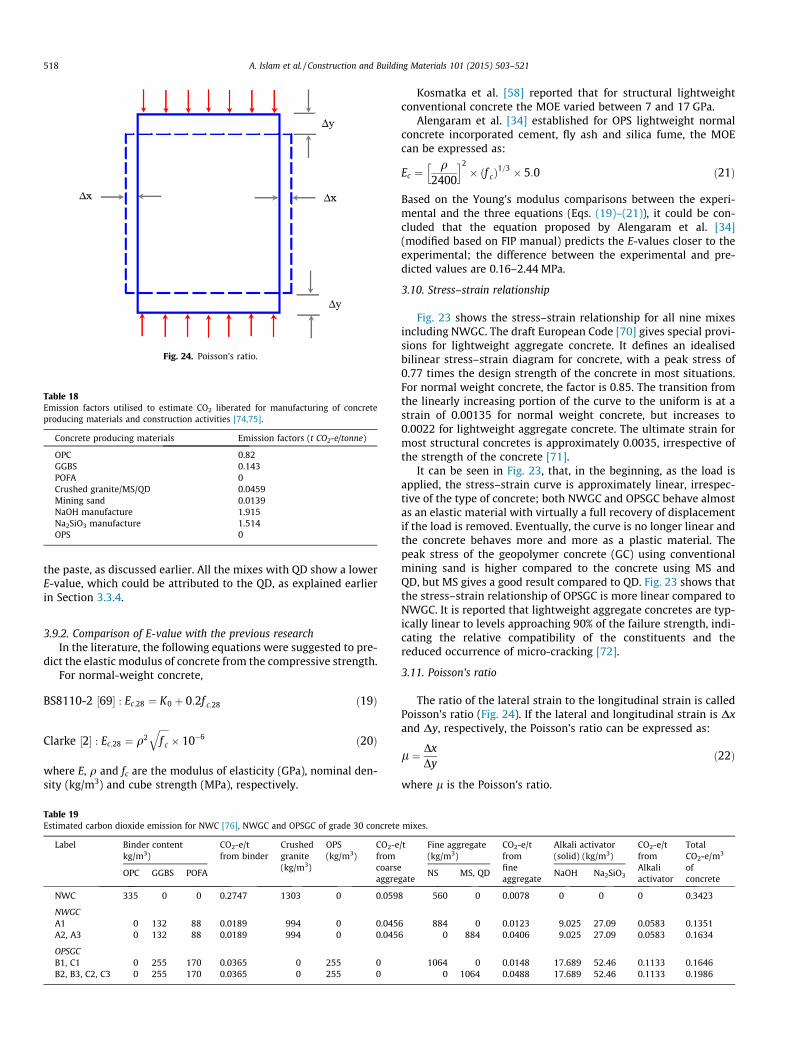
Fig. 24. Poisson’s ratio.
Table 18Emission factors utilised to estimate CO2 liberated for manufacturing of concreteproducing materials and construction activities [74,75].
Concrete producing materials Emission factors (t CO2-e/tonne)
OPC 0.82GGBS 0.143POFA 0Crushed granite/MS/QD 0.0459Mining sand 0.0139NaOH manufacture 1.915Na2SiO3 manufacture 1.514OPS 0
518 A. Islam et al. / Construction and Building Materials 101 (2015) 503–521
the paste, as discussed earlier. All the mixes with QD show a lowerE-value, which could be attributed to the QD, as explained earlierin Section 3.3.4.
3.9.2. Comparison of E-value with the previous researchIn the literature, the following equations were suggested to pre-
dict the elastic modulus of concrete from the compressive strength.For normal-weight concrete,
BS8110-2 ½69� : Ec;28 ¼ K0 þ 0:2f c;28 ð19Þ
Clarke ½2� : Ec;28 ¼ q2ffiffiffiffif c
q� 10�6 ð20Þ
where E, q and fc are the modulus of elasticity (GPa), nominal den-sity (kg/m3) and cube strength (MPa), respectively.
Table 19Estimated carbon dioxide emission for NWC [76], NWGC and OPSGC of grade 30 concrete
Label Binder contentkg/m3)
CO2-e/tfrom binder
Crushedgranite(kg/m3)
OPS(kg/m3)
CO2-efromcoarseaggre
OPC GGBS POFA
NWC 335 0 0 0.2747 1303 0 0.059
NWGCA1 0 132 88 0.0189 994 0 0.045A2, A3 0 132 88 0.0189 994 0 0.045
OPSGCB1, C1 0 255 170 0.0365 0 255 0B2, B3, C2, C3 0 255 170 0.0365 0 255 0
Kosmatka et al. [58] reported that for structural lightweightconventional concrete the MOE varied between 7 and 17 GPa.
Alengaram et al. [34] established for OPS lightweight normalconcrete incorporated cement, fly ash and silica fume, the MOEcan be expressed as:
Ec ¼ q2400
h i2� f cð Þ1=3 � 5:0 ð21Þ
Based on the Young’s modulus comparisons between the experi-mental and the three equations (Eqs. (19)–(21)), it could be con-cluded that the equation proposed by Alengaram et al. [34](modified based on FIP manual) predicts the E-values closer to theexperimental; the difference between the experimental and pre-dicted values are 0.16–2.44 MPa.
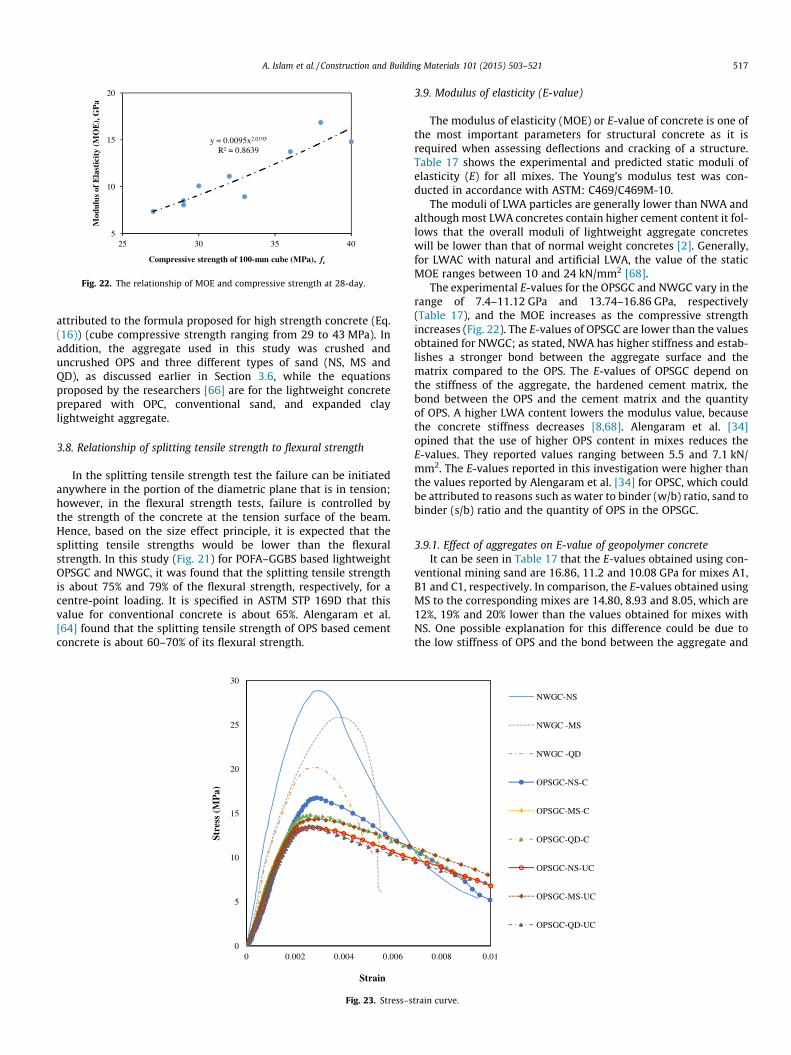
3.10. Stress–strain relationship
Fig. 23 shows the stress–strain relationship for all nine mixesincluding NWGC. The draft European Code [70] gives special provi-sions for lightweight aggregate concrete. It defines an idealisedbilinear stress–strain diagram for concrete, with a peak stress of0.77 times the design strength of the concrete in most situations.For normal weight concrete, the factor is 0.85. The transition fromthe linearly increasing portion of the curve to the uniform is at astrain of 0.00135 for normal weight concrete, but increases to0.0022 for lightweight aggregate concrete. The ultimate strain formost structural concretes is approximately 0.0035, irrespective ofthe strength of the concrete [71].
It can be seen in Fig. 23, that, in the beginning, as the load isapplied, the stress–strain curve is approximately linear, irrespec-tive of the type of concrete; both NWGC and OPSGC behave almostas an elastic material with virtually a full recovery of displacementif the load is removed. Eventually, the curve is no longer linear andthe concrete behaves more and more as a plastic material. Thepeak stress of the geopolymer concrete (GC) using conventionalmining sand is higher compared to the concrete using MS andQD, but MS gives a good result compared to QD. Fig. 23 shows thatthe stress–strain relationship of OPSGC is more linear compared toNWGC. It is reported that lightweight aggregate concretes are typ-ically linear to levels approaching 90% of the failure strength, indi-cating the relative compatibility of the constituents and thereduced occurrence of micro-cracking [72].
3.11. Poisson’s ratio
The ratio of the lateral strain to the longitudinal strain is calledPoisson’s ratio (Fig. 24). If the lateral and longitudinal strain is Dxand Dy, respectively, the Poisson’s ratio can be expressed as:
l ¼ DxDy
ð22Þ
where l is the Poisson’s ratio.
mixes.
/t
gate
Fine aggregate(kg/m3)
CO2-e/tfromfineaggregate
Alkali activator(solid) (kg/m3)
CO2-e/tfromAlkaliactivator
TotalCO2-e/m3
ofconcrete
NS MS, QD NaOH Na2SiO3
8 560 0 0.0078 0 0 0 0.3423
6 884 0 0.0123 9.025 27.09 0.0583 0.13516 0 884 0.0406 9.025 27.09 0.0583 0.1634
1064 0 0.0148 17.689 52.46 0.1133 0.16460 1064 0.0488 17.689 52.46 0.1133 0.1986
A. Islam et al. / Construction and Building Materials 101 (2015) 503–521 519
The values of Poisson’s ratio for OPSGC (mixes B1, B2, B3, C1, C2and C3) were found to be within the range of 0.15–0.17, while inthe case of NWGC (mixes A1, A2 and A3), the ratio shows slightlyhigher values of 0.19–0.27, as shown in Table 17. The mixes withuncrushed OPS coarse aggregate show a slight increment in thePoisson’s ratio (5.9–6.3%) compared to the mixes using crushedOPS (0.15–0.16), which could be attributed to the higher strainsin the uncrushed OPS. The OPSGC with conventional mining sandshows Poisson’s ratio values of 0.15 and 0.16 for the mixes B1and C1, respectively, while the corresponding mixes using MSand QD show only 0.16–0.17 in both cases.
There is no published literature available on the Poisson’s ratioof OPS based geopolymer concrete. Depending on the properties ofaggregate used, the Poisson’s ratio of concrete lies generally in therange of 0.15–0.22 [28]. Neville [28] reported that for lightweightaggregate conventional concrete the Poisson’s ratio could be oflower value compared to NWA concrete.
The Poisson’s ratio effect has a considerable influence in con-struction. Due to the Poisson’s ratio effect the concrete may later-ally expand and shorten its length. If a single slab concretehighway is cast without any expansion joint, it may show crackingwithin a short time due the effect of the Poisson’s ratio. The impactstrength in compression is improved by the use of aggregate with alow Poisson’s ratio [28]. A higher Poisson’s ratio could lead to split-ting. In each material, the vertical compression results in a lateralexpansion due to the Poisson’s ratio effect.
3.12. Carbon footprint
A carbon footprint is historically defined as ‘‘the total sets ofgreenhouse gas emissions caused by an organisation, event, pro-duct or person”. The total carbon footprint cannot be calculatedbecause of the large amount of data required and the fact thatcarbon dioxide can be produced by natural occurrences. Thecalculation on the amount of CO2 emission (CO2-e) for a partic-ular component of concrete was based on 1 m3 of concrete. Inthis investigation, the estimation of CO2 emission for the manu-factured sand (MS) and quarry dust (QD) is taken the same asthat of crushed granite aggregate. This could be justified dueto the fact that the MS/QD is the by-product of crushed graniteaggregate and needs electricity for further processing [73]. Asthe POFA and OPS are also an industrial by-product, the CO2
emission was not considered in the calculation of the carbonfoot print for OPSGC.
The CO2-e for manufacturing of concrete producing materials isshown in Table 18, in which the process of decomposition of lime,grinding and heating in kiln, as well as the transportation wereaccounted for [74].
Table 7 shows the utilisation of NaOH (12 M) and Na2SiO3 solu-tions for NWGC is 25 and 63 kg/m3, while for OPSGC is 49 and122 kg/m3, respectively. The quantity of solid form of NaOH andNa2SiO3 in NWGC and OPSGC are as follows:
NaOH (kg/m3)
Na2SiO3 (kg/m3)NWGC:
25 � 0.361 = 9.025 63 � 0.43 = 27.09 OPSGC: 49 � 0.361 = 17.689 122 � 0.43 = 52.46Table 19 shows the estimated CO2-e for NWC, NWGC and OPSGC ofgrade 30 concrete mixtures. It can be seen that CO2-e from NWGC(A1, A2, A3) is 52–61% lower compared to NWC, while OPSGC (B1,C1, B2, C2, B3, C3) is 42–52% lower compared toNWCof similar grade.A significant reduction of CO2 emissionwas observed in the develop-ment of geopolymer concrete. McLellan et al. [77] investigated over
Australian geopolymer concrete and found an estimated 44–64%reduction in greenhouse gas emissions over OPC, while the cost ofthese geopolymers can be up to twice as high as OPC.
4. Conclusion
Based on the experimental work reported in this study, the fol-lowing conclusions are drawn:
(a) POFA and GGBS could be used as the source material in thedevelopment of low to moderate structural grade light-weight and normal weight geopolymer concrete. The devel-opment of grade 30 concrete using OPS and crushed graniteaggregate of ambient cured specimens also reduces the needfor oven curing, which is normally employed for geopolymerconcrete.
(b) The oven-dry densities of all the OPSGC specimens werefound to be within the range of 1900–1935 kg/m3 and hencefulfilled the requirement for LWC as stipulated in EN206-1.
(c) Although the usage of 40% POFA in the total binder contentof 425 kg/m3 in the development of 30 grade structurallightweight OPSGC is higher than the total binder contentof 220 kg/m3 used in NWGC of similar grade, its densityreduction of 20% is crucial.
(d) The mixture containing quarry dust produced slightly lowermechanical strength compared to the mixes with conven-tional mining sand and manufactured sand.
(e) The higher mortar demand in the mixes of OPSGC specimensprepared using crushed OPS aggregate resulted in lowerslump values compared to the mixes with uncrushed OPSaggregate.
(f) The OPSGC with crushed OPS aggregate produced a highercompressive strength of about 7–14% and 3–7% cured inOD and AD, respectively, compared to the correspondingmixes with uncrushed OPS aggregate.
(g) Most of the specimens of geopolymer concrete produced90% of the 28-day compressive strength at 3 days for OD cur-ing, while the AD curing specimens reached 57–82%; how-ever, the final strength of the AD curing specimens werefound to be slightly higher than the corresponding OD curedspecimens at 28 days.
(h) The early strength development of 92–100% and 81–97% of28-day compressive strength, respectively, for OD and ADcuring at 7 days for both the OPSGC and NWGC points togeopolymerization at an early age. The rate of increase incompressive strength in the oven-cured specimens after7 days is not significant.
(i) The mixes with MS and conventional mining sand fulfilledthe minimum requirement for splitting tensile of about2 MPa for OPSGC prepared using both crushed anduncrushed OPS. The failure of specimens in splitting andflexural tensile strengths is governed by the failure of thebond between the OPS and the matrix, and the OPS itself.
(j) The splitting tensile and flexural strengths of POFA–GGBSbased geopolymer concrete were found to be in the rangeof about 6–9% and 9–11% of the compressive strength,respectively.
(k) The low stiffness of OPS resulted in reduced E-value ofPOFA–GGBS based OPSGC compared to NWGC. However,the E-values obtained for the OPSGC in the range of 8–11are comparable to the E-values of OPC based lightweightOPS concrete [34]. The usage of a high content of OPS inthe OPSGC resulted in lower values for the Poisson’s ratioof about 0.15–0.17 compared to 0.19–0.27 for NWGC.
520 A. Islam et al. / Construction and Building Materials 101 (2015) 503–521
(l) The usage of 60% of GGBS and 40% of POFA both in NWGCand OPSGC was found to have 52–61% and 42–52% reductionin carbon dioxide emission, respectively compared to NWCof similar strength.
Acknowledgments
The authors gratefully acknowledge University of Malaya’s HighImpact Research Grant (HIRG) under the project number UM.C/HIR/MOHE/ENG/02/D000002-16001: ‘‘Synthesis of Blast ResistantStructures” for financial support towards this research.
References
[1] M.N. Hassoun, A. Al-Manaseer, Structural Concrete: Theory and Design, JohnWiley & Sons, 2012.
[2] J.L. Clarke (Ed.), Structural Lightweight Aggregate Concrete, Taylor & Francis,2005 (e-Library).
[3] EN 206-1, Concrete – Part 1: Specification, Performance, Production andConformity, European Committee for Standardization CEN, 2000.
[4] E. Gartner, Industrially interesting approaches to ‘‘low-CO2” cements, Cem.Concr. Res. 34 (9) (2004) 1489–1498.
[5] C. Meyer, The greening of the concrete industry, Cem. Concr. Compos. 31 (8)(2009) 601–605.
[6] D.N. Huntzinger, T.D. Eatmon, A life-cycle assessment of Portland cementmanufacturing: comparing the traditional process with alternativetechnologies, J. Clean. Prod. 17 (7) (2009) 668–675.
[7] J. Davidovits, Geopolymers: man-made rock geosynthesis and the resultingdevelopment of very early high strength cement, J. Mater. Educ. 16 (1994) 91–139.
[8] A. Short, W. Kinniburgh, Lightweight Concrete, third ed., Applied SciencePublishers, London, 1978.
[9] M.A. Ashraf, M.J. Maah, I. Yusoff, A. Wajid, K. Mahmood, Sand mining effects,causes and concerns: a case study from Bestari Jaya, Selangor, PeninsularMalaysia, Sci. Res. Essays 6 (6) (2011) 1216–1231.
[10] J. Davidovits, Geopolymer Chemistry and Applications, third ed., GeopolymerInstitute, France, 2011.
[11] M.O. Yusuf, M.A. Megat Johari, Z.A. Ahmad, M. Maslehuddin, Strength andmicrostructure of alkali-activated binary blended binder containing palm oilfuel ash and ground blast-furnace slag, Constr. Build. Mater. 52 (2014) 504–510.
[12] N. Lloyd, B.V. Rangan, Geopolymer concrete with fly ash, in: P. Zachar JaC, T.Naik, G. Ganjian (Eds.), Second International Conference on SustainableConstruction Materials and Technologies, UWM Center for By-ProductsUtilization, Ancona, Italy, 2010, pp. 1493–1504.
[13] J. Aldred, J. Day, Is geopolymer concrete a suitable alternative to traditionalconcrete? in: 37th Conference on Our World in Concrete & Structures,Singapore, 2012, pp. 29–31.
[14] M.J.A. Mijarsh, M.A. Megat Johari, Z.A. Ahmad, Synthesis of geopolymer fromlarge amounts of treated palm oil fuel ash: application of the Taguchi methodin investigating the main parameters affecting compressive strength, Constr.Build. Mater. 52 (2014) 473–481.
[15] A. Islam, U.J. Alengaram, M.Z. Jumaat, I.I. Bashar, The development ofcompressive strength of ground granulated blast furnace slag-palm oil fuelash-fly ash based geopolymer mortar, Mater. Des. 56 (2014) 833–841.
[16] M.A.M. Ariffin, M.A.R. Bhutta, M.W. Hussin, M. Mohd Tahir, N. Aziah, Sulfuricacid resistance of blended ash geopolymer concrete, Constr. Build. Mater. 43(2013) 80–86.
[17] S.K. Lim, C.S. Tan, O.Y. Lim, Y.L. Lee, Fresh and hardened properties oflightweight foamed concrete with palm oil fuel ash as filler, Constr. Build.Mater. 46 (2013) 39–47.
[18] M.A.A. Aldahdooh, N. Muhamad Bunnori, M.A. Megat Johari, Development ofgreen ultra-high performance fiber reinforced concrete containing ultrafinepalm oil fuel ash, Constr. Build. Mater. 48 (2013) 379–389.
[19] D. Mujah, M.E. Rahman, N.H.M. Zain, Performance evaluation of the soft soilreinforced ground palm oil fuel ash layer composite, J. Clean. Prod. 95 (2015)89–100.
[20] R.H. Kupaei, U.J. Alengaram, M.Z. Jumaat, H. Nikraz, Mix design for fly ashbased oil palm shell geopolymer lightweight concrete, Constr. Build. Mater. 43(2013) 490–496.
[21] K.H. Mo, U. Johnson Alengaram, M.Z. Jumaat, S.P. Yap, Feasibility study of highvolume slag as cement replacement for sustainable structural lightweight oilpalm shell concrete, J. Clean. Prod. 91 (2015) 297–304.
[22] J. Kanadasan, H.A. Razak, Engineering and sustainability performance of self-compacting palm oil mill incinerated waste concrete, J. Clean. Prod. 89 (2015)78–86.
[23] BS 146, Specification for Portland Blast Furnace Cements, nineth ed., BSI,London, UK, 1996.
[24] K.H. Mo, S.P. Yap, U.J. Alengaram, M.Z. Jumaat, C.H. Bu, Impact resistance ofhybrid fibre-reinforced oil palm shell concrete, Constr. Build. Mater. 50 (2014)499–507.
[25] S.E. Wallah, B.V. Rangan, Low-Calcium Fly Ash-Based Geopolymer Concrete:Long-Term Properties, Faculty of Engineering, Curtin University, Perth,Australia, 2006.
[26] M.O. Yusuf, M.A. Megat Johari, Z.A. Ahmad, M. Maslehuddin, Evolution ofalkaline activated ground blast furnace slag-ultrafine palm oil fuel ash basedconcrete, Mater. Des. 55 (2014) 387–393.
[27] S.N. Raman, T. Ngo, P. Mendis, H.B. Mahmud, High-strength rice husk ashconcrete incorporating quarry dust as a partial substitute for sand, Constr.Build. Mater. 25 (7) (2011) 3123–3130.
[28] A.M. Neville, Properties of Concrete, Longman, London, 1995.[29] H.B. Basri, M.A. Mannan, M.F.M. Zain, Concrete using waste oil palm shells as
aggregate, Cem. Concr. Res. 29 (4) (1999) 619–622.[30] D. Hardjito, B.V. Rangan, Development and Properties of Low-Calcium Fly Ash-
Based Geopolymer Concrete, Curtin University, Perth, Australia, Faculty ofEngineering, 2005.
[31] T. Bakharev, J.G. Sanjayan, Y.-B. Cheng, Alkali activation of Australian slagcements, Cem. Concr. Res. 29 (1) (1999) 113–120.
[32] H.A. Razak, F. Sajedi, The effect of heat treatment on the compressive strengthof cement-slag mortars, Mater. Des. 32 (8–9) (2011) 4618–4628.
[33] S. Puligilla, P. Mondal, Role of slag in microstructural development andhardening of fly ash-slag geopolymer, Cem. Concr. Res. 43 (2013) 70–80.
[34] U.J. Alengaram, H. Mahmud, M.Z. Jumaat, Enhancement and prediction ofmodulus of elasticity of palm kernel shell concrete, Mater. Des. 32 (4) (2011)2143–2148.
[35] BS EN 12390-3, Testing Hardened Concrete. Part 3: Compressive Strength ofTest Specimens, BSI, London, UK, 2009.
[36] BS 1881-116, Testing Concrete – Part 116: Method for Determination ofCompressive Strength of concrete Cubes, BSI, London, 1983.
[37] B.V.V. Reddy, Suitability of manufacture sand (M-sand) as fine aggregate inmortars and concrete, in: Engineering DoC (Ed.), Indian Institute of Science,India, 2012.
[38] T. Lohani, M. Padhi, K. Dash, S. Jena, Optimum utilization of quarry dust aspartial replacement of sand in concrete, Int. J. Appl. Sci. Eng. Res. 1 (2) (2012)391–404.
[39] C.D. Atis�, C. Bilim, Wet and dry cured compressive strength of concretecontaining ground granulated blast-furnace slag, Build. Environ. 42 (8) (2007)3060–3065.
[40] P. Shafigh, U.J. Alengaram, H. Mahmud, M.Z. Jumaat, Engineering properties ofoil palm shell lightweight concrete containing fly ash, Mater. Des. 49 (2013)613–621.
[41] S. Pangdaeng, T. Phoo-ngernkham, V. Sata, P. Chindaprasirt, Influence of curingconditions on properties of high calcium fly ash geopolymer containingPortland cement as additive, Mater. Des. 53 (2014) 269–274.
[42] T. Phoo-ngernkham, P. Chindaprasirt, V. Sata, S. Hanjitsuwan, S. Hatanaka, Theeffect of adding nano-SiO2 and nano-Al2O3 on properties of high calcium flyash geopolymer cured at ambient temperature, Mater. Des. 55 (2014) 58–65.
[43] U.J. Alengaram, H. Mahmud, M.Z. Jumaat, S.M. Shirazi, Effect of aggregate sizeand proportion on strength properties of palm kernel shell concrete, Int. J.Phys. Sci. 5 (12) (2010) 1848–1856 (12).
[44] M.A. Mannan, J. Alexander, C. Ganapathy, D.C.L. Teo, Quality improvement ofoil palm shell (OPS) as coarse aggregate in lightweight concrete, Build.Environ. 41 (9) (2006) 1239–1242.
[45] P.S. Deb, P. Nath, P.K. Sarker, The effects of ground granulated blast-furnaceslag blending with fly ash and activator content on the workability andstrength properties of geopolymer concrete cured at ambient temperature,Mater. Des. 62 (2014) 32–39.
[46] P. Nath, P.K. Sarker, Effect of GGBFS on setting, workability and early strengthproperties of fly ash geopolymer concrete cured in ambient condition, Constr.Build. Mater. 66 (2014) 163–171.
[47] P. Nath, P.K. Sarker, Use of OPC to improve setting and early strengthproperties of low calcium fly ash geopolymer concrete cured at roomtemperature, Cem. Concr. Compos. 55 (2015) 205–214.
[48] C. Chandara, E. Sakai, K.A.M. Azizli, Z.A. Ahmad, S.F.S. Hashim, The effect ofunburned carbon in palm oil fuel ash on fluidity of cement pastes containingsuperplasticizer, Constr. Build. Mater. 24 (9) (2010) 1590–1593.
[49] R. Solís-Carcaño, E.I. Moreno, Evaluation of concrete made with crushedlimestone aggregate based on ultrasonic pulse velocity, Constr. Build. Mater.22 (6) (2008) 1225–1231.
[50] BS EN 12504-4, Testing Concrete Determination of Ultrasonic Pulse Velocity,BSI, London, UK, 2004.
[51] J.A. Bogas, M.G. Gomes, A. Gomes, Compressive strength evaluation ofstructural lightweight concrete by non-destructive ultrasonic pulse velocitymethod, Ultrasonics 53 (5) (2013) 962–972.
[52] BS EN 12390-6, Testing Hardened Concrete. Part 6: Tensile Splitting Strengthof Test Specimens, BSI, London, UK, 2009.
[53] H.D. Wong, Cylinder Strength versus Cube Strength. Standing Committee onConcrete Technology Annual Concrete Seminar, CEDD, Hong Kong, 2013.
[54] M.F.M. Zain, H.B. Mahmud, A. Ilham, M. Faizal, Prediction of splitting tensilestrength of high-performance concrete, Cem. Concr. Res. 32 (8) (2002) 1251–1258.
[55] ACI 363R-92, State-of-the-Art Report on High-Strength Concrete ACICommittee Report 363, American Concrete Institute, Detroit, 1992. 363R1–363R55.

A. Islam et al. / Construction and Building Materials 101 (2015) 503–521 521
[56] CEB-FIP, Model Code 1990 (Design Code), Thomas Telford, London, UK, 1993.[57] G.S. Ryu, Y.B. Lee, K.T. Koh, Y.S. Chung, The mechanical properties of fly ash-
based geopolymer concrete with alkaline activators, Constr. Build. Mater. 47(2013) 409–418.
[58] S.H. Kosmatka, B. Kerkhoff, W.C. Panarese, Design and Control of ConcreteMixtures, 14th ed., Portland Cement Association, USA, 2002.
[59] M.N. Haque, H. Al-Khaiat, O. Kayali, Strength and durability of lightweightconcrete, Cem. Concr. Compos. 26 (4) (2004) 307–314.
[60] P. Shafigh, M.Z. Jumaat, H.B. Mahmud, N.A.A. Hamid, Lightweight concretemade from crushed oil palm shell: tensile strength and effect of initial curingon compressive strength, Constr. Build. Mater. 27 (1) (2012) 252–258.
[61] M. Gesoglu, T. Özturan, E. Güneyisi, Shrinkage cracking of lightweight concretemade with cold-bonded fly ash aggregates, Cem. Concr. Res. 34 (7) (2004)1121–1130.
[62] BS EN 12390-5, Testing Hardened Concrete. Part 5: Flexural Strength of TestSpecimens, BSI, London, UK, 2009.
[63] M. Shetty, Concrete Technology: Theory and Practice, S. Chand & CompanyLtd., New Delhi, India, 2005.
[64] S.P. Yap, U.J. Alengaram, M.Z. Jumaat, Enhancement of mechanical propertiesin polypropylene–and nylon–fibre reinforced oil palm shell concrete, Mater.Des. 49 (2013) 1034–1041.
[65] W. Zheng, A. Kwan, P. Lee, Direct tension test of concrete, ACI Mater. J. 98 (1)(2001) 63–71.
[66] T.Y. Lo, H.Z. Cui, Z.G. Li, Influence of aggregate pre-wetting and fly ash onmechanical properties of lightweight concrete, Waste Manage. 24 (4) (2004)333–338.
[67] M. Smadi, E. Migdady, Properties of high strength tuff lightweight aggregateconcrete, Cem. Concr. Compos. 13 (2) (1991) 129–135.
[68] F.I.P. Manual, FIP Manual of Lightweight Aggregate Concrete, second ed.,Surrey University Press, London, UK, 1983.
[69] BS 8110-2, Structural Use of Concrete - Part 2: Code of Practice for SpecialCircumstances, BSI, London, 1985.
[70] ENV 1992-1-1, Part 1. Design of Concrete Structures, Part 1 General Rules andRules for Buildings, Final Draft, European Committee for Standardization, (Part1C, The use of lightweight concrete with closed structures, to be issued as ENV1992–1–4), Brussels, 1991.
[71] W.H. Mosley, J.H. Bungey, Reinforced Concrete Design, fourth ed., Macmillan,London, UK, 1990.
[72] S. Chandra, L. Berntsson, Lightweight Aggregate Concrete, William AndrewPublishing, Norwich, New York, 2002.
[73] K.H. Mo, U.J. Alengaram, M.Z. Jumaat, Utilization of ground granulated blastfurnace slag as partial cement replacement in lightweight oil palm shellconcrete, Mater. Struct. 1–12 (2014).
[74] F. Collins, Inclusion of carbonation during the life cycle of built and recycledconcrete: influence on their carbon footprint, Int. J. Life Cycle Assess. 15 (6)(2010) 549–556.
[75] L.K. Turner, F.G. Collins, Carbon dioxide equivalent (CO2-e) emissions: acomparison between geopolymer and OPC cement concrete, Constr. Build.Mater. 43 (2013) 125–130.
[76] M.H. Mohammed, M. Al-Gburi, N. Al-Ansari, J.E. Jonasson, R. Pusch, S.Knutsson, Design of concrete mixes by systematic steps and ANN, J. Adv. Sci.Eng. Res. 2 (4 September) (2012) 232–251.
[77] B.C. McLellan, R.P. Williams, J. Lay, A. van Riessen, G.D. Corder, Costs andcarbon emissions for geopolymer pastes in comparison to ordinary Portlandcement, J. Clean. Prod. 19 (9–10) (2011) 1080–1090.