engineering transcriptional regulator e ector specificity ... · vanillin, a growth-inhibiting ......
TRANSCRIPT
Engineering Transcriptional Regulator E↵ector
Specificity using Computational Design and In
Vitro Rapid Prototyping: Developing a Vanillin
Sensor
Emmanuel L.C. de los Santos,
⇤Joseph T. Meyerowitz, Stephen L. Mayo, and
Richard M. Murray
Division of Biology and Biological Engineering, California Institute of Technology,
Pasadena, CA, USA
E-mail: [email protected]
⇤To whom correspondence should be addressed
1
.CC-BY-NC-ND 4.0 International licensepeer-reviewed) is the author/funder. It is made available under aThe copyright holder for this preprint (which was not. http://dx.doi.org/10.1101/015438doi: bioRxiv preprint first posted online Feb. 19, 2015;

Abstract
The pursuit of circuits and metabolic pathways of increasing complexity and ro-
bustness in synthetic biology will require engineering new regulatory tools. Feedback
control based on relevant molecules, including toxic intermediates and environmental
signals, would enable genetic circuits to react appropriately to changing conditions.
In this work, variants of qacR, a tetR family repressor, were generated by compu-
tational protein design and screened in a cell-free transcription-translation (TX-TL)
system for responsiveness to a new targeted e↵ector. The modified repressors target
vanillin, a growth-inhibiting small molecule found in lignocellulosic hydrolysates and
other industrial processes. Promising candidates from the in vitro screen were further
characterized in vitro and in vivo in a gene circuit. The screen yielded two qacR mu-
tants that respond to vanillin both in vitro and in vivo. We believe this process, a
combination of the generation of variants coupled with in vitro screening, can serve as
a framework for designing new sensors for other target compounds.
Keywords
synthetic biology, cell-free systems, in vitro biological circuit prototyping, computational
protein design, protein engineering
Introduction
Engineering cells that contain circuits and novel metabolic pathways of increasing complexity
and robustness in synthetic biology will require more sophisticated regulatory tools. The
utility of a synthetic genetic circuits for real world applications is dependent on the ability
to e↵ectively trigger the circuit. While we can control the expression of target genes with
transcriptional regulators, triggers for these transcriptional regulators are limited to a small
number of molecules and other inputs (e.g. light) (1 ). As a consequence, most synthetic
2
.CC-BY-NC-ND 4.0 International licensepeer-reviewed) is the author/funder. It is made available under aThe copyright holder for this preprint (which was not. http://dx.doi.org/10.1101/015438doi: bioRxiv preprint first posted online Feb. 19, 2015;
Computationally aided selection of
sequences for screen
(35,577,057,600sequences)
Is there a sensor?
Rapid in vitro screening of mutants
(28 mutants)
in vitro verification of hits (2 mutants)
Is there a hit?
in vivo testing and characterization
(2 mutants)
Optimize to desired specifications
No
Yes
No
Yes
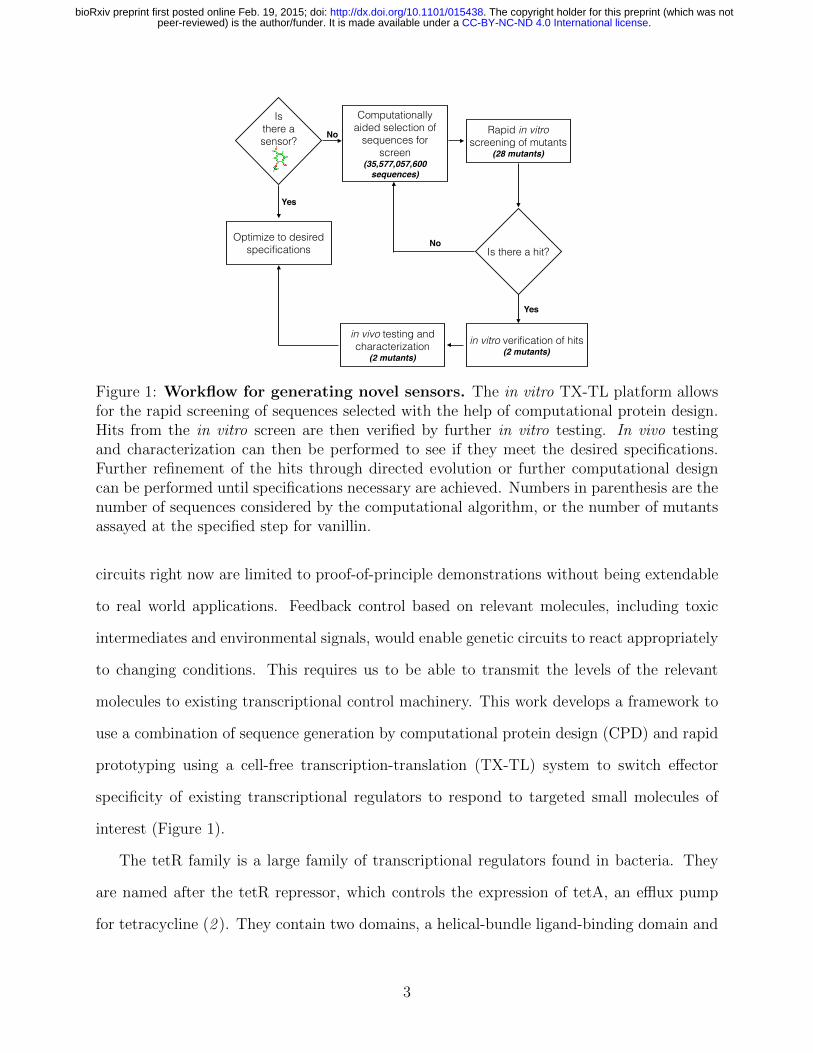
Figure 1: Workflow for generating novel sensors. The in vitro TX-TL platform allowsfor the rapid screening of sequences selected with the help of computational protein design.Hits from the in vitro screen are then verified by further in vitro testing. In vivo testingand characterization can then be performed to see if they meet the desired specifications.Further refinement of the hits through directed evolution or further computational designcan be performed until specifications necessary are achieved. Numbers in parenthesis are thenumber of sequences considered by the computational algorithm, or the number of mutantsassayed at the specified step for vanillin.
circuits right now are limited to proof-of-principle demonstrations without being extendable
to real world applications. Feedback control based on relevant molecules, including toxic
intermediates and environmental signals, would enable genetic circuits to react appropriately
to changing conditions. This requires us to be able to transmit the levels of the relevant
molecules to existing transcriptional control machinery. This work develops a framework to
use a combination of sequence generation by computational protein design (CPD) and rapid
prototyping using a cell-free transcription-translation (TX-TL) system to switch e↵ector
specificity of existing transcriptional regulators to respond to targeted small molecules of
interest (Figure 1).
The tetR family is a large family of transcriptional regulators found in bacteria. They
are named after the tetR repressor, which controls the expression of tetA, an e✏ux pump
for tetracycline (2 ). They contain two domains, a helical-bundle ligand-binding domain and
3
.CC-BY-NC-ND 4.0 International licensepeer-reviewed) is the author/funder. It is made available under aThe copyright holder for this preprint (which was not. http://dx.doi.org/10.1101/015438doi: bioRxiv preprint first posted online Feb. 19, 2015;

a helix-turn-helix DNA-binding domain. In the absence of their inducing molecule, tetR
repressors bind to DNA, preventing the transcription of downstream genes. Inducer binding
to the ligand-binding domain causes a conformational change in the DNA binding domain
that causes dissociation from the DNA, allowing transcription of downstream genes. The
tetR transcriptional regulation machinery has been used in the design of synthetic circuits,
including the repressilator (3 ) and the toggle switch (4 ).
QacR is a tetR-family repressor found in S. aureus that controls the transcription of
qacA, an e✏ux pump that confers resistance to a large number of quaternary anionic com-
pounds. The protein has been studied because it is induced by a broad range of structurally
dissimilar compounds (5 ). Structural examination of qacR in complex with di↵erent small
molecules has shown that qacR has two di↵erent binding regions inside a large binding
pocket. While qacR has multiple binding modes for various inducers, in all cases for which
there are structures, binding of the inducer causes a tyrosine expulsion that moves one of
the helices and alters the conformation of the DNA binding domain, rendering qacR unable
to bind DNA (6–8 ). Crystal structures of inducer-bound forms of qacR and the qacR-DNA
complex coupled with a definitive structural mechanism for qacR induction make it the ideal
starting point for CPD of new transcriptional regulators. In this work, we describe our ef-
forts to apply our framework to engineer qacR to sense vanillin, a phenolic growth inhibitor
that is a byproduct of lignin degradation performed during the processing of biomass into
intermediate feedstock in biofuel production (9 ).
Results and Discussion
Computationally Aided Selection of QacR Mutant Sequences
We created a computational model of vanillin to place into a crystal structure of QacR.
Phoenix Match (10 ), a computational protein design algorithm was used to find potential
vanillin binding sites close to the location of the tyrosine expulsion in the binding pocket of
4
.CC-BY-NC-ND 4.0 International licensepeer-reviewed) is the author/funder. It is made available under aThe copyright holder for this preprint (which was not. http://dx.doi.org/10.1101/015438doi: bioRxiv preprint first posted online Feb. 19, 2015;

(a)
(b)
(c)
Figure 2: Computationally aided selection of qacR mutants. (a) PDB structures ofthe non-ligand bound (cyan, PDB ID: 1JT0) and ligand bound (magenta, PDB ID: 3BQZ)conformations of qacR. A conformational shift in the binding pocket occurs upon entry ofthe small molecule causing the protein to dissociate from DNA. (b) A closer look at thebinding pocket of qacR, the binding of the ligand in green causes the displacement of threetyrosine shown as sticks in cyan and magenta. (c) Computational model for potential vanillinbinding sites. Vanillin is shown as a di↵erent color in each of the four sites. A protein designalgorithm was asked to suggest mutations for amino acids close to the potential binding sitesto support the placement of vanillin in these sites.
5
.CC-BY-NC-ND 4.0 International licensepeer-reviewed) is the author/funder. It is made available under aThe copyright holder for this preprint (which was not. http://dx.doi.org/10.1101/015438doi: bioRxiv preprint first posted online Feb. 19, 2015;

qacR (Figure 2A-B) while being in the proximity of amino acid positions that allowed for
favorable pi-stacking and hydrogen bonding interactions. We used targeted ligand placement
(10 ) to find potential binding positions for vanillin by defining an idealized binding site for
the molecule. The algorithm yielded four potential binding positions for vanillin (Figure
2C). Computational protein sequence design was then used to select amino acid residues at
positions around the potential vanillin binding sites. In order to minimize the possibility of
steric clashes in the protein, we also performed calculations that considered both the DNA-
bound state and the ligand-bound state using a multi-state design algorithm (11 ). Finally,
we also ran calculations that included an energy bias to favor the wild-type residue. The
lowest energy sequences from these four calculations (single-state biased, single-state non-
biased, multi-state biased, and multi-state non-biased) were analyzed, and used as a guide
to compile a set of ten mutants (Table S1) for in vitro testing. A more detailed description
of the computational methods used can be found in the Materials and Methods section.
In Vitro Screening of Generated Sequences
We first decided to validate function of the wild-type protein. This was done by placing
green fluorescent protein (GFP) downstream of the qacA promoter sequence (PQacA). While
we observed a hundred-fold decrease in fluorescence in cells containing plasmids encoding
the wild-type qacR gene in addition to PQacA–GFP, addition of berberine, a native qacR
inducer, yielded no observable di↵erence in fluorescence (Figure S1). We hypothesized that
the inducer was not getting into the cells due to the di↵erences in cell wall permeability
between gram-positive and gram-negative bacteria. Because of this, we decided to use an in
vitro transcription-translation (TX-TL) system to test the mutants (12 ).
The TX-TL system contains whole cell lysate from BL21 E. coli Rosetta 2, with no
endogenous mRNA or DNA. A TX-TL reaction is typically done in a 10µL reaction volume
and contains the cell extract, an energy solution consisting of amino acids, nucleotides and
3-PGA, and DNA. It contains the transcriptional and translational machinery of E. coli
6
.CC-BY-NC-ND 4.0 International licensepeer-reviewed) is the author/funder. It is made available under aThe copyright holder for this preprint (which was not. http://dx.doi.org/10.1101/015438doi: bioRxiv preprint first posted online Feb. 19, 2015;

allowing you to express proteins by adding plasmid DNA encoding genes you want expressed
(Figure 3). Protein concentration can be controlled directly by varying the amount of DNA
placed in the reaction. You can execute genetic networks in a TX-TL reaction by adding
plasmids that contain proteins that interact. The TX-TL prototyping provides advantages
over in vivo circuit testing as it allows us to control protein levels without worrying about
promoter and ribosomal binding site strength. Cell wall permeability and protein toxicity
are also not issues in the TX-TL system.
(a)
(b)
Figure 3: TX-TL allows us to prototype circuits in vitro (a) TX-TL contains thetranscriptional and translational machinery allowing you to express proteins in the reaction.Adding plasmid DNA encoding proteins allows for their expression and detection in TX-TL.(b) deGFP expression from a TX-TL reaction with plasmid encoding GFP.
We first tested the wild-type protein in our TX-TL system. We observed an increase in
GFP fluorescence as we increased the concentration of plasmid encoding PQacA–GFP from 2
nM to 8 nM (Figure 4A). The addition of plasmid encoding the qacR repressor to the system
resulted in a decrease in fluorescence. Because of the high autofluorescence of berberine, we
used dequalinium, a colorless native qacR inducer. The addition of dequalinium resulted
in an increase in fluorescence until about 85% of the fluorescence when no DNA encoding
repressor was present (Figure 4B). These results demonstrated a functional wild-type qacR
repressor in TX-TL. After validating the function of wild-type protein in TX-TL, we used
the system to look at the functionality of the qacR mutants.
None of the initial mutants showed any repression of GFP fluorescence. We analyzed
the ligand bound and DNA-bound computational models of one of the qacR mutants that
7
.CC-BY-NC-ND 4.0 International licensepeer-reviewed) is the author/funder. It is made available under aThe copyright holder for this preprint (which was not. http://dx.doi.org/10.1101/015438doi: bioRxiv preprint first posted online Feb. 19, 2015;

PqacA deGFP plasmid concentration0 nM 2 nM 4 nM 8 nM
Fluo
resc
ence
[AU
]
× 104
0
1
2
3
4
5
6
TX-TL Reaction
pQac-GFP
(a)
PqacAdeGFP, qacR wild-type, dequaliniumno repressor 0 µM 1 µM 2 µM 4 µM
Fluo
resc
ence
[AU
]
× 104
0
0.5
1
1.5
2
2.5
3
3.5
4
TX-TL Reaction
pQac-GFP
qacR wild-type
dequaliniumN
NH2
N
H2N
Cl
Cl
pQac-GFP5
6
(b)
Figure 4: Validation of TX-TL screening. (a) GFP signal after three hours of a TX-TLreaction. Plasmid encoding GFP downstream of the native qac promoter was added to theTX-TL platform. Higher concentrations of plasmid yielded more GFP signal. (b) Responseof wild-type qacR to dequalinium. DNA encoding GFP and wild-type qacR was added tothe TX-TL system. Increasing fluorescent signal is observed with increasing concentrationsof dequalinium. The highest fluorescent signal is observed when there is no repressor in thesystem, demonstrating the ability of TX-TL to test for qacR repression and de-repression.
8
.CC-BY-NC-ND 4.0 International licensepeer-reviewed) is the author/funder. It is made available under aThe copyright holder for this preprint (which was not. http://dx.doi.org/10.1101/015438doi: bioRxiv preprint first posted online Feb. 19, 2015;

contained only three amino acid substitutions from a qacR mutant that was previously shown
to be functional by Peters et al. (8 ). The computational model showed the potential for
some mutations to cause steric clashes in the DNA bound state (Figure S2). We created
a second library reverting either the 50th and 54th positions (A50F/W54L) or the 119th
position (Y119L) to their wild-type identity (Table S2)
In order to determine if any of the mutants of our library warranted further character-
ization, we performed a rapid screen of 17 qacR mutants in TX-TL (Figure S3). Plasmids
containing DNA that encoded each of the qacR variants or the wild-type qacR sequence
were placed into a TX-TL reaction containing either water, dequalinium or vanillin. QacR
activity was monitored by a plasmid encoding GFP downstream of PQacA. Two of the mu-
tants, qacR2 and qacR5, displayed an increase in fluorescence in the presence of vanillin and
dequalinium over water (Figure 5). We focused on these two mutants for further in vitro
and in vivo characterization.
qacR variantswt 1 2 3 4 5 6 7 8 9 10 11 12 13 14 15 16 17
Fold
Cha
nge
in G
FP F
luor
esen
ce o
ver W
ater
0
0.5
1
1.5
2
2.5
3
3.5
4qacR induction, Fold Change Over Water
vanillindequalinium
Figure 5: In vitro TX-TL screen of qacR mutants found potential candidates for
further testing. Fold change in maximum fluorescence between water and inducer for qacRmutants. Seventeen qacR mutants were screened using TX-TL. Plasmids containing DNAencoding each of the qacR variants were placed into the system along with water, dequalinium(native qacR inducer) and vanillin. To monitor qacR response, a plasmid encoding GFPdownstream of the native qacA promoter was also added to the system. qacR2 and qacR5were selected for further characterization. qacR1 was not selected due to low signal (FigureS3)
9
.CC-BY-NC-ND 4.0 International licensepeer-reviewed) is the author/funder. It is made available under aThe copyright holder for this preprint (which was not. http://dx.doi.org/10.1101/015438doi: bioRxiv preprint first posted online Feb. 19, 2015;

Further In Vitro Testing of QacR2 and QacR5
In order to verify the response of qacR2 and qacR5 to vanillin, we performed more extensive
TX-TL tests on the mutants. TX-TL reactions were set up with a constant amount of
reporter (PQacA–deGFP) plasmid and either no repressor (water), or plasmids encoding wild-
type qacR, qacR2, or qacR5. Reactions were incubated for 85 minutes at 29 degrees Celsius
to produce the repressor protein. This bulk reaction was then added to solution containing
dequalinium, vanillin, or water. We monitored the rate of GFP production between the first
and third hours of the reaction, where the rate of protein production appeared linear.
Figure 6 shows the ratio of GFP fluorescence between the case where there is no repressor,
and each of the repressors tested with the di↵erent inducers. The wild-type qacR is able to
inhibit the production of fluorescence to around 15% of its maximum value. The mutants are
less e�cient at repressing the production of GFP. Three times and four times more repressor
DNA was added to the reactions of qacR2 and qacR5 respectively. In spite of the additional
DNA, we do not observe the same level of repression that we see with the wild-type protein.
Wild-type qacR is well induced by the native inducer, and we observed full derepression at
the dequalinium concentration used. Induction of qacR2 and qacR5 with dequalinium is
also observed, although to a lesser degree than the wild-type protein. QacR2 and qacR5
display a response to vanillin at the concentration we tested, while no response to vanillin
was detected for the wild-type protein. The mutations introduced to the protein decrease
the ability of the mutants to repress DNA. This could be due to protein instability, or due
to a weaker protein-DNA interaction. However, these mutations also increase the sensitivity
of the mutants to vanillin, allowing their response to be detectable in our in vitro platform.
We assumed that the maximum amount of GFP fluorescence that can be achieved for a
specific inducer condition was when there is no repressor present. This takes into account
potential toxicity of the inducer to the TX-TL reaction. The factors that can a↵ect the ability
of the particular repressor to reach this the no repressor case are resource limitations due to
additional load from the production of the repressor DNA, and response of the repressor to
10
.CC-BY-NC-ND 4.0 International licensepeer-reviewed) is the author/funder. It is made available under aThe copyright holder for this preprint (which was not. http://dx.doi.org/10.1101/015438doi: bioRxiv preprint first posted online Feb. 19, 2015;

(a)
(b)
Figure 6: In vitro testing of qacR2 and qacR5. (a) TX-TL reactions were set upwith plasmids containing GFP downstream of a qacR sensitive promoter in the presenceand absence of plasmids containing the qacR variants under di↵erent inducer conditions.To account for inducer toxicity to the TX-TL reaction, and resource limitations from theproduction of the qacR repressor we normalized each condition to the reactions that onlycontained the GFP plasmid under di↵erent inducer conditions. (b) Ratio of the rate ofGFP production between TX-TL reactions with and without repressor DNA. 10 µM ofdequalinium and 5 mM of vanillin was used to induce the production of GFP for each of theqacR variants tested.
11
.CC-BY-NC-ND 4.0 International licensepeer-reviewed) is the author/funder. It is made available under aThe copyright holder for this preprint (which was not. http://dx.doi.org/10.1101/015438doi: bioRxiv preprint first posted online Feb. 19, 2015;

the inducer in the reaction. We expect that resource limitations would have a negative e↵ect
on the ability of the repressor to reach the maximum fluorescence level. Conversely, response
to repressor should have a positive e↵ect in reaching the maximum fluorescence level.
In Vivo Testing of QacR2 and QacR5
Figure 7: Circuit layout for in vivo tests. Genes encoding GFP under the control of thenative qac promoter, and our QacR designs under the control of a tet-inducible promoter wereplaced in a single plasmid and transformed into DH5↵Z1 cells. qacR levels were controlledusing aTc for varying vanillin concentrations. Candidate designs that are responsive tovanillin should show an increase in fluorescence with increasing vanillin concentrations
In order to further characterize the qacR mutants, and to see if we could detect vanillin
in a more complex system, we decided to test the in vivo response of the qacR variants
to vanillin. Plasmids containing genes that encode the wild-type qacR sequence, qacR2 or
qacR5 downstream of PTet and GFP downstream of PQacA were cloned into DH5↵Z1 cells
(Figure 7). For each of the qacR variants, we compared di↵erences in fluorescence signal
across increasing vanillin concentrations. We tested di↵erent repressor concentrations by
varying the amount of anhydrous tetracycline (aTc) in the system. Similar to the in vitro
experiments, and in order to get an idea for the maximum fluorescence the system could
achieve, we grew cells that only contained GFP downstream of PQacA without any repressor.
Cells that were grown in higher aTc concentrations had a lower measured optical density
(OD), indicating a slower doubling time. We hypothesize that this is due to the toxicity of
the qacR repressor to the E. coli strain. Since qacR is not a native protein, it is possible
12
.CC-BY-NC-ND 4.0 International licensepeer-reviewed) is the author/funder. It is made available under aThe copyright holder for this preprint (which was not. http://dx.doi.org/10.1101/015438doi: bioRxiv preprint first posted online Feb. 19, 2015;

that qacR is binding to locations in the E. coli genome. Interestingly, the di↵erences in
optical density measurements become less pronounced with increasing vanillin concentration,
suggesting that vanillin may provide a mitigating e↵ect to this toxicity. In order to account
for di↵erences in OD, fluorescence measurements were normalized to OD.
The lowest OD measurements were observed for cells encoding the wild-type qacR at
12 ng/mL aTc where very little growth was observed for cells expressing the wild-type
protein. At this aTc concentration, all of the cells expressing repressor exhibited lower
optical densities when compared to cells that were only expressing fluorescent protein. The
di↵erences in optical density are less pronounced at lower aTc concentrations. When no aTc
is present in the system, cells at the higher vanillin concentrations had lower ODs. At higher
aTc concentrations, cells at higher vanillin concentrations had higher ODs. This implies that
both the vanillin concentration and the expression of the repressor have an e↵ect on cellular
growth. The optical densities for the cells at di↵erent aTc and vanillin concentrations are
shown in Tables S3-S6.
Figure 8A shows the e↵ect of increasing the aTc concentration on the fluorescence of cells
in the absence of vanillin. Similar to the in vitro tests, fluorescence was normalized to the
no repressor case. Increasing the aTc concentration decreased the fluorescence of cells in the
absence of vanillin, confirming that the qacR mutants are able to repress the expression of
GFP at higher protein concentrations.
The response of wild-type qacR, qacR2, and qacR5 to increasing vanillin concentrations
is shown in Figure 8B. The response curves for each protein are plotted for the minimum
aTc concentration such that maximum GFP repression is observed. This corresponds to aTc
concentrations of 4, 8, and 12 ng/mL for wild-type qacR, qacR2, and qacR5 respectively.
This is consistent with the in vitro data that more qacR2 and qacR5 DNA was required
to repress the expression of GFP. Similar to the in vitro tests, we expect the ability of the
cell to reach the maximum fluorescence level to be dependent on its response to inducer,
and toxicity from vanillin and qacR. Indeed, cells expressing the qacR mutants exhibited an
13
.CC-BY-NC-ND 4.0 International licensepeer-reviewed) is the author/funder. It is made available under aThe copyright holder for this preprint (which was not. http://dx.doi.org/10.1101/015438doi: bioRxiv preprint first posted online Feb. 19, 2015;

(a)
(b)
Figure 8: In vivo response of qacR to vanillin. Cells expressing GFP without anyrepressor were used as a control to normalize for di↵erences in fluorescence due to aTc andvanillin levels. (a) All of the proteins are able to repress the expression of GFP. The wild-typeprotein is able to inhibit the expression of GFP at lower aTc concentrations, while higheraTc concentrations are necessary for the mutants to achieve a similar level of repression. (b)QacR mutants respond to vanillin in a concentration dependent manner.
increase in fluorescence with increasing vanillin levels demonstrating that they are capable
of sensing vanillin. While all three proteins appear to be sensitive to vanillin, the mutants
exhibit a marked increase in sensitivity to vanillin. QacR2 displays a response that goes
from approximately 20 percent of the fluorescence of the cells not expressing any repressor
to matching the fluorescence of the non-repressed cells at 1 mM vanillin. QacR5 saturates
at around 40 percent of the fluorescence of the non-repressed cells. This correlates with the
in vitro data that show qacR2 achieving close to the non-repressed fluorescence, with qacR5
less sensitive to vanillin (Figure 6). Figure S4 shows the vanillin dosage response of qacR
wild-type, qacR2, and qacR5 for di↵erent aTc concentrations tested.
14
.CC-BY-NC-ND 4.0 International licensepeer-reviewed) is the author/funder. It is made available under aThe copyright holder for this preprint (which was not. http://dx.doi.org/10.1101/015438doi: bioRxiv preprint first posted online Feb. 19, 2015;

Framework Enables Engineering of Sensors through Rational Re-
duction of Design Space
The framework developed— a combination of sequence generation using computationally-
aided design, preliminary screening with TX-TL, and in vitro and in vivo validation—can
be used for other small molecule targets potentially facilitating the design of more sensors in
synthetic circuits. While it is possible that the computational model of vanillin binding was
inaccurate, the computational design provided value in drastically reducing the number of
sequences to test into a figure that was experimentally tractable. Without the computational
design to reduce the size of the design space, we would not have had e↵ective starting points
to attempt the engineering of a vanillin sensor.
The use of the in vitro cell-free system in a preliminary screen provides many advantages.
It allows the screening of more mutants in a shorter amount of time. The simpler system also
reduces the number of variables to consider. Complicating factors such as cell membrane
permeability and cell growth do not need to be considered during this part of the screen.
Repressors whose native inducers cannot enter the target organism can be used as starting
points with the cell-free system. Finally, we can use this framework to target molecules that
are known to be toxic to cells and measure engineering results in a cell-free context.
As a result of this process, we now have functional vanillin sensors that can be used in
a feedback circuit that dynamically responds to vanillin. QacR2 and qacR5 can be used as
a starting point for a synthetic circuit that responds to vanillin concentrations. While we
only tested the protein in E. coli, recent work has developed a process that facilitates the
transfer of prokaryotic transcription factors into eukaryotic cells, increasing the flexibility
of the molecules for use in metabolic engineering (14 ). By linking a vanillin sensor to the
expression of a gene that can mitigate the toxic e↵ect of vanillin, such as an e✏ux pump
or an enzyme which converts vanillin to a less toxic molecule, we can design a dynamic
feedback circuit and potentially improve metabolic yield. It remains to be seen whether
the sensors developed will have the required dynamic range or sensitivity for a functional
15
.CC-BY-NC-ND 4.0 International licensepeer-reviewed) is the author/funder. It is made available under aThe copyright holder for this preprint (which was not. http://dx.doi.org/10.1101/015438doi: bioRxiv preprint first posted online Feb. 19, 2015;
feedback circuit; however, if a better sensor is needed these proteins can be used as a starting
point for directed evolution in order to obtain a sensor with the desired properties.
Materials and Experimental Methods
Computationally Aided Selection of Mutant Sequences
An in silico model of vanillin was constructed using the Schrodinger software suite. Partial
charges for vanillin were computed using Optimization in Jaguar version 7.6 (15 ) using HF/6-
311G** as the basis set. Vanillin rotamers were chosen by looking at the ideal angles for
the carbon hybrid orbitals. A model of an idealized vanillin binding pocket was designed by
looking at the protein data bank for proteins that bound small molecules similar to vanillin,
specifically PDBID 2VSU. Models of vanillin in the qacR binding pocket were generated
using the Phoenix Match algorithm (10 ).
Vanillin was built o↵ a native tyrosine residue (Y123), the primary interaction consid-
ered for the algorithm was a hydrogen bonding interaction between the hydroxyl group of
the tyrosine with the methoxy and hydroxyl groups of the vanillin. We modified the energy
function to include an energy bias for potential pi-stacking interactions between vanillin and
tyrosine, phenylalanine, or tryptophan residues. We also included an energy bias hydrogen-
bonding interactions with the methoxy, hydroxyl, and aldehyde groups of vanillin with serine,
threonine, tyrosine, glutamine, or asparagine residues. The Phoenix Match algorithm was
asked to return potential vanillin binding locations that contained interaction with the na-
tive tyrosine, at least one pi-stacking interaction, and at least two other hydrogen bonding
interactions. Solutions from the algorithm were grouped together and resulted in four po-
tential spots for vanillin. These locations were used as vanillin “rotamers” for computational
protein design.
Monte Carlo with simulated annealing (16 ) and FASTER (17 ) were used to sample
conformational space. A backbone independent conformer library with a 1.0 A resolution
16
.CC-BY-NC-ND 4.0 International licensepeer-reviewed) is the author/funder. It is made available under aThe copyright holder for this preprint (which was not. http://dx.doi.org/10.1101/015438doi: bioRxiv preprint first posted online Feb. 19, 2015;

was used for the designed residues (10 ). Designed residues were chosen by compiling a list of
amino acid residues within 15 A of vanillin. Table S7 shows the amino acid design positions,
and the allowed amino acid residues for each position. Allowed amino residues for each site
were selected by visually inspecting the qacR cyrstal structure with the potential vanillin
binding locations. Rotamer optimization was allowed for other residues in the 15 A shell
in which mutations were not allowed. Computational models of qacR with vanillin present
were scored using the PHOENIX forcefield with the inclusion of an additional geometry bias
term that favored pi-stacking and hydrogen bonding interactions (10 ) that we used to find
potential vanillin active sites. We considered solutions that both included and excluded �20
kcal/mol wild-type bias term in the energy function.
Cell Free In Vitro Transcription-Translation System and Reactions
The transcription-translation reaction consists of crude cytoplasmic extract from BL21 Rosetta
2 E. coli (12 ). Preliminary tests were done with plasmids and inducers at the specified con-
centrations. For the initial screen, the qacR mutants were downstream of a T7 promoter.
TX-TL reactions were run with 2 nM of the plasmid encoding the qacR variant, 0.1 nM
plasmid encoding T7 RNA polymerase, and 8 nM plasmid encoding PQacA–deGFP. Vanillin
was added at a concentration of 2.5 mM and dequalinium was added at 10 µM.
For the in vitro tests to further characterize the hits, plasmids encoding qacR2 or qacR5
downstream of a tet-responsive promoter were used along with a plasmid encoding deGFP
downstream of a qac-responsive promoter. Plasmids were prepared using the Macherey-Nagel
NucleoBond Xtra Midi/Maxi Kit. Plasmid DNA was eluted in water and concentrated by
vacufuge to the desired concentration. TX-TL reactions were set up as follows: 5 µL of
bu↵er, 2.5 µL of cell extract and 1.5 µL repressor DNA at a specific concentration was
mixed and incubated at 29 C for 75 minutes to facilitate the production of repressor DNA.
This mix was then added to a mixture of 1 µL deGFP plasmid and 1 µL of an inducer
stock. Measurements were made in a Biotek plate reader at 3 minute intervals using ex-
17
.CC-BY-NC-ND 4.0 International licensepeer-reviewed) is the author/funder. It is made available under aThe copyright holder for this preprint (which was not. http://dx.doi.org/10.1101/015438doi: bioRxiv preprint first posted online Feb. 19, 2015;

citation/emission wavelengths set at 485/525 nm. Stock repressor plasmid concentrations
were 243 nM , 729 nM , and 972 nM for qacR wild-type, qacR2, and qacR5, respectively.
The deGFP plasmid concentration was approximately 397 nM. Inducer concentrations were
5 mM for vanillin, and 10 µM for dequalinium.
Experimental conditions were done in triplicate and the error bars are the error propa-
gated from the standard deviation of the means.
Cell Strain and Media
The circuit was implemented in the E.coli cell strain DH5↵Z1, a variant of DH5↵ that
contains a chromosomal integration of the Z1 cassette (18 ). The Z1 cassette constitutively
expresses the TetR and LacI proteins. All cell culture was done in optically clear M9ca
minimal media (Teknova M8010).
Genes and Plasmids
DNA encoding the qacR genes was constructed using overlap extension PCR. Plasmids used
contained chloramphenicol resistance with a p15a origin of replication.
In Vivo Experiments
Cells were grown in at least two consecutive overnight cultures in M9ca minimal media.
On the day of the experiment, overnight cultures were diluted 1:100 and grown for 5 hours
to ensure that the cells were in log phase. Cells were then diluted 1:100 into fresh media
at the specified experimental condition. Cells were grown in these conditions at 37C for
12–15 hours in Axygen 96 well plates while shaking at 1100 rpm. Endpoint fluorescence
was measured by transferring the cells to clear bottomed 96-well microplates (PerkinElmer,
ViewPlate, 6005182) . GFP was read at 488/525 with gain 100.
Analysis of the data was done by taking fluorescence readings for each independent
18
.CC-BY-NC-ND 4.0 International licensepeer-reviewed) is the author/funder. It is made available under aThe copyright holder for this preprint (which was not. http://dx.doi.org/10.1101/015438doi: bioRxiv preprint first posted online Feb. 19, 2015;

well. Experimental conditions of the qacR proteins were done in triplicate and repeats were
averaged. Error bars shown are the error propagated originating from the standard deviation
of the mean.
Acknowledgement
The authors thank Jongmin Kim and Jackson Cahn for reading the manuscript. This re-
search was conducted with supprot from the Institute for Collaborative Biotechnologies
through grand W911NF-09-0001 from the U.S. Army Research O�ce. Additional support
was granted in part by the Benjamin M. Rosen Bioengineering Center, the Gordon and
Betty Moore Foundation through Grant GBMF2809 to the Caltech Programmable Molecu-
lar Technology Initiative, and DARPA through the Living Foundries Program.
19
.CC-BY-NC-ND 4.0 International licensepeer-reviewed) is the author/funder. It is made available under aThe copyright holder for this preprint (which was not. http://dx.doi.org/10.1101/015438doi: bioRxiv preprint first posted online Feb. 19, 2015;
References
(1) Purnick, P., and Weiss, R. (2009) The second wave of synthetic biology: from modules
to systems. Nature Reviews. Molecular Cell Biology 10, 410–422.
(2) Ramos, J., Martinez-Bueno, M., Molina-Henares, A., Teran, W., Watanabe, K.,
Zhang, X., Gallegos, M., Brennan, R., and Tobes, R. (2005) The TetR family of tran-
scriptional repressors. Microbiology and Molecular Biology Reviews 69, 326–356.
(3) Elowitz, M., and Leibler, S. (2000) A synthetic oscillatory network of transcriptional
regulators. Nature 403, 335–338.
(4) Gardner, T., Cantor, C., and Collins, J. (2000) Construction of a genetic toggle switch
in Escherichia coli. Nature 403, 339–342.
(5) Grkovic, S., Hardie, K., Brown, M., and Skurray, R. (2003) Interactions of the QacR
multidrug-binding protein with structurally diverse ligands: implications for the evolu-
tion of the binding pocket. Biochemistry 42, 15226–15236.
(6) Schumacher, M., Miller, M., Grkovic, S., Brown, M., Skurray, R., and Brennan, R.
(2001) Structural mechanisms of QacR induction and multidrug recognition. Science
294, 2158–2163.
(7) Schumacher, M., and Brennan, R. (2003) Deciphering the molecular basis of multidrug
recognition: Crystal structures of the Staphylococcus aureus multidrug binding tran-
scription regulator QacR. Research in Microbiology 154, 69–77.
(8) Peters, K., Brooks, B., Schumacher, M., Skurray, R., Brennan, R., and Brown, M.
(2011) A single acidic residue can guide binding site selection but does not govern
QacR cationic-drug a�nity. Public Library of Science ONE 6, e15974.
(9) Klinke, H., Thomsen, AB,, and Ahring, B. (2004) Inhibition of ethanol-producing yeast
20
.CC-BY-NC-ND 4.0 International licensepeer-reviewed) is the author/funder. It is made available under aThe copyright holder for this preprint (which was not. http://dx.doi.org/10.1101/015438doi: bioRxiv preprint first posted online Feb. 19, 2015;

and bacteria by degradation products produced during pre-treatment of biomass. Ap-
plied Microbiology and Biotechnology 66, 10–26.
(10) Lassila, J., Privett, H., Allen, B., and Mayo, S. (2006) Combinatorial methods for
small-molecule placement in computational enzyme design. Proceedings of the National
Academy of Sciences of the United States of America 103, 16710–16715.
(11) Allen, B., and Mayo, S. (2010) An e�cient algorithm for multistate protein design
based on FASTER. Journal of Computational Chemistry 31, 904–916.
(12) Sun, Z., Hayes, C., Shin, J., Caschera, F., Murray, R., and Noireaux, V. (2013) Proto-
cols for implementing an Escherichia coli based TX-TL cell-free expression system for
synthetic biology. Journal of Visualized Experiments : JoVE e50762.
(13) Sun, Z., Yeung, E., Hayes, C., Noireaux, V., and Murray, R. (2014) Linear DNA for
Rapid Prototyping of Synthetic Biological Circuits in an Escherichia coli Based TX-TL
Cell-Free System. ACS Synthetic Biology 3, 387–397.
(14) Stanton, B., Siciliano, V., Ghodasara, A., Wroblewska, L., Clancy, K., Trefzer, A.,
Chesnut, J., Weiss, R., and Voigt, C. (2014) Systematic Transfer of Prokaryotic Sensors
and Circuits to Mammalian Cells. 3, 880–891, PMID: 25360681.
(15) Bochevarov, A., Harder, E., Hughes, T., Greenwood, J., Braden, D., Philipp, D., Ri-
naldo, D., Halls, M., Zhang, J., and Friesner, R. (2013) Jaguar: A high-performance
quantum chemistry software program with strengths in life and materials sciences. In-
ternational Journal of Quantum Chemistry 113, 2110–2142.
(16) Kuhlman, B., Dantas, G., Ireton, G., Varani, G., Stoddard, B., and Baker, D. (2003)
Design of a novel globular protein fold with atomic-level accuracy. Science 302, 1364–
1368.
21
.CC-BY-NC-ND 4.0 International licensepeer-reviewed) is the author/funder. It is made available under aThe copyright holder for this preprint (which was not. http://dx.doi.org/10.1101/015438doi: bioRxiv preprint first posted online Feb. 19, 2015;

(17) Allen, B., and Mayo, S. (2006) Dramatic performance enhancements for the FASTER
optimization algorithm. Journal of Computational Chemistry 27, 1071–1075.
(18) Lutz, R., and Bujard, H. (1997) Independent and tight regulation of transcriptional
units in Escherichia coli via the LacR/O, the TetR/O and AraC/I1-I2 regulatory ele-
ments. Nucleic Acids Research 25, 1203–1210.
22
.CC-BY-NC-ND 4.0 International licensepeer-reviewed) is the author/funder. It is made available under aThe copyright holder for this preprint (which was not. http://dx.doi.org/10.1101/015438doi: bioRxiv preprint first posted online Feb. 19, 2015;