english assessment validity february 2012 michael orkin, jo ann phillips, hui zhang, sheryl queen...
TRANSCRIPT

English Assessment Validity February 2012
Michael Orkin, Jo Ann Phillips, Hui Zhang, Sheryl QueenOffice of Institutional Research
Peralta Community College District
1

English Assessment Test
• New Peralta students take assessment tests for placement in English classes.
• Course placement from test scores is recommended but not mandatory.
• A student can take courses without placement tests if prerequisites are met.
2

ACT Compass Test
• Peralta currently uses the ACT Compass test, CENG, for English placement.
• CENG tests English proficiency with separate writing and reading tests.
• This will soon change...
3

Statewide Online Assessment
• From Student Success Task Force, January, 2012:“… all students will have access to common online assessment tools for English, mathematics and ESL and to pre-testing programs that help improve assessment outcomes. They also will be able to take the results of their tests to any community college in the state.”
4

For now: ACT Compass TestPlacement in English Courses
A decision rule based on the two test scores selects an English course: • transfer level (English 1A)• degree applicable (English 201A)• Pre-collegiate (Basic Skills).
5

Placement in English Course
• If the writing score is less than 22, the student is not assessed into a course and must see a counselor.
• 699 students in the sample data had low writing scores and were excluded.
6

Data
• Students taking CENG-recommended English courses in Fall 2008, Spring 2009, Fall 2009, Spring 2010.
• Took test immediately preceding semester when they took English course.
• Never took test prior to semester when they took English course.
7

Validity
Validity measured in three ways:• Relationship between assessment scores and
grades.• Comparison of assessed and non-assessed.• Comparison of students who took the “right”
course (recommended by CENG) and “wrong” course (not recommended by CENG).
8

Assessed and Took Right Course
9
Courses Count %
Eng 1A 1571 57%
Eng 201A 593 21%
Basic Skills* 598 22%
TOTAL 2762 100%
* English 252AB, 267AB, 268AB, 269AB

Assessed - Grade %
10
A B C D F W
Eng 1A 28% 23% 12% 5% 8% 25%
Eng 201A 21% 19% 15% 9% 9% 27%
Basic Skills 23% 22% 16% 4% 10% 24%
ALL 25% 22% 13% 6% 9% 25%
Placement and Grades
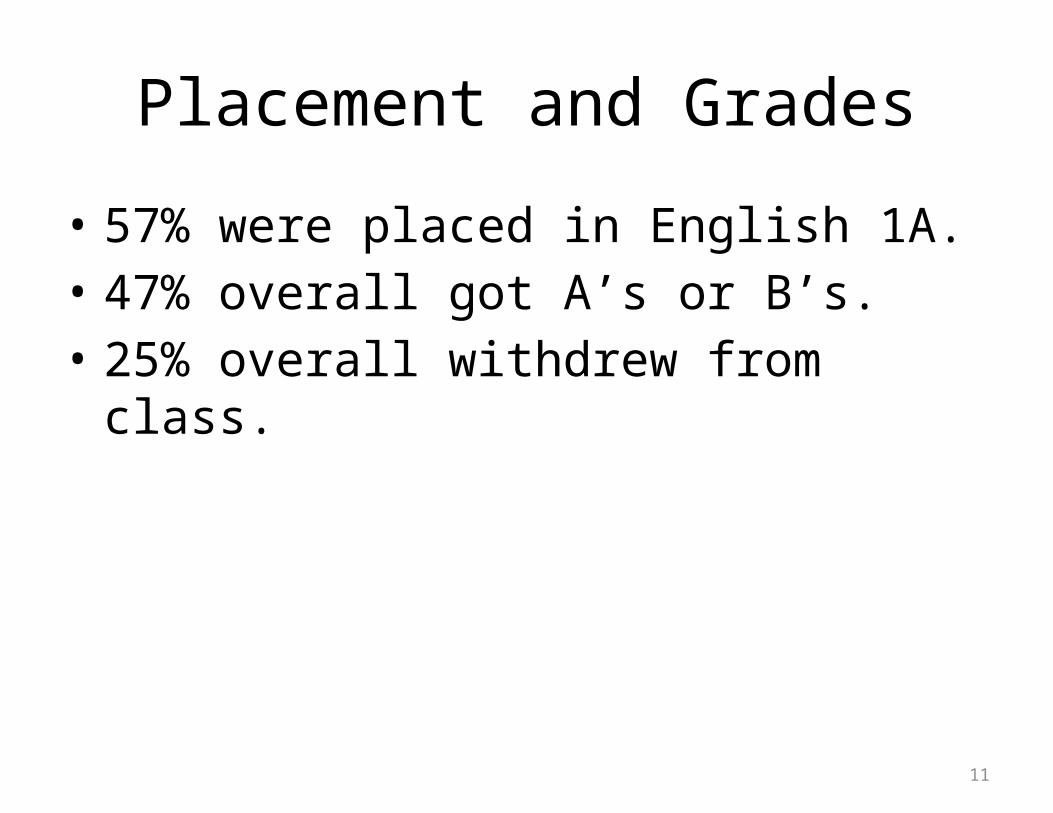
• 57% were placed in English 1A.• 47% overall got A’s or B’s.• 25% overall withdrew from class.
11

Grades vs. Test Scores
Are assessment test scores positively correlated with grades?
We use ANOVA (Analysis of Variance).
12
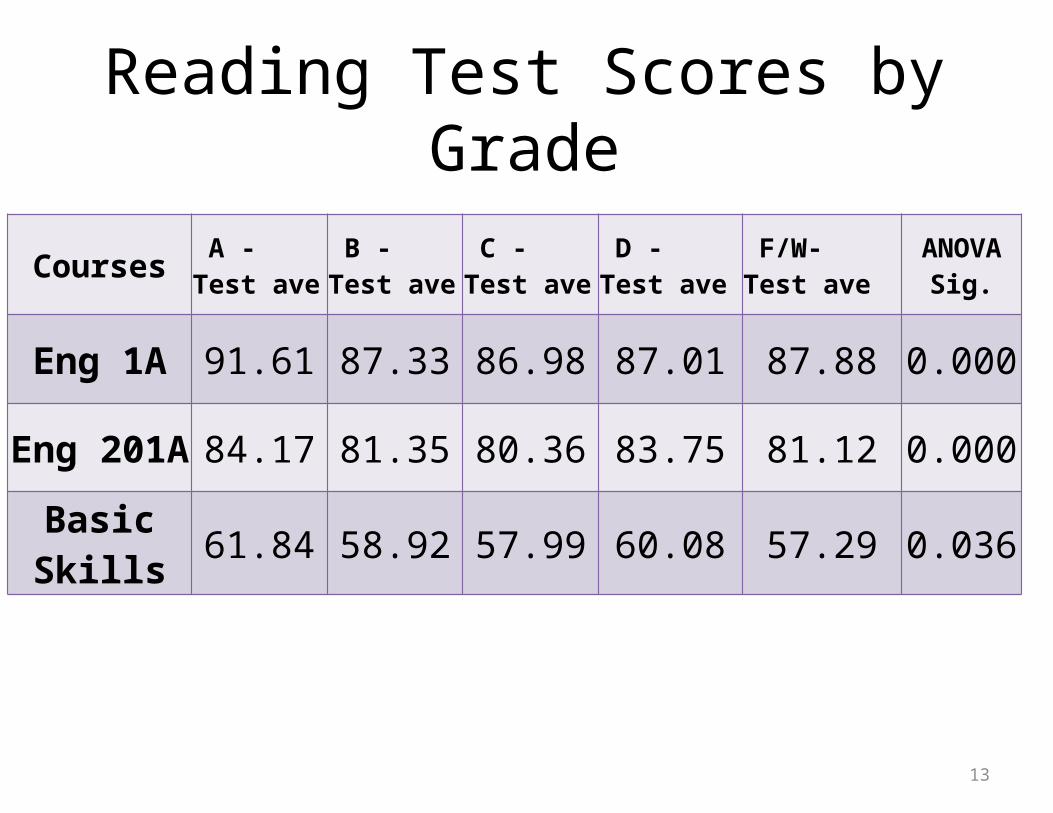
Reading Test Scores by Grade
13
Courses A - Test ave B - Test ave C - Test ave D - Test ave F/W- Test ave ANOVA Sig.
Eng 1A 91.61 87.33 86.98 87.01 87.88 0.000
Eng 201A 84.17 81.35 80.36 83.75 81.12 0.000
Basic Skills 61.84 58.92 57.99 60.08 57.29 0.036

All Test Scores by Grade
14
Courses ANOVA
Sig. ReadingANOVA
Sig. WritingANOVA
Sig. Combined
Eng 1A 0.000 0.000 0.000
Eng 201A 0.000 0.727 0.727
Basic Skills 0.036 0.170 0.481

Grades vs. Test Scores Analysis
• Reading test scores most sensitive to grades.• Students who get A’s have higher average
test scores than those who have lower grades.
• Writing test and Combined Tests only significant for English 1A.
15
Predicted Chance of Success
As test scores get higher, does predicted chance of success increase?
We use logistic regression.
16

Reading Test Predicted Chance of Success
17
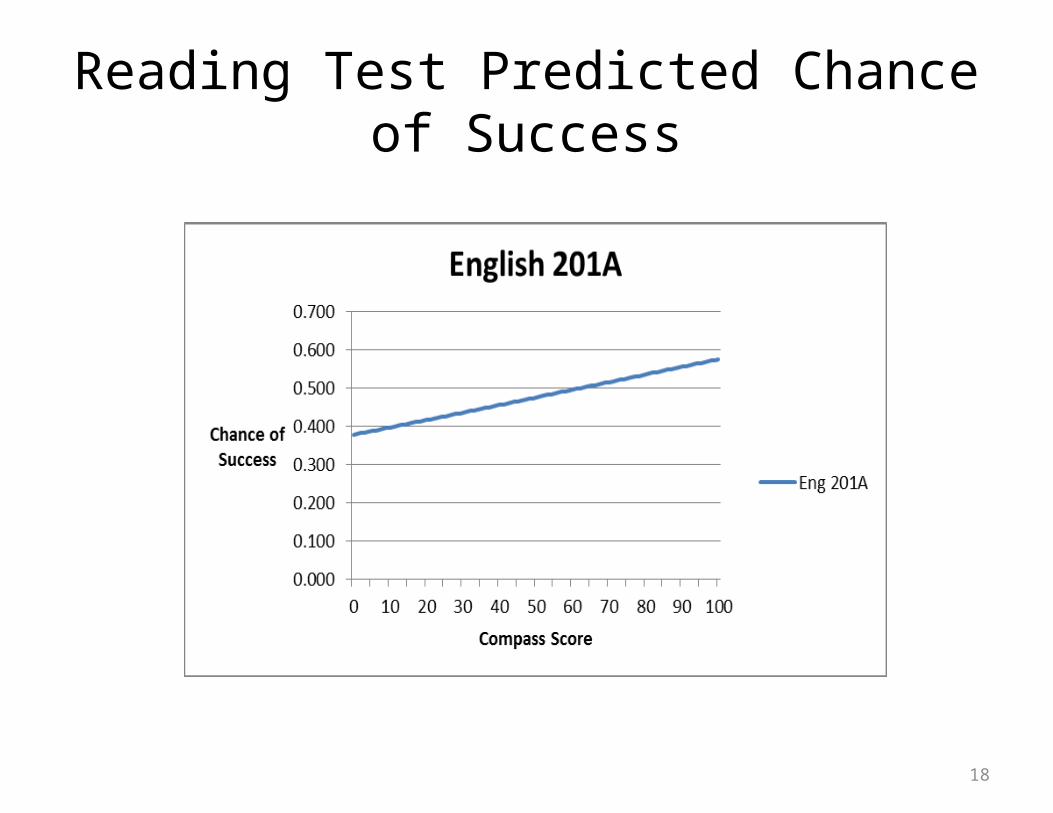
Reading Test Predicted Chance of Success
18

Reading Test Predicted Chance of Success
19
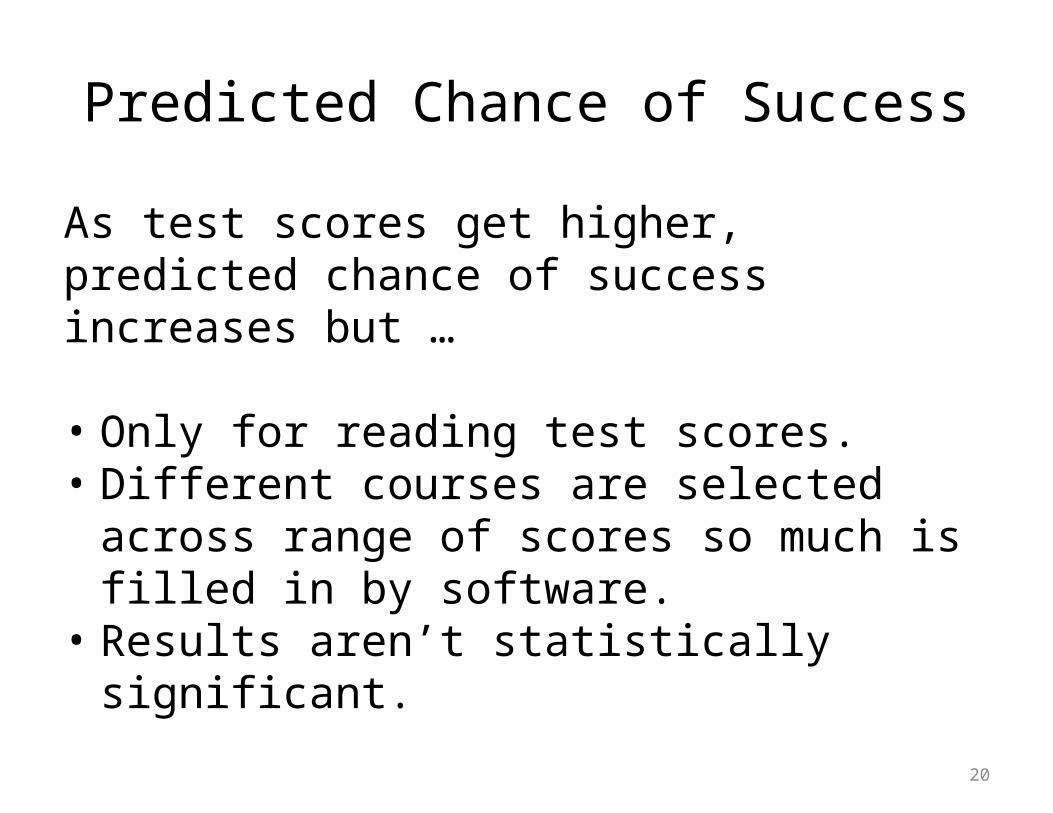
Predicted Chance of Success
As test scores get higher, predicted chance of success increases but …
• Only for reading test scores.• Different courses are selected across range of
scores so much is filled in by software. • Results aren’t statistically significant.
20
Assessment vs. No AssessmentDo assessed students do better in their assigned courses than students who don’t take the assessment test?
We use ANOVA and Chi Square tests.
21

Counts
22
Courses Assessed Not Assessed
Eng 1A 1571 1838
Eng 201A 593 621
Basic Skills* 598 727
TOTAL 2762 3186
* English 252AB, 267AB, 268AB, 269AB

Not Assessed - Grade % (Similar to Assessed)
23
A B C D F W
Eng 1A 25% 25% 15% 5% 6% 24%
Eng 201A 18% 18% 19% 9% 11% 25%
Basic Skills 21% 18% 13% 6% 10% 31%
ALL 23% 22% 16% 6% 8% 25%
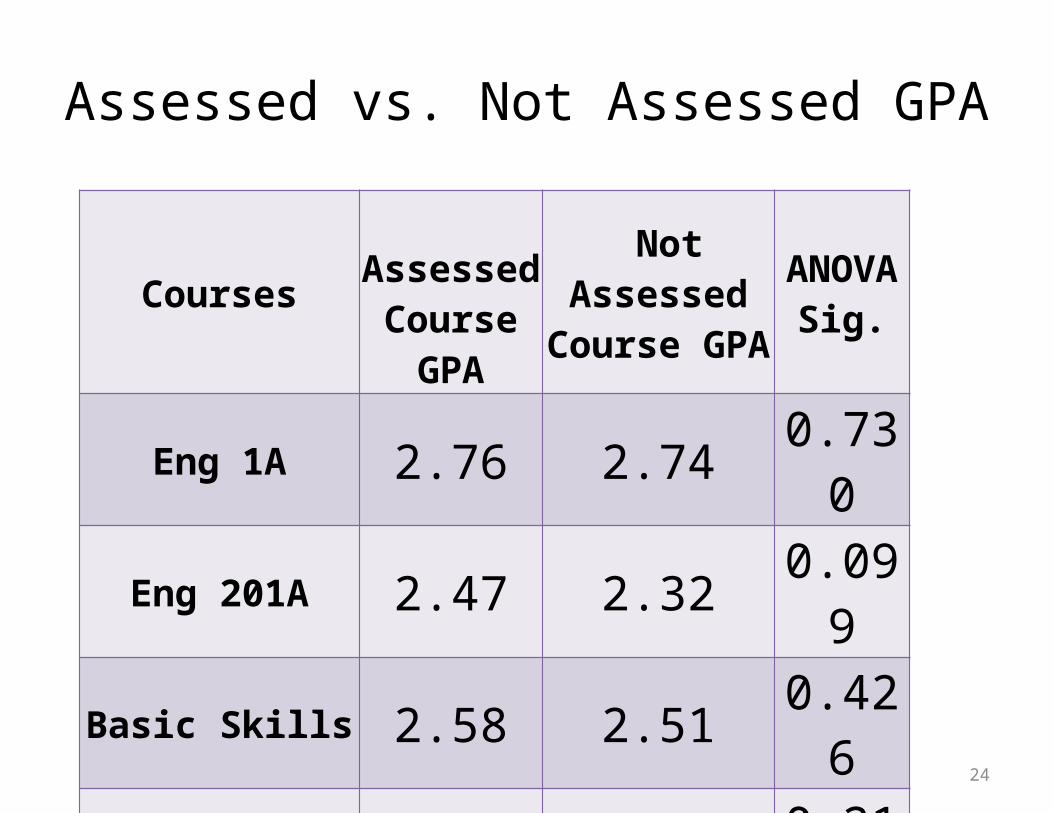
Assessed vs. Not Assessed GPA
24
Courses Assessed Course GPA
Not Assessed Course GPA
ANOVA Sig.
Eng 1A 2.76 2.74 0.730
Eng 201A 2.47 2.32 0.099
Basic Skills 2.58 2.51 0.426
TOTAL 2.61 2.66 0.212

Assessed vs. Not Assessed GPA
No significant results:• Students who are assessed have similar class GPA
as those who are not assessed.
25

Assessed vs. Not Assessed Success
26
Courses Assessed % Success
Not Assessed % Success
Chi-Square Sig.
Eng 1A 62% 65% 0.112
Eng 201A 55% 56% 0.795
Basic Skills 61% 53% 0.004
TOTAL 60% 60% 0.984

Success - Assessed vs. Not Assessed
Significant only at basic skills level:• Students who are assessed have greater success
than those who are not assessed.
27
Assessed – “Right” vs. “Wrong” Course
Do assessed students who take the right course do better than assessed students who take the wrong course?
We use Chi Square and ANOVA.
28

Counts - Right vs. Wrong Course
29
Courses Right Course Count
Wrong Course Count
% Right Course
Eng 1A 1571 378 81%
Eng 201A 593 479 55%
Basic Skills 598 127 82%
TOTAL 2762 984 74%

Success - Right vs. Wrong
30
Courses Right Course Success %
Wrong Course Success %
Chi Square Sig.
Eng 1A 62% 53% 0.001
Eng 201A 55% 52% 0.364
Basic Skills 61% 61% 0.932
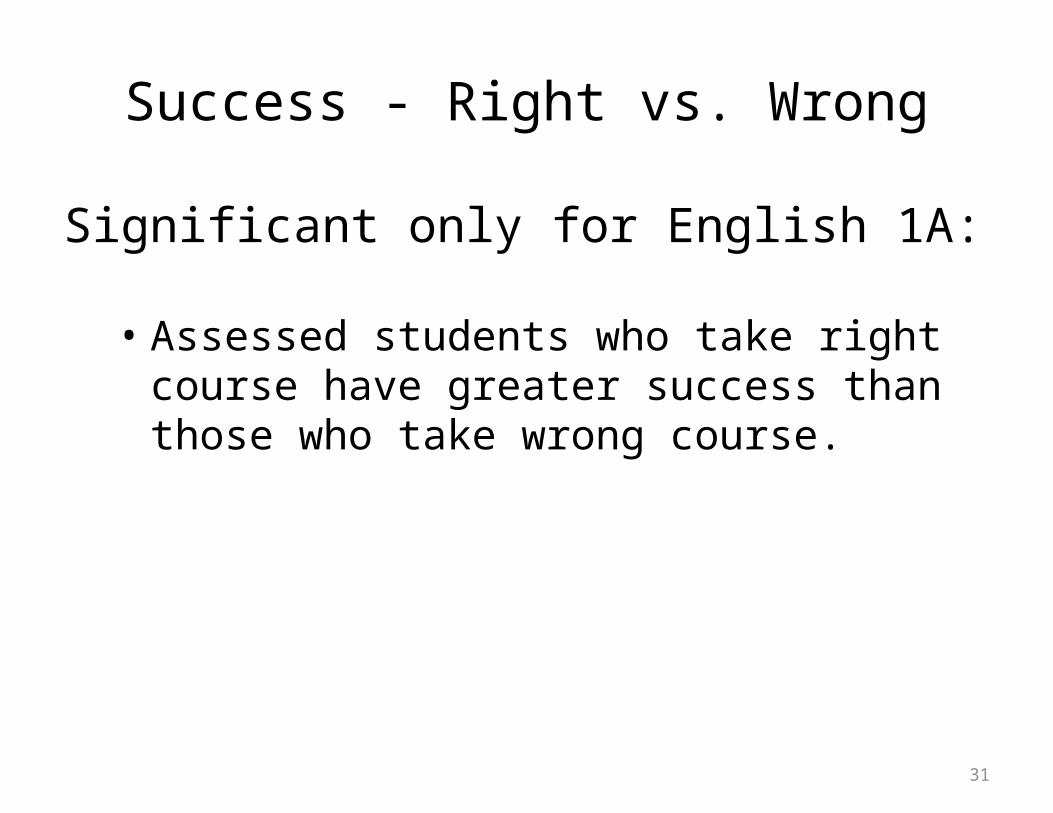
Success - Right vs. Wrong
Significant only for English 1A: • Assessed students who take right course have
greater success than those who take wrong course.
31
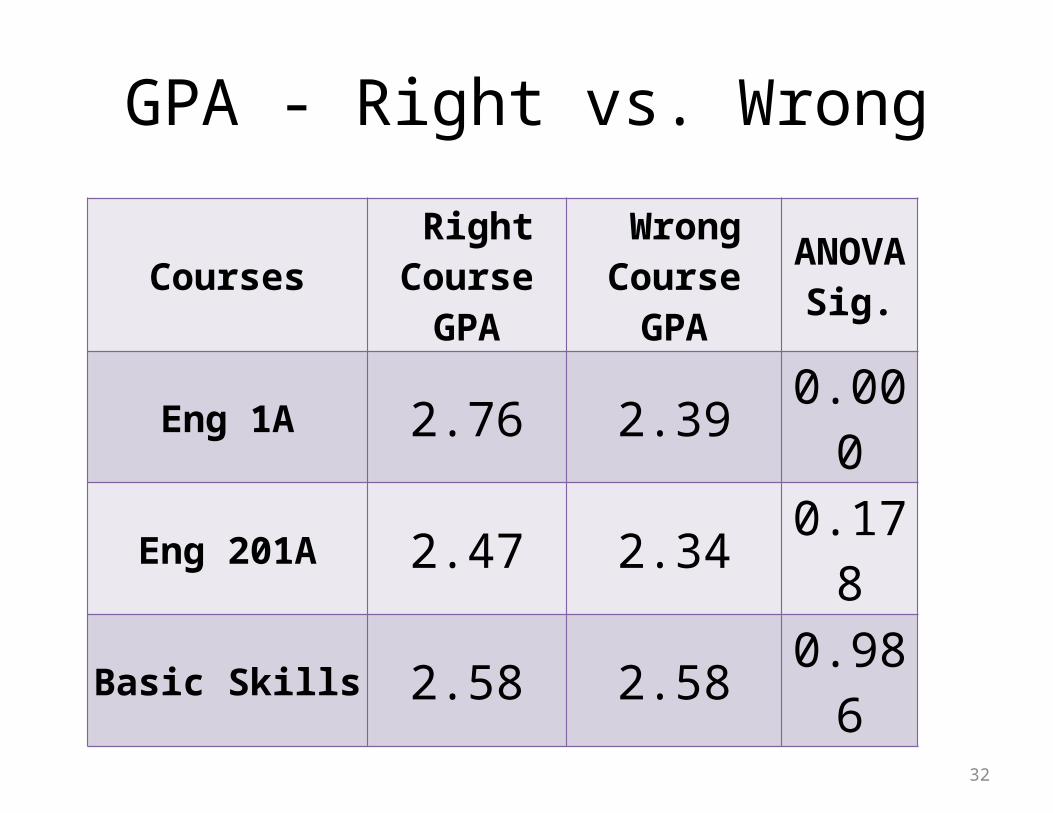
GPA - Right vs. Wrong
32
Courses Right Course GPA
Wrong Course GPA
ANOVA Sig.
Eng 1A 2.76 2.39 0.000
Eng 201A 2.47 2.34 0.178
Basic Skills 2.58 2.58 0.986
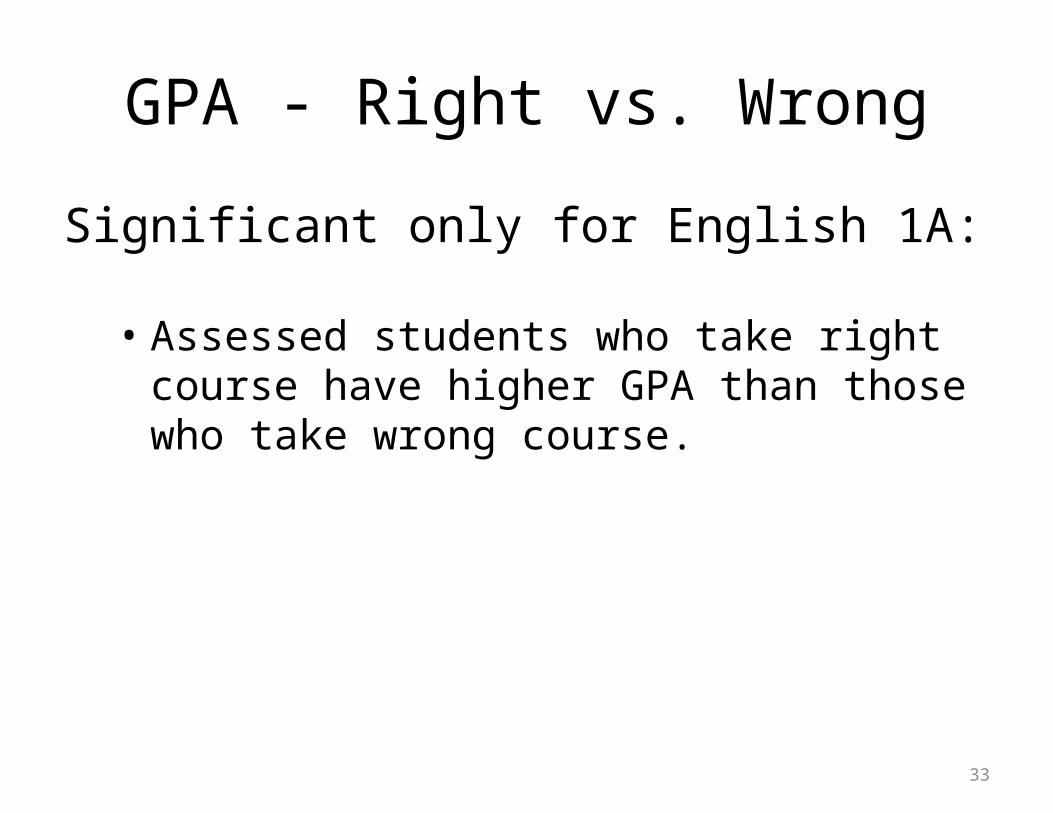
GPA - Right vs. Wrong
Significant only for English 1A: • Assessed students who take right course have
higher GPA than those who take wrong course.
33
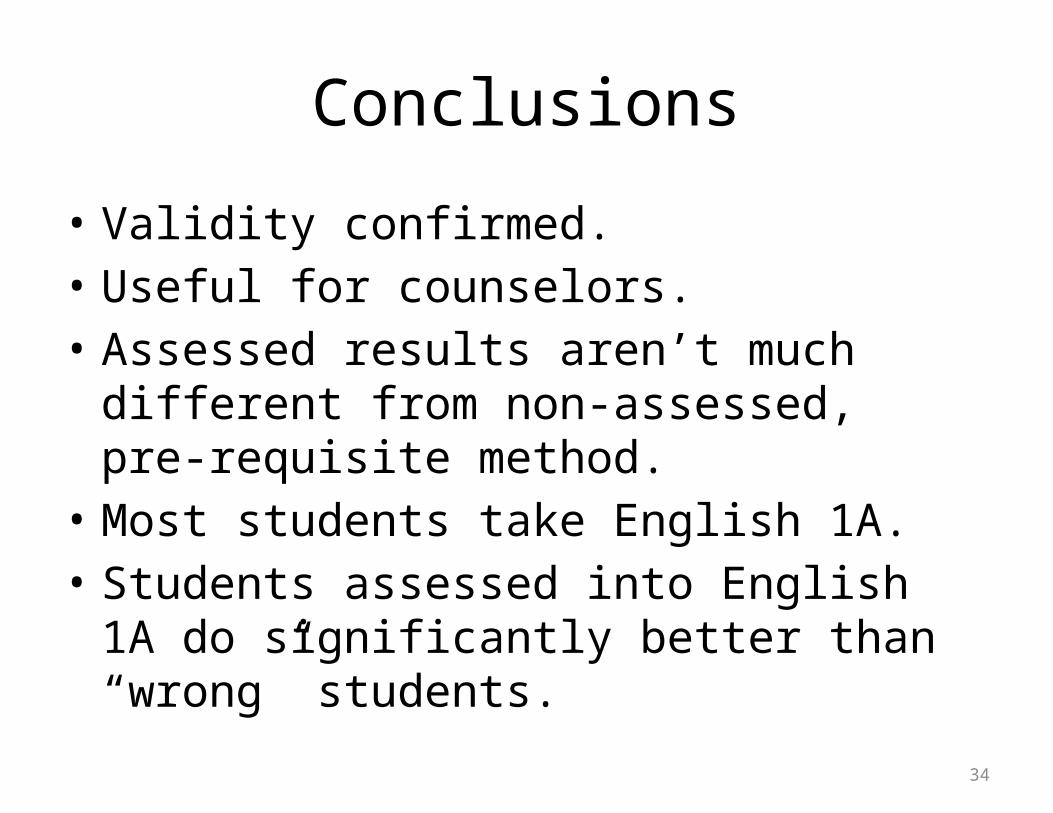
Conclusions
• Validity confirmed. • Useful for counselors.• Assessed results aren’t much different from
non-assessed, pre-requisite method.• Most students take English 1A.• Students assessed into English 1A do
significantly better than “wrong” students.
34