english department faculty of tarbiya and teacher training syarif
TRANSCRIPT

1
AN ERROR ANALYSIS ON STUDENTS' ENGLISH PRONUNCIATION
(A Case Study at the Seventh Year of Junior High School Students of SLTP
Muhammadiyah 17 Ciputat)
a ‘Skripsi’
Presented to the Faculty of Tarbiyah and Teacher’s Training
in Partial Fulfillment of the Requirements for the Degree of Strata-I
By :
Abdul Sukurilah
NIM. 103014026985
English Department
Faculty of Tarbiya and Teacher Training
Syarif Hidayatullah State Islamic University
Jakarta 2008
2
AN ERROR ANALYSIS ON STUDENTS' ENGLISH PRONUNCIATION
(A Case Study at the Seventh Year of Junior High School Students of SLTP
Muhammadiyah 17 Ciputat)
a ‘Skripsi’
Presented to the Faculty of Tarbiyah and Teacher’s Training
in Partial Fulfillment of the Requirements for the Degree of Strata-I
By :
Abdul Sukurilah
NIM. 103014026985
Approved by :
Drs. H. Nasifuddin Djalil, M.Ag
NIP. 150 244 682
English Department
Faculty of Tarbiya and Teacher Training
Syarif Hidayatullah State Islamic University
Jakarta
2008

3
Acknowledgement
In the name of Allah, the beneficent, the merciful
Praise is to Allah, lord of the worlds who has bestowed upon the writer in
completing this ' skrips'. Peace and Blessing be upon our prophet Muhammad
SAW, his families, his companions and his followers.
First of all the writer would like to thank Allah for completing this 'skripsi'.
His thank to his beloved Parents , Kosasih and Yuyun, for their irreplaceable
encouragement and unbreakable patience which have eased the writer to finish his
study. Throughout their life, they have been and still are ever ready to assist in
their various endeavors.
The writer also would like to give his gratitude to Drs. H. Nasifuddin Djalil,
M. Ag., his advisor in finishing this 'skripsi', for his wonderful guidance,
dedication, and support.
His gratitude also goes to :
1. Prof. Dr. Dede Rosyada as the Dekan of Faculty of Tarbiya and Teacher
training.
2. Drs. Syauki, M.Pd As the Head of English Department
3. Neneng M.Pd, as the secretary of English Department
4. Taufik Ibnu Hajar , S.Pd as the English teacher of SLTP Muhammdiyah 17
Ciputat for his help in conducting the research.
5. Ukie, Furkon, Kori, Apip, Rinal, Adin, Andi, Gofur, Rulie, Yanto, Jaelani,
Wahyu, Nisa, Laily, and my uncle Mang Abay for giving support and spirit to
the writer in completing his study
6. All of his friends that cannot be mentioned one by one who always help and
give the writer support, time and love and so remind him in accomplishing this
'skripsi'
Finally, the writer realizes that this 'skripsi' is not perfect yet, therefore the
writer would like to welcome and accept constructive suggestion and critism to
make this' skripsi' better.
Jakarta,May 23rd 2008
Writer
4
TABLE OF CONTENTS
ACKNOWLEDGEMENT
TABLE OF CONTENT
CHAPTER I. INTRODUCTION
A. The Background of Problem
B. The Identification of Problem
C. The Formulation of Problem
D. The significant of Study
E. Organization of Writing
CHAPTER II. THEORETICAL FRAMEWORK
A. Error Analysis
B. Pronunciation
CHAPTER III. RESEARCH METHODOLOGY AND FINDING
A. Research Methodology
1. Objective of Research
2. Place and time
3. Population and Sample
4. Method of Research
5. Instrument of Research
6. Procedure of Collecting the Data
7. Technique of Data Analysis
B. Research Finding
1. Data Description
2. Interpretation and Discussion
CHAPTER IV. CONCLUSION AND SUGGESTION
A. Conclusion
B. Suggestion
Bibliography
AppendiX

5
CHAPTER I
INTRODUCTION
A. Background of Problem
The advance of communication and transformation has motivated people to
learn a foreign language. As we know language is one of the tools of
communication that is necessary to be mastered. Even in the era of globalization,
the needs push people to master a foreign language, especially English language
as the international language is very needed by Indonesia to communicate with
each country.
Because of that English has become an essential subject of educational issues
in Indonesia recently. Starting from elementary up to students of university should
learn it. Via English language that they hoped to have the ability in English As a
matter of fact many young learner faces some difficulties to comprehend English
language as a second language it can be sure different from their mother tongue.
In conclusion, there are still so many problems in teaching learning English.
One of the problems of teaching English is Pronunciation as a component that
taught at the school. But, it does not mean that the teacher ignores other
components such as: Grammar, phonology, linguistic and culture as well as the
four basic skills: Listening, Speaking, Reading and Writing.
Pronunciation is also a very important language aspect to be mastered for
mastering language Component. It is impossible to learn a language without
mastering it. Because it is extremely large and varied. In English Pronunciation
there are some aspects that should be master, as Penny Ur said," The concept of
Pronunciation may be said to include: the sound of the language or phonology,
stress and rhythm, and intonation". It means that in learning Pronunciation we
should integrate four aspects as mention above.
Pronunciation is a way the language is spoken. It is the role for pronouncing
correctly based on the Received Pronunciation (RP). The students who master of
pronouncing the English words is used as a means usually it make better in
their speaking ability.

6
Meanwhile Error Analysis is a study about type and causes language error. It
tries to analyze by using systematic method in research. In language errors usually
exist in language skills and language knowledge. As we know language skills are
namely: Listening, Speaking, Reading and Writing. While, language knowledge
are: Pronunciation, Grammar and Vocabulary. Errors can be caused by
interference and Interlingua.
Based on the explanation above the writer would like to identify a problem in
the title “An Error Analysis on Students' English Pronunciation" the writer will
observe and identify the errors in Pronunciation test of the seventh grade SLTP
Muhammadiyah 17
.
B. The Identification of Problem
There are many factors that can cause the problems of English Pronunciation.
The problems can be identified as follow: 1). What errors do the students make
in sounds of language ?, 2). What errors do the students make in stress ?, 3).
What errors do the students make in rhythm ?, 4). What errors do the students
make in intonation ? Etc.
There are many problems that can be identified in relation to English
Pronunciation . However the writer limits them only on the errors of students’
English Sounds.
C. Formulation of Study
The problem of this study can be formulated as follow: what errors do the
students make in pronouncing the English words?
D. Significance of Study
In line with the statement of the problems, the use of the study is as follows:
1. The Teacher
The result of this research is expected to be a useful input for the English
teachers to improve students' Pronunciation.
2. The Students

7
The result of this research is expected to be useful input for the students to
encourage them to master and improve their English Pronunciation
3. The Headmaster
The result of this research is expected to be a useful input for the headmaster
to make a policy related to the English teaching and learning process in the
classroom especially in increasing the students' Pronunciation.
F. Organization of Skripsi
This Skripsi consists of Five Chapters. Chapter one is Introduction, which
consists of Background of Study, Limitation and Formulation of Study, The Use
of Study, the Method of Research, and Organization of Study.
Chapter two is Theoretical Framework consists of three sub theme , namely :
1). Error which included : Definition of Error ,Causes of Error, Types of Error.
2). Pronunciation which included: Definition of Pronunciation, and aspects of
Pronunciation
Chapter three is Research Methodology and Finding, which is included the
Place and time ,Population and Sample, Technique of Data Collecting, instrument
of Research , Technique of Data Analysis, Data Description, Analysis of Data,
Interpretation and Discussion
Chapter four is conclusion and suggestion.
8
CHAPTER II
THEORETICAL FRAMEWORK
A. Error Analysis
1. Concept of Error Analysis
Human learning is fundamentally a process that involves the making of
mistakes and errors. Error analysis is a very effective way of developing self-
correcting skills. The word of Error Analysis consists of two words namely :
Error and Analysis. Error in this case like a mistake but different. Etymological
“Error is something done wrong, while Analysis is a study of a planned complex
series of procedures to decide the quickest”1.Terminological Error Analysis is
based on the assumption that the product is still sufficiently regular to enable us to
make generalization about the systems, and this assumption seems to have been
justified in practice “2. Error Analysis is especially helpful for those who have
difficulties 'seeing' their errors, such as those with visual processing difficulties,
but it will help any learner because it can be used to focus on specific difficulties.
It helps to structure work with the learner by giving selective practice.Error
Analysis refers to observe, analyze, and classify the problems caused by errors or
mistakes. According to H. Douglas Brown:
“The fact that learners do make errors and that these error can be observed, analyzed, and classified to reveal something of the system operating within the learner, led to a surge of study of learners’ errors, called Error analysis. Error analysis became distinguished from contrastive analysis by its examination of errors attributable to all possible sources, not just those which result from negative transfer of the native languages.”3
From the statement above error Analysis is a parameter to analyze errors and
mistake in systematic method. It can be done by making identification and
1 As Hornby, Oxford Advanced Learner’s Dictionary of Current English, (Oxford : Oxford University Press, 1974), p. 29 2 William T. Little wood, Foreign and Second Language Learning, ( Cambridge : Cambridge University Press, 1984) p. 32 3 H. Douglas Brown, Principle of Language Learning and Teaching, (San Francisco State University: Prentice Hall Regents Englewood Cliffs, 1994), P. 206
9
description of error. Identification in this case is to identify the source of error,
and description of error is to describe the error more clearly.
2. Error versus Mistake
In order to analyze learner language in a best way, it is essential to make a
distinction between Mistakes and errors. There are many terminologies about
Mistake and Error from expert of language, for instance opinion from H. Douglas
Brown, he said: “A mistake refers to a performance error that is either a random
guess or slip, in that it is a failure to utilize a known system correctly. An error is
a noticeable deviation from the adult grammar of a native speaker, reflecting the
Interlingua competence of the learner.”4
More clear peter Hubbard et.al give a distinction between Mistakes and Errors,
they said:.
“Now we will have to make a distinction between genuine errors caused by lack of knowledge about the target language(English) or by incorrect hypotheses about it, and unfortunate mistakes caused by temporary lapse of memory, confusion, slips of the tongue and so temporary lapses of memory, confusion, slips of the tongue and so on.”5
He explains that the more crucial distinction between Error and mistake
focuses in making the correctness, if the students can correct himself it is a
mistake, but if not, it is a error. So do William T. Little wood has same
perspective with him, he said “errors are signs of learning failure and, as such, not
to be willingly tolerated”.
From the statement above it can be elaborated that there is significant
differences between Error and Mistake. Error is something that can not be
tolerated or can be revised, whereas the Mistake the bad condition that can be
tolerated and can be revised.
4 H. Douglas Brown, Principle of Language Learning and Teaching……P. 205 5 Peter Hubbard, A Training Course for TEFL, (Oxford : Oxford University Press, 1983)P. 134
10
3. Source of Error
A source of error is a limitation of a procedure or an instrument that causes an
inaccuracy in the quantitative results of an experiment. A human error is not
considered a source of error under this definition. Students should strive to
identify, understand, and limit sources of error in their procedures whenever
possible. Source of Error is the final step in the analysis of the learner speech. By
trying to identify sources of error we can begin at an understanding of how the
learner’s cognitive and affective self relates to the linguistic system and to
formulate an integrated understanding of the process of second language
acquisition.
a. Mother – Tongue interference
Although young children appear to be able to learn a foreign language quite
easily and to reproduce new sounds very effectively. But most older feel
difficulty in learning foreign language. They will find the difficulty in sound and
grammar because their mother tongue influences them.
b. Overgeneralization
The majority of intralingua errors are instances of the same process of
overgeneralization that has been observed in first language acquisition.
Generalization is a fundamental learning strategy in all domains not only in
language. In order to make sense of these categories, we construct ‘rule’ which
predict how the different items will behave. Overgeneralization will cause wrong
prediction because we suspect something generally. For example:
“From the non –linguistic world we allocate a certain group of animals to the category ‘bird’ and learn that they share various features of behavior, including the habit of flying. When we encounter a new kind of bird, our ‘rule’ enables us to assume that it will have the same habit. If the bird happens to be a penguin, however, this assumption will be an error. We will have over generalized our rule and must now learn a exception”6
6 William T. Littlewood, Foreign Language and Second Language Learning, ( Cambridge: Cambridge University Press, 1984) p. 23
11
c. Transfer
Transfer and overgeneralization are not distinct process. Transfer is the learner
uses his pervious mother- tongue experience as a means of organizing the second
language data. While overgeneralization as mentioned above that the rule which is
caused the wrong prediction.
d. Context of Learning
A fourth major source of error is context of learning. Context refers to the
classroom with its teacher and its materials in the case f school learning or the
social situation in the case of untutored second language learning.
4. Methodology of Error Analysis
The word methodology always rises in scientific paper. It comes from the
words method. Its mean "set of methods used in working at something".7 There
are three steps in the process of Error Analysis namely: "Identification,
Description and Explanation”8. According to H. Douglas Brown: "the first step in
the process of Analysis is Identification and description of errors and the next step
is to describe it adequately"9.
In the step of Identification of error we identify the errors which are done by
the learners in the achievement of test. The errors of students test is identified
In the step of Description. In this step the writer classify on each item based
on the errors. Frequency of errors and selection of errors.
The last is explanation, in this step the writer tries to explain why the errors
happen. He sees the highest percentage which is done by the students.
7 As Hornby, Oxford Advanced Learners' Dictionary of Current English, (New York : Oxford University Press, 1974) p. 533 8 J.P.B Allen & S.Pit Corder , Technique in Applied Linguistics ( London : Oxford University Press, 1974)Vol. 3 p.126 9 H. Douglas Brown, Principle of Language Learning and Teaching, (San Francisco State University: Prentice Hall Regents Englewood Cliffs, 1994), p.208

12
Pronunciation
Pronunciation is included in language knowledge. It is a study about the way a
word or a language is usually spoken and the manner in which someone utters a
word. So, Pronunciation influences in speaking ability. if the students master the
standard pronunciation namely : Received Pronunciation (British) or General
America (USA) automatically their speaking is better. People understand what
they pronounce and their language is pleasant to listen to.
Pronunciation is part of phonological study. According to Martha C.
Pennington:
“English phonology is a description of the sounds of English and their relationships and contrasts with each other. More concretely, we can view the phonology of English- or of any language or language variety – as the pronunciation patterns of those who speak it. Additionally phonology can be described as the study of sound patterns of languages or of the pronunciation patterns of speakers.”10
From the explanation above phonology learn about the sound patterns of
language and the pronunciation pattern of speakers. So, the question how do the
sound patterns of languages change over time? Or what are the similarities and
differences in the sound pattern of language?
According to Penny Ur : “ the concept of pronunciation may be said to
include : 1). The sound of the language , or phonology, 2). Stress and rhythm and
3). Intonation”11
1. Sound
One of the aspects pronunciation is Sound Sounds are heard. It is included in
Phonology study. The number of speech sounds in English varies from dialect to
dialect, and any actual tally depends greatly on the interpretation of the researcher 10 Martha C. Pennington, Phonology in English Language Teaching : An International Approach, (New York: Addison Wesley Longman Limited, 1996), p.1 11 Penny Ur, A Course in Language Teaching,(Cambridge: Cambridge University Press, 1996), p. 47

13
doing the counting. As we know sound (speech sound) is classified into two
categories namely: a). Consonant, and b). Vowel
a). Consonant Sound
Consonant sounds usually are usually breathed and others are voiced.
“Consonant include: 1). All breathed sounds, 2). All voiced sounds formed by
means of an obstruction in the mouth, 30. all those in which there is a narrowing
of the air passage giving rise to a frictional noise, and 4). Certain sounds which
are gliding”12.
There are 24 consonants in English, namely13 :
1. p – pig 9. s – sea 17. m – man
2. b – book 10. z – zoo 18. n – now
3. t – tea 11. ʃ-she 19. ŋ – sing 4. d – day 12. ʒ - azura 20. h – how
5. k – key 13. tʃ - chair 21. I – like
6. g – go 14. dʒ - jail 22. r – right
7. f – fine 15. θ – thin 23. w – wait 8. v – very 16. ð – this 24. j – you
According to the place of articulation the consonant is divided into14 :
1. Bilabial Plosive /p,b/
2. Alveolar Plosive /t,d/
3. Velar Plosive /k,g/
4. Palato – Alveolar Affricatives / tʃ, dʒ/
5. Labio – Dental Fricatives /f,v/
6. Dental Fricatives / θ, ð/
7. Alveolar Fricatives /s,z/
8. Palato- Alveolar Fricatives/ ʃ, ʒ/
9. Glottal Fricatives /h/
12 Daniel Jones, The Pronunciation of English, (Cambridge : Cambridge University Press, 1956), p. 12 13 M.I. Indriani, English Pronunciation, (Jakarta : P.T. Gramedia Pustaka Utama, 2001), p. 8 14 M.I. Indriani, English Pronunciation ………P. 8
14
10. Bilabial Nasal /m/
11. Alveolar Nasal /n/
12. Velar Nasal / ŋ/ 13. Lateral /I/
14. Post Alveolar Frictionless Continuant/r/
15. Unrounded Palatal Semi- Vowel /j/
16. Labio – Velar Semi Vowel /w/
b.) Vowel Sound
Vowel sound is “sustainable vocal sound made without audible stopping
the breath, or friction in its passage out through the mouth”15. In the production of
vowels the tongue is held at such a distance from the roof of the mouth that there
is no perceptible frictional noise. There are 12 cardinal vowels in English and 9
Diphthongs, they are16 :
Cardinal Vowel
1. i: - tea 7. ɑː - art
2. ɪ - sit 8. ʌ - up
3. e – pen 9. u: - food
4. æ – sad 10. ʊ - foot
5. ɜ: - bird 11. ɔ: - war
6. ə - ago 12. ɒ - not Diphthongs
1. a ɪ - like 6. ɜ ə - care
2. e ɪ - day 7. ɔ ə - more
3. ɔ ɪ - boy 8. ɒ ʊ - down
15 As Hornby, Oxford Advanced Learner’s Dictionary of Current English, (Oxford : Oxford University Press, 1974) p. 961 16 M.I. Indriani, English Pronunciation ………P.12
15
4. ɪ ə - hear 9. ə ʊ - show
5. ʊ ə - door
2. Stress
Word stress is the key to understanding spoken English. Native speakers of
English use word stress naturally. Word stress is so natural for them that they
don't even know they use it. Non-native speakers who speak English to native
speakers without using word stress they find it difficult to understand native
speakers, especially those speaking fast and the native speakers may find it
difficult to understand them. Stress is phonemic in English. For example, the
words desert and dessert are distinguished by stress, as are the noun a record and
the verb to record. Stressed syllables in English are louder than non-stressed
syllables, as well as being longer and having a higher pitch. They also tend to
have a fuller realization than unstressed syllables.
3. Rhythm
As we know rhythm is “regular succession of weak and strong stresses, accents,
sounds or movements in speech, music, dancing, etc.)”17 . English speech rhythm
is characterized by tone – units a word or group which carries one central stressed
syllable. If, there are any, are lightened.
4. Intonation
Intonation is “an important aspect in pronunciation of English”18. The
rises and falls in tone that make the tune of an utterance. Intonation is “the rise
and fall of the pitch of the voice in speaking”19. In other words intonation is a
17 As Hornby, Oxford Advanced Learner’s Dictionary of Current English, (Oxford : Oxford University Press, 1974) p. 729 18, Penny Ur, A Course in Language Teaching,(Cambridge: Cambridge University Press, 1996), p.49 19 As Hornby, Oxford Advanced Learner’s Dictionary of Current English, (Oxford : Oxford University Press, 1974) p. 448

16
piece of utterance, a continuous stream of sounds, bounded by a fairly perceptible
pause. Pausing in some sense is a way of packaging the information.

17
CHAPTER III
RESEARCH METHODOLOGY AND STUDY FINDING
A. Research Methodology
1. Objective of Research
This study aims at investigating the students’ pronunciation at the seventh
grade of Private Junior High School Muhammadiyah 17 Ciputat.
2. Place and Time
The research is at SLTP Muhammadiyah 17 Rempoa which is located at
Rempoa, Ciputat Timur, Tangerang Banten. The writer held the research from
30 July to 30 December 2007.
3. Population and Sample
The population of this research is 147 students from 3 classes namely :
class 7.A, 7.B, 7.C, and 7.D.
In this research the writer takes sample 17% from 147 students and the writer
uses simple random sampling.
4. Method of Research
The method of study is Error Analysis . In doing this study, the writer
conducts field research to collect the data. The writer carried out the field
research at SLTP Muhammdiyah 17. The instrument of the research is
administering test and recording student’s voice. Then, the data are
elaborated and analyzed by using descriptive method. The theory of an error
analysis material is gathered by using library study.

18
5. Instrument of Research
To obtain the data research in this research, the writer used pronunciation
test. The test consists of 216 items. (See the appendix)
6. Procedure of Collecting the Data
In collecting the data of English Pronunciation the writer uses these
procedures:
First step is process of Identification, in this step the items are classified
into each type of skill area. The frequency of errors of each items were
calculated.
After classifying the errors, the next is describing the errors and explaining
why it exists.
The last, he describes the sequence of skill area based on the highest
frequency of errors.
7. Technique of Data Analysis
The technique of data analysis that used in this research is Percentage. The
formula used to analyze the data is:
P = F x 100
N
P= percentage
F = Frequency
N = number

19
After he has percentage and frequency, then he calculated the Mean by using
formula:
Mean = SF. X
N
B. Research Finding
1. Data Descriptions
The writer uses pronunciation test to collect the data in this research. The test
is about consonant sound and vowel sound. The data is as follows:
Table 1
Pronunciation Test and Each Item
No Pronunciation Area Number of Items
1 Bilabial Plosive 1,2,3,4,5,6,7,8,9,10
2 Alveolar Plosives 11,12,13,14,15,16,17,18,19,20
3 Velar Plosive 21,22,23,24,25,26,27,28,29,30
4 Palato- Alveolar Affricative 31,32,33,34,35,6,37,38,39
5 Labio – Dental Fricatives 40,41,42,43,44,45,46,47,48,49
6 Dental Fricatives 50,51,52,53,54,55,56,57,58,59
7 Alveolar Fricatives 60,61,62,63,64,65,66,67,68,69

20
8 Palato – Alveolar Fricatives 70,71,72,73,74,75,76,77,78,79
9 Glottal Fricatives 80,81,82,83,84
10 Bilabial Nasal 85,86,87,88,89
11 Alveolar Nasal 90,91,92,93,94
12 Velar Nasal 95,96,97,98,99
13 Lateral 100,101,102,103,104
14 Post – Alveolar Frictionless
Continuant
105,106,107,108,109
15 Post- Alveolar Frictionless
Continuant
105,106,107,108,109
16 Unrounded Palatal Semi- Vowel 110,111,112,113,114
17 Labio – Velar Semi Vowel 115,116,117,118,119
From the table 1 we can see that there are seventeen pronunciation areas (see
the table) and 118 number items of the test. Each pronunciation area has various
numbers of items, namely: the first is Bilabial Plosive has ten items, Alveolar
Plosives has ten items , Velar Plosive has ten items , Palato- Alveolar Affricative
has ten items , Labio – Dental Fricatives has ten items , Dental Fricatives has ten
items , Alveolar Fricatives has ten items , Palato – Alveolar Fricatives has nine
items , Glottal Fricatives has five items , Bilabial Nasal has five items , Alveolar
Nasal has five items , Velar Nasal has five items , Lateral has five items , Post –
Alveolar Frictionless Continuant has five items , Unrounded Palatal Semi- Vowel
has five items , Labio Velar Semi Vowel has four items.
Table 2
No Pronunciation Area Number of Items
1 Sound i: 119,120,122,123,
2 Sound / ɪ 124,125,126,127
3 Sound / e 128,129,130

21
4 Sound /æ 131,132,133,134,135
5 Sound/Λ 136,137,138,139,140
6 Sound / ɑː 141,142,143,144,145
7 Sound / ɒ 146,147,148,149,150
8 sound / ɔ: 151,152,153,154,155
9 Sound / ʊ 156,157,158,159,160
10 Sound /u: 161,162,163
11 Sound/ ɜ: 164,165,166,167,168
12 Sound /ə 169,170,171,172,173
13 sound / e ɪ 174,175,176,177,178
14 sound / a ɪ 179,180,181,182,183
15 sound ɔ ɪ 184,185,186,187,188
16 sound /əu 189,190,191,192,193
17 Sound /au 194,195,196,197,
18 Sound /iə 198,199,200,201,202
19 sound / ɪ ə 203,204,205,206
20 Sound /uə 207,208,209,210,211
21 sound / ɔ ə 212,213,214,215,216
We can see on the table that there are twenty one pronunciation areas of vowel
sound and 98 number items of the test. In Sound i: there are four items , in
Sound / ɪ there are four items ,in Sound / e there are three items , in Sound /æ
there are five items , in Sound/Λ there are five items , in Sound / ɑː there are
five items , in Sound / ɒ there are five items , in sound / ɔ: there are five items
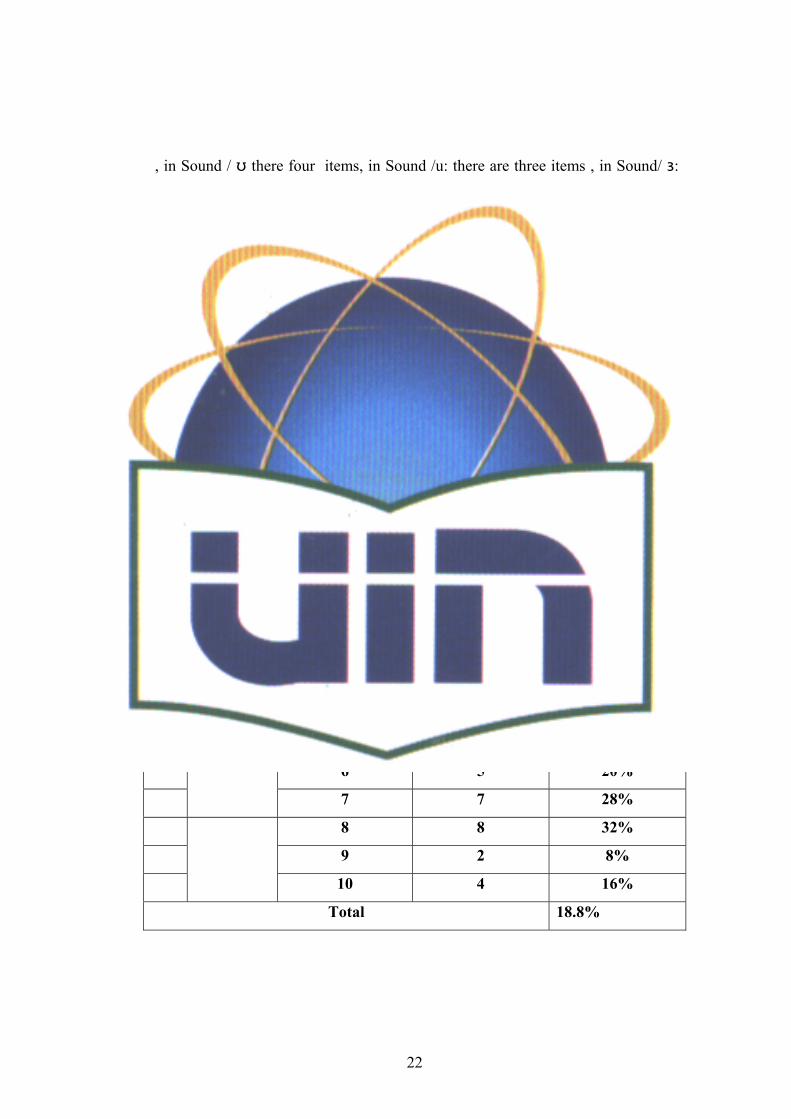
22
, in Sound / ʊ there four items, in Sound /u: there are three items , in Sound/ ɜ:
there are five items , in Sound /ə there are five items ,in sound / e ɪ there are
five items , in sound / a ɪ there are five items ,in sound ɔ ɪ there are five
items , in sound /əu there are five items, in Sound /au there are four items , in
Sound /iə therse are five items ,in sound / ɪ ə there are four items ,in
Sound /uə there are five items , in sound / ɔ ə there are five items.
The following are the explanations of each pronunciation area of vowel sound
and consonant sound:
Table 3
Frequency Error of Sound bilabial plosive
No Sound
Area Item Number
Frequency of
Error
Percentage of
Error
1 Bilabial
Plosive
1 5 20%
2 4 16%
3 6 24%
4 3 12%
5 3 12%
6 5 20%
7 7 28%
8 8 32%
9 2 8%
10 4 16%
Total 18.8%
23
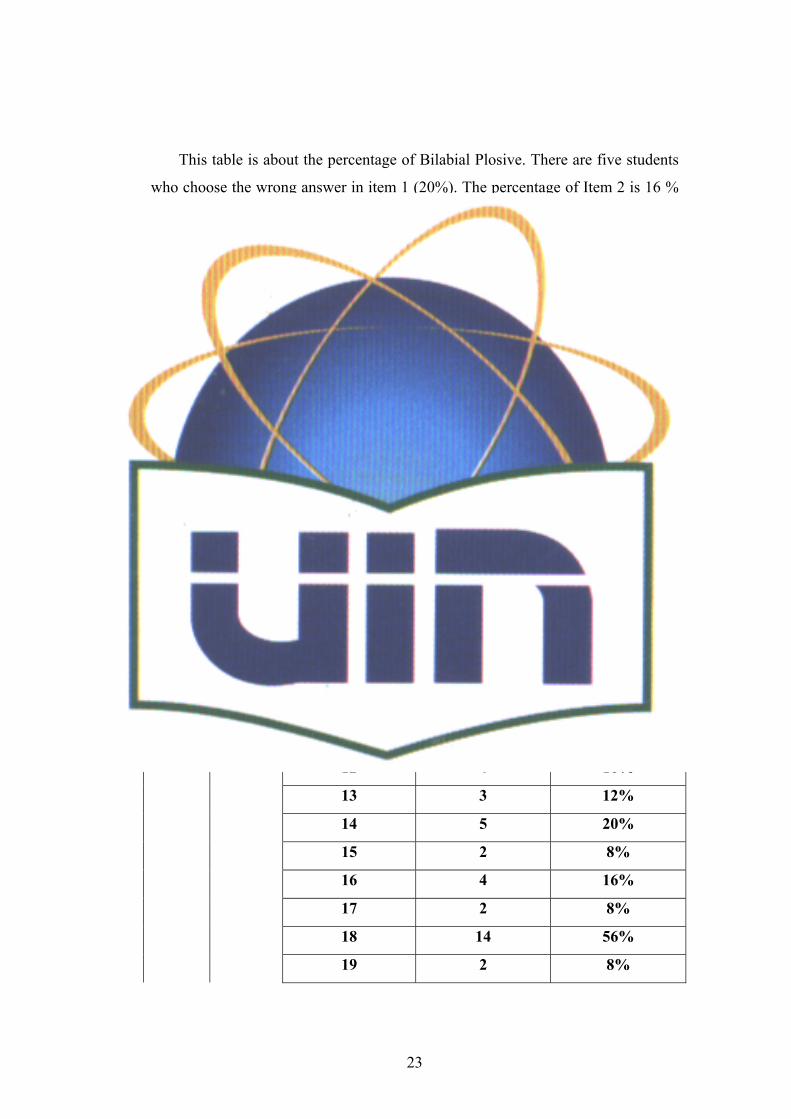
This table is about the percentage of Bilabial Plosive. There are five students
who choose the wrong answer in item 1 (20%). The percentage of Item 2 is 16 %
there are four students who choose the wrong answer. The percentage of Item 3 is
24 % there are six students choose the wrong answer. There are three students
who wrong in Item 4 with the percentage 12%, so do the Item Number five there
are three students with the same percentage. In Item six there are five students
who get wrong answer with the percentage 20%. In Item seven there are seven
students who pronounce the wrong word with the percentage 28%. In Item 8 there
are eight students who get wrong answer with the percentage 32%. It is the
highest percentage. In item 9 there are two students who get the wrong answer
with the percentage 8%, and the last the item number 10 there are four students
get who wrong answer with the percentage 16, 6%, so, the average of all
percentage is 18, 8%.
Table 4
Frequency Error of Sound Alveolar Plosives
No Sound
Area Item Number
Frequency of
Error
Percentage of
error
2 Alveolar
Plosives 11 4 16%
12 4 16%
13 3 12%
14 5 20%
15 2 8%
16 4 16%
17 2 8%
18 14 56%
19 2 8%

24
20 5 20%
Total 16.4%
This table explains about Alveolar Plosive. In item 11, 12, 16 there are four
students who get wrong answer with the percentage 16%. So do in item number
15,17, and 19, the students get 8% from the wrong answer. In item 13 there are
three students get wrong answer with the percentage 12%. In item 14 there are
five students who get wrong answer with the percentage 20%. In item 18 there are
14 students who get wrong answer with the percentage 56%. It is the highest
percentage. And the last there are five students who get wrong answer in item
number 20 with the percentage 20%
Table 5
Frequency Error of sound Velar Plosive
No Sound
Area Item Number
Frequency of
Error
Percentage of
Error
3 Velar
Plosive
21 0 0
22 6 24%
23 4 16%
24 2 8%
25 6 24%
26 4 16%
27 7 28%
28 5 20%
29 4 16%
30 7 28%
Total 18%
In the item 21 all of the students answer the right answer, it because the word
is familiar for them. While in item 23, 26, and 29 the students get the wrong

25
answer four answers with the percentage 16%. In item 22 and 25 the students get
six from wrong answer with the percentage 24%. In item 22 the students get two
from wrong answer with the percentage 8% it is the lowest answer. In item27 and
30 the students get seven answers from the wrong answer with the percentage
28%. And the last the item 28 the students get five from the wrong answer with
the percentage 20% .so, the average is 18% from the error Questions.
Table 6
Frequency Error of Sound Palato- Alveolar Affricative
No Sound
Area Item Number
Frequency of
Error
Percentage of
Error
4
Palato –
Alveolar
Affricative
31 4 16%
32 4 16%
33 7 28%
34 4 16%
35 6 24%
36 2 8%
37 3 12%
38 4 16%
39 3 12%
Total 16.4%
There are same percentage (16%) in item 31, 32, 34, and 38. In item 33 there
are seven students who get wrong answer with the percentage 28%. In item 35 the
students get six Errors with the percentage 24%. The lowest percentage is 8% in
the item number 36. In item 37 and 39 there are three students who choose the
wrong answer with the percentage 12%. The last there are four students who
choose the wrong answer with the percentage 16%.

26
Table 7
Frequency Error of Sound Labio- dental Fricatives
No Sound
Area Item Number
Frequency of
Error
Percentage of
Error
5
Labio-
Dental
Fricatives
40 3 12%
41 3 12%
42 22 88%
43 9 36%
44 5 20%
45 11 44%
46 6 24%
47 9 36%
48 7 28%
49 3 12%
Total 31.2%
This table explains the error percentage in sound Labio dental Fricative. In
item 40, 41, and 49 there are three students who choose the wrong answer with the
percentage 12%. The highest percentage is in the item 42 where students choose
22 from the wrong answer with the percentage 88%. In item 43 and item 47 there
are nine students who choose wrong answer with the percentage 36%. In item 44
there are five students who pronounce the wrong words with the percentage 20%.
Then in the item 45 the percentage is 44% from the incorrect pronouncing the
words. In item 46 the students get error in six words with the percentage 24%. In
the item 47 there are nine students who get error in pronouncing the words with

27
the percentage 36%. The last in item 48 there is 28% students who choose the
wrong answer.
Table 8
Frequency Error of Sound Dental Fricatives / ð, θ/
No Sound
Area Item Number
Frequency of
Error
Percentage of
Error
6 Dental
Fricatives 50 17 68%
51 4 16%
52 11 44%
53 12 48%
54 14 56%
55 15 60%
56 14 56%
57 9 36%
58 10 40%
59 10 40%
Total 46,4%
In the item 58 and 59 there are ten students who error in Pronouncing the
words with the percentage 40%. The highest percentage is 68% where there are
seventeen students error in pronouncing the words. In item 52 there are eleven
students who error in pronouncing the words with the percentage 44%. Then in
item 53 there are twelve students error in pronouncing the words with the
percentage 48%. The lowest percentage is 16% in item 51 where there are four
students error in pronouncing the words. The last in item 54 and 56 there are
fourteen students error in pronouncing the words with the percentage 56%. The
average is 46, 4%
28
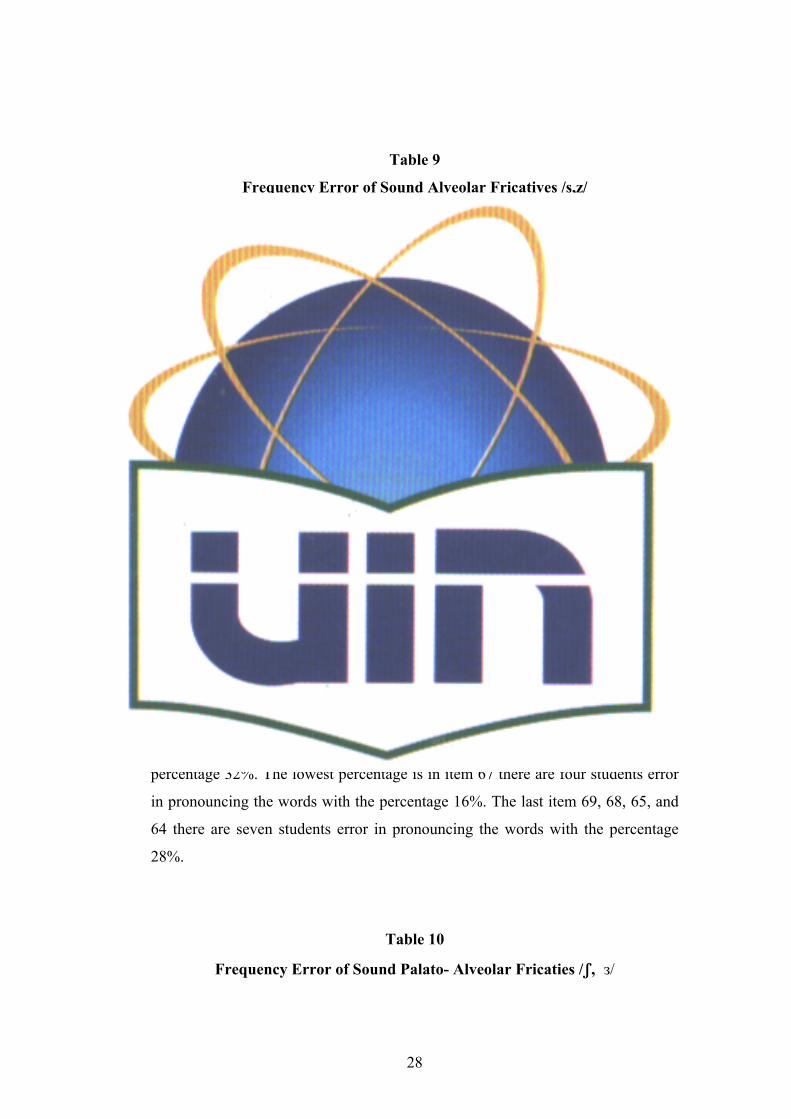
Table 9
Frequency Error of Sound Alveolar Fricatives /s,z/
No Sound
Area Item Number
Frequency of
Error
Percentage of
Error
7 Alveolar
Fricatives 60 5 20%
61 5 20%
62 6 24%
63 6 24%
64 7 28%
65 7 28%
66 8 32%
67 4 16%
68 7 28%
69 7 28%
Total 24,8%
This table has average 24, 8% from all of the error percentage. The lowest
percentage is in item 60 and 61 where there are five students error in pronouncing
the words with the percentage 20 % . In item 62 and 63 there are six students error
in pronouncing the words with the percentage 24%. The highest percentage exists
in item 66 where there are eight students error in pronouncing the words with the
percentage 32%. The lowest percentage is in item 67 there are four students error
in pronouncing the words with the percentage 16%. The last item 69, 68, 65, and
64 there are seven students error in pronouncing the words with the percentage
28%.
Table 10
Frequency Error of Sound Palato- Alveolar Fricaties /∫, з/

29
No Sound
Area Item Number
Frequency of
Error
Percentage of
Error
8
Palato-
Alveolar
Fricatives
70 7 28%
71 4 16%
72 4 16%
73 7 28%
74 12 48%
75 15 60%
76 11 44%
77 14 56%
78 18 72%
79 11 44%
Total 41,2%
This table describes the percentage about Palato Alveolar fricatives. In item 76
and 79 there are eleven students error in pronouncing the words with the
percentage 44%. In item 77 there are fourteen students error in pronouncing the
words. In item 75 with the percentage 60% there are fifteen students error in
pronouncing the words. In item 70 and 73 are the same percentage with the
percentage 28%. The last in item 74 there are twelve students error in
pronouncing the words with the percentage 48%. The highest percentage is 72%
where there are eighteen students error in pronouncing the words. While the
lowest percentage exist in item 71 and 72 (16%) there are four students who error
in pronouncing the words.
Table 11
Frequency Error of Sound Glottal Fricatives /h/
No Sound Item Number Frequency of Percentage of
30
Area Error error
9 Glottal
Fricatives 80 5 20%
81 6 24%
82 4 16%
83 6 24%
84 8 32%
Total 23,2%
From the table we know that the average is 23, 2%. The highest
percentage is 32% where there are eight students who error in pronouncing the
words. While, the lowest percentage is 16% from four students who get errors in
pronouncing the words of Glottal Fricatives. In item 81 and 83 there are six
students who error in pronouncing the words. The last is item 80 with percentage
20% where there are Five students who error in pronouncing the words.
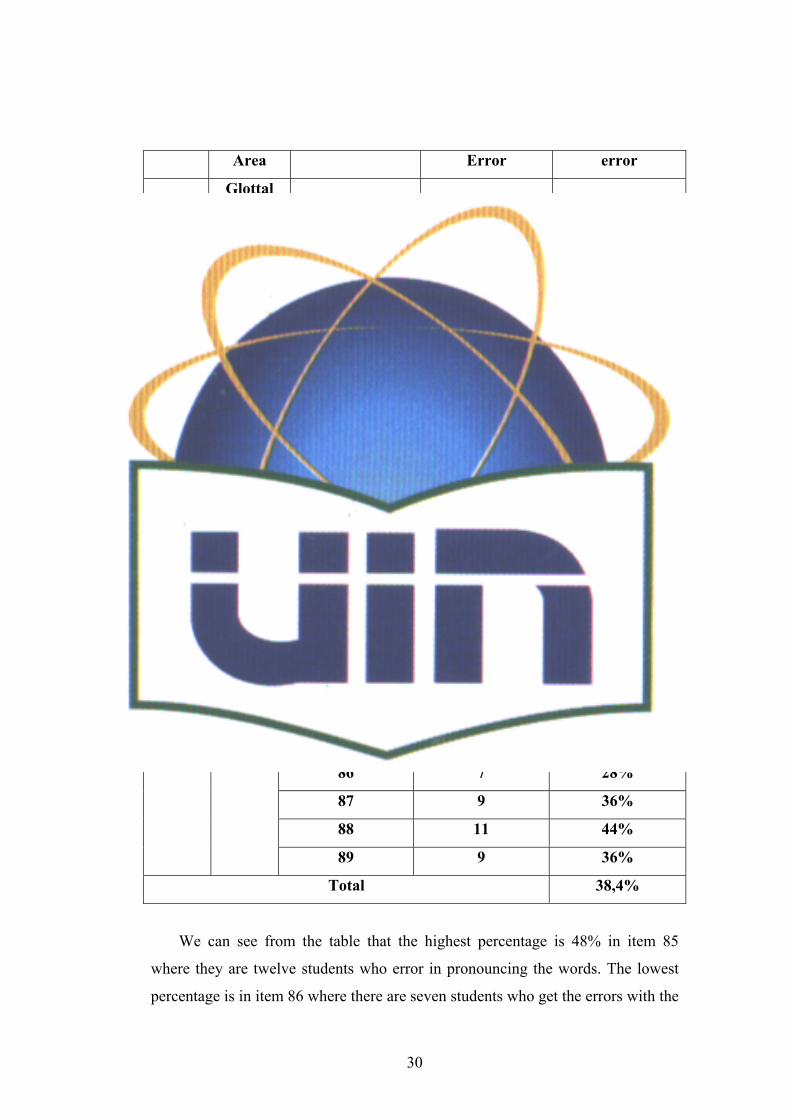
Table 12
Frequency Error of Sound Bilabial Nasal /m/
No Sound
Area Item Number
Frequency of
Error
Percentage of
Error
10 Bilabial
Nasal 85 12 48%
86 7 28%
87 9 36%
88 11 44%
89 9 36%
Total 38,4%
We can see from the table that the highest percentage is 48% in item 85
where they are twelve students who error in pronouncing the words. The lowest
percentage is in item 86 where there are seven students who get the errors with the

31
percentage 28%. In item 87 and 89 there are nine students who get errors in
pronouncing the words with the percentage 36%. The last in item 88 there are
eleven student who getting error in pronouncing the words with the percentage
44%
Table13
Frequency Error of Sound Alveolar Nasal /n/
No Sound
Area
Item Number Frequency of
Error
Percentage of
Error
11 Alveolar
Nasal
90 5 20%
91 4 16%
92 10 40%
93 13 52%
94 5 20%
Total 29,6%
We can see from the table item 94 and 90 there are five students who error
in pronouncing the words with the percentage 20%. The lowest percentage is 16
% , while the highest percentage is 52%.and the last in item 92 there are ten
students who error in pronouncing the words with the percentage 40%.
Table 14
Frequency Error of Sound Velar Nasal / ŋ/
No Sound
Area Item Number
Frequency of
Error
Percentage of
Error
12 Velar
Nasal 95 2 8%

32
96 14 56 %
97 5 20%
98 8 32%
99 4 16%
Total 26,4%
From the table we can see that the lowest percentage is in the item 95 with
the percentage 8%, while the highest percentage is in the item 96 with the
percentage 56%. In item 97 there are five students who error in pronouncing the
words. In item 98 with the percentage 32% there are eight students who error in
pronouncing the words and in item 99 there are four students who getting error
with the percentage 16%, so the average is 26, 4%.
Table 15
Frequency Error of Sound Lateral /I/
No Sound
Area Item Number
Frequency of
Error
Percentage of
Error
13 Lateral 100 17 68%
101 8 32%
102 7 28%
103 10 40%
104 15 60%
Total 45,6%
This table explains about sound of Lateral. As we know from the table there
are fifteen students who error in pronouncing the words (60%), in item 1003 there
are ten students with the percentage 40%, while in item 101 there are eight
students who error in pronouncing the words (32%). The highest percentage
is 68% (in item 100) and the lowest percentage is 28% (in item 102)
Table16
33
Frequency Error of Sound Post –Alveolar Frictionless Continuant /r/
No Sound Area Item Number Frequency of
Error
Percentage of
Error
14
Post –
Alveolar
Frictionless
Continuant
105 9 36%
106 6 24%
107 8 32%
108 8 32%
109 6 24%
Total 29,6%
The Table describes about the percentage Post Alveolar Frictionless
Continuant. As we know the highest percentage is 36% (in item 105) and the
lowest percentage is 24% (in item 109 and 106), then in item 107 and 108 there
are eight students who error in pronouncing the words with the percentage 32%,
so the average is 29,6%.
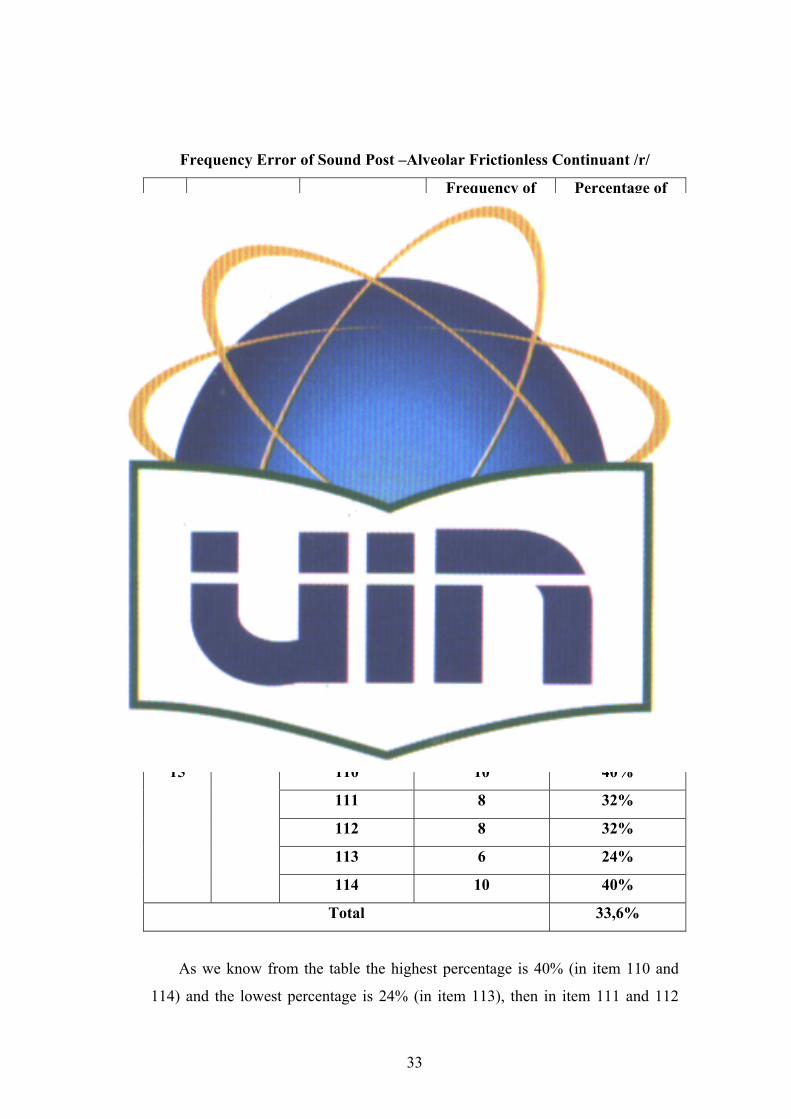
Table 17
Frequency Error of Sound Unrounded Palatal Semi – Vowel /j/
NO Sound
Area Item Number
Frequency of
Error
Percentage of
Error
15 110 10 40%
111 8 32%
112 8 32%
113 6 24%
114 10 40%
Total 33,6%
As we know from the table the highest percentage is 40% (in item 110 and
114) and the lowest percentage is 24% (in item 113), then in item 111 and 112

34
there are eight students who error in pronouncing the words with percentage 32%.
So the average 33, 6%.
Table 18
Frequency Error of Sound Labio – Velar Semi Vowel /w/
No Sound
Area Item Number
Frequency of
Error
Percentage of
Error
16
Labio-
dental
Fricatives
115 12 48%
116 9 36%
117 10 40%
118 9 36%
119 9 36%
Total 39,2%
From the table, the highest percentage is 48% (in item 115) and the lowest
percentage is 36% (in item 116, 118, and 119). In item 117 there are ten students
who error in pronouncing the words, so the average is 39, 2%.
Vowel Sounds
Table 19
Frequency Error of Sound i:
No Sound
Area Item Number
Frequency of
Error
Percentage of
Error
1 Sound
i: 120 4 16%

35
121 8 32%
122 7 28%
123 5 20%
124 8 32%
Total 25,6%
From the table we can see that the highest percentage is in item number 212
and in item number 124 with the percentage 32%. The lowest percentage is item
120 where there are four students who get error in pronouncing the words. In item
123 there are five students who error in pronouncing the words with the
percentage 20%, while in item 122 there are seven students who error in
pronouncing the words with the percentage 28%, so the average is 25,6%.
Table 20
Frequency Error of Sound I
No Sound
Area Item Number
Frequency of
Error
Percentage of
Error
2 Sound
Sound I 125 6 24%
126 3 12%
127 6 24%
128 6 24%
Total 21%
This table explains about the error of sound I. As we see from the table the
item number 125, 127 and 128 are the highest percentage with the percentage
24%, while the item number 126 is the lowest one with the percentage 12%. So
the average is 21%.
36
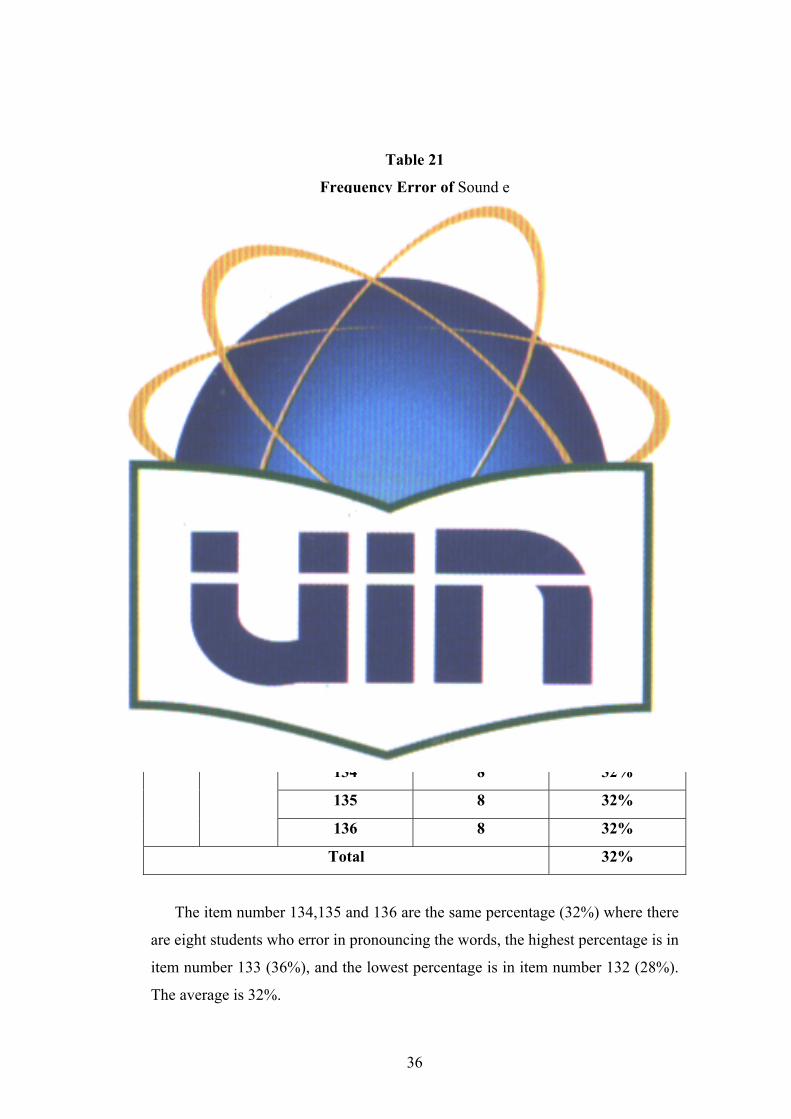
Table 21
Frequency Error of Sound e
No Sound
Area Item number
Frequency of
Error
Percentage of
Error
3 Sound e 129 3 12%
130 7 28%
131 7 28%
Total
22,66%
From the table we can see that the item number 130 and number 131 are the
highest percentage with the percentage 28% where there are seven students who
get error in pronouncing the words (sound e).while, item number 129 is the lowest
where there are three students who error in pronouncing the words with the
percentage 12%.
Table 22
Frequency Error of Sound /æ/
No Sound
Area Item number
Frequency of
Error
Percentage of
Error
4 Sound
/æ/ 132 7 28%
133 9 36%
134 8 32%
135 8 32%
136 8 32%
Total 32%
The item number 134,135 and 136 are the same percentage (32%) where there
are eight students who error in pronouncing the words, the highest percentage is in
item number 133 (36%), and the lowest percentage is in item number 132 (28%).
The average is 32%.
37
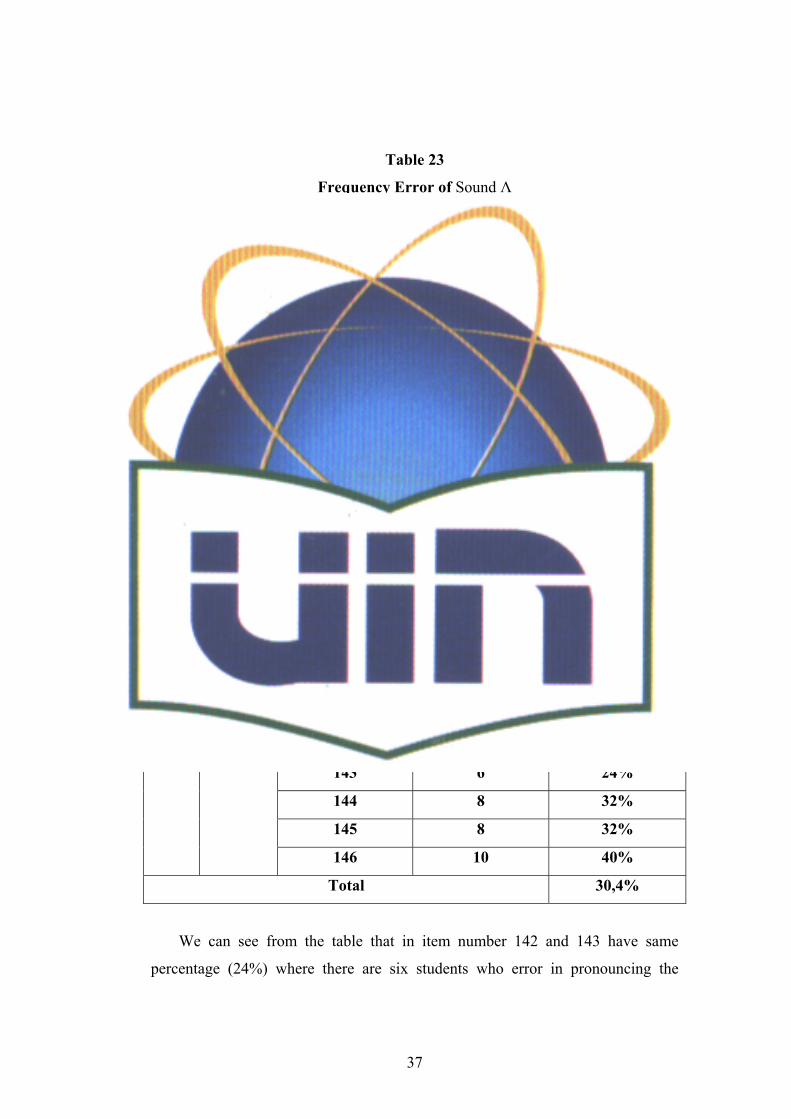
Table 23
Frequency Error of Sound Λ
No Sound
Area Item number
Frequency of
Error
Percentage of
Error
5 Sound Λ 137 10 40%
138 11 44%
139 9 36%
140 7 28%
141 7 28%
Total 35,2%
This table is describing about sound Λ. In item 140 and 141 there are seven
students who error in pronouncing the words (28%), the highest percentage is in
item number 138 (44%), while the lowest is in the item number 140 and 141. In
item 137 there are ten students who error in pronouncing the words (40%. So the
average is 35,2%.
Table 24
Frequency Error of Sound α:
No Sound
Area Item number
Frequency of
Error
Percentage of
Error
6 Sound α: 142 6 24%
143 6 24%
144 8 32%
145 8 32%
146 10 40%
Total 30,4%
We can see from the table that in item number 142 and 143 have same
percentage (24%) where there are six students who error in pronouncing the

38
words. So do in item number 144 and 145 also have same percentage (32%). The
highest percentage is in item number 146 with the percentage 40 %.
Table 25
Frequency Error of Sound Þ
No Sound
Area Item number
Frequency of
Error
Percentage of
Error
7 Sound Þ 147 4 16%
148 10 40%
149 7 28%
150 2 8%
151 6 24%
Total 23,2%
This table is explaining about the sound Þ. In item number 147 there are four
students who error in pronouncing the words (16%). In item 149 with the
percentage 28% there are seven students who error in pronouncing the words. In
item 151 there are six students who error in pronouncing the words (24%). The
highest percentage is in the item 148 with the percentage 40%, while the lowest
percentage is in item 150 (8%).
Table 26
Frequency Error of Sound ɔ:
No Sound
Area Item number
Frequency of
Error
Percentage of
Error
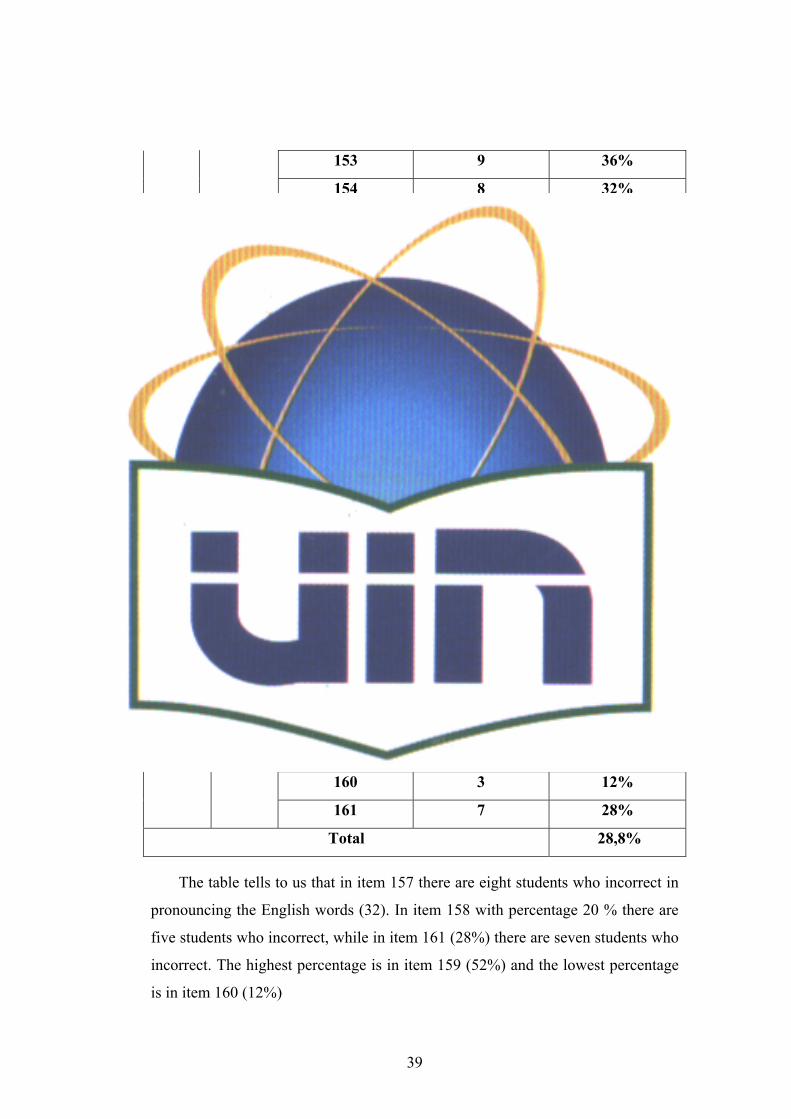
8 Sound ɔ:
152 10 40%
39
153 9 36%
154 8 32%
155 11 44%
156 8 32%
Total 36,8%
This table describes about the sound ɔ:, in item 152 there are ten students
who getting error in pronouncing the words with the percentage 40%. In item 153
there are nine students who pronounce the English words incorrect (36%),the
highest percentage is in item 155 with the percentage 44% where there are eleven
students pronounce incorrect, while the lowest percentage is in item 156 (32%).
Table 27
Frequency Error of Sound /u/
No Sound
Area Item number
Frequency of
Error
Percentage of
Error
9
Sound
/u/
157 8 32%
158 5 20%
159 13 52%
160 3 12%
161 7 28%
Total 28,8%
The table tells to us that in item 157 there are eight students who incorrect in
pronouncing the English words (32). In item 158 with percentage 20 % there are
five students who incorrect, while in item 161 (28%) there are seven students who
incorrect. The highest percentage is in item 159 (52%) and the lowest percentage
is in item 160 (12%)

40
Table 28
Frequency Error of Sound /u:/
No Sound
Area Item number
Frequency of
Error
Percentage of
Error
10 Sound
/u:/ 162 12 48%
163 4 16%
164 9 36%
Total 33,33%
This table explains about sound area Sound /u:/. In item 164 there are nine
students who incorrect in pronouncing the words with the percentage 36%. The
highest percentage is in item 162 (48%), and the lowest percentage is in item 163
(16%). So the average is 33, 33%.
Table 29
Frequency Error of Sound / з:/
No Sound
Area Item number
Frequency of
Error
Percentage of
Error
11 Sound /
з:/ 165 11 44%
166 11 44%
167 12 48%
168 13 52%
169 8 32%
Total 44%
This table describes the sound area of Sound / з: / . In item 165 and 166 there
are eleven students who incorrect in pronouncing the words with percentage 44%.
In item 167 with the percentage 48% there are twelve students who incorrect in

41
pronouncing the words. The lowest percentage is in item 168 (32%) and the
highest percentage is in item 168 (52%)
Table 30
Frequency Error of Sound ə
No Sound
Area Item number
Frequency of
Error
Percentage of
Error
12 Sound
ə 170 11 44%
171 13 52%
172 6 24%
173 7 28%
174 6 24 %
Total 34,4%
From the table we can see that in item 170 with the percentage 44 % there are
eleven students who incorrect, in item 173 there are seven students who error in
pronouncing the words with the percentage 28%. From the table the highest
percentage is in item 171(52%) and the lowest percentage is in item 172 and 174 (
24%).

42
Table 31
Frequency Error of Sound /eI/
No Sound
Area Item number
Frequency of
Error
Percentage of
Error
13 Sound
/eI/ 175 15 60%
176 11 44%
177 11 44%
178 10 40%
179 10 40%
Total 45,6%
In the table describes about sound eI. We can see that there are eleven
students who error in pronouncing the English words (item number 176 and 177)
with the percentage 44%. The highest percentage is in item 175 (60%), while the
lowest percentage is in item 178 and 179 with the percentage 40%.
Table 32
Frequency Error of Sound /ai/
No Sound
Area Item number
Frequency of
Error
Percentage of
Error
14
Sound
/ai/
180 0 0%
181 17 68%
182 5 20%
183 8 32%
184 11 44%
Total 32,8%

43
From the table we can see that in item 184 there are eleven students who
error in pronouncing the words (44%0. in item 183 with the percentage 32% there
are eight students who error. The highest percentage is in item 181 (68%) and the
lowest is in item 182 (205). So the average is 32, 8%.
Table 33
Frequency Error of Sound ɔ ɪ
No Sound
Area Item number
Frequency of
Error
Percentage of
Error
15
Sound ɔ
ɪ
185 9 36%
186 10 40%
187 6 24%
188 7 28%
189 8 32%
Total 32%
From the table we can see that in item 185 there are nine students who error in
pronouncing the words with the percentage 36%, in item 188 with the percentage
28% there are seven students who error. In item 189 there are eight students who
error (32%). The highest percentage is in item 186 (40%) and the lowest
percentage is in item number 187 (24%).
Table 34
Frequency Error of Sound /əu
No Sound
Area Item number
Frequency of
Error
Percentage of
Error
16 190 10 40%

44
191 8 32%
192 6 24%
193 8 32%
194 5 20%
Total 29,6%
From the table we can see that in item 191 and 193 have the same percentage
namely 32%, in item 192 there are six students who error in pronouncing the
words with percentage 24%. The highest percentage is in item 190 (40%), and the
lowest percentage is in item 194 (20%).
Table 35
Frequency Error of Sound əu
No Sound
Area Item number
Frequency of
Error
Percentage of
Error
17 Sound
au/ 195 11 44%
196 5 20%
197 7 28%
198 9 36%
Total 32%
This table is explaining about the sound au. In item 198 there are nine students
who error in pronouncing the words with the percentage 36%. In item 197 with
the percentage 28% there are seven students who error in pronouncing the words.
The highest percentage is in item 195 (44%), and the lowest percentage is in item
196 (20%)

45
Table 36
Frequency Error of Sound /ie/
No Sound
Area Item number
Frequency of
Error
Percentage of
Error
18 199 10 40%
200 7 28%
201 9 36%
202 9 36%
203 10 40%
Total 36%
This table describes about the sound ie where there are nine students who error
in pronouncing the words (36%), the highest percentage is in item 199 and 203 in
item with the percentage 36%, while the lowest percentage is in item 200 (28%).
Table 37
Frequency Error of Sound iə
No Sound
Area Item number
Frequency of
Error
Percentage of
Error
19 204 8 32%
205 8 32%
206 6 24%
207 5 20%
Total 27%
46
The table tells that in item 206 there are six students who make errors in
pronouncing the words with the percentage 24%. The highest percentage is in
item 204 and 205 (32%) and the lowest percentage is in item 207 (27%).
Table 38
Frequency Error of Sound u ə
No Sound
Area Item number
Frequency of
Error
Percentage of
Error
20 207 7 28%
208 6 24%
209 8 32%
210 13 52%
211 6 24%
Total 32%
This table explains about sound Sound u ə, in item 207 with the percentage
28% there are seven students who error in pronouncing the English words. In item
210 with the percentage 52% there are thirteen students who make errors. As we
know the highest percentage is in item 210 there is thirteen who error, while the
lowest is in item 208 and 211 (24%).
Table 39
Frequency Error of Sound ɔə
No Sound
Area Item number
Frequency of
Error
Percentage of
Error
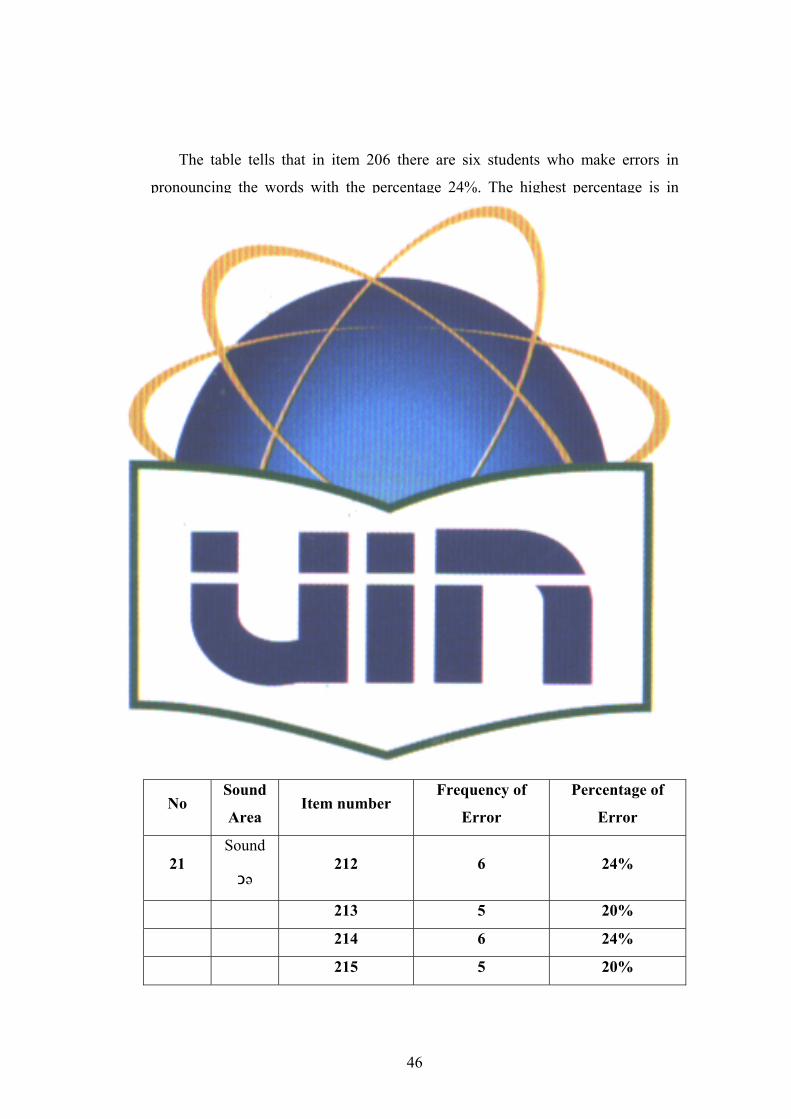
21 Sound
ɔə 212 6 24%
213 5 20%
214 6 24%
215 5 20%
47
216 5 20%
Total 21,6%
This table describes about sound of Sound ɔə , in item 212 and 214 there are
six students who make errors in pronouncing the words with the percentage 24% ,
while in item number 213, 215 and 216 with the percentage 20% there are five
students who make errors in pronouncing the words. So the average is 21,6%.
3. Interpretation and Discussion
After classifying the items into area tested and explaining the percentage and
the frequency of error on each item, then the writer describes the sequence
Consonant sound and Vowel sound based on the highest percentage of error. First,
he explains and interprets Consonant Sound area as follow:
Table 40
The sequence of Consonant Area based on the Highest Frequency of Error
Consonant Sounds Percentage of Error
1. Bilabial Plosive 18,8%
2. Velar plosive 16,4%
2. Alveolaar Plosive 18%
3. Palato- Alveolar Affricative 16,4%
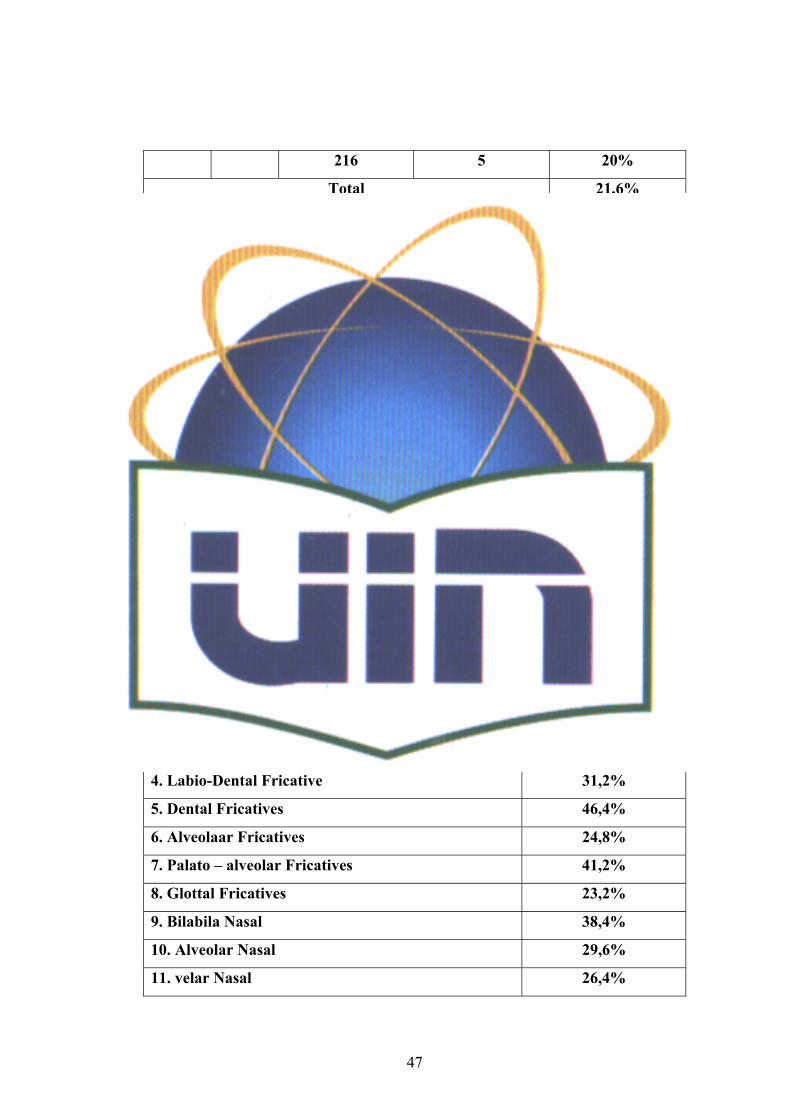
4. Labio-Dental Fricative 31,2%
5. Dental Fricatives 46,4%
6. Alveolaar Fricatives 24,8%
7. Palato – alveolar Fricatives 41,2%
8. Glottal Fricatives 23,2%
9. Bilabila Nasal 38,4%
10. Alveolar Nasal 29,6%
11. velar Nasal 26,4%

48
12. Lateral 45,6%
13. Post-Alveolare frictionless continunant 29,6%
14. Unrounded Palatal Semi- Vowel 33,6%
15. Labio- Velar Semi Vowel 39,2%
This table is describing about the consonant area that students made error in
pronouncing the words. We can see in the table that the highest percentage of
error is in Dental Fricatives. There are 46, 4% the students who error in this area.
The second is Bilabial Plosive. There are 18, 8 % students who made in errors in
this area. The third is velar Plosive. There are 16, 4% students who made in errors
in this area. The fourth is Alveolar plosive. There are 18% students who made in
errors in this area. The fifth is Pallato Alveolar Affricative. There are 16,4%
students who made in errors in this area . The sixth is Labio – Dental Fricative.
There are 31,2% students who made in errors in this area. The seventh is alveolar
Fricative. There are 24,8% students who made in errors in this area. The eighth is
Palato – alveolar Fricatives. There are 41,2% students who made in errors in this
area. The ninth is Glottal Fricatives. There 23, 3% students who made in errors
in this area. The tenth is Bilabila Nasal. There are 38, 4% students who made in
errors in this area. The eleventh is Bilabial Nasal. There are 38, 4% students who
made in errors in this area. The twelfth is Alveolar Nasal. There are 29, 6%
students who made in errors in this area. The thirteenth is Velar Nasal. There are
26,4% students who made in errors in this area. The fourteenth is Lateral. There
are 45,6 students who made in errors in this area. The fifteenth is Post Alveolar
Frictionless continuant. There are 29, 6% students who made in errors in this area.
The sixteenth is Unrounded Palatal Semi-vowel. There are 33, 6% students who
made in errors in this area. The seventeenth is Labio Velar Semi Vowel. There are
39, 2% students who made in errors in this area.

49
Table 41
The sequence of all percentages based on the Highest Frequency of Error
Sound of Vowel Area Percentage of Error
1. Sound / i: 25,6%
2. Sound /I 21%
3. Sound / e 22,66%
4. sound /æ 32%
5. Sound /Λ 35,2%
6. sound /a: 30,2%
7. sound /Þ 19,2%
8. sound / : 36,8%
9.Sound /u 28,8%
10. sound /u: 33,33%
11. sound /3: 44%
12. Sound /ə 34,4%
13. sound /ei 45,6% 14. sound /ai 32,8%
15. sound I 32%
16. sound /əu 29,6%
17. Sound /au 32%
18. Sound /iə 36%
19. sound /ie 27%
20. Sound /uə 32%
21. sound ə 21,6%
The table describes about the vowel sound area that students have made error
in pronouncing the words. From the table the highest percentage is in sound area
ei with the percentage 45, 6 %. The second is sound area i:. There are 25, 6%
students who made in errors in this area. The third is sound area I . There are 21%

50
students who made in errors in this area. The fourth is sound area e. There are 22,
66% students who made in errors in this area. The fifth is sound area æ. There are
32% students who made in errors in this area. The sixth is sound area Λ. There are
35,2% students who made in errors in this area. The seventh is a:. There are
30,2% students who made in errors in this area. The eighth is Þ. There are 19,2%
students who made in errors in this area. The ninth is : There 36, 8% students
who made in errors in this area. The tenth is sound u. There are 28, 8% students
who made in errors in this area. The eleventh is u:. There are 33, 33% students
who made in errors in this area. The twelfth is 3:. There are 44% students who
made in errors in this area. The thirteenth is ə. There are 34,4% students who
made in errors in this area. The fourteenth is ai There are 32,8% students who
made in errors in this area. The fifteenth is I. There are 32% students who made
in errors in this area. The sixteenth is əu. There are 29,6% students who made in
errors in this area. The seventeenth is au. There are 32% students who made in
errors in this area. The eighteenth is sound iə. There are 27% students who made
in errors in this area. The nineteenth is sound uə. There are 32% students who
made in errors in this area. The last is sound ə. There are 21,6 % students who
made in errors in this area .

51
CHAPTER IV
CONCLUSION AND SUGGESTION
A. Conclusion
Most students made errors in consonant sound and vowel sound. Errors in
consonant sounds are around Dental Fricatives and the vowel sounds are about
sound ei area. After the writer knows the result of the research of student’s error
in Consonant Sound area and vowel sound area. Then the writer makes a
conclusion that the most errors occur in consonant sound area namely in sound
Dental Fricatives. The percentage of this error namely 46,4%. It is the highest
percentage in consonant sound. Whereas in vowel area the most error occurs in
sound ei area. The percentage is 45,6 % from the students who pronouncing
error.
B. Suggestion
By analyzing the students’ pronunciation error in consonant sound and
vowel sound, we can prepare the best strategies to be manifested for students. So
they can not make error. Hereby some suggestion from the writer:
1. Teacher must give more attention on the students’ pronunciation errors in
consonant and vowel sounds area.
2. Teacher must conduct a lot of exercises in pronouncing the words that
contain consonant sound and vowel sound.
3. Teacher and students must make a habit in pronouncing the words correctly
by looking up to the dictionary.

52
BIBLIOGRAPHY
Anderson, Verna D., et.al, Readings in the Language Arts, New York : Mc Milan
Company, 1965
Al- Mack, John C, et.al. The New Stanford Speller , USA : Laidlaw Brother ,
1954
Brown. Douglas, Principle of Language Learning and Teaching, San Francisco
State University: Prentice Hall Regents Englewood Cliffs, 1994
Brown, Adam , Approaches to Pronunciation Teaching, London &
Basingstoke,1992 .
C. Pennington, Martha, Phonology in English Language Teaching: An
International Approach, New York: Addison Wesley Longman Limited,
1996
Evans, Desmund W. Evans, Improving English Skills
FITK, Pedoman Penulisan Skripsi, 2007
Fergus, Patricia M, Spelling Improvement, USA : McGraw – Hill inc., 1994
Hornby,As, Oxford Advanced Learner’s Dictionary of Current English, Oxford :
Oxford University Press, 1974
Hubbard, Peter A Training Course for TEFL, (Oxford: Oxford University Press,
1983
Haris P. Guth & Edgar H.Shuster, American English Today (the uses of
language), USA: McGraw-Hill,Inc. 1970
Indriani,M.I. English Pronunciation, Jakarta : P.T. Gramedia Pustaka Utama,
2001
Harmer, Jeremy, The Practice of English Language Teaching, Cambridge :
Pearson Education Limited,2001

53
.P.B Allen & S.Pit Corder , Technique in Applied Linguistics ( London : Oxford
University Press, 1974
Jones, Daniel, the Pronunciation of English, Cambridge: Cambridge University
Press, 1956
Sherin, Susan , Self Access, Oxford : Oxford University Press , 1989
“Spelling”, the article is accessed on September 30th 2007 at http
://spelling.wordpress.com/spelling/
T. Littlewood, William, Foreign Language and Second Language Learning,
Cambridge: Cambridge University Press, 1984
T. Little wood, William, Foreign and Second Language Learning, (Cambridge:
Cambridge University Press, 1984
Ur, Penny, A Course in Language Teaching, Cambridge: Cambridge University
Press, 1996

54
Appendix
Pronunciation test
Consonant Sounds
A. bilabial plosive / p,b/
No Words
1 Cub
2 Cab
3 Lab
4 Robe
5 Rib
6 Cup
7 Cap
8 Lap
9 Rope
10 Rip
B. Alveolar Plosives /t,d/
No Word
11 Take
12 Toy
13 Tail
14 Town
15 Test
16 Day
17 Doll
18 Desk
19 Dog
20 Dull

55
C. Velar Plosive /k,g/
No Word
21 Go
22 Goat
23 Girl
24 Goose
25 Gate
26 Cook
27 Cake
28 Quick
29 Come
30 Key
D. Palato- Alveolar Affricative
No Word
31 Cheap
32 Choose
33 Chin
34 Chest
35 Choke
36 Jeep
37 Jews
38 Gin
39 Jest

56
E. Labio- Dental Fricatives / f, v/
No Word
40 Fine
41 Fever
42 Flute
43 Fond
44 Fussy
45 Vine
46 Very
47 Vivid
48 Value
49 Vital
F. Dental Fricatives / ð, θ/ No Word
50 They
51 There
52 This
53 These
54 Though
55 Thin
56 Thick
57 Thing
58 Thank
59 Thumb
G. Alveolar Fricatives /s,z/
No Word
60 Loose
61 Bus

57
62 Lice
63 Rice
64 Seal
65 Lose
66 Buzz
67 Lies
68 Rise
69 Zeal
H. Palato- Alveolar Fricaties /∫, з/ No Word
70 Shop
71 Share
72 She
73 Shall
74 Shoulder
75 Pleasure
76 Leisure
77 Decision
78 Collision
79 Measure
I. Glottal Fricatives /h/
No Word
80 Here
81 Hair
82 Hole
83 Haze
84 Hurricane

58
J. Bilabial Nasal /m/
No Word
85 Milk
86 Mine
87 Miss
88 Maybe
89 Mister
K. Alveolar Nasal /n/
No Word
90 Near
91 No
92 Now
93 Nose
94 Nest
L. Velar Nasal / ŋ/ No Word
95 Playing
96 Anxious
97 Link
98 Bring
99 Wink
M. Lateral /I/
No Word
100 Live
101 Look
102 Leave
103 Love

59
104 Lamb
N. Post –Alveolar Frictionless Continuant /r/
No Word
105 Roam
106 Roll
107 Risk
108 Ruin
109 Ralph
O. Unrounded Palatal Semi – Vowel /j/
No Word
110 Young
111 Yesterday
112 Yard
113 University
114 Europe
P. Labio – Velar Semi Vowel /w/
No Word
115 West
116 Way
117 Work
118 Warm
Vowel Sounds
A. sound i:
No Word
119 Tree

60
120 Complete
121 Leaf
122 piece
123 Fierce
B. Sound I No Word
124 Sit
125 City
126 Pretty
127 Village
C. Sound e No Word
128 Set
129 Dead
130 Many
D. Sound /æ/ No Word
131 Tab
132 Mad
133 Sham
134 Ram
135 Ranks
E. Sound Λ No Word
136 Up
137 Under
138 Oven

61
139 Onion
140 Umbrella
F. Sound α: No Word
141 Pass
142 Part
143 Heart
144 Clerk
145 Calm
G. Sound Þ No Word
146 On
147 Off
148 Onto
149 Offer
150 Octopus
H. Sound ɔ: No Word
151 All
152 Always
153 Oar
154 Alter
155 Author
I. Sound /u/
No Word
156 Good
157 Wood

62
158 Would
159 Took
160 Cook
J. Sound /u:/
No Word
161 Through
162 Soup
163 Rouge
K. Sound / з:/ No Word
164 Earn
165 Fern
166 Urn
167 Earth
168 Early
L. Sound ə
No Word
169 Ago
170 Apply
171 Admit
172 Appear
173 Adore
63
M. Sound /eI/
No Word
174 Ache
175 Ace
176 Aim
177 April
178 Acre
N. Sound /ai/
No Word
179 I
180 Aisle
181 Iron
182 Ice
183 Island
O. Sound ɔ ɪ
No Word
184 Oil
185 Ointment
186 Oyster
187 Coin
188 Boy
P. Sound əu
No Word
189 Ocean
190 Over
191 Open

64
192 Only
193 Omen
Q. Sound au/
No Word
194 Owl
195 Ounce
196 Our
197 Hour
R. Sound /ie/
No Word
198 Ear
199 Era
200 Earring
201 Earphone
202 Beer
S. Sound ɪ ə
No Word
203 Hair
204 Pear
205 Bare
206 Chair
T. Sound uə
No Word
207 Tour
208 Doer

65
209 Pure
210 Gourd
211 Fluency
U. Sound ɔə
No Word
212 Four
213 Or
214 Oar
215 Door
216 Folklore

66