enhanced artificial intelligence for ensemble approach to predicting high performance concrete...
TRANSCRIPT

Construction and Building Materials 49 (2013) 554–563
Contents lists available at ScienceDirect
Construction and Building Materials
journal homepage: www.elsevier .com/locate /conbui ldmat
Enhanced artificial intelligence for ensemble approach to predicting highperformance concrete compressive strength
0950-0618/$ - see front matter � 2013 Elsevier Ltd. All rights reserved.http://dx.doi.org/10.1016/j.conbuildmat.2013.08.078
⇑ Corresponding author. Tel.: +886 2 2737 6321; fax: +886 2 2737 6606.E-mail addresses: [email protected] (J.-S. Chou), [email protected]
t.edu.tw (A.-D. Pham).
Jui-Sheng Chou ⇑, Anh-Duc PhamDepartment of Construction Engineering, National Taiwan University of Science and Technology, 43, Sec. 4, Keelung Rd., Taipei 106, Taiwan
h i g h l i g h t s
� High-performance concrete (HPC) compressive strength is a highly nonlinear function of concrete ingredients.� To predict HPC compressive strength, an ensemble artificial intelligence approach is proposed.� This ensemble technique has superior prediction accuracy to individual models.� The approach automates mix design for HPC compressive strength.� The proposed approach markedly reduces the amount of laboratory work required.
a r t i c l e i n f o
Article history:Received 2 May 2013Received in revised form 16 August 2013Accepted 29 August 2013Available online 23 September 2013
Keywords:High performance concreteCompressive strengthData miningPredictive techniquesEnsemble approach
a b s t r a c t
The compressive strength of high performance concrete (HPC) is a highly nonlinear function of the pro-portions of its ingredients. The validity of relationships between concrete ingredients and supplementarycementing materials is questionable. This work evaluates the efficacy of ensemble models by comparingindividual numerical models in terms of their performance in predicting the compressive strength of HPC.The performance of support vector machines, artificial neural networks, classification and regressiontrees, chi-squared automatic interaction detector, linear regression, and generalized linear were appliedto construct individual and ensemble models. Analytical results show that the ensemble technique com-bining two or more models obtained the highest prediction performance. For five experimental datasets,the ensemble models achieved 4.2–69.7% better error rates than those of prediction models in previousstudies. This work confirmed the efficiency and effectiveness of the proposed ensemble approach inimproving the accuracy of predicted compressive strength for HPC.
� 2013 Elsevier Ltd. All rights reserved.
1. Introduction
In recent years, the use of high performance concrete (HPC) hasincreased markedly in various structural applications (i.e., high-risebuildings, bridges, masonry applications, parking lots, residentialbuildings, and pavement construction) [1,2]. Supplementary ce-ment materials, such as fly ash, blast furnace slag, and silica fume,are often added to HPC to increase its compressive strength [3,4].Notably, HPC is used widely because of its high compressivestrength and other beneficial qualities such as high abrasion resis-tance, low permeability and diffusion, high resistance to chemicalattack, and high modulus of elasticity. In concrete mix designand quality control, compressive strength is the most importantindication of HPC quality. However, it is affected by many factors,including mix proportions, material characteristics, curing andenvironmental conditions, and concrete age [5].
Particularly, because it is highly complex, modeling the com-pressive strength of HPC is problematic. The highly nonlinear rela-tionship between components and concrete properties complicatesthe mathematical modeling of compressive strength when usingavailable data [3,6]. Early prediction of concrete strength is essen-tial for scheduling concrete form removal and re-shoring to a slab.A prediction model can help reduce the time and cost of post-ten-sioning by providing essential data to designers and structuralengineers. Thus, accurate and early prediction of concrete strengthis a critical issue in concrete construction.
Conventional methods to predict concrete compressive strengthuses linear or non-linear regression methods [7,8]. These ap-proaches apply a limited amount of experimental data to deter-mine an unknown coefficient. However, many regression modelshave shown that obtaining an accurate regression equation is dif-ficult. Moreover, several factors that affect the compressivestrength of HPC differ from those of conventional concrete. There-fore, to predict compressive strength, regression analysis may beunsuitable [9]. Since conventional models are inadequate for ana-lyzing complex non-linear and uncertain materials, many studies
J.-S. Chou, A.-D. Pham / Construction and Building Materials 49 (2013) 554–563 555
have utilized artificial intelligence (AI) in evolutionary or hybridsystems to develop accurate and effective models that can predictconcrete compressive strength [5,9–13]. Nevertheless, no modelhas proven consistently to be superior.
The growing tendency to use combined methods suggests thatensemble approaches enhance applications of individual AI tech-niques. Although hybrid methods are now very common [14–17],an ensemble approach is rarely used to predict the compressivestrength of HPC. Thus, robust models for predicting HPC compres-sive strength need to enhance their prediction accuracy. To im-prove prediction accuracy, the ensemble method combines twoor more models to obtain predictions that are more accurate thanthose by any single model. Clearly, while meeting modelingrequirements, such a model must also be sufficiently robust tomodel involved uncertainties and must be easily to manipulate.
In this work, numerical predictor nodes, artificial neural net-works (ANNs), support vector machines (SVMs), the classificationand regression tree (CART), linear regression (LR), generalized lin-ear regression (GENLIN), and the chi-squared automatic interactiondetector (CHAID) were used in the IBM SPSS modeler [18]. The ana-lytical results obtained by the best individual models were thenapplied to construct ensemble models. For validation, this ensem-ble modeling system uses a k-fold cross-validation algorithm andfive experimental datasets from previous studies [3,19–23]. Perfor-mance measures for current and previous models were comparedby hypothesis testing.
The remainder of this paper is organized as follows. The Litera-ture Review briefly introduces the study context by reviewing re-lated literature, including studies of concrete compressivestrength prediction and some well-known predictive techniques.The Section 3 then describes research methodology, evaluationmethods, and set-up procedure of the proposed models. The Sec-tion 4 discusses prediction results and compares model perfor-mance while the Conclusion section gives a summary of findingsand conclusions.
2. Literature review
Predicting the mechanical properties of construction materialsis an important research task in materials science [12]. Since con-ventional material models, such those used to model the compres-sive strength of HPC, perform poorly in complex non-linearsystems, scholars are constantly seeking to enhance predictiontools. For many years, researchers have investigated various ap-proaches for predicting the compressive strength of concrete ofvarious ages. Empirical or computational modeling, statisticaltechniques and AI approaches have acceptable accuracy. Severalalgorithms for predicting concrete compressive strength based onconventional regression analysis and statistical models have been
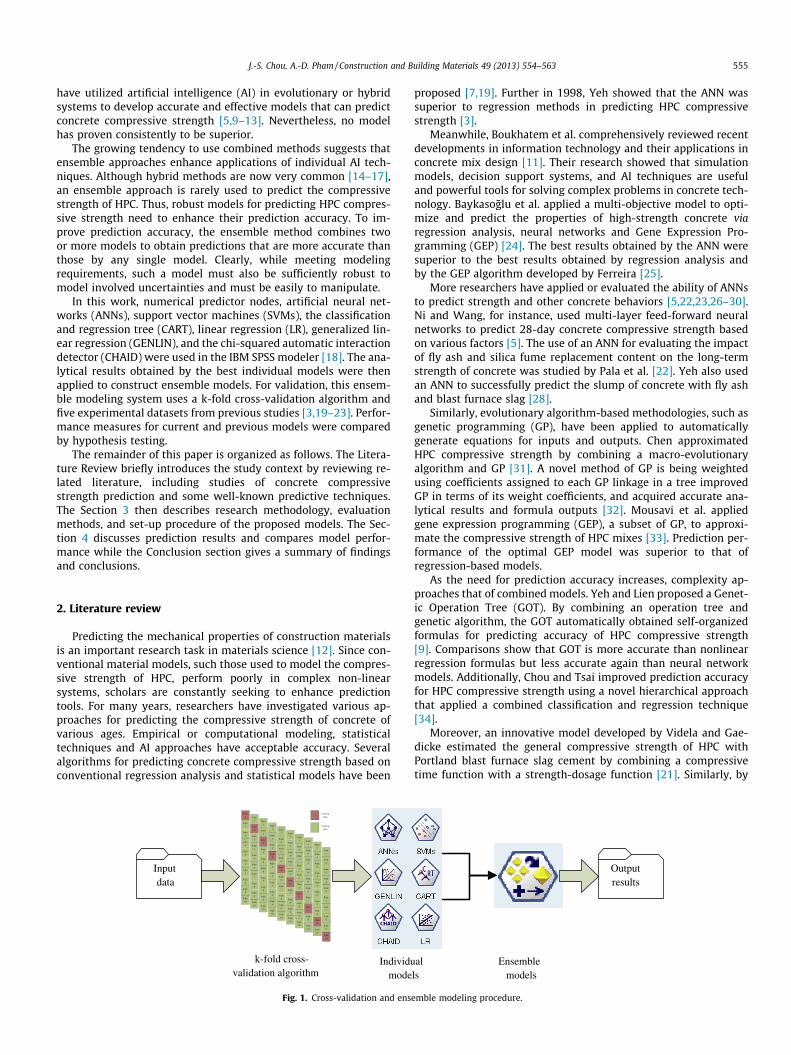
Inputdata
k-fold cross-validation algorithm
Individumode
Fig. 1. Cross-validation and ens
proposed [7,19]. Further in 1998, Yeh showed that the ANN wassuperior to regression methods in predicting HPC compressivestrength [3].
Meanwhile, Boukhatem et al. comprehensively reviewed recentdevelopments in information technology and their applications inconcrete mix design [11]. Their research showed that simulationmodels, decision support systems, and AI techniques are usefuland powerful tools for solving complex problems in concrete tech-nology. Baykasoglu et al. applied a multi-objective model to opti-mize and predict the properties of high-strength concrete viaregression analysis, neural networks and Gene Expression Pro-gramming (GEP) [24]. The best results obtained by the ANN weresuperior to the best results obtained by regression analysis andby the GEP algorithm developed by Ferreira [25].
More researchers have applied or evaluated the ability of ANNsto predict strength and other concrete behaviors [5,22,23,26–30].Ni and Wang, for instance, used multi-layer feed-forward neuralnetworks to predict 28-day concrete compressive strength basedon various factors [5]. The use of an ANN for evaluating the impactof fly ash and silica fume replacement content on the long-termstrength of concrete was studied by Pala et al. [22]. Yeh also usedan ANN to successfully predict the slump of concrete with fly ashand blast furnace slag [28].
Similarly, evolutionary algorithm-based methodologies, such asgenetic programming (GP), have been applied to automaticallygenerate equations for inputs and outputs. Chen approximatedHPC compressive strength by combining a macro-evolutionaryalgorithm and GP [31]. A novel method of GP is being weightedusing coefficients assigned to each GP linkage in a tree improvedGP in terms of its weight coefficients, and acquired accurate ana-lytical results and formula outputs [32]. Mousavi et al. appliedgene expression programming (GEP), a subset of GP, to approxi-mate the compressive strength of HPC mixes [33]. Prediction per-formance of the optimal GEP model was superior to that ofregression-based models.
As the need for prediction accuracy increases, complexity ap-proaches that of combined models. Yeh and Lien proposed a Genet-ic Operation Tree (GOT). By combining an operation tree andgenetic algorithm, the GOT automatically obtained self-organizedformulas for predicting accuracy of HPC compressive strength[9]. Comparisons show that GOT is more accurate than nonlinearregression formulas but less accurate again than neural networkmodels. Additionally, Chou and Tsai improved prediction accuracyfor HPC compressive strength using a novel hierarchical approachthat applied a combined classification and regression technique[34].
Moreover, an innovative model developed by Videla and Gae-dicke estimated the general compressive strength of HPC withPortland blast furnace slag cement by combining a compressivetime function with a strength-dosage function [21]. Similarly, by
alls
Ensemblemodels
Outputresults
emble modeling procedure.
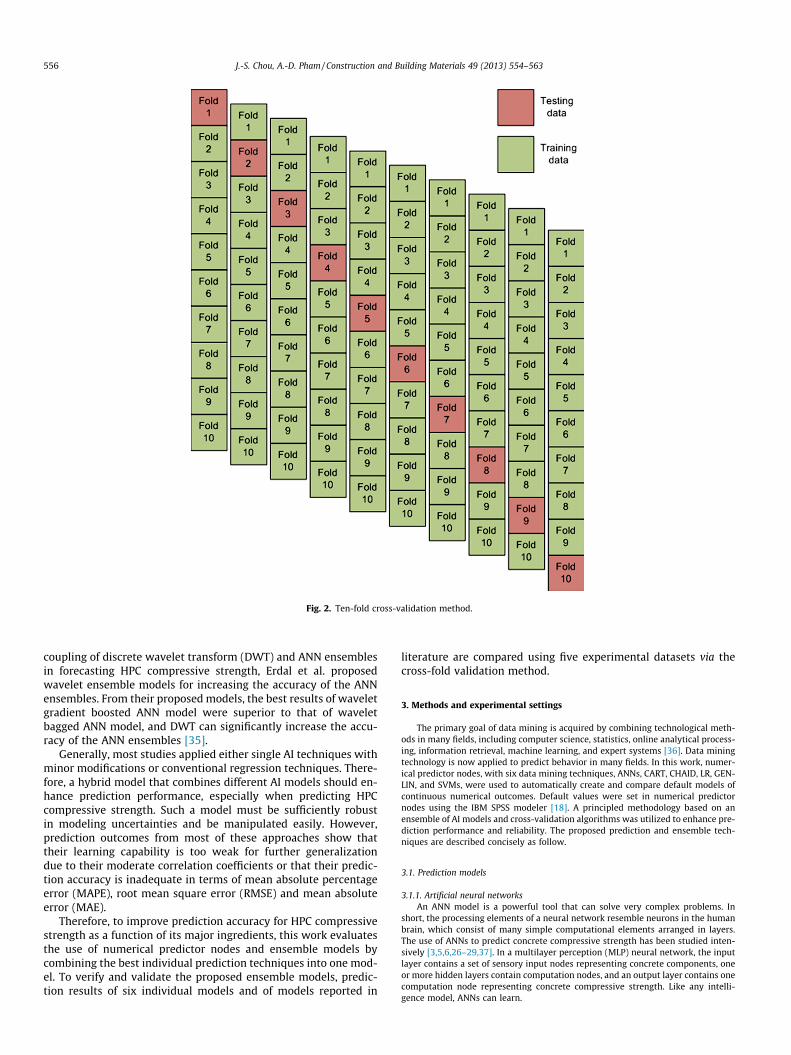
Fig. 2. Ten-fold cross-validation method.
556 J.-S. Chou, A.-D. Pham / Construction and Building Materials 49 (2013) 554–563
coupling of discrete wavelet transform (DWT) and ANN ensemblesin forecasting HPC compressive strength, Erdal et al. proposedwavelet ensemble models for increasing the accuracy of the ANNensembles. From their proposed models, the best results of waveletgradient boosted ANN model were superior to that of waveletbagged ANN model, and DWT can significantly increase the accu-racy of the ANN ensembles [35].
Generally, most studies applied either single AI techniques withminor modifications or conventional regression techniques. There-fore, a hybrid model that combines different AI models should en-hance prediction performance, especially when predicting HPCcompressive strength. Such a model must be sufficiently robustin modeling uncertainties and be manipulated easily. However,prediction outcomes from most of these approaches show thattheir learning capability is too weak for further generalizationdue to their moderate correlation coefficients or that their predic-tion accuracy is inadequate in terms of mean absolute percentageerror (MAPE), root mean square error (RMSE) and mean absoluteerror (MAE).
Therefore, to improve prediction accuracy for HPC compressivestrength as a function of its major ingredients, this work evaluatesthe use of numerical predictor nodes and ensemble models bycombining the best individual prediction techniques into one mod-el. To verify and validate the proposed ensemble models, predic-tion results of six individual models and of models reported in
literature are compared using five experimental datasets via thecross-fold validation method.
3. Methods and experimental settings
The primary goal of data mining is acquired by combining technological meth-ods in many fields, including computer science, statistics, online analytical process-ing, information retrieval, machine learning, and expert systems [36]. Data miningtechnology is now applied to predict behavior in many fields. In this work, numer-ical predictor nodes, with six data mining techniques, ANNs, CART, CHAID, LR, GEN-LIN, and SVMs, were used to automatically create and compare default models ofcontinuous numerical outcomes. Default values were set in numerical predictornodes using the IBM SPSS modeler [18]. A principled methodology based on anensemble of AI models and cross-validation algorithms was utilized to enhance pre-diction performance and reliability. The proposed prediction and ensemble tech-niques are described concisely as follow.
3.1. Prediction models
3.1.1. Artificial neural networksAn ANN model is a powerful tool that can solve very complex problems. In
short, the processing elements of a neural network resemble neurons in the humanbrain, which consist of many simple computational elements arranged in layers.The use of ANNs to predict concrete compressive strength has been studied inten-sively [3,5,6,26–29,37]. In a multilayer perception (MLP) neural network, the inputlayer contains a set of sensory input nodes representing concrete components, oneor more hidden layers contain computation nodes, and an output layer contains onecomputation node representing concrete compressive strength. Like any intelli-gence model, ANNs can learn.
Table 1Sources of datasets in literature.
Dataset Data source Supplementarycementing materials
Laboratory Samplesize
Dataset1
Yeh [3] Blast-furnace slag Taiwan 1030Yeh [20] Fly ash 103
Super-plasticizerDataset
2Lim et al. [19] Fly ash South
Korea104
Silica fumeSuper-plasticizer
Dataset3
Siddique et al.[23]
Bottom ash Literatures 80
Super-plasticizerDataset
4Videla andGaedicke [21]
Blast-furnace slag Chile 194
Silica fumeDataset
5Pala et al. [22] Fly ash Turkey 144
Silica fume
J.-S. Chou, A.-D. Pham / Construction and Building Materials 49 (2013) 554–563 557
The most widely used and effective learning algorithm for training an MLP neu-ral network is the back-propagation (BP) algorithm. Activation of each neuron in ahidden output layer is calculated as
netk ¼X
wkjoj and yk ¼ f ðnetkÞ ð1Þ
where netk is the activation of k-th neuron, j is the set of neurons in the precedinglayer, wkj is the weight of the connection between neuron k and neuron j, oj is theoutput of neuron j, and yk is the sigmoid or logistic transfer function
f ðnetkÞ ¼1
1þ e�netð2Þ
The formula for training and updating weights wkj in each cycle t is
wkjðtÞ ¼ wkjðt � 1Þ þ DwkjðtÞ ð3Þ
The change value Dwkj(t)is calculated as
DwkjðtÞ ¼ gdpjopj þ aDwkjðt � 1Þ ð4Þ
where g is the learning rate parameter, dpj is the propagated error, opj is the output ofneuron j for record p, a is the momentum parameter, and Dwkj(t�1) is the changevalue for wkj in the previous cycle.
Notably, BP networks learn by storing nonlinear information between influenc-ing factors and the strength of influences. By adjusting connection weights duringtraining to match predictions for target values in specific records, the outcomesgenerated by the network improve as the network ‘‘learns’’ [38].
3.1.2. Classification and regression treesThe CART is a decision tree method for constructing a classification or regres-
sion tree according to its dependent variable type, which may be categorical ornumerical [39]. The same predictor field may be used several times at different treelevels. Surrogate splitting optimizes the use of data with missing values. A CART issufficiently flexible to consider misclassification costs as a tree grows and to specifythe prior probability distribution in a classification problem. Decision tree methodsare markedly superior to other modeling techniques in terms of their logic rules[38].
Depending on the target field, three impurity measures can be used to locatesplits for CART models. For instance, Gini is usually applied to symbolic target fieldswhile the least-squared deviation method automatically selects continuous targetswithout explaining the selections. The Gini index g(t) at a node t in a CART, is de-fined by the following equation:
gðtÞ ¼Xj–i
pðjjtÞpðijtÞ ð5Þ
where i and j are target field categories
pðjjtÞ ¼ pðj; tÞpðtÞ ; pðjtÞ ¼ pðjÞNjðtÞ
Nj; and pðtÞ ¼
Xj
pðj; tÞ ð6Þ
where p(j) is the prior probability value for category j, Nj(t) is the number of recordsin category j of node t, and Nj is the number of records of category j in the root node.Notably, when the Gini index is used to find the improvement after a split duringtree growth, only records in node t and the root node with valid values for thesplit-predictor are used to compute Nj(t) and Nj, respectively.
3.1.3. Chi-squared automatic interaction detectorThe CHAID decision tree technique for dataset classification was developed by
Kass [40]. The algorithm’s recursive partitioning method is applied widely in manydomains [41]. It tests for independence using the chi-square test to assess whethersplitting a node improves purity significantly. Specifically, the predictor with thestrongest association (according to its p-value) with the response variable at eachnode is used as a split node. If the tested predictor shows no statistically significantimprovement, no split is performed, and the algorithm stops.
The exhaustive CHAID, which classifies the target field, was developed to ad-dress the limitations of CHAID technique [42]. However, the exhaustive CHAIDmay not optimize the split for a predictor variable because it stops merging catego-ries as soon as it determines that all remaining categories differ significantly. Theexhaustive CHAID avoids over-fitting the full-grown tree to training data by merg-ing predictor categories continuously until only two super categories remain. Itthen identifies the predictor in the series of merges and computes an adjusted p-va-lue for the set of categories that gives the strongest association with the target var-iable. Thus, exhaustive CHAID finds the best split for each predictor and chooseswhich predictor to split based on adjusted p-values [38].
3.1.4. Linear regressionThe multiple linear regression (LR) model, an extension of the simple regression
model, determined the relationship between two and more variables [43]. Its sim-plicity is attractive. The general formula for LR models is
Y ¼ bo þXn
i¼1
biXi þ e ð7Þ
In the proposed model, Y is concrete compressive strength, bo is a constant, bi isa regression coefficient (i = 1,2,. . .,n), e is an error term, and Xi values represent con-crete attributes. The LR model applies four multiple linear regression methods usingordinary least squares: enter, stepwise, forward, and backward.
3.1.5. The generalized linear modelThe GENLIN model, which was developed by Nelder and Wedderburn [44], can
analyze different probability distributions (i.e., normal, binomial, Poisson and gam-ma) for a dependent variable using a link function as a mathematical model to spec-ify the relationship between linear predictors and the distribution function mean.The GENLIN model is more flexible and obtains a more realistic relationship thansimple regression. The assumed distribution pattern of data points and the relation-ship between X and Y are defined in the following equation:
g ¼ gðEðYÞÞ ¼ Xibi þ O;Y � F ð8Þ
where g is the linear predictor, O is an offset variable, Xi is an independent variable, bi
is the slope coefficients and F is the distribution of Y.The three components of GENLIN model are an outcome variable Y with a spe-
cific random distribution with expected value l and variance r2 (E(Y) = l); a linkfunction g(�) connecting the expected value (l) of Y to transform predicted valuesof g[g = g(l)]; and a linear structural model.
3.1.6. Support vector machinesVapnik first introduced SVMs [45]. In this supervised learning method, SVMs
are generated by input–output mapping functions from a labeled training dataset.This function solves both classification and regression problems. Typically, theregression model uses epsilon support vector regression [38], a variation of anSVM for function estimation, to construct the HPC input–output model. In SVMregression, input is first mapped onto an n-dimensional feature space using a fixedmapping procedure. Nonlinear kernel functions then fit the high-dimensional fea-ture space in which input data become more separable compared to input data inthe original input space. The linear model in the feature space, f(x,w), can be ex-pressed by the following equation:
f ðx;xÞ ¼Xm
j¼1
wjgjðxÞ þ b ð9Þ
where gj(x) is a set of nonlinear transformations and b is a bias term. Moreover, esti-mation quality is measured by a loss function Lðx;/Þ where
Le ¼ ½y; f ðx;xÞ� ¼0 if jy� f ðx;xj 6 ejy� f ðx;xÞj otherwise
�
The most novel feature of support vector regression (SVR) is its use of e-insen-sitive loss to compute a linear regression function for the new higher dimensionalfeature space while simultaneously decreasing model complexity by minimizingkxk2. This function is introduced by including nonnegative slack variables ni andn�i , where i = 1,. . .,n is used to identify training samples from the e-insensitive zone.The SVR can thus be formulated as a minimized version of the following function:
min12kxk2 þ C
Xn
i¼1
ðni þ n�i Þ ð11Þ

Table 2The HPC attributes in the datasets.
Attribute Unit Minimum Maximum Average
Dataset 1Cement kg/m3 102.0 540.0 276.50Blast-furnace slag kg/m3 0.0 359.4 74.27Fly ash kg/m3 0.0 260.0 62.81Water kg/m3 121.8 247.0 182.98Super-plasticizer kg/m3 0.0 32.2 6.42Coarse aggregate kg/m3 708.0 1145.0 964.83Fine aggregate kg/m3 594.0 992.6 770.49Age of testing Day 1.0 365.0 44.06Concrete compressive strength MPa 2.3 82.6 35.84
Dataset 2Water to binder ratio % 30.0 45.0 37.60Water content kg/m3 160.0 180.0 170.00Fine aggregate % 37.0 53.0 46.00Fly ash % 0.0 20.0 10.10Air entraining ratio kg/m3 0.04 0.08 0.05Supper-plasticizer kg/m3 1.89 8.5 4.48Concrete compressive strength MPa 38.0 74.0 52.68
Dataset 3Cement kg/m3 160.0 427.0 271.75Fly ash kg/m3 0.0 261.0 151.03Water/powder % 0.3 0.9 0.52SP dosage % 0.0 1.0 0.35Sand kg/m3 478.0 1079.0 836.90Coarse aggregate kg/m3 621.0 923.0 856.05Concrete compressive strength MPa 10.2 73.5 38.52
Dataset 4Coarse aggregate kg/m3 1105.0 1173.0 1135.73Fine aggregate kg/m3 488.0 700.0 602.71Cement kg/m3 408.0 659.0 518.31Silica fume kg/m3 0.0 59.0 24.57Water kg/m3 160.0 168.0 164.74Plasticizer kg/m3 2.2 3.3 2.73High-range water-reducing kg/m3 6.7 14.5 9.30Entrapped air content % 1.3 2.5 1.82Age of testing Days 1.0 56.0 18.81Concrete compressive strength MPa 21.2 113.7 67.11
Dataset 5Fly ash replacement ratio % 0.0 55.0 25.00Silica fume replacement ratio % 0.0 5.0 1.88Total cementitious material kg/m3 400.0 500.0 436.67Fine aggregate kg/m3 536.0 724.0 639.38Coarse aggregate kg/m3 1086.0 1157.0 1125.00Water content lt/m3 150.0 205.0 171.98High rate water reducing agent lt/m3 0.0 13.0 4.87Age of samples Days 3.0 180.0 60.67Concrete compressive strength MPa 7.8 107.8 56.63
Table 3Default model parameter settings.
Defaultmodel
Parameters Options
ANNs Alpha 0.9Initial Eta 0.3High Eta 0.1Low Eta 0.01Eta decay 30Hidden layers Three (20, 15, 10)Persistence 200
CART Level s below root 5Mode SimpleMaximum surrogates 5Minimum change in impurity 0.0001Impurity measure for categoricaltargets
Gini
Minimum records in parentbranch (%)
2
Minimum records in child branch(%)
1
CHAID Mode SimpleAlpha for splitting 0.05Alpha for merging 0.05Chi-square method PearsonMinimum records in parentbranch (%)
2
Minimum records in child branch(%)
1
Epsilon for convergence 0.001Maximum iterations forconvergence
100
Allow splitting of mergedcategories
False
Use bonferroni adjustment True
LR Singularity tolerance 1.0E�4Probability entry 0.05Probability removal 0.1F value entry 3.84F value removal 2.71
GENLIN Distribution NormalSingularity tolerance 1E�007Value order for categorical inputs AscendingScale parameter method Maximum likelihood
estimateCovariance matrix Model-based estimatorConfidence interval level (%) 95
SVMs Stopping criteria 1.0E�3Regularization parameter (C) 10Regression precision (epsilon) 0.1Kernel type RBFRBF gamma 0.1
558 J.-S. Chou, A.-D. Pham / Construction and Building Materials 49 (2013) 554–563
subject toyi � f ðxi;xÞ 6 eþ n�if ðxi;xÞ � yi 6 eþ n�ini; n
�i P 0; i ¼ 1; . . . ;n
8><>:
This optimization problem can be transformed into a dual problem, which issolved by
f ðxÞ ¼XnSV
i¼1
ðai � a�i ÞKðxi; xÞ subject to 0 6 a�i 6 C;0 6 ai 6 C ð12Þ
where nSV is the number of support vectors. The kernel function is
Kðx; xiÞ ¼Xm
i¼1
giðxÞgiðxiÞ ð13Þ
During training, SVM kernel functions (i.e., linear, radial basic, polynomial, or sig-moid function) are selected to identify support vectors along the function surface.Default values of kernel parameters depend clearly on their type and on the softwareimplemented. Software usually treats SVM parameters as user-defined inputs [46].
3.2. Ensemble models and cross-validation
The ensemble approach ranks a set of the above models based on its perfor-mances and then combines the best-performing models into an ensemble model.The ensemble approach can be expressed mathematically as g : Rd ! R with a d-
dimensional predictor variable X and a one-dimensional response Y. Each procedureuses a specified algorithm to yield one estimated function gð�Þ. One estimation by anensemble-based function genð�Þ is obtained by a linear combination of individualfunctions as follow:
genð�Þ ¼XN
j¼1
cj � gð�Þ ð14Þ
where cj comprises the linear combination coefficients, which are simply based onaverage values of different weights.
Generally, this approach yields more accurate predictions than those generatedby conventional models or experts [47,48]. The generalization of predictive modelscan be enhanced by ensemble building or model averaging (Fig. 1).
Researchers often apply the k-fold cross-validation algorithm to minimize biasassociated with random sampling of training and hold out data samples. Kohavi fur-ther confirmed that ten-fold validation testing yields the optimal computationaltime and variance [49]. Thus, this work applied a stratified ten-fold cross-validationapproach to assess model performance. This method categorizes a fixed number ofdata samples into ten subsets, conducts ten rounds of model building and valida-tion, chooses a different data subset for testing, trains the model with the remainingnine data subsets, and uses the test subset to validate model accuracy (Fig. 2). Algo-rithm accuracy is then expressed as average accuracy acquired by the ten models inten validation rounds.

J.-S. Chou, A.-D. Pham / Construction and Building Materials 49 (2013) 554–563 559
3.3. Performance evaluation methods
To evaluate the prediction accuracy of the proposed individual AI models andensemble models, the following performance measures were used.
� Linear Correlation Coefficient (R)/Coefficient of Determination (R2)
R ¼ nP
y � y0 � ðP
yÞðP
y0ÞffiffiffiffiffiffiffiffiffiffiffiffiffiffiffiffiffiffiffiffiffiffiffiffiffiffiffiffiffiffiffiffiffiffiffiffiffiffinðP
y2Þ � ðP
yÞ2q ffiffiffiffiffiffiffiffiffiffiffiffiffiffiffiffiffiffiffiffiffiffiffiffiffiffiffiffiffiffiffiffiffiffiffiffiffiffiffiffi
nðP
y02Þ � ðP
y0Þ2q ð15Þ
where y0 is the predicted value; y is the actual value; and n is the number of datasamples. Likewise, the Coefficient of Determination, R2, is a measure of how welly0 variable account for y variable.
� Mean Absolute Percentage Error
MAPE ¼ 1n
Xn
i¼1
y� y0
y
�������� ð16Þ
� Mean Absolute Error
MAE ¼ 1n
Xn
i¼1
jy� y0 j ð17Þ
� Root Mean Squared Error
RMSE ¼
ffiffiffiffiffiffiffiffiffiffiffiffiffiffiffiffiffiffiffiffiffiffiffiffiffiffiffiffiffi1n
Xn
i¼1
ðy0 � yÞ2vuut ð18Þ
Furthermore, to obtain a comprehensive performance measure, a Synthesis Index(SI) via four statistical measures, 1-R, MAPE, MAE, and RMSE, were derived asfollow:
Step
1St
ep 2
Step
3St
ep 4
Step
5
Fig. 3. Flow chart of the modeling stream for
SI ¼ 1m
Xm
i¼1
Pi � Pmin;i
Pmax;i � Pmin;i
� �ð19Þ
where m is the number of performance measures; and Pi is ith performance measure.The SI range is 0–1; the SI value close to 0 indicates a better accuracy of predictivemodel.
3.4. Experimental setting
3.4.1. Data description and preparationThe efficacy of the prediction models was assessed using published datasets
[3,19–23]. For example, a set of 1133 samples of ordinary Portland cement contain-ing additive materials such as blast-furnace slag, fly ash, and super-plasticizer com-prised dataset 1 [3,20]. Table 1 lists the five datasets with various supplementarycementing materials.
The experimental dataset has been used and confirmed in part or in whole inmany studies of predictive models (i.e., ANNs, GEP, weighted genetic programming,LR modeling, a combination of hyperbolic and exponential equation, and multi-gene GP). Alternatively, this work used six predictive techniques as baseline modelsand investigated performance of ensemble AI models using five experimentaldatasets.
Table 2 lists the databases obtained from various university research laborato-ries, including descriptive data for various additives and various curing times undernormal conditions. The response/target Y is concrete compressive strength and pre-dictor variables X are remaining attributes.
3.4.2. Model constructionTo establish a baseline for validations, modeling parameters were set to default
during experimental comparisons of various data mining (DM) techniques (Table 3).This ensures that the prediction model can be constructed objectively, easily, andsatisfactorily in terms of both utilization and accuracy.
predicting concrete compressive strength.

Table 4Summary of cross-fold modeling performance–individual model.
Dataset Predictive technique Testing set
R RMSE (MPa) MAE (MPa) MAPE (%) SI
Dataset 1ANNs 0.930 6.329 4.421 15.3 0.00 (1)CART 0.840 9.703 6.815 24.1 0.64CHAID 0.861 8.983 6.088 20.7 0.46 (3)LR 0.779 11.243 7.867 29.9 0.99GENLIN 0.779 11.375 7.867 29.9 1.00SVMs 0.923 6.911 4.764 17.3 0.10 (2)
Dataset 2ANNs 0.987 1.548 1.156 2.2 0.00 (1)CART 0.982 1.837 1.368 2.6 0.57 (2)CHAID 0.979 1.994 1.555 3.0 0.99LR 0.979 1.996 1.557 3.0 0.99
GENLIN 0.980 1.996 1.557 3.0 0.96
SVMs 0.981 2.012 1.470 2.7 0.79 (3)
Dataset 3ANNs 0.832 7.104 6.017 17.2 0.33
CART 0.848 7.312 5.671 17.6 0.31 (3)CHAID 0.699 10.040 7.357 20.4 0.72LR 0.917 5.161 4.388 12.6 0.00 (1)GENLIN 0.917 5.163 4.388 12.6 0.00 (2)SVMs 0.726 10.954 9.577 29.1 0.97
Dataset 4ANNs 0.979 4.783 3.660 6.2 0.00 (1)CART 0.976 5.342 4.112 7.1 0.04 (2)CHAID 0.969 6.014 4.801 8.3 0.11 (3)LR 0.804 13.665 11.772 22.7 0.92GENLIN 0.804 13.665 11.772 22.7 0.92SVMs 0.808 14.907 11.978 26.3 0.99
Dataset 5ANNs 0.993 5.867 4.992 2.3 0.01 (1)CART 0.983 7.860 6.496 2.2 0.20 (2)CHAID 0.980 8.307 6.814 2.4 0.27 (3)LR 0.961 11.735 10.047 3.5 0.77GENLIN 0.962 11.596 9.998 3.5 0.75SVMs 0.950 13.145 10.084 4.7 1.00
Note: Underline values denote top three best performance measures for each dataset; (1)–(3): denotes performance ranking.
560 J.-S. Chou, A.-D. Pham / Construction and Building Materials 49 (2013) 554–563
The following steps were performed when using the IBM SPSS modeler [18] toconstruct the proposed models for predicting compressive strength.
� Step 1: Input phase: add data to the source node based on the cross-validationalgorithm.� Step 2: Training model: use the numerical predictor node to train data.� Step 3: Testing model: use the nugget node to validate testing data.� Step 4: Combine models via the ensemble node.� Step 5: Output phase: assess analytical results through table and analysis nodes.
The model was constructed using these five steps (Fig. 3). Analyses were per-formed using a cross-validation algorithm. In each experimental model, one foldof the original dataset was selected to identify and evaluate the best model of eachDM method. The training dataset (remaining folds) was used for model training ineach DM method. To construct the ensemble models, the best single models werecombined and output ensemble scores.
4. Results and discussion
This section gives analytical results and compares ensemblemodel performance with that of six proposed prediction models.The performance of the ensemble models was then compared withthat of AI solutions in previous works.
4.1. Experimental results
Table 4 presents statistical analyses of outcomes from differentmodels. The accuracy measures, as expressed by Eqs. (15)–(19),
were used to evaluate the predictive AI techniques. Table 4 liststhe summary of cross-fold modeling performance for each datasetduring the test period. For example, ANNs (0.00), CART (0.04) andCHAID (0.11) had the best results based on the SI values for dataset4. Notably, their ensemble model (i.e., ANNs + CART) had an evenbetter overall performance measures (Table 5).
The aggregated performance of ensemble models was calcu-lated based on the best performance of the top three individualpredictive techniques. All the best ensemble models had good per-formance in terms of correlations between predicted outputs andactual values (93.3%+, see Table 5). Fig. 4 further compares averageprediction performance of individual models with that of the bestensemble model. In all cases, the best ensemble model perfor-mance was superior to that of individual predictive models.
4.2. Model comparisons
The importance of model-predicting concrete compressivestrength is well recognized in the concrete industry. Thus,researchers have proposed various models to improve the accuracyof predicted HPC compressive strength. Table 6 shows selectedstudies predicting HPC compressive strength. For example, Gan-domi and Alavi used multi-gene GP [50] to predict the compressivestrength of HPC mixtures. Their model yielded R = 0.897,RMSE = 7.310 MPa, and MAE = 5.480 MPa. Their comparisons

Table 5Summary of cross-fold modeling performance–ensemble model.
Dataset Ensemble model Testing set
R RMSE (MPa) MAE (MPa) MAPE (%) SI
Dataset 1ANNs + CHAID 0.922 7.028 4.668 16.2 0.96ANNs + SVMs 0.939 6.174 4.236 15.2 0.00CHAID + SVMs 0.929 6.692 4.580 16.3 0.75ANNs + SVMs + CHAID 0.939 6.231 4.279 15.2 0.07
Dataset 2ANNs + SVM 0.988 1.605 1.140 2.1 0.51ANNs + CART 0.989 1.426 1.075 2.0 0.03SVMs + CART 0.986 1.623 1.245 2.3 1.00ANNs + SVMs + CART 0.989 1.464 1.075 2.0 0.06
Dataset 3CART + LR 0.926 4.993 4.122 12.3 0.48CART + GENLIN 0.926 4.987 4.122 12.3 0.48LR + GENLIN 0.916 5.154 4.370 12.5 1.00CART + LR + GENLIN 0.933 4.751 4.042 12.0 0.00
Dataset 4ANNs + CHAID 0.979 4.831 3.834 6.5 0.58ANNs + CART 0.982 4.466 3.406 5.9 0.00CHAID + CART 0.977 5.131 4.057 7.1 1.00ANNs + CART + CHAID 0.981 4.596 3.572 6.2 0.22
Dataset 5CART + CHAID 0.985 7.224 5.971 2.0 1.00CART + ANNs 0.993 5.078 4.242 1.5 0.00CHAID + ANNs 0.993 5.145 4.214 1.5 0.01
CART + CHAID + ANNs 0.992 5.421 4.470 1.5 0.14
Note: Underline value denotes the best performance measure for each dataset.
J.-S. Chou, A.-D. Pham / Construction and Building Materials 49 (2013) 554–563 561
showed that prediction performance of the optimal GEP model wassuperior to that of regression-based models. Tsai et al. also appliedan evolutionary algorithm–based methodology to a weighted GP(WGP) approach [32]. The WGP model yielded an R2 of 0.957 andan RMSE of 2.180 MPa.
Table 7 presents the improvement and hypothesis testing of thebest ensemble models across various datasets. Their performancemeasures (R) are superior to those of most models in literature(Fig. 5). Notably, the ensemble models obtained low error values(Table 5). For the same dataset, the ensemble models had a higherprediction accuracy than other individual models and those re-ported in literature. For example, for a linear coefficient ofR = 0.982, one ensemble model (ANNs + CART) obtained a lowerMAE (3.406) for dataset 4 (Table 5) compared to that (5.000) ofprevious work in Table 6. Overall, the error rates (i.e., RMSE,
0.93
0 0.987
0.83
2
0.840
0.98
2
0.848
0.86
1
0.979
0.779
0.979
0.779
0.98
0
0.92
3 0.981
0.939
0.98
9
0.00
0.20
0.40
0.60
0.80
1.00
Dataset 1 Dataset 2 D
ANNs CART CHAID LR
Concrete da
Lin
ear
corr
elat
ion
coef
ficie
nt(R
)
Fig. 4. Performance comparison of six indivi
MAE, and MAPE) of ensemble models were 4.2–69.7% lower thanthose of previous models (Table 7).
Unlike previous studies, this work used k-fold cross-validationto ensure good generalization capability. The consistence and reli-ability of modeling performance were evaluated by comparinghypothesis testing results for ensemble models (Table 5) and indi-vidual models/previous works (Tables 4 and 6). For instance, thenull hypothesis H0 associated with prediction accuracy of ensem-ble model (l) is assumed 6 than individual model/previous work(lo) in the R test case. The rejection region must be in the formfl 6 l0g, such that P ¼ ðl 6 l0
��H0Þ ¼ a reaches the desired signif-icance level in the test. In other test cases (RMSE, MAE, and MAPE),the null hypothesis indicates that the mean of average error (l) inthe ensemble model equals or exceeds that in individual model/previous work (lo), and the alternative hypothesis is the denialof H0.
0.979
0.99
3
0.97
6
0.983
0.69
9
0.969
0.980
0.917
0.804
0.961
0.917
0.80
4
0.962
0.72
6 0.808
0.95
0
0.933
0.982
0.993
ataset 3 Dataset 4 Dataset 5
GENLIN SVMs Ensemble
taset
dual models and the ensemble models.
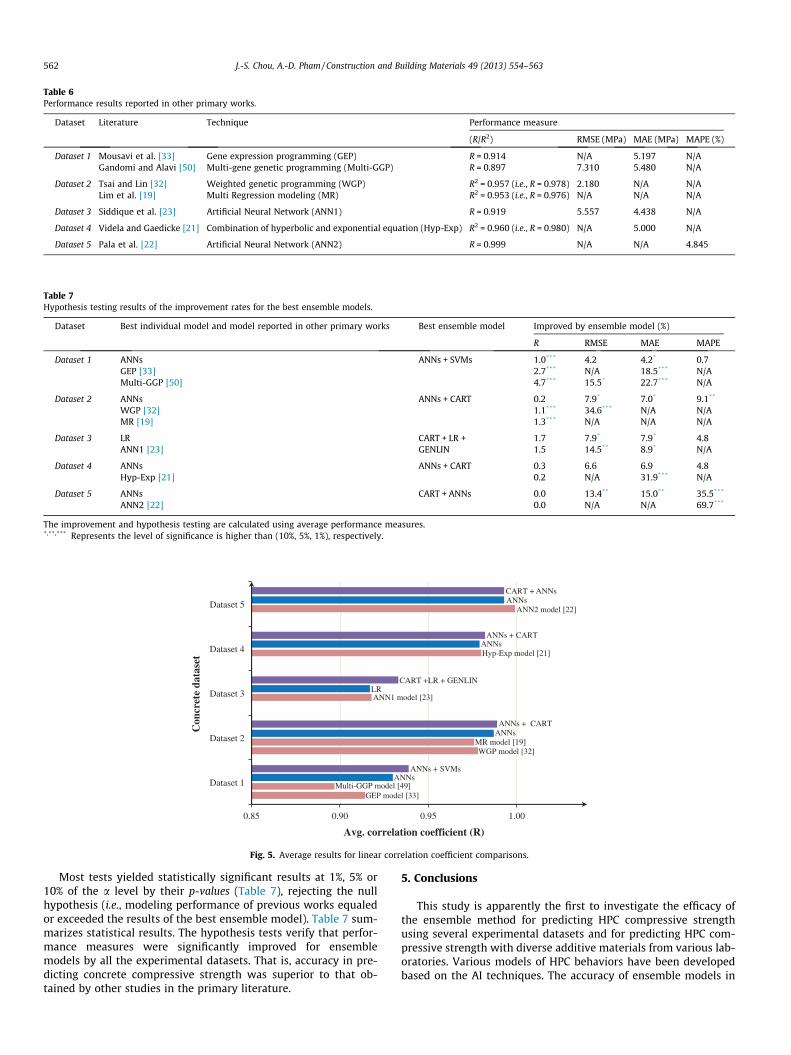
Table 6Performance results reported in other primary works.
Dataset Literature Technique Performance measure
(R/R2) RMSE (MPa) MAE (MPa) MAPE (%)
Dataset 1 Mousavi et al. [33] Gene expression programming (GEP) R = 0.914 N/A 5.197 N/AGandomi and Alavi [50] Multi-gene genetic programming (Multi-GGP) R = 0.897 7.310 5.480 N/A
Dataset 2 Tsai and Lin [32] Weighted genetic programming (WGP) R2 = 0.957 (i.e., R = 0.978) 2.180 N/A N/ALim et al. [19] Multi Regression modeling (MR) R2 = 0.953 (i.e., R = 0.976) N/A N/A N/A
Dataset 3 Siddique et al. [23] Artificial Neural Network (ANN1) R = 0.919 5.557 4.438 N/A
Dataset 4 Videla and Gaedicke [21] Combination of hyperbolic and exponential equation (Hyp-Exp) R2 = 0.960 (i.e., R = 0.980) N/A 5.000 N/A
Dataset 5 Pala et al. [22] Artificial Neural Network (ANN2) R = 0.999 N/A N/A 4.845
Table 7Hypothesis testing results of the improvement rates for the best ensemble models.
Dataset Best individual model and model reported in other primary works Best ensemble model Improved by ensemble model (%)
R RMSE MAE MAPE
Dataset 1 ANNs ANNs + SVMs 1.0*** 4.2 4.2* 0.7GEP [33] 2.7*** N/A 18.5*** N/AMulti-GGP [50] 4.7*** 15.5* 22.7*** N/A
Dataset 2 ANNs ANNs + CART 0.2 7.9* 7.0* 9.1**
WGP [32] 1.1*** 34.6*** N/A N/AMR [19] 1.3*** N/A N/A N/A
Dataset 3 LR CART + LR + 1.7 7.9* 7.9* 4.8ANN1 [23] GENLIN 1.5 14.5** 8.9* N/A
Dataset 4 ANNs ANNs + CART 0.3 6.6 6.9 4.8Hyp-Exp [21] 0.2 N/A 31.9*** N/A
Dataset 5 ANNs CART + ANNs 0.0 13.4** 15.0** 35.5***
ANN2 [22] 0.0 N/A N/A 69.7***
The improvement and hypothesis testing are calculated using average performance measures.*,**,*** Represents the level of significance is higher than (10%, 5%, 1%), respectively.
0.85 0.90 0.95 1.00
Dataset 1
Dataset 2
Dataset 3
Dataset 4
Dataset 5
Con
cret
e da
tase
t
Avg. correlation coefficient (R)
CART + ANNs
ANNs + CART
CART +LR + GENLIN
ANNs + CART
ANNs + SVMs
ANN2 model [22]
Hyp-Exp model [21]
ANN1 model [23]
MR model [19]WGP model [32]
Multi-GGP model [49]GEP model [33]
ANNs
ANNs
LR
ANNs
ANNs
Fig. 5. Average results for linear correlation coefficient comparisons.
562 J.-S. Chou, A.-D. Pham / Construction and Building Materials 49 (2013) 554–563
Most tests yielded statistically significant results at 1%, 5% or10% of the a level by their p-values (Table 7), rejecting the nullhypothesis (i.e., modeling performance of previous works equaledor exceeded the results of the best ensemble model). Table 7 sum-marizes statistical results. The hypothesis tests verify that perfor-mance measures were significantly improved for ensemblemodels by all the experimental datasets. That is, accuracy in pre-dicting concrete compressive strength was superior to that ob-tained by other studies in the primary literature.
5. Conclusions
This study is apparently the first to investigate the efficacy ofthe ensemble method for predicting HPC compressive strengthusing several experimental datasets and for predicting HPC com-pressive strength with diverse additive materials from various lab-oratories. Various models of HPC behaviors have been developedbased on the AI techniques. The accuracy of ensemble models in
J.-S. Chou, A.-D. Pham / Construction and Building Materials 49 (2013) 554–563 563
estimating HPC compressive strength was analyzed, and obtainedresults were validated by individual AI models and previous work.
Particularly, the IBM SPSS modeler, a highly effective and versa-tile data analytics workbench, was utilized to develop six predic-tive techniques (i.e., ANNs, CART, CHAID, LR, GENLIN, and SVMs)as baseline models. Although the best individual models in eachdataset perform well (R P 91.7%) when using cross-fold evaluationmethod, the ensemble models perform even better. Notably, interms of overall performance measurement score, most of the bestindividual models are ANNs in predicting HPC compressivestrength using five experimental datasets.
This work confirms that the ensemble model effectively im-proves performance in predicting HPC compressive strengthand substantially reduces the amount of laboratory work re-quired. Specifically, the ensemble models had superior robust-ness, operational simplicity, and prediction accuracy to those ofother techniques. All ensemble models achieved good predictionperformance (R P 93.3%) and significantly improved the errorrates from 4.2% in previous reports to 69.7%. Their early andaccurate prediction capability is helpful to engineers, technolo-gists, ready-mix operators and concrete mixture designers in ci-vil engineering and to concrete-mixing in batch plants.
Moreover, the proposed ensemble method can be used to opti-mize the quality of HPC mixtures and to reduce the time needed todesign and validate mixtures at various curing times. The proposedapproach is implemented easily and has many potential applica-tions in materials science. Experimental data for materials withcharacteristics resembling those of HPC might provide further evi-dence of the power of the ensemble models for solving differentprediction problems. However, one significant limitation of thiswork is that it used default settings in the single and ensemblemodels. Therefore, further studies are needed to investigateparameters optimization in ensemble models for predicting HPCcompressive strength.
References
[1] Kosmatka SH, Wilson ML. Design and control of concrete mixtures, EB001.15th ed. Skokie, Illinois, USA: Portland Cement Association; 2011.
[2] Aïtcin P-C. Developments in the application of high-performance concretes.Constr Build Mater 1995;9(1):13–7.
[3] Yeh IC. Modeling of strength of high-performance concrete using artificialneural networks. Cem Concr Res 1998;28(12):1797–808.
[4] Papadakis VG, Tsimas S. Supplementary cementing materials in concrete: PartI: efficiency and design. Cem Concr Res 2002;32(10):1525–32.
[5] Ni H-G, Wang J-Z. Prediction of compressive strength of concrete by neuralnetworks. Cem Concr Res 2000;30(8):1245–50.
[6] Kasperkiewicz J, Racz J, Dubrawski A. HPC strength prediction using artificialneural network. J Comput Civ Eng 1995;9(4):279–84.
[7] Bhanja S, Sengupta B. Investigations on the compressive strength of silica fumeconcrete using statistical methods. Cem Concr Res 2002;32(9):1391–4.
[8] Atici U. Prediction of the strength of mineral-addition concrete usingregression analysis. Concrete Research: Thomas Telford Ltd; 2010. p. 585–92.
[9] Yeh IC, Lien L-C. Knowledge discovery of concrete material using GeneticOperation Trees. Expert Syst Appl 2009;36(3, Part 2):5807–12.
[10] Chou J-S, Chiu C, Farfoura M, Al-Taharwa I. Optimizing the prediction accuracyof concrete compressive strength based on a comparison of data-miningtechniques. J Comput Civ Eng 2011;25(3):242–53.
[11] Boukhatem B, Kenai S, Tagnit-Hamou A, Ghrici M. Application of newinformation technology on concrete: an overview. J Civ Eng Manage2011;17(2):248–58.
[12] Sobhani J, Najimi M, Pourkhorshidi AR, Parhizkar T. Prediction of thecompressive strength of no-slump concrete: a comparative study ofregression, neural network and ANFIS models. Constr Build Mater2010;24(5):709–18.
[13] Lee JJ, Kim D, Chang SK, Nocete CFM. An improved application technique of theadaptive probabilistic neural network for predicting concrete strength.Comput Mater Sci 2009;44(3):988–98.
[14] Everingham YL, Smyth CW, Inman-Bamber NG. Ensemble data miningapproaches to forecast regional sugarcane crop production. Agric ForMeteorol 2009;149(3–4):689–96.
[15] Chen S-C, Lin S-W, Chou S-Y. Enhancing the classification accuracy by scatter-search-based ensemble approach. Appl Soft Comput 2011;11(1):1021–8.
[16] Wang S-J, Mathew A, Chen Y, Xi L-F, Ma L, Lee J. Empirical analysis of supportvector machine ensemble classifiers. Expert Syst Appl 2009;36(3, Part2):6466–76.
[17] Wezel MV, Potharst R. Improved customer choice predictions using ensemblemethods. Eur J Oper Res 2007;181(1):436–52.
[18] IBM. PASW Modeler. NY: IBM Corporation, USA; 2010.[19] Lim C-H, Yoon Y-S, Kim J-H. Genetic algorithm in mix proportioning of high-
performance concrete. Cem Concr Res 2004;34(3):409–20.[20] Yeh IC. Modeling slump of concrete with fly ash and superplasticizer. Comput
Concr 2008;5(6):559–72.[21] Videla C, Gaedicke C. Modeling Portland blast-furnace slag cement high-
performance concrete. ACI Mater J 2004;101(5):365–75.[22] Pala M, Özbay E, Öztas� A, Yuce MI. Appraisal of long-term effects of fly ash and
silica fume on compressive strength of concrete by neural networks. ConstrBuild Mater 2007;21(2):384–94.
[23] Siddique R, Aggarwal P, Aggarwal Y. Prediction of compressive strength of self-compacting concrete containing bottom ash using artificial neural networks.Adv Eng Softw 2011;42(10):780–6.
[24] Baykasoglu A, Öztas� A, Özbay E. Prediction and multi-objective optimization ofhigh-strength concrete parameters via soft computing approaches. Expert SystAppl 2009;36(3, Part 2):6145–55.
[25] Ferreira C. Gene expression programming: a new adaptive algorithm forsolving problems. Complex Syst 2001;13(2):87–129.
[26] Prasad BKR, Eskandari H, Reddy BVV. Prediction of compressive strength ofSCC and HPC with high volume fly ash using ANN. Constr Build Mater2009;23(1):117–28.
[27] Lee S-C. Prediction of concrete strength using artificial neural networks. EngStruct 2003;25(7):849–57.
[28] Yeh IC. Analysis of strength of concrete using design of experiments and neuralnetworks. J Mater Civ Eng 2006;18(4):597–604.
[29] Parichatprecha R, Nimityongskul P. Analysis of durability of high performanceconcrete using artificial neural networks. Constr Build Mater2009;23(2):910–7.
[30] Dantas ATA, Batista Leite M, de Jesus Nagahama K. Prediction of compressivestrength of concrete containing construction and demolition waste usingartificial neural networks. Constr Build Mater 2013;38:717–22.
[31] Chen L. Study of applying macroevolutionary genetic programming toconcrete strength estimation. J Comput Civ Eng 2003;17(4):290–4.
[32] Tsai H-C, Lin Y-H. Predicting high-strength concrete parameters usingweighted genetic programming. Eng Comput 2011;27(4):347–55.
[33] Mousavi SM, Aminian P, Gandomi AH, Alavi AH, Bolandi H. A new predictivemodel for compressive strength of HPC using gene expression programming.Adv Eng Softw 2012;45(1):105–14.
[34] Chou J-S, Tsai C-F. Concrete compressive strength analysis using a combinedclassification and regression technique. Autom Constr 2012;24:52–60.
[35] Erdal HI, Karakurt O, Namli E. High performance concrete compressivestrength forecasting using ensemble models based on discrete wavelettransform. Eng Appl Artif Intell 2013;26(4):1246–54.
[36] Liao S-H, Chu P-H, Hsiao P-Y. Data mining techniques and applications – adecade review from 2000 to 2011. Expert Syst Appl 2012;39(12):11303–11.
[37] Alshihri MM, Azmy AM, El-Bisy MS. Neural networks for predictingcompressive strength of structural light weight concrete. Constr Build Mater2009;23(6):2214–9.
[38] SPSS. Clementine 12.0 Algorithm Guide. Chicago, USA: Integral SolutionsLimited; 2007.
[39] Breiman L, Friedman J, Olshen R, Stone C. Classification and regressiontrees. New York: Chapman & Hall/CRC; 1984.
[40] Kass GV. An exploratory technique for investigating large quantities ofcategorical data. J Roy Stat Soc: Ser C (Appl Stat) 1980;29(2):119–27.
[41] Shmueli G, Patel N, Bruce P. Data mining for business intelligence. NewJersey: John Wiley & Sons, Inc.; 2007.
[42] Biggs D, De Ville B, Suen E. A method of choosing multiway partitions forclassification and decision trees. J Appl Stat 1991;18(1):49–62.
[43] Neter J, Kutner MH, Nachtsheim CJ, Wasserman W. Applied linear statisticalmodels. 4th ed. McGraw-Hill/Irwin; 1996.
[44] Nelder JA, Wedderburn RWM. Generalized linear models. J Roy Stat Soc Ser A(General) 1972;135(3):370–84.
[45] Vapnik VN. The nature of statistical learning theory. New York: Springer-Verlag; 1995.
[46] Smola A, Schölkopf B. A tutorial on support vector regression. Stat Comput2004;14(3):199–222.
[47] Adeodato PJL, Arnaud AL, Vasconcelos GC, Cunha RCLV, Monteiro DSMP. MLPensembles improve long term prediction accuracy over single networks. Int JForecast 2011;27(3):661–71.
[48] Wezel M, Potharst R. Improved customer choice predictions using ensemblemethods. Eur J Oper Res 2007;181(1):436–52.
[49] Kohavi R. A study of cross-validation and bootstrap for accuracy estimationand model selection. In: International joint conference on artificialintelligence. Morgan Kaufmann; 1995. p. 1137–43.
[50] Gandomi A, Alavi A. A new multi-gene genetic programming approach tononlinear system modeling. Part I: materials and structural engineeringproblems. Neural Comput Appl 2012;21(1):171–87.