enhanced evaluation of the interdomain routing system for
TRANSCRIPT

This article has been accepted for inclusion in a future issue of this journal. Content is final as presented, with the exception of pagination.
IEEE SYSTEMS JOURNAL 1
Enhanced Evaluation of the Interdomain RoutingSystem for Balanced Routing Scalability and
New Internet Architecture DeploymentsJianli Pan, Student Member, IEEE, Raj Jain, Fellow, IEEE, and Subharthi Paul, Student Member, IEEE
Abstract—Internet is facing many challenges that cannot besolved easily through ad hoc patches. To address these challenges,many research programs and projects have been initiated andmany solutions are being proposed. However, before we have a newarchitecture that can motivate Internet service providers (ISPs)to deploy and evolve, we need to address two issues: 1) knowthe current status better by appropriately evaluating the existingInternet; and 2) find how various incentives and strategies willaffect the deployment of the new architecture. For the first issue,we define a series of quantitative metrics that can potentiallyunify results from several measurement projects using differentapproaches and can be an intrinsic part of future Internet archi-tecture (FIA) for monitoring and evaluation. Using these metrics,we systematically evaluate the current interdomain routing systemand reveal many “autonomous-system-level” observations and keylessons for new Internet architectures. Particularly, the evaluationresults reveal the imbalance underlying the interdomain routingsystem and how the deployment of FIAs can benefit from thesefindings. With these findings, for the second issue, appropriatedeployment strategies of the future architecture changes can beformed with balanced incentives for both customers and ISPs.The results can be used to shape the short- and long-term goalsfor new architectures that are simple evolutions of the currentInternet (so-called dirty-slate architectures) and to some extent toclean-slate architectures.
Index Terms—Balanced incentives, future Internet architec-tures (FIA), interdomain routing, quantitative metrics, routingevaluation, routing scalability.
I. INTRODUCTION
THE ORIGINAL Internet designers did not expect sucha broad expansion of the Internet as it is today. It was
designed almost 40 years ago for a small number of trustedcommunities of universities and institutions, but now, it isbroadly used in business-related contexts. This trend introducessignificant challenges such as routing scalability [1], mobilityand multihoming, renumbering, traffic engineering, and policyenforcement [2]. Many new designs and services have to be
Manuscript received December 15, 2012; revised July 26, 2013; acceptedAugust 30, 2013. This work was supported in part by the National ScienceFoundation’s Directorate for Computer and Information Science and Engineer-ing (CISE) under Grant 1249681 and in part by Cisco University ResearchProgram under a Grant.
The authors are with the Department of Computer Science and Engineering,Washington University in St. Louis, St. Louis, MO 63130 USA (e-mail:[email protected]; [email protected]; [email protected]).
Color versions of one or more of the figures in this paper are available onlineat http://ieeexplore.ieee.org.
Digital Object Identifier 10.1109/JSYST.2013.2281129
supported via ad hoc patches. For example, mobility and se-curity designs and services were not provided and were notsupported in the original Internet architecture, and then patchessuch as Mobile IP [32] and IPSec [33] were incrementallydesigned and applied. Many of the patches are not consistentwith each other, and some basic challenges cannot be solved bythese patches. As a result, the Mobile IP and similar techniqueshave seen limited deployments.
Hence, many research programs and projects have beeninitiated globally targeting at changes to the current Internetarchitecture. We use the term “new Internet architecture (NIA)”to denote not only the clean-slate proposals but also thosethat are simple evolutions of the current Internet architecture.Details of future Internet research can be found in [3] and [4].
However, few NIA designs, particularly the clean-slate ones[5], consider the real incentives for multiple stakeholders,including customers and various Internet service providers(ISPs). They may also be hard to experiment, validate, evaluate,and deploy over the current Internet. The underlying reasons arecomplicated, but one of the most important is the existence ofmultiple stakeholders represented by different ISPs who maybe unwilling to disclose their commerce-sensitive data [6] andalso reluctant to allow experiments on their networks. GlobalEnvironment for Network Innovations [7] aims to create acooperative infrastructure to enable research experimentations.However, for the real-world deployments, more research isstill needed to study the incentives and the impact of multiplepossible strategies.
Therefore, to motivate the ISPs to deploy a new architecture,we need to address two issues.
1) Know the current status better by appropriately evaluatingthe existing Internet, particularly the interdomain routingsystem.
2) Find how various incentives and strategies can affect thedeployment of new architectures.
In other words, NIA designers need more evaluation ap-proaches and results to understand the most up-to-date statusbefore designing and implementing some key features. Suchevaluation can also help the designers to form a “big picture”for appropriate deployment strategies.
However, currently, there is a “gap” between the researchon NIAs and their evaluation efforts. First, new designs mayignore some practical constraints, and it is difficult to evaluate astill-not-existent architecture. Thus, the designers are eager for
1932-8184 © 2013 IEEE

This article has been accepted for inclusion in a future issue of this journal. Content is final as presented, with the exception of pagination.
2 IEEE SYSTEMS JOURNAL
TABLE ISUMMARY AND COMPARISON OF NEW CONTRIBUTIONS OF THIS PAPER
specialized evaluations to support their assumptions, validatetheir ideas, and improve their solutions. Second, most existingevaluation efforts on the current Internet are not for new ar-chitectures, and most evaluation experts do not know what thearchitecture designers really need. Due to this gap, some keyinformation is not available to the designers.
In this paper, we try to fill the gap through a new evalua-tion method. The major innovations can be described in twoaspects.
1) We define several new systematic quantitative metricsand present corresponding evaluations leading to a seriesof new insights over the interdomain routing systemthrough autonomous-system (AS)-level evaluation com-bining multiple public Border Gateway Protocol (BGP)[8] data sources. Our analysis unifies results from severalmeasurement projects using different approaches and canpotentially be an intrinsic part of future Internet architec-tures (FIAs) for monitoring and evaluation.
2) The new findings can help stakeholders (both customersand ISPs) to make the routing system more scalable andto formulate appropriate deployment strategies for futurearchitectures with balanced incentives.
The rest of this paper is organized as follows. Section IIdescribes related work. Section III presents the basic methodol-ogy. The incentives and deployment strategies are discussed inSection IV. Detailed evaluation and analysis are in Section V.Discussions on applying to new architectures are in Section VI.We conclude this paper in Section VII.
II. RELATED WORK
In this section, we discuss some related work.
A. Relationship to Our Previous Work
This paper is a significant step forward over our previouspreliminary evaluation work started in [2]. We present newfindings and add a series of new major contributions in thecontext of a new architecture design and try to form a completeevaluation framework. It also offers a new angle of view intothe evaluation of the routing system for user- and ISP-level
incentives and strategies. Table I briefly describes the newcontributions and compares them to the previous work.
B. Debate Over Address Deaggregation of the Internet
There are different opinions on how severe the Internetaddress deaggregation problem is and how it contributes tothe routing scalability challenge. Cittadini et al. [9] hold anoptimistic opinion and argue that routing table size growthhas not turned worse in recent years, which is opposite ofthe previous alarming findings [10]–[12] and the conclusionreached in [1] by the Routing Research Group (RRG) [13]of the Internet Research Task Force (IRTF). In this paper, wego beyond the debate and aim to view this issue in a longerterm perspective, i.e., in the context of new architectures ratherthan restricted to the current status. When the IPv4 addresspool finally depletes and new architectures are deployed, ourgoal is to find a way to make the development sustainable, thetransition fluent, and the evolution transparent.
C. AS-Level Measurements
We are not the first to do AS-level analysis. In the lastdecade, many papers have used the public BGP data sourcesto analyze the Internet for different purposes such as Internettopology [14], [15], routing table size growth, and prefix ag-gregation [11], [16]–[18]. Roughan et al. [18] summarize theAS-level measurement work of the last ten years and clarifymany controversial observations; the authors also argue againstmany “exercises-like” AS-level topology measurements. Theauthors advocate measuring the AS Internet as an economicconstruct driven by economic incentives and constrained bysociotechnological factors instead of just uninspiring abstractgraphs. Our paper matches this call well.
Although some overlap with some earlier AS-level analysisis unavoidable, our approach is novel because of the follow-ing reasons: 1) we do it in a different way and for differ-ent purposes, i.e., we do it in the context of deploying newarchitectures and estimate how various deployment strategiescan achieve different results; and 2) we set up a system ofnew metrics and study their boundary values for monitoringdeployment progress and maintaining cost effectiveness. We

This article has been accepted for inclusion in a future issue of this journal. Content is final as presented, with the exception of pagination.
PAN et al.: EVALUATING INTERDOMAIN ROUTING SYSTEM FOR ROUTING SCALABILITY AND NIA DEPLOYMENTS 3
TABLE IIDATA SOURCES USED IN OUR EVALUATION AND ANALYSIS
aim to shape short-term goals such as routing scalability andlong-term goals such as new architecture evolution.
D. Work on Scalability and FIA
Despite the debate over the severity of the address deaggre-gation [9] and the argument that hardware technology advancescan make routing table size expansion issue unimportant [31],routing scalability is still one of the direct incentives (althoughnot the only one) motivating the Internet community to lookfor architecture alternatives [1]. The RRG [13] of the IRTFand the Host Identity Protocol [19] and Locator/Identifier (ID)Separation Protocol (LISP) [20] groups of the Internet Engi-neering Task Force have been working on several solutions. Alow-cost transition solution to improve the prefix aggregation ispresented in [21].
Many research efforts have been recently initiated, such asFuture INternet Design (FIND) [23] and latest synergistic FIAprogram [24] from the USA. More details of these and otherglobal architecture design and experimentation efforts can befound in our papers [3], [4].
E. Relationship to This Work
First, new architecture ideas need more knowledge about thelatest status of the Internet and about evaluation methods fordeployment. Second, nontechnical incentives and deploymentstrategies’ analysis are needed for solving the routing scala-bility issue and for long-term architecture evolution. Hence,these two aspects illustrate our unique goals and contributions:1) to provide systematic evaluations on the real-world statusfor deployment reference; and 2) to provide incentives anddeployment strategies’ analysis for NIAs.
III. METHODOLOGY
Internet is too complex, and there is not a single place thatcan claim having a complete copy of raw data characterizingthe “whole picture” of the Internet. Hence, to avoid or limit thechances of biased information, we combine several public inter-domain routing data sources. The three data sources we used in-clude Cooperative Association for Internet Data Analysis [25],Route Views [26], and Classless InterDomain Routing (CIDR)Report [11]. They have different features and we use themfor different purposes. We also carry out cross comparisonsamong these sources to validate the results and observations.For incentives and deployment strategies’ analysis, we combinethe data sources to get a clearer picture of the many factorsthat can impact any new architectural deployment. We evaluate
how the different incentives and deployment strategies lead todifferent results in achieving short- and long-term goals. Thefeatures, comparison, and modeling usage of the three datasources are listed in Table II.
Our evaluation is based on AS-level analysis. Although thereare limitations of such methods for other measurement purposes[18], we find it useful in our evaluation for new architectureresearch. Although AS is always deemed as only a basic routingunit, it is also a basic organizational unit, which is overloadedwith both interdomain routing policy and high-level businessrelationships [2] (indicating cash flow of customer-to-providerand provider-to-provider relationships). These later parts andthe real incentives for the stakeholders are always overlooked.Much information is hidden among the interaction of the ASs,and we want to reveal it through quantitative evaluation. Webelieve that such methods can reveal significant organizationalinformation for the future Internet. These concepts about ASswere also reflected in our Mobility and Multihoming supportingIdentifier Locator Split Architecture (MILSA) architecture [2]and policy-oriented frameworks [27].
In this paper, we define unified quantitative metrics to eval-uate the current status. Some evaluations have used differentapproaches on different data sources and may have drawnbiased conclusions. Using a unified metrics can help mitigatesuch errors and form a complete view of the current Internetby integrating different measurements. In addition, for newarchitectures, a quantitative metrics system integrated into thearchitecture is necessary to monitor and control the Internet.Our effort can be a good starting point for this. Moreover, wetry to avoid the mistakes made by several previous BGP dataanalysis papers that only look at the data without identifyingthe structural components that cause the observations. Hence,in the evaluation for each metric, in addition to analyzing thedata, we have observations and key lesson discussions in thecontext of NIAs, which is one of the key goals of this paper.
IV. FUTURE INTERNET: DEPLOYMENT
INCENTIVES AND STRATEGIES
In view of the debate regarding the future architecture to be aclean-slate or an evolutionary one [28], in this paper, we focuson evolutionary ones since we believe that today’s Internet istoo big to be started over again.
A. Deployment Incentives
We do a detailed evaluation in the next section to addressthe problems faced in the context of both routing scalabilityand future Internet evolution. However, every change needs
This article has been accepted for inclusion in a future issue of this journal. Content is final as presented, with the exception of pagination.
4 IEEE SYSTEMS JOURNAL
TABLE IIIDEPLOYMENT STRATEGIES: THEIR INCENTIVES, MAJOR MOTIVATORS, AND DEPLOYMENT ORDER
balanced incentives and motivations for ISPs and customers.This also applies to the transition to any potential new archi-tecture. For deployment, it is necessary to have a clear strategythat balances the interests of all parties and sets up a “win–win”business model in the technical deployment plan. After athorough investigation, we summarize the incentives into threecategories: 1) privacy and mobility that the new solution canprovide for a single user or a group of users; 2) multihoming,traffic engineering, and easy renumbering; and 3) scalability.Users or ISPs may have different priorities and preferencesin achieving these under certain cost constraints. End usersexpect to pay only for the features they need instead of allavailable features. ISPs are more concerned with protectingtheir investment and being as efficient as possible. For example,the broad usage of provider-independent addresses [1] for stubASs (for portability, multihoming, and load balancing, etc.) puthigh burden on the BGP routers in terms of routing scalability.The ISPs have to keep upgrading their core devices to keep thenetwork running. In general, they may prefer to accept solutionsthat are backward compatible.
In short, we need to balance such incentives and use appro-priate strategies to motivate the deployment. Although there aremany new architecture ideas available, LISP [22] looks closelyto the real deployment. Hence, we use it as an example forsome evaluations in this paper. However, our approach andfindings are not restricted to LISP and are applicable to anypotential NIA.
B. Deployment Strategies
Customer ASs and ISP ASs play different roles in the routingsystem, which means that various deployment orders can leadto different results. Specifically, with the defined metrics andthe evaluation results (see Section V), we can devise multiplecost-effective deployment strategies that fit the demands andincentives of end users and ISPs best. These are the sampleconceptual deployment strategies.
1) Bottom-up Strategy: First deploying functional devicesof the new solution for the stub customers’ ASs, thenthe small- and medium-sized ISPs, and finally at the bigISPs. Multihoming, traffic engineering, and renumberingare the major incentives. Stub customers’ ASs may preferthis strategy due to their motivation of improving theseservices.
2) Top-down Strategy: First deploying the new solution atthe edge of the big ISPs, then the medium- and small-sized ISPs, and finally at the stub customers’ ASs. Mo-bility is the major incentive since both end user and
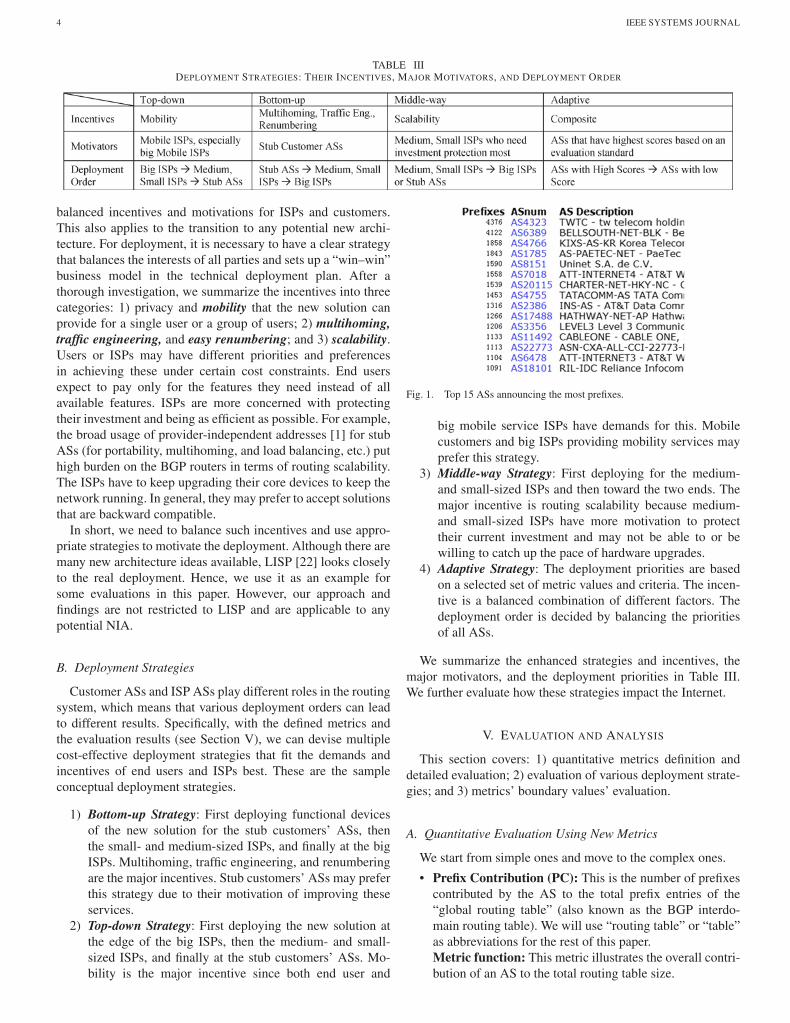
Fig. 1. Top 15 ASs announcing the most prefixes.
big mobile service ISPs have demands for this. Mobilecustomers and big ISPs providing mobility services mayprefer this strategy.
3) Middle-way Strategy: First deploying for the medium-and small-sized ISPs and then toward the two ends. Themajor incentive is routing scalability because medium-and small-sized ISPs have more motivation to protecttheir current investment and may not be able to or bewilling to catch up the pace of hardware upgrades.
4) Adaptive Strategy: The deployment priorities are basedon a selected set of metric values and criteria. The incen-tive is a balanced combination of different factors. Thedeployment order is decided by balancing the prioritiesof all ASs.
We summarize the enhanced strategies and incentives, themajor motivators, and the deployment priorities in Table III.We further evaluate how these strategies impact the Internet.
V. EVALUATION AND ANALYSIS
This section covers: 1) quantitative metrics definition anddetailed evaluation; 2) evaluation of various deployment strate-gies; and 3) metrics’ boundary values’ evaluation.
A. Quantitative Evaluation Using New Metrics
We start from simple ones and move to the complex ones.
• Prefix Contribution (PC): This is the number of prefixescontributed by the AS to the total prefix entries of the“global routing table” (also known as the BGP interdo-main routing table). We will use “routing table” or “table”as abbreviations for the rest of this paper.Metric function: This metric illustrates the overall contri-bution of an AS to the total routing table size.

This article has been accepted for inclusion in a future issue of this journal. Content is final as presented, with the exception of pagination.
PAN et al.: EVALUATING INTERDOMAIN ROUTING SYSTEM FOR ROUTING SCALABILITY AND NIA DEPLOYMENTS 5
Fig. 2. Cumulative PC distribution in the whole AS space (ASs sorted inincreasing order of PCs).
Fig. 3. One-hour sample of BGP updates in August 2009.
Evaluation: In Fig. 1, we present a list of top 15 ASshaving highest prefix contributions (PCs) based on a daily-based snapshot from CIDR Report [11] in 2010. We observethat their PCs are much higher than those of the rest. Forexample, the AS in the first place has a PC of 4376, whereasthe average PC is 9 for all ASs.
We also evaluate the cumulative PC distribution of all ASs inFig. 2 (a data snapshot from 2006). The top 2% (700 ASs) ofthe total AS space contribute over 50% prefixes, whereas the top33% ASs contribute over 90% of the total prefixes in the globalrouting table. The distribution reveals a significant imbalanceamong ASs, which is also close to the so-called “80–20 rule”(or Pareto principle). To verify such imbalance, we furthersample a set of prefixes and the BGP update messages thatthey generate in 1 h in August 2009. (Note that it should not beinferred that these prefixes are from the top ASs that announceprefixes most.) As shown in Fig. 3, we observe that less than5% of the prefixes generate around 80% of the BGP updatemessages. It roughly matches the above “80–20 rule” and thetrend shown in Fig. 2. More on BGP update dynamics analysisand their relationships with prefixes are in [9].
Observations and Key Lessons for NIA: From PC distribu-tion, we can see two types of imbalance in the current interdo-main routing system: 1) between ISPs’ ASs and customer ASs;and 2) among ISPs’ ASs. It is partially due to the structure ofthe current interdomain routing system and because differentASs have different roles in serving other ASs. It means thatthere is still plenty of room for future improvements. Deploying
Fig. 4. AR examples.
transitional solution with higher priorities in the ASs withhigher PCs may be a good start. For NIAs, the PCs (or theircounterpart in the NIA) for an AS should be proportional tothe number of customers or actual usage under their terri-tory. It also needs to be monitorable and controllable fromarchitecture-level supports. Devising such standard metric andallowing comparison among different NIA deployments canpotentially help see and evaluate the performance of NIAs.
• Aggregation Ratio (AR): This is the ratio of the number ofprefixes announced outside after aggregation inside the ASto the total prefixes announced outside. It is described as
aggregation ratio (AR) = P a/(P a +N) (a).
Metric function: This metric approximately describeshow well a specific AS performs aggregation inside itself.
Pa is the number of prefixes announced outside after aggre-gation inside the AS, and N represents the prefixes the AS getsfrom its “customer cone” that are not aggregated. (Note: Fora transit AS, all its customer ASs and customer-of-customerASs form a “cone,” including the transit AS itself, and weuse algorithms and data from [25] for such “cone” evaluation.)(Pa +N) is the number of total prefixes announced by theAS. However, note that the prefixes are considered “aggregatedinside the AS” only when there is a precise match of AS pathso that the traffic transit policies are preserved. In addition,note that the aggregation does not mean perfect or maximumone. We give two examples to illustrate the AR definition andthe way to compute it in Fig. 4. For example (a), Pa = 1 andN = 1; hence, AR = 1/2. For example (b), Pa = 1 and N = 0;hence, AR = 1. Note the difference between our definitionand the deaggregation factor defined in [9], we focus on theaggregation behavior of an AS along the AS paths insteadof simply using the ratio between the number of announcedprefixes and allocated blocks.
Evaluation: We evaluate the ARs of the 32 125 ASs and sortthem in decreasing order by their PCs. The results are shown inFig. 5. Interestingly, we observe the symmetric distribution nearthe horizontal line of AR = 0.44. The top group with ARs closeto 1 represents the stub customer ASs, and the dots below it withARs ranging from 0 to 0.95 are mostly ISPs. We further dividethe ISPs into two categories based on the value of AR = 0.44,and hence, we have three groups of ARs. Roughly, Group 1has lowest ARs and are mostly big- and medium-sized ISPs;Group 2 consists of mostly medium- and small-sized ISPs whohave AR values in the middle; and Group 3 are mostly stubcustomer ASs having ARs close to 1.

This article has been accepted for inclusion in a future issue of this journal. Content is final as presented, with the exception of pagination.
6 IEEE SYSTEMS JOURNAL
Fig. 5. AR distribution in the whole AS space (ASs are sorted in decreasingorder by PCs).
Fig. 6. Number of ASs and prefixes announced in groups 1, 2, and 3.
We then study the numbers of ASs in each group and howmuch they contribute to the total routing table size. The resultsare shown in Fig. 6. Groups 1 and 2 (mostly ISPs) only cover27% of total AS space but contribute more than 81% of totalprefixes in the routing table. Moreover, we observe that big- andmedium-sized ISPs generally have low ARs, and small ISPs andstub customer ASs have higher ARs due to their location nearthe edge. In the ideal case, if perfect aggregation is performed,every AS should have AR = 1. However, in the current Internet,the top 50 ASs with the highest PCs have an average AR of0.44, and taking all the stub ASs’ ARs into account, the averageAR of the whole AS space is only 0.61.
Observations and Key Lessons for NIAs: The aggregationfor the current Internet, particularly those big ISP ASs, isfar away from the ideal case due to many factors. Businessrelationships intermixed with routing protocol may be one ofthem. Although some hold positive view over the aggregationissue [9], for NIA consideration, particularly in near term whenIPv6 has to come and in longer term of the world of “Internetof Things” [30] where smart devices are everywhere, the hugeaddress space and Internet scale make better aggregation evenmore important. Separation of multiple-level ID spaces fordedicated functions may avoid semantic overloading and makethe aggregation easier and more manageable.
• Cumulative Aggregation Ratio (CAR): Of a collectionof ordered ASs is the ratio of the total aggregated pre-fixes to the total prefixes in the table contributed by thecollection.Metric function: This approximately describes how wellthe collection of ASs performs aggregation inside thecollection. Detailed cumulative AR (CAR) evaluation andimprovements for different strategies are presented inSection V-B3.
Fig. 7. APAR distribution in the whole AS space (ASs are sorted in decreasingorder by APARs).
The above metrics are about a single or a group of ASs anddo not reveal the interaction among ASs, particularly amongASs in the customer cone. Hence, we have more metrics.
• Absolute Prefix-to-AS Ratio (APAR): This is the totalprefixes announced by the ASs in the customer cone of theAS. It can be expressed as
APAR = Σ(PC)cone (b).
Metric function: The metric approximately describes theposition of the AS in the AS hierarchy and how well itscustomer cone performs aggregation.
Evaluation: Note the difference with PC. Absolute prefix-to-AS ratio (APAR) is the sum of the PCs in the customercone. The higher level the AS is located in the AS hierarchy,the bigger the APAR it generally has. For example, in ourdata sample, AS 1239 (Sprint) has APAR of 263 628, whereasAS 2552 (Washington University) has APAR of 62. We alsostudy the APAR distribution among the whole AS space, whichis shown in Fig. 7. There are very significant differences amongthe APARs of the three categories (i.e., backbone, middle,and stub).
Observations and Key Lessons for NIAs: Compared withAR, the metric of APAR is a more straightforward and accuratereflection of the target ASs’ position in the AS tree. BiggerAPARs generally reflect poorer aggregation in the customercone. However, they cannot reflect the exact impact of thecustomer cone to the target AS and need other metrics. Forexample, for two ASs with the same APAR, we cannot easilytell which one does aggregation better. We use relative prefix-to-AS ratio (RPAR) to help depict the inside aggregation status.For a NIA such as MILSA [2], an AS is also an organizationalbusiness management unit besides being a basic routing unit.The business-level policy is separate from routing and packetforwarding. The APAR distribution can be a lot more balanced.By dedicated control and management planes, an AS will havestronger interactive capability with its customer cone to keepthe overall routing balanced and scalable.
• Relative Prefix-to-AS Ratio (RPAR): This is the ratio ofthe total unique prefixes announced by the AS’s customer

This article has been accepted for inclusion in a future issue of this journal. Content is final as presented, with the exception of pagination.
PAN et al.: EVALUATING INTERDOMAIN ROUTING SYSTEM FOR ROUTING SCALABILITY AND NIA DEPLOYMENTS 7
TABLE IVAPAR AND RPAR FOR THE TOP 15 ASS WITH HIGHEST APAR
Fig. 8. RPAR distribution in the whole AS space (ASs are sorted in decreasingorder by APAR).
cone to the number of total ASs in the cone
RPAR = Σ(PC)cone/Σ(AS)cone (c).
Metric function: This approximately depicts the averageaggregation status in the customer cone.
Evaluation: Intuitively, smaller RPAR means better averageaggregation in that customer cone. For example, AS 1239(Sprint) has RPAR of 9.4 and AS 2552 (Washington University)has RPAR of 62. Washington University is announcing prefixesmore than the average. However, we may draw wrong conclu-sion if we see RPAR only. We know that Sprint is a big ISP andits customer cone included a lot of downstream ASs; hence,the RPAR of 9.428 is an average number. To explore the innerrelationship between APAR and RPAR, we take the top 15 ASsin Fig. 1 and compare their APARs and RPARs. The resultsare shown in Table IV. It shows no absolute linear relationshipbetween APARs and RPARs. Instead, there is a very obviousvariation among the RPARs of different ASs. The variationmeans that even for two ASs with the same APAR, their RPARscan be significantly different due to the complexity inside theircustomer cone. We further study the RPAR distribution amongthe whole AS space, as shown in Fig. 8. Compared with APAR,it exhibits a little fluctuation for the ISPs’ part, which is mostlydue to the complexity inside ISP ASs.
Observations and Key Lessons for NIAs: We may com-bine the APAR and RPAR to decide which ASs have betteraggregation even when they have the same APAR. We maytake both metrics into consideration and effectively developa deployment strategy. Specifically, for a NIA deployment, arecursive method can be taken from bottom to top level orreversely to inspect the metric values for the ASs to decidesuitable deployment strategies. In addition, the above method
will help identify where the imbalance is located in the customercone and keep the routing plane stable.
We summarize the key metrics and their major functions inTable V. For the rest of this paper, we use the above new metricsto carry out further in-depth evaluation.
B. Deployment Benefits of Various Strategies
We focus on evaluating the effects of the strategies in reduc-ing the routing table size, improving the PCs of each type ofASs, and improving CARs.
1) Benefit of Total Prefix Numbers’ Decrease: First, wepresent an enhanced evaluation on the possible benefits ofdecreasing the routing table size. In this paper, we addressthree key limitations of our previous work [2]: 1) It assumedstatic starting point and neglected the 20% natural increase eachyear; 2) it considered only the scalability-driven model and onlythe first half phase, and no evaluation on complete scenariosof all the strategies; and 3) the predefined deployment rates(i.e., 10%, 20%, and 30% each year) were too conservative fordeployment. Therefore, we address the problems and conduct amore complete evaluation.
We assume a “phase-by-phase” deployment pattern in whicha specific group of ASs (such as big ISP ASs) finishes de-ployment following the others (such as medium and small ISPASs or stub ASs). Hence, the deployment process is dividedinto two phases for all the three strategies. For the sampleunder study, the total routing table size starts around 310 000.Due to the deployment, the regular 20% natural increase everyyear will gradually decrease, and therefore, we simulated thiseffect in Fig. 9. Initially, the total routing table size increasesbut soon begins gradually decreasing due to the continuousdeployment until it reaches a level close to the lower boundof the phase. In each phase, we curve the shapes to simulatethe effects that the new technique deployment is relativelyslow at the beginning and end periods and faster in the middleperiod.
Observations and Key Lessons for NIAs: Fig. 9 showsthat in terms of reducing table size, the “middle-way strategy”is more effective compared with the other two strategies inthe studied period, whereas “top-down strategy” and “bottom-up strategy” are relatively close. For even longer term NIAconsiderations, we need to guarantee that whichever strategyis taken, finally, it will reach the same status as expected in theNIA design. The findings in this paper will help achieve costeffectiveness for the deployment process.
The above observations validate our evaluation inSection V-A and the strategy discussion in Section IV in thatthe middle-way strategy is mostly driven by the large number

This article has been accepted for inclusion in a future issue of this journal. Content is final as presented, with the exception of pagination.
8 IEEE SYSTEMS JOURNAL
TABLE VSUMMARY OF THE KEY METRICS AND THE MAJOR USAGE COMPARISON
Fig. 9. Prefix decrease for the three strategies with deployment speeds of10%, 20%, and 30% per month.
of medium and small ISPs, which are the major motivators forscalability-oriented solutions and strategies. Specifically formiddle-way strategy, we consider three deployment speeds,i.e., 10%, 20%, and 30% each month; they finally meet atthe endpoint of phase 1 and by then we can achieve about44% reduction in a period of 11 months compared with about20% reduction for the top-down and bottom-up strategies. Forphase 2, the middle-way strategy finishes deployment on thebig ISP and stub ASs with further 70% reduction (using the endof phase 1 as a starting point), and the top-down and bottom-upstrategies finish the deployment on the small and mediumISPs with further 67% reduction in the following period of11 months. Note that at the end of phase 2, the curves of thethree strategies do not meet because phase 3 deployment is stillpending. They will finally join when all phases are finished.
2) PC Improvement of Each Strategy: We further evaluatethe PC improvements of the three strategies. First, we havethe original cumulative PC data, as shown in Fig. 2, and westudy the three strategies separately and reveal the potentialdifference. The results are shown in Fig. 10. We evaluate andcompare the data at the end of phase 1 deployment of the threestrategies. We do not consider the deployment speeds here toavoid too much information mixed altogether. Note that wesorted the data in a decreasing order to calculate cumulativePC. In Fig. 10, similar to Fig. 2, the original cumulative PC dis-tribution shows very imbalanced status. In Fig. 10, we can seethat the middle-way strategy achieves significant improvementcompared with others. The shape of the curve shows that thevalues of PCs are smaller than the original ones. Top-down and
Fig. 10. Cumulative PC improvements with the three deployment strategies.
bottom-up strategies show close effects but not as good as themiddle-way strategy.
Observations and Key Lessons for NIAs: Intuitively, thelower the curve, the better balance is achieved in the overallaggregation of the routing system, hence better scalabilityduring the deployment progress. The difference will diminishin the NIA when the whole deployment is finished.
3) CAR Improvements: Here, we evaluate the CAR im-provements by the three strategies. We continue our preliminaryevaluation in [1] by: 1) basing our evaluation on new quanti-tative metric of CAR; 2) adding the new middle-way strategyevaluation; and 3) adding more results and discussions on theimplications.
We show the CAR improvement results in Fig. 11. Beforethe deployment, the CAR ranges from 0.44 for the top 50 ASsto 0.61 for the whole AS space. We sort the ASs accordingto their PCs in a decreasing order. For top-down strategy, wedeploy first at the top ISPs, and for the first step, we assumehalf of their unaggregated prefixes to be aggregated. We makethis assumption since we cannot expect that all the ISPs canfinish the deployment overnight, but we can first aggregate theprefixes that failed to aggregate previously, hence increasingthe ARs. Note that the results in this paper are based on theclassification of new strategies, and we also added the curve forthe “middle-way” strategy. It shows that the CARs are signifi-cantly improved under the top-down strategy. Note that thereare several “turning points” on the curve, which are markedwith dashed circles in Fig. 11. They happen to be at the inter-sections between different types of ASs, which matches thegrouping results that we found in Fig. 6. For example, for the

This article has been accepted for inclusion in a future issue of this journal. Content is final as presented, with the exception of pagination.
PAN et al.: EVALUATING INTERDOMAIN ROUTING SYSTEM FOR ROUTING SCALABILITY AND NIA DEPLOYMENTS 9
Fig. 11. CAR improvements of the three strategies [Note: 1) ASs are sortedin decreasing order by their PCs; and 2) assume a first step of 50% reduction ofthe unaggregated prefixes].
second point, the CAR curve turns down a little bit since mostof the stub ASs cannot benefit from the top-down strategy.
Similarly, we have curves for the bottom-up and middle-waystrategies. The middle-way strategy shows CARs’ improvementlower than the top-down strategy but higher than the bottom-up strategy. The bottom-up strategy provides little CARs’ im-provement, indicating that it may not be as effective as the othertwo in terms of reducing the routing table size.
Intuitively, the results in Fig. 11 show that the top-downstrategy improves the CARs most. However, it may be a littlemisleading since it does not directly match Figs. 9 and 10 inwhich the middle-way strategy literally shows the best effectsin achieving PCs and total table size reduction. Note that inFig. 11, the y-axis is the cumulative distribution function (cdf)of the ARs, and the x-axis is the ASs in logarithmic decreasingorder sorted by their PCs. Unlike the evaluations in Figs. 9 and10, here, we only focus on CAR. The left parts of the curves forthe three strategies are mostly the tier-1 and big ISPs’ ASs thathave higher PCs. Therefore, deploying new solution in theseASs leads to a significant CAR improvement for these ASssince the other ASs are not counted into the cdf yet. Combiningthis with the above “turning points” observation, we have thefollowing.
Observations and Key Lessons for NIAs: For aggregationimprovement, the most effective way is to follow the top-downstrategy and deploy in big or tier-1 ASs first, and then combineit with other strategies by recursively improving the aggregationlevel by level starting from the bottom stub ASs. However, dueto the overloaded semantic of current AS [2], changing the topof the AS hierarchy may need synergy from the customer cone.It is also the reason we define APAR and RPAR to reflect suchinteractions. For NIAs, such interactive mechanisms shouldbe provided from architecture level such as the inter-realmcommunication mechanism in [2].
C. Monitoring Deployment by Metrics’ Boundary Values
We now estimate the metrics’ “upper or lower bound” valuesin a well-aggregated Internet. Doing this can be helpful in mon-itoring the deployment progress and help put the investmentinto the most cost-effective parts first. Here, the ideal case
means that IP semantic overloading problem has been solvedand locator aggregation is performed effectively.
• PC: The PC of each AS is determined by its position inthe AS hierarchy. For tier-1 ASs, their PCs are at least1 (sufficient), or more than 1 (more than minimum, butmay be allowed for transition or temporary engineeringpurposes). Other ASs’ prefixes are not needed to appear inthe routing table since they will be aggregated by the tier-1ASs’ prefixes. Hence
PC=1 for tier-1ASs and 0 for all the other ASs.(1)
Certainly, during the interim period before reaching theideal case, the PC of the ASs will be larger than the valuesin (1) and it will get closer as the deployment proceeds.
• AR: In the boundary case, each AS will aggregate theprefixes under its domain and announce outside only oneaggregated prefix covering all its space. This is to say that
AR = 1 for all ASs. (2)
Note that AR = 1 does not guarantee perfect aggrega-tion, but perfect aggregation always means AR = 1. Foraggregation improvement progress, AR is a good deploy-ment touchstone.
• CAR: Similar to AR, as long as the ASs perform efficientaggregation, for ASs in each level, no matter where theyare located in the AS hierarchy, the CAR will be one. Thisis to say that
CAR = 1 for all ASs. (3)
• APAR: From (1), for tier-1 ASs that have prefixes an-nounced in the routing table, due to the perfect aggre-gation, their APARs will be equal to the PCs since theirdownstream ASs’ prefixes are aggregated by their singleprefix. This is to say that
APAR=1for tier-1ASsand0forall theotherASs.(4)
Although APAR and PC demonstrate similar bound-ary values, they have different meanings in evaluatingthe progress of deployment. Specifically, PC describes asingle AS’s behavior, whereas APAR shows a set of ASs’behavior in the customer cone. They cannot replace eachother. Instead, combining these two is an efficient wayto monitor the progress of the aggregation inside an AScustomer cone.
• RPAR: RPAR value is the APAR divided by the numberof ASs in the cone. Hence
RPAR = 1/Σ (AS)cone for tier-1
ASs and 0 for all the other ASs. (5)
It is easy to see that the boundary RPARs for the tier-1ASs are very close to 0, whereas the others are all 0.RPAR shares little difference between top-tier and thelower tier ASs. However, in the deployment process, the

This article has been accepted for inclusion in a future issue of this journal. Content is final as presented, with the exception of pagination.
10 IEEE SYSTEMS JOURNAL
dynamics of such differences can be used as an effectiveway to monitor the progress.
For the total routing table size, in an ideal aggregation case,it can be the number of tier-1 ASs. However, it is also possiblethat each tier-1 AS may announce a little more than 1 prefix.This is controllable due to the small amount of tier-1 ASs. Itwill be also smaller than the total number of ASs since mostlower tier ASs’ prefixes are aggregated and will not appear inthe interdomain routing table. Hence, the changing dynamics ofthe table size can be a vivid “index point” for the deploymentprogress of the new architecture.
VI. REASONING TO NIAs
In this section, we present the discussion on the reasoning ofthe evaluation results to NIAs.
A. Evaluation Results
1) Quantitative Metrics and the Corresponding EvaluationsReveal New Findings Useful for NIAs: This paper shows manyfacts and trends on the status of the current interdomainrouting system, the contributions of different types of ASs(big, medium, and small ISPs’ ASs and customer ASs), theirrelationships and interactions (AR, CAR, APAR, RPAR, etc.)leading to the problem space, and the underlying implications.It provides useful tips for how the problems can be effectivelyalleviated or solved. It also lays the foundation for furtherincentives and deployment strategies’ evaluation.
2) Successful Design and Deployment of New ArchitecturesNeed Full Consideration on Incentives for Both Customer andISPs and With Balanced Strategies: Any change to the Internetneeds appropriate incentives to get a chance to succeed. Thisobservation is validated by the National Science Foundationreport [29] on the latest trends in the future Internet research.In the evaluation, we find that various deployment orders leadto significantly different results. Thus, we are interested inhow new solutions can benefit from the findings for differentinterest groups. We discuss real incentives, specify their majormotivators, and show how they can influence the formulationof practical deployment strategies. Further evaluation of themajor benefits of the three strategies shows effectiveness andunderlying implications concerning all possible improvements.
3) Boundary Value Analysis for Various Metrics ProvidesGood Guidelines for Monitoring and Evaluating the Deploy-ment Progress of New Architectures: New architecture designs,even with solid technical qualities, may have to experience longdeployment and evolution process. For various strategies, thisprocess can be monitored and measured by boundary valuesof various metrics and can serve as an “index value” forimprovements, hence achieving cost effectiveness by dynamicadjustments of these strategies.
B. Balance Issue
It is impossible to get absolute balance for the routing systemsince ISP ASs have different roles than stub customer ASs inthe AS hierarchy. Instead, by better balanced Internet, we mean
that ASs with similar roles (“type-2 imbalance,” as discussed inSection V-A) should be equal in sharing the responsibilities ofkeeping the prefixes aggregated in a sustainable and balancedway. We can discuss the imbalance in technical and nontechni-cal senses. Technically, the current routing design is old, andits enforcement does not address the prefixes allocation andaggregation very well. Hence, future Internet has to addressthe weakness and pitfalls of the current design. With newprinciples, NIAs have to be open and consider all the currentlimitations and define clear and feasible changing steps. Fromnontechnical aspects, the Internet is currently intertwined withcommercial interests of ISPs and customers. The imbalanceof the routing system is an embodiment of the imbalanceunderlying the social commercial interests. Hence, in thefuture design, the commercial and human factors need to beincluded into the architecture design, i.e., the future Internet isa “network of the people.” Hence, balancing incentives for allstakeholders at every step of the changes is important.
C. Short- and Long-Term Goals of Future Internet
1) On Short-Term Goals and Effects: The evaluation pro-vides hints on how to achieve short-term routing scalabilitywith various speeds. For example, several quantitative metrics’values can be improved directly or indirectly. For direct im-provement of an individual AS, we may first improve the PCand AR since improving the inner aggregation of each AS isrelatively easier than improving a whole AS customer cone.By carrying out such improvements step by step in differentISPs’ ASs, the overall routing scalability can be improved sig-nificantly. For indirect improvement, the two metrics of APARand RPAR demonstrate the behavior of a group of ASs and theirintegrated impacts on the rest of the Internet. Combining thesetwo metrics can further improve the overall routing scalability.The boundary values of these metrics can be used to evaluatehow well the short-term goals have been achieved.
Moreover, various deployment strategies lead to differenteffects in achieving the short-term goals depending on the realdemands. Multiple incentives decide the existence of variousstrategies and, hence, different short-term achievements.
2) On Long-Term Goals and Effects: The new findings ofthe evaluation also provide important guidelines for futuresolutions aiming at a long-term architecture evolution. Forsuch considerations, the new architecture has to be open andextensible to accommodate demands and changes from ISPsand users, which may urge design principles different from theoriginal ones [5], [28]. From a practical view, Internet shouldbe able to evolve from the current through gradual steps.
Moreover, evaluating the current Internet is too difficultand inconvenient [18]. For long-term consideration, systematicmonitoring and evaluation capabilities (methods and tools)should be provided and supported at the architecture levelto identify problems and find needed changes. In other words,the AS-level analysis method is used in this paper as allother existing works do not have to worry about the limiteddata sources and the limited inference methods. Instead, theinnovative method using quantitative metrics in this paper canbe a norm and a part of the NIA itself.

This article has been accepted for inclusion in a future issue of this journal. Content is final as presented, with the exception of pagination.
PAN et al.: EVALUATING INTERDOMAIN ROUTING SYSTEM FOR ROUTING SCALABILITY AND NIA DEPLOYMENTS 11
D. Limitations of the Evaluation
Several limitations of our evaluation are worth discussing.
1) Our evaluation is based on some existing public BGP datasources. However, every BGP observation point has itslimited visibility. Other useful data such as finer granular-ity traffic patterns of the ASs are hard to get because of thenondisclosure agreements of the Internet stakeholders [6].
2) The existing topology data and the prescreen algorithmswe use may also not be accurate enough due to theextreme complexity of the interdomain routing system.
3) Internet is changing fast, and many latest trends may notbe revealed in our work.
4) In deployment benefits’ evaluation, we only considersome solutions, but future ones may deviate from them.
Due to these limitations, the evaluations are not 100% accu-rate. However, our goal is to present a reference and guide forthe potential new architectures, which is the unique contributionof this paper as the first such effort.
VII. CONCLUSION
In this paper, we have tried to fill a gap between the designs ofNIA and the evaluation efforts through an AS-level interdomainrouting system evaluation. The major idea was systematicallydefining a series of quantitative metrics to reveal hidden in-formation and observations that may be useful in improvingthe status and deploying candidate new architectural solutions.The results of the evaluation can be further applied to find thedeployment strategies with balanced incentives for both cus-tomers and ISPs.
REFERENCES
[1] D. Meyer, L. Zhang, and K. Fall, “Report from IAB workshop on routingand addressing,” RFC 4984, Sep. 2007.
[2] J. Pan, R. Jain, S. Paul, and C. So-In, “MILSA: A new evolutionaryarchitecture for scalability, mobility, and multihoming in the future In-ternet,” IEEE J. Sel. Areas Commun., vol. 28, no. 8, pp. 1344–1362,Oct. 2010.
[3] J. Pan, S. Paul, and R. Jain, “A survey of the research on future In-ternet architectures,” IEEE Commun. Mag., vol. 49, no. 7, pp. 26–36,Jul. 2011.
[4] S. Paul, J. Pan, and R. Jain, “Architectures for the future networks andthe next generation Internet: A survey,” Comput. Commun., vol. 34, no. 1,pp. 2–42, Jan. 2011.
[5] A. Feldmann, “Internet clean-slate design: What and why?” SIGCOMMComput. Commun. Rev., vol. 37, no. 3, pp. 59–64, Jul. 2007.
[6] C. Labovitz, S. Iekel-Johnson, D. McPherson, J. Oberheide, andF. Jahanian, “Internet inter-domain traffic,” in Proc. ACM SIGCOMM,Aug. 30/Sep. 3, 2010, pp. 75–86.
[7] Global Environment for Network Innovations (GENI) Project. [Online].Available: http://www.geni.net/
[8] Y. Rekhter, T. Li, and S. Hares, “A Border Gateway Protocol 4 (BGP-4),”IETF, Fremont, CA, USA, IETF RFC 4271, Jan. 2006.
[9] L. Cittadini, W. Mühlbauer, S. Uhlig, R. Bush, P. François, andO. Maennel, “Evolution of Internet address space deaggregation: Mythsand reality,” IEEE J. Sel. Areas Commun., vol. 28, no. 8, pp. 1238–1249,Oct. 2010.
[10] G. Huston, “Analyzing the Internet BGP routing table,” Internet ProtocolJ., vol. 4, no. 1, pp. 2–15, Mar. 2001.
[11] T. Bates, P. Smith, and G. Huston, The CIDR Report. [Online]. Available:http://www.cidr-report.org
[12] X. Meng, Z. Xu, B. Zhang, G. Huston, S. Lu, and L. Zhang, “IPv4 addressallocation and the BGP routing table evolution,” ACM Comput. Commun.Rev., vol. 35, no. 1, pp. 71–80, Jan. 2005.
[13] IRTF Routing Research Group Charter. [Online]. Available: http://www.irtf.org/charter?gtype=rg&group=rrg
[14] K. Xu, Z. Duan, Z.-L. Zhang, and J. Chandrashekar, “On propertiesof Internet exchange points and their impact on AS topology and rela-tionship,” in Networking. Berlin, Germany: Springer-Verlag, 2004,pp. 284–295.
[15] H. Haddadi, M. Rio, G. Iannaccone, A. Moore, and R. Mortier, “Networktopologies: Inference, modeling and generation,” IEEE Commun. SurveysTuts., vol. 10, no. 2, pp. 48–69, 2nd Quart., 2008.
[16] G. Huston, “Scaling inter-domain routing—A view forward,” InternetProtocol J., vol. 4, no. 4, pp. 2–16, Dec. 2001.
[17] T. Bu, L. Gao, and D. Towsley, “On characterizing BGP routingtable growth,” in Proc. IEEE Global Telecommun. Conf., Nov. 2002,pp. 2185–2189.
[18] M. Roughan, W. Willinger, O. Maennel, D. Perouli, and R. Bush, “10 less-ons from 10 years of measuring and modeling the Internet’s autonomoussystems,” IEEE J. Sel. Areas Commun., vol. 29, no. 9, pp. 1810–1821,Oct. 2011.
[19] IETF Host Identity Protocol (HIP) working group charter. [Online].Available: http://datatracker.ietf.org/wg/hip/charter/
[20] IETF Locator/ID Separation Protocol (LISP) working group charter.[Online]. Available: https://datatracker.ietf.org/wg/lisp/charter/
[21] H. Ballani, P. Francis, T. Cao, and J. Wang, “ViAggre: Making RoutersLast Longer!” in Proc. Hotnets, 2008, pp. 1–6.
[22] D. Farinacci, V. Fuller, D. Meyer, and D. Lewis, “Locator/ID separationprotocol (LISP),” RFC 6830, Jan. 2013.
[23] NSF NeTS FIND Initiative. [Online]. Available: http://www.nets-find.net[24] NSF Future Internet Architecture Project. [Online]. Available: http://
www.nets-fia.net/[25] CAIDA: The Cooperative Association for Internet Data Analysis.
[Online]. Available: http://www.caida.org[26] University of Oregon Route Views Project. [Online]. Available: http://
www.routeviews.org[27] S. Paul, R. Jain, J. Pan, and M. Bowman, “A vision of the next generation
Internet: A policy oriented perspective,” in Proc. BCS Int. Conf. Vis.Comput. Sci., Sep. 22–24, 2008, pp. 1–14.
[28] C. Dovrolis, “What would Darwin think about clean-slate architectures?”ACM SIGCOMM Comput. Commun. Rev., vol. 38, no. 1, pp. 29–34,Jan. 2008.
[29] V. Cerf, B. Davie, A. Greenberg, S. Landau, and D. Sincoskie, FINDobserver panel report, Apr. 9, 2009. [Online]. Available: http://www.nets-find.net/FIND_report_final.pdf
[30] Internet of Things. [Online]. Available: http://en.wikipedia.org/wiki/Internet_of_Things
[31] K. Fall, G. Iannaccone, and S. Ratnasamy, “Routing tables: Is smallerreally much better?” in Proc. HotNets, Oct. 2009, pp. 1–6.
[32] P. Calhoun, T. Johansson, and C. Perkins, “Diameter Mobile IPv4 Appli-cation,” RFC 4004, Aug. 2005.
[33] S. Kent and R. Atkinson, “Security architecture for the Internet protocol,”RFC 2401, Nov. 1998.
Jianli Pan (S’08) received the B.E. degree fromNanjing University of Posts and Telecommunica-tions, Nanjing, China, and the M.S. degree fromBeijing University of Posts and Telecommunica-tions, Beijing, China. He is currently a Ph.D. can-didate in the Department of Computer Science andEngineering, Washington University in St. Louis,St. Louis, MO, USA.
His current research includes: 1) next-generationInternet architecture and related issues such as rout-ing scalability, mobility, multihoming, and Internet
evolution; and 2) cyber-assisted energy efficiency, green building, smart energy,and sustainability.

This article has been accepted for inclusion in a future issue of this journal. Content is final as presented, with the exception of pagination.
12 IEEE SYSTEMS JOURNAL
Raj Jain (F’93) received the Ph.D. degree in appliedmath (computer science) from Harvard University,Cambridge, MA, in 1978.
He is currently a Professor of computer sci-ence and engineering with Washington University inSt. Louis, St. Louis, MO, USA. Previously, he wasone of the Cofounders of Nayna Networks, Inc.,a next-generation telecommunication systems com-pany in San Jose, CA, USA. He was a SeniorConsulting Engineer with Digital Equipment Corpo-ration, Littleton, MA, USA, and then a Professor of
computer and information sciences with The Ohio State University, Columbus,OH, USA. He is the author of Art of Computer Systems Performance Analysis,which won the 1991 “Best-Advanced How-to Book, Systems” Award fromthe Computer Press Association, and of High-Performance TCP/IP: Concepts,Issues, and Solutions (Prentice Hall, November 2003), which is his fourthbook. Recently, he has coedited Quality of Service Architectures for WirelessNetworks: Performance Metrics and Management (April 2010).
Prof. Jain is a Fellow of the Association for Computing Machinery (ACM).He was a recipient of the ACM SIGCOMM Test of Time Award and theCenter for Development of Advanced Computing-Advanced Computing andCommunication Society Foundation Award in 2009. He ranks among the top75 in CiteSeerX’s list of Most Cited Authors in Computer Science.
Subharthi Paul (S’12) received the B.S. degreefrom the University of Delhi, New Delhi, India,and the Master’s degree in software engineeringfrom Jadavpur University, Kolkata, India. He is cur-rently working toward the Doctoral degree in theDepartment of Computer Science and Engineering,Washington University in St. Louis, St. Louis, MO,USA.
His primary research interests are in the areaof future Internet architectures, including software-defined networks, data center network architectures,
and application delivery networking for cloud and multicloud environments.