enhanced model and simulation of hydration process of
TRANSCRIPT

Enhanced model and simulation of hydration process of blast furnace slag in blended cementYao Luan, Tetsuya Ishida Toyoharu Nawa, , SagawaTakahiroJournal of Advanced Concrete Technology, volume ( ), pp.10 2012 1-13
Prediction of changes in physical properties due to leaching of hydration products from concreteKosuke Yokozeki, Kenzo Watanabe Noboru Sakata, , Nobuaki OtsukiJournal of Advanced Concrete Technology, volume ( ), pp.1 2003 161-171
Analytical hydration model for filler rich self-compacting concreteGeert De Schutter, Anne-Mieke PoppeJournal of Advanced Concrete Technology, volume ( ), pp.4 2006 259-266
XRD/Rietveld analysis of the hydration and strength development of slag and limestoneblended cement Seiichi Hoshino, Kazuo Yamada Hiroshi Hirao, ,Journal of Advanced Concrete Technology, volume ( ), pp.4 2006 357-367
Quantifying the effects of hydration enhancement and dilution in cement pastes containing coarse glass powderNarayanan NeithalathJournal of Advanced Concrete Technology, volume ( ), pp.6 2008 397-408

Journal of Advanced Concrete Technology Vol. 10, 1-13, January 2012 / Copyright © 2012 Japan Concrete Institute 1
Scientific paper
Enhanced Model and Simulation of Hydration Process of Blast Furnace Slag in Blended Cement Yao Luan1, Tetsuya Ishida2, Toyoharu Nawa3 and Takahiro Sagawa4
Received 1 April 2011, accepted 4 October 2011 doi:10.3151/jact.10.1
Abstract A hydration model for cementitious materials was applied to slag blended cement. The original model was found to overestimate the hydration degree of slag, and the influence of the slag ratio on the hydration degree not to be well simulated either. The hydration mechanism of slag was investigated, considering the role of calcium hydroxide as acti-vator and the Ca/Si ratio of C-S-H. It is assumed that for low Ca/Si ratio, the C-S-H inner product has a stronger resis-tance against ion diffusion and thus influences the hydration process significantly. Accordingly an enhanced model for slag hydration is proposed. Finally, the enhanced model is verified by both hydration degree and heat generation tests.
1. Introduction
In Japan blast furnace slag (BFS) is widely used in the cement and concrete industry. As a by-product during steel manufacture, it is broadly agreed that concrete made with slag blended cement has many advantages, including better chloride resistance, lower permeability and higher strength at later age. From the viewpoint of circular economy and sustainable development, blast furnace slag is a promising mineral admixture in the concrete industry. However, some disadvantages are also reported, such as larger drying and autogenous shrinkage, which tend to induce early age cracks and decrease the durability of structures. Beside, BFS concrete is more sensitive to the curing conditions. Insufficient water supply during curing may retard the hydration process and cause a significant decrease in the long-time prop-erties. Therefore, for the purpose of promoting the effi-cient application of blast furnace slag, it is of great ne-cessity to investigate the properties of BFS blended ce-ment.
Hydration is a process that represents the reaction and mass conversion of cement, and therefore the percentage of hydrated cementitious materials is closely tied to mi-crostructure development and affects other properties. Slag blended in Portland cement has a more complicated hydration mechanism, since slag is a latent hydraulic material and the reactivity is significantly influenced by calcium hydroxide (CH), which acts as activator. Meas-
urement of heat generation, such as the adiabatic tem-perature rise test, is usually used to assess the hydration status. However, because it is difficult to separate the heat released by slag accurately, this method is not ca-pable of evaluating the reaction of the slag separately. On the other hand, several test methods have been developed for quantitatively analyzing the hydration degree of slag separately, such as selective dissolution (Kondo and Ohsawa 1969; Luke and Glasser 1987; Lumley et al. 1996; Demoulian et al. 1980; Battagin 1992; Escalante et al. 2001), XRD (Kondo et al. 1975; Hoshino et al. 2006), Differential Scanning Calorimetry (DSC) (Totani et al. 1980; Imoto et al. 2006) and image analysis (Feng et al. 2004; Kurumisawa et al. 2007). Thanks to advances in techniques, test methods are becoming more accurate and reveal the hydration process and reactivity of slag. For instance, Luke and Glasser (1987) modified the EDTA dissolution and studied pastes with 30% slag ratio until 12 months. They reported that within 1 month around 40% of the slag reacted while the hydration de-gree was up to 60% after 12 months. Lumley et al. (1996) studied the effects of the water-to-cementitious material (herein refer to both cement and slag, and is simplified as w/b, i.e. water-to-binder) ratio and slag ratio, and they indicated that 30-55% of the slag hydrated in 28 days and 45-75% in 1-2 years. They also found that as the w/b ratio decreased or the slag ratio increased, the hydration degree decreased, and the slag type also influenced the reactivity. Escalante et al. (2001) also reported that the reactivity of slag decreased with the w/b ratio or with increases of the slag ratio. They pointed out also that the hydration degree increases with the temperature, and the values after 6 months were 20-50% in the range of 10-30℃. In Japan, Iyoda and Dan (2007) and Sakai et al. (2004) also confirmed that the hydration degree depends on the slag ratio, and that for a long time most of the values remain much lower than 100%. Based on the above reviews, the following characteristics of slag hy-dration can be identified: for long time curing, the hy-dration is still far from completed even if sufficient water
1Researcher, Department of Civil Engineering, University of Tokyo, Japan. E-mail: [email protected] 2Associate Professor, Department of Civil Engineering, University of Tokyo, Japan. 3Professor, Division of Sustainable Resources Engineering, Hokkaido University, Japan. 4Researcher, Research Institute, Division of Technology, Nittetsu Cement Co., Ltd., Japan.
Y. Luan, T. Ishida, T. Nawa and T. Sagawa / Journal of Advanced Concrete Technology Vol. 10, 1-13, 2012 2
supplied. Most of the data show that the hydration degree is less than 60% and a large proportion of slag remains unhydrated. Moreover, the slag ratio influences hydra-tion significantly and a higher ratio induces lower hy-dration.
Several models have been proposed to simulate the hydration of slag cement. In this paper, a multi-component hydration heat model developed by Kishi (1994, 1995, 1996, 1997) and Maekawa et al. (2008) is investigated. In this model, hydration and heat generation of components in cement including clinkers such as C3S, C2S, C3A, C4AF, and mineral admixtures such as fly ash and blast furnace slag are treated respec-tively by the Arrhenius law of chemical reaction and then integrated together. This model has been verified by adiabatic temperature rise tests for both Portland cement and slag blended cement concrete. On the other hand, verification of the hydration degree of slag has not been carried out, because of the scarcity of reliable data when the model was established. Based on the above reviews of the hydration degree, recent test methods have be-come more accurate and some common characteristics are found. Therefore, in order to further expand the ap-plication of the multi-component hydration heat model, it is necessary to investigate its applicability on prediction of hydration degree. Before describing this investigation, the simulation of slag hydration in the multi-component hydration heat model is introduced briefly first.
2. Simulation of slag hydration (Kishi and Maekawa 1996, 1997)
A reference heat rate that represents the heat generation process under isothermal condition (293 K) is first as-sumed for slag. Taking into account various factors such as temperature, available free water, CH content and slag fineness, the hydration heat rate under real condition is computed following the equation:
0,0
1 1min( , ) ( )exp sgsg sg sg sg T sg
EH H Q
R T Tβ λ
⎧ ⎫⎛ ⎞⎪ ⎪= ⋅ − −⎨ ⎬⎜ ⎟⎪ ⎪⎝ ⎠⎩ ⎭
(1)
where Hsg is the hydration heat rate under real condition, Hsg,T0 is the reference heat rate at 293 K, Qsg is the ac-cumulated heat during hydration, Esg is the activation energy of slag, R is the gas constant, T0 is the reference temperature (293 K), and T is the real temperature. βsg is the coefficient considering the effect of available free water, and λsg is the coefficient expressing hydration stagnation due to CH insufficiency.
The hydration degree is computed by the following equation:
,
sg sg
sgsg
sg
Q HQ
Qα
∞
≡
=
∫ (2)
where αsg is the hydration degree of slag and Qsg,∞ is the
ultimate heat in the case of complete hydration of the slag. For per unit weight of slag, the value of Qsg,∞, i.e. the specific heat, is assumed as 525.0 kJ/kg.
In Eq. 1, except for temperature effect, βsg and λsg are the other two factors that noticeably affect the hydration process. The coefficient considering the effect of avail-able free water, βsg, is obtained by the following equa-tion:
121 exp
100
s
freesg sg
sg
r sω
βη
⎧ ⎫⎧ ⎫⎛ ⎞⎪ ⎪ ⎪ ⎪= − − ⎜ ⎟⎨ ⎨ ⎬ ⎬⎜ ⎟⋅⎪ ⎪⎪ ⎪⎝ ⎠⎩ ⎭⎩ ⎭ (3)
where ηsg represents the normalized cluster thickness of inner product, ωfree is the free water percentage. Physical water existing in micro-pores sustains continued hydra-tion and serves as space which hydrates precipitate. This portion of water is regarded as free water. Lack of free water would induce the stagnation of later hydration, e.g. low water-cement ratio concrete. ssg is the normalized Blaine value of blast furnace, and r and s are material constants. The following equation is given for ηsg:
13
,
1 sgsg
sg
η∞
⎛ ⎞= − ⎜ ⎟⎜ ⎟
⎝ ⎠ (4)
For ωfree, under sealed conditions, this equation can be simplified as follows:
total ifree
W WC
ω−
= ∑ (5)
where Wtotal is the initial water weight, Wi is the water consumed by various components in the cementitious binder, and C is the unit cement weight in the paste.
The coefficient expressing hydration stagnation due to CH insufficiency, λsg, is calculated by:
1.5
1 exp 2.0 CHsg
SGCH
FR
λ⎧ ⎫⎛ ⎞⎪ ⎪= − −⎨ ⎬⎜ ⎟
⎝ ⎠⎪ ⎪⎩ ⎭ (6)
where FCH is the CH content in the paste, and RSGCH is the amount of CH required for fully hydration of slag at the next time interval. 3. Investigation on applicability of the model to slag
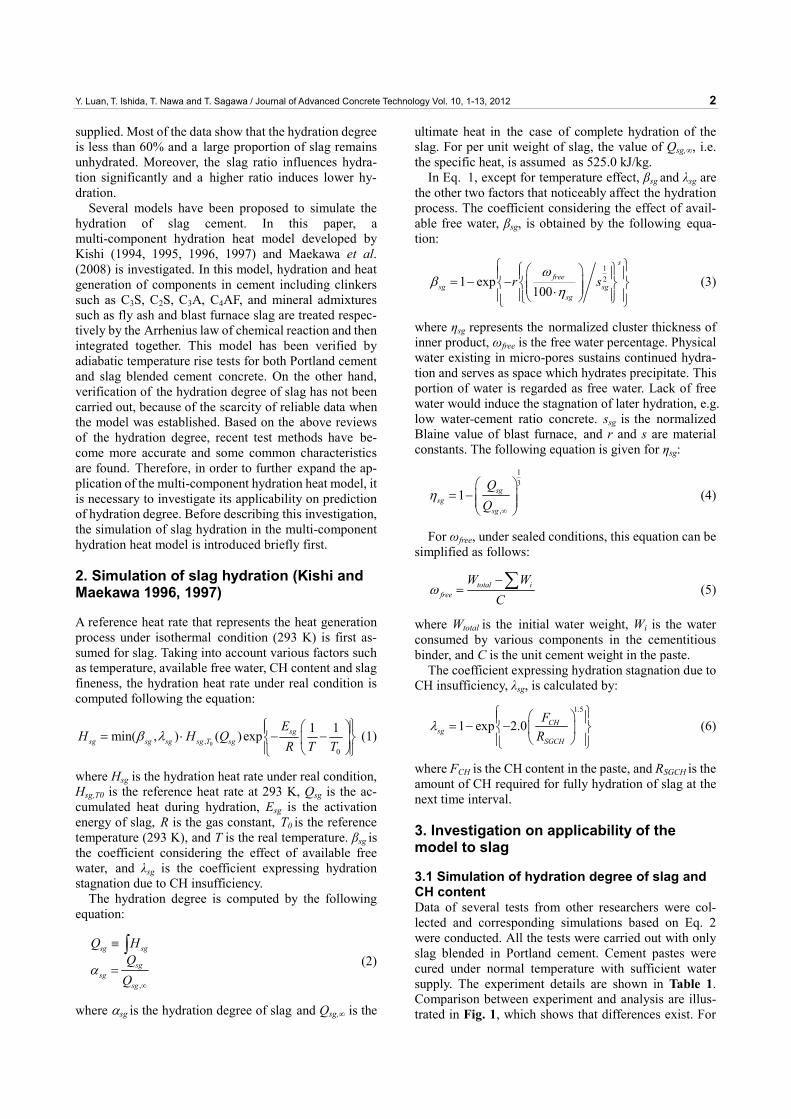
3.1 Simulation of hydration degree of slag and CH content Data of several tests from other researchers were col-lected and corresponding simulations based on Eq. 2 were conducted. All the tests were carried out with only slag blended in Portland cement. Cement pastes were cured under normal temperature with sufficient water supply. The experiment details are shown in Table 1. Comparison between experiment and analysis are illus-trated in Fig. 1, which shows that differences exist. For
Y. Luan, T. Ishida, T. Nawa and T. Sagawa / Journal of Advanced Concrete Technology Vol. 10, 1-13, 2012 3
most cases, the analysis value appears higher than the test data, which implies that the hydration degree may be overestimated to a certain extent. Moreover, the rela-tionship of the hydration and slag ratio seems hardly obvious in analysis. When the slag ratio is less than 50%, there appears to be no difference between analytical curves. Only when the slag ratio is as high as 67% in Fig. 1-(a) do the hydration curves reduce after around 20 days.
Figure 2 represents the CH content measured by the TG-DTA method in test-(a) in Table 1 and the analysis. For both the analysis and experiment, the amount of CH declines as the slag ratio increases. However, it seems that when the slag ratio is 67%, the analytical result is underestimated. CH is completely consumed and the value stays zero after 15 days, while the experiment indicates that some CH always remains. Kwak et al. (2004) also reported that even for a high slag ratio of 70%, CH in the paste is detectable at a later age. There-fore, it can de deduced that analysis may overrate con-sumption of CH for a high slag ratio, causing remaining CH to be underestimated. Combined with the analysis in Fig. 1, some correlation seems to exist. If the hydration degree is suitably reduced, CH consumption is reduced and a better result in terms of CH content can be ex-pected.
Hence, the authors presume that current model has some limitations. As described in Section 1, the model was verified by the adiabatic temperature rise test, and the heat generation was found to be well simulated and the temperature history of concrete to be traced properly. On the other hand, it is probable that for slag, the model has some limitations with regard to the hydration degree. As these limitations may hinder further simulation such as pore structure development, the authors assume that appropriate modifications of the model are called for. This must be preceded by an investigation of the major
factors that may affect hydration in the current model. Only after a clear understanding of the working mecha-nism of these factors and the causes of the discrepancies is gained can modifications be conducted.
3.2 Key parameter tracing in the model As presented in Section 2, in the current model, two factors may noticeably affect the hydration process, i.e. βsg and λsg. Case (a) in Table 1 is selected, and the values of βsg, λsg and min(βsg, λsg) are output and illustrated in Fig. 3 according to Eq. 3 and Eq. 6. Their effects on the hydration rate can be clearly grasped. For low ratios such as 20% and 42%, βsg dominates the hydration process, while for 67% the alleviative effect at lager age is at-tributed to λsg. The development of min(βsg, λsg) is con-sistent with the analytical results in Fig. 1-(a).
Next, the discussion focuses on the influence of CH. λsg affects hydration only when the slag ratio is 67%, because the analytical result of CH amount in Fig. 2 is almost zero. However, the test result indicates that some amount of CH always exists, while the hydration process is still reduced. In other words, the fact is that even though sufficient CH remains, the hydration rate may still be influenced significantly. Thus it appears that the current approach does not adequately describe this phe-nomenon.
3.3 Discussion of hydration mechanism of slag blended in cement It is well agreed that the principle hydrates of slag are C-S-H gels. Compared with Portland cement, research-ers found that as the slag ratio increases, C-S-H gels produced by slag show a lower Ca/Si ratio (Harrisson et al. 1987; Shi et al. 1992; Richardson and Groves 1992; Gollop and Taylor 1992, 1996), as illustrated in Fig. 4. The physical properties of C-S-H may vary due to the reduced Ca/Si ratio. Richardson et al. (1994, 2004) re
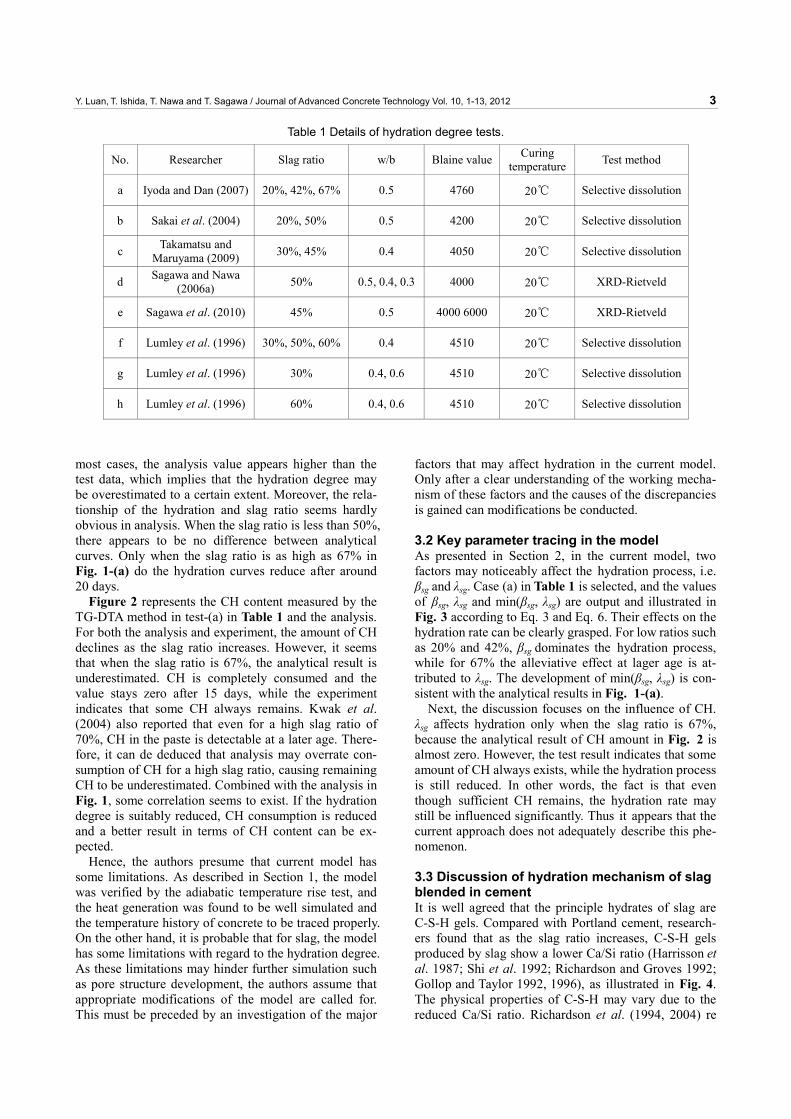
Table 1 Details of hydration degree tests.
No. Researcher Slag ratio w/b Blaine value Curing temperature Test method
a Iyoda and Dan (2007) 20%, 42%, 67% 0.5 4760 20℃ Selective dissolution
b Sakai et al. (2004) 20%, 50% 0.5 4200 20℃ Selective dissolution
c Takamatsu and Maruyama (2009) 30%, 45% 0.4 4050 20℃ Selective dissolution
d Sagawa and Nawa (2006a) 50% 0.5, 0.4, 0.3 4000 20℃ XRD-Rietveld
e Sagawa et al. (2010) 45% 0.5 4000 6000 20℃ XRD-Rietveld
f Lumley et al. (1996) 30%, 50%, 60% 0.4 4510 20℃ Selective dissolution
g Lumley et al. (1996) 30% 0.4, 0.6 4510 20℃ Selective dissolution
h Lumley et al. (1996) 60% 0.4, 0.6 4510 20℃ Selective dissolution

Y. Luan, T. Ishida, T. Nawa and T. Sagawa / Journal of Advanced Concrete Technology Vol. 10, 1-13, 2012 4
0
20
40
60
80
100
0 20 40 60 80 100
Hyd
ratio
n de
gree
(%
)
Age (days)
20% 20%42% 42%67% 67%
Iyoda and Dan (2007)
Analysis Test
(a)
0
20
40
60
80
100
0 20 40 60 80 100
Hyd
ratio
n de
gree
(%
)
Age (days)
20% 20%
50% 50%
Sakai et al. (2004)
Analysis Test
(b)
0
20
40
60
80
100
0 7 14 21 28
Hyd
ratio
n de
gree
(%
)
Age (days)
30%45%30%45%
Analysis
Test
Takamatsu and Maruyama (2009)
(c)
0
20
40
60
80
100
0 20 40 60 80 100
Hyd
ratio
n de
gree
(%
)
Age (days)
0.5 0.50.4 0.40.3 0.3
Sagawa and Nawa (2006a)
Analysis Test
(d)
0
20
40
60
80
100
0 10 20 30 40 50 60
Hyd
ratio
n de
gree
(%
)
Age (days)
4000 4000
6000 6000
Analysis Test
Sagawa et al. (2010)
(e)
0
20
40
60
80
100
0 20 40 60 80 100 120
Hyd
ratio
n de
gree
(%
)
Age (weeks)
30% 30%50% 50%60% 60%
Lumley et al. (1996)
Analysis Test
(f)
0
20
40
60
80
100
0 20 40 60
Hyd
ratio
n de
gree
(%
)
Age (weeks)
0.4 0.40.6 0.6
Lumley et al. (1996)Analysis Test
(g)
0
20
40
60
80
100
0 20 40 60 80 100 120
Hyd
ratio
n de
gree
(%
)
Age (weeks)
0.4 0.4
0.6 0.6
Lumley et al. (1996)
Analysis Test
(h)
Fig. 1 Comparison of hydration degree based on original model.

Y. Luan, T. Ishida, T. Nawa and T. Sagawa / Journal of Advanced Concrete Technology Vol. 10, 1-13, 2012 5
ported that in the case of a high Ca/Si ratio, C-S-H has a fibrillar-like morphology, while in the case of a low Ca/Si ratio, the morphology tends to be of the crumpled foil type. This implies a transition of hydrates from es-sentially one-dimensional growth to two-dimensional growth, resulting in higher tortuosity and specific sur-face area in micro-pores. Moreover, the electrical charges on the surface of hydrates are influenced by the Ca/Si ratio. The surface of hydrates from Portland ce-ment is usually positively charged (Elakneswaran et al. 2009; Glasser 1992; Nakarai et al. 2006). According to the research from Glasser (1992), as the Ca/Si ratio de-cline, the electric charges become less positive, and when the Ca/Si ratio is lower than 1.2-1.3, the surface charge of C-S-H reverses to negative, and C-S-H tend to bind alkali cations. Studies on the pore solution (Bhatty and Greening 1978; Chatterji 1979; Hong and Glasser 1999; Shehata and Thomas 2006) indicated that the available alkali concentration decreases as the slag ratio increases or the Ca/Si ratio decreases, which also sup-ports the reversal of surface charge and ion binding ca-pacity of C-S-H.
Herein the hydration scheme of slag is discussed ac-cording to the basic information of activation (Tanaka et al. 1983; Taylor 1990). At the starting stage, due to the activation by Ca2+, the protective film on the surface of the slag particle is destroyed. The internal structure, which is an anionic network composed of O, Si and other elements, starts to decompose, and silicate ions such as Si(OH)4 are released into the solution. When silicate ions contact Ca2+, a reaction occurs and hydrates start to pre-cipitate. Like in the case of Portland cement, hydrates from slag can be divided into two categories, i.e. the inner product and the outer product. The inner product consists of hydrates generated inside the radius of the original particle and closely bond around an unhydrated core, while the outer product precipitates outside the range of the original particle and fills in capillary pores. In order to sustain hydration, it is necessary for silicate ions released from slag to diffuse outside the inner product, or alkali cations to diffuse inside. The inner product may show resistance against ion diffusion, i.e. as hydration goes on and the thickness of the inner product increases, the diffusivity of ions through the inner product becomes lower. Accordingly, the reaction be-comes slower or even stagnates. Therefore, the thickness of the inner product is a crucial factor that dominates the hydration rate of slag.
As discussed above, the Ca/Si ratio of hydrates is re-duced with increases in the slag ratio, and the physical properties of C-S-H may vary accordingly. Hence, when we discuss the resistance effect of the inner product, not only its thickness but also the various other physical properties have to be taken into account. In this study, the authors assume that the physical properties of C-S-H influence the hydration process from two aspects. First, since C-S-H with a lower Ca/Si ratio has a morphology that is foil-like rather than fibrillar, the tortuosity of gel
0
5
10
15
20
25
0 20 40 60 80 100
CH
con
tent
(%
)
Age (days)
20% 20%42% 42%67% 67%
Iyoda and Dan (2007)
AnalysisTest
Fig. 2 Comparison of CH content based on original model.
0.0
0.2
0.4
0.6
0.8
1.0
1.2
0 20 40 60 80 100
λsg,
fact
or re
late
d to
C
H in
suffi
cien
cy
Age (days)
20%
42%
67%
20%42%
0.0
0.2
0.4
0.6
0.8
1.0
0 20 40 60 80 100
βsg,
fact
or re
late
d to
la
ck o
f fre
e w
ater
Age (days)
20%42%67%
0.0
0.2
0.4
0.6
0.8
1.0
0 20 40 60 80 100
Min
( βs
g, λs
g)
Age (days)
20%
42%
67%
Fig. 3 Parameter tracing.

Y. Luan, T. Ishida, T. Nawa and T. Sagawa / Journal of Advanced Concrete Technology Vol. 10, 1-13, 2012 6
pores becomes higher. This implies more twists and forks in pores, resulting in a much longer path for ions to diffuse through the inner product. The other factor may be the alternated electric charge on the surface of C-S-H. As indicated by Elakneswaran et al. (2009), pores with a diameter of less than 10 nm show the electrical double layer (EDL) effect. The inner product contains mainly gel pores and a large proportion of gel pores have a di-ameter smaller than 10 nm, and thus the EDL effect of the inner product is obvious. In the case of C-S-H with a high Ca/Si ratio, the surface is positively charged. The repelling effect of the positive charge layer restrains the movement of Ca2+ towards the inner product. The prin-cipal ion movement is that of silicate ions that are re-leased through the inner product. When the electric charges become less positive or even negative due to the lower Ca/Si ratio, the principal ion movement may change. Due to the absorbing effect, more Ca2+ ions
move toward the inner product and react with silicate ions near it. The reverse ion movement implies that denser inner product having stronger resistance against ion diffusion is formed. Further ion diffusion may be blocked and the hydration rate afterwards is reduced significantly. The above discussion about the relation-ship between the hydration of the slag and inner product is illustrated in Fig. 5. Accordingly, the authors conclude that for a lower Ca/Si ratio due to both higher tortuosity and reversed electric charge, the inner product layer shows higher resistance to ion movement. This may be the main reason that the hydration degree decreases as the slag ratio increases.
4. Enhanced hydration model for blast furnace slag
4.1 Modification on hydration rate From the discussion in Section 3.3, it can be seen that the hydration process is closely associated with the inner product because of its resistance to ion movement. This resistance depends on both the thickness and intrinsic properties of C-S-H. In the original model, although the thickness of the inner product is included in Eq. 3, it provides constant evaluation for various slag ratios. In other words, the various intrinsic properties of C-S-H due to the Ca/Si ratio are not taken into account. On the other hand, coefficient λsg, which represents the ineffi-ciency of CH, seems unnecessary because it has been proved that a sufficient amount of CH exists in the paste even for high slag ratios as described in Section 3.2.
Hence in the modification λsg is not utilized and all factors are integrated into coefficient βsg. Since the hy-dration degree is related to the w/b ratio and slag fineness,
0.8
1.0
1.2
1.4
1.6
1.8
2.0
0 20 40 60 80 100Slag ratio (%)
Ca/
Si ra
tio
Harrisson et al. (1987) Shi et al. (1992) Richardson and Groves (1992) Gollop and Taylor (1992, 1996)
Fig. 4 Ca/Si ratio of C-S-H with various slag ratios.
Unhydrated core
Inner product
Outer product
Expand and fill incapillary pores
Ca2+
Ca2+
Ca2+Si(OH)4
Si(OH)4
Si(OH)4
Si(OH)4
Ca2+
Ca2+
Ca2+
Si(OH)4
Si(OH)4
Ca2+
Ca2+
Ca2+
Ca2+
Ca2+
Ca2+
Ca2+
Si(OH)4
Si(OH)4
Si(OH)4
High C/S ratio case
Low C/S ratio case
• Silicate ions diffuse outside inner product due to positive charges of C-S-H
• Inner product with relativelycoarse structure and low tortuosity, easy for ion movement
• High hydration degree
• More Ca2+ diffuse inside inner product due to less positive or negative charges of C-S-H
• Much denser inner product with higher tortuosity which is difficult for further ion movement
• Low hydration degree• Unhydrated core releases silicate ions• Ca2+ diffusion into inner productIon movement during slag hydration
Fig. 5 Influence of inner product on ion movement and hydration of slag.

Y. Luan, T. Ishida, T. Nawa and T. Sagawa / Journal of Advanced Concrete Technology Vol. 10, 1-13, 2012 7
those factors in Eq. 3, i.e. ωfree and ssg, need to be re-served. Moreover, the most important issue is how to simulate the effect of the inner product. When the thickness of inner product is zero, i.e. the starting of hydration, no resistance from the inner product exists. As the thickness of the inner product increases, the hydra-tion rate should decrease. Furthermore, as explained in Section 3.3, for a lower Ca/Si ratio, the inner product shows stronger resistance towards ion movement, so the effect needs to be more significant. Therefore, an avail-able approach is to establish an influential coefficient which includes the thickness of inner product as the principal variable and meanwhile reflects the effect of Ca/Si ratio. According to Fig. 4, the Ca/Si ratio of C-S-H shows a clear correlation with the slag ratio, and thus the slag ratio seems a proper index of the influence of the Ca/Si ratio. For the inner product, as it becomes thicker, the ion diffusion is strongly resisted so the hydration rate decreases sharply rather than gradually. The exponential formula seems appropriate to describe the significant relationship between inner product thickness and the resistance effect. Therefore, the effect of the inner product is proposed by a new coefficient χ, defined as follows:
( )bsga ηχ ⋅−= exp (7)
where ηsg is the thickness of the inner product, which has the same definition in Eq. 4. a and b are intrinsic pa-rameters that are the functions of the slag ratio, given by:
19.0 20.02.2 3.0
sg
sg
a pb p= − ⋅= − ⋅ (8)
In Eq. 8, psg is the slag ratio. Therefore, the value development of χ depends on the slag ratio. Herein Eq. 8 is not directly derived from experiment. Instead, it is empirically proposed to alter the hydration heat. On the other hand, the basis of Eq. 8 is the intrinsic properties of C-S-H which depends on the Ca/Si ratio and its influence on ion movement. In other words for Eq. 8 the physical meaning relating to microscopic mechanism of hydration exists. Figure 6 plots the curves of χ versus ηsg when the slag ratio changes from 20% to 70%. All the functions decrease as the thickness of the inner product increases, which implicitly represents the resistance by the inner product to ion diffusion. Besides, for a higher slag ratio, the function decreases more sharply from the beginning. This has clear physical meaning that the C-S-H inner product has a stronger retardation effect on ion move-ment the lower the Ca/Si ratio. When χ is integrated into βsg, it is applicable to the simulation of the development of the hydration degree for various slag ratios.
Accordingly, in the enhanced model, the new expres-sion for βsg is given by:
121 exp /
20.0
sfree
sg sgr sω
β χ⎧ ⎫⎧ ⎫⎧ ⎫⎛ ⎞⎪ ⎪ ⎪ ⎪ ⎪⎪= − − ⋅⎨ ⎨ ⎨ ⎬ ⎬⎬⎜ ⎟
⎪ ⎪⎝ ⎠⎩ ⎭⎪ ⎪ ⎪⎪⎩ ⎭⎩ ⎭ (9)
where ωfree, ssg are defined as in Eq. 3, and r and s are also the same material constants.
In Eq. 9, χ is integrated into βsg. The effects of the available free water and slag fineness are reserved by ωfree and ssg. Unlike the original model, the thickness of the inner product, ηsg, is extracted and included in χ. This means that the inner product has an independent effect on the hydration rate from the available free water or slag fineness. For instance, even if sufficient water is pro-vided such as a high w/b ratio, later hydration may still tend to stagnate. Therefore, this separate treatment sub-stantially corresponds to the mechanism of hydration.
4.2 Verification by hydration degree of slag and CH content The enhanced model is verified by experiments in Table 1, and the results are illustrated in Fig. 7. For most cases, the analytical results are much improved, showing the dependence of the hydration process on the slag ratio. For different w/b ratios, the enhanced model can also give better results, except the slag ratio 20% in case (a) in Table 1, for which neither the analyses before and after modification provide good agreement with the experi-ment, since the test data is even higher than 90%. For other cases, because hydration degrees are largely de-creased in the enhanced model, the values become much closer to the test data especially at early age. For long period such as after 91d, the analysis is slightly deviating from the test data. This is because that the hydration rate in the analysis is not completely zero. On the other hand, some tests such as case (a) show that hydration com-pletely stagnates around 91d, while in case (g) the hy-dration can gradually proceed until quite long period. More accurate measurement and simulation until quite long time need to be conducted in the future research. In any case, comprehensively speaking the simulation of slag hydration is greatly improved. Moreover, besides the factors that are taken into account in the model, the hydration degree of slag is also influenced by other fac-tors, such as the chemical composition or glass content of the slag. For those factors which are not included in the model, their influences on the hydration degree should be
0.0
0.2
0.4
0.6
0.8
1.0
0.0 0.1 0.2 0.3 0.4 0.5
χ, fa
ctor
affe
ctin
g hy
drat
ion
rate
du
e to
inne
r pro
duct
thic
knes
s
ηsg, inner product thickness
BFS20%BFS30%BFS40%BFS50%BFS60%BFS70%
Fig. 6 function χ versus ηsg.

Y. Luan, T. Ishida, T. Nawa and T. Sagawa / Journal of Advanced Concrete Technology Vol. 10, 1-13, 2012 8
0
20
40
60
80
100
0 20 40 60 80 100
Hyd
ratio
n de
gree
(%
)
Age (days)
20% 20%42% 42%67% 67%
Iyoda and Dan (2007)
Analysis Test
(a)
0
20
40
60
80
100
0 20 40 60 80 100
Hyd
ratio
n de
gree
(%
)
Age (days)
20% 20%
50% 50%
Sakai et al. (2004)
Analysis Test
(b)
0
20
40
60
80
100
0 7 14 21 28
Hyd
ratio
n de
gree
(%
)
Age (days)
30%45%30%45%
Analysis
Test
Takamatsu and Maruyama (2009)
(c)
0
20
40
60
80
100
0 20 40 60 80 100
Hyd
ratio
n de
gree
(%
)
Age (days)
0.5 0.50.4 0.40.3 0.3
Sagawa and Nawa (2006a)
Analysis Test
(d)
0
20
40
60
80
100
0 10 20 30 40 50 60
Hyd
ratio
n de
gree
(%
)
Age (days)
4000 4000
6000 6000
Sagawa et al. (2010)
Analysis Test
(e)
0
20
40
60
80
100
0 20 40 60 80 100 120
Hyd
ratio
n de
gree
(%
)
Age (weeks)
30% 30%50% 50%60% 60%
Lumley et al. (1996)
Analysis Test
(f)
0
20
40
60
80
100
0 20 40 60
Hyd
ratio
n de
gree
(%
)
Age (weeks)
0.4 0.4
0.6 0.6
Lumley et al. (1996)
Analysis Test
(g)
0
20
40
60
80
100
0 20 40 60 80 100 120
Hyd
ratio
n de
gree
(%
)
Age (weeks)
0.4 0.4
0.6 0.6
Lumley et al. (1996)
Analysis Test
(h)
Fig. 7 Comparison of hydration degree based on enhanced model.

Y. Luan, T. Ishida, T. Nawa and T. Sagawa / Journal of Advanced Concrete Technology Vol. 10, 1-13, 2012 9
studied in the future to allow more precise prediction. Besides the hydration degree, the analysis for CH con-tent for case (a) in Table 1 is shown in Fig. 8. The en-hanced model provides much better simulation. Even for a high slag ratio of up to almost 70%, CH is still not completely consumed, which is simulated well by the enhanced model.
The tests adopted in Table 1 are all under the reference temperature (293 K). If the curing temperature increases, a higher hydration degree of slag will be obtained (Es-calante et al. 2001). In the original model, this effect is included in Eq. 1 and it still remains after modification of the model. Therefore in order to expand the applicability of the modified model, the hydration degrees of slag under various curing temperatures are also analyzed. The results are compared with test data from Sagawa and Nawa (2006b). In the research, 40% of the Portland cement is replaced by slag and the cement pastes are cured in water with temperatures of 5°C, 20°C and 40°C. The w/b ratio is 0.5. The hydration degrees of slag are measured by the XRD-Rietveld method. The analysis based on original and enhanced model, and their com-parison with analysis are given in Fig. 9. Similar with cases under normal temperature shown in Fig. 1 and Fig.
7, the original model highly overestimates the hydration degree of slag, while the analysis based on enhanced model is consistent with the test data. This means that the modified model is applicable to various temperature ranges.
4.3 Modification of reference heat rate of slag Based on the modification in Section 4.1, it is probable that not only the hydration degree but also heat genera-tion are influenced. This is easy to understand, as in the modified model, hydration degrees are greatly reduced, but the specific heat of slag Qsg,∞ in Eq. 2 still remains 525.0 kJ/kg, which implies that total heat generation is reduced. Therefore in order to ensure the predictability of heat generation, the authors considered modifying the value of specific heat. Few test data on the specific heat of slag are available in the literature. Goto et al. (2006, 2009) synthesized slag-simulated glasses in the system of CaO-Al2O3-SiO2 and measured heat generation dur-ing hydration. They proposed that the specific heat of slag is 571.2 kJ/kg. Referring to this data, the authors assume that in the enhanced model, the value of Qsg,∞ is 630.0 kJ/kg, which is 1.2 times the value in the original model. This value is not far from Goto’s test considering the difference between real and synthesized slags. Meanwhile with the increased value, effective compen-sation for the heat generation can be obtained. The new function of the reference heat rate is also increased by multiplying both the original reference heat rate with the constant value of 1.2, as illustrated in Fig. 10. Direct verification by test curve from slag is unavailable, since it is difficult to accurately separate the heat of the slag from that of the total blended cement. Herein, the au-thors decide to compare total heat generation of Port-land cement blended with slag under isothermal condi-tion. Gruyaert et al. (2010) measured the total heat gen-eration of BFS cement by isothermal calorimetry with various slag ratios. The w/b ratio is 0.50 and the iso-thermal conditions are 10℃, 20℃ and 35℃. In this study, corresponding analysis by the modified model were carried out and compared with their measurement as shown in Fig. 11. For slag ratio 0%, i.e. OPC, the
0
5
10
15
20
25
0 20 40 60 80 100
CH
con
tent
(%
)
Age (days)
20% 20%42% 42%67% 67%
Iyoda and Dan (2007)
AnalysisTest
Fig. 8 Comparison of CH content based on enhanced model.
0
20
40
60
80
100
0 20 40 60 80 100
hydr
atio
n de
gree
(%
)
Age (days)
5℃ 5℃20℃ 20℃40℃ 40℃
Sagawa and Nawa (2006b)
Analysis Test
0
20
40
60
80
100
0 20 40 60 80 100
hydr
atio
n de
gree
(%
)
Age (days)
5℃ 5℃20℃ 20℃40℃ 40℃
Analysis Test
(a) Original model (b) Enhanced model
Fig. 9 Hydration degree under various temperatures based on the original and enhanced models.

Y. Luan, T. Ishida, T. Nawa and T. Sagawa / Journal of Advanced Concrete Technology Vol. 10, 1-13, 2012 10
analysis follows Kishi’s original model. Its agreement with the test data suggests that the disturbance from the Portland cement part in blended cement can be ne-glected. Furthermore, when we turn to the BFS cases, for all the isotherm condition and slag ratios, both the process and final heat can be well traced. Therefore, it can be concluded that the modification of the specific heat and referent heat rate of slag is reasonable. Herein it has to be pointed out that although the enhanced model is supported by the heat generation test, the specific heat value 630.0 kJ/kg adopted in the model is not directly verified due to the scarcity of test data available. Meas-urement of the specific heat of slag should be carried out in future research.
Finally, as mentioned in Section 1, the original model was verified by the adiabatic temperature rise test of BFS concrete. In order to remain consistent with the original model, the adiabatic temperature rise adopted in the original verification is analyzed again with the modified model. The mix proportions of BFS concrete are shown in Table 2, and comparison of results is shown in Fig. 12. Obviously, with increased specific heat and decreased hydration degree, the modified model provides similar evaluation of adiabatic temperature rise as the original model. Therefore, the modified model can be used not only under isothermal condition but also adiabatic con-dition.
5. Summary and conclusions
In this study, the hydration process of slag blended in cement is investigated based on the intrinsic properties of the inner product. As the original model appears not to provide proper prediction of the hydration degree, the hydration mechanism of slag is investigated again, con-sidering the influence of CH as activator and the chemo-physical properties of C-S-H in slag hydration. Since the Ca/Si ratio of C-S-H decreases as the slag ratio increases, resulting in both higher tortuosity and changed positive electric charge accumulation in C-S-H, it is assumed that the C-S-H inner product has a strong re-sistance to ions movement, and therefore the subsequent hydration tends to be retarded. Based on the above as-sumption, an enhanced model is proposed, taking into
0.0
2.0
4.0
6.0
8.0
10.0
12.0
14.0
16.0
0 200 400 600 800
Ref
eren
t hea
t rat
e (k
J/kg
/hr)
Accumulated heat (kJ/kg)
Modified
OriginalFinal heat forfull hydration
Fig. 10 Reference heat rate of slag before and after modification.
0
50
100
150
200
250
300
350
400
0 50 100 150 200 250
Tota
l hea
t pro
duct
ion
(J/g
)
Age (hours)
0%BFS30%BFS50%BFS0%BFS30%BFS50%BFS
Analysis
Test
Isothermal condition 10℃
0
50
100
150
200
250
300
350
400
0 50 100 150 200
Tota
l hea
t pro
duct
ion
(J/g
)
Age (hours)
0%BFS30%BFS50%BFS0%BFS30%BFS50%BFS
Analysis
Test
Isothermal condition 20℃
0
50
100
150
200
250
300
350
400
0 50 100 150
Tota
l hea
t pro
duct
ion
(J/g
)
Age (hours)
0%BFS30%BFS50%BFS0%BFS30%BFS50%BFS
Analysis
Test
Isothermal condition 35℃
Fig. 11 Comparison of isothermal heat generation based on modified model.
Table 2 Mix proportion of BFS concretes used for verification (Maekawa et al. 2008, p.82).
Unit weight (kg/m3) Types w/b
(%) Water Cement Slag Sand Gravel
SG400 39.3 157 240 160 645 1,129
SG300 49.3 148 180 120 757 1,129
SG200 78.5 157 120 80 854 1,089

Y. Luan, T. Ishida, T. Nawa and T. Sagawa / Journal of Advanced Concrete Technology Vol. 10, 1-13, 2012 11
account the resistance effect. Finally, the enhanced model is applied to simulation of slag hydration, and the results indicate good agreement with the experiment data. Moreover, the amount of CH in the paste and heat gen-eration of slag cement can also be simulated accurately. References Battagin, A. F., (1992). “Influence of degree of hydration
of slag on slag cement.” In: Proceedings of the 9th International Congress on the Chemistry of Cement, New Delhi, India, Vol.3, 166-172.
Bhatty, M. S. Y. and Greening, N., (1978). “Interaction of
alkalies with hydrating and hydrated calcium silicates.” In: Proceedings of 4th International Conference on Effects of Alkalis in Cement and Concrete, Purdue August 1978. 87-112.
Chatterji, S., (1979). “The role of Ca(OH)2 in the breakdown of portland cement concrete due to alkali-silica reaction.” Cement and Concrete Research, 9(2), 185-188.
Demoulian, E., Gourdin, P., Hawthorn, F. and Vernet, C., (1980). “Influence of slags chemical composition and texture on their hydraulicity.” In: Proceedings of 7th International Congress on the Chemistry of Cement, Paris. Vol.2, 89-104.
Elakneswaran, Y., Nawa, T. and Kurumisawa, K., (2009). “Electrokinetic potential of hydrated cement in relation to adsorption of chlorides.” Cement and Concrete Research, 39(4), 340-344.
Escalante, J. I., Gomez, L. Y., Johal, K. K., Mendoza, G., Mancha, H. and Mendez, J., (2001). “Reactivity of blast-furnace slag in portland cement blends hydrated under different conditions.” Cement and Concrete Research, 31(10), 1403-1409.
Feng, X., Garboczi, E. J., Bentz, D. P., Stutzman, P. E. and Mason, T. O., (2004). “Estimation of the degree of hydration of blended cement pastes by scanning electron microscope point-counting procedure.” Cement and Concrete Research, 34(10), 1787-1793.
Glasser, F. P., (1992). “Chemistry of alkali-aggregate reaction.” In: R. Swamy, Ed. The Alkali-Silica Reaction in Concrete, Van Nostrand Reinhold, New York. 30-53.
Gollop, R. S. and Taylor, H. F. W., (1992). “Microstructural and microanalytical studies of sulfate attack: I. ordinary Portland cement paste.” Cement and Concrete Research, 22(6), 1027-1038.
Gollop, R. S. and Taylor, H. F. W., (1996). “Microstructural and microanalytical studies of sulfate attack: IV. reactions of a slag cement paste with sodium and magnesium sulfate solutions.” Cement and Concrete Research, 26(7), 1013-1028.
Goto, S., (2009). “Hydration of hydraulic materials – a discussion on heat liberation and strength development.” Advances in Cement Research, 21, 113-117.
Goto, S., Fujimori, H., Hidaka, A. and Ioku, K., (2006). “Effect of components on the rate of heat liberation of hydration in the system of glass/gypsum/lime.” Journal of the European Ceramic Society, 26, 771-776.
Gruyaert, E., Robeyst, N. and De Belie, N., (2010). “Study of hydration of Portland cement blended with blast-furnace slag by calorimetry and thermogravimetry.” Journal of Thermal Analysis and Calorimetry, 102, 941-951.
Harrisson, A. M., Winter, N. B. and Taylor, H. F. W., (1987). “Microstructure and microchemistry of slag cement pastes.” In: L. Struble and P. Brown, Eds. Materials Research Society Symposium Proceedings,
0
10
20
30
40
50
60
70
0 1 2 3 4 5 6 7
Adi
abat
ic te
mpe
ratu
re (℃
)
Age (days)
SG400
SG200
SG300
Original modelModified model
Initial casting temperature 10℃
0
10
20
30
40
50
60
70
0 1 2 3 4 5 6 7
Adi
abat
ic te
mpe
ratu
re (℃
)
Age (days)
SG400
SG300
SG200
Original modelModified model
Initial casting temperature 20℃
0
10
20
30
40
50
60
70
0 1 2 3 4 5 6 7
Adi
abat
ic te
mpe
ratu
re (℃
)
Age (days)
SG400
SG300
SG200
Original modelModified model
Initial casting temperature 30℃
Fig. 12 Adiabatic temperature rises based on original and modified model.

Y. Luan, T. Ishida, T. Nawa and T. Sagawa / Journal of Advanced Concrete Technology Vol. 10, 1-13, 2012 12
Materials Research Society, Pittshurgh. 85, 213-222. Hong, S. Y. and Glasser, F. P., (1999). “Alkali binding in
cement pastes: Part I. the C-S-H phase.” Cement and Concrete Research, 29(12), 1893-1903.
Hoshino, S., Yamada, K. and Hirao, H., (2006). “XRD/Rietveld analysis of the hydration and strength development of slag and limestone blended cement.” Journal of Advanced Concrete Technology, 4(3), 357-367
Imoto, H., Sakai, E., Hukui, R. And Daimon, M., (2006). “Measurement of blast furnace slag content ratio in cement by DSC.” In: Proceedings of the Japan Concrete Institute. 28(1), 29-34. (In Japanese)
Iyoda, T. and Dan, Y., (2007). “The Effect of temperature on hydration rate of slag in blended cement.” In: Proceedings of JSCE 333 Committee Symposium. II59-62. (In Japanese)
Kishi, T. and Maekawa, K., (1994). “Thermal and mechanical modeling of young concrete based on hydration process of multi-component cement minerals.” In: R. Springeschmid, Ed. Proceedings of the International RILEM Symposium on Thermal Cracking in Concrete at Early Ages, Munich. 11-18.
Kishi, T. and Maekawa, K., (1995). “Multi-component model for hydration heat of portland cement.” Journal of Materials, Concrete Structure and Pavements (JSCE), 29, 97-109. (In Japanese)
Kishi, T. and Maekawa, K., (1996). “Multi-component model for hydration heat of blended cement with blast slag and fly ash, Journal of Materials.” Concrete Structures and Pavements (JSCE), 33, 131-143. (In Japanese)
Kishi, T. and Maekawa, K., (1997). “Multi-component model for hydration heating of blended cement with blast furnace slag and fly ash.” Concrete library of JSCE, 30, 125-139.
Kondo, R., Abo-el-enein, S. A. and Daimon, M., (1975). “Kinetics and mechanisms of hydrothermal reaction of granulated blast furnace slag.” Bulletin of the Chemical Society of Japan, 48(1), 222-226.
Kondo, R. and Ohsawa, S., (1969). “Studies on a method to determine the amount of granulated blast furnace slag in cement.” In: Proceedings of the 5th International Symposium on the Chemistry of Cement, Tokyo. Ⅳ, 255-262.
Kurumisawa, K., Nawa, T. and Elakneswaran, Y., (2007). “Study on chloride permeability and microstructure of blast furnace slag blended paste.” In: Proceedings of JSCE 333 Committee Symposium, II37-40. (In Japanese)
Kwak, D., Kokubu, K., Lee,C. and Lee, K., (2004). “Influence of replacement ratio on pore structure of concrete with ground granulated blast furnace.” In: Proceedings of JCI, 26(1), 783-788. (In Japanese)
Luke, K. and Glasser, F. P., (1987). “Selective dissolution of hydrated blast furnace slag cements.” Cement and Concrete Research 17(2), 273-282.
Lumley, J. S., Gollop, R. S., Moir, G. K. and Taylor, H. F.
W., (1996). “Degrees of reaction of the slag in some blends with portland cements.” Cement and Concrete Research, 26(1), 139-151.
Maekawa, K., Ishida, T. and Kishi, T., (2008). “Multi-scale modeling of structural concrete.” London and New York: Taylor & Francis.
Nakarai, K., Ishida, T. and Maekawa, K., (2006). “Modeling of calcium leaching from cement hydrates coupled with micro-pore formation.” Journal of Advanced Concrete Technology, 4(3), 395-407.
Richardson, I. G., (2004). “Tobermorite/jennite and tobermorite/calcium hydroxide-based models for the structure of C-S-H: applicability of hardened pastes of tricalcium silicate, β-dicalcium silicate, portland cement, and blends of portland cement with blast-furnace slag, metakaolin, or silica fume.” Cement and Concrete Research, 34(9), 1733-1777.
Richardson, I. G., Brough, A. R., Groves, G. W. and Dobson, C. M., (1994). “The characterization of hardened alkali-activated blast-furnace slag pastes and the nature of the calcium silicate hydrate (C-S-H) phase.” Cement and Concrete Research, 24(5), 813-829.
Richardson, I. G. and Groves, G. W., (1992). “Microstructure and microanalysis of hardened cement pastes involving ground granulated blast-furnace slag.” Journal of Materials Science, 27, 6204-6212.
Sagawa, T., Ishida, T., Luan, Y. and Nawa, T., (2010). “Hydrate composition analysis and micro structure characteristics of portland cement-blast furnace slag system.” Journal of JSCE E, 66(3), 311-324. (In Japanese)
Sagawa, T. and Nawa, T., (2006a). “Hydration of blast furnace slag cement and effect of water to cement ratio on hydration of blast furnace slag cement. ” Cement Science and Concrete Technology, 60, 82-87. (In Japanese)
Sagawa, T. and Nawa, T., (2006b). “Quantitative hydration analysis of blast furnace slag cement by Rietveld method.” Cement Research and Technology, 17, 1-11. (In Japanese)
Sakai, E., Imoto, H. and Daimon, M., (2004). “Hydration and strength development of blastfurnace slag cement.” In: Proceedings of JCI, 26(1), 135-140. (In Japanese)
Shehata, M. H. and Thomas, M. D. A., (2006). “Alkali release characteristics of blended cements.” Cement and Concrete Research, 36(6), 1166-1175.
Shi, C., Day, R. L., Wu, X. and Tang, M., (1992). “Microstructure and performances of alkali–slag cement pastes.” In: Proceedings of 9th International Congress on the Chemistry of Cements, New Delhi, India. 3, 298-304.
Takamatsu, N. and Maruyama, I., (2009). “Study on volume deformation and hydration degree of blast furnace slag replaced matrix.” In: Proceedings of JCI, 31, 187-192. (In Japanese)

Y. Luan, T. Ishida, T. Nawa and T. Sagawa / Journal of Advanced Concrete Technology Vol. 10, 1-13, 2012 13
Taylor, H. F. W., (1997). “Cement Chemistry.” 2nd ed. Thomas Telford Ltd.
Tanaka, H., Totani, Y. and Saito, Y., (1983). “Structure of hydrated glasy blast furnace slag contents.” ACI Special Publication, 79, 963-977.
Totani, Y., Saito, Y., Kageyama, M. and Tanaka, H., (1980). “The hydration of blast furnace slag cement.” In: Proceedings of the 7th International Congress on the Chemistry of Cement, Paris, 1980. 2 III, 95-98.