enhanced transportation asset data collection … transportation asset data collection using video...
TRANSCRIPT

Enhanced Transportation Asset Data Collection Using Video Log Image
Pattern Recognition
James Tsai, Ph.D., P.E.Georgia Institute of Technology
March 26, 2007

Acknowledgement to National Academy of Science (NAS) NCHRP IDEA Program
for sponsoring
on-going research project of “Developing Image Pattern Recognition Algorithms for Processing
Video Log Images to Enhance Roadway Infrastructure Data Collection”

Outline
Problem StatementResearch ObjectiveProposed Methodology/AlgorithmsPreliminary TestsImplementation ResultsNext Step

Problem StatementPhoto logging provides a safe and effective means to visualize roadway condition and retrieve roadway data (e.g. Signs). However, to collect roadway data by reviewing images one by one is:
• Very labor-intensive.• time consuming (i.e.Year).• Not getting up-to-date roadway data.• Very costly (million of dollars).
(For example, there are more than 17.5-million images collected by LADOTD.)

Research ObjectiveDevelop sign image recognition algorithms to streamline existing sign data collection. The objectives are to:
• Save time (i.e. month).• Save cost (reduce at least 50%).• Quickly get up-to-date roadway data.

Proposed MethodologyFor 17.5-million images collected by LADOTD, there are less than 5% of images containing signs. The proposed methodology is to:
• Effectively eliminate images containing no signs with an acceptable false negative.
• Streamline sign data collection using sign type and legend recognition algorithms.

Sign Type and Legend Recognition
Result - Speed Limit : 15 MPH
Image Processing
Character Recognitions

Sign Location Calculation
Sign Location Calculated:
LAT: 36.149049212
LON: -86.863794344
GPS Location:
LAT: 36.149039055
LON: -86.863680089
Image taken here
15
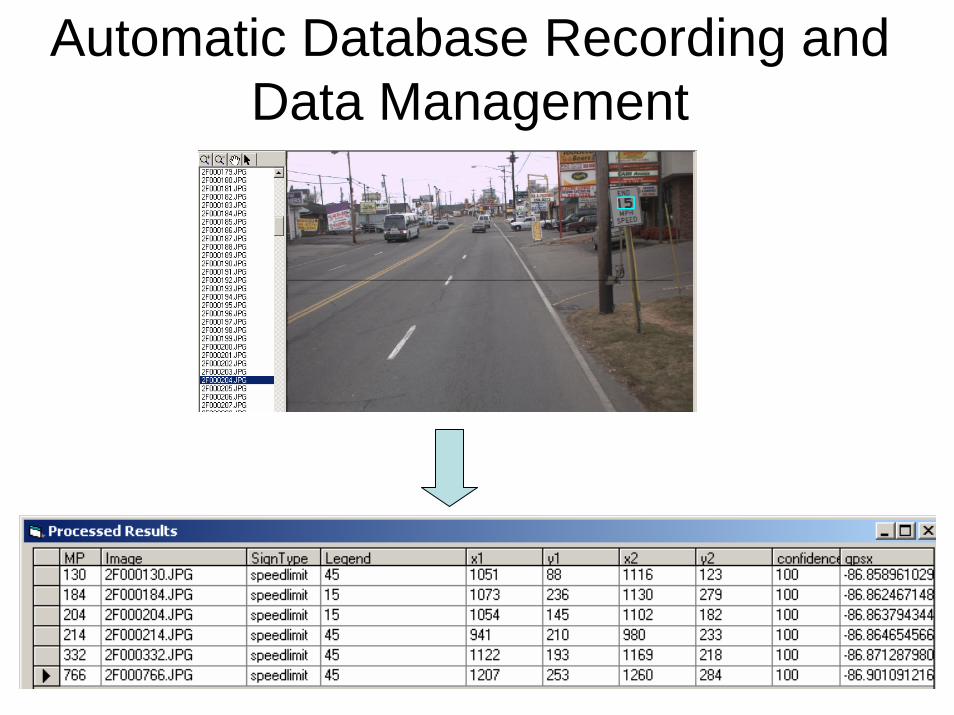
Automatic Database Recording and Data Management

GIS Presentation of Roadway Signs
Signs

Validation Design
SLS recognition algorithm
Video log images (37,640 testing images)
Yes No
Containing SLS folder Containing no SLS folder
Automatic process
Manual validation Manual validation
Has SLS Has no SLS
Correct SLS sign recognized column 5
in Table 1
Incorrect false positive images,
column 9 in Table 1
Has SLS Has no SLS
Incorrect false negative SLS,
column 8 in Table 1
Correct no sign images recognized, column 6
in Table 1
NoNoYes Yes

Preliminary Result – Speed Limit Table 1: Results of automatic speed limit sign recognition for LaDOTD
1 2 3 4 5 6 7 8 9
Functional Class TotalImage
TotalMiles
No.ofSLS
Correct SLSRecognized
Correct noSignImagesrecognized
TotalImages Need to beReviewedManually
IncorrectFalseNegativeSLS
IncorrectFalsePositiveimages
Interstate highways 4760 9.52 13 13 (100%) 4651 (97.7) 109 (2.3%) 0 (0%) 96 (2%)
Non-interstate urban roads 20645 41.19 76 73 (96.1%) 20041
(97.1%) 601 (2.9%) 3 (3.9%) 528 (2.5%)
Non-interstate urban roads 12235 24.46 29 28 (96.6%) 11888
(97.2%) 346 (2.8%) 1 (3.4%) 318 (2.6%)
Total 37,640 75.17 118 114 (96.6%) 36580 (97.2%)
1056 (2.8%) 4 (3.4%) 942
(2.5%)

Preliminary Result – Stop Sign Results of automatic stop sign (SS) recognition for ConnDOT and Nashville
Transportation Agency
Functional Class
Total Image
Total Miles No. of SS Correct SS
recognizedIncorrect False Negative SS
Incorrect False Positive SS
Connecticut DOT State Highway and Local Roads 10,731 107.3 29 (0.27%) 26 (89.7%) 3 (10.3%) 115 (1.07%)
City of Nashville Urban and Rural Local Roads 14,312 143.1 160 (1.12%) 151 (94.4%) 9 (5.6%) 196 (1.37%)

Signs Correctly Recognized

Factors Causing False Recognition
• Small sign due to large video log spacing • Poor lighting condition• High compression ratio• Tilted signs• Blocked and scratched signs

Signs Not Correctly Recognized
Blocked signs Small signs
Titled signs Poor lighting condition

Optimal Video Log Spacing for Sign Recognition
Four consecutive images

Implementation
• Successful sign inventory on processing 600,000 images (half of Nashville City/Davison County). Ready for processing the remaining 750,000 images.
• Pilot study and full-scale implementation using more data provided by state DOTs.

Next Step
• Refine the algorithms to improve false recognition and to have full-scale implementation.
• Test algorithms of recognizing other roadway assets such as roadway geometry, curvature computation, guardrails, sight distance, etc.

Thanks !

Contact Info
James Tsai, Ph.D., P.E.Associate ProfessorGeorgia Institute of TechnologyEmail: [email protected]:(404)385-0904