enhanced visual functioning in autism: an ale meta-analysis
TRANSCRIPT
r Human Brain Mapping 00:000–000 (2011) r
Enhanced Visual Functioning in Autism:An ALE Meta-Analysis
Fabienne Samson,1 Laurent Mottron,1 Isabelle Soulieres,1,2
and Thomas A. Zeffiro2
1Centre d’Excellence en Troubles Envahissants du Developpement de l’Universite de Montreal(CETEDUM), Montreal, QC, Canada
2Neural Systems Group, Massachusetts General Hospital, Boston, Massachusetts
r r
Abstract: Autistics often exhibit enhanced perceptual abilities when engaged in visual search, visualdiscrimination, and embedded figure detection. In similar fashion, while performing a range of percep-tual or cognitive tasks, autistics display stronger physiological engagement of the visual system thando non-autistics. To account for these findings, the Enhanced Perceptual Functioning Model proposesthat enhanced autistic performance in basic perceptual tasks results from stronger engagement of sen-sory processing mechanisms, a situation that may facilitate an atypically prominent role for perceptualmechanisms in supporting cognition. Using quantitative meta-analysis of published functional imagingstudies from which Activation Likelihood Estimation maps were computed, we asked whether autismis associated with enhanced task-related activity for a broad range of visual tasks. To determinewhether atypical engagement of visual processing is a general or domain-specific phenomenon, weexamined three different visual processing domains: faces, objects, and words. Overall, we observedmore activity in autistics compared to non-autistics in temporal, occipital, and parietal regions. In con-trast, autistics exhibited less activity in frontal cortex. The spatial distribution of the observed differen-tial between-group patterns varied across processing domains. Autism may be characterized byenhanced functional resource allocation in regions associated with visual processing and expertise.Atypical adult organizational patterns may reflect underlying differences in developmental neuralplasticity that can result in aspects of the autistic phenotype, including enhanced visual skills, atypicalface processing, and hyperlexia. Hum Brain Mapp 00:000–000, 2011 VC 2011 Wiley-Liss, Inc.
Keywords: hyperlexia; reading; fMRI; vision; perception; enhanced perceptual functioning model;expertise; plasticity
r r
INTRODUCTION
Atypical perceptual processing, often manifested asenhanced perceptual performance [Dakin and Frith, 2005],
is now included as an associated feature of the autistic phe-notype [Belmonte et al., 2004]. Autistic visual strengths areconsistently reported for the Block Design subtest of theWechsler Intelligence Scales [Caron et al., 2006; Shah and
Additional Supporting Information may be found in the onlineversion of this article.
Contract grant sponsor: Autism Speaks; Contract grant number:2706; Contract grant sponsors: Natural Sciences and EngineeringResearch Council of Canada; Canadian Institutes for HealthResearch; Fonds de la Recherche en Sante du Quebec.
*Correspondence to: Thomas A. Zeffiro, M.D., Ph.D., NeuralSystems Group, Massachusetts General Hospital, Room 10.033,
Building 149 13th Street, Charlestown, MA 02119. E-mail: [email protected]
Received for publication 16 August 2010; Revised 12 January2011; Accepted 18 February 2011
DOI: 10.1002/hbm.21307View this article online at wileyonlinelibrary.com.
VC 2011 Wiley-Liss, Inc.

Frith, 1993], the Embedded Figures Task [Jolliffe andBaron-Cohen, 1997], visual search tasks [Joseph et al., 2009;Kemner et al., 2008; O’Riordan, 2004; O’Riordan et al.,2001], and visual discrimination tasks [Bertone et al., 2005;Plaisted et al., 1998]. In addition, an increasing number ofstudies have demonstrated autistic early sensory process-ing advantages or atypicalities in stimulus dimensionextraction, with examples including crowding [Baldassiet al., 2009; Keita et al., 2010], contour and texture process-ing [Pei et al., 2009; Vandenbroucke et al., 2008] and spatialfrequency processing [Jemel et al., 2010; Milne et al., 2009].These behavioral characteristics, along with other aspectsof the autistic perceptual phenotype, have been summar-ized in the Enhanced Perceptual Functioning Model (EPF)[Mottron et al., 2006]. Assuming generally stronger physio-logical engagement of the visual system in autism, thismodel predicts generally superior perceptual performanceand a wider role for perceptual processes in autistic cogni-tion. It also incorporates the observation that autistics1
display better access to information typically masked bytop-down influences [Wang et al., 2007], as well as relativeautonomy of perceptual processes from top-down influen-ces [Caron et al., 2006; Soulieres et al., 2009].
Several neuroimaging studies have revealed strongertask-related activity in visual cortex in autism, evidencedas either higher levels of activity associated with visual in-formation processing, or as serendipitous findings in stud-ies employing memory or language tasks. In associationwith the Embedded Figures Test, autistic brain activity ishigher in right occipital cortex, left posterior parietal cortex,bilateral occipital cortex, and bilateral cerebellar cortex, andlower in frontal cortex [Lee et al., 2007; Manjaly et al., 2007;Ring et al., 1999]. Higher occipital cortex activity in autisticsis seen in relation to faster and more accurate visual search[Keehn et al., 2008]. These results suggest that the autistics’behavioral advantages might arise from stronger and morepervasive engagement of visual processing mechanisms.Stronger occipital activity has also been reported in associa-tion with reduced frontal activity in autism for tasksincorporating a broad range of cognitive and perceptualcomponents, including embedded figure detection [Ringet al., 1999], attention shifting [Belmonte and Yurgelun-Todd 2003], word learning [Hazlett et al., 2004], saccades tovisual targets [Luna et al., 2002], working memory [Kosh-ino et al., 2005], visuomotor learning [Muller et al., 2003],face processing [Hubl et al., 2003], and social attribution[Castelli et al., 2002]. The wide variety of tasks associatedwith higher activity in autistics’ visual cortical areas sug-gests that the atypical physiological processing mechanismsmay be related to task performance in a less straightfor-ward way than initially posited by the EPF model.
Quantitative meta-analysis of functional neuroimagingstudies is one means to characterize the role of perceptual
processes in autism. Neuroimaging meta-analysis combinesresults from independent experiments to achieve a quanti-tative summary of the state of research in a specific domain[Turkeltaub et al., 2002]. It assesses the reliability of resultsacross imaging techniques, tasks, and laboratories byrevealing consistently modulated voxel activity in a collec-tion of studies. In addition, meta-analysis can establish thespecificity of the relationship between a region or networkof regions and a particular task type [Wager et al., 2009].Voxel-wise meta-analysis of neuroimaging studies, calledActivation Likelihood Estimation (ALE; Turkeltaub et al.,2002] has recently been used in autism to documentbetween-group differences in activity related to social com-pared to non-social tasks [Di Martino et al., 2009].
We used ALE meta-analysis to summarize patterns of activ-ity related to visual processing by merging activity maximareported in experiments including both autistic and non-autis-tic groups, a process that resulted in group maps assessingthe regions of common task-related modulation across stud-ies. Maps revealing regions differently engaged betweengroups were then generated by contrasting the within-groupALE maps [Laird et al., 2005]. We included the coordinates ofactivity increases for each group instead of using the reportedcoordinates of differential activity between autistics and non-autistics, an approach used in a recent autism meta-analysis[Di Martino et al., 2009]. Our method allowed identification ofprocessing activity without any a priori bias that might resultfrom including only studies reporting higher or lower activityin autistics compared to non-autistics. For instance, somereports do not include tables listing coordinates related tohigher activity in autistics, even when such findings aredescribed in the body of the paper. To minimize regionalselection bias, we also limited our meta-analysis to studiesthat reported coordinates resulting from whole-brain analysis,as contrasted with region-of-interest (ROI) analysis. Becausethe resource allocation proposition, stated as Principle 4 of theEPF Model [Mottron et al., 2006], was primarily based on areview of neuroimaging studies of visual perception in autis-tics, and because there are only a limited number of neuroi-maging studies of auditory processing, we limited the currentanalysis to studies employing visual stimuli.
In this meta-analysis our aim was to quantitatively sum-marize the neuroimaging findings concerning visual proc-essing in autism in order to test the prediction thatautistics will exhibit generally stronger engagement of thevisual system. Additionally, we explored the relative do-main specificity of atypical visual processes in autism, byexamining whether any differences between autistics andnon-autistics showed specificity for face, object, or wordstimulus classes.
MATERIALS AND METHODS
Literature Review and Contrast Selection
We performed a PubMed literature search (www.pubmed.org) to identify functional neuroimaging studies
1Throughout the report we respectfully use the term autistics, fol-lowing Sinclair, J. (1999). Why I dislike ‘‘person first’’ language.http://www.jimsinclair.org/person_first.htm
r Samson et al. r
r 2 r
published from 1995 to July 2009 in which visual stimuliwere presented to both autistic and non-autistic groups.For this analysis, what we call the autistic group includedparticipants with diagnostic assignments falling withinwhat are generally referred to as autism spectrum condi-tions. We used the following search terms: «(Autism ORAsperger OR PDD) AND (fMRI OR PET OR Neuroimag-ing)» and retrieved 787 articles. Among those, 692 wereexcluded through an initial review of the abstracts. Studiesexcluded were 217 reviews, 207 reports without an autisticgroup, 255 reports not using PET or fMRI, and 19 reportsincluding no visual stimuli. Of the remaining 89 studies,22 were rejected because of small sample size (n < 10), 21because of partial brain coverage or analysis, 11 becauseresults were not reported in a standard anatomical space,and 9 because only between-group contrasts were pre-sented. The remaining 26 peer-reviewed fMRI articlesreporting within-group results using whole brain acquisi-tion techniques in a standardized stereotaxic space wereincluded in the meta-analysis. Coordinates reported inMNI space were converted to Talairach anatomical spaceusing the ‘‘Convert Foci’’ tool of the GingerALE 1.1 pro-gram [Laird et al., 2005]. This tool uses the icbm2tal Lan-caster transform [Lancaster et al., 2007]. The total numberof participants included 370 typical controls and 357 indi-viduals with an autism spectrum condition determination.Most studies were conducted on adults and all includedparticipants with Full Scale IQ in the normal range. Seven
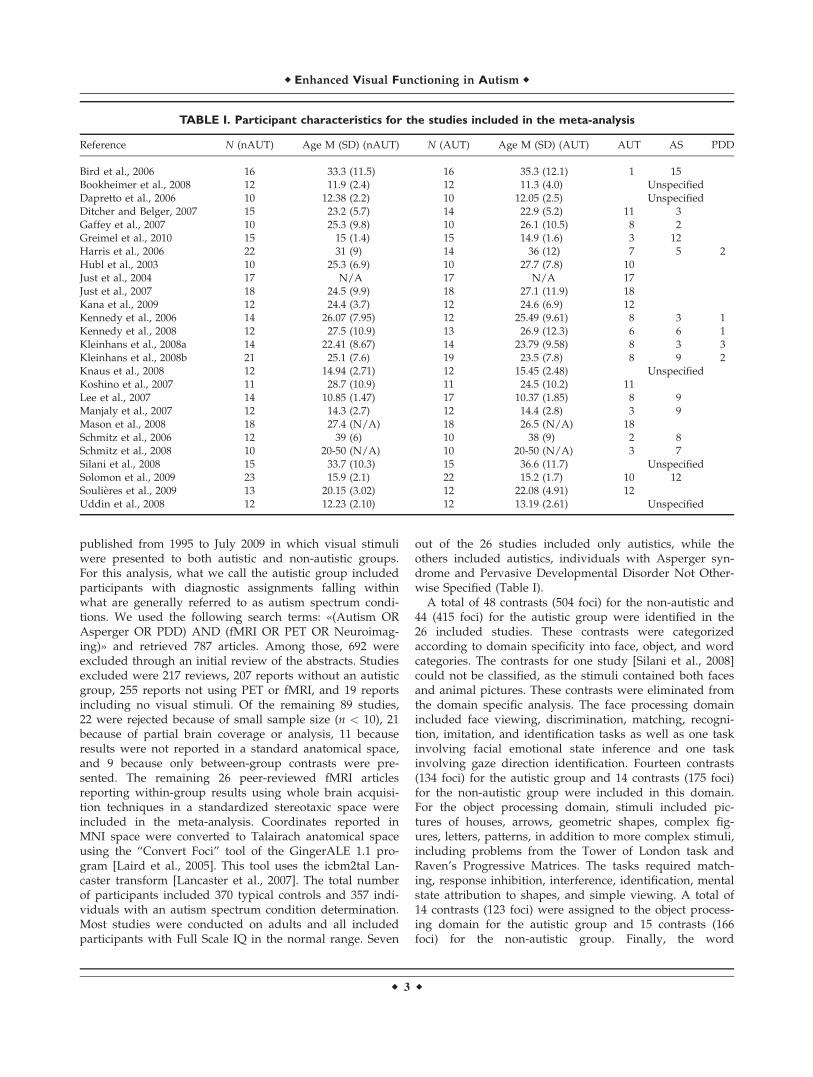
out of the 26 studies included only autistics, while theothers included autistics, individuals with Asperger syn-drome and Pervasive Developmental Disorder Not Other-wise Specified (Table I).
A total of 48 contrasts (504 foci) for the non-autistic and44 (415 foci) for the autistic group were identified in the26 included studies. These contrasts were categorizedaccording to domain specificity into face, object, and wordcategories. The contrasts for one study [Silani et al., 2008]could not be classified, as the stimuli contained both facesand animal pictures. These contrasts were eliminated fromthe domain specific analysis. The face processing domainincluded face viewing, discrimination, matching, recogni-tion, imitation, and identification tasks as well as one taskinvolving facial emotional state inference and one taskinvolving gaze direction identification. Fourteen contrasts(134 foci) for the autistic group and 14 contrasts (175 foci)for the non-autistic group were included in this domain.For the object processing domain, stimuli included pic-tures of houses, arrows, geometric shapes, complex fig-ures, letters, patterns, in addition to more complex stimuli,including problems from the Tower of London task andRaven’s Progressive Matrices. The tasks required match-ing, response inhibition, interference, identification, mentalstate attribution to shapes, and simple viewing. A total of14 contrasts (123 foci) were assigned to the object process-ing domain for the autistic group and 15 contrasts (166foci) for the non-autistic group. Finally, the word
TABLE I. Participant characteristics for the studies included in the meta-analysis
Reference N (nAUT) Age M (SD) (nAUT) N (AUT) Age M (SD) (AUT) AUT AS PDD
Bird et al., 2006 16 33.3 (11.5) 16 35.3 (12.1) 1 15Bookheimer et al., 2008 12 11.9 (2.4) 12 11.3 (4.0) UnspecifiedDapretto et al., 2006 10 12.38 (2.2) 10 12.05 (2.5) UnspecifiedDitcher and Belger, 2007 15 23.2 (5.7) 14 22.9 (5.2) 11 3Gaffey et al., 2007 10 25.3 (9.8) 10 26.1 (10.5) 8 2Greimel et al., 2010 15 15 (1.4) 15 14.9 (1.6) 3 12Harris et al., 2006 22 31 (9) 14 36 (12) 7 5 2Hubl et al., 2003 10 25.3 (6.9) 10 27.7 (7.8) 10Just et al., 2004 17 N/A 17 N/A 17Just et al., 2007 18 24.5 (9.9) 18 27.1 (11.9) 18Kana et al., 2009 12 24.4 (3.7) 12 24.6 (6.9) 12Kennedy et al., 2006 14 26.07 (7.95) 12 25.49 (9.61) 8 3 1Kennedy et al., 2008 12 27.5 (10.9) 13 26.9 (12.3) 6 6 1Kleinhans et al., 2008a 14 22.41 (8.67) 14 23.79 (9.58) 8 3 3Kleinhans et al., 2008b 21 25.1 (7.6) 19 23.5 (7.8) 8 9 2Knaus et al., 2008 12 14.94 (2.71) 12 15.45 (2.48) UnspecifiedKoshino et al., 2007 11 28.7 (10.9) 11 24.5 (10.2) 11Lee et al., 2007 14 10.85 (1.47) 17 10.37 (1.85) 8 9Manjaly et al., 2007 12 14.3 (2.7) 12 14.4 (2.8) 3 9Mason et al., 2008 18 27.4 (N/A) 18 26.5 (N/A) 18Schmitz et al., 2006 12 39 (6) 10 38 (9) 2 8Schmitz et al., 2008 10 20-50 (N/A) 10 20-50 (N/A) 3 7Silani et al., 2008 15 33.7 (10.3) 15 36.6 (11.7) UnspecifiedSolomon et al., 2009 23 15.9 (2.1) 22 15.2 (1.7) 10 12Soulieres et al., 2009 13 20.15 (3.02) 12 22.08 (4.91) 12Uddin et al., 2008 12 12.23 (2.10) 12 13.19 (2.61) Unspecified
r Enhanced Visual Functioning in Autism r
r 3 r

processing domain included visually presented words orsentences, with participants identifying word category,making a semantic judgment, answering reading compre-hension questions, counting words, or generating words ina given category (verbal fluency). The word processing do-main included 14 contrasts (137 foci) for the autistic groupand 17 contrasts (136 foci) for the non-autistic group. Inaddition, we investigated the effect of contrasting high tolow level baselines across all tasks, by computing separateALE maps using either low level baselines, such as fixa-tion or rest, or high level baselines such as complex figurematching. Both types of maps yielded superimposable pat-terns for both the autistic and non-autistic groups. There-fore, in an effort to increase statistical power, contrastswith both high and low level baselines were pooled for allsubsequent analyses.
ALE Meta-Analysis
ALE maps were computed using GingerALE (version1.1 www.brainmap.org/ale) software [Laird et al., 2005],based on methods introduced by Turkeltaub et al., [2002].The ALE technique models the uncertainty in location oftask-related activity foci as Gaussian probability distribu-tions, yielding statistical maps in which each voxel valuerepresents an estimate of the likelihood that activityoccurred in the studies included in the meta-analysis. Thecritical threshold for the ALE map is set using a MonteCarlo permutation analysis of sets of randomly distributedfoci. A FWHM of 8 mm was selected for the Gaussianprobability distributions to reflect the average smoothnessof the fMRI data from which the foci were derived. Thecritical threshold was set using a 5,000 permutations test,corrected for multiple comparisons (False Discovery Rate(FDR); Laird et al., 2005]. The model is of the fixed-effectsclass and permits inferences over the studies included inthe meta-analysis.
Maps reflecting regions of convergence across allreported coordinates both within- and between-groupswere computed, using maxima drawn from all three proc-essing domains. As there was an imbalance between thetotal number of foci included for the non-autistic (48experiments, 504 foci) and autistic (44 experiments, 415foci) samples, it was necessary to randomly removeexperiments from the non-autistic group to equalize thenumber of foci between groups (44 experiments, 438 foci),increasing the possibility that the difference maps wouldreflect activity differences between groups rather than animbalance in coordinate numbers between categories[Laird et al., 2005]. Second, domain specific within-groupALE maps for face, object, and word processing were com-puted. For each domain, the number of experiments andfoci were similar enough for direct comparison. To com-pare activity patterns between autistics and non-autistics,the within-group ALE maps were subtracted from oneanother and randomization testing with 5,000 permuta-
tions was performed. This procedure tests for the presenceof differences between the groups under the null hypothe-sis that both sets of foci are uniformly distributed [Lairdet al., 2005]. The critical threshold was set at pFDR (<0.05(k ¼ 250 voxels). To present results in the anatomical spacemost commonly used in the current literature, the ALEcoordinate results were transformed into the MNI anatom-ical space using the Lancaster transform [Lancaster et al.,2007].
RESULTS
Behavior
Table II summarizes the behavioral findings for all stud-ies included in the meta-analysis. In the majority of stud-ies, autistics and non-autistics exhibited similar accuraciesor response times. There were no significant between-group differences in performance in 69% of the studies(18/26), whereas autistics showed better performance in7.6% of the studies (2/26) and poorer performance in 23%of the studies (6/26). Across domains, no between-groupbehavioral differences were observed in 64% of the facetasks (9/14 contrasts), 93% of the object tasks (14/15), and71% of the word tasks (12/17 contrasts).
Five studies included information about eye movementcharacteristics, reporting the number or duration of fixa-tions or saccades or the eye movement related fluctuationsin the orbital BOLD-contrast signal. None of these studiesfound any significant between-group differences in eyemovement measures acquired either during the scanningsessions [Greimel et al., 2009; Soulieres et al., 2009] or inseparate experimental sessions [Bird et al., 2006; Daprettoet al., 2006; Kleinhans et al., 2008b].
Combined Face, Object, and Word Processing
Within-group maps
We first analyzed the task-related activity across allprocessing domains within each group. ALE maxima val-ues for the autistic and non-autistic groups are presentedin Table III. Figures 1 and S1 show a broadly overlappingpattern of activity in the two groups, with large clusters inbilateral striate and extrastriate areas (BA 17, 18, 19); fusi-form gyrus (BA 37); precuneus (BA 7); inferior (BA 44, 45,47), middle (BA 46), and superior (BA 8, 9) frontal gyri;precentral (BA 6) gyrus; and the insula (BA 13).
Between-group maps
Direct comparisons between autistic and non-autisticgroup maps revealed differing ALE values in occipito-tem-poral and frontal regions (Table IV; Fig. 1 and S1). Overallhigher ALE values in striate (BA 17) and extrastriate (BA18, 19) cortex were found in autistics. Small bilateral clus-ters in posterior extrastriate cortex (BA 18) exhibit lower
r Samson et al. r
r 4 r
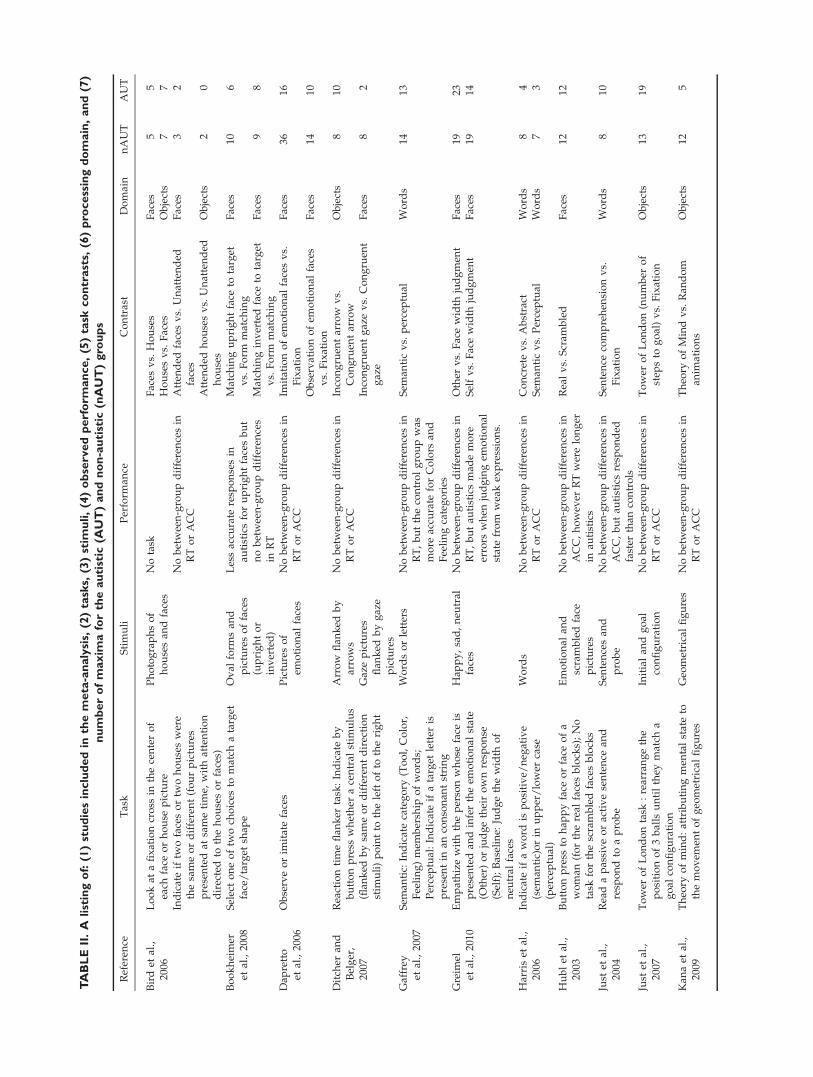
TABLEII.A
listingof:(1)studiesincludedin
themeta-analysis,
(2)tasks,
(3)stim
uli,(4)observedperform
ance,(5)task
contrasts,
(6)pro
cessingdomain,and(7)
numberofmaxim
afortheautistic
(AUT)andnon-autistic
(nAUT)gro
ups
Referen
ceTask
Stimuli
Perform
ance
Contrast
Domain
nAUT
AUT
Birdet
al.,
2006
Lookat
afixationcross
inthecenterof
each
face
orhouse
picture
Photographsof
housesan
dfaces
Notask
Faces
vs.
Houses
Faces
55
Housesvs.
Faces
Objects
77
Indicateiftw
ofacesortw
ohouseswere
thesameordifferent(fourpictures
presentedat
sametime,
withattention
directedto
thehousesorfaces)
Nobetween-groupdifferencesin
RTorACC
Atten
ded
facesvs.
Unattended
faces
Faces
32
Atten
ded
housesvs.
Unattended
houses
Objects
20
Bookheimer
etal.,2008
Selectoneoftw
och
oices
tomatch
atarget
face/target
shap
eOval
form
san
dpicturesoffaces
(uprightor
inverted)
Lessaccu
rate
resp
onsesin
autisticsforuprightfacesbut
nobetween-groupdifferences
inRT
Match
inguprightface
totarget
vs.
Form
match
ing
Faces
106
Match
inginvertedface
totarget
vs.
Form
match
ing
Faces
98
Dap
retto
etal.,2006
Observeorim
itatefaces
Picturesof
emotional
faces
Nobetween-groupdifferencesin
RTorACC
Imitationofem
otional
facesvs.
Fixation
Faces
3616
Observationofem
otional
faces
vs.
Fixation
Faces
1410
Ditch
eran
dBelger,
2007
Reactiontimeflan
ker
task:Indicateby
buttonpress
whether
acentral
stim
ulus
(flan
ked
bysameordifferentdirection
stim
uli)pointto
theleftofto
theright
Arrow
flan
ked
by
arrows
Nobetween-groupdifferencesin
RTorACC
Incongruen
tarrow
vs.
Congruen
tarrow
Objects
810
Gazepictures
flan
ked
bygaze
pictures
Incongruen
tgazevs.
Congruen
tgaze
Faces
82
Gaffrey
etal.,2007
Sem
antic:
Indicatecategory
(Tool,Color,
Feeling)mem
bersh
ipofword
s;Perceptual:Indicateifatarget
letter
ispresentin
anconsonan
tstring
Word
sorletters
Nobetween-groupdifferencesin
RT,butthecontrolgroupwas
more
accu
rate
forColors
and
Feelingcategories
Sem
anticvs.
perceptual
Word
s14
13
Greim
elet
al.,2010
Empathizewiththepersonwhose
face
ispresentedan
dinfertheem
otional
state
(Other)orjudgetheirownresp
onse
(Self);Baseline:
Judgethewidth
of
neu
tral
faces
Hap
py,sad,neu
tral
faces
Nobetween-groupdifferencesin
RT,butau
tisticsmad
emore
errors
when
judgingem
otional
statefrom
weakexpressions.
Other
vs.
Facewidth
judgmen
tFaces
1923
Selfvs.
Facewidth
judgmen
tFaces
1914
Harriset
al.,
2006
Indicateifaword
ispositive/
neg
ative
(sem
antic)orin
upper/lower
case
(perceptual)
Word
sNobetween-groupdifferencesin
RTorACC
Concretevs.
Abstract
Word
s8
4Sem
anticvs.
Perceptual
Word
s7
3
Hublet
al.,
2003
Buttonpress
tohap
pyface
orface
ofa
woman
(forthereal
facesblocks);No
task
forthescrambledfacesblocks
Emotional
and
scrambledface
pictures
Nobetween-groupdifferencesin
ACC,howev
erRTwerelonger
inau
tistics
Realvs.
Scram
bled
Faces
1212
Just
etal.,
2004
Readapassiveoractivesentence
and
resp
ondto
aprobe
Sen
tencesan
dprobe
Nobetween-groupdifferencesin
ACC,butau
tisticsresp
onded
faster
than
controls
Sen
tence
comprehen
sionvs.
Fixation
Word
s8
10
Just
etal.,
2007
Tower
ofLondontask
:rearrangethe
positionof3balls
untilthey
match
agoal
configuration
Initialan
dgoal
configuration
Nobetween-groupdifferencesin
RTorACC
Tower
ofLondon(number
of
step
sto
goal)vs.
Fixation
Objects
1319
Kan
aet
al.,
2009
Theo
ryofmind:attributingmen
talstateto
themovem
entofgeo
metricalfigures
Geo
metricalfigures
Nobetween-groupdifferencesin
RTorACC
Theo
ryofMindvs.
Ran
dom
anim
ations
Objects
125

TABLEII.(C
ontinued)
Referen
ceTask
Stimuli
Perform
ance
Contrast
Domain
nAUT
AUT
Ken
ned
yet
al.,2006
Countthenumber
ofpresentedword
s(emotional,neu
tral
ornumber
word
s)an
dselect
resp
onse
(3,4,
5word
s).
Word
sNobetween-groupdifferencesin
RTorACC
Countnumber
ofword
svs.
Fixation
Objects
88
Countem
otional
vs.
neu
tral
word
sObjects
30
Ken
ned
yet
al.,2008
Statemen
t:Mak
etrue/
falsejudgmen
tsfor
statem
ents
aboutthem
selves
(self)ora
close
other
person(other)describing
psych
ological
personalitytraits
(internal)
orobservab
lech
aracteristics(external);
Equation:Indicateifamatheq
uation
was
trueorfalse
Statemen
tsormath
equations
Nobetween-groupdifferences
inRTorACC
Allstatem
ents
vs.
Equation
Word
s11
8Internal
vs.External
Word
s4
0External
vs.
Internal
Word
s7
12Other
vs.
Self
Word
s6
4
Kleinhan
set
al.,
2008a
Verbal
fluen
cy:Gen
erateas
man
yword
sas
possible
beg
inningwithagiven
letter
oritem
sin
given
category
Letters
or
categories
Autisticsgen
erated
less
word
sthan
controlgroupforboth
conditions,
butnobetween
groupdifferencesin
number
oferrors
(word
repetition,
non-target
item
,neo
logism)
Gen
erateword
sstartingwitha
given
letter
vs.
repeat
‘‘nothing’’
Word
s1
1
Gen
erateword
sin
agiven
category
vs.
repeat‘‘n
othing’’
Word
s3
3
Gen
erateword
sin
acategory
vs.
startingwithagiven
letter
Word
s5
0
Kleinhan
set
al.,
2008b
Press
abuttonwhen
ever
iden
ticalstim
uli
appearin
succession(1-back)
Picturesofneu
tral
facesan
dhouses
Nobetween-groupdifferences
inRTorACC
Faces
vs.
Houses
Faces
13
Housesvs.
Faces
Objects
22
Knau
set
al.,
2008
Reading:select
aword
that
bestmatch
athree-word
phrase
description;Letter
judgmen
t:Indicatewhether
letter
strings
werein
upper
orlower
case
Sen
tencesorletter
strings
Autisticshav
ebetteran
dfaster
resp
onsesthan
controls.
Readingan
dresp
ondingvs.
Letterjudgmen
tWord
s7
8
Kosh
ino
etal.,2007
Facerecognition(0-back,1-back,2-back):
Iden
tify
aremem
bered
target
face
Grayscalepictures
offaces
Nobetween-groupdifferences
inRTorACC
Facerecognitionvs.
Fixation
Faces
159
Lee
etal.,
2007
Embed
ded
Figure
Task:Selectoneoftw
oprobefigure
that
contained
thetarget
shap
e;Match
ingTask:Selectoneoftw
oprobefigure
that
isiden
ticalto
thetar-
get
shap
e
Pairs
ofcomplex
figuresan
dtarget
shap
es
Nobetween-groupdifferences
inRTorACC
Embed
ded
Figure
Taskvs.
Match
ingTask
Objects
113
Man
jaly
etal.,2007
Embed
ded
Figure
Task:Decideifatarget
figure
match
edasu
bpartofacomplex
figure;Match
ingTask:Indicateifa
highlightedpartofacomplexfigure
match
edatarget
shap
e
Complexan
dtarget
figure
Nobetween-groupdifferences
inRTorACC
Embed
ded
Figure
Taskvs.
Match
ingtask
Objects
24
Masonet
al.,
2008
Readthree-sentence
stories
andresp
ondto
asimple
yes/nocomprehen
sion
questionbased
onaphysical(direct
consequen
ce),intentional
(character’s
goal)orem
otional
(character’sem
otion)
inference
Sen
tence
and
question
N/A
Intentional
inference
vs.
Fixation
Word
s12
20Emotional
inference
vs.
Fixation
Word
s15
17Physicalinference
vs.
Fixation
Word
s17
26
Sch
mitz
etal.,2006
Motorresp
onse
inhibited
orexecuted
dep
endingonGO
/noGosignal
Arrow
pointingleft
orright
Nobetween-groupdifferences
inRTorACC
Govs.
NoGo
Objects
116

TABLEII.(C
ontinued)
Referen
ceTask
Stimuli
Perform
ance
Contrast
Domain
nAUT
AUT
Stoop:Press
abuttonifan
arrow
indicatingleft(orright)is
displayed
onleft(orright)
Arrow
onleftor
rightside
Nobetween-groupdifferencesin
RTorACC
Correctstroopinhibitionvs.
Congruen
tObjects
59
Shiftattentionan
dsw
itch
resp
onse
tonew
associationpatterns
Red
dotan
dfour
squares
Nobetween-groupdifferencesin
RTorACC
Switch
vs.
Rep
eatsettrials
Objects
99
Sch
mitz
etal.,2008
Press
abuttonto
twotarget
letters,
oneof
whichwas
linked
tomonetaryreward
Letter
Nobetween-groupdifferences
inRTorACC
Successfulrewardvs.
Successful
unrewarded
Objects
54
Silan
iet
al.,
2008
Rate(visual
analoguescale)
theem
otional
valueortheratioofblack/whitepixels
inpleasan
t,unpleasan
torneu
tral
pictures
Affectivepictures
Nobetween-groupdifferences
inRTorACC
Emotionvs.
Colorrating
*24
8Unpleasan
tvs.
Neu
tral
*3
13
Solomon
etal.,2009
Preparingto
overcomeprepotency
(POP)
task
(response
inhibition):Press
key
on
sameordifferentsideas
target
Squares
andarrows
Nodifferencesin
RT,but
autisticsmad
emore
errors
ontrials
requiringresp
onse
inhibition
Inhibitionvs.
NoInhibition
Objects
164
Soulieres
etal.,2009
Pattern
match
ing:Selectoneof8resp
onse
that
bestmatch
apattern;Rav
en’s
stan
dardprogressivematrices(RSPM):
Selectoneof8resp
onse
tomatrices
from
whichthefinal
entryis
missing
Target
pattern
or
RSPM
plus8
resp
onse
choices
Nobetween-groupdifferences
inRTorACC
Pattern
match
ingvs.
Fixation
Objects
3323
Rav
envs.
Fixation
Objects
3018
Uddin
etal.,
2008
Press
abuttoniftheface
presentedlooks
likeselfan
dan
other
buttonifitlooks
likean
other
orscrambledface
Picturesof
participan
tan
dan
other
person
Nobetween-groupdifferences
inRTorACC
Ownface
vs.
Fixation
Faces
1218
Other
face
vs.
Fixation
Faces
126

TABLE III. ALE maxima of regions showing within-group effects for combined «FACES, OBJECTS and WORDS»
processing domains (pFDR< 0.05, k 5 250vx)
Left Right
Region BA x y z ALE (x10�3) x y z ALE (x10�3)
Non-autistic
OccipitalInferior occipital gyrus 18 �18 �95 �4 39.10 14 �95 �7 30.83Fusiform gyrus 19 �31 �87 �9 36.88 42 �74 �9 33.00
19 �42 �81 �12 34.62Lingual gyrus 17 �18 �94 7 22.00
18 �18 �78 �10 27.02Temporal
Fusiform gyrus 37 �42 �54 �19 53.51 41 �59 �13 28.5442 �47 �21 40.38
Middle temporal gyrus 21 �53 �35 �7 30.23 59 �37 �2 29.6721 �55 �32 2 21.6221 �61 �47 �4 20.19
ParietalPrecuneus 7 �1 �59 35 30.21 32 �65 42 32.15Superior parietal lobule 7 26 �62 50 26.13Angular gyrus 39 �30 �58 44 26.23Frontal
Precentral gyrus 6 �46 1 34 37.45 47 7 28 63.17Middle frontal gyrus 46 42 33 12 40.01
9 �46 15 30 31.66 42 26 21 24.049 �1 57 17 29.539 �46 23 25 20.22
Superior frontal gyrus 6 0 15 52 39.526 �5 9 57 38.348 �11 55 37 29.908 �3 29 42 28.239 �25 51 27 27.14
Inferior frontal gyrus 47 �47 27 �4 35.1145 �53 22 10 27.2944 �55 14 �1 25.92 53 9 9 21.71
Insula 13 �31 23 0 24.50 31 26 �1 52.7113 44 14 9 24.94
Subcortical
Cingulate gyrus 31 �1 �47 31 43.46Parahippocampal gyrus 37 �27 �46 �11 27.81 29 �46 �12 37.16
27 �25 �31 �8 29.53Thalamus 27 �26 �3 34.68Caudate 21 �24 18 34.23Putamen �23 0 3 25.61Autistic
OccipitalFusiform gyrus 19 �48 �72 �5 24.78 38 �74 �9 46.87
19 �40 �66 �18 48.79 29 �83 �15 23.8119 �20 �81 �10 24.48
Middle occipital gyrus 18 �31 �85 �7 42.92 34 �87 10 27.2318 �22 �93 18 26.71 23 �98 �9 25.3119 32 �80 23 21.51
Cuneus 17 �12 �99 3 32.31Lingual gyrus 19 23 �71 �2 28.53
18 8 �77 3 22.37Temporal
Fusiform gyrus 37 �44 �51 �17 34.13 31 �47 �16 51.5137 �33 �63 �7 29.81 46 �49 �16 36.5637 �33 �48 �22 26.59
r Samson et al. r
r 8 r

ALE values in autistics. While both groups showed strongactivity in BA 37, lower ALE values were found in autis-tics bilaterally in the anterior fusiform gyrus and in themedial part of the left fusiform gyrus. Additionally, autis-tics had lower ALE values in left middle temporal gyrus(BA 21) and higher ALE values in the left precuneus andintraparietal sulcus (BA 7).
In the frontal cortex, lower ALE values were observedin autistics in bilateral precentral (BA 4, 6), superior frontal(BA 6, 8, 9) and inferior frontal (BA 45, 47) gyri. HigherALE values in autistics were limited to small regions inthe posterior part of the left inferior frontal gyrus (BA 47)and in right medial frontal gyrus (BA 8). Clusters of loweractivity in the autistics were also observed in bilateralinsula (BA 13) and in cingulate cortex (BA 24) (Fig. S1).
To better visualize the spatial pattern of the differentialvisual activity in both groups, we computed the numberof voxels for which ALE values differed between autisticsand non-autistics in the left and right hemispheres for thefrontal, parietal, occipital, temporal and subcortical regions(Table V). Combining counts across all tasks, 6368 voxelshad higher ALE values, and 2016 voxels had lower ALEvalues in the temporal, occipital and parietal lobes of theautistics compared to the non-autistics. In contrast, thefrontal lobes of the autistics exhibited a reversed pattern,with higher ALE values in 1360 voxels and lower ALE val-ues in 4808 voxels (see Fig. 2). The associated analysis of
variance revealed a significant effect of Region, F (4, 10) ¼6.4, p ¼ 0.008 and a Region x Group interaction F (4, 10) ¼6.2, p ¼ 0.009. These patterns reveal an atypical spatial dis-tribution of visual processing in autism, seen as a posteriorto anterior gradient of group activity differences, with theautistics exhibiting generally higher ALE values in poste-rior regions and lower ALE values in frontal regions.
Face Processing
Within-group maps
We then restricted the analysis to the face processingdomain (Table VI). Figures 1 and S2 show partially over-lapping clusters of group activity. While both groups hadhigh ALE values bilaterally along the fusiform gyrus (BA19, 37), the largest overlap was observed in the anteriorand middle fusiform gyrus, involving more posterior andlateral regions on the left than on the right. Additionally,both groups had high ALE values in right superior tempo-ral gyrus (BA 22) and medial parietal cortex (BA 7). More-over, both groups displayed activity in the posteriorcingulate, the globus pallidus and at the temporo-occipitaljunction (BA 21, 39). Significant ALE values in frontal cor-tex were more numerous in non-autistics (BA 4, 6, 9, 10,44, 45, 46) and overlap between the groups was limited toALE values in precentral gyrus (BA 6) and insula (BA 13).
TABLE III. (Continued)
Left Right
Region BA x y z ALE (x10�3) x y z ALE (x10�3)
Superior temporal gyrus 39 60 �60 25 27.0922 �50 �55 20 23.97
ParietalPrecuneus 7 �26 �67 41 39.29 4 �55 37 27.34
7 30 �65 42 27.23Superior parietal lobule 7 �22 �64 51 15.04Frontal
Inferior frontal gyrus 47 �49 22 �10 44.14Middle frontal gyrus 9 �48 19 26 30.82 56 23 35 32.84
9 47 6 39 16.45Superior frontal gyrus 6 �7 10 60 39.76
6 �3 15 43 19.389 3 59 18 23.42
Precentral gyrus 6 51 7 27 35.586 40 11 32 26.44
Insula 13 �31 24 5 36.79 36 24 1 45.55Subcortical
Putamen �25 6 4 32.22Globus pallidus �25 �10 �10 29.41Cingulate gyrus 31 2 �51 32 27.35
24 3 43 0 26.35Parahippocampal gyrus 28 �25 �27 �8 25.76
19 27 �54 �6 23.0237 �27 �46 �11 21.69
Thalamus �12 �19 9 24.20 27 �30 0 25.5725 �24 �5 22.32
AQ3
r Enhanced Visual Functioning in Autism r
r 9 r

Between-group maps
Between-group comparisons of face processing revealed
areas of differential activity in occipital, temporal and
frontal cortex (Table VII; Figs. 1, 3, and S2). First, higher
ALE values in autistics were found in the fusiform gyrus
(BA 37) bilaterally, while regions immediately posterior
showed lower ALE values. Autistics also had higher ALE
values in the middle portion of the left fusiform gyrus,
the right lingual gyrus (BA 18, 19) and primary visualcortex (BA 17), with below threshold clusters at �20,�95, þ3; vx ¼ 48 and �14, �99, þ1; vx ¼ 32. Maximawere also seen in left middle temporal gyrus (BA 21),with greater ALE values for autistics in the extreme ante-rior portion and lower values in autistics in the posteriorpart of the gyrus. The autistics had lower ALE values inleft superior temporal gyrus (BA 39), while the corre-sponding region on the right had higher ALE values. The
Figure 1.
Within- and between-group distribution of task-related activity
in inferior occipital and inferotemporal cortex. A: Regions
showing increases in autistics (RED), non-autistics (GREEN), and
their overlap (YELLOW) for «FACES, OBJECTS and WORDS»
tasks combined. B: Regions showing more task-related activity
in autistics vs. non-autistics (RED-YELLOW) and less task-
related activity in autistics vs. non-autistics (BLUE-GREEN) for
the combined «FACES, OBJECTS, and WORDS» tasks. C:
Regions showing increases in autistics (RED), non-autistics
(GREEN), and their overlap (YELLOW) for the «FACES» tasks.
D: Regions showing more task-related activity in autistics vs.
non-autistics (RED-YELLOW) and less task-related activity in
autistics vs. non-autistics (BLUE-GREEN) for the «FACES» tasks.
ALE maps (pFDR < 0.05) are superimposed on axial slices from
a gray matter template in MNI space. Anatomical left is image
left.
r Samson et al. r
r 10 r
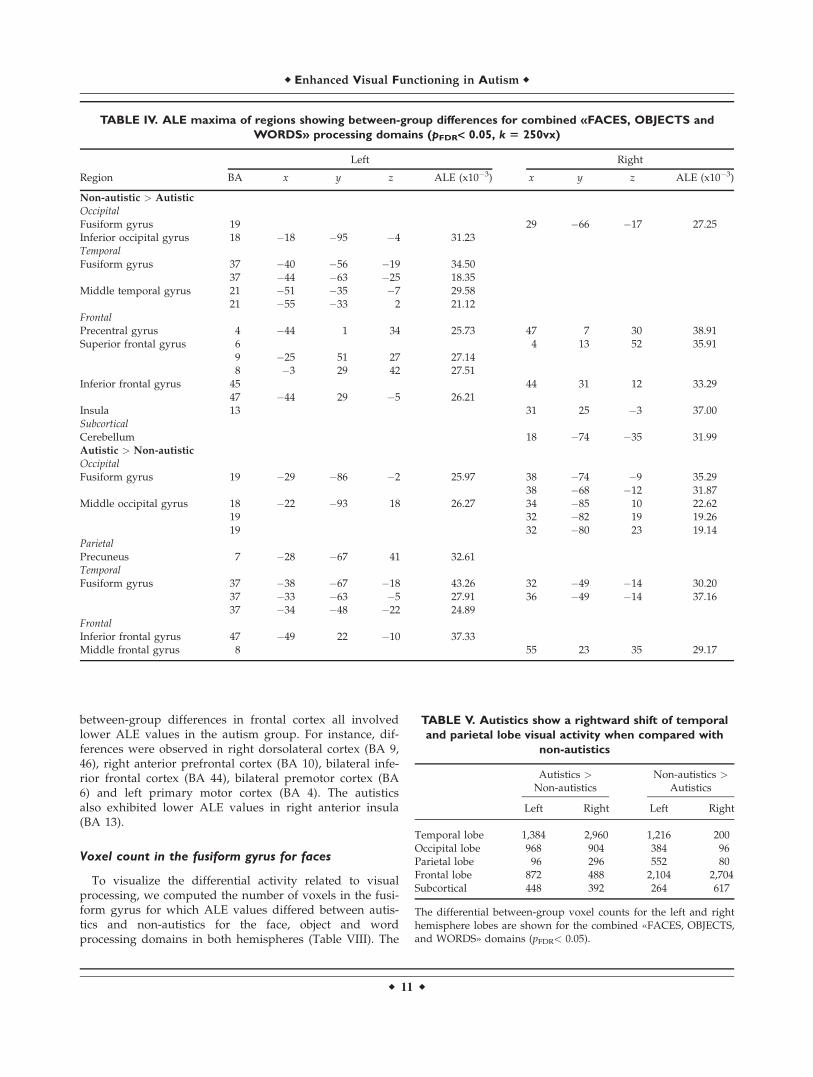
between-group differences in frontal cortex all involvedlower ALE values in the autism group. For instance, dif-ferences were observed in right dorsolateral cortex (BA 9,46), right anterior prefrontal cortex (BA 10), bilateral infe-rior frontal cortex (BA 44), bilateral premotor cortex (BA6) and left primary motor cortex (BA 4). The autisticsalso exhibited lower ALE values in right anterior insula(BA 13).
Voxel count in the fusiform gyrus for faces
To visualize the differential activity related to visualprocessing, we computed the number of voxels in the fusi-form gyrus for which ALE values differed between autis-tics and non-autistics for the face, object and wordprocessing domains in both hemispheres (Table VIII). The
TABLE IV. ALE maxima of regions showing between-group differences for combined «FACES, OBJECTS and
WORDS» processing domains (pFDR< 0.05, k 5 250vx)
Left Right
Region BA x y z ALE (x10�3) x y z ALE (x10�3)
Non-autistic > Autistic
Occipital
Fusiform gyrus 19 29 �66 �17 27.25Inferior occipital gyrus 18 �18 �95 �4 31.23TemporalFusiform gyrus 37 �40 �56 �19 34.50
37 �44 �63 �25 18.35Middle temporal gyrus 21 �51 �35 �7 29.58
21 �55 �33 2 21.12FrontalPrecentral gyrus 4 �44 1 34 25.73 47 7 30 38.91Superior frontal gyrus 6 4 13 52 35.91
9 �25 51 27 27.148 �3 29 42 27.51
Inferior frontal gyrus 45 44 31 12 33.2947 �44 29 �5 26.21
Insula 13 31 25 �3 37.00SubcorticalCerebellum 18 �74 �35 31.99Autistic > Non-autistic
OccipitalFusiform gyrus 19 �29 �86 �2 25.97 38 �74 �9 35.29
38 �68 �12 31.87Middle occipital gyrus 18 �22 �93 18 26.27 34 �85 10 22.62
19 32 �82 19 19.2619 32 �80 23 19.14
Parietal
Precuneus 7 �28 �67 41 32.61TemporalFusiform gyrus 37 �38 �67 �18 43.26 32 �49 �14 30.20
37 �33 �63 �5 27.91 36 �49 �14 37.1637 �34 �48 �22 24.89
FrontalInferior frontal gyrus 47 �49 22 �10 37.33Middle frontal gyrus 8 55 23 35 29.17
TABLE V. Autistics show a rightward shift of temporal
and parietal lobe visual activity when compared with
non-autistics
Autistics >
Non-autisticsNon-autistics >
Autistics
Left Right Left Right
Temporal lobe 1,384 2,960 1,216 200Occipital lobe 968 904 384 96Parietal lobe 96 296 552 80Frontal lobe 872 488 2,104 2,704Subcortical 448 392 264 617
The differential between-group voxel counts for the left and righthemisphere lobes are shown for the combined «FACES, OBJECTS,and WORDS» domains (pFDR< 0.05).
r Enhanced Visual Functioning in Autism r
r 11 r
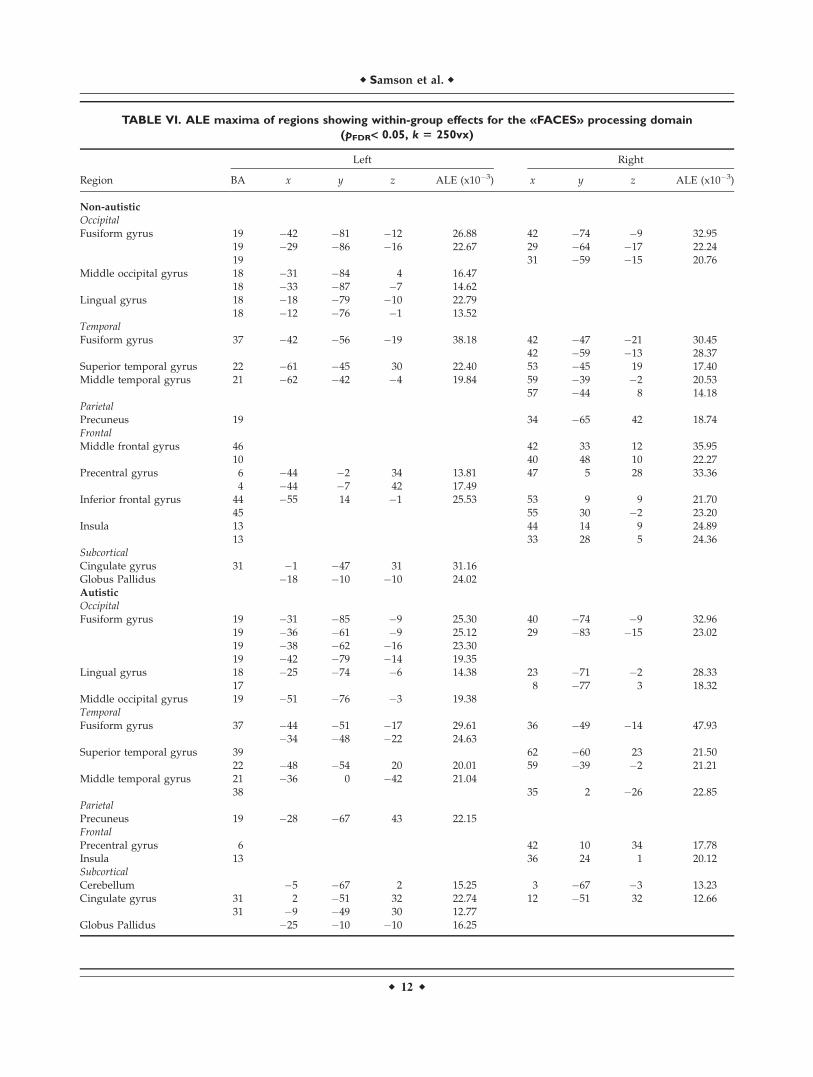
TABLE VI. ALE maxima of regions showing within-group effects for the «FACES» processing domain
(pFDR< 0.05, k 5 250vx)
Region
Left Right
BA x y z ALE (x10�3) x y z ALE (x10�3)
Non-autistic
Occipital
Fusiform gyrus 19 �42 �81 �12 26.88 42 �74 �9 32.9519 �29 �86 �16 22.67 29 �64 �17 22.2419 31 �59 �15 20.76
Middle occipital gyrus 18 �31 �84 4 16.4718 �33 �87 �7 14.62
Lingual gyrus 18 �18 �79 �10 22.7918 �12 �76 �1 13.52
Temporal
Fusiform gyrus 37 �42 �56 �19 38.18 42 �47 �21 30.4542 �59 �13 28.37
Superior temporal gyrus 22 �61 �45 30 22.40 53 �45 19 17.40Middle temporal gyrus 21 �62 �42 �4 19.84 59 �39 �2 20.53
57 �44 8 14.18ParietalPrecuneus 19 34 �65 42 18.74Frontal
Middle frontal gyrus 46 42 33 12 35.9510 40 48 10 22.27
Precentral gyrus 6 �44 �2 34 13.81 47 5 28 33.364 �44 �7 42 17.49
Inferior frontal gyrus 44 �55 14 �1 25.53 53 9 9 21.7045 55 30 �2 23.20
Insula 13 44 14 9 24.8913 33 28 5 24.36
SubcorticalCingulate gyrus 31 �1 �47 31 31.16Globus Pallidus �18 �10 �10 24.02Autistic
Occipital
Fusiform gyrus 19 �31 �85 �9 25.30 40 �74 �9 32.9619 �36 �61 �9 25.12 29 �83 �15 23.0219 �38 �62 �16 23.3019 �42 �79 �14 19.35
Lingual gyrus 18 �25 �74 �6 14.38 23 �71 �2 28.3317 8 �77 3 18.32
Middle occipital gyrus 19 �51 �76 �3 19.38TemporalFusiform gyrus 37 �44 �51 �17 29.61 36 �49 �14 47.93
�34 �48 �22 24.63Superior temporal gyrus 39 62 �60 23 21.50
22 �48 �54 20 20.01 59 �39 �2 21.21Middle temporal gyrus 21 �36 0 �42 21.04
38 35 2 �26 22.85Parietal
Precuneus 19 �28 �67 43 22.15Frontal
Precentral gyrus 6 42 10 34 17.78Insula 13 36 24 1 20.12Subcortical
Cerebellum �5 �67 2 15.25 3 �67 �3 13.23Cingulate gyrus 31 2 �51 32 22.74 12 �51 32 12.66
31 �9 �49 30 12.77Globus Pallidus �25 �10 �10 16.25
r Samson et al. r
r 12 r
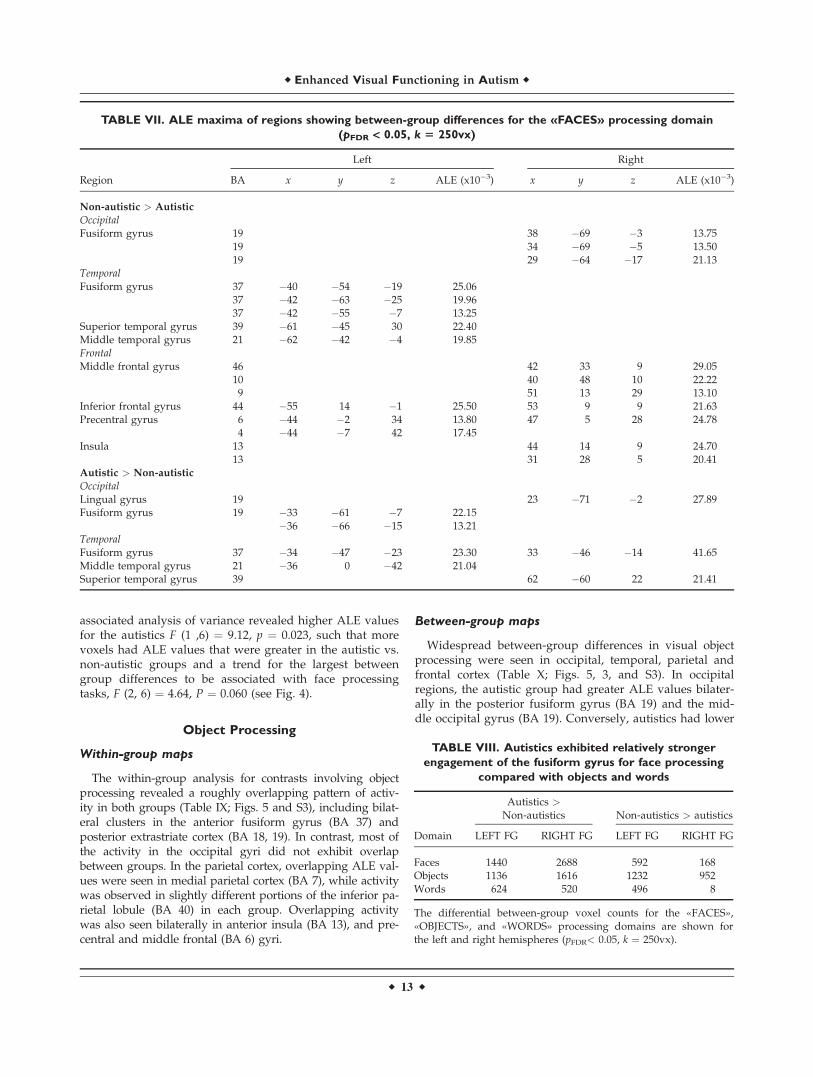
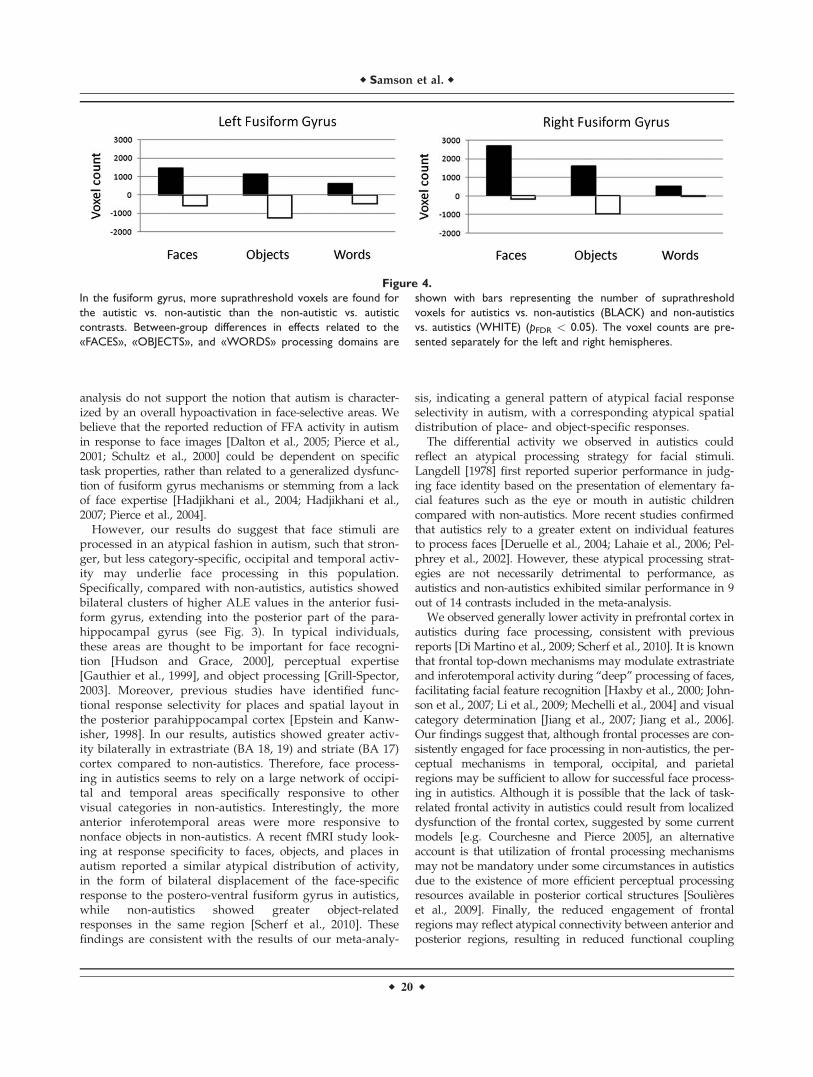
associated analysis of variance revealed higher ALE valuesfor the autistics F (1 ,6) ¼ 9.12, p ¼ 0.023, such that morevoxels had ALE values that were greater in the autistic vs.non-autistic groups and a trend for the largest betweengroup differences to be associated with face processingtasks, F (2, 6) ¼ 4.64, P ¼ 0.060 (see Fig. 4).
Object Processing
Within-group maps
The within-group analysis for contrasts involving objectprocessing revealed a roughly overlapping pattern of activ-ity in both groups (Table IX; Figs. 5 and S3), including bilat-eral clusters in the anterior fusiform gyrus (BA 37) andposterior extrastriate cortex (BA 18, 19). In contrast, most ofthe activity in the occipital gyri did not exhibit overlapbetween groups. In the parietal cortex, overlapping ALE val-ues were seen in medial parietal cortex (BA 7), while activitywas observed in slightly different portions of the inferior pa-rietal lobule (BA 40) in each group. Overlapping activitywas also seen bilaterally in anterior insula (BA 13), and pre-central and middle frontal (BA 6) gyri.
Between-group maps
Widespread between-group differences in visual objectprocessing were seen in occipital, temporal, parietal andfrontal cortex (Table X; Figs. 5, 3, and S3). In occipitalregions, the autistic group had greater ALE values bilater-ally in the posterior fusiform gyrus (BA 19) and the mid-dle occipital gyrus (BA 19). Conversely, autistics had lower
TABLE VII. ALE maxima of regions showing between-group differences for the «FACES» processing domain
(pFDR < 0.05, k 5 250vx)
Region
Left Right
BA x y z ALE (x10�3) x y z ALE (x10�3)
Non-autistic > Autistic
OccipitalFusiform gyrus 19 38 �69 �3 13.75
19 34 �69 �5 13.5019 29 �64 �17 21.13
Temporal
Fusiform gyrus 37 �40 �54 �19 25.0637 �42 �63 �25 19.9637 �42 �55 �7 13.25
Superior temporal gyrus 39 �61 �45 30 22.40Middle temporal gyrus 21 �62 �42 �4 19.85FrontalMiddle frontal gyrus 46 42 33 9 29.05
10 40 48 10 22.229 51 13 29 13.10
Inferior frontal gyrus 44 �55 14 �1 25.50 53 9 9 21.63Precentral gyrus 6 �44 �2 34 13.80 47 5 28 24.78
4 �44 �7 42 17.45Insula 13 44 14 9 24.70
13 31 28 5 20.41Autistic > Non-autistic
OccipitalLingual gyrus 19 23 �71 �2 27.89Fusiform gyrus 19 �33 �61 �7 22.15
�36 �66 �15 13.21Temporal
Fusiform gyrus 37 �34 �47 �23 23.30 33 �46 �14 41.65Middle temporal gyrus 21 �36 0 �42 21.04Superior temporal gyrus 39 62 �60 22 21.41
TABLE VIII. Autistics exhibited relatively stronger
engagement of the fusiform gyrus for face processing
compared with objects and words
Domain
Autistics >
Non-autistics Non-autistics > autistics
LEFT FG RIGHT FG LEFT FG RIGHT FG
Faces 1440 2688 592 168Objects 1136 1616 1232 952Words 624 520 496 8
The differential between-group voxel counts for the «FACES»,«OBJECTS», and «WORDS» processing domains are shown forthe left and right hemispheres (pFDR< 0.05, k ¼ 250vx).
r Enhanced Visual Functioning in Autism r
r 13 r

TABLE IX. ALE maxima of regions showing within-group effects for the «OBJECTS» processing domain
(pFDR < 0.05, k 5 250vx)
Region
Left Right
BA x y z ALE (x10�3) x y z ALE (x10�3)
Non-autistic
Occipital
Inferior occipital gyrus 18 �16 �93 �2 27.07Cuneus 17 �18 �94 9 21.79Middle occipital gyrus 18 �29 �92 3 13.08Fusiform gyrus 19 �27 �68 �13 20.46
19 �29 �87 �9 12.49ParietalPrecuneus 7 �18 �66 52 24.86 28 �63 39 26.33
7 �24 �61 44 15.977 �13 �72 57 13.05
Precuneus 31 �26 �75 30 22.48Superior parietal lobule 7 26 �62 50 26.09Inferior parietal lobule 40 �35 �41 47 21.36
40 �50 �48 44 14.1240 �44 �54 46 13.67
FrontalPrecentral gyrus 6 47 7 30 30.85
60 9 23 14.31Superior frontal gyrus 6 2 13 52 30.01 4 19 45 13.63
6 �24 �2 54 26.45 28 0 53 21.70Middle frontal gyrus 9 42 23 24 19.53Insula 13 �31 25 0 20.93 31 25 �3 36.33SubcorticalParahippocampal gyrus 36 �27 �46 �11 26.33 29 �44 �12 35.78Putamen �25 �1 �2 17.34Brainstem 3 �36 �41 23.45Autistic
OccipitalFusiform gyrus 19 �36 �81 �9 19.43 36 �76 �9 21.79Middle occipital gyrus 19 32 �84 17 18.92
19 38 �81 9 13.3818 �22 �93 16 24.11 32 �87 10 16.5518 �27 �88 �2 15.57 34 �88 1 15.9118 �27 �90 2 15.5518 �31 �87 11 13.23
Inferior occipital gyrus 18 38 �84 �4 15.2118 24 �93 �3 14.87
Cuneus 17 25 �97 0 14.31Lingual gyrus 17 �11 �97 1 20.34Parietal
Superior parietal lobule 7 �22 �64 51 14.52 32 �51 49 23.13Inferior parietal lobule 40 �44 �26 �48 18.64 36 �39 43 19.40
40 36 �33 56 13.6440 56 �26 46 14.65
Precuneus 7 �24 �63 42 15.51 23 �59 55 22.327 �15 �66 51 13.99
31 30 �75 25 12.65FrontalPrecentral gyrus 6 �48 9 31 13.64 53 7 30 25.69
6 �46 3 34 14.256 �55 2 31 13.00
Middle frontal gyrus 6 �24 �2 54 19.13Insula 13 �31 23 3 22.89 38 24 1 16.74SubcorticalCingulate gyrus 24 �3 �6 30 23.85
24 �3 5 31 13.3432 8 25 40 15.49
Parahippocampal gyrus 36 �27 �46 �11 20.42Thalamus �14 �19 9 19.83

ALE values in left lingual gyrus (BA 18) and the right ante-rior fusiform gyrus (BA 37). Additionally, autistics had lowervalues in the left mid-fusiform gyrus (BA 19; þ29, �68, �14),in an area anterior and medial to the area in which autisticshad higher values. Both groups had ALE value maxima inthe medial (precuneus) and lateral parietal cortex. HigherALE values in autistics were more medial than those of non-autistics in right inferior parietal cortex (BA 40) and anteriorto those of controls in right lateral and medial superior parie-tal cortex (BA 7). As for frontal cortex, lower ALE valueswere observed in superior frontal gyrus (BA 6) in the autis-tics. Additionally, the autistic group exhibited lower ALE val-ues in the right anterior insular cortex (BA 13) and higherALE values in the cingulate gyrus (BA 24).
Word Processing
Within-group maps
ALE maps were computed for contrasts involving wordprocessing (Table XI; Fig. 5 and S4). In both groups, activ-ity was observed in striate (BA 17) and extrastriate cortex(BA 18), overlapping mostly in the right hemisphere, whileleft hemisphere activity was slightly more anterior inautistics. In parietal cortex, both groups showed overlap-ping activity in the medial parietal cortex (BA 7), while ac-tivity in left middle temporal gyrus (BA 21) was observedin a more posterior location in autistics. In frontal cortex,both groups had significant ALE values in inferior (left BA45, 47), middle (BA 6, 46), and superior frontal (BA 6, 8, 9)gyri, with overlapping activity in the left inferior andsuperior frontal gyri. We observed group overlap in sub-cortical activity in the thalami, right cingulate gyrus (BA31), and left parahippocampal gyrus (BA 36).
Between-group maps
Between-group ALE maps revealed differences in wordprocessing activity (Table XII; Figs. 3, 5 and S4). First, ALE
values differed between groups in occipitotemporal areas,with lower activity in bilateral striate cortex in autistics,just under the critical threshold on the right (þ16, �95,�7), and higher activity in autistics in extrastriate cortex(BA 18; �14, �87, �5 and þ25, �98, �9). Autistics alsohad higher activity in both the right fusiform gyrus (BA19, 37) and, more ventrally, in the left ventral fusiformgyrus (BA 19). In parietal cortex, the autistics had higherALE values in bilateral medial parietal cortex (BA 7),although the values were subthreshold on the left (�28,�68, þ38; vx ¼ 144). Between-group differences were alsoseen in the middle temporal gyrus, with higher ALE val-ues found posteriorly in autistics and anteriorly in non-autistics on the left.
A more complex pattern of effects was observed in fron-tal and subcortical regions. For example, while autisticsgenerally had more areas exhibiting lower ALE values infrontal cortex compared to non-autistics, the lower ALEvalues were seen primarily in left inferior, superior frontal,and precentral gyri (BA 4, 8, 47) and higher ALE valueswere found bilaterally in left posterior inferior frontalgyrus (BA 47), left superior frontal gyrus (BA 6), as wellas left and right middle frontal gyri (BA 8, 9, 46). At thesubcortical level, the right caudate nucleus, and bilateralthalami (sub-threshold cluster on the right; þ29, �26, �2;vx ¼ 120) exhibited lower ALE values in autistics, whilethe left putamen had higher ALE values in autistics.
DISCUSSION
Summary of Findings
On the basis of the behavioral, cognitive and physiologi-cal phenomena previously summarized in the enhancedperception function model, we predicted that autisticswould exhibit stronger engagement of the visual systemacross a range of tasks. In addition, we were interested inwhether any observed atypical visual activity patterns in
Figure 2.
In both hemispheres, autistics exhibit more activity in temporal
and occipital cortex. Between-group differences in task-related
effects related to the combined «FACES, OBJECTS and WORDS»
processing domains are shown with individual bars representing
the number of suprathreshold voxels for autistics vs. non-autistics
(BLACK) and non-autistics vs. autistics (WHITE) (pFDR < 0.05).
Voxel counts are presented separately for the left and right
temporal, occipital, parietal and frontal lobes.
r Enhanced Visual Functioning in Autism r
r 15 r

autism were specific to particular processing domains. Wecompared the magnitude and spatial distribution of brainactivity associated with visual processing in autistics andnon-autistics using ALE meta-analysis, including datadrawn from 26 neuroimaging studies using visual stimuli.The analysis provided information about between-groupdifferences with respect to location and amplitude of task-related activity. Combining all visual tasks, we observedwidespread effects in both groups in regions spanningtemporal, occipital, parietal, and frontal cortex. However,compared to non-autistics, autistics displayed generallyhigher task-related activity in posterior regions, and lowertask-related activity in frontal cortex. In addition, for eachprocessing domain, we observed spatial overlap in activityin autistics and non-autistics, accompanied by an atypicalfunctional spatial distribution of domain-specific responsesin autism.
Domain-Independent Similarities and Differences
As visual stimuli were used in all studies, large clustersof activity were found in both groups in the cortical areas
involved in the first visual processing stages, namelystriate (BA 17) and extrastriate (BA 18, 19) cortex. Bothgroups had responses in inferotemporal cortex, a regioninvolved in recognition and identification of visually pre-sented animate or inanimate objects [Op de Beeck et al.,2008]. Both groups also displayed posterior parietal cortexactivity mainly in the medial parietal cortex (BA 7), anassociative region involved in visuospatial informationprocessing [Cavanna and Trimble 2006]. In addition, bothgroups exhibited activity in the dorsal (BA 6, 8, 9, 46) andventral (BA 44-47) prefrontal cortex, regions involved inmultiple aspects of sensorimotor and cognitive control[D’Esposito et al., 2000; Duncan and Owen 2000; Petrides1996; Petrides 2005]. The high ALE values seen in bothgroups across a broad network comprising temporal, occi-pital, parietal, and frontal regions were consistent with thewide range of visual processing tasks included in thestudy.
Between-group comparisons using the combined face,object, and word processing tasks revealed an atypical pat-tern of resource allocation in autistics, with relativelyhigher activity in posterior visual processing regions andlower activity in frontal regions, as demonstrated by voxel
TABLE X. ALE maxima of regions showing between-group differences for the «OBJECTS» processing domain
(pFDR < 0.05, k 5 250vx)
Region
Left Right
BA x y z ALE (x10�3) x y z ALE (x10�3)
Non-autistic > Autistic
Occipital
Lingual gyrus 18 �18 �93 �4 25.0718 �18 �94 7 17.91
Temporal
Fusiform gyrus 37 29 �44 �10 24.82Parietal
Precuneus 7 28 �61 39 26.12Superior parietal lobule 7 28 �62 48 20.65Inferior parietal lobule 40 �35 �41 47 20.89
40 �50 �48 �43 14.1040 �43 �54 46 13.67
Frontal
Superior frontal gyrus 6 2 13 52 30.02Insula 13 31 25 �3 33.33SubcorticalPutamen �25 0 0 16.75Autistic > Non-autistic
OccipitalMiddle occipital gyrus 19 �24 �91 16 22.78Fusiform gyrus 19 �36 �79 �10 19.16 36 �76 �9 21.24ParietalSuperior parietal lobule 7 32 �51 49 22.99Inferior parietal lobule 40 34 �39 43 17.32
40 36 �32 47 14.72SubcorticalCingulate gyrus 24 �3 �6 30 23.39
r Samson et al. r
r 16 r
count lobar distributions (see Fig. 2). In inferotemporal,occipital, and inferior parietal regions, more voxelsshowed higher ALE values in autistics than in non-autis-tics in areas subserving integration of local visual features,manipulation of visual features, object recognition andobject identification [Wandell et al., 2007]. Moreover, autis-tics displayed higher activity bilaterally in the precuneus(BA 7), a region subserving visual imagery [Suchan et al.,2002], visual search and detection [Brown et al., 2006; Huf-ner et al., 2008; Patel and Sathian, 2000], and the mainte-nance of visual information in working memory [Owen,2004; Suchan et al., 2006; Yeh et al., 2007].
Conversely, ALE values in more anterior frontal regions(BA 4, 6, 8, 9, 45, and 47) were mostly lower in autistics.These areas include a range of regions with specializationfor movement execution, movement planning, and cogni-tive control. The most posterior frontal region (BA 4) inthe precentral gyrus is involved in fine motor control andsensorimotor transformations [He et al., 1993; Rizzolattiand Luppino 2001]. The posterior part of the dorsolateralprefrontal cortex (DLPFC; BA 6, 8) is responsible forresponse selection, attention shifting between alternativestimuli or responses in visuomotor tasks [Petrides, 1994,2005]. The mid-DLPFC (BA 9) is involved in planning andmonitoring of behavior in accordance with internal goals[Petrides, 1991, 2000]. The adjacent mid-ventrolateral pre-frontal cortex (VLPFC; BA 45, 47) plays an important rolein decision making [Petrides, 2002], response comparison,selection and inhibition based on stored stimulus represen-tations [Badre and Wagner, 2007; Petrides, 2005]. Finally,BA 6 and 9 are believed to be involved in cognitive con-trol, mainly through the activation of task representationsto adjust behavior to changing contexts [Brass et al., 2005].
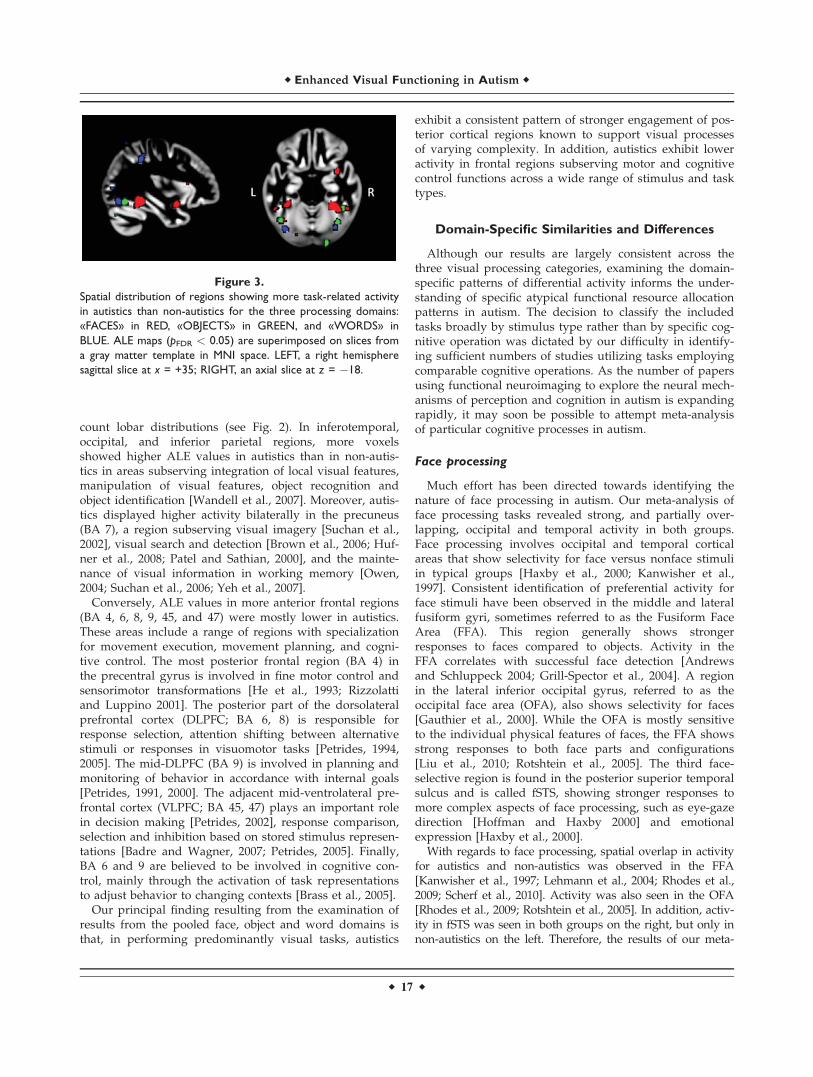
Our principal finding resulting from the examination ofresults from the pooled face, object and word domains isthat, in performing predominantly visual tasks, autistics
exhibit a consistent pattern of stronger engagement of pos-terior cortical regions known to support visual processesof varying complexity. In addition, autistics exhibit loweractivity in frontal regions subserving motor and cognitivecontrol functions across a wide range of stimulus and tasktypes.
Domain-Specific Similarities and Differences
Although our results are largely consistent across thethree visual processing categories, examining the domain-specific patterns of differential activity informs the under-standing of specific atypical functional resource allocationpatterns in autism. The decision to classify the includedtasks broadly by stimulus type rather than by specific cog-nitive operation was dictated by our difficulty in identify-ing sufficient numbers of studies utilizing tasks employingcomparable cognitive operations. As the number of papersusing functional neuroimaging to explore the neural mech-anisms of perception and cognition in autism is expandingrapidly, it may soon be possible to attempt meta-analysisof particular cognitive processes in autism.
Face processing
Much effort has been directed towards identifying thenature of face processing in autism. Our meta-analysis offace processing tasks revealed strong, and partially over-lapping, occipital and temporal activity in both groups.Face processing involves occipital and temporal corticalareas that show selectivity for face versus nonface stimuliin typical groups [Haxby et al., 2000; Kanwisher et al.,1997]. Consistent identification of preferential activity forface stimuli have been observed in the middle and lateralfusiform gyri, sometimes referred to as the Fusiform FaceArea (FFA). This region generally shows strongerresponses to faces compared to objects. Activity in theFFA correlates with successful face detection [Andrewsand Schluppeck 2004; Grill-Spector et al., 2004]. A regionin the lateral inferior occipital gyrus, referred to as theoccipital face area (OFA), also shows selectivity for faces[Gauthier et al., 2000]. While the OFA is mostly sensitiveto the individual physical features of faces, the FFA showsstrong responses to both face parts and configurations[Liu et al., 2010; Rotshtein et al., 2005]. The third face-selective region is found in the posterior superior temporalsulcus and is called fSTS, showing stronger responses tomore complex aspects of face processing, such as eye-gazedirection [Hoffman and Haxby 2000] and emotionalexpression [Haxby et al., 2000].
With regards to face processing, spatial overlap in activityfor autistics and non-autistics was observed in the FFA[Kanwisher et al., 1997; Lehmann et al., 2004; Rhodes et al.,2009; Scherf et al., 2010]. Activity was also seen in the OFA[Rhodes et al., 2009; Rotshtein et al., 2005]. In addition, activ-ity in fSTS was seen in both groups on the right, but only innon-autistics on the left. Therefore, the results of our meta-
Figure 3.
Spatial distribution of regions showing more task-related activity
in autistics than non-autistics for the three processing domains:
«FACES» in RED, «OBJECTS» in GREEN, and «WORDS» in
BLUE. ALE maps (pFDR < 0.05) are superimposed on slices from
a gray matter template in MNI space. LEFT, a right hemisphere
sagittal slice at x = +35; RIGHT, an axial slice at z = �18.
r Enhanced Visual Functioning in Autism r
r 17 r

TABLE XI. ALE maxima of regions showing within-group effects for the «WORDS» processing domain
(pFDR< 0.05, k 5 250vx)
Left Right
Region BA x y z ALE (x10�3) x y z ALE (x10�3)
Non-autistic
OccipitalInferior occipital gyrus 17 �18 �97 �4 20.85 14 �96 �7 30.74Lingual gyrus 18 �10 �96 �11 19.55TemporalMiddle temporal gyrus 21 �51 �35 �5 24.30
21 �55 �33 2 21.1639 56 �66 26 17.94
Parietal
Precuneus 7 2 �59 37 18.08Frontal
Superior frontal gyrus 8 �18 28 47 25.578 �12 55 37 21.178 �7 47 45 16.688 �13 33 53 13.599 �1 60 19 20.538 �1 34 44 18.886 �5 9 57 26.20
Inferior frontal gyrus 45 �49 24 12 20.4847 �47 27 �6 23.5047 �40 29 �5 19.2147 �32 33 �12 13.18
Middle frontal gyrus 46 �46 21 23 13.186 �44 8 49 13.95
Precentral gyrus 4 �55 �3 46 24.876 �50 6 45 14.626 �44 0 50 13.59
SubcorticalParahippocampal gyrus 27 �25 �31 �8 29.49
36 �21 �42 �9 13.71Caudate 21 �24 18 33.27Thalamus �18 �47 5 21.50 27 �27 7 31.97Cingulate 29 �5 �51 10 17.58
30 �3 �62 8 13.10Autistic
OccipitalFusiform gyrus 19 �40 �69 �17 37.16 38 �68 �12 25.65Inferior occipital gyrus 17 23 �98 �9 23.84Lingual gyrus 18 �14 �87 �7 16.75TemporalMiddle temporal gyrus 21 �57 �42 �2 17.79
21 �61 �47 8 13.87Fusiform gyrus 37 46 �49 �14 23.50ParietalPrecuneus 7 �5 �59 37 13.96 4 �57 37 20.54
7 �9 �54 41 13.62 30 �65 42 22.02Frontal
Inferior frontal gyrus 47 �49 22 �10 42.7945 �49 24 5 13.28
Superior frontal gyrus 6 �7 10 60 36.648 �9 50 38 20.25 12 45 49 17.329 1 58 26 18.25
Middle frontal gyrus 46 �44 21 21 26.659 56 23 35 20.678 28 28 44 19.59
r Samson et al. r
r 18 r

TABLE XI. (Continued)
Left Right
Region BA x y z ALE (x10�3) x y z ALE (x10�3)
Subcortical
Putamen �25 6 4 32.21�25 �8 �8 13.34
Thalamus �5 �12 12 15.07 27 �30 0 25.37�7 �16 13 14.99
Parahippocampal gyrus 35 �25 �27 �10 24.76 12 �51 5 13.20Insula 13 �31 24 5 13.82
13 �40 23 3 13.8113 �31 27 0 13.05
Amygdala �23 �10 �12 14.30�29 �8 �14 13.41
Cingulate 30 4 �53 7 15.25
TABLE XII. ALE maxima of regions showing between-group differences for the «WORDS» processing domain
(pFDR < 0.05, k 5 250vx)
Region
Left Right
BA x y z ALE (x10�3) x y z ALE (x10�3)
Non-autistic > Autistic
Occipital
Inferior occipital gyrus 17 �18 �97 �4 20.28Lingual gyrus 18 �10 �96 �11 19.32Temporal
Middle temporal gyrus 21 �51 �36 �7 23.8321 �55 �33 2 20.6639 56 �66 26 17.94
FrontalPrecentral gyrus 4 �55 �3 46 24.85Superior frontal gyrus 8 �18 26 47 22.24
8 �1 34 44 18.88Inferior frontal gyrus 47 �40 31 �5 18.21SubcorticalCaudate 21 �24 18 24.97Thalamus �27 �33 �5 19.14Parahippocampal gyrus 36 �21 �42 �9 13.67
36 �18 �36 �14 13.61Autistic > Non�autistic
Occipital
Fusiform 19 �40 �69 �17 36.82TemporalMiddle temporal gyrus 21 �59 �44 �2 17.03Fusiform gyrus 37 46 �49 �14 23.50Parietal
Precuneus 7 30 �65 42 22.02FrontalInferior frontal gyrus 44 �49 22 �10 36.82Superior frontal gyrus 6 �7 81 55 23.15Middle frontal gyrus 46 �42 29 18 13.09
8 56 23 35 20.669 �51 17 26 19.919 �42 21 21 17.23
SubcorticalPutamen �25 6 4 30.20
r Enhanced Visual Functioning in Autism r
r 19 r
analysis do not support the notion that autism is character-ized by an overall hypoactivation in face-selective areas. Webelieve that the reported reduction of FFA activity in autismin response to face images [Dalton et al., 2005; Pierce et al.,2001; Schultz et al., 2000] could be dependent on specifictask properties, rather than related to a generalized dysfunc-tion of fusiform gyrus mechanisms or stemming from a lackof face expertise [Hadjikhani et al., 2004; Hadjikhani et al.,2007; Pierce et al., 2004].
However, our results do suggest that face stimuli areprocessed in an atypical fashion in autism, such that stron-ger, but less category-specific, occipital and temporal activ-ity may underlie face processing in this population.Specifically, compared with non-autistics, autistics showedbilateral clusters of higher ALE values in the anterior fusi-form gyrus, extending into the posterior part of the para-hippocampal gyrus (see Fig. 3). In typical individuals,these areas are thought to be important for face recogni-tion [Hudson and Grace, 2000], perceptual expertise[Gauthier et al., 1999], and object processing [Grill-Spector,2003]. Moreover, previous studies have identified func-tional response selectivity for places and spatial layout inthe posterior parahippocampal cortex [Epstein and Kanw-isher, 1998]. In our results, autistics showed greater activ-ity bilaterally in extrastriate (BA 18, 19) and striate (BA 17)cortex compared to non-autistics. Therefore, face process-ing in autistics seems to rely on a large network of occipi-tal and temporal areas specifically responsive to othervisual categories in non-autistics. Interestingly, the moreanterior inferotemporal areas were more responsive tononface objects in non-autistics. A recent fMRI study look-ing at response specificity to faces, objects, and places inautism reported a similar atypical distribution of activity,in the form of bilateral displacement of the face-specificresponse to the postero-ventral fusiform gyrus in autistics,while non-autistics showed greater object-relatedresponses in the same region [Scherf et al., 2010]. Thesefindings are consistent with the results of our meta-analy-
sis, indicating a general pattern of atypical facial responseselectivity in autism, with a corresponding atypical spatialdistribution of place- and object-specific responses.
The differential activity we observed in autistics couldreflect an atypical processing strategy for facial stimuli.Langdell [1978] first reported superior performance in judg-ing face identity based on the presentation of elementary fa-cial features such as the eye or mouth in autistic childrencompared with non-autistics. More recent studies confirmedthat autistics rely to a greater extent on individual featuresto process faces [Deruelle et al., 2004; Lahaie et al., 2006; Pel-phrey et al., 2002]. However, these atypical processing strat-egies are not necessarily detrimental to performance, asautistics and non-autistics exhibited similar performance in 9out of 14 contrasts included in the meta-analysis.
We observed generally lower activity in prefrontal cortex inautistics during face processing, consistent with previousreports [Di Martino et al., 2009; Scherf et al., 2010]. It is knownthat frontal top-down mechanisms may modulate extrastriateand inferotemporal activity during ‘‘deep’’ processing of faces,facilitating facial feature recognition [Haxby et al., 2000; John-son et al., 2007; Li et al., 2009; Mechelli et al., 2004] and visualcategory determination [Jiang et al., 2007; Jiang et al., 2006].Our findings suggest that, although frontal processes are con-sistently engaged for face processing in non-autistics, the per-ceptual mechanisms in temporal, occipital, and parietalregions may be sufficient to allow for successful face process-ing in autistics. Although it is possible that the lack of task-related frontal activity in autistics could result from localizeddysfunction of the frontal cortex, suggested by some currentmodels [e.g. Courchesne and Pierce 2005], an alternativeaccount is that utilization of frontal processing mechanismsmay not be mandatory under some circumstances in autisticsdue to the existence of more efficient perceptual processingresources available in posterior cortical structures [Souliereset al., 2009]. Finally, the reduced engagement of frontalregions may reflect atypical connectivity between anterior andposterior regions, resulting in reduced functional coupling
Figure 4.
In the fusiform gyrus, more suprathreshold voxels are found for
the autistic vs. non-autistic than the non-autistic vs. autistic
contrasts. Between-group differences in effects related to the
«FACES», «OBJECTS», and «WORDS» processing domains are
shown with bars representing the number of suprathreshold
voxels for autistics vs. non-autistics (BLACK) and non-autistics
vs. autistics (WHITE) (pFDR < 0.05). The voxel counts are pre-
sented separately for the left and right hemispheres.
r Samson et al. r
r 20 r

and regional interaction during visual processing. As ourresults are consistent with all of these hypothetical mecha-nisms, further studies are warranted to better delineate thephysiological basis of the generalized frontal cortical hypoac-tivity commonly seen in autism.
Object processing
Autistics often exhibit unexpectedly strong and atypicalabilities in visual tasks involving object detection or
manipulation. For object processing, we observed activityin both groups in occipital (BA 17, 18, 19), temporal (BA37), medial and lateral superior parietal (BA 7), inferiorparietal (BA 40), and dorsal and ventral lateral prefrontalcortex (BA 6, 9 46, 47). Object processing is typically asso-ciated with activity in occipital and temporal cortex, withprevious studies identifying responses in lateral occipitalcortex to pictures of common objects [Malach et al., 1995],line drawings of objects [Kanwisher et al., 1996] andshapes [Hayworth and Biederman 2006]. We observedactivity in both groups that was located more medially
Figure 5.
Within- and between-group distribution of task-related activity in
inferior occipital and inferotemporal cortex. A: Regions showing
increases in autistics (RED), non-autistics (GREEN), and their
overlap (YELLOW) for the «OBJECTS» tasks. B: Regions showing
more task-related activity in autistics vs. non-autistics (RED-YEL-
LOW) and less task-related activity in autistics vs. non-autistics
(BLUE-GREEN) for the «OBJECTS» tasks. C: Regions showing
increases in autistics (RED), non-autistics (GREEN), and their spa-
tial overlap (YELLOW) for the «WORDS» tasks. D: Regions
showing more task-related activity in autistics vs. non-autistics
(RED-YELLOW) and less task-related activity in autistics vs. non-
autistics (BLUE-GREEN) for the «WORDS» tasks. ALE maps
(pFDR < 0.05) are superimposed on axial slices from a gray matter
template in MNI space. Anatomical left is image left.
r Enhanced Visual Functioning in Autism r
r 21 r

than previously reported, possibly due to the heterogene-ity of stimuli and tasks combined in the current analysis.While the lateral occipital region plays a specific role inobject recognition [Grill-Spector et al., 2001], object recog-nition as such was not a prominent component of all thetasks included in the meta-analysis. Activity common toboth groups was also observed in the anterior fusiformgyrus, another area involved in object processing [Grill-Spector, 2003] and spatial relations [Epstein and Kanw-isher, 1998]. Overall, both groups showed occipital andtemporal activity in brain regions typically recruited bymaterial-independent visual information processing, suchas integration of local visual features and manipulation ofvisual properties [Wandell et al., 2007].
Both groups also showed responses in prefrontal corti-cal regions, consistent with cognitive control requirementsof the object processing tasks. For instance, lateral pre-frontal cortex activity has been reported in relation to setshifting [Rogers et al., 2000], inhibitory control [Konishiet al., 1999], and category discrimination [Jiang et al.,2007; Jiang et al., 2006], processes common in object proc-essing tasks [Dichter and Belger, 2007; Schmitz et al.,2006; Schmitz et al., 2008; Solomon et al., 2009]. Theobserved prefrontal activity could also be related to plan-ning and categorization [Petrides 2005], processes criticalto tasks such as the Embedded Figure Test [Lee et al.,2007; Manjaly et al., 2007], the Tower of London task[Just et al., 2007], spatial reasoning, and pattern matching[Soulieres et al., 2009].
Both groups showed activity in superior parietal corticalareas involved in visuospatial attention [Corbetta et al.,1993; Nobre et al., 1997] and manipulation of informationin working memory [Cabeza, 2008; Cabeza et al., 2008].Despite the variability of the tasks and stimuli combinedwithin the object category, we observed a pattern concord-ant with the previous literature.
Regarding between-group differences in activity relatedto object processing, autistics had higher ALE values inoccipital (BA 19) and parietal (BA 7, 40) areas and lowervalues in the fusiform gyri (BA 37). The clusters ofbetween-group differential activity were smaller for theobject than the face domains, which may be explained bygreater task and stimulus variability for the object vs.face domain. Greater task variability within each domainmight be expected to lead to a greater degree of spatialvariability and consequently weaker constructive interfer-ence among the local maxima. As with face processing,autistics performed similarly to non-autistics while dis-playing lower ALE values in the superior frontal gyrus(BA 6). Enhanced autistic performance has been reportedin a broad range of visual perceptual tasks based on pat-tern detection, matching, and manipulation of objects,aspects encompassed here in the very general object proc-essing domain. Therefore, we tentatively relate the atypi-cal functional allocation of activity in visual perceptiveregions in autism to enhanced performance in objectprocessing.
Word processing
Some autistics acquire reading skills at an unexpectedlyearly age, a phenomenon known as hyperlexia. It is possi-ble that these atypical reading skills result from differen-tial organization in the visual areas responsible forprocessing letters or words. In our meta-analysis results,group activity distributions related to word processingcorresponded well to the known functional neuroanatomyof reading systems. A first level of word analysis in theoccipito-temporal junction supports word identification; asecond level at the parieto-temporal junction supportsphonological processing; and a third level in the inferiorfrontal cortex supports semantics, phonology, and articula-tion [Shaywitz and Shaywitz, 2008]. Both groups displayedbilateral posterior fusiform and lingual activity, presum-ably associated with word form analysis [Fiez andPetersen, 1998; Price, 2000]. Also consistent with this find-ing are the previous studies that have reported occipito-temporal and lateral occipital sensitivity to letter strings[Puce et al., 1996] and written words [Baker et al., 2007].In addition, both groups displayed activity in regions typi-cally associated with semantic processing [Howard et al.,1992; Martin and Chao, 2001; Petersen et al., 1988; Pol-drack et al., 1999], verbal fluency [Abrahams et al., 2003;Gaillard et al., 2000], and sentence comprehension [Justet al., 1996; Roder et al., 2002], including the left middletemporal gyrus, the left superior temporal gyrus, the leftinferior frontal gyrus and multiple lateral prefrontalregions. The word processing tasks included semantic de-cision [Gaffrey et al., 2007; Harris et al., 2006], sentencejudgment and comprehension [Just et al., 2004; Kennedyand Courchesne, 2008; Mason et al., 2008], word counting[Kennedy et al., 2006], and verbal fluency [Kleinhans et al.,2008a], for which we observed the expected activity in anumber of left hemisphere language regions.
We observed group differences for the word processingtasks, with higher task-related ALE values in autistics inthe fusiform gyrus (mostly on the right; BA 19, 37), medialparietal cortex (BA 7), middle posterior temporal gyrus(BA 21), left inferior frontal gyrus (BA 44), and bilaterallateral prefrontal cortex (BA 6, 8, 9, 46). Many of theseareas are also part of the reading network seen in non-autistics. However, predominantly left lateralization, expectedbased on previous studies of language in typical samples,was not seen here in autism, in line with reports ofreduced leftward hemispheric response lateralization forspeech processing in autism [Boddaert et al., 2003;Boddaert et al., 2004; Lepisto et al., 2005]. Higher activityfor words in the fusiform gyrus and medial parietal cortexsupports the hypothesis that autistics more stronglyengage mental imagery and visualization to process writ-ten sentences [Just et al., 2004] and words [Gaffrey et al.,2007; Toichi and Kamio, 2001]. In addition, we observedlower activity in the autistic group in many readingregions, including occipital (BA 17, 18), left parieto-tempo-ral (BA 21, 39) and left inferior frontal (BA 47) cortex. In
r Samson et al. r
r 22 r
summary, the regional functional allocation of wordrelated activity is clearly atypical in autism, as weobserved more right-lateralized activity in autistics relatedto reading as well as stronger involvement of regions typi-cally involved in broader aspects of perceptual expertise(BA 19, 37).
This atypical activity pattern could explain the emer-gence of hyperlexic abilities in some autistics. Hyperlexiais defined as reading skills exceeding those predicted byan individual’s general intelligence or language compre-hension capacities [Grigorenko et al., 2003]. Hyperlexiaoccurs in about 5–10% of autistic children [Burd et al.,1985]. While it has been suggested that enhanced visualpattern recognition may underlie hyperlexia [Cobrinik,1982], heightened phonological and orthographic abilitiesmay also contribute to precocious reading skills [Goldbergand Rothermel, 1984]. Although hyperlexic children couldengage typical reading strategies to attain superior wordrecognition abilities, word recognition mechanisms couldoperate more autonomously from more abstract wordcomprehension mechanisms in this group [Newman et al.,2007]. The atypical pattern of occipital and temporal wordprocessing activity seen in our meta-analysis might under-lie this autonomy, a phenomenon that we called functionalindependence in a different cognitive context [Souliereset al., 2009].
Alternative Interpretations of the
Between-Group Differences
Could atypical saccades cause the observed atypical
occipital and parietal activity?
Differences in brain activity apparently associated withvisual processing might trivially result from differences ineye movements used to explore the stimuli, rather thanfrom differences in perceptual processing per se. We arguethat this is not the case for the following reasons. First, allstudies included in the meta-analysis that reported eyemovement data found no differences between the autisticand non-autistic groups [Bird et al., 2006; Dapretto et al.,2006; Greimel et al., 2009; Kleinhans et al., 2008b; Souliereset al., 2009], in line with other studies reporting no differ-ences in visual saccade or fixation properties betweenautistics and non-autistics [Dalton et al., 2005; Kemneret al., 2004; Luna et al., 2007; Luna et al., 2002; Takaraeet al., 2004; Takarae et al., 2007]. Second, the spatial pat-tern of activity across tasks for the between-group differ-ences reported here does not overlap with the networkthought to control visual search and saccades. Forinstance, both groups exhibited activity in lateral prefron-tal cortex in the frontal eye fields [FEF; Amiez and Pet-rides 2009; Grosbras et al., 2005]. This area is consistentlyinvolved in controlling saccade and pursuit eye move-ments [Astafiev et al., 2003; Ettinger et al., 2008; Grosbraset al., 2005]. It is also active in tasks requiring changes invisuospatial attention, even in the absence of saccades
[Armstrong et al., 2009]. Nevertheless, no significantbetween-group differences were observed in this region.Similarly, regions previously reported as less active in au-tism in association with visually-guided saccades [Takaraeet al., 2007] do not correspond to the areas of lower activ-ity reported here in autistics across all visual tasks. LowerALE values in non-autistics were observed in the dorsalpart of the medial frontal gyrus, anterior to the supple-mentary eye fields [Grosbras et al., 1999]. However, thisregion is known to be less active in autism well beyondthe context of saccade generation, specifically during exec-utive and working memory tasks [Gilbert et al., 2008; Silket al., 2006]. Therefore, the pattern of between-group dif-ferences reported here is unlikely to be related to oculomo-tor effects.
Are the observed activity patterns explained bydifferences in task complexity?
Another interpretation of the differential engagement ofcortical regions in autistics across a range of visual taskscould be that these differences are driven mainly by tasksincorporating more substantial perceptual complexity.However, the autistic pattern of relative posterior hyperac-tivity was consistently found for a range of tasks involvingvisual information ranging from simple to complex, andcognitive complexity ranging from low to high. Forinstance, our meta-analysis included stimuli varying fromsimple shapes (i.e. letters in Keehn et al., 2008] to morecomplex visual patterns (i.e. facial stimuli in Hall et al.,2003; Raven’s Progressive Matrices in Soulieres et al.,2009]. Tasks of varying complexity were included as well,ranging from passive viewing of faces (e.g. Bird et al.,2006] and stimulus matching (e.g. Bookheimer et al., 2008;Lee et al., 2007] to sentence comprehension (e.g. Masonet al., 2008], mental state inference (e.g. Kana et al., 2009]and abstract reasoning [Soulieres et al., 2009]. In sum,more strongly engaged perceptual processing regionsengaged across a disparate collection of tasks indicates agreater role for perceptual processes in autism for tasksnot necessarily incorporating complex perceptual or cogni-tive components.
Does differential between-group performance explain
the observed activity patterns?
It is possible that performance differences could be re-sponsible for atypical neural activity patterns in autistics.However, autistics and non-autistics exhibited similar per-formance levels in 18 of the 26 included studies, comparedto two studies with enhanced and six studies with dimin-ished performance in autistics. While enhanced autisticperformance was seen in the form of faster responses forsentence comprehension tasks [Just et al., 2004; Knauset al., 2008], diminished performance was mainly observedin the form of reduced accuracy. Even in studies where ac-curacy was significantly reduced, the autistics still
r Enhanced Visual Functioning in Autism r
r 23 r

performed fairly well. While one study reported 93% cor-rect responses in autistics compared with 100% in non-autistics [Bookheimer et al., 2008], another observedreduced but significantly greater than chance (81.9% and73.8%) accuracy for a semantic decision task in autistics[Gaffrey et al., 2007]. Kleinhans et al. [2008a] reported thatautistics generated fewer words than non-autistics in averbal fluency task, while no group differences in errornumber were seen. One study [Hubl et al., 2003] reportedlonger response times for autistics detecting the sex of realand scrambled faces, but the task instructions did not ex-plicitly require participants to respond as quickly as possi-ble. Other studies reported more errors when autisticswere asked to judge emotional states from weak facialexpressions [Greimel et al., 2009] or when they had toovercome an automatic response tendency [Solomon et al.,2009]. Given that atypical visual processing is observed inassociation with mostly typical performance levels in au-tism, we suggest that autistics make more use of percep-tual processes than do non-autistics in executing cognitivetasks involving complex operations.
Is Hemispheric Asymmetry for Visual Processing
Atypical in Autism?
Face processing was associated with generally similarhemispheric effects in autistics and non-autistics, withboth groups showing bilateral activity in the FFA and theOFA. However, while activity increases were seen in pos-terior fSTS in both groups on the right, it was observedonly in non-autistics on the left. For face processing inautistics, some have hypothesized atypical regional alloca-tion of activity, not necessarily reflecting reduced laterali-zation of the face-specific activity compared to non-autistics [Pierce et al., 2001]. In addition, recent studieshave demonstrated displacement of the face-specificresponse in autism to regions typically responsive to non-face visual stimuli in non-autistics in both hemispheres[Humphreys et al., 2008; Scherf et al., 2010]. One othermeta-analysis of functional neuroimaging studies lookingat social vs. non social tasks did not report activity laterali-zation differences between autistics and non-autistics [DiMartino et al., 2009]. For object processing, hemispheric ac-tivity was similarly distributed in both groups. The lateral-ity of word processing is atypical in autism, as evidencedby more symmetric activity in autistics related to reading.Predominantly left lateralization, expected based on previ-ous studies of language in typical samples, does notappear to characterize autism. With respect to languagetasks in general, some studies have suggested that atypicalhemispheric specialization might be related to the commu-nication difficulties observed in autistics. Atypical leftwardlateralization in autism has been most consistentlyobserved at the structural level in frontal language areas[Herbert et al., 2005] and in temporal regions such as pla-num temporale, middle and inferior temporal gyri [Her-
bert et al., 2005; Rojas et al., 2002]. Some functionalimaging studies have reported reduced left frontal activityassociated with language tasks [Gaffrey et al., 2007; Justet al., 2004; Kana et al., 2006] and others have reportedreduced leftward temporal response lateralization for au-ditory language tasks in autism [Boddaert et al., 2003; Bod-daert et al., 2004; Lepisto et al., 2005]. It is possible that thelateralization effects related to language might be task-de-pendent, as the hemispheric differences between autisticsand non-autistics were not the same for two languagetasks examined in a study in which autistics showedreduced leftward asymmetry for one task (fluency) andtypical lateralization for the other (categorization) [Klein-hans et al., 2008a].
In summary, while we observed a trend for decreasedhemispheric asymmetry in autism for word processing,the left/right differences in associated ALE values weremore subtle than the more consistent finding of higherALE values across all three task domains in posterior com-pared to frontal cortical regions.
Are the Results Consistent With the Predictions
of the EPF Model?
Our ALE meta-analysis results both confirm and extendthe original EPF Model, demonstrating that: (1) perceptualprocessing in autistic individuals plays an enhanced roleacross a wide range of visual tasks and (2) that the neuralorganization of perceptual processing is atypically organ-ized, extending to areas involved in the development ofperceptual expertise. The first major finding of this studyconsists of evidence for generally stronger engagement ofvisual processing regions in autism across a range of tasks,consistent with our previous non-quantitative review ofbrain imaging results [Mottron et al., 2006]. In addition,the observed stronger engagement of visual areas emergesdespite multiple sources of noise introduced by variationsin matching strategies, participant age and general intelli-gence, and whether group assignment was defined using aspecific diagnosis of autism versus the broader classifica-tion of autism spectrum condition. Our findings are con-sistent with the hypothesis that autistics rely more heavilyon visual processing mechanisms regardless of the stimu-lus domain, particularly for language functions [Gaffreyet al., 2007; Just et al., 2004; Lambert et al., 2004].Enhanced activity in brain regions related to visual proc-essing may therefore represent a core atypicality in autisticneural organization.
However, while behavioral evidence for visuospatialstrengths in autism is now strong, it is not possible to sim-ply associate higher levels of neural activity with superiorbehavioral performance, a relationship that has beenclearly demonstrated in only a limited number of studies.For instance, we recently reported increased extrastriate(BA 18) combined with reduced prefrontal (BA 9) and pa-rietal (BA 7) activity during performance of a matrix
r Samson et al. r
r 24 r
reasoning task in a group of autistics who had beenmatched with a non-autistic group on both accuracy andresponse time [Soulieres et al., 2009]. In this study, anautistic behavioral advantage, as evidenced by faster per-formance, and enhanced occipital activity both increasedas task complexity increased. The relative independence ofthe observed occipital findings with respect to task per-formance in the present study indicates that higher levelsof neural activity may be associated with more efficienttask performance in only some circumstances.
The second main finding of this meta-analysis is thatatypical regional functional resource allocation, involvingboth primary and associative cortical areas across a rangeof visual processing tasks, engages mechanisms responsi-ble for the development of perceptual expertise in areassuch as the fusiform gyrus. This important finding allowsan extension of the original EPF Model that suggests thatthe overall process of perceptual expertise development,as well as the specific nature of related category-specificresponses, may be atypical in autism. Material-independ-ent variations in the acquisition of autistic perceptualexpertise, their reciprocal interactions with low-level per-ceptual processes, and their involvement in a broad rangeof both social and non-social atypical behaviors character-istic of autism, may all represent promising fields forfuture investigation.
Lastly, considering that atypical spatial allocation ofbrain resources may be an indication of developmentalfunctional plasticity, our results indicate that enhancedcortical plasticity may be beneficial to visual perception inautism, in the light of preliminary findings of greater corti-cal plasticity, including enhanced long-term potentiationof synaptic strength in an animal model of autism [Rinaldiet al., 2008], and more lasting changes in cortical excitabil-ity following in vivo theta burst stimulation in a few autis-tics [Oberman et al., 2010].
ACKNOWLEDGMENTS
The authors thank Michelle Dawson for editing andcommenting on the paper and Marouane Nassim forresearch assistance.
REFERENCES
Abrahams S, Goldstein LH, Simmons A, Brammer MJ, WilliamsSC, Giampietro VP, Andrew CM, Leigh PN (2003): Functionalmagnetic resonance imaging of verbal fluency and confronta-tion naming using compressed image acquisition to permitovert responses. Hum Brain Mapp 20:29–40.
Amiez C, Petrides M (2009): Anatomical organization of the eyefields in the human and non-human primate frontal cortex.Prog Neurobiol 89:220–230.
Andrews TJ, Schluppeck D (2004): Neural responses to Mooneyimages reveal a modular representation of faces in human vis-ual cortex. Neuroimage 21:91–98.
Armstrong KM, Chang MH, Moore T (2009): Selection and main-tenance of spatial information by frontal eye field neurons.J Neurosci 29:15621–15629.
Astafiev SV, Shulman GL, Stanley CM, Snyder AZ, Van EssenDC, Corbetta M (2003): Functional organization of humanintraparietal and frontal cortex for attending, looking, andpointing. J Neurosci 23:4689–4699.
Badre D, Wagner AD (2007): Left ventrolateral prefrontal cortexand the cognitive control of memory. Neuropsychologia45:2883–2901.
Baker CI, Liu J, Wald LL, Kwong KK, Benner T, Kanwisher N(2007): Visual word processing and experiential origins offunctional selectivity in human extrastriate cortex. Proc NatlAcad Sci USA 104:9087–9092.
Baldassi S, Pei F, Megna N, Recupero G, Viespoli M, Igliozzi R,Tancredi R, Muratori F, Cioni G (2009): Search superiority inautism within, but not outside the crowding regime. VisionRes 49:2151–2156.
Belmonte MK, Cook EH, Jr., Anderson GM, Rubenstein JL,Greenough WT, Beckel-Mitchener A, Courchesne E, BoulangerLM, Powell SB, Levitt PR, et al. (2004): Autism as a disorder ofneural information processing: Directions for research and tar-gets for therapy. Mol Psychiatry 9:646–663.
Belmonte MK, Yurgelun-Todd DA (2003): Functional anatomy ofimpaired selective attention and compensatory processing inautism. Brain Res Cogn Brain Res 17:651–664.
Bertone A, Mottron L, Jelenic P, Faubert J (2005): Enhanced anddiminished visuo-spatial information processing in autismdepends on stimulus complexity. Brain 128(Part 10):2430–2441.
Bird G, Catmur C, Silani G, Frith C, Frith U (2006): Attention doesnot modulate neural responses to social stimuli in autism spec-trum disorders. Neuroimage 31:1614–1624.
Boddaert N, Belin P, Chabane N, Poline JB, Barthelemy C, Mou-ren-Simeoni MC, Brunelle F, Samson Y, Zilbovicius M (2003):3erception of complex sounds: abnormal pattern of corticalactivation in autism. Am J Psychiatry 160:2057–2060.
Boddaert N, Chabane N, Belin P, Bourgeois M, Royer V, Barthe-lemy C, Mouren-Simeoni MC, Philippe A, Brunelle F, SamsonY, et al. (2004): Perception of complex sounds in autism:Abnormal auditory cortical processing in children. Am J Psy-chiatry 161:2117–2120.
Bookheimer SY, Wang AT, Scott A, Sigman M, Dapretto M (2008):Frontal contributions to face processing differences in autism:Evidence from fMRI of inverted face processing. J Int Neuro-psychol Soc 14:922–932.
Brass M, Derrfuss J, Forstmann B, von Cramon DY (2005): Therole of the inferior frontal junction area in cognitive control.Trends Cogn Sci 9:314–316.
Brown MR, Goltz HC, Vilis T, Ford KA, Everling S (2006): Inhibi-tion and generation of saccades: Rapid event-related fMRI ofprosaccades, antisaccades, and nogo trials. Neuroimage33:644–659.
Burd L, Kerbeshian J, Fisher W (1985): Inquiry into the incidenceof hyperlexia in a statewide population of children with perva-sive developmental disorder. Psychol Rep 57:236–238.
Cabeza R (2008): Role of parietal regions in episodic memory re-trieval: The dual attentional processes hypothesis. Neuropsy-chologia 46:1813–1827.
Cabeza R, Ciaramelli E, Olson IR, Moscovitch M (2008): The parie-tal cortex and episodic memory: An attentional account. NatRev Neurosci 9:613–625.
r Enhanced Visual Functioning in Autism r
r 25 r

Caron MJ, Mottron L, Berthiaume C, Dawson M (2006): Cognitivemechanisms, specificity and neural underpinnings of visuospa-tial peaks in autism. Brain 129(Part 7):1789–1802.
Castelli F, Frith C, Happe F, Frith U (2002): Autism, Asperger syn-drome and brain mechanisms for the attribution of mentalstates to animated shapes. Brain 125(Part 8):1839–1849.
Cavanna AE, Trimble MR (2006): The precuneus: A review of itsfunctional anatomy and behavioural correlates. Brain 129(Part3):564–583.
Cobrinik L (1982): The performance of hyperlexic children on an‘‘incomplete words’’ task. Neuropsychologia 20:569–577.
Corbetta M, Miezin FM, Shulman GL, Petersen SE (1993): 1 PETstudy of visuospatial attention. J Neurosci 13:1202–1226.
Courchesne E, Pierce K (2005): Why the frontal cortex in autismmight be talking only to itself: Local over-connectivity butlong-distance disconnection. Curr Opin Neurobiol 15:225–230.
D’Esposito M, Postle BR, Rypma B (2000): Prefrontal cortical con-tributions to working memory: Evidence from event-relatedfMRI studies. Exp Brain Res 133:3–11.
Dakin S, Frith U (2005): Vagaries of visual perception in autism.Neuron 48:497–507.
Dalton KM, Nacewicz BM, Johnstone T, Schaefer HS, GernsbacherMA, Goldsmith HH, Alexander AL, Davidson RJ (2005): Gazefixation and the neural circuitry of face processing in autism.Nat Neurosci 8:519–526.
Dapretto M, Davies MS, Pfeifer JH, Scott AA, Sigman M, Book-heimer SY, Iacoboni M (2006): Understanding emotions inothers: Mirror neuron dysfunction in children with autismspectrum disorders. Nat Neurosci 9:28–30.
Deruelle C, Rondan C, Gepner B, Tardif C (2004): Spatial fre-quency and face processing in children with autism andAsperger syndrome. J Autism Dev Disord 34:199–210.
Di Martino A, Ross K, Uddin LQ, Sklar AB, Castellanos FX, Mil-ham MP (2009): Functional brain correlates of social and non-social processes in autism spectrum disorders: An activationlikelihood estimation meta-analysis. Biol Psychiatry 65:63–74.
Dichter GS, Belger A (2007): Social stimuli interfere with cognitivecontrol in autism. Neuroimage 35:1219–1230.
Duncan J, Owen AM (2000): Common regions of the human fron-tal lobe recruited by diverse cognitive demands. Trends Neu-rosci 23:475–483.
Epstein R, Kanwisher N (1998): A cortical representation of thelocal visual environment. Nature 392:598–601.
Ettinger U, Ffytche DH, Kumari V, Kathmann N, Reuter B, ZelayaF, Williams SC (2008): Decomposing the neural correlates ofantisaccade eye movements using event-related FMRI. CerebCortex 18:1148–1159.
Fiez JA, Petersen SE (1998): Neuroimaging studies of word read-ing. Proc Natl Acad Sci USA 95:914–921.
Gaffrey MS, Kleinhans NM, Haist F, Akshoomoff N, Campbell A,Courchesne E, Muller RA (2007): Atypical [corrected] partici-pation of visual cortex during word processing in autism: AnfMRI study of semantic decision. Neuropsychologia 45:1672–1684.
Gaillard WD, Hertz-Pannier L, Mott SH, Barnett AS, LeBihan D,Theodore WH (2000): Functional anatomy of cognitive devel-opment: fMRI of verbal fluency in children and adults. Neurol-ogy 54:180–185.
Gauthier I, Tarr MJ, Anderson AW, Skudlarski P, Gore JC (1999):3ctivation of the middle fusiform ‘face area’ increases with ex-pertise in recognizing novel objects. Nat Neurosci 2:568–573.
Gauthier I, Tarr MJ, Moylan J, Skudlarski P, Gore JC, AndersonAW (2000): The fusiform ‘‘face area’’ is part of a network thatprocesses faces at the individual level. J Cogn Neurosci12:495–504.
Gilbert SJ, Bird G, Brindley R, Frith CD, Burgess PW (2008): Atyp-ical recruitment of medial prefrontal cortex in autism spectrumdisorders: An fMRI study of two executive function tasks.Neuropsychologia 46:2281–2291.
Goldberg TE, Rothermel RD, Jr. 1984. Hyperlexic children reading.Brain 107 (Part 3):759–785.
Greimel E, Schulte-Ruther M, Kircher T, Kamp-Becker I,Remschmidt H, Fink GR, Herpertz-Dahlmann B, Konrad K(2009): Neural mechanisms of empathy in adolescents with au-tism spectrum disorder and their fathers. Neuroimage 49:1055–1065.
Grigorenko EL, Klin A, Volkmar F (2003): Annotation: Hyperlexia:disability or superability? J Child Psychol Psychiatry 44:1079–1091.
Grill-Spector K (2003): The neural basis of object perception. CurrOpin Neurobiol 13:159–166.
Grill-Spector K, Knouf N, Kanwisher N (2004): The fusiform facearea subserves face perception, not generic within-categoryidentification. Nat Neurosci 7:555–562.
Grill-Spector K, Kourtzi Z, Kanwisher N (2001): The lateral occipi-tal complex and its role in object recognition. Vision Res41(10–11):1409–1422.
Grosbras MH, Laird AR, Paus T (2005): Cortical regions involvedin eye movements, shifts of attention, and gaze perception.Hum Brain Mapp 25:140–154.
Grosbras MH, Lobel E, Van de Moortele PF, LeBihan D, BerthozA (1999): An anatomical landmark for the supplementary eyefields in human revealed with functional magnetic resonanceimaging. Cereb Cortex 9:705–711.
Hadjikhani N, Joseph RM, Snyder J, Chabris CF, Clark J, Steele S,McGrath L, Vangel M, Aharon I, Feczko E, et al. (2004): Acti-vation of the fusiform gyrus when individuals with autismspectrum disorder view faces. Neuroimage 22:1141–1150.
Hadjikhani N, Joseph RM, Snyder J, Tager-Flusberg H (2007):Abnormal activation of the social brain during face perceptionin autism. Hum Brain Mapp 28:441–449.
Hall GB, Szechtman H, Nahmias C (2003): Enhanced salience andemotion recognition in Autism: A PET study. Am J Psychiatry160:1439–1441.
Harris GJ, Chabris CF, Clark J, Urban T, Aharon I, Steele S,McGrath L, Condouris K, Tager-Flusberg H (2006): Brain acti-vation during semantic processing in autism spectrum disor-ders via functional magnetic resonance imaging. Brain Cogn61:54–68.
Haxby JV, Hoffman EA, Gobbini MI (2000): The distributedhuman neural system for face perception. Trends Cogn Sci4:223–233.
Hayworth KJ, Biederman I (2006): Neural evidence for intermedi-ate representations in object recognition. Vision Res 46:4024–4031.
Hazlett EA, Buchsbaum MS, Hsieh P, Haznedar MM, Platholi J,LiCalzi EM, Cartwright C, Hollander E (2004): Regional glu-cose metabolism within cortical Brodmann areas in healthyindividuals and autistic patients. Neuropsychobiology 49:115–125.
He SQ, Dum RP, Strick PL (1993): Topographic organization ofcorticospinal projections from the frontal lobe: Motor areas onthe lateral surface of the hemisphere. J Neurosci 13:952–980.
r Samson et al. r
r 26 r
Herbert MR, Ziegler DA, Deutsch CK, O’Brien LM, Kennedy DN,Filipek PA, Bakardjiev AI, Hodgson J, Takeoka M, Makris N,et al. (2005): Brain asymmetries in autism and developmentallanguage disorder: A nested whole-brain analysis. Brain128(Part 1):213–226.
Hoffman EA, Haxby JV (2000): Distinct representations of eyegaze and identity in the distributed human neural system forface perception. Nat Neurosci 3:80–84.
Howard D, Patterson K, Wise R, Brown WD, Friston K, Weiller C,Frackowiak R (1992): The cortical localization of the lexicons.Positron emission tomography evidence. Brain 115 (Part6):1769–1782.
Hubl D, Bolte S, Feineis-Matthews S, Lanfermann H, FederspielA, Strik W, Poustka F, Dierks T (2003): Functional imbalanceof visual pathways indicates alternative face processing strat-egies in autism. Neurology 61:1232–1237.
Hudson AJ, Grace GM (2000): Misidentification syndromes relatedto face specific area in the fusiform gyrus. J Neurol NeurosurgPsychiatry 69:645–648.
Hufner K, Stephan T, Glasauer S, Kalla R, Riedel E, DeutschlanderA, Dera T, Wiesmann M, Strupp M, Brandt T (2008): Differen-ces in saccade-evoked brain activation patterns with eyes openor eyes closed in complete darkness. Exp Brain Res 186:419–430.
Humphreys K, Hasson U, Avidan G, Minshew N, Behrmann M(2008): Cortical patterns of category-selective activation forfaces, places and objects in adults with autism. Autism Res1:52–63.
Jemel B, Mimeault D, Saint-Amour D, Hosein A, Mottron L(2010): 3EP contrast sensitivity responses reveal reduced func-tional segregation of mid and high filters of visual channels inAutism. J Vis 10:13.
Jiang X, Bradley E, Rini RA, Zeffiro T, Vanmeter J, Riesenhuber M(2007): Categorization training results in shape- and category-selective human neural plasticity. Neuron 53:891–903.
Jiang X, Rosen E, Zeffiro T, Vanmeter J, Blanz V, Riesenhuber M(2006): Evaluation of a shape-based model of human face dis-crimination using FMRI and behavioral techniques. Neuron50:159–172.
Johnson MR, Mitchell KJ, Raye CL, D’Esposito M, Johnson MK(2007): A brief thought can modulate activity in extrastriatevisual areas: Top-down effects of refreshing just-seen visualstimuli. Neuroimage 37:290–299.
Jolliffe T, Baron-Cohen S (1997): Are people with autism andAsperger syndrome faster than normal on the Embedded Fig-ures Test? J Child Psychol Psychiatry 38:527–534.
Joseph RM, Keehn B, Connolly C, Wolfe JM, Horowitz TS (2009):Why is visual search superior in autism spectrum disorder?Dev Sci 12:1083–1096.
Just MA, Carpenter PA, Keller TA, Eddy WF, Thulborn KR(1996): Brain activation modulated by sentence comprehension.Science 274:114–116.
Just MA, Cherkassky VL, Keller TA, Kana RK, Minshew NJ(2007): Functional and anatomical cortical underconnectivity inautism: Evidence from an FMRI study of an executive functiontask and corpus callosum morphometry. Cereb Cortex 17:951–961.
Just MA, Cherkassky VL, Keller TA, Minshew NJ (2004): Corticalactivation and synchronization during sentence comprehensionin high-functioning autism: Evidence of underconnectivity.Brain 127(Part 8):1811–1821.
Kana RK, Keller TA, Cherkassky VL, Minshew NJ, Just MA(2006): Sentence comprehension in autism: Thinking in pictureswith decreased functional connectivity. Brain 129(Part 9):2484–2493.
Kana RK, Keller TA, Cherkassky VL, Minshew NJ, Just MA(2009): Atypical frontal-posterior synchronization of Theory ofMind regions in autism during mental state attribution. SocNeurosci 4:135–152.
Kanwisher N, Chun MM, McDermott J, Ledden PJ (1996): Func-tional imaging of human visual recognition. Brain Res CognBrain Res 5(1–2):55–67.
Kanwisher N, McDermott J, Chun MM (1997): The fusiform facearea: A module in human extrastriate cortex specialized forface perception. J Neurosci 17:4302–4311.
Keehn B, Brenner L, Palmer E, Lincoln AJ, Muller RA (2008):Functional brain organization for visual search in ASD. J IntNeuropsychol Soc 14:990–1003.
Keita L, Mottron L, Bertone A (2010): Far visual acuity is unre-markable in autism: Do we need to focus on crowding? Au-tism Res 3;333–341.
Kemner C, van der Geest JN, Verbaten MN, van Engeland H(2004): In search of neurophysiological markers of pervasivedevelopmental disorders: Smooth pursuit eye movements?J Neural Transm 111:1617–1626.
Kemner C, van Ewijk L, van Engeland H, Hooge I (2008): Briefreport: Eye movements during visual search tasks indicateenhanced stimulus discriminability in subjects with PDD.J Autism Dev Disord 38:553–557.
Kennedy DP, Courchesne E (2008): Functional abnormalities ofthe default network during self- and other-reflection in autism.Soc Cogn Affect Neurosci 3:177–190.
Kennedy DP, Redcay E, Courchesne E (2006): Failing to deacti-vate: Resting functional abnormalities in autism. Proc NatlAcad Sci USA 103:8275–8280.
Kleinhans NM, Muller RA, Cohen DN, Courchesne E (2008a)Atypical functional lateralization of language in autism spec-trum disorders. Brain Res 1221:115–125.
Kleinhans NM, Richards T, Sterling L, Stegbauer KC, Mahurin R,Johnson LC, Greenson J, Dawson G, Aylward E (2008b):Abnormal functional connectivity in autism spectrum disor-ders during face processing. Brain 131(Part 4):1000–1012.
Knaus TA, Silver AM, Lindgren KA, Hadjikhani N, Tager-Flus-berg H (2008): fMRI activation during a language task in ado-lescents with ASD. J Int Neuropsychol Soc 14:967–979.
Konishi S, Nakajima K, Uchida I, Kikyo H, Kameyama M, Miya-shita Y (1999): Common inhibitory mechanism in human infe-rior prefrontal cortex revealed by event-related functional MRI.Brain 122 (Part 5):981–991.
Koshino H, Carpenter PA, Minshew NJ, Cherkassky VL, KellerTA, Just MA (2005): Functional connectivity in an fMRI work-ing memory task in high-functioning autism. Neuroimage24:810–821.
Lahaie A, Mottron L, Arguin M, Berthiaume C, Jemel B, SaumierD (2006): Face perception in high-functioning autistic adults:Evidence for superior processing of face parts, not for a config-ural face-processing deficit. Neuropsychology 20:30–41.
Laird AR, Fox PM, Price CJ, Glahn DC, Uecker AM, Lancaster JL,Turkeltaub PE, Kochunov P, Fox PT (2005): ALE meta-analysis:Controlling the false discovery rate and performing statisticalcontrasts. Hum Brain Mapp 25:155–164.
Lancaster JL, Tordesillas-Gutierrez D, Martinez M, Salinas F,Evans A, Zilles K, Mazziotta JC, Fox PT (2007): Bias between
r Enhanced Visual Functioning in Autism r
r 27 r

MNI and Talairach coordinates analyzed using the ICBM-152brain template. Hum Brain Mapp 28:1194–1205.
Langdell T (1978): Recognition of faces: An approach to the studyof autism. J Child Psychol Psychiatry 19:255–268.
Lee PS, Foss-Feig J, Henderson JG, Kenworthy LE, Gilotty L, Gail-lard WD, Vaidya CJ (2007): Atypical neural substrates of Em-bedded Figures Task performance in children with AutismSpectrum Disorder. Neuroimage 38:184–193.
Lehmann C, Mueller T, Federspiel A, Hubl D, Schroth G, HuberO, Strik W, Dierks T (2004): Dissociation between overt andunconscious face processing in fusiform face area. Neuroimage21:75–83.
Lepisto T, Kujala T, Vanhala R, Alku P, Huotilainen M, NaatanenR (2005): The discrimination of and orienting to speech andnon-speech sounds in children with autism. Brain Res 1066(1–2):147–157.
Li J, Liu J, Liang J, Zhang H, Zhao J, Huber DE, Rieth CA, Lee K,Tian J, Shi G (2009): A distributed neural system for top-downface processing. Neurosci Lett 451:6–10.
Liu J, Harris A, Kanwisher N (2010): Perception of face parts andface configurations: An FMRI study. J Cogn Neurosci 22:203–211.
Luna B, Doll SK, Hegedus SJ, Minshew NJ, Sweeney JA (2007):Saturation of executive function in autism. Biol Psychiatry61:474–481.
Luna B, Minshew NJ, Garver KE, Lazar NA, Thulborn KR, EddyWF, Sweeney JA (2002): Neocortical system abnormalities inautism: An fMRI study of spatial working memory. Neurology59:834–840.
Malach R, Reppas JB, Benson RR, Kwong KK, Jiang H, KennedyWA, Ledden PJ, Brady TJ, Rosen BR, Tootell RB (1995): Object-related activity revealed by functional magnetic resonanceimaging in human occipital cortex. Proc Natl Acad Sci USA92:8135–8139.
Manjaly ZM, Bruning N, Neufang S, Stephan KE, Brieber S, Mar-shall JC, Kamp-Becker I, Remschmidt H, Herpertz-DahlmannB, Konrad K, et al. (2007): Neurophysiological correlates of rel-atively enhanced local visual search in autistic adolescents.Neuroimage 35:283–291.
Martin A, Chao LL (2001): Semantic memory and the brain: Struc-ture and processes. Curr Opin Neurobiol 11:194–201.
Mason RA, Williams DL, Kana RK, Minshew N, Just MA (2008):Theory of Mind disruption and recruitment of the right hemi-sphere during narrative comprehension in autism. Neuropsy-chologia 46:269–280.
Mechelli A, Price CJ, Friston KJ, Ishai A (2004): There bottom-upmeets top-down: Neuronal interactions during perception andimagery. Cereb Cortex 14:1256–1265.
Milne E, Griffiths H, Buckley D, Scope A (2009): Vision in chil-dren and adolescents with autistic spectrum disorder: Evi-dence for reduced convergence. J Autism Dev Disord 39:965–975.
Mottron L, Dawson M, Soulieres I, Hubert B, Burack J (2006):3nhanced perceptual functioning in autism: An update, andeight principles of autistic perception. J Autism Dev Disord36:27–43.
Muller RA, Kleinhans N, Kemmotsu N, Pierce K, Courchesne E(2003): Abnormal variability and distribution of functionalmaps in autism: An FMRI study of visuomotor learning. Am JPsychiatry 160:1847–1862.
Newman TM, Macomber D, Naples AJ, Babitz T, Volkmar F, Gri-gorenko EL (2007): Hyperlexia in children with autism spec-trum disorders. J Autism Dev Disord 37:760–774.
Nobre AC, Sebestyen GN, Gitelman DR, Mesulam MM, Fracko-wiak RS, Frith CD (1997): Functional localization of the systemfor visuospatial attention using positron emission tomography.Brain 120 (Part 3):515–533.
O’Riordan MA (2004): Superior visual search in adults with au-tism. Autism 8:229–248.
O’Riordan MA, Plaisted KC, Driver J, Baron-Cohen S (2001): Supe-rior visual search in autism. J Exp Psychol Hum Percept Per-form 27:719–730.
Oberman L, Ifert-Miller F, Najib UU, Bashir SS, Woollacott I, Gon-zalez-Heydrich J, Picker J, Rotenberg A, Pascual-Leone A(2010): Transcranial magnetic stimulation provides means toassess cortical plasticity and excitability in humans with fragileX syndrome and autism spectrum disorder. Frontiers SynapticNeurosci 2:1–8.
Op de Beeck HP, Dicarlo JJ, Goense JB, Grill-Spector K, Papanas-tassiou A, Tanifuji M, Tsao DY (2008): Line-scale spatial orga-nization of face and object selectivity in the temporal lobe: Dofunctional magnetic resonance imaging, optical imaging, andelectrophysiology agree? J Neurosci 28:11796–11801.
Owen AM (2004): Working memory: Imaging the magic numberfour. Curr Biol 14:R573–R574.
Patel GA, Sathian K (2000): Visual search: Bottom-up or top-down? Front Biosci 5:D169–D193.
Pei F, Baldassi S, Procida G, Igliozzi R, Tancredi R, Muratori F,Cioni G (2009): Neural correlates of texture and contour inte-gration in children with autism spectrum disorders. Vision Res49:2140–2150.
Pelphrey KA, Sasson NJ, Reznick JS, Paul G, Goldman BD, PivenJ (2002): Visual scanning of faces in autism. J Autism Dev Dis-ord 32:249–261.
Petersen SE, Fox PT, Posner MI, Mintun M, Raichle ME (1988):Positron emission tomographic studies of the cortical anatomyof single-word processing. Nature 331:585–589.
Petrides M (1991): Monitoring of selections of visual stimuli andthe primate frontal cortex. Proc Biol Sci 246:293–298.
Petrides M (1994): Frontal lobes and behaviour. Curr Opin Neuro-biol 4:207–211.
Petrides M (1996): Specialized systems for the processing of mne-monic information within the primate frontal cortex. PhilosTrans R Soc Lond B Biol Sci 351:1455–1461; discussion 1461–1462.
Petrides M (2000): Dissociable roles of mid-dorsolateral prefrontaland anterior inferotemporal cortex in visual working memory.J Neurosci 20:7496–7503.
Petrides M (2002): The mid-ventrolateral prefrontal cortex andactive mnemonic retrieval. Neurobiol Learn Mem 78:528–538.
Petrides M (2005): Lateral prefrontal cortex: Architectonic andfunctional organization. Philos Trans R Soc Lond B Biol Sci360:781–795.
Pierce K, Haist F, Sedaghat F, Courchesne E (2004): The brainresponse to personally familiar faces in autism: Findings offusiform activity and beyond. Brain 127(Part 12):2703–2716.
Pierce K, Muller RA, Ambrose J, Allen G, Courchesne E (2001):Face processing occurs outside the fusiform ‘face area’ in au-tism: Evidence from functional MRI. Brain 124(Part 10):2059–2073.
Plaisted K, O’Riordan M, Baron-Cohen S (1998): Enhanced dis-crimination of novel, highly similar stimuli by adults with au-tism during a perceptual learning task. J Child PsycholPsychiatry 39:765–775.
r Samson et al. r
r 28 r

Poldrack RA, Wagner AD, Prull MW, Desmond JE, Glover GH,Gabrieli JD (1999): Functional specialization for semantic andphonological processing in the left inferior prefrontal cortex.Neuroimage 10:15–35.
Price CJ (2000): The anatomy of language: Contributions fromfunctional neuroimaging. J Anat 197 (Part 3):335–359.
Puce A, Allison T, Asgari M, Gore JC, McCarthy G (1996): Differ-ential sensitivity of human visual cortex to faces, letterstrings,and textures: A functional magnetic resonance imaging study.J Neurosci 16:5205–5215.
Rhodes G, Michie PT, Hughes ME, Byatt G (2009): The fusiformface area and occipital face area show sensitivity to spatialrelations in faces. Eur J Neurosci 30:721–733.
Rinaldi T, Silberberg G, Markram H (2008): Hyperconnectivity oflocal neocortical microcircuitry induced by prenatal exposureto valproic acid. Cereb Cortex 18:763–770.
Ring HA, Baron-Cohen S, Wheelwright S, Williams SC, BrammerM, Andrew C, Bullmore ET (1999): Cerebral correlates of pre-served cognitive skills in autism: A functional MRI study ofembedded figures task performance. Brain 122 (Part 7):1305–1315.
Rizzolatti G, Luppino G (2001): The cortical motor system. Neuron31:889–901.
Roder B, Stock O, Neville H, Bien S, Rosler F (2002): Brain activa-tion modulated by the comprehension of normal and pseudo-word sentences of different processing demands: A functionalmagnetic resonance imaging study. Neuroimage 15:1003–1014.
Rogers RD, Andrews TC, Grasby PM, Brooks DJ, Robbins TW(2000): Contrasting cortical and subcortical activations pro-duced by attentional-set shifting and reversal learning inhumans. J Cogn Neurosci 12:142–162.
Rojas DC, Bawn SD, Benkers TL, Reite ML, Rogers SJ (2002):Smaller left hemisphere planum temporale in adults withautistic disorder. Neurosci Lett 328:237–240.
Rotshtein P, Henson RN, Treves A, Driver J, Dolan RJ (2005):Morphing Marilyn into Maggie dissociates physical and iden-tity face representations in the brain. Nat Neurosci 8:107–113.
Scherf SK, Luna B, Minshew N, Behrmann M (2010): Location,location, location: Alterations in the functional topography offace- but not object- or place-related cortex in adolescent withautism. Frontiers Hum Neurosci 4:1–16.
Schmitz N, Rubia K, Daly E, Smith A, Williams S, Murphy DG(2006): Neural correlates of executive function in autistic spec-trum disorders. Biol Psychiatry 59:7–16.
Schmitz N, Rubia K, van Amelsvoort T, Daly E, Smith A, MurphyDG (2008): Neural correlates of reward in autism. Br J Psychia-try 192:19–24.
Schultz RT, Gauthier I, Klin A, Fulbright RK, Anderson AW,Volkmar F, Skudlarski P, Lacadie C, Cohen DJ, Gore JC (2000):Abnormal ventral temporal cortical activity during face dis-crimination among individuals with autism and Asperger syn-drome. Arch Gen Psychiatry 57:331–340.
Shah A, Frith U (1993): Why do autistic individuals show superiorperformance on the block design task? J Child Psychol Psychi-atry 34:1351–1364.
Shaywitz SE, Shaywitz BA (2008): Paying attention to reading:The neurobiology of reading and dyslexia. Dev Psychopathol20:1329–1349.
Silani G, Bird G, Brindley R, Singer T, Frith C, Frith U (2008): Lev-els of emotional awareness and autism: An fMRI study. SocNeurosci 3:97–112.
Silk TJ, Rinehart N, Bradshaw JL, Tonge B, Egan G, O’Boyle MW,Cunnington R (2006): Visuospatial processing and the functionof prefrontal-parietal networks in autism spectrum disorders:A functional MRI study. Am J Psychiatry 163:1440–1443.
Solomon M, Ozonoff SJ, Ursu S, Ravizza S, Cummings N, Ly S,Carter CS (2009): The neural substrates of cognitive controldeficits in autism spectrum disorders. Neuropsychologia47:2515–2526.
Soulieres I, Dawson M, Samson F, Barbeau EB, Sahyoun CP,Strangman GE, Zeffiro TA, Mottron L (2009): Enhanced visualprocessing contributes to matrix reasoning in autism. HumBrain Mapp 30:4082–4107.
Suchan B, Botko R, Gizewski E, Forsting M, Daum I (2006): Neu-ral substrates of manipulation in visuospatial working mem-ory. Neuroscience 139:351–357.
Suchan B, Yaguez L, Wunderlich G, Canavan AG, Herzog H, Tell-mann L, Homberg V, Seitz RJ (2002): Neural correlates ofvisuospatial imagery. Behav Brain Res 131(1–2):163–168.
Takarae Y, Minshew NJ, Luna B, Krisky CM, Sweeney JA (2004):Pursuit eye movement deficits in autism. Brain 127(Part12):2584–2594.
Takarae Y, Minshew NJ, Luna B, Sweeney JA (2007): Atypicalinvolvement of frontostriatal systems during sensorimotor con-trol in autism. Psychiatry Res 156:117–1127.
Toichi M, Kamio Y (2001): Verbal association for simple commonwords in high-functioning autism. J Autism Dev Disord31:483–490.
Turkeltaub PE, Eden GF, Jones KM, Zeffiro TA (2002): Meta-anal-ysis of the functional neuroanatomy of single-word reading:Method and validation. Neuroimage 16(Part 1):765–780.
Vandenbroucke MW, Scholte HS, van Engeland H, Lamme VA,Kemner C (2008): A neural substrate for atypical low-level vis-ual processing in autism spectrum disorder. Brain 131(Part4):1013–1024.
Wager TD, Lindquist MA, Nichols TE, Kober H, Van SnellenbergJX (2009): Evaluating the consistency and specificity of neuro-imaging data using meta-analysis. Neuroimage 45(1 Suppl):S210–S221.
Wandell BA, Dumoulin SO, Brewer AA (2007): Visual field mapsin human cortex. Neuron 56:366–383.
Wang L, Mottron L, Peng D, Berthiaume C, Dawson M (2007):Local bias and local-to-global interference without global defi-cit: A robust finding in autism under various conditions ofattention, exposure time, and visual angle. Cogn Neuropsychol24:550–574.
Yeh YY, Kuo BC, Liu HL (2007): The neural correlates of attentionorienting in visuospatial working memory for detecting featureand conjunction changes. Brain Res 1130:146–157.
r Enhanced Visual Functioning in Autism r
r 29 r