enhancement of service quality in the intercity bus ...alternation.ukzn.ac.za/files/docs/18.3 sped...
TRANSCRIPT

Alternation Special Edition 4 (2011) 181 – 202 ISSN 1023-1757
181
Enhancement of Service Quality in the Intercity Bus Transport Industry Jeevarathnam P. Govender Qi Pan Abstract The South African intercity bus transport system plays a pivotal role in the movement of commuters across the country, including contributing to the reduction of traffic congestion. The intercity bus system appears to provide safe, comfortable and cost-effective transportation compared to some of the alternative means. However, there is potential to better serve the needs of its consumers. To this end, paying attention to service quality could prove useful in making this mode of travel the preferred choice to local as well as international travellers. This paper therefore aims to evaluate service quality in the intercity bus transport system and seeks to measure levels of service quality, determine the relationships among the dimensions of service quality and examine the relationship between selected biographical variables and expectations and perceptions of service quality. A literature survey was undertaken in order to determine the theoretical underpinnings of service quality. The empirical study was conducted using the SERVQUAL model. Service quality was measured on the basis of the 25 items that constitute the five dimensions of service quality. The study was conducted using purposive, convenience, and quota sampling among 400 intercity transport bus passengers, including international travellers. The results indicate gaps in four out of the five dimensions of service quality. Recommendations for improvement in service quality have been made. Keywords: Intercity bus transport industry, service quality, service quality gaps, dimensions of service quality, expectations of service quality, perceptions of service quality.
Jeevarathnam P. Govender & Qi Pan
182
Introduction The South African intercity bus transport industry plays a prominent role in the transportation sector, more specifically, in the passenger (commuter) segment. The industry, as part of the public transport network, contributes to the enhancement of social mobility in South Africa. At the same time, this industry helps solve traffic problems created by the excessive use of private motor vehicles in recent years, e.g. pollution and traffic jams (Ongkittikul & Geerlings 2006: 285). The most common difficulties for tourists and foreigners in unfamiliar areas are that public transport is still not accessible and safety is still of great concern. Moreover, South Africa is still considered as a country with an inadequate transport infrastructure (No financial worries about 2010, 2006). The major principles underlying public transport focus on the how to deliver effective public service. These include:
• The promotion of the use of public transport over private transport, • Ensuring that public transport services address user needs, • Promoting and implementing a system of regulated competition, and • Promoting safe and secure, reliable, and sustainable public transport
(National Department of Transport 2006). South Africa has the longest road network in Africa, consisting of around 754 600 km of roads and streets. The national road network covers about 9 600 km. Toll roads, serviced by 32 mainline toll plazas, cover about 2 400 km (South Africa Yearbook 2005/6, 611). In many countries around the world, public transport is considered a favoured alternative to private transport. Buses play a key role in the public transport system (National Department of Transport Strategic Plan 2006-2009, 2006). Intercity bus transport, as a means of bus passenger transport, is responsible for linking the major centres in South Africa, and also serves commuters in rural areas by a network of public and privately operated passenger bus services. The latest available data indicates that between 2002 and 2005, the number of commuters travelling by bus increased by 9.5%, while for the same period, people travelling by train decreased by 3% (Transport crisis could hinder 6% economic growth 2006). Intercity bus transportation appears to provide reliable, safe, comfortable and better-integrated transport, hence proving to be more cost effective, compared to using a private car. However, in some

… Service Quality in the Intercity Bus Transport Industry
183
instances, the price of travel by air is similar to that of intercity bus travel (Getting you from A2B in South Africa 2006). It would therefore mean that the intercity bus transport industry has great potential to better serve the needs of its consumers. To this end, paying attention to service quality could prove very useful in making this mode of travel the preferred choice to both local as well as international travellers. Statement of the Problem The National Department of Transport (2006) has acknowledged that the current public transportation system is not in a position to cater for the needs of the market and furthermore, that the culture of service provision needs to be improved. There is no documented evidence of research being conducted into service quality in the public transportation industry, more specifically, the intercity bus transport industry. This study therefore intends to analyse the elements impacting on the service quality of the intercity bus transport industry in South Africa. The subsidiary problems relate to:
• Measuring the levels of service quality on the basis of the dimensions that constitute service quality in the intercity bus transport industry in South Africa
• Determining the relationships among the dimensions of service quality
• Examining the relationship between selected biographical variables and expectations and perceptions of service quality in the intercity bus transport industry in South Africa.
Objectives of the Study The objectives of the study were:
• To measure the levels of service quality on the basis of the dimensions that constitute service quality in the intercity bus transport industry in South Africa
• Determine the relationships among the dimensions of service quality
Jeevarathnam P. Govender & Qi Pan
184
• To examine the relationship between selected biographical variables and expectations and perceptions of service quality in the intercity bus transport industry in South Africa
Research Questions The key questions the study intended to answer were:
• What are the levels of service quality on the basis of the dimensions that constitute service quality in the intercity bus transport industry in South Africa?
• What are the relationships among the dimensions of service quality? • Are there significant relationships between selected biographical
variables and expectations and perceptions of service quality in the intercity bus transport industry in South Africa?
Literature Survey The Concept of ‘Service Quality’ Service quality has been associated with the satisfaction of expectations. Gronroos (2001: 151) states that customer satisfaction and happiness are more strongly affected by their expectations. The term ‘expectations’ from a behavioural perspective is not as precise as the usage by mathematicians, who attempt to quantify what, on average, is likely to happen (Metters, King-Metters, Pullman & Walton 2006: 69). Marketing researchers, however, prefer to define service quality from an individual customer’s perspective, also referred to as ‘user-based’ (Fitzsimmons & Fitzsimmons 2006: 128). The expectations are subjective and are based on imagination of the service process and outcomes. Service value is reflected in the satisfaction of customer’s demands. Service quality is a function of the expectations-perceptions gap and pioneering studies into this were conducted in the early 1980s leading to the development of the SERVQUAL model. Today, the results extend into e-SQ or electronic service quality (Zeithaml, Parasuraman & Malhotra 2001: 2). A number of industries were studied to develop and refine SERVQUAL, which has been used to execute a gap analysis of an organisation’s service quality performance against customer service quality needs.
… Service Quality in the Intercity Bus Transport Industry
185
The Relationship between Service Quality and Customer Satisfaction Lovelock and Wright (2002: 87) define customer satisfaction as a form of emotional reaction that arose from an actual experience. Metters et al. (2006: 110) indicate that satisfaction is the consumer’s fulfilment response. Satisfaction is the customer’s evaluation of a product or service in terms of whether that product or service has met the customer’s needs and expectations (Bruhn & Georgi 2006: 443). According to Truong and Foster (2006: 843), customer satisfaction takes place in two situations. One is the result of a product or actual service meeting the customer’s expectations. The other is where the result exceeds the expectations. Dissatisfaction will occur where the actual service level is below the expected level. Therefore, satisfaction and dissatisfaction are the outcome of a subjective evaluative process by the consumer. The relationship between service quality and customer satisfaction still remains a mystery, from the point of view of whether customer satisfaction is an antecedent of service quality or vice versa. Some researchers suggest that customer satisfaction leads to service quality (Lee, Lee & Yoo 2000:219). A viewpoint most commonly adopted is that customer satisfaction with a service is related to the perceived discrepancy between actual and ideal levels of service delivery. If experience of the service greatly exceeds the expectations that clients had of the service, then satisfaction will be high and vice versa (MORI, 2002). This should, however, not be taken as a cue for service providers to drive down expectations in order to achieve surprise and concomitant customer satisfaction with moderate service quality. Service quality is seen as an antecedent of customer satisfaction (Brady, Cronin & Brand 2002: 18). According to Zeithaml, Bitner and Gremler (2006: 110), in order to measure customer satisfaction and examine the differences between the desired level of a service and actual service received, the related factors and their relative importance need to be taken into account, when considering areas for improvement as far as the service mix is concerned. Specific product or service features, perceptions of product and service quality, and price influence customer satisfaction, inter alia. In addition, personal factors such as the customer’s mood, emotional state and situational factors are likely to influence satisfaction.

Jeevarathnam P. Govender & Qi Pan
186
The Dimensions of Service Quality Parasuraman, Zeithaml and Berry originally identified ten dimensions that were used to assess service quality (Nowacki 2005: 236). As a result of further interrogation, the ten dimensions were consolidated into five (Gronroos 2000: 74). These are tangibles, reliability, responsiveness, assurance and empathy, and are briefly explained:
• Tangibles Tangibles are related to the appearance and evidence of physical facilities, equipment, personnel and communication materials (Robledo 2001: 26). Since the tangible and visual elements of the site will be critical to efficiency and overall impressions of the firm and the brand, service companies are likely to use tangibles to enhance their image and convey quality service to consumers (Zeithaml et. al. 2006: 120-22).
• Reliability Bebco (2000: 11-12) defines reliability as ‘the ability to perform the promised service dependably and accurately’. Reliability is a key factor in helping customers evaluate the quality they experienced relative to the quality promised during the delivery process (e.g. service provision, problem resolution and pricing).
• Responsiveness Zeithaml, et al. (2006: 17) believe that service providers should be active and voluntary to assist their customers and be prompt in the provision of services. This dimension makes it necessary that the service provider be flexible in solving customers’ problems and handling requests and queries. This dimension also addresses the need for capacity to customise services to meet the special needs of certain customers.
• Assurance Robelo (2001: 25) regards assurance as the knowledge possessed by employees, their courtesy and the ability of the organisation to inspire trust and confidence. This dimension constitutes four determinants viz. competence, courtesy, credibility and security.

… Service Quality in the Intercity Bus Transport Industry
187
• Empathy According to Curry and Sinclair (2002: 200), the empathy dimension refers to the caring, individualised attention that an organisation provides its customers. To this end, access, communication and understanding the customer are key elements. The basic idea behind this dimension is to provide appropriate and adequate facilities for current as well as potential customers.
Research Methodology The study was cross-sectional, descriptive and quantitative in nature. The population for this study comprised passengers who made use of the intercity bus transport service. A sample size of 400 was considered appropriate, based on the recommendation of Leedy and Omrod (2005: 207) who believe that a sample size of 400 is adequate if the target population size exceeds 5 000. Three approaches to non-probability sampling were used. Firstly, on the basis of purposive sampling, the fieldwork was conducted at the Durban Bus Terminal as the sampling location for two main reasons viz. Durban is one of South Africa’s major tourist destinations and secondly, that the intercity bus transport network connects Durban with the other major cities and towns. Secondly, convenience sampling was used to select respondents. Thirdly, quota sampling was employed to achieve a balance between local and foreign travellers. 350 South Africans and 50 foreign residents were chosen, based on the attendance figures in the 2010 Soccer World Cup held in South Africa. The SERVQUAL instrument was used, consisting of 25 questions pertaining to the five dimensions on expectations and perceptions of service quality. In addition, biographic-type questions were included. After a pilot-test, questionnaires were personally administered among respondents. Data Analysis The data analysis is presented in this section.

Jeevarathnam P. Govender & Qi Pan
188
Biographical Detail As indicated in Table 1, 66.8% of the respondents were male, with 33.2% of respondents being female. It emerged that 26% of respondents were younger than 20 years old, 56.5% being between 20 to 39 years of age, 17% being between 40 and 59 years old, and 0.5% of respondents being over 60years old. 50.3% of respondents resided in Durban, 37.3% were South African, but did not reside in Durban, 4.8% of respondents were from African countries other than South Africa with 7.8% of respondents being overseas residents. Table 1: Biographical detail of Respondents
Respondents n=400 Percentage Gender Male Female Total
66.8 33.2 100
Age Under 20 20-39 40-59 Over 60 Total
26.0 56.5 17.0 0.5 100
Regional distribution Durban area South African, but from outside Durban Other African countries Overseas Total
50.3 37.3 4.8 7.8 100
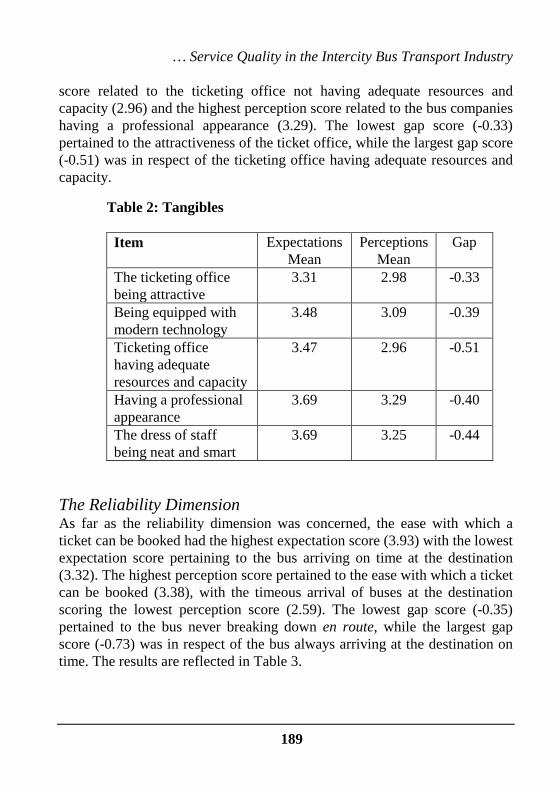
The Tangibles Dimension As depicted in Table 2, the lowest expectation score applied to the attractiveness of the ticketing office (3.31) with the highest expectation scores applying to the bus companies having a professional appearance as well as the staff dress being neat and smart (3.69). The lowest perception
… Service Quality in the Intercity Bus Transport Industry
189
score related to the ticketing office not having adequate resources and capacity (2.96) and the highest perception score related to the bus companies having a professional appearance (3.29). The lowest gap score (-0.33) pertained to the attractiveness of the ticket office, while the largest gap score (-0.51) was in respect of the ticketing office having adequate resources and capacity. Table 2: Tangibles
Item Expectations Mean
Perceptions Mean
Gap
The ticketing office being attractive
3.31 2.98 -0.33
Being equipped with modern technology
3.48 3.09 -0.39
Ticketing office having adequate resources and capacity
3.47 2.96 -0.51
Having a professional appearance
3.69 3.29 -0.40
The dress of staff being neat and smart
3.69 3.25 -0.44
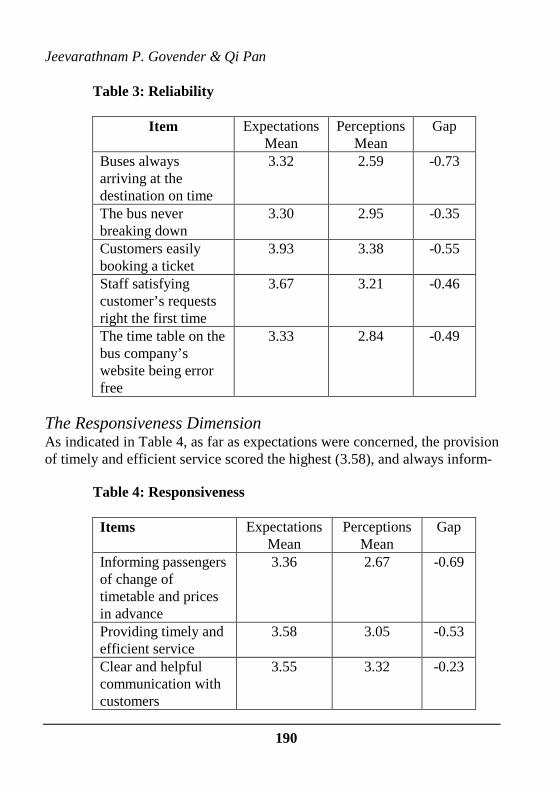
The Reliability Dimension As far as the reliability dimension was concerned, the ease with which a ticket can be booked had the highest expectation score (3.93) with the lowest expectation score pertaining to the bus arriving on time at the destination (3.32). The highest perception score pertained to the ease with which a ticket can be booked (3.38), with the timeous arrival of buses at the destination scoring the lowest perception score (2.59). The lowest gap score (-0.35) pertained to the bus never breaking down en route, while the largest gap score (-0.73) was in respect of the bus always arriving at the destination on time. The results are reflected in Table 3.
Jeevarathnam P. Govender & Qi Pan
190
Table 3: Reliability
Item Expectations Mean
Perceptions Mean
Gap
Buses always arriving at the destination on time
3.32 2.59 -0.73
The bus never breaking down
3.30 2.95 -0.35
Customers easily booking a ticket
3.93 3.38 -0.55
Staff satisfying customer’s requests right the first time
3.67 3.21 -0.46
The time table on the bus company’s website being error free
3.33 2.84 -0.49
The Responsiveness Dimension As indicated in Table 4, as far as expectations were concerned, the provision of timely and efficient service scored the highest (3.58), and always inform- Table 4: Responsiveness
Items Expectations Mean
Perceptions Mean
Gap
Informing passengers of change of timetable and prices in advance
3.36 2.67 -0.69
Providing timely and efficient service
3.58 3.05 -0.53
Clear and helpful communication with customers
3.55 3.32 -0.23

… Service Quality in the Intercity Bus Transport Industry
191
ming passengers of changes to timetables and prices in advance being scored the lowest (3.36). The highest perception score pertained to communication with customers being clear and helpful (3.32), while informing customers of change in timetable and pricing in advance had the lowest perception score (2.67). The lowest gap score (-0.23) pertained to communication with customers being clear and helpful, while the largest gap score (-0.69) was in respect of bus companies always informing passengers of changes to timetables and prices in advance. The Assurance Dimension It emerged, as indicated in Table 5, that as far as the assurance dimension was concerned, customers feeling safe in their transactions with ticket office staff had the highest expectation score (3.88) with the lowest expectation score pertaining to two items, viz. staff having an in-depth knowledge of their jobs, and the behaviour of staff instilling confidence in customers (3.56). The highest perception score pertained to customers feeling safe in their transactions with ticket office staff (3.68), with staff having an in-depth Table 5: Assurance
Items Expectations Mean
Perceptions Mean
Gap
Customers feeling safe in their transactions with ticketing office staff
3.88 3.68 -0.20
Customers feeling safe in their transactions with staff on the bus
3.67 3.26 -0.41
Politeness of staff 3.72 3.43 -0.29 Staff having an in-depth knowledge of their jobs
3.56 3.13 -0.43
Behaviour of staff instilling confidence in customers
3.56 3.14 -0.42

Jeevarathnam P. Govender & Qi Pan
192
knowledge of their jobs scoring the lowest perception score (3.13). The lowest gap score (-0.20) pertained to customers feeling safe in their transactions with ticket office staff while the largest gap score (-0.43) was in respect of staff having an in-depth knowledge of their jobs. The Empathy Dimension The findings, as indicated in Table 6, revealed that for the empathy dimension, the lowest expectation score applied to bus companies having operating hours convenient to all customers (3.39) with the highest expectation score applying to two items, viz. ease of accessing ticket office, and staff providing individualised attention to help customers (3.60). The lowest perception score related to getting information about the facilities and services easily (2.52) and the highest perception score related to staff providing individualised attention to help customers (3.08). The lowest gap score (-0.52) pertained to staff providing individualised attention to help
Table 6: Empathy Items Expectations
Mean Perceptions
Mean Gap
Looking after the best interests of customers
3.44 2.89 -0.55
Having operating hours convenient to all customers
3.39 2.61 -0.78
Getting information about the facilities and services easily
3.48 2.52 -0.96
Ease of accessing ticket office
3.60 2.83 -0.77
Staff providing individualised attention to help customers
3.60 3.08 -0.52
… Service Quality in the Intercity Bus Transport Industry
193
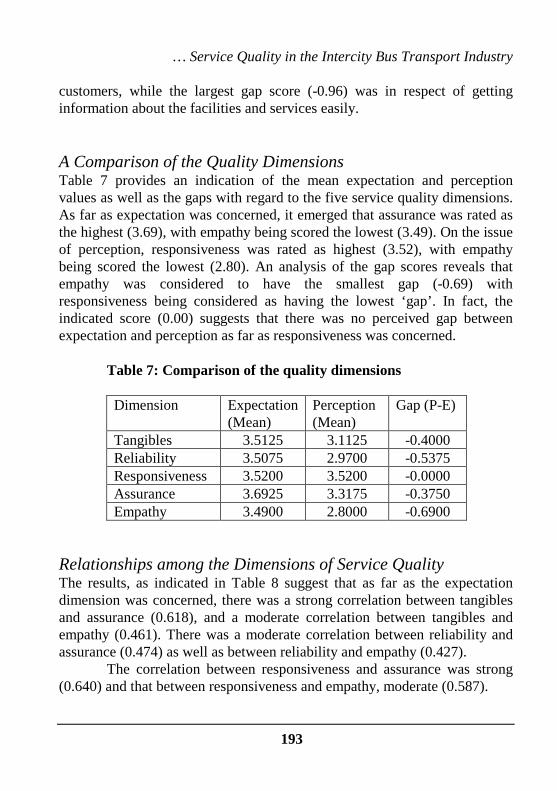
customers, while the largest gap score (-0.96) was in respect of getting information about the facilities and services easily. A Comparison of the Quality Dimensions Table 7 provides an indication of the mean expectation and perception values as well as the gaps with regard to the five service quality dimensions. As far as expectation was concerned, it emerged that assurance was rated as the highest (3.69), with empathy being scored the lowest (3.49). On the issue of perception, responsiveness was rated as highest (3.52), with empathy being scored the lowest (2.80). An analysis of the gap scores reveals that empathy was considered to have the smallest gap (-0.69) with responsiveness being considered as having the lowest ‘gap’. In fact, the indicated score (0.00) suggests that there was no perceived gap between expectation and perception as far as responsiveness was concerned.
Table 7: Comparison of the quality dimensions Dimension Expectation
(Mean) Perception (Mean)
Gap (P-E)
Tangibles 3.5125 3.1125 -0.4000 Reliability 3.5075 2.9700 -0.5375 Responsiveness 3.5200 3.5200 -0.0000 Assurance 3.6925 3.3175 -0.3750 Empathy 3.4900 2.8000 -0.6900
Relationships among the Dimensions of Service Quality The results, as indicated in Table 8 suggest that as far as the expectation dimension was concerned, there was a strong correlation between tangibles and assurance (0.618), and a moderate correlation between tangibles and empathy (0.461). There was a moderate correlation between reliability and assurance (0.474) as well as between reliability and empathy (0.427).
The correlation between responsiveness and assurance was strong (0.640) and that between responsiveness and empathy, moderate (0.587).

Jeevarathnam P. Govender & Qi Pan
194
Table 8: Intra-correlations of expectations Assurance Empathy Tangibles Pearson correlation Significance
0.618 0.000
0.461 0.000
Reliability Pearson correlation Significance
0.474 0.000
0.427 0.000
Responsiveness Pearson correlation Significance
0.640 0.000
0.587 0.000
All of the aforementioned correlations were significant at the 0.01 level and were positive.
The results, as indicated in Table 9 suggest that as far as the perception dimension was concerned, there was a moderate correlation between tangibles and assurance (0.526), and a moderate correlation between tangibles and empathy (0.478). There was a moderate correlation between reliability and assurance (0.470) as well as between reliability and empathy (0.443). The correlation between responsiveness and assurance was moderate (0.428) and that between responsiveness and empathy, weak (0.239). All of the aforementioned correlations were significant at the 0.01 level and positive.
Table 9: Intra-correlations of perceptions Assurance Empathy Tangibles Pearson correlation Significance
0.526 0.000
0.478 0.000
Reliability Pearson correlation Significance
0.470 0.000
0.443 0.000
Responsiveness Pearson correlation Significance
0.428 0.000
0.239 0.000
… Service Quality in the Intercity Bus Transport Industry
195
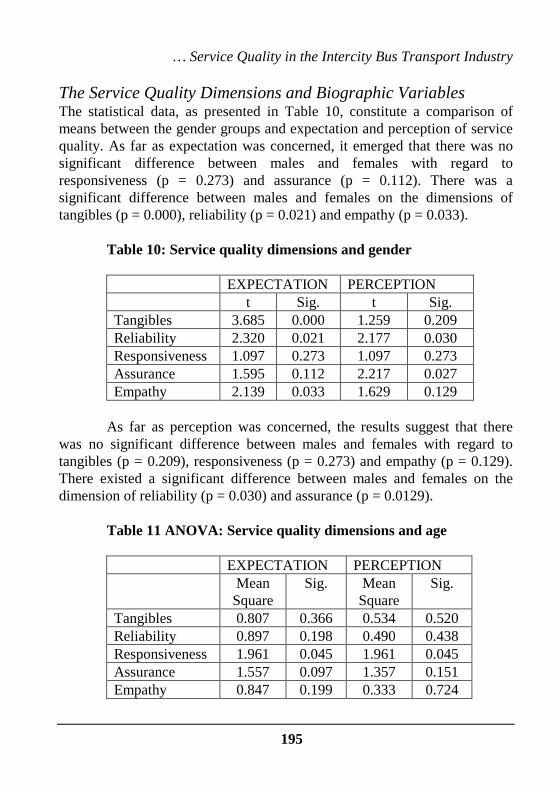
The Service Quality Dimensions and Biographic Variables The statistical data, as presented in Table 10, constitute a comparison of means between the gender groups and expectation and perception of service quality. As far as expectation was concerned, it emerged that there was no significant difference between males and females with regard to responsiveness (p = 0.273) and assurance (p = 0.112). There was a significant difference between males and females on the dimensions of tangibles (p = 0.000), reliability (p = 0.021) and empathy (p = 0.033).
Table 10: Service quality dimensions and gender EXPECTATION PERCEPTION t Sig. t Sig. Tangibles 3.685 0.000 1.259 0.209 Reliability 2.320 0.021 2.177 0.030 Responsiveness 1.097 0.273 1.097 0.273 Assurance 1.595 0.112 2.217 0.027 Empathy 2.139 0.033 1.629 0.129
As far as perception was concerned, the results suggest that there
was no significant difference between males and females with regard to tangibles (p = 0.209), responsiveness (p = 0.273) and empathy (p = 0.129). There existed a significant difference between males and females on the dimension of reliability (p = 0.030) and assurance (p = 0.0129).
Table 11 ANOVA: Service quality dimensions and age EXPECTATION PERCEPTION Mean
Square Sig. Mean
Square Sig.
Tangibles 0.807 0.366 0.534 0.520 Reliability 0.897 0.198 0.490 0.438 Responsiveness 1.961 0.045 1.961 0.045 Assurance 1.557 0.097 1.357 0.151 Empathy 0.847 0.199 0.333 0.724

Jeevarathnam P. Govender & Qi Pan
196
As indicated in Table 11, the ANOVA test results reveal a significant difference among the different age groups only for the responsiveness dimension (p = 0.045 for expectation as well as perception). There were no significant differences between the age groups with regard to expectation and perception of service quality on the dimensions of tangibles, reliability, assurance and empathy. The ANOVA test results reveal that there were no significant differences among the regional groups with regard to expectation and perception of service quality on the dimensions of tangibles, reliability, responsiveness and assurance. There existed a significant difference among the regional groups only for the empathy dimension (p = 0.0387 for expectation and p = 0.035 for perception). The results are indicated in Table 12.
Table 12: Service quality dimensions and regional grouping EXPECTATION PERCEPTION Mean
Square Sig. Mean
Square Sig.
Tangibles 1.290 0.166 0.309 0.727 Reliability 1.231 0.093 1.197 0.084 Responsiveness 0.837 0.330 0.837 0.330 Assurance 0.303 0.748 0.505 0.580 Empathy 1.527 0.038 2.149 0.035
Reliability Analysis Cronbach’s Alpha was used as a test of internal consistency. According to Malhotra (2010: 319), in general, a coefficient of less than 0.6 suggests unsatisfactory internal consistency reliability. The results, as reflected in Table 13, suggest a high degree of internal consistency.
Table 13: Cronbach Alpha Test N=400 Cronbach Alpha No. of items Expectation 0.930 25 Perception 0.924 25

… Service Quality in the Intercity Bus Transport Industry
197
Answers to the Research Questions What are the levels of service quality on the basis of the dimensions that constitute service quality in the intercity bus transport industry in South Africa? It emerged that the largest quality gap score (-0.69) pertained to the empathy dimension, and of all the 25 items, the three items showing the largest gap score pertained to the empathy dimension. These were:
• Getting information about the facilities and services easily (-0.96) • Bus companies having operating hours convenient to all customers
(-0.78) • Ease of access to ticketing office (-0.77)
The reliability dimension achieved the second largest gap score (-0.54), with the following three items showing significant gaps:
• Buses arriving at the destination on time (-0.73) • Customers easily booking a ticket (-0.55) • The time table on the bus companies websites being error free
(-0.49) The assurance dimension achieved the third largest gap score (-0.38), with no items under this dimension having scores that suggested a significant gap. This was followed by the tangibles dimension (gap score = -0.40), which had one item that warranted attention viz. the ticketing office having adequate resources and capacity (-0.51). Interestingly, although the responsiveness dimension showed no overall gap, two items had significant gap scores viz:
• Informing passengers of changes in timetable and prices in advance (-0.69)
• Providing timely and efficient service (-0.53)
What are the relationships among the dimensions of service quality? With regards to the expectation dimension, there was a strong correlation between tangibles and assurance, and a moderate correlation between
Jeevarathnam P. Govender & Qi Pan
198
tangibles and empathy. There was a moderate correlation between reliability and assurance as well as between reliability and empathy. The correlation between responsiveness and assurance was strong and that between responsiveness and empathy, moderate. As far as the perception dimension was concerned, there was a moderate correlation between tangibles and assurance, and a moderate correlation between tangibles and empathy. There was a moderate correlation between reliability and assurance as well as between reliability and empathy. The correlation between responsiveness and assurance was moderate and that between responsiveness and empathy, weak. Are there significant relationships between selected demographic variables and expectations and perceptions of service quality in the intercity bus transport industry in South Africa? With regard to expectations, it emerged that there was no significant difference between males and females with regard to responsiveness and assurance. There was a significant difference between males and females on the dimensions of tangibles, reliability and empathy. As far as perception was concerned, there was no significant difference between males and females with regard to tangibles, responsiveness and empathy. There was a significant difference between males and females on the dimension of reliability and assurance. There was significant difference among the different age groups only for the responsiveness dimension for expectation as well as perception. There were no significant differences between the age groups with regard to expectation and perception of service quality on the dimensions of tangibles, reliability, assurance and empathy. There were no significant differences among the regional groups with regard to expectation and perception of service quality on the dimensions of tangibles, reliability, responsiveness and assurance. There existed a significant difference among the regional groups only for the empathy dimension. Recommendations Based on the research findings, the following recommendations are made:

… Service Quality in the Intercity Bus Transport Industry
199
• The intercity bus transportation system should use user-friendly printed material (e.g. area based timetables, posters and brochures) which customers can relate to. Electronic media should also be used to greater effect (e.g. electronic displays and a more comprehen-sively detailed website). This will address issues around empathy and tangibles in the industry.
• The ticketing system should be more accessible in terms of location as well as operating hours. To this end, geographic information regarding ticketing offices should be placed at strategic points (e.g. at tourism centres and in the media).
• An online reservation system should be developed considering the
cost saving associated with an electronic medium. The system should connect with strategic partners (e.g. main chain stores).
• The reliability of the bus service should be improved in three ways:
Firstly, a consistently aligned set of factors, processes and standards that can define timely routing should be developed. Secondly, there should be regular maintenance of the fleet as well as readily available spare equipment and parts. Thirdly, new technologies (e.g. Global Positioning) should be introduced to control routes and timings.
• Changes in time and prices should be communicated quickly to
customers. To this end rapid electronic media should be used. These media should take into account the needs of persons with impairments (e.g. hearing and visual).
• There should be greater interaction with present as well as potential
customers with a view to understanding their needs more clearly. Regular surveys should be conducted and customer complaints, fully analysed. Staff members need to be made aware of customer feedback as well as complaints so that the necessary actions can be taken.

Jeevarathnam P. Govender & Qi Pan
200
• Detailed policies and procedures should be developed so that the variability in customer treatment is reduced. There should be formalised training in the area of customer service. Recruitment and selection should take cognizance of the element of customer service.
• There should be closer co-operation between the bus companies
(operators) so that there can be a more synchronised approach to operations e.g. sharing passenger loads during conditions of under-capacity as well as excess capacity.
Conclusion The study sought to assess the level of service quality in the intercity bus transport industry. A literature survey was undertaken in order to determine the theoretical underpinnings of service quality. The empirical study was conducted using the SERVQUAL model. Service quality was measured on the basis of the 25 items that constitute the five dimensions of service quality. The relationships among the dimensions of service quality were analysed. The relationship between selected biographical variables and expectations and perceptions of service quality was examined. Recommendations for improvement in service quality have been made. References Bebco CP 2000. Service Intangibility and its Impact on Customer
Expectations of Service Quality. Journal of Services Marketing 14,1: 9-26.
Brady MK, JJ Cronin & RR Brand 2002. Performance-only Measurement of Service Quality: A Replication and Extension. Journal of Business Research 55,1: 17-31.
Bruhn M and D Georgi 2006. Services Marketing: Managing the Service Value Chain. London: Pearson Education Limited.
Curry A & E Sinclair 2002. Assessing the Quality of Physiotherapy Services Using Servqual. International Journal of Health Care Quality Assurance 15,5: 197- 205.

… Service Quality in the Intercity Bus Transport Industry
201
Fitzsimmons JA & MJ Fitzsimmons 2006. Service Management: Operations, Strategy, Information Technology. 5th Edition. Singapore: McGraw-Hill.
Getting you from A2B in South Africa 2006. Available at: http:// www.visa.org.za/transport.htm.
Gronroos C 2000. Service Management and Marketing: A Customer Relationship Management Approach. 2nd Edition. Chichester: John Wiley & Sons.
Gronroos C 2001. The Perceived Service Quality Concept – A Mistake? Managing Service Quality 11,3: 150-152.
Le H, Y Lee & D Yoo 2000. The Determinants of Perceived Service Quality and its Relationship with Satisfaction. Journal of Services Marketing 14,2: 217 – 231.
Leedy PD & JE Omrod 2005. Practical Research: Planning and Design. 7th Edition. Upper Saddle River, NJ.: Prentice Hall.
Lovelock C & L Wright 2002. Principles of Service Marketing and Management. 2nd Edition. Upper Saddle River, NJ.: Prentice Hall.
Malhotra N 2010. Marketing Research – An Applied Orientation. New York: Pearson.
Metters RK, M King-Metters, M Pullman & S Walton S 2006. Successful Service Operations Management. 2nd Edition. Singapore: South Western.
MORI 2002. Public Service Reform: Measuring and Understanding Customer Satisfaction. Available at: http://www.mori.com/pubinfo/ rd/opsr.pdf.
National Department of Transport. National Department of Transport Strategic Plan 2006-2009. 2006. Available at: http://www. transport. gov.za/library/plan-f.html.
No financial Worries about 2010. 2006. Available at: http://www.cape-town.org.
Nowacki MM 2005. Evaluating a Museum as a Tourist Product Using the Servqual Method. Museum Management and Curatorship 20: 235 - 250.
Ongkittikul S & H Geerlings 2006. Opportunities for Innovation in Public Transport: Effects of Regulatory Reforms on Innovative Capabilities. Transport Policy 13: 283-293.

Jeevarathnam P. Govender & Qi Pan
202
Robledo MA 2001. Measuring and Managing Service Quality: Integrating Customer Expectations. Managing Service Quality 11,1: 22-31.
South Africa Yearbook 2005/6. 2005. Pretoria: Government Printer Transport Crisis Could Hinder 6% Economic Growth. Available at: http://www.marketingweb.co.za.
Truong T & D Foster 2006. Using Holstat to Evaluate Tourist Satisfaction at Destinations: The Case of Australian Holidaymakers in Vietnam. Tourism Management 27: 842-855.
Zeithaml VA, MJ Bitner & DD Gremler 2006. Services Marketing: Integrating Customer Focus across the Firm. 4th Edition. New York: McGraw-Hill.
Zeithaml VA, A Parasuraman & A Malhotra 2001. A Conceptual Framework for Understanding e-Service Quality: Implications for Future Research and Managerial Practice. MSI Working Paper Series, No. 00-115: 1-9.
Jeevarathnam P Govender
Department of Marketing, Retail and Public Relations Durban University of Technology
Durban, South Africa [email protected]
Qi Pan
Department of Marketing, Retail and Public Relations Durban University of Technology
Durban, South Africa [email protected]