enhancing accountability at the cutting edges gopakumar
TRANSCRIPT
8/2/2019 Enhancing Accountability at the Cutting Edges Gopakumar
http://slidepdf.com/reader/full/enhancing-accountability-at-the-cutting-edges-gopakumar 1/16
1
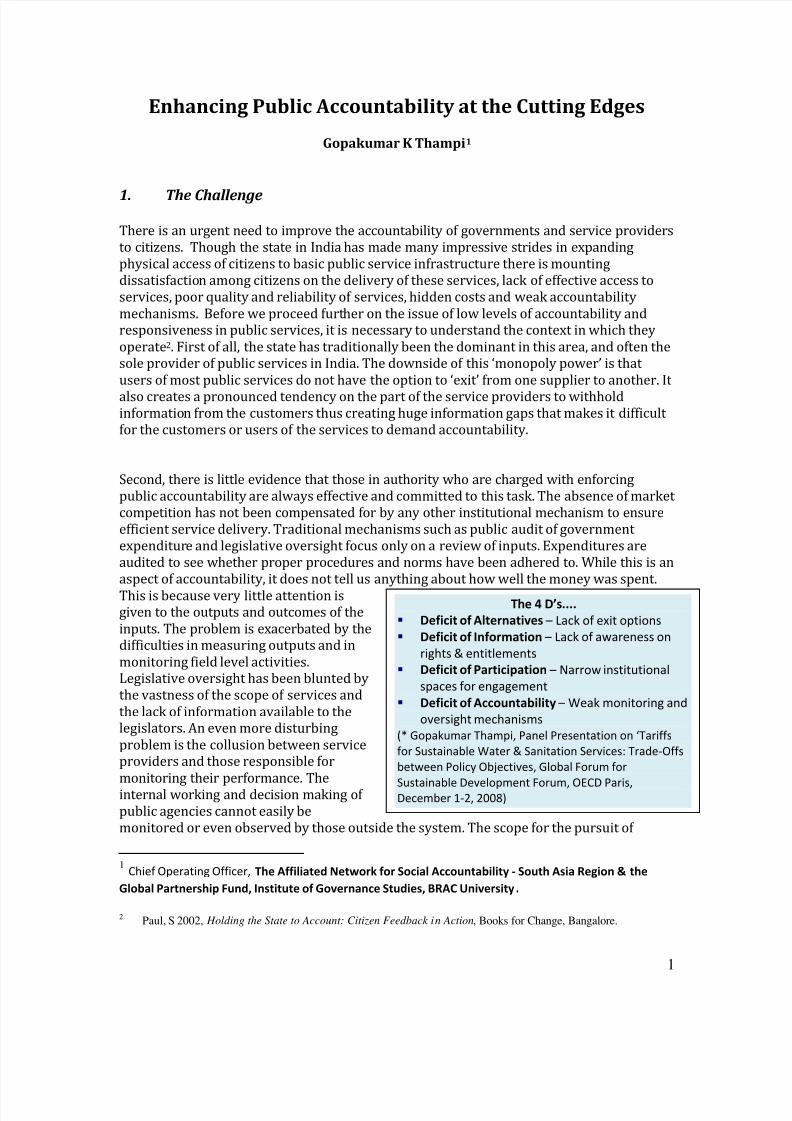
The 4 D’s....
Deficit of Alternatives – Lack of exit options
Deficit of Information – Lack of awareness on
rights & entitlements
Deficit of Participation – Narrow institutional
spaces for engagement
Deficit of Accountability – Weak monitoring and
oversight mechanisms
(* Gopakumar Thampi, Panel Presentation on ‘Tariffs
for Sustainable Water & Sanitation Services: Trade-Offs
between Policy Objectives, Global Forum for
Sustainable Development Forum, OECD Paris,December 1-2, 2008)
Enhancing Public Accountability at the Cutting Edges
Gopakumar K Thampi1
1. The Challenge
There is an urgent need to improve the accountability of governments and service providers
to citizens. Though the state in India has made many impressive strides in expanding
physical access of citizens to basic public service infrastructure there is mounting
dissatisfaction among citizens on the delivery of these services, lack of effective access to
services, poor quality and reliability of services, hidden costs and weak accountability
mechanisms. Before we proceed further on the issue of low levels of accountability andresponsiveness in public services, it is necessary to understand the context in which they
operate2. First of all, the state has traditionally been the dominant in this area, and often thesole provider of public services in India. The downside of this ‘monopoly power’ is that
users of most public services do not have the option to ‘exit’ from one supplier to another. It
also creates a pronounced tendency on the part of the service providers to withholdinformation from the customers thus creating huge information gaps that makes it difficult
for the customers or users of the services to demand accountability.
Second, there is little evidence that those in authority who are charged with enforcing
public accountability are always effective and committed to this task. The absence of market
competition has not been compensated for by any other institutional mechanism to ensure
efficient service delivery. Traditional mechanisms such as public audit of government
expenditure and legislative oversight focus only on a review of inputs. Expenditures are
audited to see whether proper procedures and norms have been adhered to. While this is an
aspect of accountability, it does not tell us anything about how well the money was spent.
This is because very little attention isgiven to the outputs and outcomes of the
inputs. The problem is exacerbated by thedifficulties in measuring outputs and in
monitoring field level activities.Legislative oversight has been blunted by
the vastness of the scope of services and
the lack of information available to thelegislators. An even more disturbing
problem is the collusion between serviceproviders and those responsible for
monitoring their performance. The
internal working and decision making of
public agencies cannot easily be
monitored or even observed by those outside the system. The scope for the pursuit of
1 Chief Operating Officer, The Affiliated Network for Social Accountability - South Asia Region & the
Global Partnership Fund, Institute of Governance Studies, BRAC University.
2 Paul, S 2002, Holding the State to Account: Citizen Feedback in Action, Books for Change, Bangalore.

8/2/2019 Enhancing Accountability at the Cutting Edges Gopakumar
http://slidepdf.com/reader/full/enhancing-accountability-at-the-cutting-edges-gopakumar 2/16
2
parochial and self-serving interests and for corruption is considerable under thecircumstances.
Third, citizens—who directly or indirectly pay for all public services—are seldom able to
engage in sustained collective action to demand increased public accountability from the
service providers they deal with. There is an implicit assumption that once people elect a
government, it is for the latter to enforce accountability on all service providers. Perhaps aneven more important reason for this attitude of citizens is that their motivation to engage in
collective action is usually weak. The fact that the severity of problems people face
concerning public services generally tend to vary from day to day and from household to
household shows that sustaining collective action is difficult even when a group is able to
initiate action at some point in time. Some people may not invest time and energy for
collective action as they feel they could get a ‘free ride’ from the success of the efforts of
others in any case. This is a major reason why the incentives for collective action are weak
except in certain critical situations.
Fourth, the legal framework of the country can be a barrier to improved public
accountability. Administrators typically try to work within the framework of the laws andregulations of their organisations. Accounts get audited because a law requires them to do
so. Investments are made according to the laws and regulations governing the organisation.If the law is silent on the standards and other attributes of services, provider agencies are
likely to pay less attention to them.
Under these circumstances, the brunt of deficiencies in service, leave “poor people
vulnerable to rudeness, humiliation and inhuman treatment by both private and public
agents of the state3”, even when they seek services they are entitled to under the law of the
land. The difficulties in accessing services are aggravated by the physical and social
environment that the poor live in. These experiences of the poor reflect the inadequacy and
difficulties encountered by the poor. On the other hand, these experiences also reflect morebasic realities of state-citizen relationship beyond the service in question – on the manner
in which the poor are organized as citizens, their relationship and mechanisms of interface
with the state, and the changing character of the state.
Given this highly disabling environment, what are the practical ways to use `voice and
participation’ to change the highly disabling ambience of public service delivery? Increasing
opportunities for citizens’ voice and participation can create powerful incentives for change
in one major direction: when competition is absent, as in the case of most public goods,
popular voice can reduce information asymmetries which can challenge service providersto perform better and lower transaction costs.4 When low incentives and weak monitoring
combine to produce inefficient public services, voice mechanisms can inform public officials
of the problems and act as pressure forces for demanding improvements.5
3 Narayan, D., Patel, R., Schafft, K., Rademacher, A. and Koche-Schulte, S., 2000, Voices of the Poor: Can AnyoneHear Us?, Oxford University Press, New York
4 Paul, S 1998, „Making Voice Work: The Report Card on Bangalore‟s Public Services‟, Policy Research Working
Paper no. 1921, The World Bank, Washington DC. 5 Dreze, J and Amartya Sen 1999, „Public Action and Social Inequality‟, in Barbara Harriss-White and Sunil
Subramanian (Eds), Illfare in India: Essays on India’s Social Sector in Honour of S. Guhan, Sage Publications,New Delhi.

8/2/2019 Enhancing Accountability at the Cutting Edges Gopakumar
http://slidepdf.com/reader/full/enhancing-accountability-at-the-cutting-edges-gopakumar 3/16
3
The accountability conundrum
Governments spend on the wrong goods and people – Budget Allocation
Problem Resources fail to reach service providers or users - Expenditure
Tracking Problem
Weak incentives for effective service delivery - Problem of
Monitoring/Accountability
Demand-side constraints - Problem of Participation/Awareness -
VOICE
2. Exploring the potency of Citizen Feedback
Citizen feedback is a cost-effective way for a government to find out whether its services are
reaching the people, especially the poor. Users of a public service can tell the government a
lot about the quality and value of a service. However, there is a dominant tendency among
policy makers and service leaders to neglect this critical input while designing anddelivering services. It was against this disabling background that Citizen Report Cards
emerged as an “experiment” 15 years back in the city of Bangalore, India.
2.1 Citizen Report Card: The Context
Bangalore, the capital of the State of Karnataka, is one of India’s large cosmopolitan cities,
with a current population of around 6.8 million. The city expanded very rapidly since the1980s, putting immense pressure on public service providers to cope with increased
demand for essential services. The city’s services deteriorated significantly between thelate 80’s and mid 90’s, after which major changes and improvements took place.
At the root of the problems in Bangalore was the rapid growth of the city, from a population
of 1.2 million in 1961 to 4.1 million in 1991. Although the local government, called the
Bangalore City Corporation, with an elected Mayor and Council, and a large complement of
civil servants, was mandated to provide services such as solid waste disposal, maintenance
of roads, permissions for erecting new buildings, etc., other services such as drinking water,
public transport, electricity, security and traffic management were provided by separate
agencies set up by the State Government. Urban planning and expansion of housing were
facilitated by yet another agency. Annex 1 gives the list of key service providers inBangalore.
By the early nineties, the situation in the city was not only one of inadequate and low
quality public services, but also of a sense of helplessness among ordinary people about

8/2/2019 Enhancing Accountability at the Cutting Edges Gopakumar
http://slidepdf.com/reader/full/enhancing-accountability-at-the-cutting-edges-gopakumar 4/16
4
resolving such problems. Electricity, water, garbage removal, and other essential serviceswere both unreliable and difficult to access. People waited for years to get new telephone
connections. Roads were in bad shape, especially in residential areas. Pedestrian sidewalks,
parks and other civic amenities were poorly maintained. There was a widespread
impression that it was difficult to get assistance from service providers without bribes.
There was no institutional mechanism for coordinating the activities of different serviceproviders until 1999. Each agency formulated policies and plans depending on its priorities
and resources. Administrative systems provided little room for direct consultation with city
residents, to establish priorities, plan or monitor services.
Slum dwellers, who accounted for a large proportion of the urban poor and approximately
25% of city resident’s, were a fast growing population. Their problems were similar to those
faced by slum dwellers in other cities: civic agencies were reluctant to provide services
without a land title, the high density of habitation placed pressure on the minimalinfrastructure and subsidized services were needed, etc. Bangalore’s slums were scattered
across the city, and urban growth created pressure to move the slums.
The misery in the city was sustained by a sense of resignation among citizens. There were
no loud protests or public agitations demanding an overall improvement in services. Inretrospect, one could largely attribute the lack of corrective action by service providers to
this deficit in collective action by city residents. There were very few neighborhood
associations in Bangalore to take up civic issues. Most city based NGOs directed their
attention to specific segments such as children, women and slum dwellers. The poor level of
organization in civil society matched the low level of concern among activists and leading
citizens to fight against the dismal public services in their own backyard.
It was against this disabling backdrop that a small citizens’ group in Bangalore led by Dr.
Samuel Paul, a distinguished academic and internationally renowned public sector expert,
organised a public feedback exercise with some friends as a concerned citizen’s response tothe appalling quality of civic services. The survey was carried out by a supportive market
research firm, Marketing and Business Associates, with survey costs met through local
donations. The response this experiment evoked in both state and non-state arenas led to
the formation of ‘Public Affairs Centre’ (PAC) in Bangalore as a national institute dedicated
to improve the quality of governance in India in 1994. Over the past nine years, PAC has
emerged as a major resource centre for stimulating public action through focused
knowledge creation.
2.2 Citizen Report Card: The Concept
Citizen Report Cards (CRCs) on public utilities, pioneered by PAC is now widely recognised
as a powerful voice mechanism. Anchoring on the concept of user feedback, ‘citizen report cards’ provide a simple and widely replicable tool for improving transparency and public
accountability. When citizens’ voice provides an objective assessment of both qualitative
and quantitative aspects of different public services, based on first-hand interactions with
the agencies providing these services, it is possible to rank the agencies on the quality of
performance. This ̀ report card’ can then be used to stimulate collective action by citizens,
and provide organisational leaders with an opportunity to design reforms and bring in a

8/2/2019 Enhancing Accountability at the Cutting Edges Gopakumar
http://slidepdf.com/reader/full/enhancing-accountability-at-the-cutting-edges-gopakumar 5/16
5
strategic reorientation.6 Experiences with report cards, both national and international,have amply demonstrated its potential for demanding more public accountability and
providing a credible database to facilitate proactive civil society responses. In more
practical terms, Citizen Report Cards give the following strategic inputs:
a. Provide benchmarks on access, adequacy and quality of public services as experienced by
citizens: Citizen Report Cards go beyond the specific problems that individual citizensface and place each issue in the perspective of other elements of service design and
delivery, as well as a comparison with other services, so that a strategic set of actions
can be initiated.
b. Provide measures of citizen satisfaction to prioritise corrective actions: Citizen Report
Cards capture citizens’ feedback in clear, simple and unambiguous fashion by indicating
their level of satisfaction or dissatisfaction. When this measure of citizen satisfaction or
dissatisfaction is viewed from a comparative perspective, it gives very valuable
information to prioritise corrective actions. For example, the most basic feedback acitizen may give about power supply is total dissatisfaction. To appreciate this feedback,
it must be related to the ratings given to other services by the same person. Forexample, water supply may be rated worse than power supply. When these two pieces
of information are compared, one can conclude that power supply may be a cause of dissatisfaction, but the priority for corrective action may be on water supply.
c. Provide indicators of problem areas in the delivery of public services: Citizen Report Cards
enquire into specific aspects of interaction between the service agency and the citizen,
and seek to identify issues experienced by citizens in interfacing with the services. In
more simple terms, Citizen Report Cards suggest that dissatisfaction has causes, which
may be related to the quality of services enjoyed by citizens (like reliability of power
supply, or availability of medicines in a public hospital); difficulties encountered while
dealing with the agency to solve service related issues like excess billing or complaints
of power supply breakdown.
d. Provide reliable estimates on corruption and other hidden costs: Corruption, though
widespread and rampant, often exists in the realm of anecdotes without any
quantitative base. This ‘subjectivity’ of corruption has severely undermined both
corrective and collective responses.
e. Provides a mechanism to explore citizens’ alternatives for improving public services:Citizen Report Cards go beyond collecting feedback on existing situations from citizens.
They are also a means of testing out different options that citizens wish to exercise,individually or collectively, to tackle various problems. For example, Citizen Report
Cards can provide information on whether citizens are willing to pay more for better
quality of services or be part of citizens’ bodies made responsible for managing garbageclearance in the locality.
A typical CRC study is organised along the following lines7:
6 Gopakumar, K 1997, „Public Feedback as an aid to Public Accountability: Reflections on an innovative approach‟,Public Administration and Development , vol. 17, pp. 281-82.
7 For a comprehensive review of the Citizen Report Card methodology, refer to www.citizenreportcard.com
8/2/2019 Enhancing Accountability at the Cutting Edges Gopakumar
http://slidepdf.com/reader/full/enhancing-accountability-at-the-cutting-edges-gopakumar 6/16
6
Identification of issues through Focus Group Discussions
Designing the survey instrument
Identifying the scientific sample for the survey
Survey by an independent agency
Collection of qualitative data
Placing the results in the public domain
Advocacy and partnerships.
The increasing application of Report Cards reflects a growing awareness of the potency of
empirical approaches to provide useful trigger mechanisms for mobilising effective andfocused demand constituencies. Empirical approaches have also helped to quantify and give
shape to many themes, which hitherto existed in the realms of the abstract (corruptionbeing a good case in point).
2.3 The Bangalore Citizen Report Card Narratives (1994-2003)
The Public Affairs Centre (PAC) in Bangalore has done pioneering work on CRCs over the
past decade. The first report card on Bangalore’s public agencies in 1994 covered municipal
services, water supply, electricity, telecom, and transport. Since then, PAC has brought out
report cards on several other cities, rural services and also on social services such as health
care. But since it has tracked services for a longer period in Bangalore, we shall refer to this
experiment in detail.
A comparison of the citizen ratings of public service agencies in Bangalore over a decade is
perhaps the only way to judge whether their services had improved significantly. The earlyresponses of the agencies between the first two report cards were varied. Some agenciestook reform initiatives while others did not. It was during the period between the second
and third report cards that more concerted efforts towards reform took place. The evidence
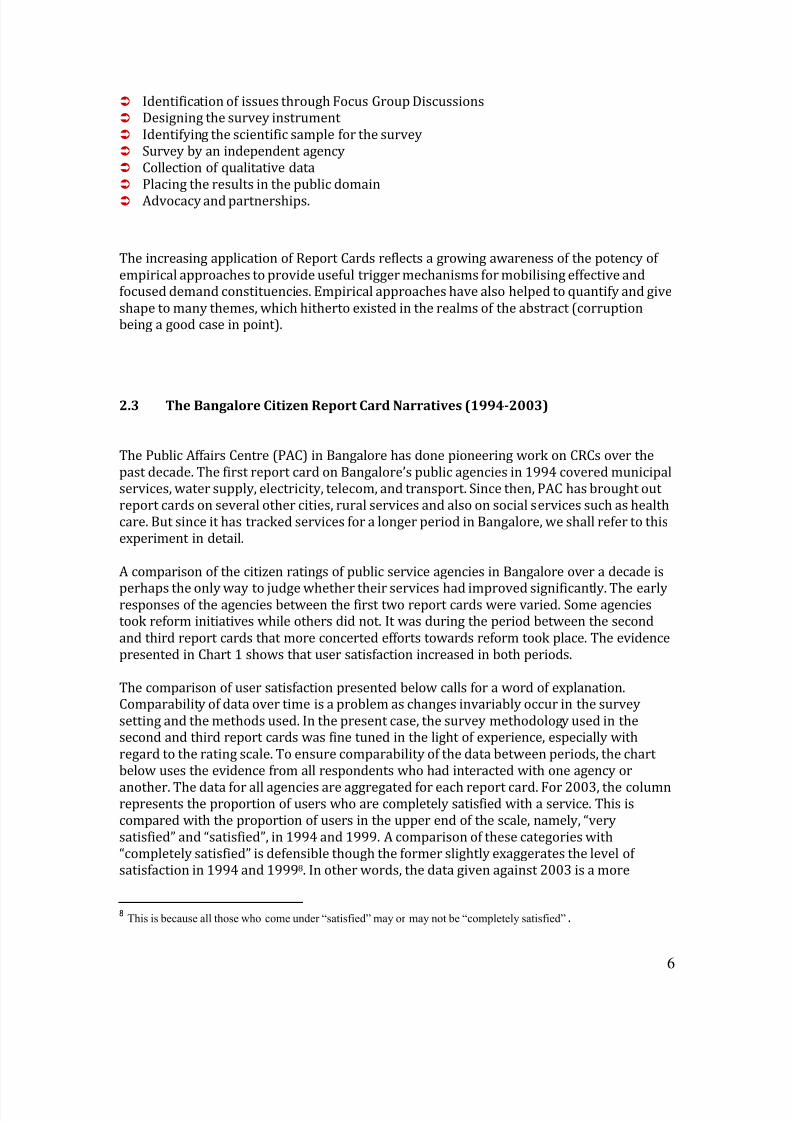
presented in Chart 1 shows that user satisfaction increased in both periods.
The comparison of user satisfaction presented below calls for a word of explanation.Comparability of data over time is a problem as changes invariably occur in the survey
setting and the methods used. In the present case, the survey methodology used in thesecond and third report cards was fine tuned in the light of experience, especially with
regard to the rating scale. To ensure comparability of the data between periods, the chart
below uses the evidence from all respondents who had interacted with one agency or
another. The data for all agencies are aggregated for each report card. For 2003, the columnrepresents the proportion of users who are completely satisfied with a service. This is
compared with the proportion of users in the upper end of the scale, namely, “very
satisfied” and “satisfied”, in 1994 and 1999. A comparison of these categories with
“completely satisfied” is defensible though the former slightly exaggerates the level of
satisfaction in 1994 and 19998. In other words, the data given against 2003 is a more
8 This is because all those who come under “satisfied” may or may not be “completely satisfied”.
8/2/2019 Enhancing Accountability at the Cutting Edges Gopakumar
http://slidepdf.com/reader/full/enhancing-accountability-at-the-cutting-edges-gopakumar 7/16
7
restrictive measure of user satisfaction. Despite this limitation, the chart shows that theaverage user satisfaction increased by over 40% between 1999 and 2003. Focus on the
upper end of the scale is appropriate also because it sets a goal for the service provider to
achieve, namely, giving complete or high satisfaction to the user.
Chart 1
Chart 2
8/2/2019 Enhancing Accountability at the Cutting Edges Gopakumar
http://slidepdf.com/reader/full/enhancing-accountability-at-the-cutting-edges-gopakumar 8/16
8
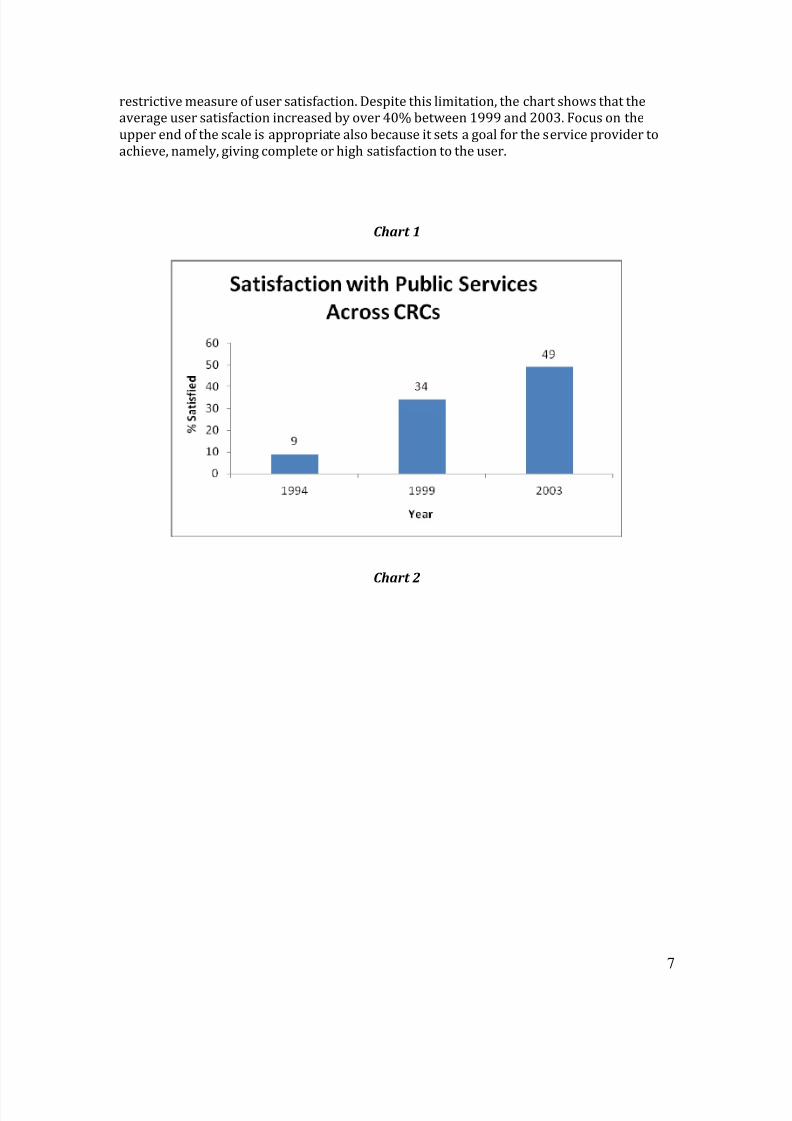
Legend: BWSSB – Bangalore Water Supply & Sewerage Board; BESCOM – Bangalore Electricity
Company; BSNL – Bangalore Telephone Company; BMP – Bangalore City Corporation; BDA –
Bangalore Development Authority; and; RTO – Road Transport Authority
Chart 2 above presents the satisfaction ratings across the three CRCs. Here again, while the
rating for 1994 and 1999 includes those users who interacted with service providers and
are either very satisfied or satisfied, that for 2003 gives those who are completely satisfied.The chart shows that agencies have varied in terms of complete satisfaction. This probably
reflects the complexity of the agency tasks and the nature of reforms attempted.
Chart 1 above clearly indicates a trend of across the board improvement over time in user
satisfaction when all the agencies are taken together. Chart 2 shows that there are
variations in the ratings across CRCs for agencies and they are not even. The usage of the
restrictive measure in 2003 understates the extent of satisfaction. The improvement in
rating would have been better if a less restrictive measure had been used. It is important to
understand what lies behind this change. Does the improvement in satisfaction reflect real
changes that might have occurred in the quality of services, responsiveness of the service
providers, and efficiency of service delivery? Did the need for interaction with the agencies
significantly decrease? What actions might have been taken by the government and itsservice providers to achieve such positive outcomes? The comparative charts below provide
some answers to these questions.
Problem incidence: People are likely to be more satisfied when they have fewer problems
in getting a service or while interacting with an agency. The extent to which users of services experience problems has come down in 2003 in comparison with 1999. (see Chart
3). Fewer problems mean fewer interactions with the agencies. This usually happens when

8/2/2019 Enhancing Accountability at the Cutting Edges Gopakumar
http://slidepdf.com/reader/full/enhancing-accountability-at-the-cutting-edges-gopakumar 9/16

8/2/2019 Enhancing Accountability at the Cutting Edges Gopakumar
http://slidepdf.com/reader/full/enhancing-accountability-at-the-cutting-edges-gopakumar 10/16
10
The chart above indicates a positive change in staff behaviour for all the agencies takentogether. It is difficult to imagine that people who gave low ratings in the past to the same
staff would applaud them now without valid reasons. While improved procedures havereduced the possibility of abuse of discretion, most agencies have invested also in training
their staff. These efforts may have positively influenced the attitude and mindset of staff
since 1999.
Corruption: An important question is whether service improvement has been accompanied
by a reduction in corruption. Evidence on this is given in the chart below. Despite some
improvement in the services, corruption seems to have increased between 1994 and 1999.But compared to the report card of 1999, the findings of CRC 2003 for general households
show that corruption in the agencies has come down (chart 5). We suspect that this reflects
a reduction in the bribes demanded and paid by people in routine transactions.Streamlining of procedures and systems and increased transparency may well have
contributed to this outcome. Some examples of how this might have happened are given
below. This does not imply that all pockets of corruption have been eliminated. In
specialized areas such as building permits and approvals of various kinds, corruption may
still be substantial, but this survey was not designed to unearth them. The findings
definitely support the premise that simpler procedures and improved efficiency in routineoperations such as self assessment of property tax by the City Corporation, simplified land
transfer by the Urban Development Authority and the like, as well as measures such as IT
enabled billing systems in BESCOM (the Electricity Company), served to reduce harassment
and extortion citizens faced in the late nineties.

8/2/2019 Enhancing Accountability at the Cutting Edges Gopakumar
http://slidepdf.com/reader/full/enhancing-accountability-at-the-cutting-edges-gopakumar 11/16
11
Chart 5
3. From Political “brakes” to Reform “accelerators”: The New Paradigm
Citizen Report Card emerged as a demand-side “voice” mechanism. However, over the years,
it started to elicit slow but steady interest from political leaders. A good illustration of this
transition is the social audit of public services in Delhi initiated by the Chief Minister of
Delhi, Mrs. Sheila Dixit. In September 2005, the Chief Minister (Head of the Provincial
Government) of Delhi Mrs. Sheila Dikshit invited the Public Affairs Foundation (PAF) to
monitor the outcomes of key public services in Delhi, using citizen feedback on the service
providers involved. The project was completed in September 2006 and the findings were
presented before the media and officials on September 4, 2006. What made this case stand
out was that the Chief Minister publicly announced the launch of this audit and also openly
committed to disclose the findings to the public, irrespective of the nature of the results.
The audit was modeled after the well known Citizen Report Cards, pioneered by Public
Affairs Centre.
The National Capital Territory (NCT) of Delhi is a unique administrative set up withadministrative controls spread across three sets of actors – the central government, an
elected state (provincial) government and local (municipal) government. A reformist government headed by Mrs. Sheila Dikshit has been in power since 1998. During the last 5-6
years, huge investments have been committed to improve public infrastructure, followed bya wide range of reforms in public administration. Two major strands that stand out in the
reform agenda are: (a) significant investments on public infrastructure (especially in
improving mass transport, and provision of water) and (b) wide range of e governanceapplications (e.g., computerization of land registration, online grievance redress etc.) that
have been implemented across the board to make public services more accessible,
responsive and accountable.
8/2/2019 Enhancing Accountability at the Cutting Edges Gopakumar
http://slidepdf.com/reader/full/enhancing-accountability-at-the-cutting-edges-gopakumar 12/16
12
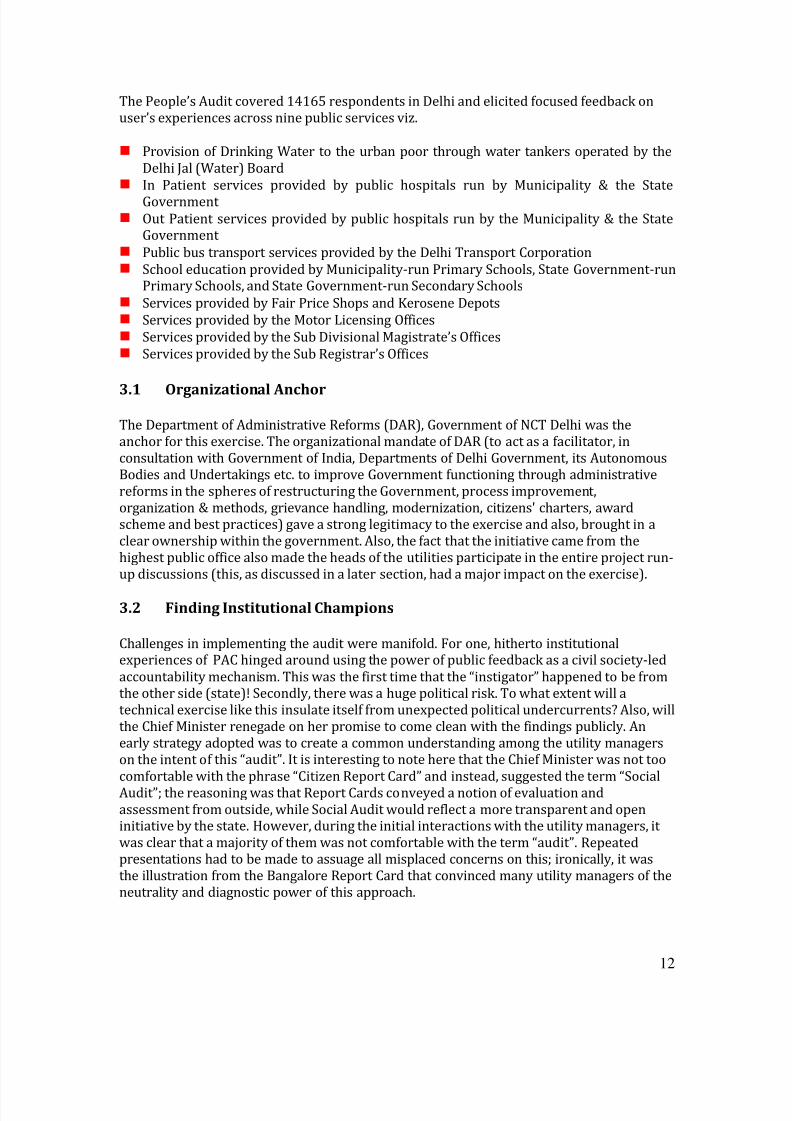
The People’s Audit covered 14165 respondents in Delhi and elicited focused feedback on
user’s experiences across nine public services viz.
Provision of Drinking Water to the urban poor through water tankers operated by the
Delhi Jal (Water) Board
In Patient services provided by public hospitals run by Municipality & the State
Government
Out Patient services provided by public hospitals run by the Municipality & the StateGovernment
Public bus transport services provided by the Delhi Transport Corporation
School education provided by Municipality-run Primary Schools, State Government-runPrimary Schools, and State Government-run Secondary Schools
Services provided by Fair Price Shops and Kerosene Depots
Services provided by the Motor Licensing Offices
Services provided by the Sub Divisional Magistrate’s Offices
Services provided by the Sub Registrar’s Offices
3.1 Organizational Anchor
The Department of Administrative Reforms (DAR), Government of NCT Delhi was the
anchor for this exercise. The organizational mandate of DAR (to act as a facilitator, in
consultation with Government of India, Departments of Delhi Government, its Autonomous
Bodies and Undertakings etc. to improve Government functioning through administrative
reforms in the spheres of restructuring the Government, process improvement,
organization & methods, grievance handling, modernization, citizens' charters, award
scheme and best practices) gave a strong legitimacy to the exercise and also, brought in a
clear ownership within the government. Also, the fact that the initiative came from the
highest public office also made the heads of the utilities participate in the entire project run-
up discussions (this, as discussed in a later section, had a major impact on the exercise).
3.2 Finding Institutional Champions
Challenges in implementing the audit were manifold. For one, hitherto institutionalexperiences of PAC hinged around using the power of public feedback as a civil society-led
accountability mechanism. This was the first time that the “instigator” happened to be from
the other side (state)! Secondly, there was a huge political risk. To what extent will a
technical exercise like this insulate itself from unexpected political undercurrents? Also, will
the Chief Minister renegade on her promise to come clean with the findings publicly. An
early strategy adopted was to create a common understanding among the utility managers
on the intent of this “audit”. It is interesting to note here that the Chief Minister was not too
comfortable with the phrase “Citizen Report Card” and instead, suggested the term “Social
Audit”; the reasoning was that Report Cards conveyed a notion of evaluation and
assessment from outside, while Social Audit would reflect a more transparent and openinitiative by the state. However, during the initial interactions with the utility managers, it
was clear that a majority of them was not comfortable with the term “audit”. Repeatedpresentations had to be made to assuage all misplaced concerns on this; ironically, it was
the illustration from the Bangalore Report Card that convinced many utility managers of the
neutrality and diagnostic power of this approach.
8/2/2019 Enhancing Accountability at the Cutting Edges Gopakumar
http://slidepdf.com/reader/full/enhancing-accountability-at-the-cutting-edges-gopakumar 13/16
13
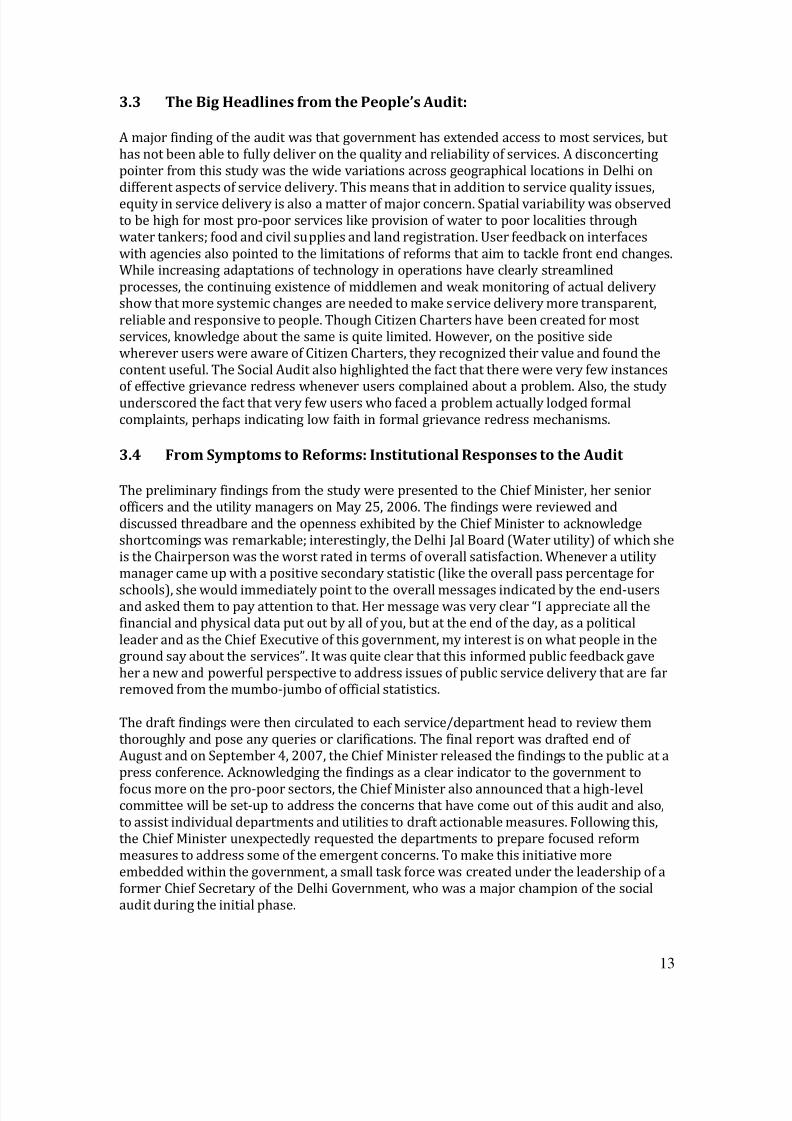
3.3 The Big Headlines from the People’s Audit:
A major finding of the audit was that government has extended access to most services, but
has not been able to fully deliver on the quality and reliability of services. A disconcerting
pointer from this study was the wide variations across geographical locations in Delhi on
different aspects of service delivery. This means that in addition to service quality issues,
equity in service delivery is also a matter of major concern. Spatial variability was observed
to be high for most pro-poor services like provision of water to poor localities through
water tankers; food and civil supplies and land registration. User feedback on interfaces
with agencies also pointed to the limitations of reforms that aim to tackle front end changes.While increasing adaptations of technology in operations have clearly streamlined
processes, the continuing existence of middlemen and weak monitoring of actual deliveryshow that more systemic changes are needed to make service delivery more transparent,
reliable and responsive to people. Though Citizen Charters have been created for most
services, knowledge about the same is quite limited. However, on the positive side
wherever users were aware of Citizen Charters, they recognized their value and found the
content useful. The Social Audit also highlighted the fact that there were very few instances
of effective grievance redress whenever users complained about a problem. Also, the studyunderscored the fact that very few users who faced a problem actually lodged formal
complaints, perhaps indicating low faith in formal grievance redress mechanisms.
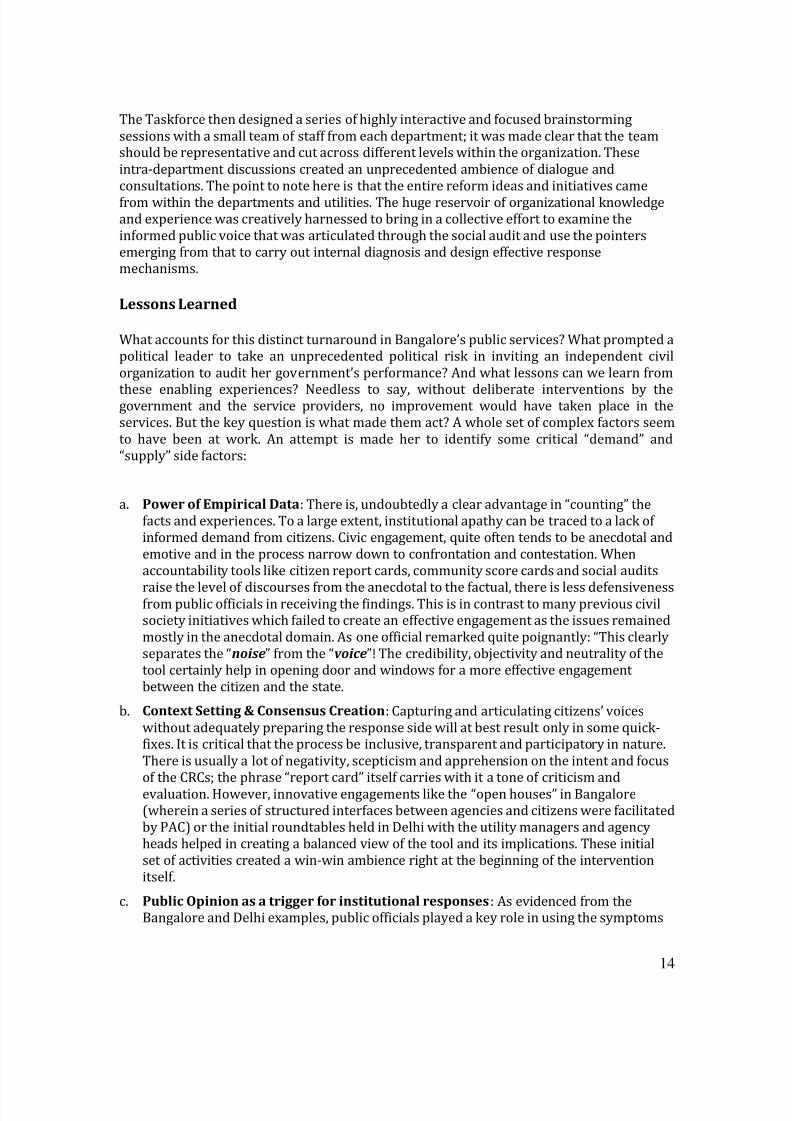
3.4 From Symptoms to Reforms: Institutional Responses to the Audit
The preliminary findings from the study were presented to the Chief Minister, her senior
officers and the utility managers on May 25, 2006. The findings were reviewed and
discussed threadbare and the openness exhibited by the Chief Minister to acknowledgeshortcomings was remarkable; interestingly, the Delhi Jal Board (Water utility) of which she
is the Chairperson was the worst rated in terms of overall satisfaction. Whenever a utility
manager came up with a positive secondary statistic (like the overall pass percentage for
schools), she would immediately point to the overall messages indicated by the end-usersand asked them to pay attention to that. Her message was very clear “I appreciate all the
financial and physical data put out by all of you, but at the end of the day, as a political
leader and as the Chief Executive of this government, my interest is on what people in theground say about the services”. It was quite clear that this informed public feedback gave
her a new and powerful perspective to address issues of public service delivery that are farremoved from the mumbo-jumbo of official statistics.
The draft findings were then circulated to each service/department head to review them
thoroughly and pose any queries or clarifications. The final report was drafted end of
August and on September 4, 2007, the Chief Minister released the findings to the public at a
press conference. Acknowledging the findings as a clear indicator to the government to
focus more on the pro-poor sectors, the Chief Minister also announced that a high-levelcommittee will be set-up to address the concerns that have come out of this audit and also,
to assist individual departments and utilities to draft actionable measures. Following this,
the Chief Minister unexpectedly requested the departments to prepare focused reform
measures to address some of the emergent concerns. To make this initiative more
embedded within the government, a small task force was created under the leadership of a
former Chief Secretary of the Delhi Government, who was a major champion of the social
audit during the initial phase.
8/2/2019 Enhancing Accountability at the Cutting Edges Gopakumar
http://slidepdf.com/reader/full/enhancing-accountability-at-the-cutting-edges-gopakumar 14/16
14
The Taskforce then designed a series of highly interactive and focused brainstorming
sessions with a small team of staff from each department; it was made clear that the teamshould be representative and cut across different levels within the organization. These
intra-department discussions created an unprecedented ambience of dialogue and
consultations. The point to note here is that the entire reform ideas and initiatives came
from within the departments and utilities. The huge reservoir of organizational knowledge
and experience was creatively harnessed to bring in a collective effort to examine the
informed public voice that was articulated through the social audit and use the pointers
emerging from that to carry out internal diagnosis and design effective responsemechanisms.
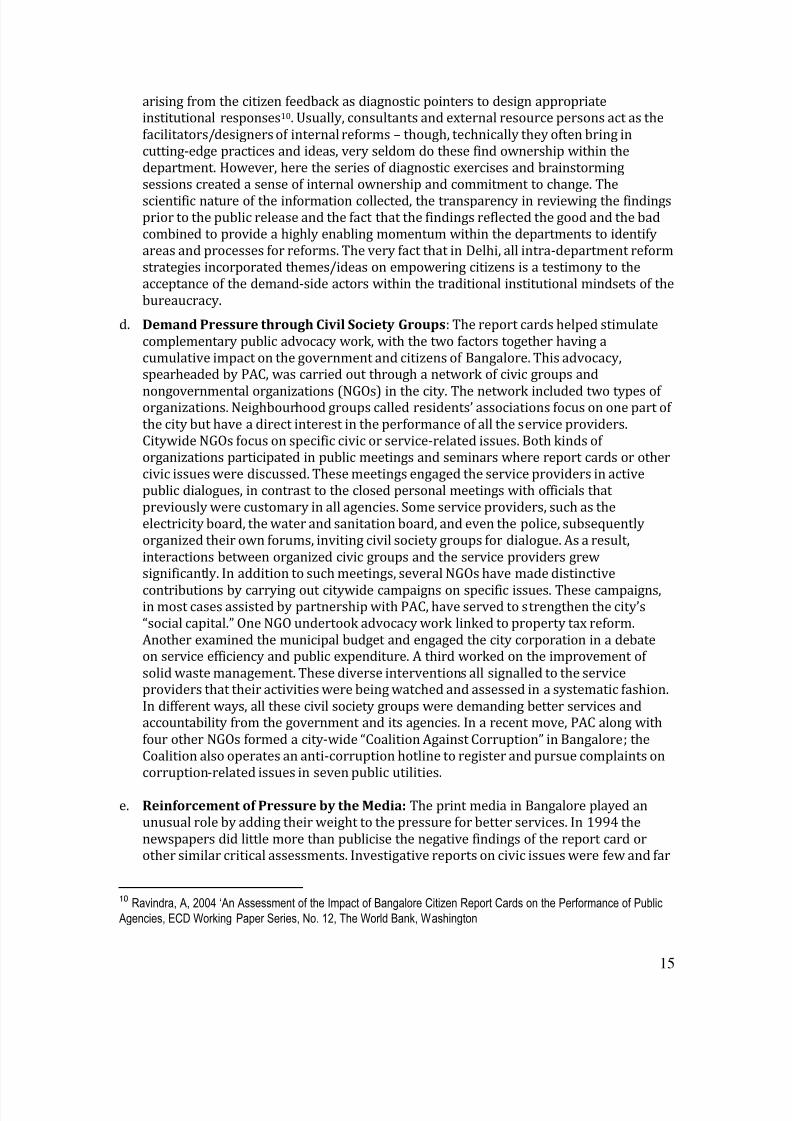
Lessons Learned
What accounts for this distinct turnaround in Bangalore’s public services? What prompted a
political leader to take an unprecedented political risk in inviting an independent civil
organization to audit her government’s performance? And what lessons can we learn from
these enabling experiences? Needless to say, without deliberate interventions by thegovernment and the service providers, no improvement would have taken place in the
services. But the key question is what made them act? A whole set of complex factors seem
to have been at work. An attempt is made her to identify some critical “demand” and
“supply” side factors:
a. Power of Empirical Data: There is, undoubtedly a clear advantage in “counting” the
facts and experiences. To a large extent, institutional apathy can be traced to a lack of
informed demand from citizens. Civic engagement, quite often tends to be anecdotal and
emotive and in the process narrow down to confrontation and contestation. When
accountability tools like citizen report cards, community score cards and social audits
raise the level of discourses from the anecdotal to the factual, there is less defensivenessfrom public officials in receiving the findings. This is in contrast to many previous civilsociety initiatives which failed to create an effective engagement as the issues remained
mostly in the anecdotal domain. As one official remarked quite poignantly: “This clearly
separates the “noise” from the “voice”! The credibility, objectivity and neutrality of the
tool certainly help in opening door and windows for a more effective engagement
between the citizen and the state.
b. Context Setting & Consensus Creation: Capturing and articulating citizens’ voices
without adequately preparing the response side will at best result only in some quick-fixes. It is critical that the process be inclusive, transparent and participatory in nature.
There is usually a lot of negativity, scepticism and apprehension on the intent and focus
of the CRCs; the phrase “report card” itself carries with it a tone of criticism and
evaluation. However, innovative engagements like the “open houses” in Bangalore
(wherein a series of structured interfaces between agencies and citizens were facilitated
by PAC) or the initial roundtables held in Delhi with the utility managers and agency
heads helped in creating a balanced view of the tool and its implications. These initial
set of activities created a win-win ambience right at the beginning of the intervention
itself.
c. Public Opinion as a trigger for institutional responses: As evidenced from theBangalore and Delhi examples, public officials played a key role in using the symptoms
8/2/2019 Enhancing Accountability at the Cutting Edges Gopakumar
http://slidepdf.com/reader/full/enhancing-accountability-at-the-cutting-edges-gopakumar 15/16
15
arising from the citizen feedback as diagnostic pointers to design appropriateinstitutional responses10. Usually, consultants and external resource persons act as the
facilitators/designers of internal reforms – though, technically they often bring in
cutting-edge practices and ideas, very seldom do these find ownership within the
department. However, here the series of diagnostic exercises and brainstorming
sessions created a sense of internal ownership and commitment to change. The
scientific nature of the information collected, the transparency in reviewing the findingsprior to the public release and the fact that the findings reflected the good and the bad
combined to provide a highly enabling momentum within the departments to identify
areas and processes for reforms. The very fact that in Delhi, all intra-department reform
strategies incorporated themes/ideas on empowering citizens is a testimony to the
acceptance of the demand-side actors within the traditional institutional mindsets of the
bureaucracy.
d. Demand Pressure through Civil Society Groups: The report cards helped stimulate
complementary public advocacy work, with the two factors together having a
cumulative impact on the government and citizens of Bangalore. This advocacy,spearheaded by PAC, was carried out through a network of civic groups and
nongovernmental organizations (NGOs) in the city. The network included two types of organizations. Neighbourhood groups called residents’ associations focus on one part of
the city but have a direct interest in the performance of all the service providers.
Citywide NGOs focus on specific civic or service-related issues. Both kinds of
organizations participated in public meetings and seminars where report cards or other
civic issues were discussed. These meetings engaged the service providers in active
public dialogues, in contrast to the closed personal meetings with officials that
previously were customary in all agencies. Some service providers, such as the
electricity board, the water and sanitation board, and even the police, subsequently
organized their own forums, inviting civil society groups for dialogue. As a result,
interactions between organized civic groups and the service providers grewsignificantly. In addition to such meetings, several NGOs have made distinctive
contributions by carrying out citywide campaigns on specific issues. These campaigns,in most cases assisted by partnership with PAC, have served to strengthen the city’s
“social capital.” One NGO undertook advocacy work linked to property tax reform.
Another examined the municipal budget and engaged the city corporation in a debateon service efficiency and public expenditure. A third worked on the improvement of
solid waste management. These diverse interventions all signalled to the serviceproviders that their activities were being watched and assessed in a systematic fashion.
In different ways, all these civil society groups were demanding better services andaccountability from the government and its agencies. In a recent move, PAC along with
four other NGOs formed a city-wide “Coalition Against Corruption” in Bangalore; the
Coalition also operates an anti-corruption hotline to register and pursue complaints on
corruption-related issues in seven public utilities.
e. Reinforcement of Pressure by the Media: The print media in Bangalore played an
unusual role by adding their weight to the pressure for better services. In 1994 the
newspapers did little more than publicise the negative findings of the report card orother similar critical assessments. Investigative reports on civic issues were few and far
10 Ravindra, A, 2004 ‘An Assessment of the Impact of Bangalore Citizen Report Cards on the Performance of Public
Agencies, ECD Working Paper Series, No. 12, The World Bank, Washington

8/2/2019 Enhancing Accountability at the Cutting Edges Gopakumar
http://slidepdf.com/reader/full/enhancing-accountability-at-the-cutting-edges-gopakumar 16/16
16
between. Subsequently, however, the newspapers began to take a much more proactiverole. After deciding to devote more space to public service problems and related civic
issues, several newspapers sought PAC’s advice and technical support for special
features. One newspaper began a series of reports on the different wards of the city,
highlighting their problems and focusing on their elected council members This was
followed by another innovative campaign that newspapers seldom undertake, through
which they organized interactive meetings in different parts of the city for citizens tovoice specific problems to senior officials from selected city agencies. A large number of
public officials were thus exposed to the issues of the localities and stimulated to
respond with answers. FM radio channels also provide opportunities for city residents
to call in and raise questions on key issues. This public process clearly put increased
pressure on the agencies to be more transparent and accountable and to deliver on their
promises.