enhancing educational data quality in heterogeneous learning contexts using pentaho data integration
TRANSCRIPT

Enhancing educational data quality in heterogeneous learning contexts using
Pentaho Data Integration
Learning Analytics Summer Institute, 2015
Alex Rayón Jerez@alrayon, [email protected]
June, 22nd, 2015

2
Table of contents● Introduction● Why data quality?● Data lifecycle● Data quality framework● Data quality plan● ETL approach● Tools

3
Table of contents● Introduction● Why data quality?● Data lifecycle● Data quality framework● Data quality plan● ETL approach● Tools

4
Introduction
Fuente: http://hardcoremind.com/?p=823

5
Introduction (II)
6
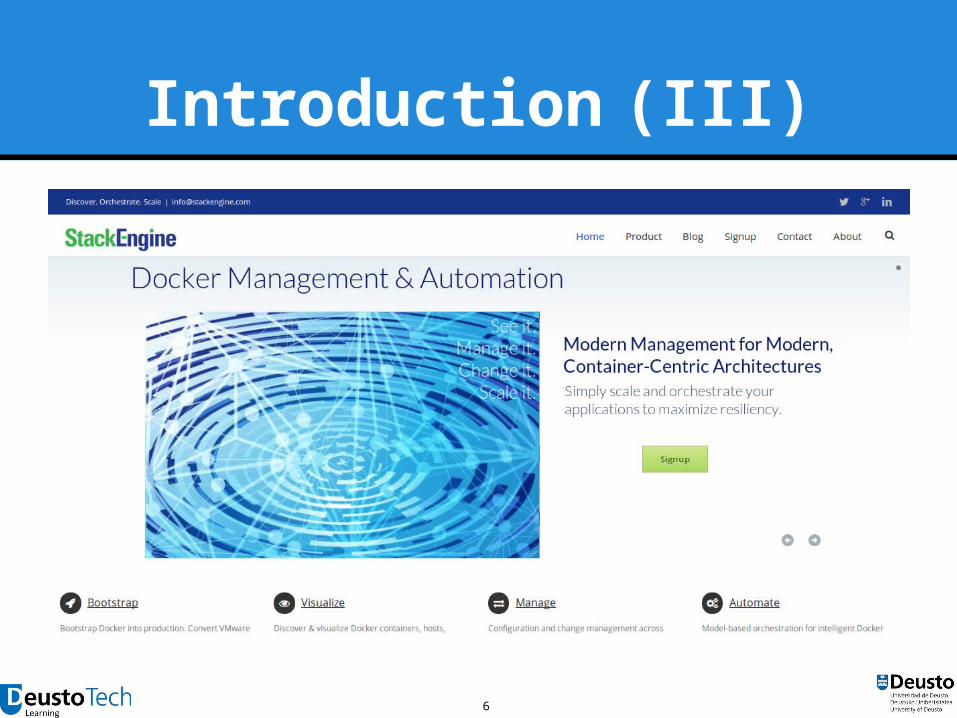
Introduction (III)

7
Introduction (IV)

8
Introduction (V)

9
Introduction (VI)

10
Introduction (VII)
Source: http://www.economist.com/news/finance-and-economics/21578041-containers-have-been-more-important-globalisation-freer-trade-humble

11
Introduction (VIII)
What about education?
And learning?

12
Table of contents● Introduction● Why data quality?● Data lifecycle● Data quality framework● Data quality plan● ETL approach● Tools
13
Why data quality?Data sources
Today we have so much data that come in an unstructured or semi-structured form that may nonetheless be of value in understanding more about our
learners
14
Why data quality?Data sources (II)
“Learning is a complex social activity” [Siemens2012]
Lots of dataLots of tools
Humans to make sense

15
Why data quality?Data sources (III)
● The world of technology has changed [Eaton2012]o 80% of the world’s information is unstructuredo Unstructured data are growing at 15 times the rate
of structured informationo Raw computational power is growing at such an
enormous rate that we almost have a supercomputer in our hands
o Access to information is available to all

16
Why data quality?Data sources (IV)
Source: http://www.bigdata-startups.com/BigData-startup/understanding-sources-big-data-infographic/

17
Why data quality?Data sources (V)
● RDBMS (SQL Server, DB2, Oracle, MySQL, PostgreSQL, Sybase IQ, etc.)
● NoSQL Data: HBase, Cassandra, MongoDB● OLAP (Mondrian, Palo, XML/A)● Web (REST, SOAP, XML, JSON)● Files (CSV, Fixed, Excel, etc.)● ERP (SAP, Salesforce, OpenERP)● Hadoop Data: HDFS, Hive● Web Data: Twitter, Facebook, Log Files, Web Logs● Others: LDAP/Active Directory, Google Analytics,
etc.

18
Why data quality?Limitations and costs
Source: http://www.learningfrontiers.eu/?q=story/will-analytics-transform-education

19
Why data quality?Challenges
● Data is everywhere● Data is inconsistent
o Records are different in each system● Performance issues
o Running queries to summarize data for stipulated long period takes operating system for task
o Brings the OS on max load● Data is never all in Data Warehouse
o Excel sheet, acquisition, new application
20
Why data quality?Challenges (II)
● Data is incomplete● Certain types of usage data are not logged● Data are not aggregated following a
didactical perspective● Users are afraid that they could draw
unsound inferences from some of the data
[Mazza2012]

21
Why data quality?Development of common language for data exchange
The IEEE defines interoperability to be:
“The ability of two or more systems or components to exchange information and to use the information that
has been exchanged”

22
Why data quality?Development of common language for data exchange (II)
● The most difficult challenges with achieving interoperability are typically found in establishing common meanings to the data
● Sometimes this is a matter of technical precisiono But culture – regional, sector-specific, and
institutional – and habitual practices also affect meaning

23
Why data quality?Development of common language for data exchange (III)
● Potential benefitso Efficiency and timeliness
No need for a persona to intervene to re-enter, re-format or transform data
o Independence Resilience
o Adaptability Faster, cheaper and less disruptive to change
o Innovation and market growth Interoperability combined with modularity makes
it easier to build IT systems that are better matched to local culture without needing to create and maintain numerous whole systems

24
Why data quality?Development of common language for data exchange (IV)
● Potential benefitso Durability of data
Structures and formats change over time The changes are rarely properly documented
o Aggregation Data joining might be supported by a common set
of definitions around course structure, combined with a unified identification scheme
o Sharing Specially when there are multiple parties involved

25
Why data quality?Development of common language for data exchange (V)
[LACE2013]

26
Why data quality?Development of common language for data exchange (VI)
[LACE2013]
In our case?

27
Why data quality?Development of common language for data exchange (VII)
[LACE2013]
In our case?

28
Why data quality?Importance
● Data quality emerged as an academic research theme in the early 90’s
● In large companies, awareness of the importance of quality is much more recent
● The core of any business process where data is the main asset○ Why?
■ Poor decision taking process
■ Time to fix the errors
■ ...
29
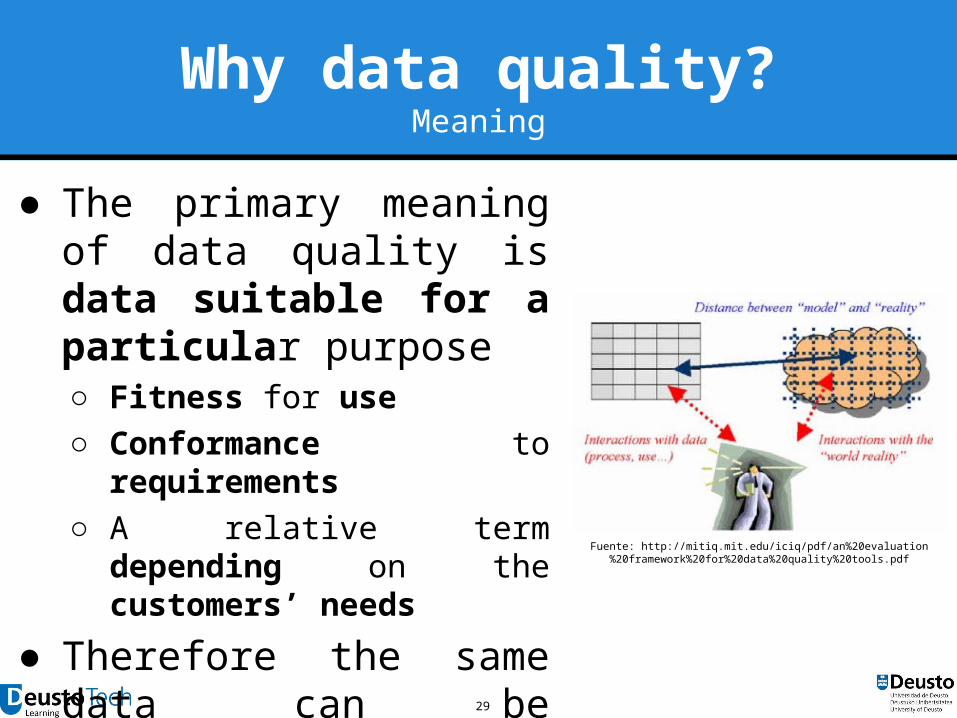
Why data quality?Meaning
● The primary meaning of data quality is data suitable for a particular purpose○ Fitness for use○ Conformance to requirements○ A relative term depending on
the customers’ needs
● Therefore the same data can be evaluated to varying degrees of quality according to users’ needs
Fuente: http://mitiq.mit.edu/iciq/pdf/an%20evaluation%20framework%20for%20data%20quality%20tools.pdf
30
Why data quality?Meaning (II)
● How well the representation model lines up with the reality of business processes in the real world [Agosta2000]
● The different ways in which the project leader, the end-user or the database administrator evaluate data integrity produces a large number of quality dimensions

31
Why data quality?Where are problems generated?
Data entry
External data integration
Loading errors
Data migrations
New applications

32
Índice de contenidos● Introduction● Why data quality?● Data lifecycle● Data quality framework● Data quality plan● ETL approach● Tools

33
Data lifecycleQuality definition

34
Data lifecycleKnowledge Discovery in Databases

35
Data lifecycleKnowledge Discovery in Databases (II)
SQL
XML
CSV
...
Data Management /
Integration
Ciclo / Proceso
datos
Modelodatos
Dashboard
Report
API

36
Table of contents● Introduction● Why data quality?● Data lifecycle● Data quality framework● Data quality plan● ETL approach● Tools

37
Data quality frameworkMeasuring data quality
● A vast number of bibliographic references address the definition of criteria for measuring data quality
● Criteria are usually classified into quality dimensions○ [Berti1999]○ [Huang1998]○ [Olson2003]○ [Redman2001]○ [Wang2006]
38
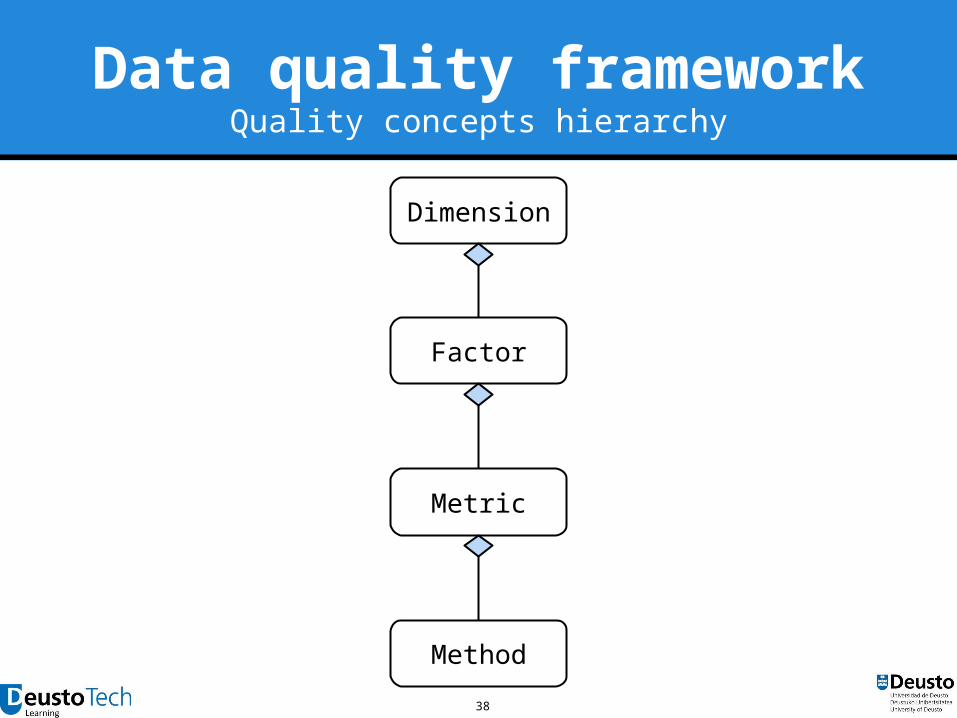
Data quality frameworkQuality concepts hierarchy
Dimension
Factor
Metric
Method

39
Data quality frameworkDimensions
● A dimension captures a facet (at a high level) of the quality○ Completeness○ Accuracy○ Consistency○ Relevancy○ Uniqueness
[Goasdoué2007]

40
Data quality frameworkDimensions (II)
QUALITY INDICATORSCompleteness
Accuracy
Consistency
Relevancy
Uniqueness
Do I have all the information?
Is my dataset valid?
Are there conflicts within my data?
Is my data useful?
Do I have repeated information?

41
Data quality frameworkQuality factors
Freshness Validity, age, volatility, opportunity, obsolescence, etc.
Completeness Density, coverage, sufficiency, etc.
Data quantity Volume, data quantity, etc.
Interpretation Traceability, appearance, presentation, modifiability, etc.
Understanding Clarity, meaning, readability, comparability, etc.
Concise representation
Uniqueness, minimality, etc.
Consistent representation
Format, syntas, alias, semantic, version control, etc.

42
Data quality frameworkQuality metrics
● A metric is the tool that permits us to measure a quality factor
● We must define○ The semantic (how it is measured)
■ i.e. amount of null values, time elapsed since the last update
○ The measurement units■ i.e. response time in ms, GB volume, transaction/seg. quantity
○ The measurement granularity■ i.e. error quantity in the whole table or in one attribute
■ Usual granularities: cell, triple, attribute, view, table, etc.

43
Data quality frameworkQuality methods
● A method is a process that implements a metric
● It is the responsible of obtaining a set of measurements (in relation to a metric) for a given database
● The method implementation is dependant of the application and of the database structureo i.e. to measure the time since the last update we can
Use database timestamps Access to the update logs Compare versions of the database

44
Data quality frameworkDimensions: 1) Completeness
● Is a concept missing? ● Are there missing values in a column, in a
table? ● Are there missing values?● Examples
○ Empty postal codes in the 50% of the records

45
Data quality frameworkDimensions: 1) Completeness (II)
● Extensityo The amount of entities/states of the reality
represented for solving our problem
● Intensityo The amount of data of each entity/state of the data
model
46
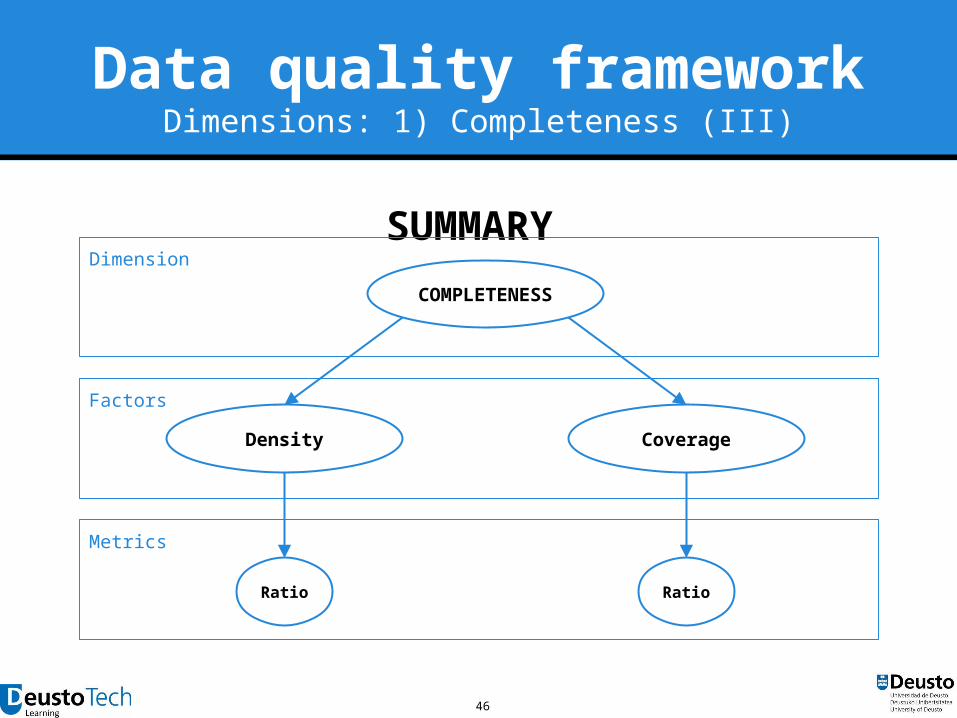
Data quality frameworkDimensions: 1) Completeness (III)
Metrics
SUMMARYDimension
Factors
COMPLETENESS
CoverageDensity
Ratio Ratio

47
Data quality frameworkDimensions: 1) Completeness (IV)
● Densityo How much information about my entities do I have in
my information system?o We need to measure the quantity of information and
the gapo Some interpretations about missing values
They exist but I do not know them It does not exist I do not know if they exist
Factors: Completeness

48
Data quality frameworkDimensions: 1) Completeness (V)
● Coverageo How many entities does my information system
contain? Closed world: a table contains all the states Open world: a table contains some of the states
o We need to measure the quantity of of real world data my information system contain
o Examples From all my students, ¿how much do I know? Which percentage of learning activities are registered in my
database?
Factors: Completeness

49
Data quality frameworkDimensions: 1) Completeness (VI)
● Density factor○ Density ratio: % of no null values
● Coverage factor○ Coverage ratio: % of data within the data model
● Improvement opportunities○ Crosschecking or external data acquisition ○ Imputation with statistical models �○ Statistical smoothing techniques �
Metrics: Completeness
50
Data quality frameworkDimensions: 1) Completeness (VII)
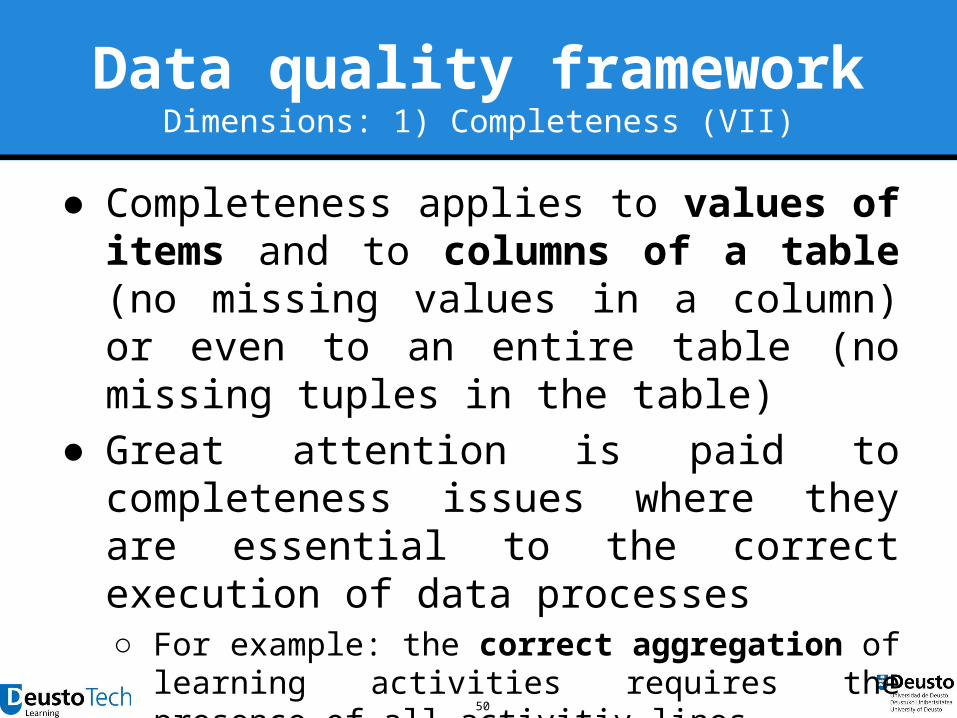
● Completeness applies to values of items and to columns of a table (no missing values in a column) or even to an entire table (no missing tuples in the table)
● Great attention is paid to completeness issues where they are essential to the correct execution of data processes○ For example: the correct aggregation of learning
activities requires the presence of all activitiy lines
51
Data quality frameworkDimensions: 2) Accuracy
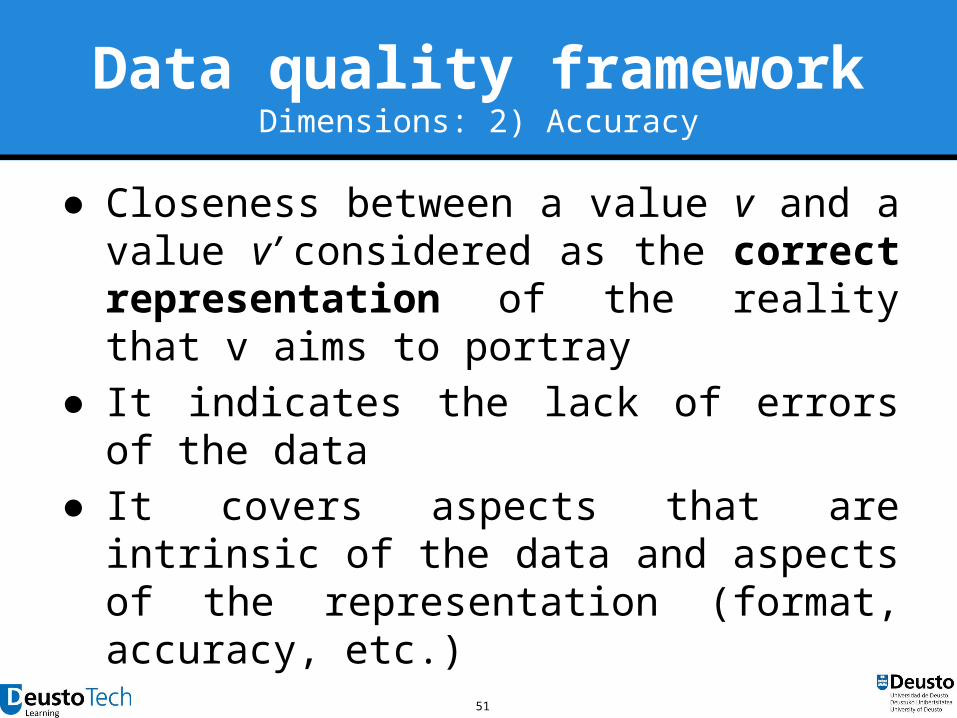
● Closeness between a value v and a value v’ considered as the correct representation of the reality that v aims to portray
● It indicates the lack of errors of the data● It covers aspects that are intrinsic of the data
and aspects of the representation (format, accuracy, etc.)
52
Data quality frameworkDimensions: 2) Accuracy (II)
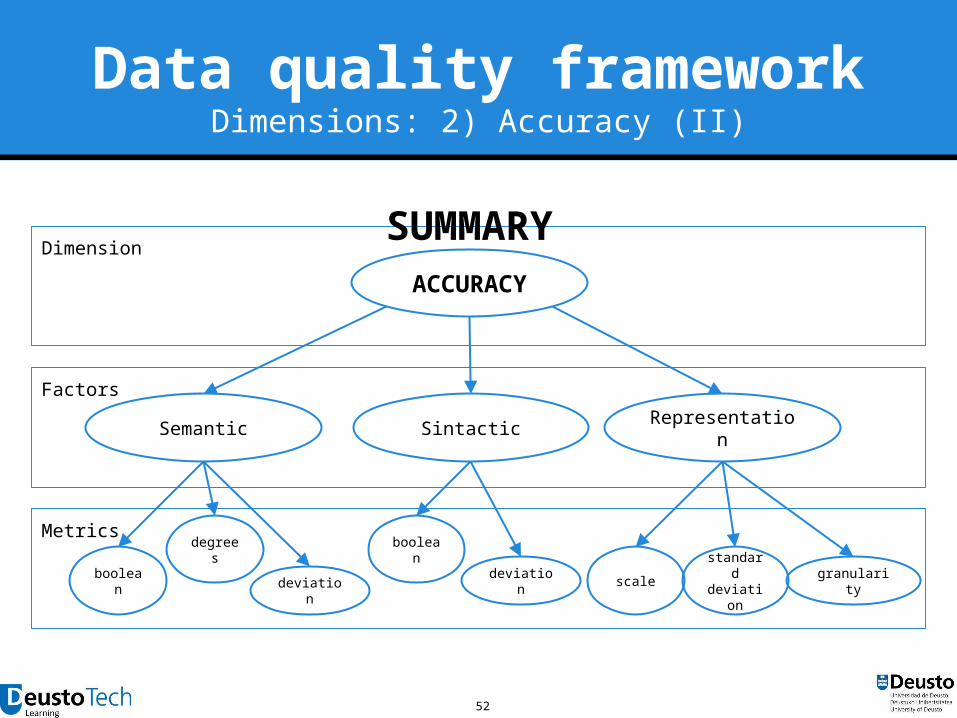
Dimension
Factors
Metrics
ACCURACY
Sintactic RepresentationSemantic
boolean
degrees
deviation
boolean
deviation scalestandard deviation
granularity
SUMMARY

53
Data quality frameworkDimensions: 2) Accuracy (III)
● Semantic accuracyo The closeness between a value v and a real value v’o We need to measure how well are represented real
world states within the information systemo Some problems that may arise
Data that do not correspond to any real world state● i.e. An student that does not exist
Data that correspond to a wrong real world state● i.e. Data that does not refer to the proper student
Data with errors in some attributes● i.e. Data that refer to the correct student but with some wrong
attribute
Factors: Accuracy

54
Data quality frameworkDimensions: 2) Accuracy (IV)
● Syntactic accuracyo It refers to the closeness that exist between a value v and
the elements of the domain Do We need to know if v corresponds to a correct value within
D, leaving aside if it corresponds to a real world valueo Some problems that may arise
Value errors: out-of-range values, orthographical errors, etc .● i.e. “Smiht” instead of “Smith” for a last name of a student● i.e. 338 years
Standardization errors: ● i.e. for genre, “0” or “1”, instead of “M” or “F”● i.e. in a foreign currency instead of €
Factors: Accuracy

55
● Boolean○ If data satisfies rules or not
● Standard deviation○ If the accuracy error is within the standard deviation
or not
Metrics: Accuracy
Data quality frameworkDimensions: 2) Accuracy (V)

56
Data quality frameworkDimensions: 2) Accuracy (VI)
Referentials vs. Dictionaries
Verify semantic accuracy Verify syntactic accuracy
<key, value> pair List of valid values for a given domain
The key represents an element or a state of the real world
A value represents an attribute of that element
57
Data quality frameworkDimensions: 2) Accuracy (VII)
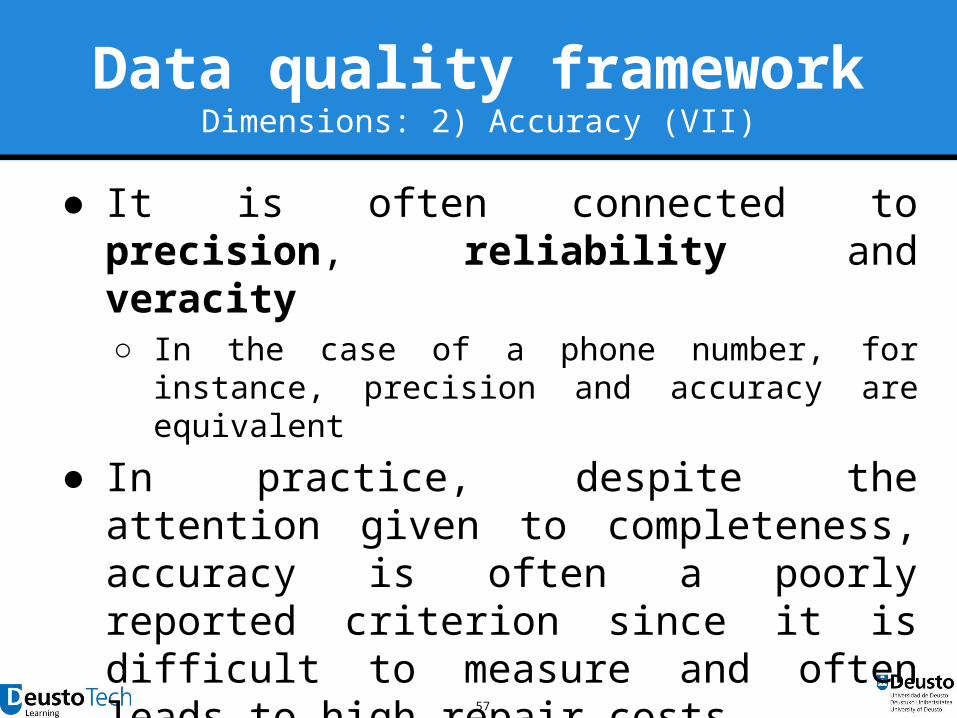
● It is often connected to precision, reliability and veracity○ In the case of a phone number, for instance, precision
and accuracy are equivalent
● In practice, despite the attention given to completeness, accuracy is often a poorly reported criterion since it is difficult to measure and often leads to high repair costs
● This is due to the fact that accuracy control and improvement requires external reference data
58
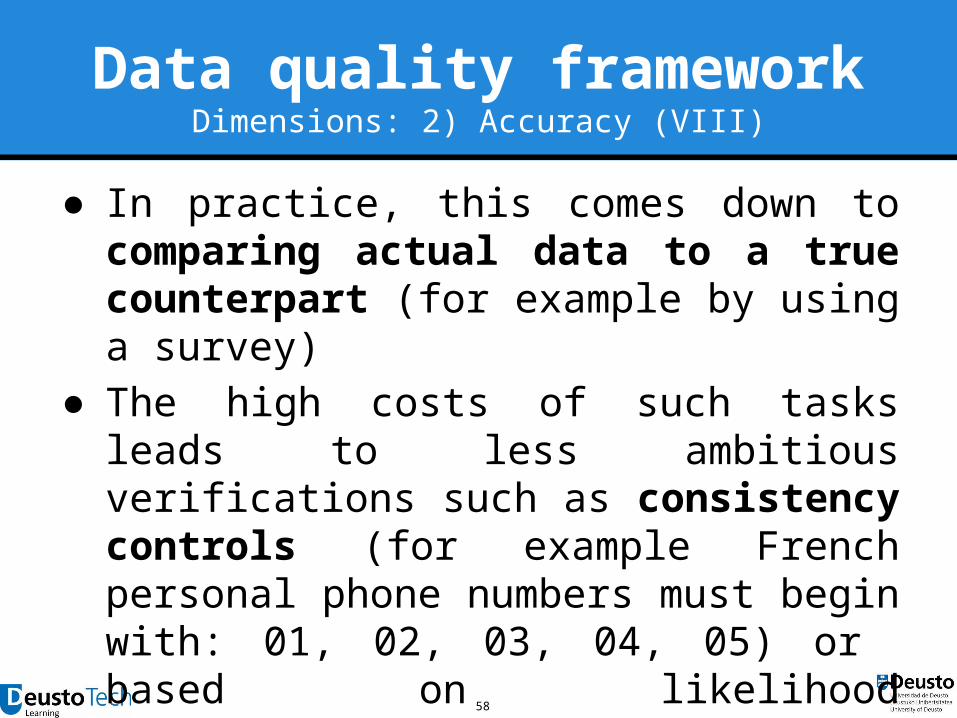
Data quality frameworkDimensions: 2) Accuracy (VIII)
● In practice, this comes down to comparing actual data to a true counterpart (for example by using a survey)
● The high costs of such tasks leads to less ambitious verifications such as consistency controls (for example French personal phone numbers must begin with: 01, 02, 03, 04, 05) or based on likelihood (disproportional ratios of men versus women)
59
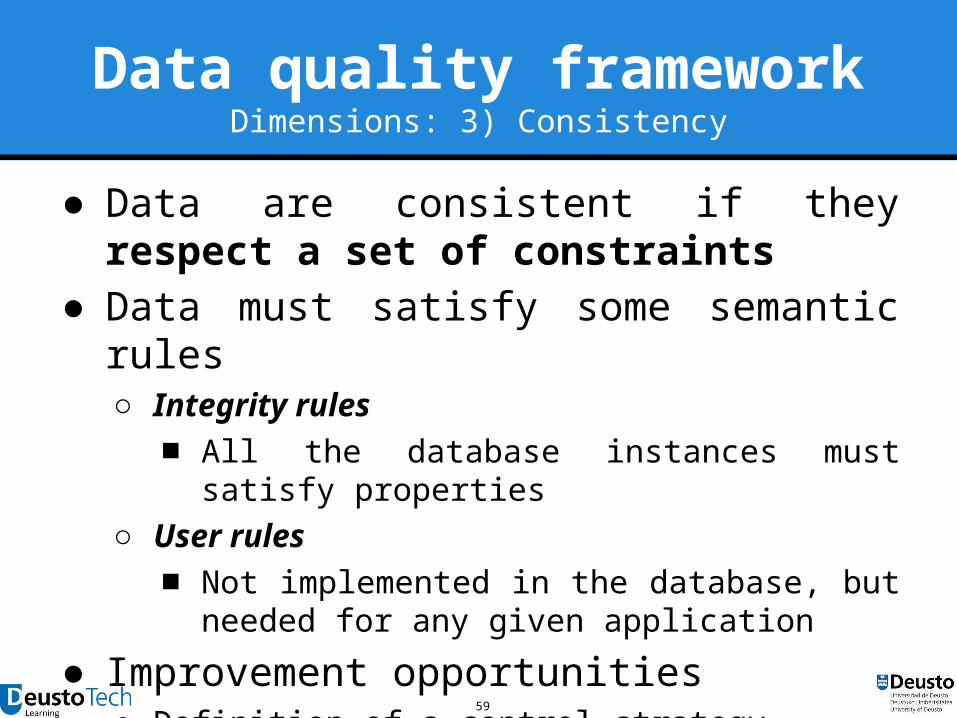
Data quality frameworkDimensions: 3) Consistency
● Data are consistent if they respect a set of constraints
● Data must satisfy some semantic rules ○ Integrity rules
■ All the database instances must satisfy properties○ User rules
■ Not implemented in the database, but needed for any given application
● Improvement opportunities○ Definition of a control strategy○ Comparison with another, apparently more reliable,
source

60
Data quality frameworkDimensions: 3) Consistency (II)
● A consistency factor is based on a rule, for example, a business rule such as “town address must belong to the set of French towns” or “invoicing must correspond to electric power consumption”○ Consistency can be viewed as a sub-dimension of
accuracy ● This dimension is essential in practice as
much as there are many opportunities to control data consistency

61
Data quality frameworkDimensions: 3) Consistency (III)
● Consistency can not be measured directly○ It is defined by a set of constraints
● Instead, we often measure the percentage of data which satisfy the set of constraints (and therefore deduce rate of suspect data)
● Consistency only gives indirect proof of accuracy
● In the context of data quality tools, address normalisation and data profiling processes use consistency and likelihood controls

62
Data quality frameworkDimensions: 3) Consistency (IV)
Metrics
Dimension
Factors
CONSISTENCY
Inter-relation integrity
Domain integrity
Rule
Intra-relation integrity
Rule Rule
62
SUMMARY

63
Data quality frameworkDimensions: 3) Consistency (V)
Factors: Consistency● Domain integrity
o Rule satisfaction over the content of an attribute i.e. age of the student must be between 0 and 120 years
● Intra-relation integrityo Rule satisfaction within attributes of the same table
Functional dependencies Value dependencies Conditional expressions
● Inter-relation integrityo Rule satisfaction among attributes of different tables
Inclusion dependencies (foreign key, referential integrity, etc.)

64
Data quality frameworkDimensions: 3) Consistency (VI)
Metrics: Consistency● Boolean
o If data satisfies rules or noto Granularity could be the cell or a set of cells
● Aggregationo Integrity ratio: % of data that satisfy the ruleso Since it can exist a variety of rules for a same
relationship (or group of relations), in general, we build a weighted sum of the results after measuring those rules

65
Data quality frameworkDimensions: 4) Relevancy
● Is the data useful for the task at hand?● Relevancy corresponds to the usefulness of
the data○ Database users usually access huge volumes of data
● Among all this information, it is often difficult to identify that which is useful○ In addition, the available data is not always adapted to
user requirements○ For this reason users can have the impression of poor
relevancy, leading to loss of interest in the data(base)

66
Data quality frameworkDimensions: 4) Relevancy (II)
● Relevancy is very important because it plays a crucial part in the acceptance of a data source
● This dimension, usually evaluated by rate of data usage, is not directly measurable by the quality tools

67
Data quality frameworkDimensions: 4) Relevancy (III)
● It indicates how updated is the datao Are they current enough for our needs?o Are they updated or obsolete?o Do we have the most recent data?o Do we update the data?
● It has a temporary perspectiveo When were those data created/updated?o When did we check those data?

68
Data quality frameworkDimensions: 4) Relevancy (IV)
68
Metrics
Dimension
Factors
RELEVANCY
VolatilityPresent Opportunity
boolean FrequencyOn time
SUMMARY
Temporary

69
Data quality frameworkDimensions: 4) Relevancy (V)
Factors: Relevancy● Present
o Are in force the data of my information system? A data model is a view of the entities and states of a given
reality in a given moment i.e.
● Student data (address, email addresses, etc.)● Grades (exercises, courses, etc.)
We need to measure the difference between existing data and valid data

70
Data quality frameworkDimensions: 4) Relevancy (VI)
Factors: Relevancy● Opportunity
o Are in force the data of my information system? How updated are my data for the task we have The data we have in our information system can be recently
updated but no relevant for the task in force for having arrived late
i.e.● Activity improvement obtained after having finished the
course● Teaching method improvement after having finished the
course We need to measure the moment of opportunity of our data

71
Data quality frameworkDimensions: 4) Relevancy (VII)
Factors: Relevancy● Volatility
o How unstable are my data? It characterizes the frequency within my data changes over
time It is an intrinsic characteristic of the nature of data i.e.
● Born date has 0 volatility● Average degree has high volatility
We need to measure the time interval within data are still valid

72
Data quality frameworkDimensions: 4) Relevancy (VIII)
Metrics: Relevancy● Present
o Temporary: query moment - first modification without update in the database
o Boolean: data is updated or not● Opportunity
o On time: if it is updated and arrived on time for the task in force
● Volatilityo Frequency: how often changes happen

73
Data quality frameworkDimensions: 5) Uniqueness
● It indicates the duplicity levels of the datao The duplicity happens when a same entity is
represented two or more times in the information system
o A same entity can be identified under different ways i.e. A teacher is identified by his/her email address; a student
is identified by the enrollment id. But some students could in the future become teachers.
o A same entity can be two times represented due to errors on the key i.e. an id badly digitalized
o A same entity can be repeated with different keys i.e. A teacher is identified by email address; but can have
more than one

74
Data quality frameworkDimensions: 5) Uniqueness (II)
Metrics
Dimension
Factors
UNIQUENESS
No-contradictionNo-duplicity
boolean boolean
SUMMARY

75
Data quality frameworkDimensions: 5) Uniqueness (III)
Factors: Uniqueness● No-duplicity
o There is duplicity if the same entity appears repeated Key values and attributes match (or are nulls in some triples)
● No-contradictiono There is contradiction if the same entity appears
repeated with different values Key values could be the same or not There are some differences in the values of some attributes
(not null)

76
Data quality frameworkDimensions: 5) Uniqueness (IV)
Metrics: Uniqueness● Boolean
o If the data is duplicated or noto If the data has contradictions or noto Granularity could be from the cell or from a given set
of cells
● Aggregationso No-duplication ratio: % of data that are not duplicatedo No-contradiction ratio: % of data that are not
duplicated with contradictions
77
Table of contents● Introduction● Why data quality?● Data lifecycle● Data quality framework● Data quality plan● ETL approach● Tools

78
Data quality planQuality model
Deter
min
e
Measure
StandardizeFix
Enrich
Rela
te
Consolidate
AnalyseData profiling
Data cleansingData improving
Data matching
1
23
4

79
Data quality plan1) Data profiling
● It permits to locate, measure, monitorize and report data quality problems
● It is a project itself● Two types
o Structure Position Format
o Content

80
Data quality plan1) Data profiling (II)
● Structure profilingo It consists on the data analysis without considering its
meaningo Semi-automatic and massiveo Column profiling

81
Data quality plan1) Data profiling (III)
● Structure profilingo Dependency profiling
o Redundancy profiling Referential integrity Foreign keys

82
Data quality plan1) Data profiling (IV)
● Structure profilingo Example: for a given student
Name● How much students do have name and last name?● % of syntactic errors? (badly written)● Consistency between the name and the sex?
Contact phone number● Pattern recognition: 999 999 999 - 999.999.999, etc.● Length● Strange characters: . , -
etc.

83
Data quality plan1) Data profiling (V)
● Content profilingo It analyses in depth the data and its meaningo It is specific for each fieldo It is realized in combination with dictionaries, specific
components of data treatment, etc.

84
Data quality plan2) Data cleansing
● We implement a reliable methodology of data quality ○ Normalization○ Deduplication○ Standardization
● It permits:○ Determine and separate a field elements relocating it
in its proper field○ Format standardization○ Fix errors within the data○ Data enriching

85
Data quality plan2) Data cleansing (II)
● The data is normalized so that there is a common unit of measure for items in a class○ For example: feet, inches, meters, etc. are all
converted to one unit of measure○ Adecuación de un dato a un formato
esperado○ Ejemplo: NIF
■123456789■0123456789B

86
Data quality plan2) Data cleansing (III)
● Or it contains duplicate records/items and may have missing or incomplete descriptions
● Fixes misspellings, abbreviations, and errors● The values are also standardized so that the
name of each attribute is consistent● For example: inch, in., and the symbol “ are all
shown as inch

87
Data quality plan3) Data enriching
● Enrichment of data with more attributes, images, and specifications
● We add some data that did not exist before

88
Data quality plan4) Data matching
● It is used to: o Duplicate detection → unicityo Establish a relationship between two data sources that
did not have linking fields beforeo Identify a same entity within different sources that
provide different observations● Two types
o Deterministic By identifying the same code (A = A) or by relation of codes
(A = B)o Probabilistic
A = B in a given % over assessed distances and lengths

89
Data quality plan4) Data matching (II)
● Data consolidationo It usually consists on the fusion of two or more records
in the sameo It has been traditionally used for duplicate detectiono It is based on business rules
Record survival Best record Best attribute of a given record
o The result is called Golden Record

90
Table of contents● Introduction● Why data quality?● Data lifecycle● Data quality framework● Data quality plan● ETL approach● Tools

91
ETL approachDefinition and characteristics
● An ETL tool is a tool thato Extracts data from various data sources (usually
legacy data)o Transforms data
from → being optimized for transaction to → being optimized for reporting and analysis synchronizes the data coming from different
databases data cleanses to remove errors
o Loads data into a data warehouse

92
ETL approachWhy do I need it?
● ETL tools save time and money when developing a data warehouse by removing the need for hand-coding
● It is very difficult for database administrators to connect between different brands of databases without using an external tool
● In the event that databases are altered or new databases need to be integrated, a lot of hand-coded work needs to be completely redone

93
ETL approachKettle
Project Kettle
Powerful Extraction, Transformation and Loading (ETL) capabilities using an
innovative, metadata-driven approach

94
ETL approachKettle (II)
● It uses an innovative meta-driven approach● It has a very easy-to-use GUI● Strong community of 13,500 registered
users● It uses a stand-alone Java engine that
process the tasks for moving data between many different databases and files

95
ETL approachKettle (III)

96
ETL approachKettle (IV)
Source: http://download.101com.com/tdwi/research_report/2003ETLReport.pdf
97
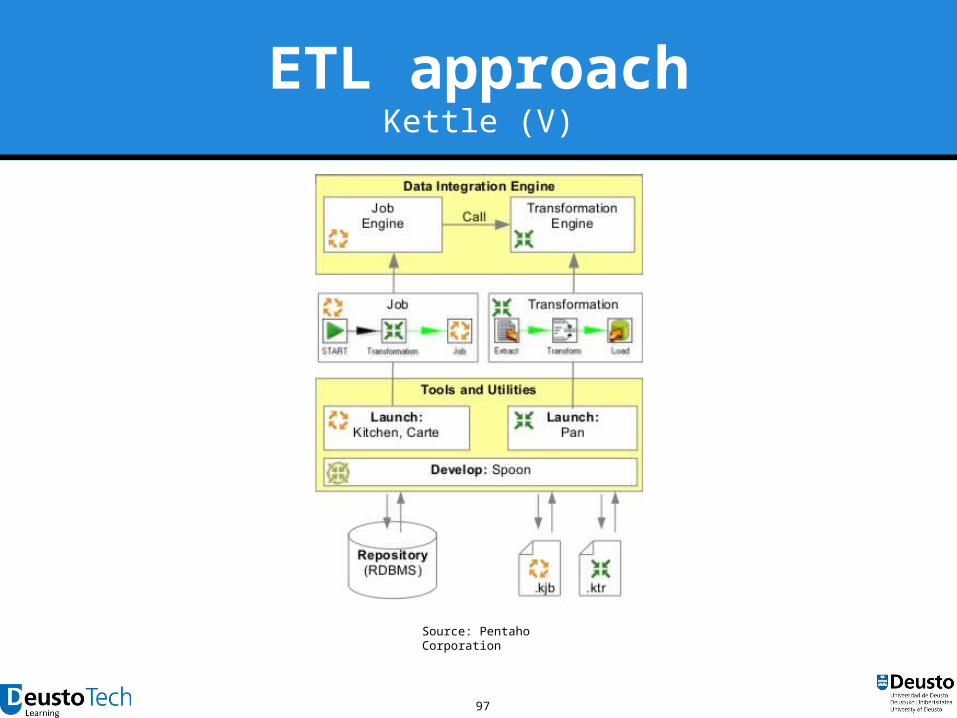
ETL approachKettle (V)
Source: Pentaho Corporation

98
ETL approachKettle (VI)
● Datawarehouse and datamart loads● Data integration● Data cleansing● Data migration● Data export● etc.

99
ETL approachTransformations
● String and Date Manipulation● Data Validation / Business Rules● Lookup / Join● Calculation, Statistics● Cryptography● Decisions, Flow control● Scripting● etc.

100
ETL approachWhat is good for?
● Mirroring data from master to slave● Syncing two data sources● Processing data retrieved from multiple
sources and pushed to multiple destinations
● Loading data to RDBMS● Datamart / Datawarehouseo Dimension lookup/update step
● Graphical manipulation of data

101
Table of contents● Introduction● Why data quality?● Data lifecycle● Data quality framework● Data quality plan● ETL approach● Tools

102
Tools
Source: https://www.informatica.com/data-quality-magic-quadrant.html#fbid=ln22wvh0trz
103
Tools (II)
Interactive Data Transformation Tools (IDTs)
1. Pentaho Data Integration: Kettle PDI2. Talend Open Studio
3. DataCleaner4. Talend Data Quality
5. Google Refine6. Data Wrangler
7. Potter's Wheel ABC

104
References[CampbellOblinger2007] Campbell, John P., Peter B. DeBlois, and Diana G. Oblinger. "Academic analytics: A new tool for a new era." Educause Review 42.4 (2007): 40.[Clow2012] Clow, Doug. "The learning analytics cycle: closing the loop effectively." Proceedings of the 2nd International Conference on Learning Analytics and Knowledge. ACM, 2012.[Cooper2012] Cooper, Adam. "What is analytics? Definition and essential characteristics." CETIS Analytics Series 1.5 (2012): 1-10.[DA09] J. Dron and T. Anderson. On the design of collective applications. Proceedings of the 2009 International Conference on Computational Science and Engineering, 04:368–374, 2009.[DronAnderson2009] Dron, J., & Anderson, T. (2009). On the design of collective applications. In Proceedings of the 2009 International Conference on Computational Science and Engineering, 4, 368–374.[Dyckhoff2010] Dyckhoff, Anna Lea, et al. "Design and Implementation of a Learning Analytics Toolkit for Teachers." Educational Technology & Society 15.3 (2012): 58-76.[Eaton2012] Chris Eaton, Dirk Deroos, Tom Deutsch, George Lapis & Paul Zikopoulos, “Understanding Big Data: Analytics for Enterprise Class Hadoop and Streaming Data”, p.XV. McGraw-Hill, 2012.[Eli11] Tanya Elias. Learning analytics: definitions, processes and potential. 2011.[GayPryke2002] Cultural Economy: Cultural Analysis and Commercial Life (Culture, Representation and Identity series) Paul du Gay (Editor), Michael Pryke. 2002.

105
References (II)[HR2012] NMC Horizon Report 2012 http://www.nmc.org/publications/horizon-report-2012-higher-ed-edition[Jenkins2013] BBC Radio 4, Start the Week, Big Data and Analytics, first broadcast 11 February 2013 http://www.bbc.co.uk/programmes/b01qhqfv[Khan2012] http://www.emergingedtech.com/2012/04/exploring-the-khan-academys-use-of-learning-data-and-learning-analytics/ [LACE2013] Learning Analytics Community Exchange http://www.laceproject.eu/ [LAK2011] 1st International Conference on Learning Analytics and Knowledge, 27 February - 1 March 2011, Banff, Alberta, Canada https://tekri.athabascau.ca/analytics/[Mazza2006] Mazza, Riccardo, et al. "MOCLog–Monitoring Online Courses with log data." Proceedings of the 1st Moodle Research Conference. 2012.[Mazza2012] Riccardo Mazza, Marco Bettoni, Marco Far , and Luca Mazezola. Moclog–monitoring online ́�courses with log data. 2012.[Reinmann2006] Reinmann, G. (2006). Understanding e-learning: an opportunity for Europe? European Journal of Vocational Training, 38, 27-42.[SiemensBaker2012] Siemens & Baker (2012). Learning Analytics and Educational Data Mining: Towards Communication and Collaboration. Learning Analytics and Knowledge 2012. Available in .pdf format at http://users.wpi.edu/~rsbaker/LAKs%20reformatting%20v2.pdf

Enhancing educational data quality in heterogeneous learning contexts using
Pentaho Data Integration
Learning Analytics Summer Institute, 2015
Alex Rayón Jerez@alrayon, [email protected]
June, 22nd, 2015