enhancing tensile strength of fdm parts using thermal
TRANSCRIPT

Enhancing Tensile Strength of FDM parts using Thermal Annealing and
Uniaxial Pressure
by
RHUGDHRIVYA RANE
Presented to the Faculty of the Graduate School of
The University of Texas at Arlington in Partial Fulfillment
of the Requirements
for the Degree of
MASTER OF SCIENCE IN MECHANICAL ENGINEERING
THE UNIVERSITY OF TEXAS AT ARLINGTON
December 2018

ii
Copyright © by Rhugdhrivya Rane 2018
All Rights Reserved
iii
Acknowledgements
I would firstly like to thank Dr. Robert Taylor for mentoring and guiding
me throughout my coursework and being a constant source of motivation. I would
also like to thank Dr. Ankur Jain and Dr. Ashfaq Adnan for not only providing me
with their valuable feedback but also for allowing me to use their lab equipment as
and when necessary.
I would like to thank Mr. Hardik Jain for helping me to obtain the cross-
sectional images of the test parts. I am deeply thankful to Mr. Sangram Advirkar
for helping me to print the test parts. I would like to extend my gratitude to my
parents for being supportive of my academic pursuits. I would especially like to
dedicate this work to my mother, Anjana, as none of this would be possible without
her.
December 5, 2018

iv
Abstract
Enhancing Tensile Strength of FDM parts using Thermal Annealing and Uniaxial
Pressure
Rhugdhrivya Rane, MS
The University of Texas at Arlington, 2018
Supervising Professor: Robert Taylor
Additive manufacturing has been a revolutionary and disruptive technological
development in the field of design and manufacturing with Fused deposition
modelling (FDM) being at the forefront of this technology. But it is seen that parts
printed using FDM suffer from an inherent deficiency of weak tensile strength in
the out of plane direction (z-direction) thus limiting their application. This issue of
weak z-direction strength is due to the weak Inter-bead bond strength of adjacent
polymer interfaces. The purpose of this work is to increase this Inter-Bead bond
strength thus increasing the overall tensile strength of the part. In this work, FDM
was used to print tensile specimens made of Acrylonitrile Butadiene Styrene
(ABS), which were subjected to varying values of isothermal heating and uniaxial
pressure which was along the z-direction. Multiple values of temperature and
pressure were chosen to investigate their effect of the deformation of the part and

v
try to maintain geometric accuracy. The thermally annealed parts were then
subjected to tensile loading to check the increase in strength. It was seen that when
the parts were subjected to only thermal annealing there was a slight increase in the
tensile strength of the part. But when the parts were subjected to a combination
isothermal heating and pressure the increase in strength was considerably more as
compared to only thermal annealing for the same time period. A cross sectional
view of the layer to layer bonding was studied under the microscope which showed
a change in the mesostructure of the part. From previous studies it had been seen
that when two polymer interfaces have intimate contact while undergoing thermal
annealing above the glass transition temperature Reptation occurred. This theory of
Reptation was seen to be the reason for the considerable increase in strength and
lead changes in the mesostructure of the part. The investigations done in this study
provide ground work to increase the total structural strength of the parts with a
special focus on the inter laminar bonding which affects the z-direction strength.
vi
TABLE OF CONTENTS
Acknowledgements ................................................................................................ iii
Abstract .................................................................................................................. iv
List of Tables .......................................................................................................... x
Chapter 1 Introduction .......................................................................................... 11
Chapter 2 Background .......................................................................................... 13
2.1 Additive Manufacturing .......................................................................... 13
2.2 Fused Deposition Modeling .................................................................... 15
2.2.1 Operation .............................................................................................. 15
2.2.2 Materials .............................................................................................. 16
2.3 Parameters Affecting strength of FDM parts .............................................. 17
2.3.1 Infill Percentage ................................................................................... 17
2.3.2 Infill Pattern ......................................................................................... 18
2.3.3 Number of Perimeter Shells ................................................................. 18
2.3.4 Print Orientation ................................................................................... 19
2.3.5 Layer Height ........................................................................................ 19
2.3.6 Flow Rate ............................................................................................. 19
2.4 Mechanical Properties of FDM Parts .......................................................... 20
2.5 Bond Formation and Strength ..................................................................... 21
2.5.1 Intimate Contact ................................................................................... 23
2.5.2 Thermoplastic Healing ......................................................................... 24
vii
2.5.3 Reptation Theory of Chain Mobility .................................................... 25
2.6 Effect of Temperature on Viscosity of Amorphous Polymers ................... 31
Chapter 3 Methodology ........................................................................................ 32
3.1 Test Specimens Design ............................................................................... 33
3.2 Print Parameters and Dogbone Fabrication ................................................ 34
3.3 Thermal Annealing and Uniaxial Pressure ................................................. 36
3.4 Testing ........................................................................................................ 42
Chapter 4 Results .................................................................................................. 43
4.1 Characterization of Tensile Strength for Specimen Set 1 ........................... 43
4.1.1 No Post Processing .............................................................................. 43
4.1.2 Isolated Thermal Annealing ................................................................. 44
4.1.3 Thermal Annealing and Uniaxial Pressure .......................................... 47
4.2 Characterization of Tensile Strength for Specimen Set 2 ........................... 52
4.2.1 No Post Processing .............................................................................. 52
4.2.2 Isolated thermal annealing ................................................................... 52
4.2.3 Thermal Annealing and Uniaxial Pressure .......................................... 57
4.3 Effect of Print Parameters on Strength ....................................................... 60
Chapter 5 Conclusion ............................................................................................ 62
Chapter 6 Future Work ......................................................................................... 64
Chapter 7 References ............................................................................................ 65

viii
List of Illustrations
Figure 1: Different infill patterns used in FDM . .................................................. 18
Figure 2: Parts printed using varying numbers of perimeter shells. ..................... 18
Figure 3: Stages of bond formation in FDM . ....................................................... 22
Figure 4: Temporal disengagement of polymer chains from the
initial tube . ........................................................................................................... 26
Figure 5: Minor chains at different times . ........................................................... 27
Figure 6: Conformation of chains at the interface before and
after diffusion . ...................................................................................................... 28
Figure 7: Disengagement of chain from the initial tube near an interface . .......... 29
Figure 8: Tensile test specimen with modified geometry. .................................... 33
Figure 9: Printing of Dogbone specimens in Z- direction. ................................... 35
Figure 10: Custom built fixture to hold dogbones. ............................................... 36
Figure 11: Uniaxial pressure being applied on the test specimens using
a fixture. ................................................................................................................ 37
Figure 12: Ultem parts placed to prevent distortion of specimen contours. ......... 38
Figure 13: Thermocouple lot indicating time required to steady state. ................ 40
Figure 14: Tensile testing of dogbone specimens ................................................. 42
Figure 15: Stress- Strain curve for non- post processed parts. ............................. 44
Figure 16: Stress-Strain curve for experiments with variable
time (High settings).............................................................................................. 46

ix
Figure 17: Stress-Strain curves for experiments with variable
temperature (High settings).................................................................................. 47
Figure 18: Stress-Strain curve for 120°C and variable
pressure (High setting). ......................................................................................... 50
Figure 19: Stress-Strain curve for 140°C and variable
pressure (High setting). ......................................................................................... 50
Figure 20: Comparison of ultimate tensile strength for variable
values of temperature and pressure (High setting). .............................................. 51
Figure 21: Stress- Strain curve for non-post processed
parts (Low settings)............................................................................................... 52
Figure 22: Stress- Strain curve for experiments with temperature
variable (Low settings). ........................................................................................ 54
Figure 23: Cross-section of parts subjected to Isolated heat
treatment (Low settings) ....................................................................................... 55
Figure 24: Plot indicating increase in Ultimate tensile strength with
variable temperature. (Low settings) .................................................................... 55
Figure 25: Comparison of ultimate tensile strength for variable values
of temperature and pressure (Low setting). .......................................................... 60
x
List of Tables
Table 1: Print Parameters used to print the dogbone specimens. ......................... 34
Table 2: List of all the experiments performed. .................................................... 41
Table 3: Tensile test data of non-post processed parts (High). ............................. 43
Table 4: List of various combinations of temperature and time
used (High settings). ............................................................................................. 45
Table 5: Increase in ultimate strength with time as variable (High settings) ........ 45
Table 6: Increase in ultimate strength with temperature as
variable (High settings) ......................................................................................... 46
Table 7: List of various combinations of temperatures and pressures
used (High settings). ............................................................................................. 48
Table 8: Increase in ultimate strength with temperature and pressure as
variables (High settings) ....................................................................................... 49
Table 9: List of various combinations of temperature used (Low settings). ........ 53
Table 10: Increase in the ultimate strength for temperature
as variable (Low settings) ..................................................................................... 56
Table 11: List of various combinations of temperatures and pressures
used (Low settings). .............................................................................................. 57
Table 12: Increase in ultimate strength of parts with variable temperature
and pressure (Low settings). ................................................................................. 58

11
Chapter 1 Introduction
Additive manufacturing (AM) is a disruptive manufacturing technique as it
enables fabrication of complex part geometries which were previously considered
difficult to manufacture using conventional methods. AM has gained popularity
due to its low cost, low production capability to print highly complex and
customizable parts with a multitude of materials. Fused Deposition Modeling
(FDM) is one of the most commonly used additive manufacturing technologies in
terms of number of parts produced, printers, and printer manufacturers worldwide
[1]. But parts fabricated using FDM cannot be used for most engineering
applications due to their insufficient and anisotropic mechanical properties
especially in the out of plane (z-plane) direction. This deficiency in mechanical
properties is due to the weak Inter-laminar bonding in the adjacent layers of FDM
parts leading to an overall reduction in part strength [1]. Thus, to enhance the use
of FDM parts in actual engineering application and not just artistic renderings, the
overall anisotropy of the parts has to be reduced while increasing the strength.
The aim of this study is to investigate the increase in tensile strength of the
FDM parts by the application of post processes such as: 1) thermal annealing and
2) thermal annealing accompanied with a unidirectional mechanical pressure in the
Z- direction. The increase in the bond length and its corresponding effect on the
tensile strength is also studied to provide a better understanding regarding the

12
increase in strength. Therefore, we experimentally tried to investigate the effect of
the combinations of the above given parameters on the tensile strength.
13
Chapter 2 Background
2.1 Additive Manufacturing
Manufacturing techniques have constantly been evolving to better
accommodate the manufacturing of complex and dimensionally accurate parts.
Additive Manufacturing (AM) was one such technique which allowed for the
fabrication of complex geometries with relative ease. In AM, a computer-generated
model is used to fabricate the part in layer by layer fashion using either metal
powder or plastic feedstock. AM uses digital technology to build the printed part
rather than using the traditional mold manufacturing, which involves complex
designing and is time consuming [2]. Unlike conventional subtractive
manufacturing methods where material is machined away to obtain the desired
geometries and then assembled to form the final product, AM only adds material
layer by layer to build the desired part. This not only reduces the amount of material
wasted and the assembly time but also provides the freedom to manufacture far
more complex geometries. AM has accentuated the freedom of designing and
fabricating parts because internal features and complex, previously non-viable
geometries can easily be fabricated using AM [3].
The AM processes have been divided into seven categories by the ASTM
F42 committee in an attempt to standardize the terminology [4]. These processes
vary from one another based on the method of material deposition, the energy

14
source used, and the state of the build material used (wire feedstock, liquid, powder
or sheets). These processes are listed as follows:
1) Binder jetting: A liquid bonding agent is selectively deposited to join powder
materials.
2) Directed energy deposition: Focused thermal energy (Laser, Electron beam or
Plasma) is used to fuse materials by melting as they are being deposited.
3) Material extrusion: Filament is selectively dispensed through a heated nozzle or
orifice.
4) Material jetting: Droplets of build material such as photopolymer or wax are
selectively deposited.
5) Powder bed fusion: Thermal energy is used to selectively fuse regions of a
powder bed. Powders may be metals or polymers.
6) Sheet lamination: Sheets of material are bonded to form an object.
7) Vat photopolymerization: Liquid photopolymer in a vat is selectively cured by
light-activated polymerization. One or more lasers are used as the energy source to
cure the photopolymer.
15
2.2 Fused Deposition Modeling
Fused deposition modeling (FDM) or Fused Filament Modeling (FFF) is
one of the most popular and rapidly growing AM technologies with growing
application in finished part manufacturing [1]. FDM was known as rapid
prototyping technology as it involved printing rudimentary 3D designs for visual
aid or presentation [5]. But recently there has been an increase in the use of FDM
to manufacture finished parts [1]. The popularity of FDM is also due to its
comparatively low costs and simple feedstock to other AM technologies [6].
2.2.1 Operation
FDM systems build 3D objects layer by layer from a CAD design. In FDM,
a filament of thermoplastic material is forced through a heated liquefier with the
help of a pinch roller. A gantry moves the print nozzle in the horizontal x-y direction
while depositing the material on the build surface [1]. The three-axis movement is
completed by either the bed moving downwards or the nozzle head moving
upwards by a distance equal to that of the specified layer height. Nozzles diameters
can vary from 0.010 to 0.05 in [7]. A continuous positive force required for
extrusion is provided by the rollers driving the incoming filament [7]. This filament
fed into the liquefier melts and the solid portion of the filament acts as a piston
pushing the melt through the nozzle [1].
16
2.2.2 Materials
FDM works best with polymers that are amorphous in nature rather than
highly crystalline polymers. This is because in FDM the extrusion takes place in
the form of a viscous paste. As amorphous polymers do not have a distinct melting
point but rather the viscosity lowers with increasing temperature. Thus, the
viscosity at which the amorphous polymers can be extruded is high enough for it to
maintain the extruded shape and solidify quickly. Also, when material is added in
an adjacent road or as a new layer it can bond easily with the previously extruded
material [5].
The most common amorphous polymer used in FDM is Acrylonitrile
Butadiene Styrene (ABS). ABSplus material is the updated version of ABS which
is commercially available. Also, Stratasys provides its own blends of ABS namely
ABS-M30 (stronger and tougher than standard ABS) and ABS-M30i
(Biocompatible material) [8]. The ABSi material provides a translucent effect with
properties similar to ABS.
In applications where ABS cannot fulfill the requirements a PC- based
material, formulated to ISO 10993-1 and USP Class VI requirements, is used.
ULTEM 9085 is another material that has been developed with favorable flame,
smoke and toxicity (FST) ratings and thus is suitable for use in aerospace and
marine applications. Polyphenylsulphone (PPSF) is another sophisticated material
which can be used in applications that require improved heat deflection [5].
17
2.3 Parameters Affecting strength of FDM parts
Apart from the strength of the bulk material used, the overall strength of
FDM parts is largely affected by the various printing and slicing parameters. The
effect of the parameters on strength have been discussed in the upcoming sections.
These parameters play a crucial role in this study as they provide us with the means
to compare and test the effect of the post printing thermal annealing and uniaxial
pressure on parts printed with optimal print settings and parts printed with below
par print settings.
2.3.1 Infill Percentage
Infill refers to the amount of material required to build the part. Infill
percentage is the percentage value of the amount of material used to manufacture
the part with respect to the volume of the part. As infill percentage increases the
part becomes heavier and denser. Thus, infill percentage directly correlates to part
strength, as infill percentage goes up the parts exhibit higher values of stiffness and
strength.

18
2.3.2 Infill Pattern
Various infill patterns are available for parts printed in FDM. These can be
broadly classified as Rectilinear, Diagonal, Hexagonal, Honeycomb, Hexagonal
etc. Some of these can be seen in Figure 1.
Figure 1: Different infill patterns used in FDM [9].
2.3.3 Number of Perimeter Shells
Perimeter shells are loops formed around the internal raster by the extruder
as shown in Figure 2. The number of perimeter shells can be specified in the slicer
by the user. An increase in the number of shells for printed tends to increase total
strength of the part.
Figure 2: Parts printed using varying numbers of perimeter shells [10].
19
2.3.4 Print Orientation
FDM parts can be printed using different plane orientations. The orientation
of the printed part dictates the mechanical strength of the parts. Parts printed using
FDM are the weakest when loaded along the Z- direction (Out of plane). This
results in anisotropic properties of FDM parts. Thus, to get optimized strength the
orientation of the print should be in such a way that the direction of loading should
not coincide with the build direction.
2.3.5 Layer Height
FDM parts are built in a layer wise fashion by extruding one layer on top of
the other. The layer height affects the surface finish of the part and can be modified
in the slicer. Though smaller layer heights lead to a better surface finishes there is
a trade-off between the layer height and the amount of print time needed, decreasing
the layer height leads to larger print times.
2.3.6 Flow Rate
Flow rate of the extruded material through the nozzle has a significant effect
on the total strength of the parts. As the flow rate increases the mesostructure of the
FDM parts is affected leading to a decrease in the size of the voids and an increase
in the contact area between adjacent layers. This leads to considerably larger values
of ultimate tensile strength for parts printed with higher flow rates.
20
2.4 Mechanical Properties of FDM Parts
Though FDM is one of the most popular AM technologies due to its low
cost of operation and comparatively cheap feedstock it has many limitations to it.
The mechanical properties of the parts fabricated using FDM largely depend on the
material, processing and geometric details [11]. It is seen that the mechanical
properties of these parts are affected by various print parameters like build
orientation [12], layer thickness [13,14], air gap [15,16] and printing temperatures
[17], leading to orthotropic properties. One of the major limitations is that parts
fabricated using FDM fail to match the mechanical properties exhibited by similar
parts manufactured using conventional manufacturing techniques (injection
molding). This depreciation in mechanical properties is due to two primary factors:
porosity and imperfect weld-lines [18]. As FDM uses circular nozzles to print parts.
the rounded features of the deposited polymer melt do not stack perfectly leading
to inherent porosity [19]. Also, long void spaces are present, both within a build
plane and between planes. Thus, even when there is intimate contact between the
polymer traces the interface strength is not comparable to that of the bulk polymer
[18]. The interfaces are formed when molten polymer is extruded onto previously
deposited polymer melt which has cooled down to a lower temperature. These
interfaces act as points of failure initiations giving FDM parts orthotropic
properties. Therefore, parts printed using FDM are inherently highly anisotropic in
nature with the weakest loading direction being in the out of plane or Z-direction.

21
The interlaminar bond-forming processes can be improved by using higher
temperature and lower deposition rates, but these changes lead to poorer geometric
control, lower surface quality and longer print times [18]. For FDM parts to be used
as final use parts their mechanical properties need to be drastically improved and
should be comparable with that of the bulk material.
2.5 Bond Formation and Strength
In ideal conditions a bond can be formed by bringing the surfaces as close
as the equilibrium spacing of the atoms such that the attractive and repulsive forces
of the surface molecules are balanced. The net potential energy of such a system is
at a minimum and is equal to the energy with which the atoms are bonded. But due
to surface asperities and the complex nature of polymer molecules, only one in a
billion atoms forms such a bond along a real surface. Thus, the joint strength is only
one-billionth of the theoretical strength that can be achieved [20]. Thus, to enhance
a joint strength application of heat and pressure are the critical factors. In FDM, the
formation of bonds among the polymer filaments is driven by the thermal energy
of the polymer filaments. The temperature history plays a major role in the bond
quality formed which in turn affect the mechanical properties of the part. The
growth of the neck formed between the two adjacent filaments and the thermal
healing are the major factors affecting the bond quality. The sequential stages of
22
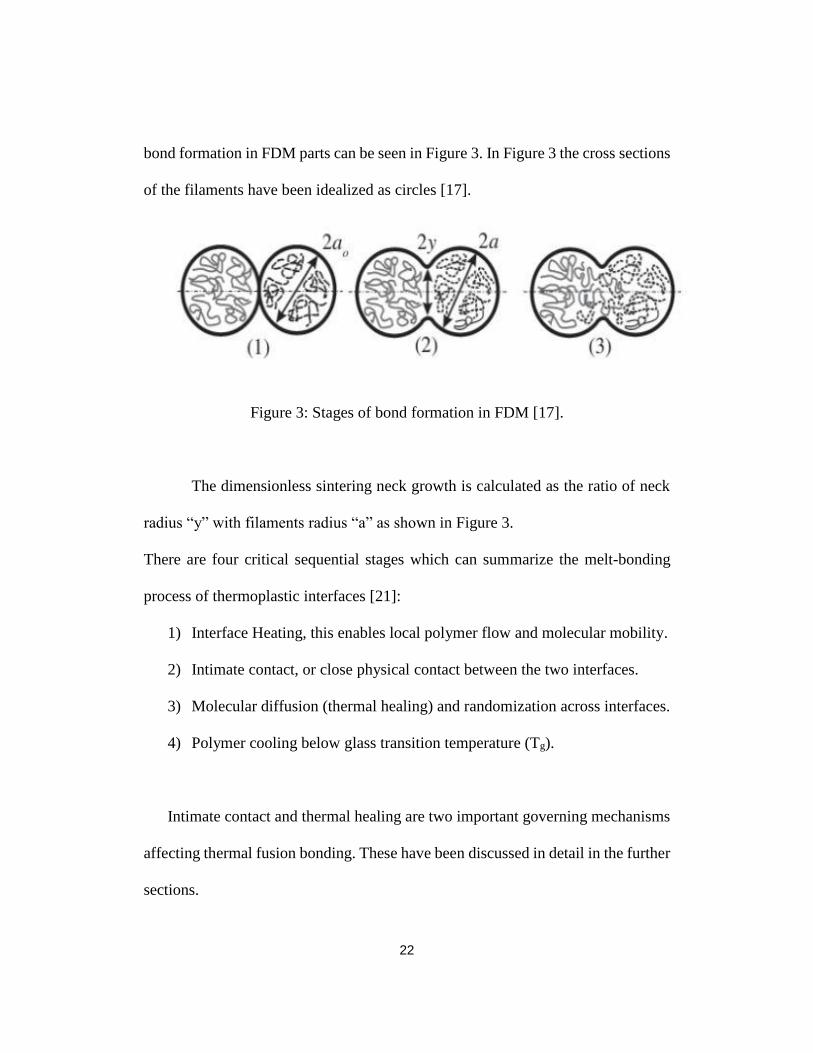
bond formation in FDM parts can be seen in Figure 3. In Figure 3 the cross sections
of the filaments have been idealized as circles [17].
Figure 3: Stages of bond formation in FDM [17].
The dimensionless sintering neck growth is calculated as the ratio of neck
radius “y” with filaments radius “a” as shown in Figure 3.
There are four critical sequential stages which can summarize the melt-bonding
process of thermoplastic interfaces [21]:
1) Interface Heating, this enables local polymer flow and molecular mobility.
2) Intimate contact, or close physical contact between the two interfaces.
3) Molecular diffusion (thermal healing) and randomization across interfaces.
4) Polymer cooling below glass transition temperature (Tg).
Intimate contact and thermal healing are two important governing mechanisms
affecting thermal fusion bonding. These have been discussed in detail in the further
sections.

23
2.5.1 Intimate Contact
Intimate contact represents the amount of physical area contact that has been
established between two surfaces after they are brought in contact [22]. This
intimate contact is affected because of the presence of surface asperities as no
materials have perfectly smooth surfaces. Due to these asperities perfect contact is
not established, and the total contact area is reduced. But when heat and pressure
are applied the surface asperities start to deform and there is an increase in the total
contact area of the surfaces. As thermoplastics have temperature dependent
viscosity an increase in temperature facilitates the flow, allowing for greater
contact.
Degree of intimate contact (Dic) is defined as the fraction of the total surface
area that is in contact. Dic is a function of various factors such as applied
temperature and pressure, duration of application, and a surface roughness
parameter characterizing asperities. A model was developed by Dara and Loos to
describe the intimate contact between the surfaces. In their model they assumed the
asperities along the imperfect surface to be in the form of a wave made up of
rectangular elements of varying sizes. This model was further developed by Lee
and Springer. In the Lee-Springer model the rectangular elements were idealized to
be identically sized and the dependence of intimate contact on applied pressure and
temperature-dependent viscosity was shown. The same model was developed by
Mantell and Springer to accommodate for time-varying properties and thus explain
24
intimate contact. In the Mantell-Springer model the applied force is assumed to
cause deformation of the rectangular elements thus leading to an increase in area of
contact. In this work we investigate the effect of increase in inter-laminar bond
strength due to a uniaxial pressure which leads to an increase in intimate contact.
2.5.2 Thermoplastic Healing
FDM parts built with rasters oriented at bias angles to the primary axis of
the structure morphologically resemble laminated composite materials. Each layer
of FDM parts can be treated as a composite lamina with anisotropic strength and
stiffness [23]. Therefore, the interlaminar bond formation in FDM parts is like that
as seen in composite structures and occurs due to the phenomenon of thermoplastic
healing. When two thermoplastics are brought into good contact above the glass
transition temperature, the interface starts to gradually disappear and the
mechanical strength at the interface starts to develop due to thermoplastic or crack
healing [21]. This thermoplastic healing is primarily a result of polymer chain
diffusion across the interface. This chain diffusion can be explained using the
Reptation theory proposed by de Gennes.
25
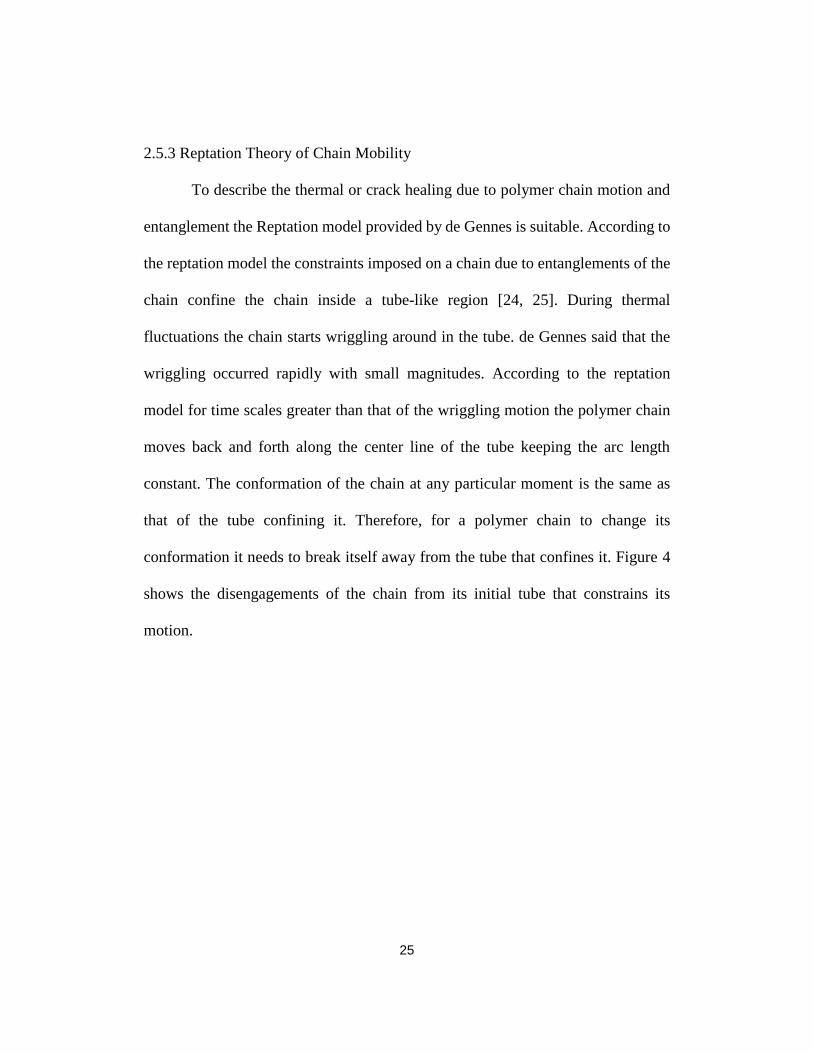
2.5.3 Reptation Theory of Chain Mobility
To describe the thermal or crack healing due to polymer chain motion and
entanglement the Reptation model provided by de Gennes is suitable. According to
the reptation model the constraints imposed on a chain due to entanglements of the
chain confine the chain inside a tube-like region [24, 25]. During thermal
fluctuations the chain starts wriggling around in the tube. de Gennes said that the
wriggling occurred rapidly with small magnitudes. According to the reptation
model for time scales greater than that of the wriggling motion the polymer chain
moves back and forth along the center line of the tube keeping the arc length
constant. The conformation of the chain at any particular moment is the same as
that of the tube confining it. Therefore, for a polymer chain to change its
conformation it needs to break itself away from the tube that confines it. Figure 4
shows the disengagements of the chain from its initial tube that constrains its
motion.
26
Figure 4: Temporal disengagement of polymer chains from the initial tube [21].
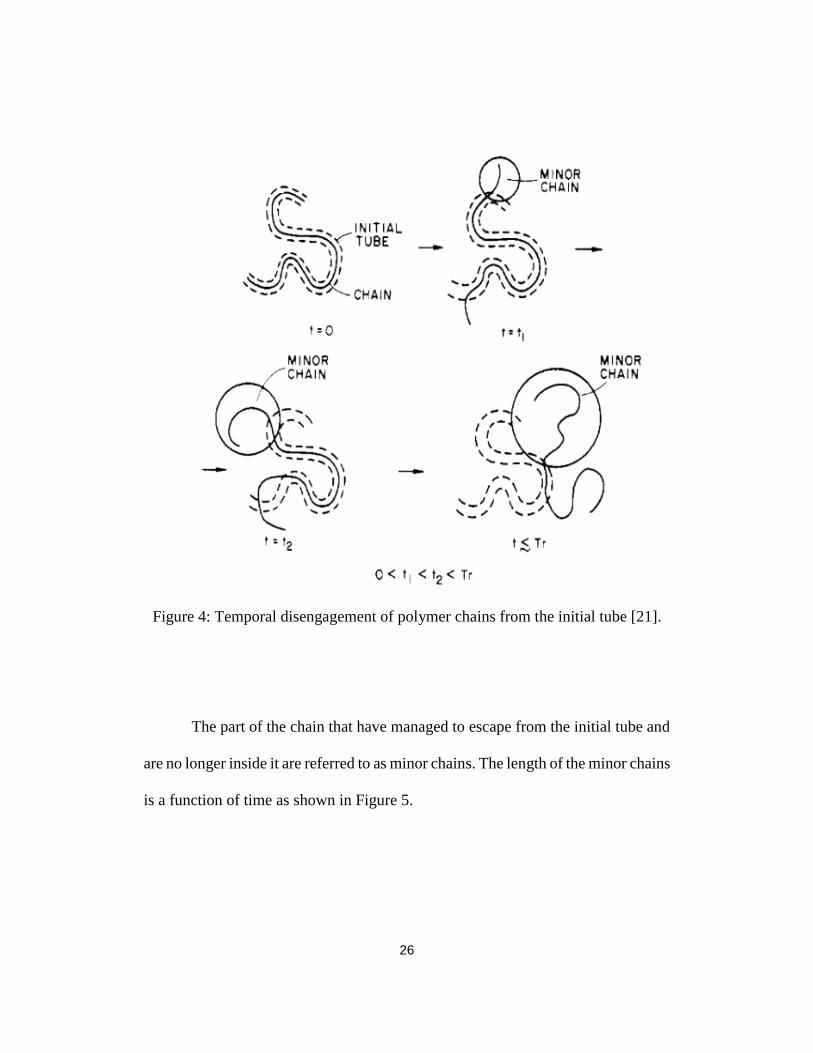
The part of the chain that have managed to escape from the initial tube and
are no longer inside it are referred to as minor chains. The length of the minor chains
is a function of time as shown in Figure 5.
27
Figure 5: Minor chains at different times [21].
The minor chains have lost the memory of their initial conformations and
as their length increases the initial conformations are replaced by new ones. But as
the chain is in a dense system it is always in a new tube but only parts of the chain
(central portions) retain some memory of the initial tube conformation. The two
important time scales associated with the reptation model are Te, or the time
associated with the short- range wriggling motion and Tr, the amount of time
required for the chain to completely disengage itself from the tube. Minor chains
play an important role when describing the chain motion at a polymer-polymer
interface. The chain conformation at a polymer- polymer interface before and after
diffusion is shown in Figure 6.

28
Figure 6: Conformation of chains at the interface before and after diffusion [21].
When we consider the motion of a single chain at the interface from the
point of reptation model we see that initially the chain has conformations same as
that of the initial tube. But as time progresses minor chains escape from this initial
tube and new conformations are formed. These minor chains may assume any
conformation and may also cross the interface. As time progresses the length of the
minor chains increases, and these may cross the polymer-polymer interface
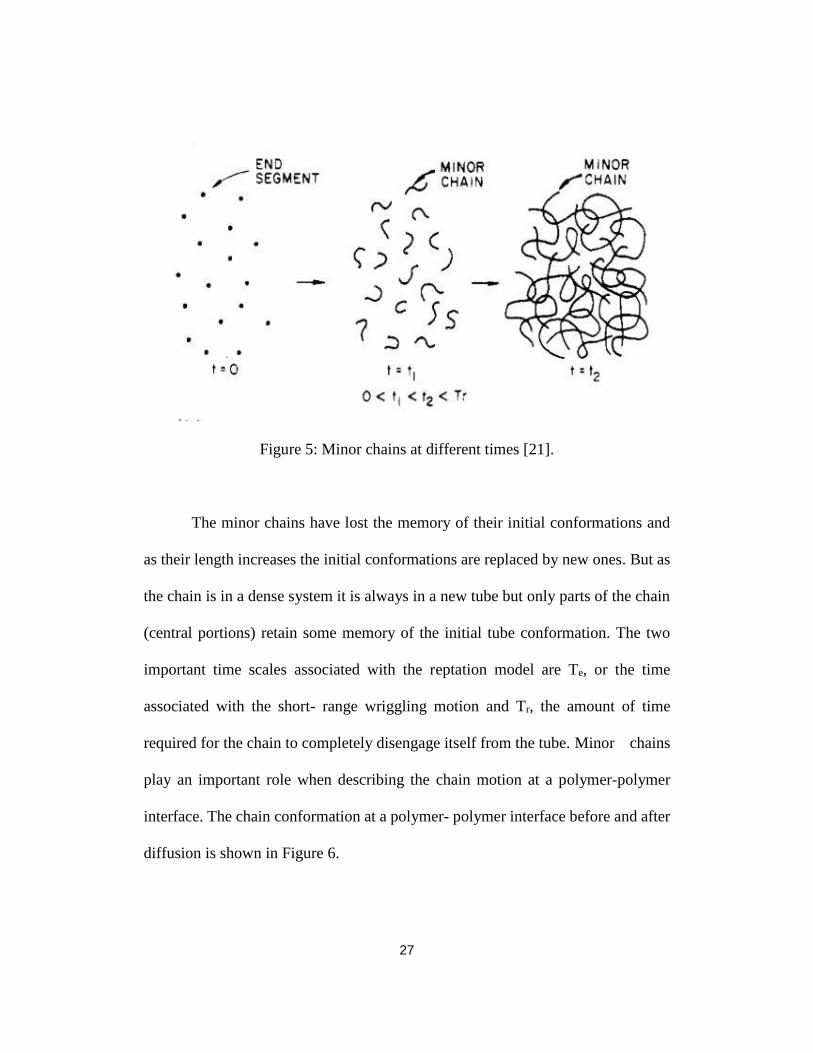
multiple times and penetrate more deeply into the other side as seen in Figure 7. It
is seen that only minor chains can cross the interface. The growth and random
Gaussian conformations of minor chains constitute the diffusion and randomization
of chains across the interface [21].
29
Figure 7: Disengagement of chain from the initial tube near an interface [21].
The time required to achieve complete healing across the interface is called
molecular relaxation time or reptation time. According to reptation theory the
average interpenetration distance of the chain ends across the interface (X) is given
by:
𝑋 ∝ (𝑡
𝑀)
14
30
This equation relates the interpenetration distance of chain molecules to
time and molecular weight of the polymers. It is seen that as time increases the
interpenetration distance of the chain ends across the interface increases. It was
shown by Kim and Wool [21] that strength development is proportional to the
average interpenetration distance of the polymers across the interface.
𝜎 ∝ 𝑋
𝜎 ∝ (𝑡
𝑀)
14
Thus, it is seen that the strength development is dependent on time and
molecular weight for the monodisperse systems. As the time approaches reptation
time, diffusion and randomization stages are complete and the full potential
strength of the bond is reached, σ∞.
𝜎∞ ∝ (𝑡𝑟
𝑀)
14
Where,
tr = Reptation time or relaxation time at a given temperature
Reptation time is also the time required to obtain full healing at the
interface. Degree of healing (Dh) can be defined as the maximum obtainable
strength after a certain time [22]. Degree of healing can be represented as the ratio
of actual bondline strength to the maximum realizable strength of the material.
31
𝐷ℎ =𝜎
𝜎∞
Therefore, by combining equation the above equations we get,
𝐷ℎ = (𝑡
𝑡𝑟)
14
From the above equation we can see the time dependence of strength
buildup. The cohesive strength is said to be reached when the two interfaces are
indistinguishable.
2.6 Effect of Temperature on Viscosity of Amorphous Polymers
The polymer melt viscosity is affected by several factors such as
temperature, pressure, molecular characteristics and addition of fillers. But it is seen
that temperature has the most significant impact on the flow properties of polymer
melts. It is seen that as the temperature increases beyond the glass transition
temperature the viscosity of the polymers decreases leading to increased flow.

32
Chapter 3 Methodology
To test the increase in strength of the parts a custom test specimen was
designed, and a fixture was built to accommodate the test specimens during heat
treatment and prevent distortion allowing the specimens to maintain their original
geometries. The parts were printed using two different sets of print parameters: high
and low settings, to investigate the effect of heat treatment on both sets of print
parameters. The values of temperature, time and applied pressure during heat
treatment were varied to obtain a detailed comparative study and the correlation
between the given variables and the increase in ultimate tensile strength. A cross-
sectional view of the parts was obtained under a microscope to study the changes
in the mesostructure of the parts after the post processing. This provides us with the
means to explain the increase in the strength based on visible physical changes in
the mesostructured.

33
3.1 Test Specimens Design
The specimens were designed on Solidworks using a modified version of
ASTM D638-02a standards as shown in Figure 8. The dimensions of the dogbone
specimen were scaled down to reduce print time of each part. The final design was
saved as a .STL file format which was later used as the input for the slicing
software.
Figure 8: Tensile test specimen with modified geometry.

34
3.2 Print Parameters and Dogbone Fabrication
The test specimen was sliced using Simplify 3D and printed on Polyprinter
229. The specimens were printed using Acrylonitrile Butadiene Styrene (ABS)
filament of 1.75mm diameter. Two combinations of print parameters were used,
the details of the which are given in Table 1.
Table 1: Print Parameters used to print the dogbone specimens.
Print Parameters Set 1: High settings Set 2: Low settings
Extrusion Multiplier 1.2 0.8
Number of perimeter shells 2 1
Layer Height 0.2 mm 0.3 mm
Extrusion Temperature 230 °C 225 °C
Print speed 3600 mm/min 4500 mm/min
Total Print Time per
specimen
1 hour and 3 minutes 33 minutes
Raster Angle 0° 0°
Extrusion multiplier allows to change the flow rate of the material from the
nozzle. The specimens were printed without any supports and a brim setting was
provided to enable the part to print vertically (Z- direction) without falling over as
seen in Figure 9. The raster angle was kept the same to ensure similar interlaminar
bonding areas.

35
Figure 9: Printing of Dogbone specimens in Z- direction.
Each specimen was printed individually to obtain maximum interlaminar
bonding and reduce the thermal gradient while printing at each layer.
36
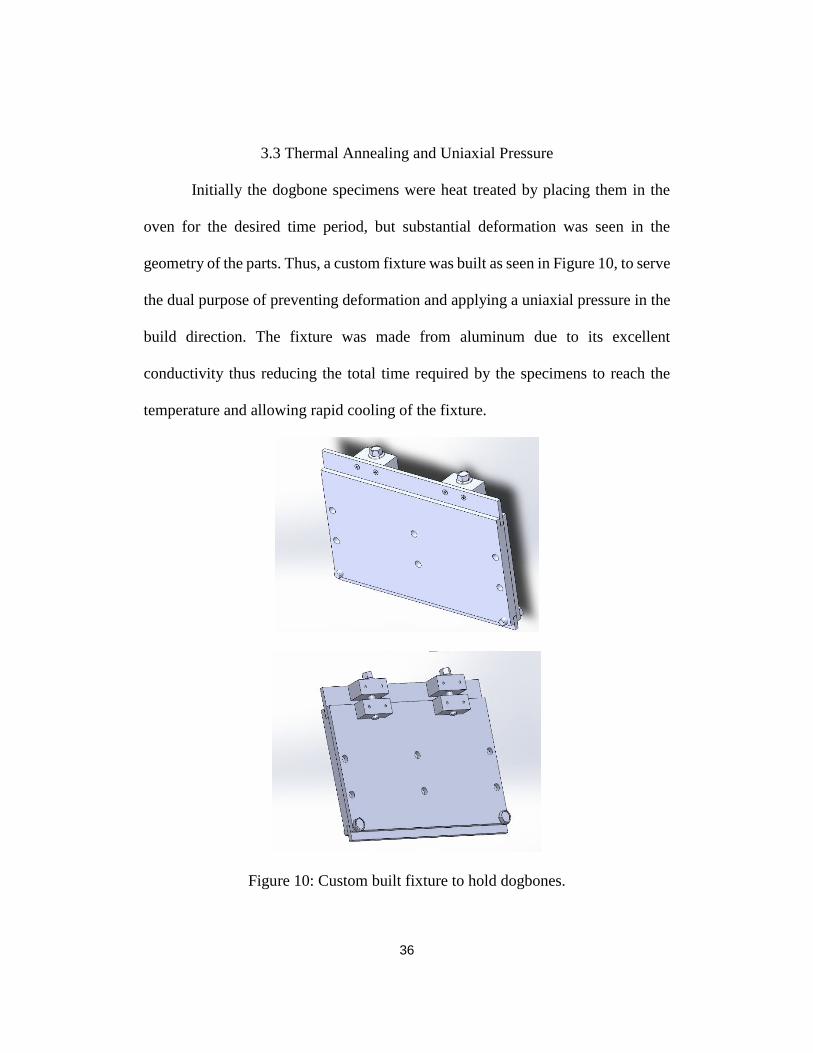
3.3 Thermal Annealing and Uniaxial Pressure
Initially the dogbone specimens were heat treated by placing them in the
oven for the desired time period, but substantial deformation was seen in the
geometry of the parts. Thus, a custom fixture was built as seen in Figure 10, to serve
the dual purpose of preventing deformation and applying a uniaxial pressure in the
build direction. The fixture was made from aluminum due to its excellent
conductivity thus reducing the total time required by the specimens to reach the
temperature and allowing rapid cooling of the fixture.
Figure 10: Custom built fixture to hold dogbones.

37
The fixture prevents deformation of the specimens during thermal annealing
and allows for the application of a uniaxial pressure as shown in Figure 11. The
pressure is applied by tightening the screws to the desired torque value using a
torque wrench, this in turn causes the pressure plate to apply a uniform pressure
over all the specimens in the fixture.
Figure 11: Uniaxial pressure being applied on the test specimens using a fixture.
Before placing the specimens in the fixture, their top and bottom ends were
lightly brushed with a sandpaper to ensure identical lengths of the specimens so
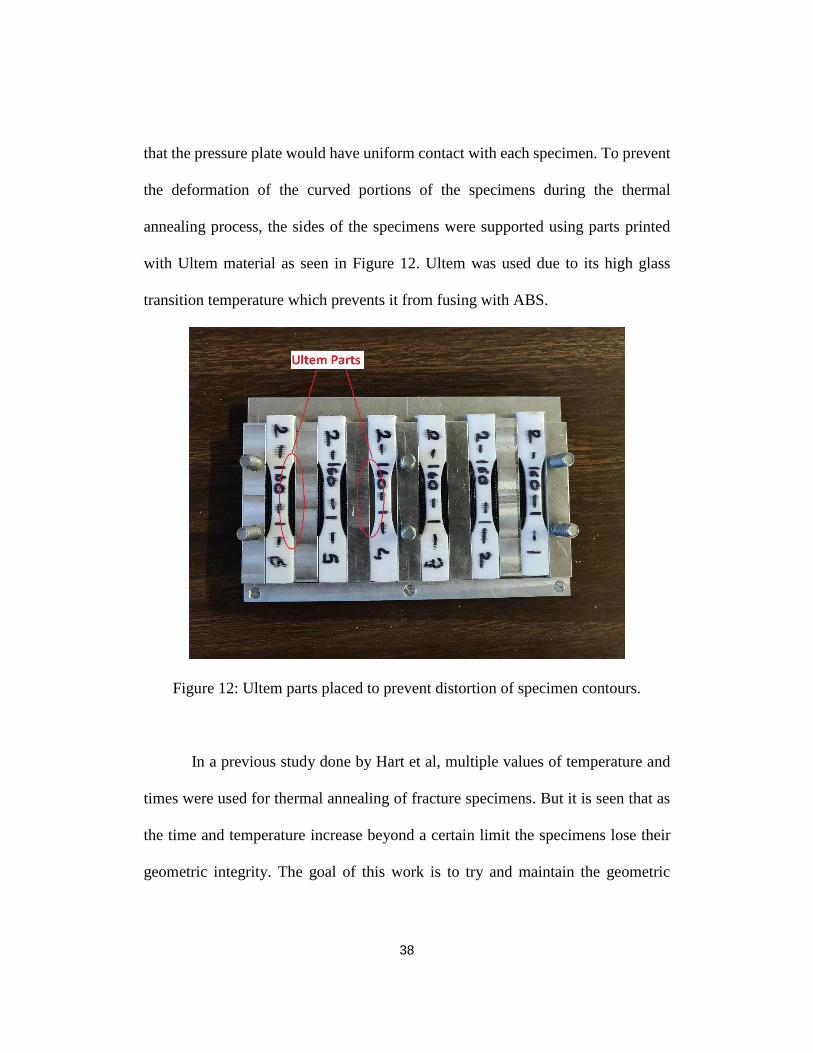
38
that the pressure plate would have uniform contact with each specimen. To prevent
the deformation of the curved portions of the specimens during the thermal
annealing process, the sides of the specimens were supported using parts printed
with Ultem material as seen in Figure 12. Ultem was used due to its high glass
transition temperature which prevents it from fusing with ABS.
Figure 12: Ultem parts placed to prevent distortion of specimen contours.
In a previous study done by Hart et al, multiple values of temperature and
times were used for thermal annealing of fracture specimens. But it is seen that as
the time and temperature increase beyond a certain limit the specimens lose their
geometric integrity. The goal of this work is to try and maintain the geometric
39
integrity of the part while increasing its tensile strength. Thus, the work done by
Hart et al was taken as reference and the values of temperature and times were
chosen. Hart et al had seen that the fracture toughness had increased by 400% for a
thermal annealing time and temperature of 2 hours and 125°C respectively. During
preliminary heat treatment tests, it was seen that for 2 hours the geometric distortion
of the parts was low. Further, previous studies have suggested that though long heat
treatment times lead to an increase in strength there is loss of ductility, especially
for parts with low infill percentage values [26]. Thus, most of the experiments were
performed for a thermal annealing time of 2 hours. In addition to the two variables,
temperature and time, a uniaxial pressure was applied by tightening the screws to
different values of torque. Table 2 gives the different combinations of time,
temperature and pressure for the 2 sets of specimens: High print settings (Set 1) and
Low print settings (Set 2).
During the heat treatment process, the oven was preheated to the desired
temperature and then the fixture along with the specimens was placed inside. To
check the amount of time required by the specimens to reach the oven temperature
thermocouples were attached to the specimens. It was seen that the dogbones
reached a steady state and were at thermal equilibrium with the oven’s temperature
after 1 hour. Figure 13 shows the thermocouple plots for 120°C and the
approximate time required to reach steady state. Thus, a preheat time of 1 hour was

40
consider for each experiment and added to the total time chosen for the
experiments.
Figure 13: Thermocouple lot indicating time required to steady state.
The main differences between the two sets of specimens being tested are the
extrusion multiplier, print temperature and number of perimeter shells. For the high
print settings (Set 1), the values of extrusion multiplier and print temperature are
set at 1.2 and 230°C respectively. Whereas for the low print settings (Set 2), the
extrusion multiplier and print time are 0.8 and 220°C respectively. Previous studies
have shown that using a higher value of extrusion temperature provides for better
interlayer bonding [27].
0
20
40
60
80
100
120
140
160
0 2000 4000 6000 8000 10000
Tem
per
atu
re (°C
)
Time (Seconds)
Plate
Dogbone 2
Dogbone 1
Air
Dogbone 3
At approximately 4000 seconds the Dogbones reach steady

41
Table 2: List of all the experiments performed.
Experiment
Number
Total
Time
(Hours)
Temperature
(°C)
Number
of
Specimens
Pressure
(lb.-in)
Specimen
Parameters
1 3 140 1 - High
2 5 140 1 - High
3 3 120 5 1 High
4 3 120 4 2 High
5 3 120 4 3 High
6 3 140 5 1 High
7 3 140 5 3 High
8 3 140 5 5 High
9 3 160 3 - High
10 3 120 5 - Low
11 3 120 5 1 Low
12 3 120 5 3 Low
13 3 120 5 5 Low
14 3 140 5 - Low
15 3 140 5 1 Low
16 3 140 5 3 Low
17 3 140 5 5 Low
18 3 160 5 - Low
19 3 160 5 1 Low
20 3 160 5 3 Low
21 3 160 5 5 Low
22 3 180 5 - Low
23 1 160 5 5 Low
24 2 160 5 5 Low

42
3.4 Testing
The dogbones were tested under tensile loading on a Shimadzu Universal
Testing Machine as seen in Figure 14. The specimens were tested using a
displacement control of 5mm/min and a load cell of 1 kN was used.
Figure 14: Tensile testing of dogbone specimens
43
Chapter 4 Results
The tensile tests performed on the different combinations of heat treatment
times, temperatures and pressure yielded data which has been grouped into various
subcategories to compare the effect of different variables on the increase in
strength. The subcategories have been divided based on the sets of specimens and
then a comparative study has been done between the two different sets.
4.1 Characterization of Tensile Strength for Specimen Set 1
4.1.1 No Post Processing
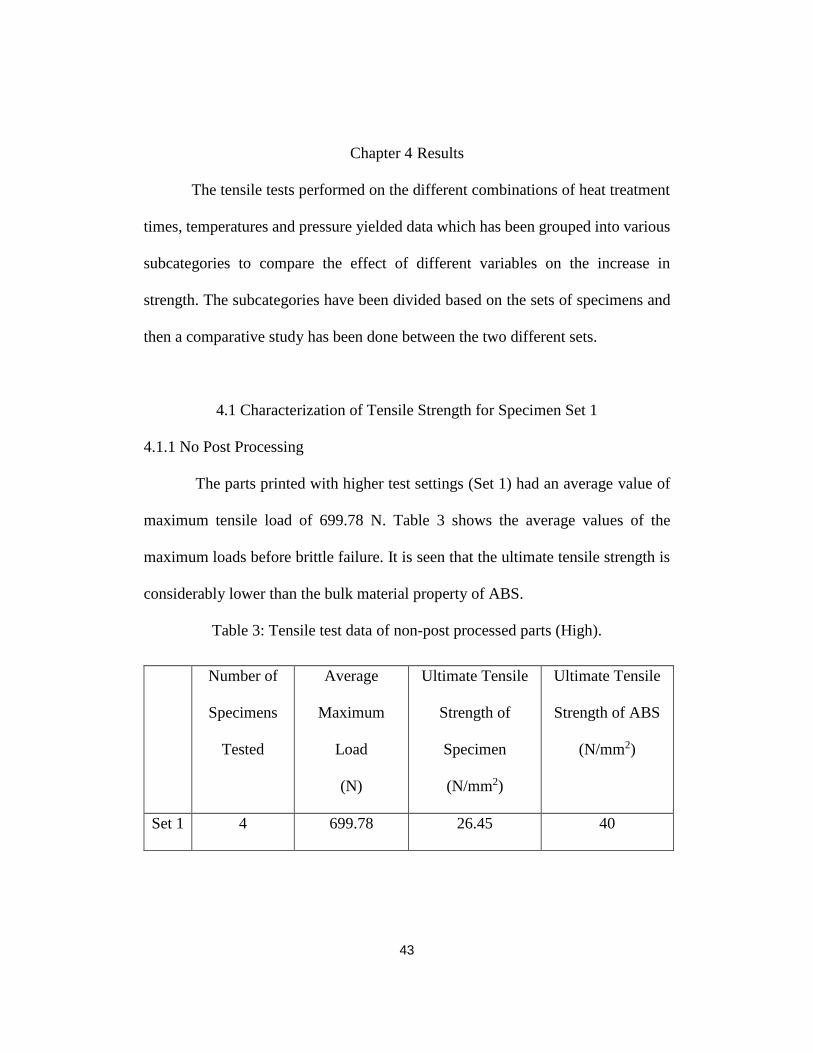
The parts printed with higher test settings (Set 1) had an average value of
maximum tensile load of 699.78 N. Table 3 shows the average values of the
maximum loads before brittle failure. It is seen that the ultimate tensile strength is
considerably lower than the bulk material property of ABS.
Table 3: Tensile test data of non-post processed parts (High).
Number of
Specimens
Tested
Average
Maximum
Load
(N)
Ultimate Tensile
Strength of
Specimen
(N/mm2)
Ultimate Tensile
Strength of ABS
(N/mm2)
Set 1 4 699.78 26.45 40

44
Figure 15 shows the stress-strain curves of the two sets. All the plots of Set
1 specimens have a minor abnormality in the beginning section of the plot due to a
loose mechanical part in the tensile test machine.
Figure 15: Stress- Strain curve for non- post processed parts.
4.1.2 Isolated Thermal Annealing
To check the effect of time, thermal annealing was done by varying the time
and keeping the temperature constant. In one experiment the specimens were heated
for 3 hours and 5 hours respectively while keeping the temperature constant at
140°C. In the next experiment the temperature was kept as the variable while
keeping the time constant at 3 hours. The heat treatment was done for 2 different
values of temperature as seen in Table 4.
-5
0
5
10
15
20
25
30
35
0 0.005 0.01 0.015 0.02 0.025 0.03
Stre
ss (
MP
a)
Strain
45
Table 4: List of various combinations of temperature and time used (High
settings).
Experiment Number Temperature Time
1 140°C 3 hours, 5 hours
2 140°C, 160°C 3 hours
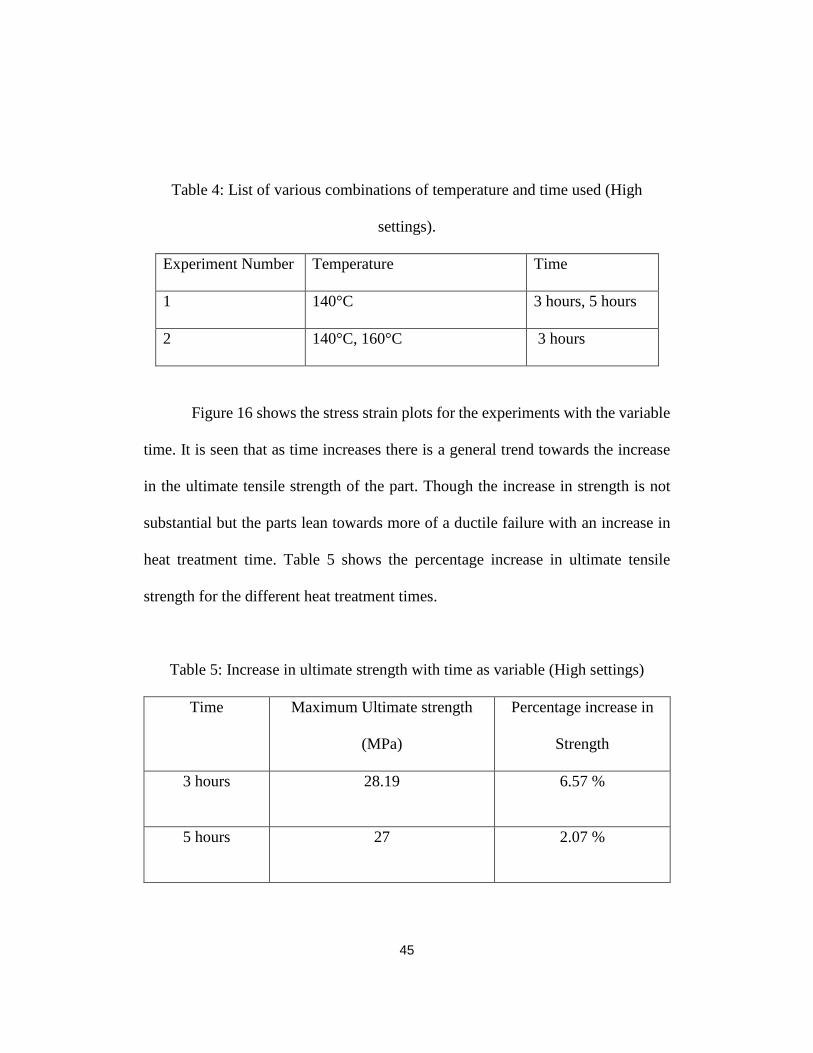
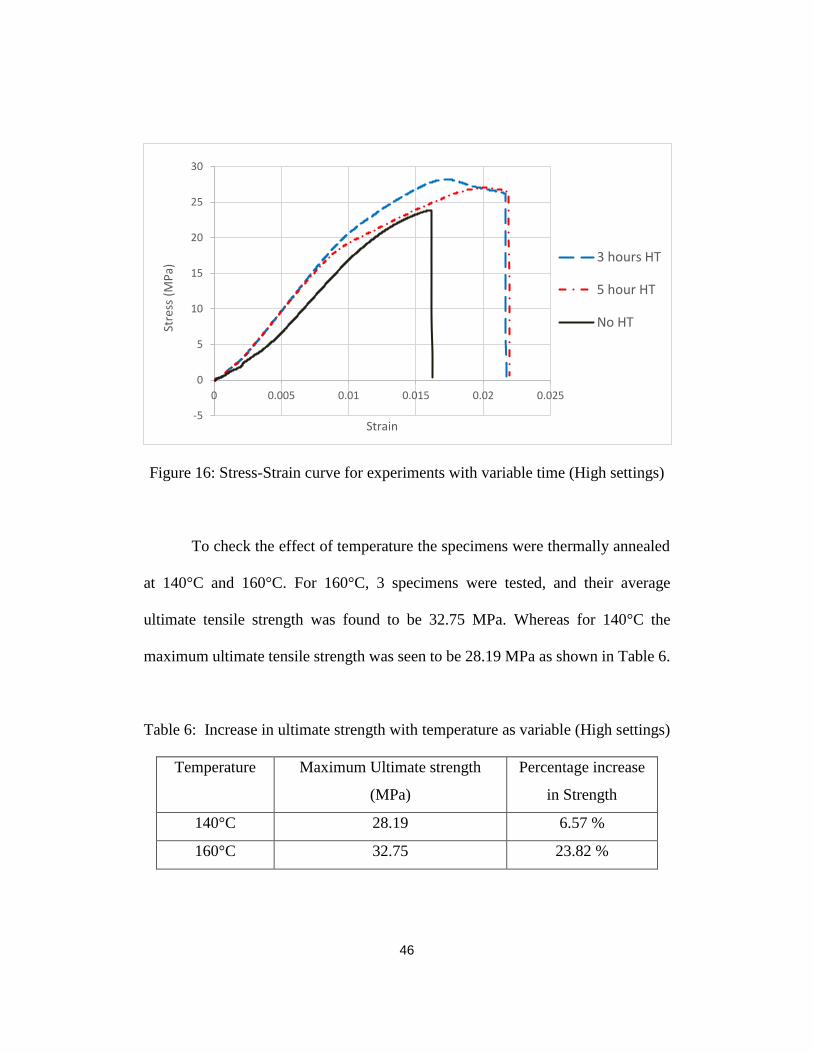
Figure 16 shows the stress strain plots for the experiments with the variable
time. It is seen that as time increases there is a general trend towards the increase
in the ultimate tensile strength of the part. Though the increase in strength is not
substantial but the parts lean towards more of a ductile failure with an increase in
heat treatment time. Table 5 shows the percentage increase in ultimate tensile
strength for the different heat treatment times.
Table 5: Increase in ultimate strength with time as variable (High settings)
Time Maximum Ultimate strength
(MPa)
Percentage increase in
Strength
3 hours 28.19
6.57 %
5 hours 27
2.07 %
46
Figure 16: Stress-Strain curve for experiments with variable time (High settings)
To check the effect of temperature the specimens were thermally annealed
at 140°C and 160°C. For 160°C, 3 specimens were tested, and their average
ultimate tensile strength was found to be 32.75 MPa. Whereas for 140°C the
maximum ultimate tensile strength was seen to be 28.19 MPa as shown in Table 6.
Table 6: Increase in ultimate strength with temperature as variable (High settings)
Temperature Maximum Ultimate strength
(MPa)
Percentage increase
in Strength
140°C 28.19 6.57 %
160°C 32.75 23.82 %
-5
0
5
10
15
20
25
30
0 0.005 0.01 0.015 0.02 0.025
Stre
ss (
MP
a)
Strain
3 hours HT
5 hour HT
No HT

47
Figure 17 shows the stress strain curve for the two different values of
temperature. From the results obtained it is seen that an increase in temperature has
a larger impact on strength as compared to thermal annealing for a larger duration
of time.
Figure 17: Stress-Strain curves for experiments with variable temperature (High
settings).
4.1.3 Thermal Annealing and Uniaxial Pressure
In the mathematical models that have been developed by various authors, it
is seen that intimate contact plays a role in affecting the inter-laminar strength
between polymers. Uniaxial pressure was considered as a variable to try and
increase the intimate contact and thus investigate its effect on increase in strength.
Table 7 shows the combinations of temperatures and pressures used.
0
5
10
15
20
25
30
35
40
0 0.005 0.01 0.015 0.02 0.025
Stre
ss (
MP
a)
Strain
160°C
140°C
48
Table 7: List of various combinations of temperatures and pressures used (High
settings).
Experiment
Number
Temperature
(°C)
Pressure
(lb.-in)
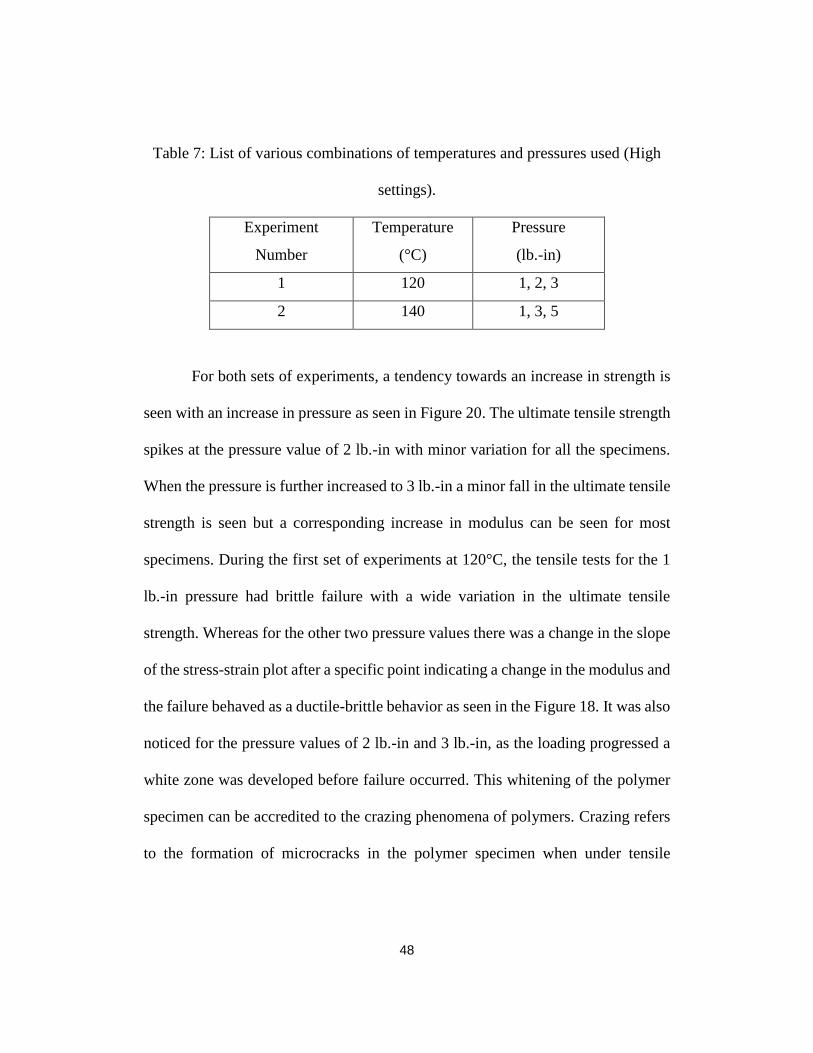
1 120 1, 2, 3
2 140 1, 3, 5
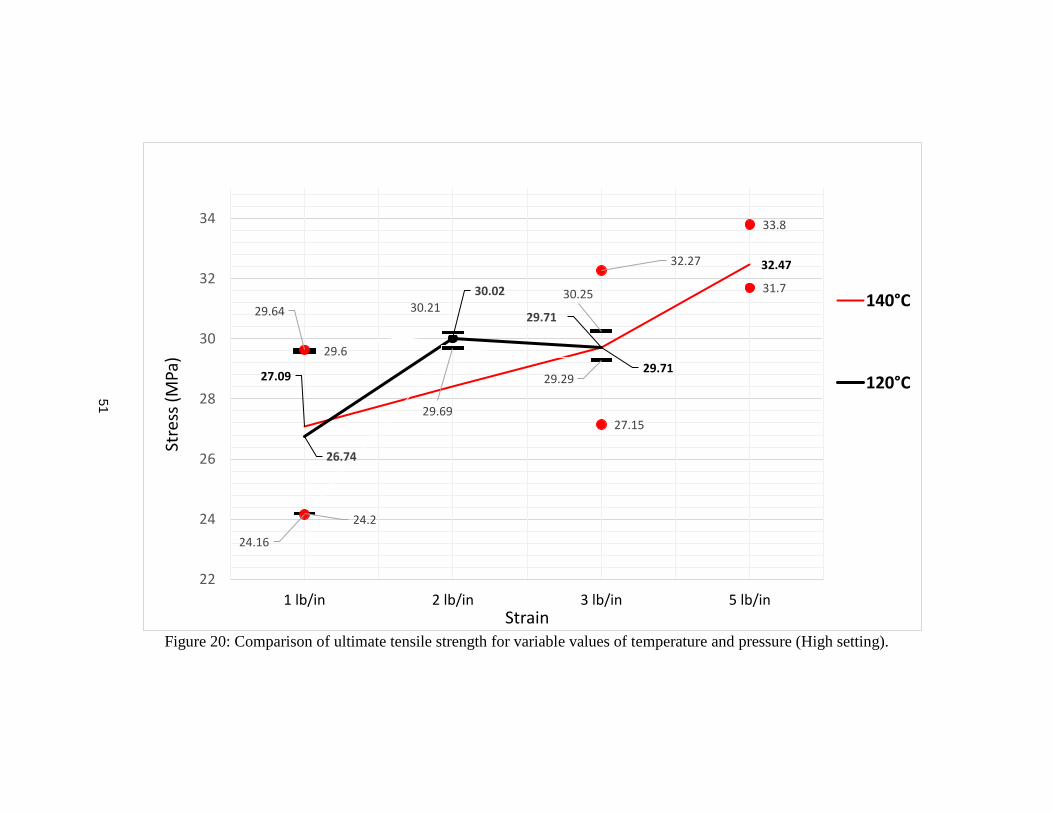
For both sets of experiments, a tendency towards an increase in strength is
seen with an increase in pressure as seen in Figure 20. The ultimate tensile strength
spikes at the pressure value of 2 lb.-in with minor variation for all the specimens.
When the pressure is further increased to 3 lb.-in a minor fall in the ultimate tensile
strength is seen but a corresponding increase in modulus can be seen for most
specimens. During the first set of experiments at 120°C, the tensile tests for the 1
lb.-in pressure had brittle failure with a wide variation in the ultimate tensile
strength. Whereas for the other two pressure values there was a change in the slope
of the stress-strain plot after a specific point indicating a change in the modulus and
the failure behaved as a ductile-brittle behavior as seen in the Figure 18. It was also
noticed for the pressure values of 2 lb.-in and 3 lb.-in, as the loading progressed a
white zone was developed before failure occurred. This whitening of the polymer
specimen can be accredited to the crazing phenomena of polymers. Crazing refers
to the formation of microcracks in the polymer specimen when under tensile

49
loading. This is indicative of a better bond formation in the specimens at the
interlaminar level.
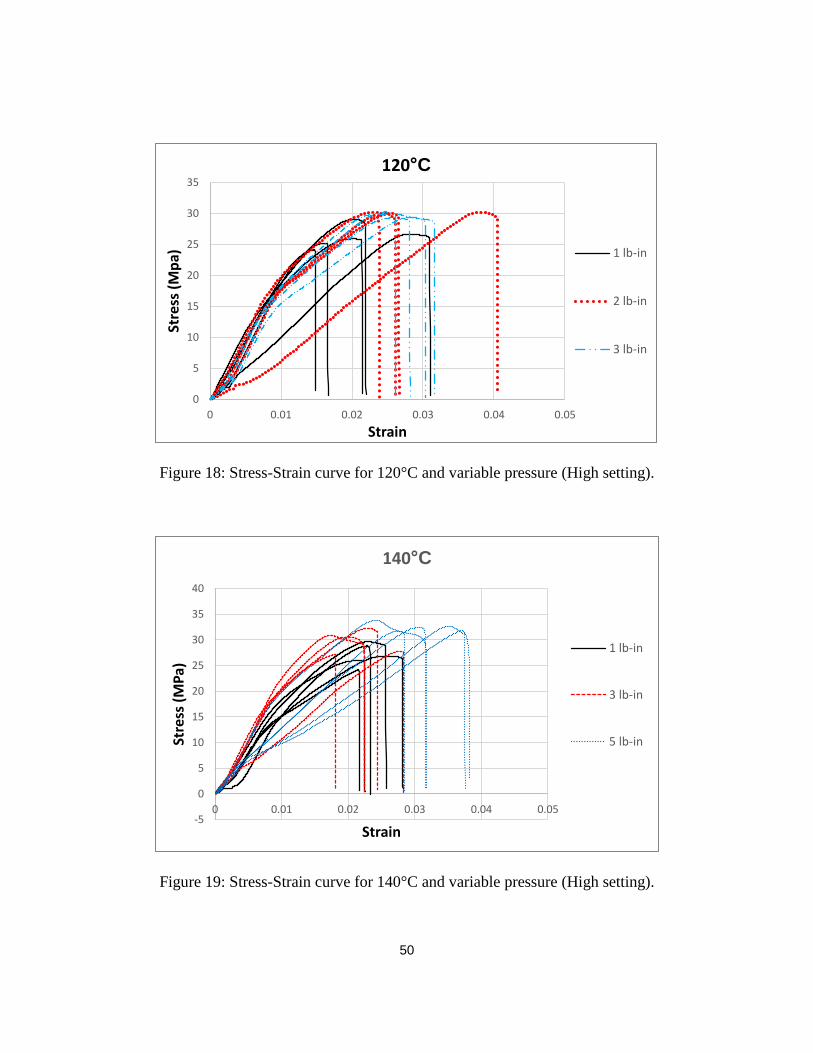
For the second set of experiments, the temperature is increased to 140°C for
the three values of pressures mentioned in Table 7. As the pressure is increased a
corresponding increase in the strength is seen and a more pronounced effect on
ductility is noticed. Like the first experiment, for higher values of applied pressure,
crazing is noticed in the specimens before tensile failure occurs. Table 8 shows the
increase in strength obtained as compared to the non-heat treated parts.
Table 8: Increase in ultimate strength with temperature and pressure as variables
(High settings)
Experiment
Number
Temperature
(°C)
Pressure
(lb.-in)
Average
Ultimate
tensile
Strength
(MPa)
Percentage
Increase in
Strength
1 120 1 26.74 1.09 %
2 120 2 30.02 13.5 %
3 120 3 29.71 12.32 %
4 140 1 27.09 2.42 %
5 140 3 29.71 12.33 %
6 140 5 32.47 22.76 %
50
Figure 18: Stress-Strain curve for 120°C and variable pressure (High setting).
Figure 19: Stress-Strain curve for 140°C and variable pressure (High setting).
0
5
10
15
20
25
30
35
0 0.01 0.02 0.03 0.04 0.05
Stre
ss (
Mp
a)
Strain
120°C
1 lb-in
2 lb-in
3 lb-in
-5
0
5
10
15
20
25
30
35
40
0 0.01 0.02 0.03 0.04 0.05
Stre
ss (
MP
a)
Strain
140°C
1 lb-in
3 lb-in
5 lb-in
51
Figure 20: Comparison of ultimate tensile strength for variable values of temperature and pressure (High setting).
27.0929.71
32.47
29.64
32.27
33.8
24.16
27.15
31.7
26.74
30.02
29.71
29.6
30.2130.25
24.2
29.69
29.29
22
24
26
28
30
32
34
1 lb/in 2 lb/in 3 lb/in 5 lb/in
Stre
ss (
MPa
)
Strain
140°C
120°C

52
4.2 Characterization of Tensile Strength for Specimen Set 2
4.2.1 No Post Processing
Set 2 of the specimens were printed with low print settings and the average
ultimate tensile strength is seen to be 9.677 MPa. This is considerably lower than
the bulk material properties of ABS. Figure 21 represents the stress-strain curve for
the tested parts, and it can be seen that all the parts undergo brittle failure.
Figure 21: Stress- Strain curve for non-post processed parts (Low settings).
4.2.2 Isolated thermal annealing
For the low print settings multiple values of temperature were chosen to test
its effect on the ultimate tensile strength. Table 9 shows the different temperatures
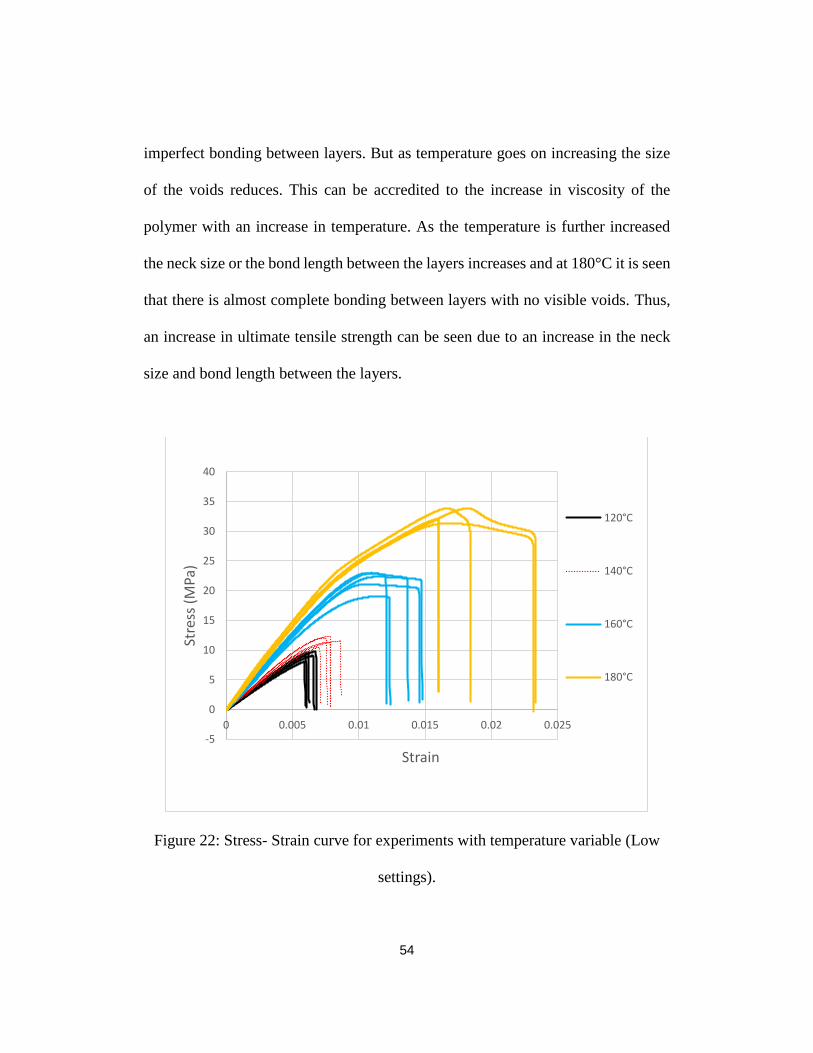
used for the experiment. From Figure 22 it is seen that as the temperature goes on
0
2
4
6
8
10
12
0 0.001 0.002 0.003 0.004 0.005 0.006 0.007 0.008 0.009
Stre
ss (
MP
a)
Strain
No Heat Treat
53
increasing there is a drastic increase in the ultimate tensile strength of the
specimens. For thermal annealing at 120°C it is seen that ultimate tensile strength
of the parts remain almost the same as that of the non-heat treated parts. As the
glass transition temperature of ABS is 105°C, thermal annealing at 120°C for 3
hours does not impart enough energy to see substantial increase in the bond length
which in turn would lead to an increase in strength. But for higher values of
temperature a substantial rise in strength is seen. Also, for higher values of
temperature the surface finish of the parts becomes glossy and there is a reduction
in the cross-sectional area of the specimens. Figure 22 shows the stress-strain
relationships for the different heat treatment values. It is seen that as the
temperature increases the ductility of the specimens increases along with a
corresponding increase in strength and the failure shifts from a pure brittle failure
to more of a ductile-brittle failure.
Table 9: List of various combinations of temperature used (Low settings).
Temperature Time (hours)
120°C, 140°C, 160°C, 180°C 3
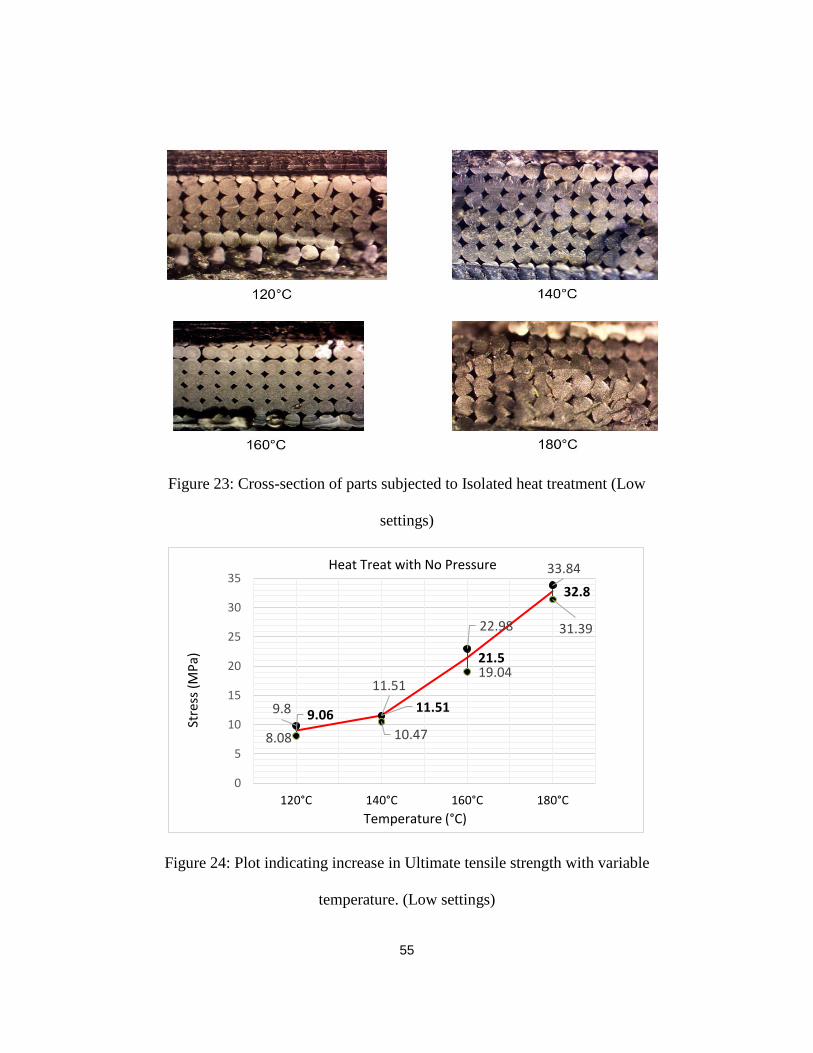
Figure 23 shows the cross-sectional images of the test specimens after heat
treatment. For lower values of temperatures prominent voids are noticed indicating
54
imperfect bonding between layers. But as temperature goes on increasing the size
of the voids reduces. This can be accredited to the increase in viscosity of the
polymer with an increase in temperature. As the temperature is further increased
the neck size or the bond length between the layers increases and at 180°C it is seen
that there is almost complete bonding between layers with no visible voids. Thus,
an increase in ultimate tensile strength can be seen due to an increase in the neck
size and bond length between the layers.
Figure 22: Stress- Strain curve for experiments with temperature variable (Low
settings).
-5
0
5
10
15
20
25
30
35
40
0 0.005 0.01 0.015 0.02 0.025
Stre
ss (
MP
a)
Strain
120°C
140°C
160°C
180°C
55
Figure 23: Cross-section of parts subjected to Isolated heat treatment (Low
settings)
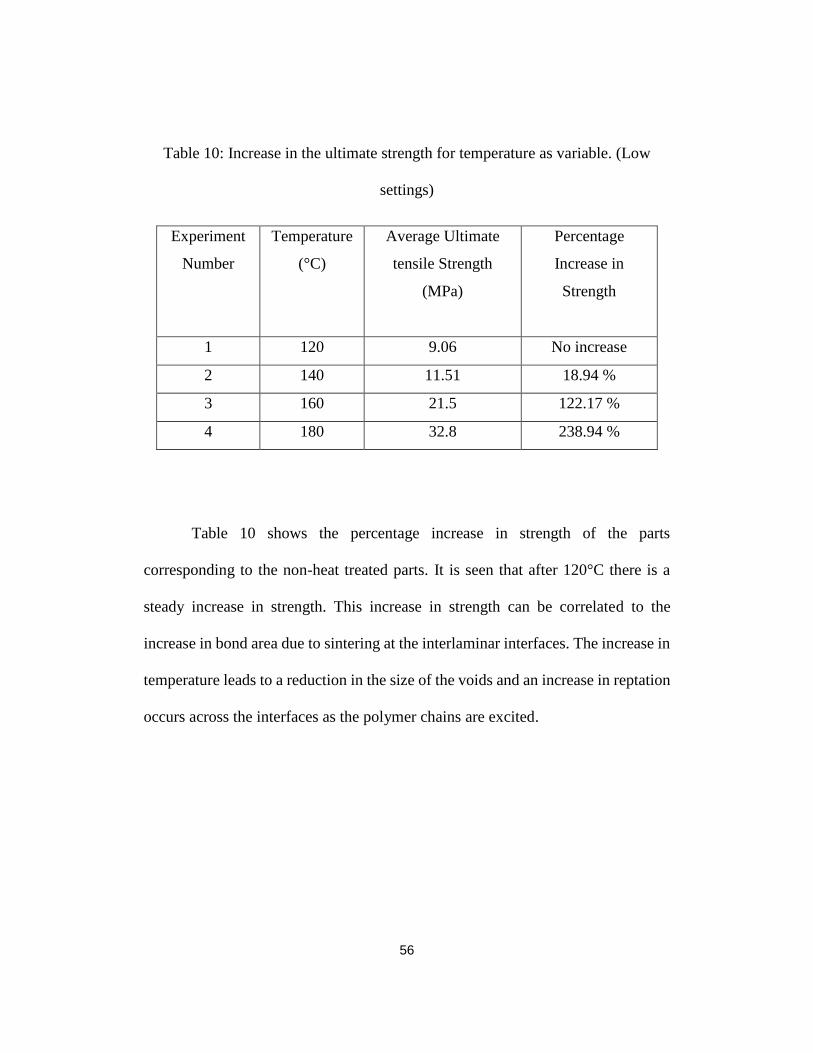
Figure 24: Plot indicating increase in Ultimate tensile strength with variable
temperature. (Low settings)
9.0611.51
21.5
32.8
9.8
11.51
22.98
33.84
8.08 10.47
19.04
31.39
0
5
10
15
20
25
30
35
120°C 140°C 160°C 180°C
Stre
ss (
MP
a)
Temperature (°C)
Heat Treat with No Pressure
56
Table 10: Increase in the ultimate strength for temperature as variable. (Low
settings)
Table 10 shows the percentage increase in strength of the parts
corresponding to the non-heat treated parts. It is seen that after 120°C there is a
steady increase in strength. This increase in strength can be correlated to the
increase in bond area due to sintering at the interlaminar interfaces. The increase in
temperature leads to a reduction in the size of the voids and an increase in reptation
occurs across the interfaces as the polymer chains are excited.
Experiment
Number
Temperature
(°C)
Average Ultimate
tensile Strength
(MPa)
Percentage
Increase in
Strength
1 120 9.06 No increase
2 140 11.51 18.94 %
3 160 21.5 122.17 %
4 180 32.8 238.94 %
57
4.2.3 Thermal Annealing and Uniaxial Pressure
To investigate the effect of pressure on the specimens printed with low
settings, the dogbones were subjected to 3 different values of applied pressure for
varying values of temperature. Table 11 shows the various combinations of
temperatures and pressures used.
Table 11: List of various combinations of temperatures and pressures used (Low
settings).
Experiment Number Temperature (°C) Pressure (lb.-in)
1 120 1, 3, 5
2 140 1, 3, 5
3 160 1, 3, 5
Figure 25 shows the comparative values of ultimate tensile strength obtained for all
three experiments. In the first experiment (120°C), a slight increase in the ultimate
tensile strength is seen. But there is wide variation in the data obtained for each
value of pressure. As the magnitude of the applied pressure is increased the
variation in the ultimate tensile strength goes down considerably. For the
experiments at 140°C the 160°C the ultimate tensile strength peaks at the 3 lb.-in
value and then falls slightly for the 5 lb.-in pressure. Overall in each experiment a
rise in strength is seen with applied pressure but there is considerable variation in

58
the data due to the tendency of FDM parts to fail at the weakest layer due to flaws
during print. The percentage increase in strength when compared to specimens
thermally annealed at the same temperature but without pressure is given in Table
12.
Table 12: Increase in ultimate strength of parts with variable temperature and
pressure (Low settings).
Experiment
Number
Temperature
(°C)
Pressure
(lb.-in)
Average
Ultimate
tensile
Strength
Coefficient
of
Variation
Percentage
Increase in
Strength
1 120 1 10.69 10.29 % 17.99 %
2 120 3 10.5 1.77 % 15.89 %
3 120 5 10.87 4.58 % 19.98 %
4 140 1 11.88 2.62 % 3.2 %
5 140 3 13.04 0.29 % 13.29 %
6 140 5 12.76 1.68 % 10.86 %
7 160 1 20.12 0.81 % No
Increase
8 160 3 22.33 1.65 % 3.8 %
9 160 5 19.97 0.36 % No
increase
59
From Table 12 it is seen that for 120°C and 140°C the pressure has a greater
effect on increase in strength. For 160°C the strength remains somewhat constant
to the values obtained for thermal annealing without any pressure, thus indicating
that for higher values of temperature the applied pressure is not the controlling
factor in increasing the strength.
This may be because the flow or deformation caused by the applied pressure
is not as significant as the flow cause by the increase in temperature and time which
leads to better sintering and void reduction in the inter-laminar regions.

60
Figure 25: Comparison of ultimate tensile strength for variable values of
temperature and pressure (Low setting).
4.3 Effect of Print Parameters on Strength
For the two sets of specimens printed, wide variation is seen in the strength increase
even for similar post processing parameters. The non-heat treated specimens
printed with higher print settings have an ultimate tensile strength which is
drastically higher than the parts printed with low print settings. Though the parts
printed with low settings show a considerable increase in the ultimate tensile
10.69 10.5
10.87
12.15
10.97 11.43
9.42 9.899.52
20.12
22.33
19.97
20.84
23.31
20.325
19.6921.48
19.58
11.88
13.04 12.7612.69
13.2813.24
10.9412.72
11.88
5
7
9
11
13
15
17
19
21
23
25
1 lb-in 3 lb-in 5 lb-in
Ult
imat
e Te
nsi
le S
tres
s (M
Pa)
Applied Pressure
120 degrees 160 degrees 140 degrees
61
strength after thermal annealing, the strength is still somewhat lower than the parts
printed with high print settings. This discrepancy in strength may be due to the high
flow rate and larger extruder temperature used for the high print settings which lead
to better material flow and sintering at the laminas. Thus, it is seen that print
parameters like flow rate and extrusion temperature play a vital role in determining
the bond strength of the parts printed using FDM and significantly affect their
mechanical properties.
62
Chapter 5 Conclusion
The study was aimed to investigate the effect of isothermal annealing and uniaxial
pressure on the inter-laminar tensile strength of FDM. From the study it is seen that the
strength of FDM parts can be improved by using thermal annealing and uniaxial pressure.
The degree of improvement in strength depends not only on the values of temperatures,
times and pressures used but also on the print parameters. With an increase in the
temperature and time values for heat treatment the ultimate tensile strength of the
specimens goes on increasing. Accompanied with the increase in the strength an increase
in the ductility of the parts is also seen.
It is seen that even for parts which are subjected to similar post processing and
heat treatment parameters there is considerable variation in their ultimate tensile strength.
This variation is due to the defects introduced in the individual parts during printing. The
tensile specimens fail at the weakest location and it is difficult to predict the actual zone
of failure due to these internal defects. Thus, the internal defects and external print
conditions cause significant variability in the ultimate tensile strength of similarly post
processed parts.
The cross- sectional images of the heat-treated specimens indicate a correlation
between the increase in neck size and bond length with heat treatment. As the temperature
is increased the bond length increases and the size of the voids decreases considerably
resulting in lesser stress concentration zones. This change in the mesostructure is partially
due to the increased flow properties of the polymer at higher temperatures and the
reptation phenomenon occurring at the layer to layer interface resulting in better bonding.
63
The effect of uniaxial pressure in increasing the ultimate tensile strength is seen
to be more significant for lower values of temperatures. As temperature increases the
effect of pressure and intimate contact is seen to be predominated by the accentuated
sintering and reptation phenomena due to higher values of temperature and time.
Though thermal annealing and uniaxial pressure cause an increase in the strength
of the parts, the print parameters play a vital role in determining the initial mechanical
properties of the parts. When the parts are fabricated with a higher values of flow rate
and extrusion temperature, they exhibit significantly higher mechanical properties as
compared to parts printed with substandard setting. Thus, by controlling the print
parameters and using the right values of temperature and pressure we can see substantial
increase in strength of FDM parts.
64
Chapter 6 Future Work
Multiple values of temperature, pressure and time have been tested in this study
but there still is wide scope to understand the behavior of the interlaminar bond when
subjected to the variables. To understand the effect of each variable more accurately a
Design of Experiments (DOE) approach can be chosen to quantify the significance of
each variable. Also, as final use parts are not just subjected to pure tension a fracture and
fatigue strength analysis can be done to investigate the increase in strength. Applications
such as the aerospace industry require the fabrication of complicated geometries such as
the optimized thin layer aircraft wings. Though FDM provides us with the design freedom
to fabricate these complex shapes, the parts so produced cannot meet with the high fatigue
and fracture strength demands required in such applications. Thus, a specific combination
of temperature, time and pressure while minimizing the deformation could help meet
these demands.
65
Chapter 7 References
[1] N. Turner, R. Strong, and S. A. Gold, "A review of melt extrusion
additive manufacturing processes: I. Process design and modeling,"
Rapid Prototyping Journal, vol. 20, pp. 192-204, 2014.
[2] H. Lipson and M. Kurman, Fabricated: The new world of 3D printing.
John Wiley and Sons, 2013.
[3] Sossou, Germain. “An Additive Manufacturing Oriented Design Approach to
Mechanical Assemblies.” Journal of Computational Design and Engineering,
6 Nov. 2017, www-
sciencedirectcom.ezproxy.uta.edu/science/article/pii/S2288430017300659.
[4] ASTM, 2009, ASTM International Committee F42 on Additive
Manufacturing Technologies, ASTM F2792–10 Standard Terminology for
Additive Manufacturing Technologies, ASTM, West Conshohocken, PA.
[5] Gibson, I., Rosen, D.W. and Stucker, B. (2013), Additive Manufacturing
Technologies: Rapid Prototyping to Direct Digital Manufacturing, Springer,
New York, NY.
[6] Hart KR, Dunn RM, Sietins JM, Hofmeister Mock CM, Mackay ME, Wetzel
ED, Increased fracture toughness of additively manufactured amorphous
thermoplastics via thermal annealing, Polymer (2018), doi:
10.1016/j.polymer.2018.04.024.

66
[7] M. K. Agarwala, V. R. Jamalabad, N. A. Langrana, A. Safari, P. J. Whalen,
and S. C. Danforth, “Emerald Article: Structural quality of parts processed by
fused deposition Structural quality of parts processed by fused deposition,”
vol. 2, pp. 1– 15, 1996.
[8] ABS m30 [Online].
Available:(http://www.stratasys.com/materials/search/absm30)
[9] https://all3dp.com/2/infill-3d-printing-what-it-means-and-how-to-use-it/
[10] https://www.prusaprinters.org/what-are-perimeters-good-for/
[11] Forster AM. Materials Testing Standards for Additive Manufacturing of
Polymer Materials: State of the Art and Standards Applicability. National
Institute of Standards and Technology; 2015. May.
[12] Ziemian S, Okwara M, Ziemian CW. Tensile and fatigue behavior of layered
acrylonitrile butadiene styrene. Rapid Prototyping J 2015; 21:270–8).
[13] Onwubolu GC, Rayegani F. Characterization and optimization of mechanical
properties of ABS parts manufactured by the fused deposition modelling
process. Int J Manuf Eng 2014; 2014:1–13.
[14] Sood AK, Ohdar RK, Mahapatra SS. Parametric appraisal of mechanical
property of fused deposition modelling processed parts. Mater Des 2010;
31:287–95.

67
[15] Rodríguez JF, Thomas JP, Renaud JE. Mechanical behavior of acrylonitrile
butadiene styrene (ABS) fused deposition materials. Experimental
investigation. Rapid Prototyping J 2001; 7:148–58.
[16] Rodriguez JF. Modeling the mechanical behavior of fused deposition ABS
polymer components. Notre Dame, IN: Aerospace & Mechanical Engineering
Department, University of Notre Dame; 1999.
[17] Sun Q, Rizvi GM, Bellehumeur CT, Gu P. Effect of processing conditions on
the bonding quality of FDM polymer filaments. Rapid Prototyping J2008;
14:72–80.
[18] K. R. Hart and E. D. Wetzel, "Fracture behavior of additively manufactured
acrylonitrile butadiene styrene (ABS) materials," Engineering Fracture
Mechanics, vol. 177, pp. 1-13, 2017.
[19] Rodriguez JF, Thomas JP, Renaud JE. Characterization of the
mesostructure of fused-deposition acrylonitrile-butadiene-styrene materials.
Rapid Prototyping J 2000;6:175–86.
[20] R.W. Messler, Jr. Joining of advanced materials; Butterworth-Heinemann
(1993).
[21] Theory of Healing at a Polymer-Polymer Interface 1115 Young Hwa Kim’
and Richard P. Wool*.

68
[22] C. Butler, R. McCullough, R. Pitchumani, and J. John Gillespie, "An Analysis
of Mechanisms Governing Fusion Bonding of Thermoplastic Composites,"
Journal of Thermoplastic Composite Materials, vol. 11, pp. 338-363, 1998.
[23] C Ziemian, M. Sharma, S. Ziemian, (2012) Anisotropic Mechanical Properties
of ABS Parts Fabricated by Fused Deposition Modeling, Mechanical
Engineering, Dr. Murat Gokcek (Ed.), ISBN: 978-953-51-0505-3.
[24] Edwards, S. F. Proc. Phys. SOC., London 1967, 92,9.
[25] Doi, M.; Edwards, S. F. J. Chem. SOC., Faraday Trans. 2,1978, 1789.
[26] J. Torres, J. Cotelo, J. Karl, A.P. Gordon, Mechanical property optimization of
FDM PLA in shear with multiple objectives, JOM 67 (5) (2015) 1183–1193.
[27] Aliheidari N, Christ J, Tripuraneni R, Nadimpalli S, Ameli A, “Interlayer
adhesion and fracture resistance of polymers printed through melt extrusion
additive manufacturing process”, Materials & Design ,Volume 156, pp. 351-
361, 2018.

69