enhancing the decision making process in urban spatial planning using advanced ict
TRANSCRIPT
Enhancing the Decision-making Process in Urban Spatial Planning Using Advanced ICT
Technical Paper: Technologies for new ways of working
By
Philip JAMES1 Terrence FERNANDO2
Andy HAMILTON3 and
Steve CURWELL3 1 The Research Institute for the Built and Human Environment, School of Environment and Life Sciences, University of Salford 2 Future Workspaces Research Centre, Business House, University of Salford 3 The Research Institute for the Built and Human Environment, School of Construction & Property Management, University of Salford
We acknowledge the help of Matthew Faulk and Glen Hart, Research and Innovation, Ordnance Survey
This paper along with the accompanying issues paper form the final report of this research
2
Contents
Chapter Page
Acknowledgements
3
1 Introduction
4
2 Key Drivers for Change
5
3 Applications
15
4 Future Urban Planning Workspaces
29
Bibliography
38
3
Acknowledgements Matt Chapman, Matt Faulk*, Glen Hart and, John Horgan* Ordnance Survey of Great
Britain
Ian Cooper*, Eclipse Research Consultants
Simon Bee, Iona Billing*, Yannis Goulermas, Norman Murray, Nav Patel and
Jialiang Yao, Future Workspaces Research Centre, University of Salford
Sarrif Nujeeralee, BT Exact Technologies
Richard Armitage*, Stefanos Dodouras*, Rio Singh* and Konstantinos Tzoulas*,
Research Institute for the Built and Human Environment, University of Salford
Margot Sullivan School of Environment and Life Sciences, University of Salford
Ghssan Aouad, Yusuf Ariyici, Rob Aspin, Yun Chen*, Yonghui Song, Joe Tah, Ali
Tanyer and Hongxia Wang Intelcities Project
Andrew Dennison and Iola Price* 3d Webdesign
Kim Foster* Fusion GFX Consultants
Paul Bingham* Blackpool Borough Council
Phil Birchinall* and Bonnie Campbell* Manchester Digital Development Agency
Matt Doherty* and Paul Holme* Salford City Council
Ian Everall* and Geoff Henderson* Black Country Knowledge Society/ Consortium
Pedro Gamito* e-Reality
Mike Hodge* Greater Manchester Police
Cedric Knipe* Macclesfield Borough Council
Paul Mahony* and Jonathan Porter* Countryscape
Rob Ramwell* Wythenshawe Partnership
Roy Stepney* University of Huddersfield
We acknowledge the support of the ODPM New Horizons Programme. Any views expressed in this report are not necessarily shared by the ODPM.
*Attendees at the workshop held as part of this research project on 29th and 30th March 2004 held at the University of Salford and Sacha’s Hotel, Manchester.
4
Chapter 1 Introduction 1.1 The Office of the Deputy Prime Minister (ODPM) commissioned the University of Salford to identify and explore examples of the innovative use of advanced Information and Communication Technology (ICT) to enhance decision making in the planning system. The research was carried out between 1st February and 19th April 2004. 1.2 The methodology employed in this research was based on:
• Producing an issues paper based on these two critical reviews. The first critical review was of emerging policies relating to e-governance, and a sustainable knowledge-based inclusive society in order to surface the drivers of change in urban spatial planning. The second review was of developing ICT applications and technology in the next two, five and ten years.
• Circulating the issues paper to key stakeholders including planning professions, academics, architects, ICT specialists and representatives of the voluntary and community sectors.
• Holding a one and half day workshop with key stakeholders during which there were demonstrations and discussions of future urban spatial planning workspace scenarios, and discussion of the issues paper.
• Collating the findings of the critical literature reviews and the workshop into a technical report (this document) and an issues paper.
1.3 The final report for this project comprises both the issues paper and the technical report. The issues paper sets out the main messages from the research with particular reference to the requirements of the New Horizons programme. In particular it identifies the key trends and drivers for change, discusses stakeholder participation, summaries the existing and emerging technologies and identifies the implications for future research and policy. This paper (the technical report) complements the issues paper by setting out details of key drivers for change, existing and emerging ICT applications and technologies, and describing how these applications may result in new ways of working. This report also contains and bibliography.
5
Chapter 2 Key Drivers for Change e-government and e-governance 2.1 In the widest sense e-government means exploiting the power of ICT to help transform the accessibility, quality and cost effectiveness of public services, and to help revitalise the relationship between customers and citizens and the public bodies who work on their behalf. 2.2 The concept of e-governance, as distinguished from e-government, has been widely used but it is often not clearly defined. For this project the term "e-governance" is taken as the capacity of cities and city regions working, in a dialectic exchange with social organisations, citizens and business, to deploy ICTs to develop and achieve urban policy goals. An important element of this is the role of ICT, not as a means in itself, but as an instrument of organisational innovation and new social contracts that:
• Establish new business models of government (supporting innovation, labour mobility, skills, education, entrepreneurship, etc.);
• Build strategic alliances that integrate across public and other sectors to reduce transaction costs and exploit economies of scale in service delivery and procurement;
• Develop citizenship based on e-Inclusion - equal community access to technology and information and opportunity for learning and personal development; and
• Provide for effective local e-Participation to counteract central pressures and decide local priorities.
2.3 The move towards e-government and e-governance is being driven forward by European and UK policy initiatives. 2.4 In July 2003 Ministers of the EU Member States, Acceding Countries, Candidate Countries and EFTA Countries met in Como for the European eGovernment Conference jointly organised by the Italian Presidency of the Council and the European Commission. Those present at this meeting exchanged views on implementing eGovernment in the framework of the eEurope 2005 and the eEurope+ 2003 Action Plans (European Union, 2003a). 2.5 Following the Como conference a Communication on eGovernment was adopted in September (European Union, 2003b). This is now the reference document for eGovernment policy of the European Commission. The Communication called for political commitment and proposed a roadmap to advance eGovernment as a means to realise more open, inclusive and productive public administrations in Europe. The Communication has been endorsed by the Council of Ministers. Their Conclusions reinforced the roadmap and proposed concrete actions, amongst others on pan-European services and authentication, cooperation in innovation and exchange of best practice. 2.6 Benchmarking for eGovernment in eEurope 2005 has been pursued as well and results can be found on the eEurope website (http://europa.eu.int/). A one-stop website for access to the eGovernment activities in the various EU programmes is

6
currently being set up, under eEurope 2005. These activities at EU level and especially the work happening throughout Europe has contributed to advancing eGovernment, which has become one of the most high profile parts of the eEurope 2005 Action Plan. 2.7 It is clear from this review that there is wide spread support for e-governance through out the European Union and that actions are under way to implement the policy. For example The PARSOL (Planning and Regulatory Services Online) e-gov project is developing a range of guidelines, benchmarks, schemas, systems and toolkits to assist Local Authorities in building effective and transparent online planning and regulatory systems. The Project is run by a consortium of Local Authorities led by Wandsworth Borough Council and financed by the Office of the Deputy Prime Minister. Support is provided by key national organisations - IDeA, RTPI, CIEH, LACORS, Planning Officers’ Society, SOCITM, The Planning Inspectorate through the Planning Portal Project, HSE and the Environment Agency (see www.parsol.gov.uk). 2.8 On 16th February 2004 The Office of the Deputy Prime Minister (ODPM) announced that it is establishing an integrated programme to bring together a whole raft of projects and initiatives designed to drive forward the e-planning agenda. An e-Programme Board and a dedicated team have been established as a focus for work in achieving the goal of ensuring every local planning authority is e-enabled by the end of 2005, allowing them to accept and process planning applications electronically (ODPM, 2004c). 2.9 The UK Government has set an overall target that 100% of all public services which can feasibly be provided online should be available by 2005. In addition there is also a drive towards electronic storage and management of new records by that date (The Scottish Executive, not dated). On line delivery is taken to include internet and other ICT provision, as well as telephone contact where the officer receiving the call uses electronic systems to provide the required service. In terms of planning services, this target will require the availability of full development control, enforcement and policy services. Related electronic services will include the submission of and payment for planning applications, making enforcement complaints, submission of consultation responses, viewing local policy documents and more general queries (Land Use Consultants and Business Efficiency, 2002). Some authorities are well down the road but others have a lot to do to meet the Government's 2005 target for electronic provision of planning services (Office of the Deputy Prime Minister, 2001). 2.10 Within the context of planning ICT provides the opportunities to improve the planning service through better use and sharing of information. Planning services encompass a broad spectrum of activities, including decision-making, policy development, enforcement, monitoring provision of information and receiving payment. Consequently the demands made upon planning related ICT systems are wide ranging. In carrying out their functions staff rely upon word processing packages, databases and spreadsheets, GIS and the internet, and document management systems, in addition to standard planning applications packages (Land Use Consultants and Business Efficiency, 2002).

7
2.11 The Best Value review system for local authority services now includes a Performance Indicator relating to Electronic Service Delivery (ESD). The Best Value Performance Indicator 157 (BVPI 157) for the year 2001-02 measures:
The percentage of interactions with the public, by type, which are capable of electronic service delivery and which are being delivered using internet protocols or other paperless methods.
2.12 The supporting text for the performance indicator identifies ten possible transaction types, including providing information, consultation, regulation, applications for services, and providing access to community, professional or business networks. The target for provision within each authority is to be set locally, but clearly local authorities will need to take account of the 2005 target in setting an appropriate target for the coming year. In addition, the Government sets minimum targets and provides guidance for local authorities on issues to take into account in setting their local targets. Such progress has been made towards achieving the Government’s target for public service delivery by 2005. 2.13 In Scotland the e-planning compact has been drawn up as the basis of co-ordination between central and local government to develop effective high quality and citizen-focused planning service delivery. It extends to development plans, general advice and policy information and the processing of planning and related applications and appeals, along with other important elements of the planning service. 2.14 It is foreseen that access to these services will be via a range of communication channels to suit different needs and preferences (The Scottish Executive, not dated). With regards to ICT these include:
• Internet for electronic access to planning services and information, • Kiosks or Digital TV for use when people do not have access to the
internet, • Mobile telephones allowing people to access and receive information
easily (The Scottish Executive, not dated). 2.15 Significant amongst the internet services is the UK Planning Portal. Portals are internet points of access for structuring information and services around the needs of citizens. The UK Planning Portal (http://www.planningportal.gov.uk) is provide a range of services including access to the latest planning news, determining if planning permission is required and how to go about obtaining it, accessing the development plans, regulations and guidance notes upon which the application and appeal procedures are based, and finding out about planning in the local area. 2.16 One example serves to illustrate how e-planning is being operationalised. Fareham Borough Council has published their e-Governance Strategy electronically (Farnham Borough Council, 2003). There are four elements to their strategy:
• e-service: making the Council’s services more accessible, improving services and developing new service options;
• e-democracy: supporting new political processes and embracing joined up electronic government at local, regional and national levels;
• e-community: leading strategies to ensure the economic, environmental and social well-being of the Borough’s communities;
8
• e-business: contributing to the local economy by attracting inward investment, supporting local businesses and developing the local infrastructure.
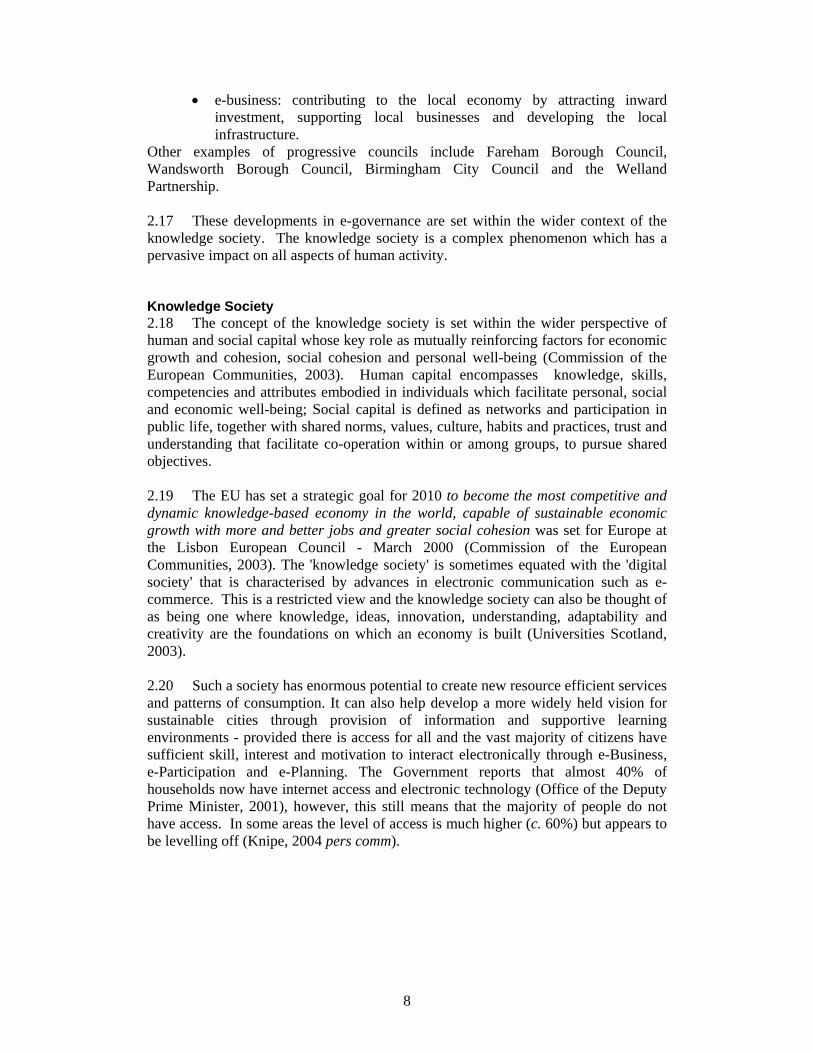
Other examples of progressive councils include Fareham Borough Council, Wandsworth Borough Council, Birmingham City Council and the Welland Partnership. 2.17 These developments in e-governance are set within the wider context of the knowledge society. The knowledge society is a complex phenomenon which has a pervasive impact on all aspects of human activity. Knowledge Society 2.18 The concept of the knowledge society is set within the wider perspective of human and social capital whose key role as mutually reinforcing factors for economic growth and cohesion, social cohesion and personal well-being (Commission of the European Communities, 2003). Human capital encompasses knowledge, skills, competencies and attributes embodied in individuals which facilitate personal, social and economic well-being; Social capital is defined as networks and participation in public life, together with shared norms, values, culture, habits and practices, trust and understanding that facilitate co-operation within or among groups, to pursue shared objectives. 2.19 The EU has set a strategic goal for 2010 to become the most competitive and dynamic knowledge-based economy in the world, capable of sustainable economic growth with more and better jobs and greater social cohesion was set for Europe at the Lisbon European Council - March 2000 (Commission of the European Communities, 2003). The 'knowledge society' is sometimes equated with the 'digital society' that is characterised by advances in electronic communication such as e-commerce. This is a restricted view and the knowledge society can also be thought of as being one where knowledge, ideas, innovation, understanding, adaptability and creativity are the foundations on which an economy is built (Universities Scotland, 2003). 2.20 Such a society has enormous potential to create new resource efficient services and patterns of consumption. It can also help develop a more widely held vision for sustainable cities through provision of information and supportive learning environments - provided there is access for all and the vast majority of citizens have sufficient skill, interest and motivation to interact electronically through e-Business, e-Participation and e-Planning. The Government reports that almost 40% of households now have internet access and electronic technology (Office of the Deputy Prime Minister, 2001), however, this still means that the majority of people do not have access. In some areas the level of access is much higher (c. 60%) but appears to be levelling off (Knipe, 2004 pers comm).
9
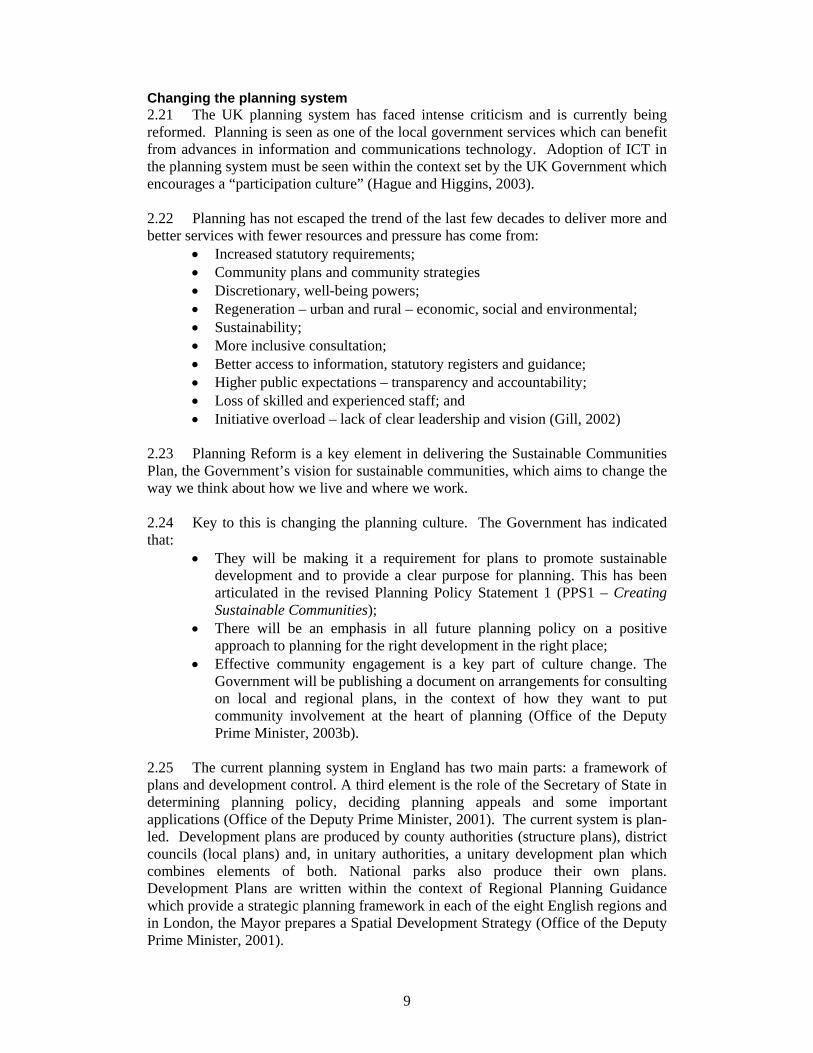
Changing the planning system 2.21 The UK planning system has faced intense criticism and is currently being reformed. Planning is seen as one of the local government services which can benefit from advances in information and communications technology. Adoption of ICT in the planning system must be seen within the context set by the UK Government which encourages a “participation culture” (Hague and Higgins, 2003). 2.22 Planning has not escaped the trend of the last few decades to deliver more and better services with fewer resources and pressure has come from:
• Increased statutory requirements; • Community plans and community strategies • Discretionary, well-being powers; • Regeneration – urban and rural – economic, social and environmental; • Sustainability; • More inclusive consultation; • Better access to information, statutory registers and guidance; • Higher public expectations – transparency and accountability; • Loss of skilled and experienced staff; and • Initiative overload – lack of clear leadership and vision (Gill, 2002)
2.23 Planning Reform is a key element in delivering the Sustainable Communities Plan, the Government’s vision for sustainable communities, which aims to change the way we think about how we live and where we work. 2.24 Key to this is changing the planning culture. The Government has indicated that:
• They will be making it a requirement for plans to promote sustainable development and to provide a clear purpose for planning. This has been articulated in the revised Planning Policy Statement 1 (PPS1 – Creating Sustainable Communities);
• There will be an emphasis in all future planning policy on a positive approach to planning for the right development in the right place;
• Effective community engagement is a key part of culture change. The Government will be publishing a document on arrangements for consulting on local and regional plans, in the context of how they want to put community involvement at the heart of planning (Office of the Deputy Prime Minister, 2003b).
2.25 The current planning system in England has two main parts: a framework of plans and development control. A third element is the role of the Secretary of State in determining planning policy, deciding planning appeals and some important applications (Office of the Deputy Prime Minister, 2001). The current system is plan-led. Development plans are produced by county authorities (structure plans), district councils (local plans) and, in unitary authorities, a unitary development plan which combines elements of both. National parks also produce their own plans. Development Plans are written within the context of Regional Planning Guidance which provide a strategic planning framework in each of the eight English regions and in London, the Mayor prepares a Spatial Development Strategy (Office of the Deputy Prime Minister, 2001).
10
2.26 The system by which planning applications are determined is known as development control. Development control authorities are normally the districts and unitary authorities responsible for putting local plans in place. Development control is the process by which decisions are made on applications to develop land or buildings or to change their use. In 2000 some 550,000 planning applications were submitted (Office of the Deputy Prime Minister, 2001). 2.27 The UK Government has brought forward the Planning and Compulsory Purchase Bill which in April 2004 was entering the final stages of the parliamentary process (Hill, 2004). The Bill introduces regional spatial strategies and local development frameworks. These are based on spatial planning; a broader, more visionary approach than simple development control policy making, focusing on integrating and delivering economic, social and environmental objectives (Hill, 2004). The current system of structure plans, local plans and unitary development plans will be abolished and replaced with a new single level of plan. This would be known as a Local Development Framework and consist of:
• a statement of core policies setting out the local authority's vision and strategy to be applied in promoting and controlling development throughout its area;
• more detailed action plans for smaller local areas of change, such as urban extensions, town centres and neighbourhoods undergoing renewal; and
• a map showing the areas of change for which action plans are to be prepared and existing designations, such as conservation areas (Office of the Deputy Prime Minister, 2001).
2.28 An amendment to the Planning and Compulsory Purchase Bill has put in a requirement for the developers to engage with the community before an outline application is submitted. This will be seen as just another overhead by the developers, but does encourage early community participation in the planning process. 2.29 The ODPM (2003c) in their report on Participatory Planning for Sustainable Communities stated that a change in the culture of planning is required. This means changing from 'public participation' (defined in the report as “led by the planning authority and built around the assumption that their plan already represents a basis for consensus”) to 'participatory planning' (defined as “in which diverse groups and agencies come together to exchange information, explore common ground and negotiate in an attempt to achieve consensus”). Such change in culture raises questions relating to the barriers to participation and to developing techniques to overcome these barriers (Hague and Higgins, 2003). On a wider scale Agenda 21, agreed at the 1992 Rio Conference (United Nations, 1993) and other environmental agreements (UNECE, 1998) stress the importance of public participation in land use management. 2.30 As part of the reform of the planning system Planning Policy Statements (PPSs) will replace Planning Policy Guidance. Consultation on PPS1 – Creating Sustainable Communities is due to be completed by 21st May 2004. In the consultation draft it is stated that: PPS1 supports the reform programme and, in particular, the Government’s objectives for planning culture change, by setting out the Government’s vision for planning, and
11
the key policies and principles which should underpin the planning system. These are built around three themes: – Sustainable development – the purpose of the planning system. – The spatial planning approach. – Community involvement in planning (ODPM, 2004a). Strategies for ensuring progress towards these objectives are detailed in the ODPM’s document Community Involvement in Planning: The Government’s objectives (ODPM, 2004b) 2.31 The Planning and Compulsory Purchase Bill, which in April 2004 was entering the final stages of the parliamentary process, will require that each council produces a Development Framework. This Framework would contain a Statement of Community Involvement, setting out how the community should be involved in both the continuing review of the Framework and in commenting on significant planning applications. It is recognised by the ODPM that new technology may offer new ways of carrying out consultation (Office of the Deputy Prime Minister, 2001). 2.32 There is a clear suggestion here that stakeholder involvement will become increasingly important. Within the constraints of the physical world the actions and interplay between stakeholders determine and shape the way cities develop. Understanding stakeholder roles, actions and behaviour is central to understanding the evolving city and how changes in attitude and behaviour and ultimately in stakeholder requirements can achieve the conditions for a sustainable knowledge society, e.g. by a combination of information, education, debate, fiscal incentives and legislation. 2.33 The ODPM (2004b) state that the barriers to participation are: – The costs of participation for local communities (and for the planning authorities running community involvement exercises). – The complexity of many of the issues. – Planning can seem a remote, bureaucratic process which does not encourage involvement. – The difficulties of identifying and reaching the different groups within a community. – The language of planning, with its reliance on technical expressions and jargon, can be off-putting. Sometimes planners can inadvertently reinforce the barrier through the way they communicate. – The perception that community involvement exercises will be captured by individuals or articulate groups which dominate proceedings. Community involvement is not about giving a free hand to unrepresentative vocal groups to block development irrespective of the case for it. Nor is it about talking to a few, favoured organisations. 2.34 An exploration of barriers was undertaken during the workshop held on 29th and 30th March 2004 as part of this research. It supplements earlier work undertaken at the second INTELCITY workshop held in Brussels in November 2002, supplemented by discussion with city authorities and ICT companies in the second half of that project. 2.35 The findings from the INTELCITY workshop are summarised in Table 2.1 (Curwell and Hamilton, 2003).

12
Table 2.1: Key Factors contributing to barriers to stakeholder involvement in planning
• Lack of e skills and of awareness of the potential of advanced ICTs in planning.
• Lack of access to cyber space • Lack of financial resources and economic
uncertainty • Lack of demand for sustainable goods
and services • Lack of a market for e-planning
• Lack of incentives for change /business as usual, plus NIMBYism (Not in my backyard)
• Information overload • Information security/anonymity • Problem complexity and lack of adequate
decision making and modelling tools • Lack of empowerment and participation
2.36 Since the INTELCITY workshop the perception of the barriers has changed. In particular the market for e-planning has developed as a result of the drive for the electronic delivery of services by 2005 and initiatives undertaken as part of the PARSOL programme. Barriers - Information society dimensions 2.37 The technical problem(s) of creating an integrated ICT infrastructure to support more sustainable urban re/development in cities is considered, by the workshop participants, to be surmountable. Greater concern is expressed over socio-economic problems, such as the availability of resources, financial and human. Most cities face financial stringencies and constraints on investment, with shortage of personnel with adequate levels or e-skill capability, therefore these issues form key barriers. 2.38 City authorities, e.g., planning, development control, local transport providers, etc., are not seen as a sufficiently large market by software and hardware developers. The sector presents economic uncertainty due to high development costs, complexity of the problem and extended time to bring to market. This is compounded by the fact that, as yet, the direct economic as well as other intangible benefits of new forms of information utility service in cities are unclear. Thus expecting the free market to deliver such systems, in time scales envisaged (i.e. by 2010) is an important barrier. On the other hand, the alternative of creating new forms of public/private partnership in this area is in itself problematic: Will people engage? What new forms of governance will emerge? Will participation solve the problems or create new ones? 2.39 The ‘digital divide’ i.e., lack of access to ICTs combined with poor ‘e skills’ in a significant proportion of the population represent a most important barrier, true of both professional actors (planners, engineers, civil servants and politicians), as well as with individual citizens. Within this lack of awareness of the potential of ICTs in planning is important. Information overload, access to and security of data are seen as rapidly developing issues.
13
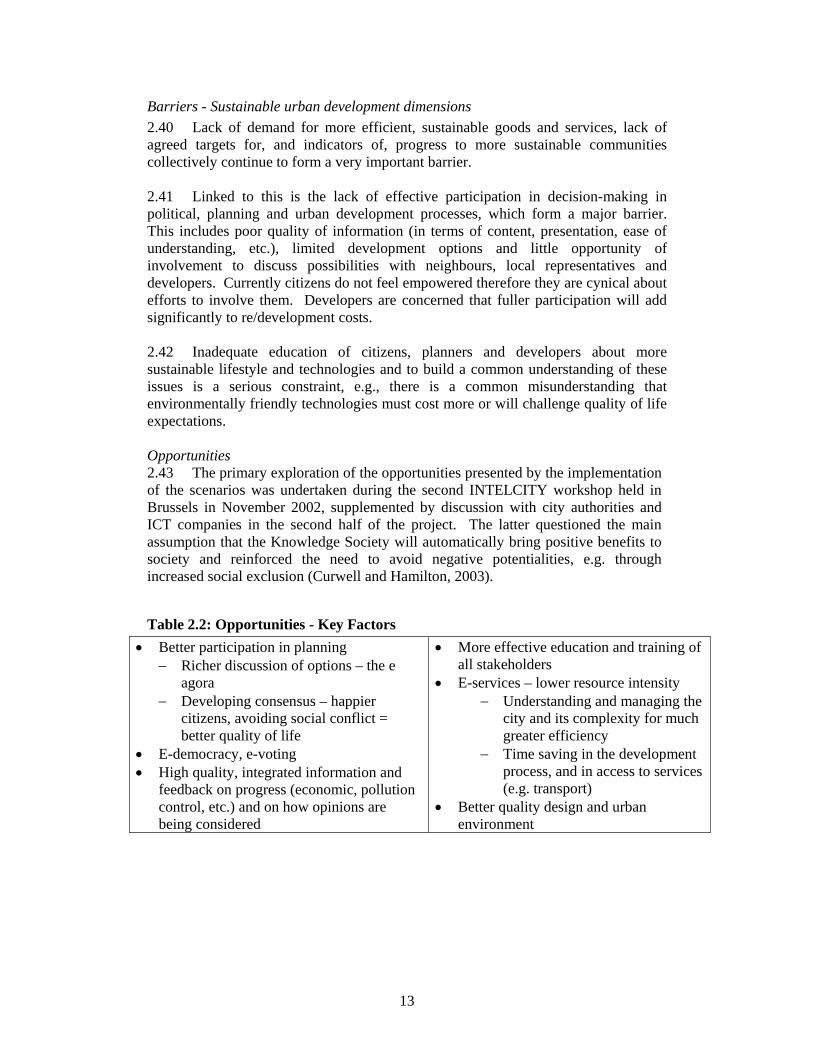
Barriers - Sustainable urban development dimensions 2.40 Lack of demand for more efficient, sustainable goods and services, lack of agreed targets for, and indicators of, progress to more sustainable communities collectively continue to form a very important barrier. 2.41 Linked to this is the lack of effective participation in decision-making in political, planning and urban development processes, which form a major barrier. This includes poor quality of information (in terms of content, presentation, ease of understanding, etc.), limited development options and little opportunity of involvement to discuss possibilities with neighbours, local representatives and developers. Currently citizens do not feel empowered therefore they are cynical about efforts to involve them. Developers are concerned that fuller participation will add significantly to re/development costs. 2.42 Inadequate education of citizens, planners and developers about more sustainable lifestyle and technologies and to build a common understanding of these issues is a serious constraint, e.g., there is a common misunderstanding that environmentally friendly technologies must cost more or will challenge quality of life expectations. Opportunities 2.43 The primary exploration of the opportunities presented by the implementation of the scenarios was undertaken during the second INTELCITY workshop held in Brussels in November 2002, supplemented by discussion with city authorities and ICT companies in the second half of the project. The latter questioned the main assumption that the Knowledge Society will automatically bring positive benefits to society and reinforced the need to avoid negative potentialities, e.g. through increased social exclusion (Curwell and Hamilton, 2003).
Table 2.2: Opportunities - Key Factors • Better participation in planning
− Richer discussion of options – the e agora
− Developing consensus – happier citizens, avoiding social conflict = better quality of life
• E-democracy, e-voting • High quality, integrated information and
feedback on progress (economic, pollution control, etc.) and on how opinions are being considered
• More effective education and training of all stakeholders
• E-services – lower resource intensity − Understanding and managing the
city and its complexity for much greater efficiency
− Time saving in the development process, and in access to services (e.g. transport)
• Better quality design and urban environment

14
Opportunities - information society dimensions 2.44 ICTs offer many opportunities to improve the quality of the built environment through new forms of e commerce, better planning, urban and building design tools as well as through improved planning processes. Advances in ICT models as well as integration of systems (e.g. N-dimensional (ND) modelling, linked GIS, VR and Computer Aided Design (CAD)) will enable the complexity represented by the metabolism of the city to be better understood and managed, which is seen to offer a number of interrelated opportunities:
• Significant reductions in resource use intensity through greater use of e services and new forms of e commerce;
• High quality, up-to-date information on the city, e.g., pollution levels, congestion, etc. and also to manage anti-social behaviour effectively;
• Better visualisation and broader understanding of the implications (economic, environmental and social) of various re/development options;
• More effective re/development decision support with lower risk of ‘poor‘ decisions based on incomplete data sets or limited scope of analysis;
• Speedier access to information, or more timely information flows, leading to quicker decision-making, removing barriers to re/development decision-making and the associated investment thus lowering financial risks;
• Wider participation and empowerment through the virtual exchange of experience and knowledge, e-governance and e-voting;
• Automatic information gathering to produce real time models to support citizens e.g. with information about traffic and also in the longer term to produce better models of the city; and
• Dynamic models which constantly update how the city works. Opportunities – sustainable urban development dimensions 2.45 More inclusive, richer participatory processes are seen as an important way of achieving effective citizen commitment to life-style changes necessary for environmental improvements, e.g., for changes in behaviour such as greater use of public rather than private transport. 2.46 Wider access to information about individual consumption patterns, their effect on the environment and on the social fabric, is an important educational tool for all stakeholders. 2.47 The opportunity for wider discussion enriches the traditional process of social interaction, advocacy and discussion essential to developing a broader consensual view of the nature of the city and the changes necessary for its sustainable improvement, regeneration and renewal in economic, socio-cultural and environmental terms. 2.48 It is anticipated that together these factors can reduce social tension and thus support a better quality of life.
15
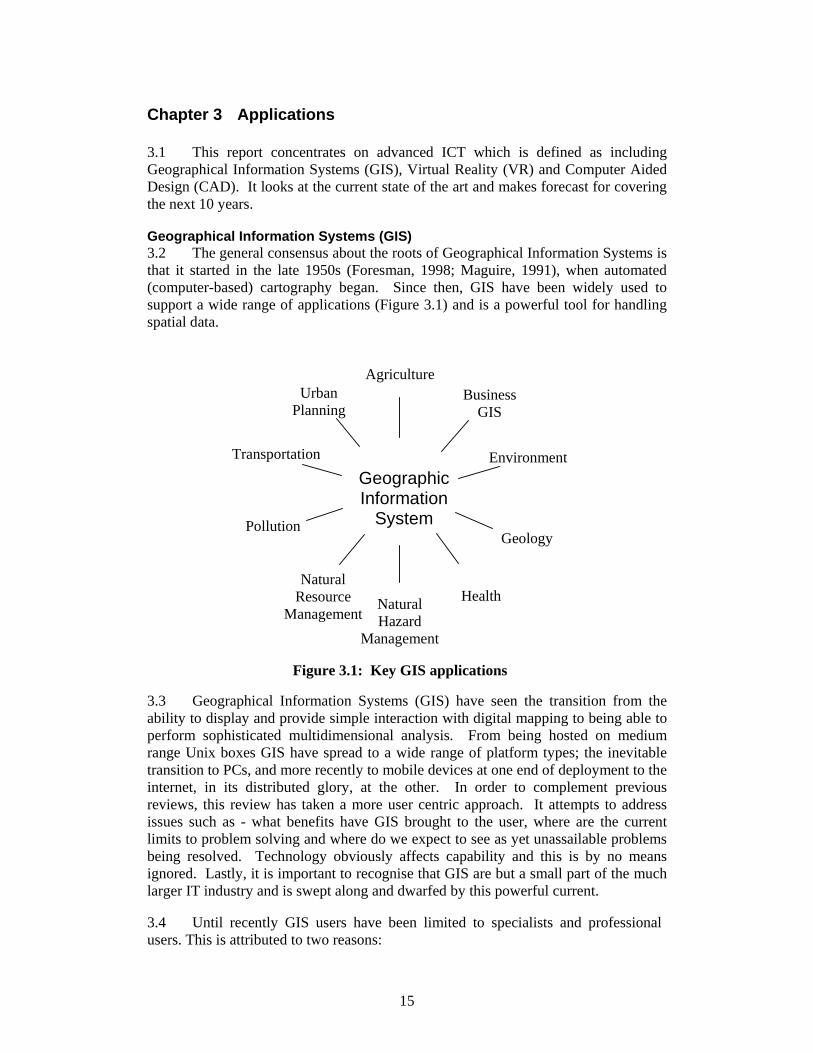
Chapter 3 Applications 3.1 This report concentrates on advanced ICT which is defined as including Geographical Information Systems (GIS), Virtual Reality (VR) and Computer Aided Design (CAD). It looks at the current state of the art and makes forecast for covering the next 10 years. Geographical Information Systems (GIS) 3.2 The general consensus about the roots of Geographical Information Systems is that it started in the late 1950s (Foresman, 1998; Maguire, 1991), when automated (computer-based) cartography began. Since then, GIS have been widely used to support a wide range of applications (Figure 3.1) and is a powerful tool for handling spatial data.
3.3 Geographical Information Systems (GIS) have seen the transition from the ability to display and provide simple interaction with digital mapping to being able to perform sophisticated multidimensional analysis. From being hosted on medium range Unix boxes GIS have spread to a wide range of platform types; the inevitable transition to PCs, and more recently to mobile devices at one end of deployment to the internet, in its distributed glory, at the other. In order to complement previous reviews, this review has taken a more user centric approach. It attempts to address issues such as - what benefits have GIS brought to the user, where are the current limits to problem solving and where do we expect to see as yet unassailable problems being resolved. Technology obviously affects capability and this is by no means ignored. Lastly, it is important to recognise that GIS are but a small part of the much larger IT industry and is swept along and dwarfed by this powerful current. 3.4 Until recently GIS users have been limited to specialists and professional users. This is attributed to two reasons:
Transportation
Agriculture Business
GIS
Environment
Geology
Health
Pollution
Natural Hazard
Management
Natural Resource
Management
Urban Planning
Geographic Information
System
Figure 3.1: Key GIS applications
16
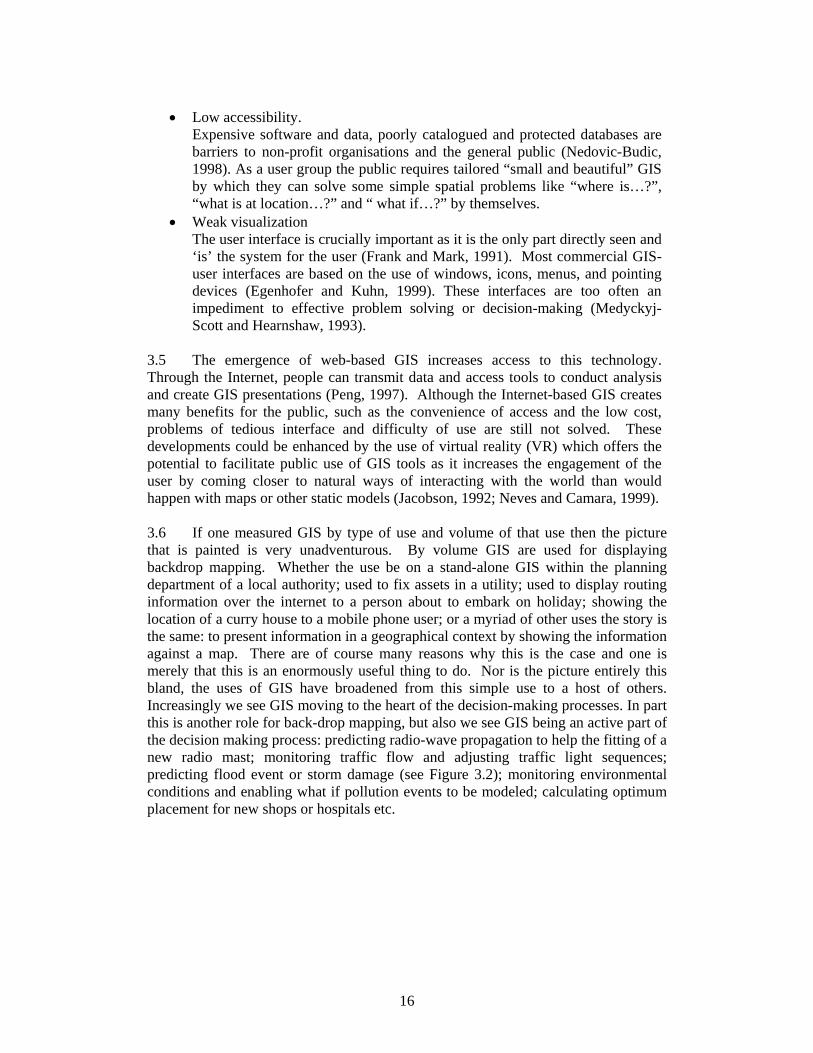
• Low accessibility.
Expensive software and data, poorly catalogued and protected databases are barriers to non-profit organisations and the general public (Nedovic-Budic, 1998). As a user group the public requires tailored “small and beautiful” GIS by which they can solve some simple spatial problems like “where is…?”, “what is at location…?” and “ what if…?” by themselves.
• Weak visualization The user interface is crucially important as it is the only part directly seen and ‘is’ the system for the user (Frank and Mark, 1991). Most commercial GIS-user interfaces are based on the use of windows, icons, menus, and pointing devices (Egenhofer and Kuhn, 1999). These interfaces are too often an impediment to effective problem solving or decision-making (Medyckyj-Scott and Hearnshaw, 1993).
3.5 The emergence of web-based GIS increases access to this technology. Through the Internet, people can transmit data and access tools to conduct analysis and create GIS presentations (Peng, 1997). Although the Internet-based GIS creates many benefits for the public, such as the convenience of access and the low cost, problems of tedious interface and difficulty of use are still not solved. These developments could be enhanced by the use of virtual reality (VR) which offers the potential to facilitate public use of GIS tools as it increases the engagement of the user by coming closer to natural ways of interacting with the world than would happen with maps or other static models (Jacobson, 1992; Neves and Camara, 1999). 3.6 If one measured GIS by type of use and volume of that use then the picture that is painted is very unadventurous. By volume GIS are used for displaying backdrop mapping. Whether the use be on a stand-alone GIS within the planning department of a local authority; used to fix assets in a utility; used to display routing information over the internet to a person about to embark on holiday; showing the location of a curry house to a mobile phone user; or a myriad of other uses the story is the same: to present information in a geographical context by showing the information against a map. There are of course many reasons why this is the case and one is merely that this is an enormously useful thing to do. Nor is the picture entirely this bland, the uses of GIS have broadened from this simple use to a host of others. Increasingly we see GIS moving to the heart of the decision-making processes. In part this is another role for back-drop mapping, but also we see GIS being an active part of the decision making process: predicting radio-wave propagation to help the fitting of a new radio mast; monitoring traffic flow and adjusting traffic light sequences; predicting flood event or storm damage (see Figure 3.2); monitoring environmental conditions and enabling what if pollution events to be modeled; calculating optimum placement for new shops or hospitals etc.

17
Figure 3.2: Use of GIS in flood risk modelling (Matthew Faulk and Ordnance Survey ©Crown Copyright. All rights reserved.)
3.7 GIS are becoming ever more useful and its uses are directly affecting more and more people. Indeed, that this is the case can be seen by the peripheral awareness of GIS that many television viewers now have of the technology, an awareness developed through the use of GIS within popular programmes such as the Channel 4 programme -Time Team. 3.8 GIS have seen the transition from the ability to display and provide simple interaction with digital mapping to being able to perform sophisticated multidimensional analysis. Whereas once upon a time GIS use was limited to stand-alone applications GIS today are available on a wide variety of platforms; the inevitable transition to PCs, and more recently to mobile devices at one end of deployment and to the internet at the other. 3.9 GIS are now exploiting the potential of the Web and has moved rapidly from applications that were able to do little more than serve raster maps to those that support fully-fledged feature servers. The ability of the Internet user to interact with such applications continues to rise with desktop functionality becoming increasingly achievable. 3.10 GIS have not been slow to emerge in mobile applications, perhaps because it is a natural area for it to exploit. Here the applications are much more limited to backdrop mapping types, but even here there is increasing use both for data collection and analysis. The ability to mount Global Positioning System (GPS) into these devices, for them to communicate with others, to perform simple analysis and for this capability to be increasingly available on mobile phones presents enormous opportunities. The general picture then is of technology opening up opportunities for GIS and of GIS beginning to seize these opportunities. 3.11 There is a clear trend observable - spatial data is moving from the GIS tool to mainstream databases. This trend is also a general trend within GIS, as time progresses GIS are increasingly merging with information management technologies. Where once GIS would have been seen as providing stand-alone analysis functions, it
18
is now being increasingly incorporated as an integral component of enterprise level applications. Many end-users are beginning to use GIS without realizing it. 3.12 On the horizon there is the GRID. Where there is a network of computers that belong to the GRID, the resources of all the computers in the Network are available to all the users. Hence, the advantage is the aggregation of resources that having access to GRIDS provide. How it will develop and differentiate from the Web remains to be seen. One thing is certain GIS will provide resources for the GRID. The large volumes of data and the complex processing requirements often associated with spatial data make it a good candidate for the provision of GRID services. What is unclear is whether this will challenge the way GIS are constructed or merely provide another platform for its expression in its current form. 3.13 We could for example see GIS broken into components, tools for a toolbox distributed across the plant. GIS then would become divided into those providing tools, and those proving service to enable users to gather tools and data together to provide end solutions and those that provided packaged service based solutions. 3.14 From a data model perspective GIS have still to cross the great divide between Fields and Objects or as it is more usually (and simplistically) seen between raster and vector representations. Within the vector representation there is another great divide i.e. that which exists between layer and object based architectures. The processing of fields is still in its infancy and remains very much the junior partner with GIS in terms of usage. Models to support field-based analysis are developing. Grids and raster representations have been used for a long time and the emergence of TINs (triangulated integrated networks) was also some time ago. But all these models are rather crude and all suffer from the need to support very large data volumes and consequent lengthy processing. 3.15 Usage is thus restricted to largely scientific purposes from cover type analysis to terrain modeling. It is becoming ever more possible to extract information direct from remotely sensed data representing continuous coverages using semi-automated processing, although full automation remains a distant hope. Also on the horizon is the representation of such information by algorithms but this remains largely theory. 3.16 With respect to vector models, the industry is dominated by layer based systems that are based on what may be termed first generation architecture. In such models the emphasis is placed on geometry, each layer representing a specific geometry – perhaps building footprints or agricultural fields. Where a feature may be represented by more than one geometry, multiple layers are required with little direct support for inter-relationships. The ability of these systems to resolve relationships through spatially overlaying different layers is one of their key features. 3.17 Needless to say the explicit representation and manipulation of topological relationships is not a strength within this architecture. A more recent approach and again following in the tracks of mainstream IT, has been a feature or object based approach. At present although fully object oriented GIS do exist they are in the minority especially in terms of deployed systems. The feature based approach offers the advantages of enabling models to be developed that are more natural

19
representations of the problem domain (humans tend to think in terms of frames or objects). 3.18 But it is noticeable that whilst GIS may progress over time from layers to objects we are still dealing for the most part with two-dimensional worlds. Where is height? Where is time? In truth neither is handled well by existing GIS and it can be argued that no mainstream IT solution is particularly competent with the temporal dimension. The lack of good 3-dimensional models acts as an inhibitor to the application of GIS in many areas. Perhaps the industry needs to look in the direction of gaming for inspiration, although it may not only find direction but perhaps also too many short cuts. Nevertheless there is increasing demand for the third dimension, whether it is for analysis, simulation, planning, gaming, augmented reality and so on. So the demand is there and rising but, for the immediate future, the lack of good models will relegate 3D models to specialist areas often with access to specialist resources, or to gaming where areas are limited or compromises are made between reality (and the detail shown) and game play. 3.19 Time also presents challenges and as with space there are counterparts to fields and features – processes and event. Time is often ignored completely by GIS and no mainstream GIS have any integral ability to support temporal models, although some provide add-on modules that enable some limited temporal representation and analysis. Historical data exists largely as snap-shots and is rarely held on-line. In many respects time is much further behind than space and there is for example little agreement on how to represent events and processes and even argument as to whether events and processes are just at different ends of a continuum. 3.20 Where time has been successfully incorporated into GIS it has been with respect to processing real time data, perhaps traffic flow information or vehicle tracking. But here the solution has been to hide the temporal aspect from the GIS solution, essentially presenting a series of rapid updates. 3.21 Thus the ability to provide full 4D dimensional GIS solutions is far off, lacking both internal models and efficient spatio-temporal databases to support those models. So, for the foreseeable future true 3D or temporal solutions are only likely to be implemented within specialist high-end systems, in answer to problems sufficiently important to warrant the investment, or in stripped down form making many compromises, perhaps to provide gaming. 3.22 An emerging issue in ICT is interoperability. It is important to recognize that the principal issue is the ability of GIS (and other information systems) to exchange data such that information is not lost in the exchange process and to do so with minimal impedance. With the creation of the Web; a growing recognition that Geographical Information (GI) data should be regarded as an enterprise level asset and with increased realization of the value of GI data as a tradable asset the Open GIS Consortium (OGC) was formed to provide open standards for GIS. The OGC has undoubtedly made its mark. It has developed standard forms for the representation of geometry and topology, developed a truly international open transfer format (GML) based on XML (an output from the PARSOL and other national projects) and defined a simple data model that supports the feature based representation of geographical
20
entities. ISO have adopted much of this work and all major software vendors have committed to OGC initiatives. 3.23 Importantly what this has meant is that more and more people are recognizing that interoperability gives the potential to move data with relative ease and in combination with initiatives from the World Wide Web Consortium (W3C) means that Web based geographic information services (and service chains) are becoming possible. The focus is beginning to move away from packaged products to on-line services, certainly available to the conventional desktop PC user, but also to users of mobile services and perhaps in the near further to Digital (DTV) viewers too. And, what is possible in commercial settings also offers governmental and intrabusiness connectivity – perhaps beginning to enable ‘Joined-up Government’ and to make it more than just a phrase. Creating environments where geographic information services are relatively easy to create are dependent on many more things than the technical ability to support interoperability. There are unresolved issues over Intellectual Property rights (IP), pricing models, service infrastructure and so on. 3.24 The difficultly in producing good data, of known quality, is probably the biggest impediment to the future expansion of GIS As it stands today the majority of data has been collected for one purpose and may not easily be used for another. It is typically not maintained and the quality will not have been measured. Very probably no metadata (i.e. data about data; information about data which allows one data set to be combined with other data sets) exists to describe the dataset or the data within the dataset. All of these factors create enormous impediments to the widespread use of geographic data and the expansion of GIS. The industry is at the stage of problem recognition; it has not yet begun to address the issues in a serious manner. There are of course exceptions, but these are exceptions rather than the rule. Recognition and development of metadata is perhaps the most advanced. Metadata discovery services based on metadata standards are available although it can be argued that these are not yet flourishing. Organisations such as OGC and initiatives such as DNF recognize the need to create a common syntax and develop common rules for the capture and maintenance of geographic data. OGC in particular has been established for long enough to have begun to make an impact as was discussed above. But what of data quality? Here little has been done to even define basic quality measures. Even positional accuracy remains ill defined. Datasets that attempt to record all features of a certain type often make claims as to their completeness, but no real measures exist that can be reliably tested. This certainly remains an area where development is required. 3.25 Overall we can be optimistic about the progress that technology is making in both hardware and software terms; technology per se is not a major limiting factor, rather it serves to create opportunities and new openings for GIS and GIS supported applications. As this happens so the edges between GIS and IT in general blur. GIS technology is being subsumed into the mainstream, and whilst it will begin to loose its individual identity it will gain ubiquitous usage.
21
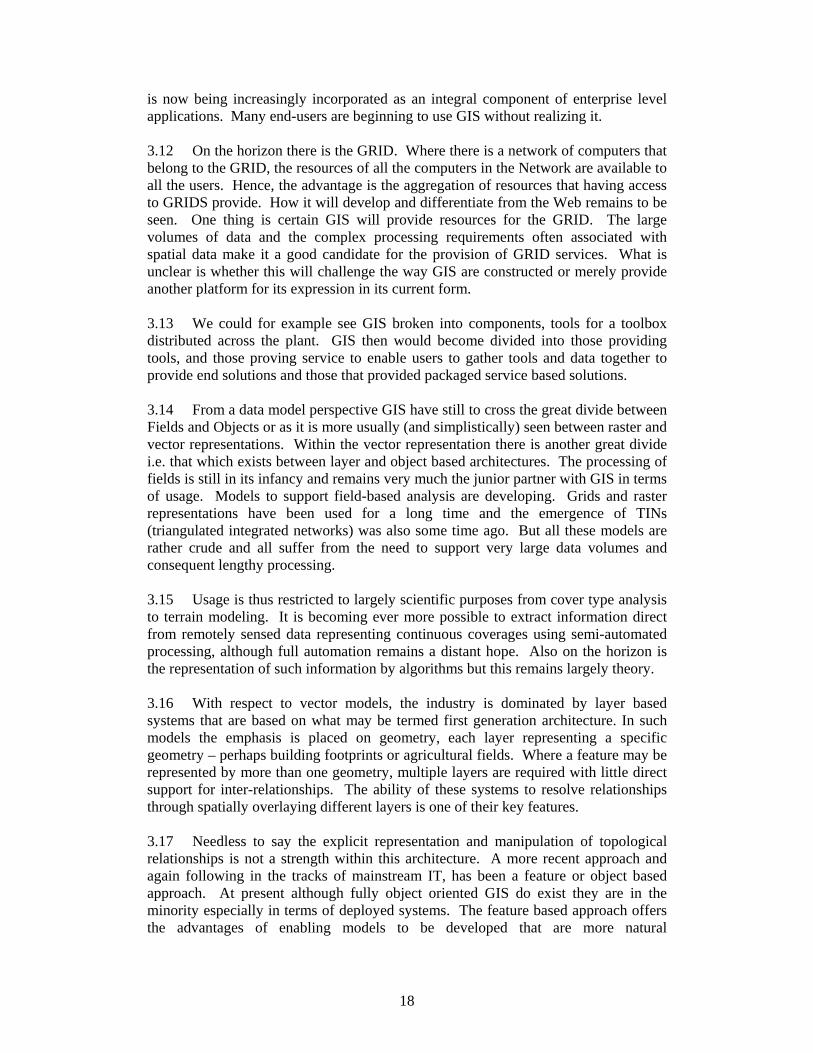
Modelling 3.26 Over the last decade, there have been many applications of 3D modelling and visualization technologies for supporting the urban planning process. This provides an excellent opportunity to view change in the urban landscape. The ability of GIS to provide greater contextual information (see Figure 3.3) will however prove as important as the visual rendering. It is also worth noting how, when the modelling of the fourth dimension is overcome, the ability to witness urban environments changing over time will be hugely powerful. With respect to 3D visualisation this section summarizes few of these applications. 3.27 Whilst the limiting factors of true 3D and indeed 4D GIS are well documented above, it is worth noting that significant advancements have been made in the use of GIS as a means to providing not only ‘building blocks’ for urban simulation, but additionally, for providing contextual information (as attributes) for buildings. Figure 3.3 below highlights how building footprint and other topographic data (when combined with height data and other geometric information) can render urban scenes using CAD packages.
Figure 3.3: 3D modelling from 2D mapping data (Ordnance Survey © Crown Copyright. All rights reserved)
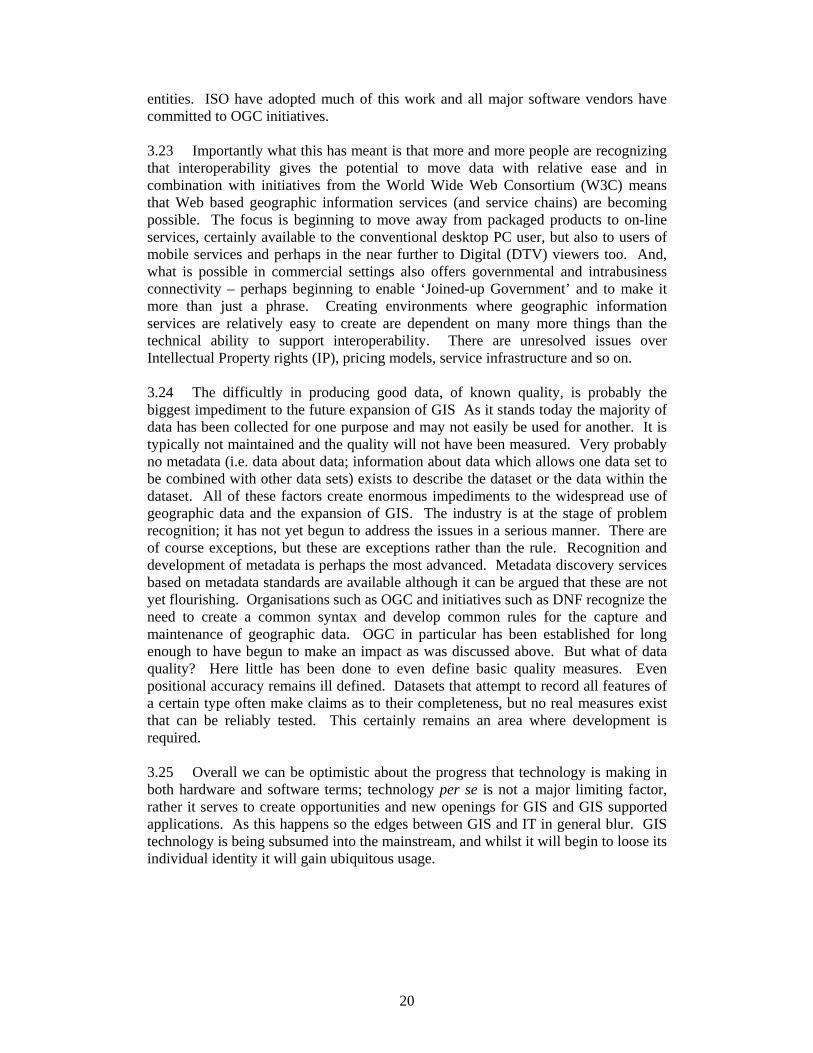
3.28 2D mapping data can also be used to not only generate 2.5D urban scenes but contextual information can be provided through the querying of that data. 3.29 Jepson and Friedman (not dated) presented an urban simulation system which combines VR, GIS and database technology, to establish a 3D urban simulation environment of Los Angeles Basin, USA (Figure 3.4). This project covers an area of about 10,000 square miles and scales from satellite views of the L.A. basin to street level views, accurate enough to allow the signs in the windows of the shops and the graffiti on the walls to be legible. The modelling of the environment has been carried out using a VR modelling package called MultiGen. In this project, a large multi-client server has been deployed to support the real-time visualization.
22
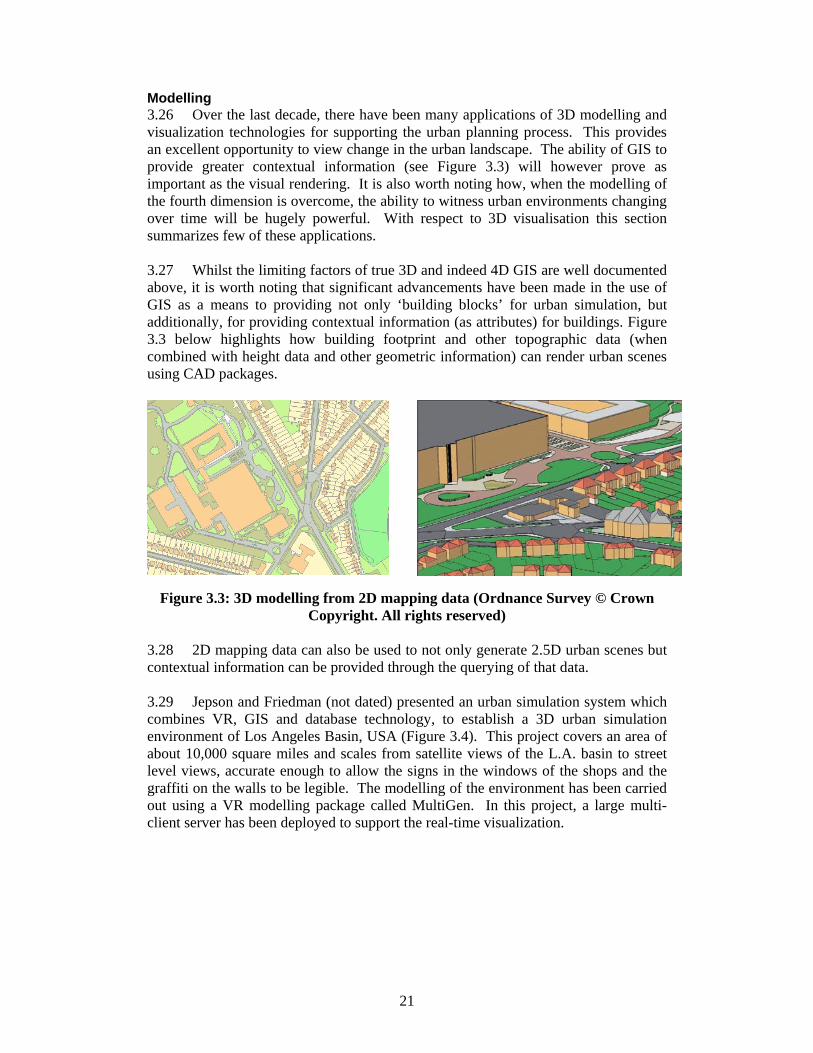
3.30 Bourdakis and Day (1997) created a Bath model in 1992 using the AutoCAD CAD workpackage, covering several square kilometres of the historic centre of Bath, accurate to the sub-metre level (Figure 3.5). They have managed to achieve considerable amount of realism using textures. City planners have used the model to test the visual impact of a number of proposed developments for the city’s future. The CAD model was also converted to VRML (Virtual Reality Modelling Language) model so that it can be visualized through the internet (Bourdakis, 1997). The advantage of this method is that the browser is available at minimal cost, the application is platform independent and models can be transferred across the Internet. On the other hand, the complexity of scene is limited by the bandwidth of Internet.
Figure 3.5: AutoCAD screenshot of one element of the Bath Model
(http://www.bath.ac.uk/casa/completed/views.html)
Figure 3.4: 3D model of Los Angeles using MultiGen (Jepson and Friedman, not dated)

23
3.31 Another IT application for supporting urban planning is the Woodberry Down project (Hudson-Smith and Evans, 2001) which attempts to increase the public’s involvement in the council’s regeneration schemes by providing free computers and internet access to thirty key residents. The residents can link to web site of this area’s regeneration plans which integrates 3D models, GIS, general information and a bulletin board where residents can post their views on the proposed plans. The process of engagement is designed to be fully interactive, with residents being able to see information regarding proposed solutions in their area, and communicating their views and proposals to the Regeneration Team and to other residents. The advantage of this scheme is that it involves the public in the planning process at every stage. Data capture 3.32 There are many data capturing techniques to support the construction of 3D urban environments to facilitate the visualization of complex urban structures. These techniques vary from simple 2D digital maps to detailed CAD models with textures to improve visual realism. However, the use of these techniques to construct a urban model which is realistic in terms of its visual content, geometric content and semantic content is still a challenging task. This section summarizes the techniques available to support the construction of virtual urban environments. The data capturing and modelling techniques have been categorized according to the underlying data representations (2D pixel-based, 3D pixel-based, 2D geometry-based, 2.5 geometry-based and 3D geometry-based).
2D Pixel-Based Techniques 3.33 In this approach, photographs are used to capture urban environments either at ground level (terrestrial images) or from the sky (aerial photographs).
3.34 The terrestrial images can be useful for presenting still pictures of an area from different view points. However, obtaining suitable viewpoints for image acquisition can be problematic due to physical restrictions in reaching such view points. Recently, such photographic techniques have been applied to create panoramic images to cover 360° field of view from a given point. A panoramic image can provide highly realistic images from all angles and capture an urban area complete with people, vehicle and street furniture. The panoramic images can be an inexpensive solution for pseudo-3D visualization (Figure 3.6).

24
Figure 3.6: Panoramic Image of Trafalgar Square, London (http://www.panoguide.com/gallery/)
3.35 Aerial Photographs (Figure 3.7) provide a rapid and efficient way of visualizing large urban areas from a bird’s eye view. It provides a global view of the area of interest in relation to the surrounding areas. Two terrestrial images or two aerial photographs, taken from two view points (left eye and right eye), can be combined to create stereoscopic views of the environment. Such stereoscopic images can give a user the illusion that he/she is looking at a 3D representation of the urban environment.
Figure 3.7: Aerial Photograph of Part of Salford (Ordnance Survey ©Crown Copyright 2002. ©Copyright UK Perspectives-
Simmons Aerofilms Limited 1999-2002)
3D LiDAR-Based Techniques 3.36 This approach is an extension of the 2D pixel-based approach where each pixel contains a depth value with respect to the viewing point. Typically, in this approach, a camera integrated with a laser scanning system is used to capture and visualize 3D urban environments or objects. For example, the LiDAR (Light Detection and Ranging) imaging techniques, use a camera system that use a pulsed laser device to record the distance from the camera to each point on the image. Polygons are then constructed between from the 3D point cloud to support the 3D

25
visualization and navigation of the model. This technique can be used either to create 3D representation of buildings (ground-based) or city models using airborne sensors Figures 3.8 and 3.9).
Figure 3.8: Airborne LIDAR-based City Model (Frueh and Zakhor, 2003)
Figure 3.9: Ground-based facade models using LiDAR (Frueh and Zakhor, 2003)
2D Geometry-based Technique 3.37 This approach uses geometric entities such as lines and arcs to construct 2D representations of urban environments. For example, conventional 2D GIS maps use this approach to represent various features such as roads, building, rivers etc. The recent MasterMap® schemas from Ordnance Survey has extended such geometric representations of urban objects using a object oriented framework. OS MasterMap is a new generation of geographical dataset from Ordnance Survey (OS) in UK, which is based on OS Digital National Framework™ (DNF®). DNF defines a series of XML schemas which are based on extensions to OpenGIS Consortium (OGC)’s GML version 2 specifications. This seamless geospatial database reflects the real world with themed feature layers, polygonal data and the important TOID® (unique

26
Topographic Object IDentifier for every feature). In MasterMap, each object in the real world is represented as a feature (point, line, area, text, address etc.) which has a unique code (TOID) with other attribute information attached to it. A feature in MasterMap represents a basic unit in the real world. For example, a terraced building which includes 12 houses may be represented with 12 features in MasterMap to identify each address number in this building. A feature always appears as a whole part in database and cannot be broken into subparts because of the boundary of the map. The TOID of a feature remains unchanged throughout the life of the feature, but each feature has a version number to reflect its change during its lifetime, referred to as its temporal model. Referring to a feature by TOID and version number means the exact version of the feature is specified. These MasterMap characteristics combined with GIS’s analytical ability allow it to be an ideal tool for describing, managing and analysing urban environments (Figure 3.10). It is possible to include other attributes such as the height of buildings to create 2.5D models.
Figure 3.10: OS MasterMap® and the TOID® system. (Ordnance Survey ©Crown Copyright. All rights reserved.)
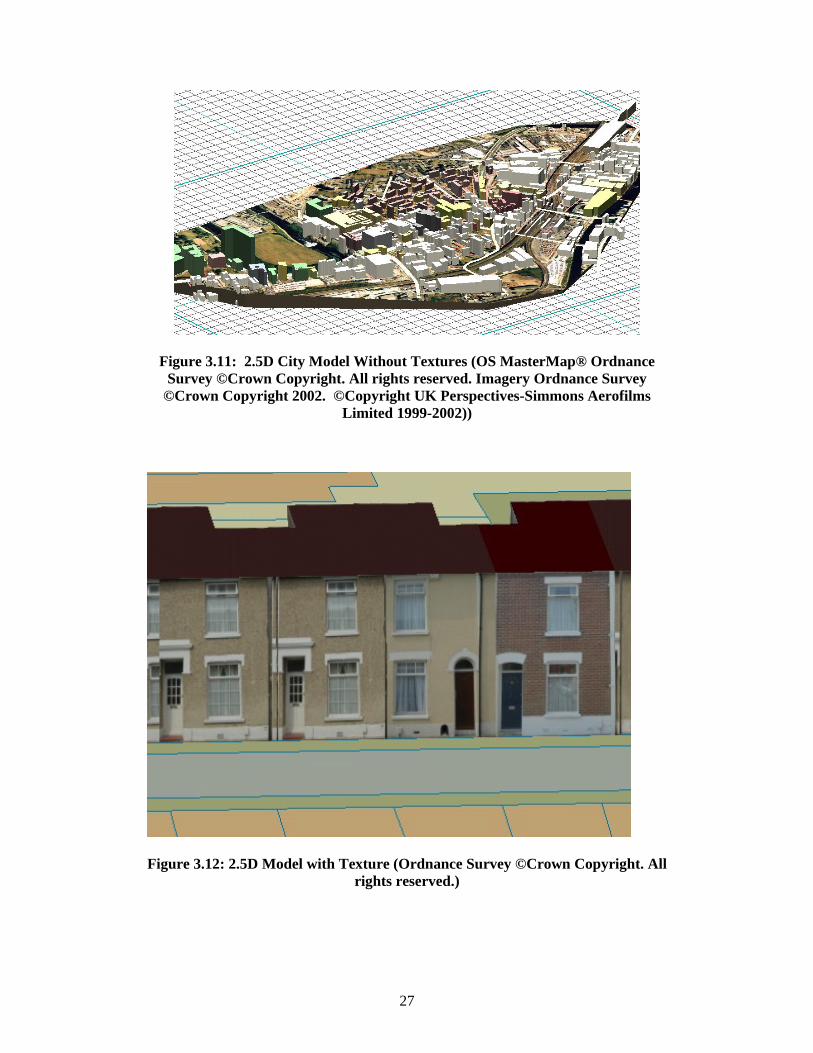
2.5D Geometry-based Techniques 3.38 This approach typically uses 2D topological data and height data (airborne survey data and other height information) to create 2.5D objects by extruding the footprints of buildings. Once extruded, to enhance the visual realism of the urban environment, 2D textures can be pasted on to the faces of the 2.5D representation of the building (Figures 3.11 and 3.12).
27
Figure 3.11: 2.5D City Model Without Textures (OS MasterMap® Ordnance Survey ©Crown Copyright. All rights reserved. Imagery Ordnance Survey
©Crown Copyright 2002. ©Copyright UK Perspectives-Simmons Aerofilms Limited 1999-2002))
Figure 3.12: 2.5D Model with Texture (Ordnance Survey ©Crown Copyright. All
rights reserved.)
28
3D Geometry-based Techniques 3.39 Typically, this approach uses CAD systems (eg. MicroStation, AutoCAD), VR modelling package (e.g. MultiGen, Realax) or Photogrammetry techniques to generate a 3D representation of the urban environment. The CAD approach allow the designers to create topologically rich representations of each urban object using accurate surface descriptions. On the other hand, VR packages allow the designers to create 3D objects and their surfaces in terms of polygons. Once modelled, the visual realisms of these models can be enhanced through texture mapping techniques. The key limitation of this approach is the shear amount of efforts required for modelling each object in the urban scene. On the other hand, photogrammetry techniques provide an economic means to acquire truly 3D urban models. This technique interprets digital image data, such as aerial image, into 3D geometry models. Photogrammetric techniques vary in the mathematical & algorithmic aspects as well as the type of information they use to calculate 3D information. Shape-from-Motion, for instance, makes use of multiple frames from a moving video to reconstruct the original 3D scene by estimating optical scene flow. Shape-from-Shading makes use of scene lighting assumptions on light sources and reflection surfaces to infer object surfaces spatial parameters. Multi-channel stereo techniques, use multiple cameras from different angles to calculate/match persistent geometric elements between the images so that they calculate parallax changes between the images. All these techniques can rebuild the original 3D model by estimating the 3D coordinates of each single visible point in the observed scene. Thus, it becomes possible to generate novel images (views) from positions and angles not coincident to those of any of the cameras, while simultaneously maintaining the visible and realistic details contained in the scene objects (Figure 3.5).
29
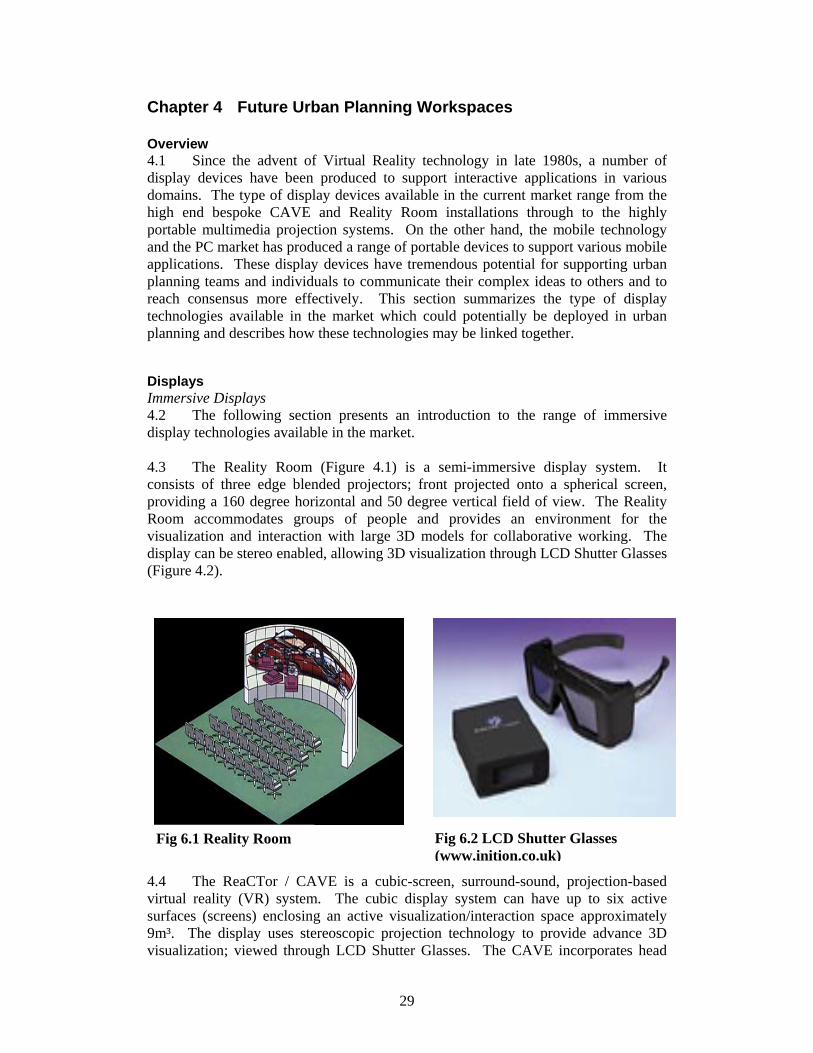
Fig 6.1 Reality Room Fig 6.2 LCD Shutter Glasses (www.inition.co.uk)
Chapter 4 Future Urban Planning Workspaces Overview 4.1 Since the advent of Virtual Reality technology in late 1980s, a number of display devices have been produced to support interactive applications in various domains. The type of display devices available in the current market range from the high end bespoke CAVE and Reality Room installations through to the highly portable multimedia projection systems. On the other hand, the mobile technology and the PC market has produced a range of portable devices to support various mobile applications. These display devices have tremendous potential for supporting urban planning teams and individuals to communicate their complex ideas to others and to reach consensus more effectively. This section summarizes the type of display technologies available in the market which could potentially be deployed in urban planning and describes how these technologies may be linked together. Displays Immersive Displays 4.2 The following section presents an introduction to the range of immersive display technologies available in the market. 4.3 The Reality Room (Figure 4.1) is a semi-immersive display system. It consists of three edge blended projectors; front projected onto a spherical screen, providing a 160 degree horizontal and 50 degree vertical field of view. The Reality Room accommodates groups of people and provides an environment for the visualization and interaction with large 3D models for collaborative working. The display can be stereo enabled, allowing 3D visualization through LCD Shutter Glasses (Figure 4.2). 4.4 The ReaCTor / CAVE is a cubic-screen, surround-sound, projection-based virtual reality (VR) system. The cubic display system can have up to six active surfaces (screens) enclosing an active visualization/interaction space approximately 9m³. The display uses stereoscopic projection technology to provide advance 3D visualization; viewed through LCD Shutter Glasses. The CAVE incorporates head

30
and hand tracking for correct stereo projection and for orientating/positioning the user and input devices within the environment. Although several people can view the environment at the same time, only one person is tracked by the computer to provide interaction.
Figure 4.3 ReaCTor/CAVE (www.inition.co.uk) 4.5 The PowerWall is a display technology that accommodates the benefits of large screen immersive visualization in a boardroom or office surroundings, for small group collaborative working or presentations. Multiple screens can be coupled together and projection edge blended to provide larger display areas. PowerWall displays can be configured, depending on the projection system, to be active or passive stereo; with active stereo requiring the users to wear Shutter Glasses. Head and hand tracking can be incorporated for intuitive user interaction with the displayed 3D models.
Figure 4.4 PowerWall (image courtesy of Fakespace Inc)

31
4.6 The Elumens’ VisionStation and VisionDome are immersive hemispherical display systems. The display systems use a single fisheye projector set-up, which can project monoscopic or active stereoscopic images. The displays range in size from single workstations through to large displays for use at exhibitions.
Figure 4.7 Head Mounted Display (www.inition.co.uk) 4.7 Head Mounted Displays (HMDs) are single user fully immersive displays. The HMDs comprise of two CRT or LCD screens, one for each eye, providing stereoscopic visualisation. Head tracked is used to update the displayed 3D image in relation to the user position and orientation. Through distribution of the virtual environment a number of HMDs can be networks allowing a number of users to experience the same environment. A number of HMDs are available on the market; hence various factors such as device weight, display resolution, field of view and cost need to be considered. Non-immersive Displays 4.8 An overview of the current non-immersive display devices will be presented in this section. The scope will cover the developments made in display technologies to facilitate advance visualization, interaction and mobile computing. 4.9 The traditional CRT desktop monitor has adequately catered for the mundane tasks of textual data entry and display, but with the evolution of the graphic capabilities of hardware and software the 2D desktop monitor is becoming a dinosaur. The new suites of graphics cards have enabled the software developer to produce applications that utilize the performance of the graphics hardware through the use of advanced 3D graphics with real time user interactions. New display technologies have emerged to accommodate advanced 3D visualization. 4.10 Optical CO-3 (Figure 4.8) is a VGA Clip-On Display which provides an image of a computer screen floating in space in front of the user. The image is a 24-Bit color, full VGA screen that can replace the screen in notebook or wearable computers. The image is equivalent in size to a 21 cm diagonal screen viewed at 60 cm. The display system clips onto an eyeglass frames, either on the left or right side. A large adjustment range makes it convenient to position the image in the center of the field of view, or elsewhere if desired. A focus mechanism allows the user to set the distance of the image. Eye-Trek FMD-700 (Figure 4.9) is a wearable display that is connectable to video sources and has a direct interface to PC/ Notebook. The display device also provides stereo audio via the integrated headphones. The display

32
comprises two high performance LC-Displays producing an image which is equivalent to watching a 52" screen from 2m distance. The system also has the option of tracking, which allow the goggles to be used in Virtual Reality systems.
Figure 4.8 - Micro Optical CO-3 (www.inition.co.uk)
Figure 4.9 - Eye-Trek FMD 700 (www.inition.co.uk)
4.11 The Dresden D4D 18” SXGA (Figure 4.10) is a flat autostereoscopic LCD monitor. Through head tracking of the user it is capable of adding true 3D depth perception to visual presentations without the need for the glasses traditionally associated with 3D visualisation devices. The display tracks the user's head position in 3 dimensions, ensuring the correct alignment of the stereoscopic images with the viewer's eyes. The Dresden D4D could be used in conjunction with a standard 2D monitor to allow user to explore the designs being developed on in a 2D CAD environment to be visualized in 3D concurrently.
Figure 4.10: Dresden Autostereoscopic LCD monitor (www.inition.co.uk)
Figure 4.11: 4D-Vision™ (www.inition.co.uk)
33
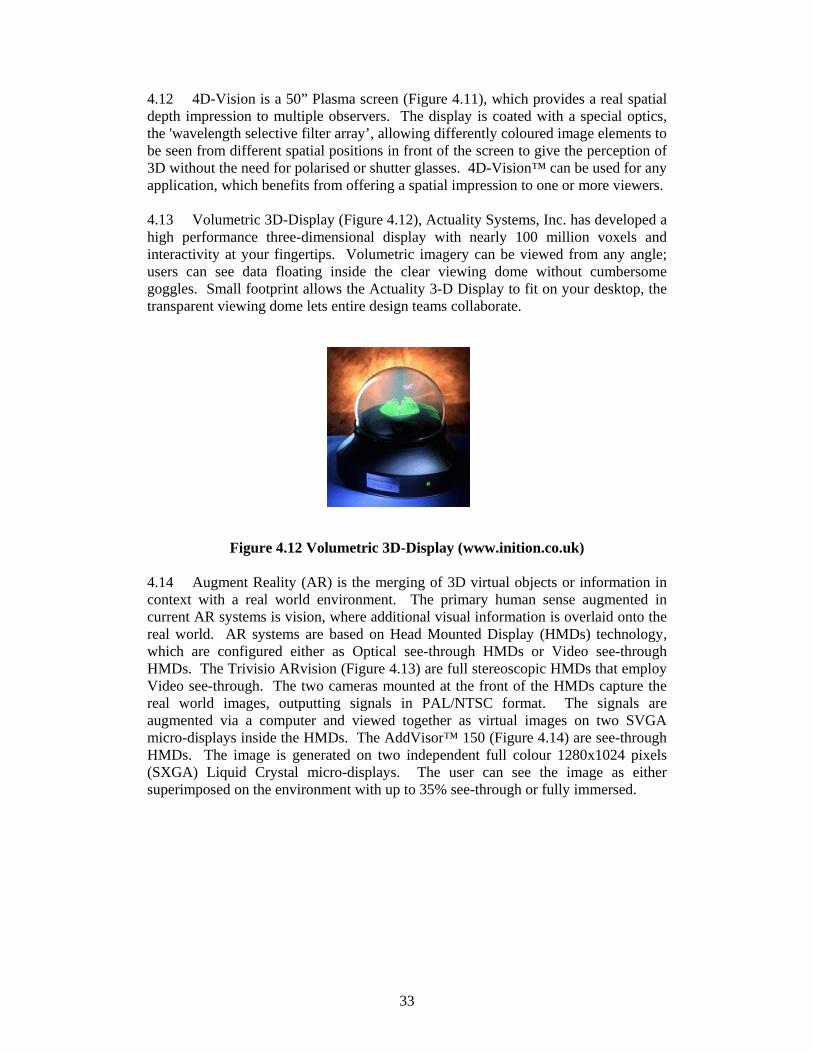
4.12 4D-Vision is a 50” Plasma screen (Figure 4.11), which provides a real spatial depth impression to multiple observers. The display is coated with a special optics, the 'wavelength selective filter array’, allowing differently coloured image elements to be seen from different spatial positions in front of the screen to give the perception of 3D without the need for polarised or shutter glasses. 4D-Vision™ can be used for any application, which benefits from offering a spatial impression to one or more viewers. 4.13 Volumetric 3D-Display (Figure 4.12), Actuality Systems, Inc. has developed a high performance three-dimensional display with nearly 100 million voxels and interactivity at your fingertips. Volumetric imagery can be viewed from any angle; users can see data floating inside the clear viewing dome without cumbersome goggles. Small footprint allows the Actuality 3-D Display to fit on your desktop, the transparent viewing dome lets entire design teams collaborate.
Figure 4.12 Volumetric 3D-Display (www.inition.co.uk)
4.14 Augment Reality (AR) is the merging of 3D virtual objects or information in context with a real world environment. The primary human sense augmented in current AR systems is vision, where additional visual information is overlaid onto the real world. AR systems are based on Head Mounted Display (HMDs) technology, which are configured either as Optical see-through HMDs or Video see-through HMDs. The Trivisio ARvision (Figure 4.13) are full stereoscopic HMDs that employ Video see-through. The two cameras mounted at the front of the HMDs capture the real world images, outputting signals in PAL/NTSC format. The signals are augmented via a computer and viewed together as virtual images on two SVGA micro-displays inside the HMDs. The AddVisor™ 150 (Figure 4.14) are see-through HMDs. The image is generated on two independent full colour 1280x1024 pixels (SXGA) Liquid Crystal micro-displays. The user can see the image as either superimposed on the environment with up to 35% see-through or fully immersed.

34
Figure 4.13 Trivisio ARvision 150 Figure 4.14 AddVisor
(www.inition.co.uk) (www.inition.co.uk) Interactive displays and mobile computing 4.15 Interactive display technology has become a standard feature on Personal Digital Assistants (PDAs). These devices have become the base end technology for mobile computing offering a digital replacement to the Filofax with many additional usages. PDAs are produced by numerous manufactures offering a range of performance capabilities, greyscale or colour screens, multiple expansion slots, memory, Bluetooth connectivity and the ability to dock with PCs. 4.16 True mobile computing offering performance capabilities similar to desktop PC’s can be found in the many of the Laptops and Notebooks currently on the market. A new development in this sector has been the introduction of Tablet Laptops. The display detaches or swivels to cover the keyboard to become an interactive screen allowing the user to write, draw or sketch on it, emulating the intuitive interaction found in using pen and paper. A number of manufacturers, Acer, Fujitsu, Toshiba and ViewSonic, are currently Tablet Laptop manufacturing Tablets Laptops. Physical networking Broadband Networks 4.17 The Broadband market is more than just the design of broadband xDSL networks. It also includes the market for integrating broadband access methods into network services such as Data over Cable Service Interface Specification DOCSIS, Cable TV and 2.5/3G networks to be able to offer network services that encompass all broadband access technologies. In the longer term Ethernet access is anticipated to play an increasingly important role.
Home Networks / Personal area Networks 4.18 Today Home Networks is really about households with more than one PC, and is being driven primarily from the US. In the future it will be more about home systems integration. Although there is talk of the Internet enabled fridge there are applications of home networks that may have more value to the home, for example home content distribution networks, storing your MP3s or movies on a central file

35
server and distributing them around the house, or to your car. The main challenge that these networks will face is associated with the "residential gateway" functionality. Such functionality will be responsible for connecting the home network to the Internet in a secure manner. Management and ease of use will be other key challenges along with the protection of such data. Personal area Networks are about small devices on the person or around the person communicating with each other wirelessly and may be using Bluetooth technology. For example a PDA communicating with a cell phone, a PDA synching with the PC when it gets in range within a residential gateway that can identify the user and call up information from the users home gateway or representation of information residing within the network or service operators domain. Mobile and Wireless Networks 4.19 Mobility is the driving force behind the development of advanced telecommunication network technologies. At present, a wide range of digital services are being delivered through a variety of wireless platforms, optimised for different classes of users, services and environments:
• Cellular systems (e.g. GSM/GPRS, UMTS), with more than 1 billion users world-wide.
• Wireless Local Area Networks (WLAN) are starting to be taken up. • In spite of a number of constellations, satellites are successfully addressing the
broadcasting markets and niche markets for fixed and mobile services. • Fixed Wireless Access (FWA) Systems have been recognised by the e-Europe
action plan as a potential alternative for broadband access networks, stimulating the access to broadband for all.
Networked Audiovisual Systems for Rich Media Communication 4.20 Europe is playing a leading role in audio-visual global standards (MPEG) introducing the next generation of video processing technologies and opening the door for the seamless integration of synthetic and natural images and enhanced user interaction. Networked audio-visual services including DTV are now thriving not just for television but for a whole range of innovative Information Society services like AV on broadband Internet, interactive services and ecommerce. However, the potential of the audio-visual services is far from being fully realised. Visual display systems are essential for assessing and transmitting information. The last few years have seen the penetration of flat displays of increasing size and performance, and light portable projectors in the office. The emergence of large area “plastic” electronics integrated with flexible displays and sensors could open up new application possibilities like e-paper, wearable devices, and complete flat and thin terminals. 4.21 Future workspaces will need to build on mixed reality technologies fusing real (vision spaces) and virtual (graphical spaces) to enhance realism and level of detail. This will require networked based environments to acquire process, encode, store and render and deliver hybrid 3D signals and objects.
36
Distributed virtual environments 4.22 The need of a distributed environment for supporting virtual urban planning environment is inevitable since such an environment should provide access to various distributed data sources, simulation services, computational power and distributed teams. This section summarizes some of the key development work in the area of distributed virtual environments. Distributed virtual environments has long been a major research area for a variety of research teams in industry and academia. Distributing virtual environment applications has two implications. Firstly, processor intensive software components can be carried out in a separate process from the fundamental components of the visualization. Secondly, users can collaborate in a virtual environment, potentially connecting desktop users with users of more immersive technology (such as a CAVE). 4.23 Examples of middleware for distributed VEs includes the Message Passing Interface (MPI), the Common Object Request Broker Architecture (CORBA), Grid computing infrastructure (e.g. Globus, Legion and SNIPE), the Common Component Architecture (CCA) and the open source problem-solving environment Cactus. The MPI standard is widely used on certain classes of parallel machines, especially those with distributed memory. CORBA is an open standard for communicating between local and remote processes. The Grid computing infrastructure is being developed to include services such as authentication, program start-up and data transfer mechanisms. CCA defines a flexible component-based framework that sits above middleware such as CORBA, and Globus and supports the different approaches and requirements that are inevitable in a multi-disciplinary collaborative development effort. Cactus is modular and is designed for implementation across a distributed architecture, having a central core (or flesh) that connects to application modules (thorns). 4.24 A number of web-based collaboration tools exist that typically employ a thin client/server architecture model. This type of architecture consists of a simple client program, which connects to a server via an efficient network protocol. The processing is carried out on the server with updates pushed to the clients. The clients themselves possess comparatively little or no intelligence and any input from them is usually sent back to the server to handle. Applications supporting on-line meetings are NetMeeting, IBM’s ENOVIA Portal, Alibre and Groove Networks (see Dongarra et al. 1993 for details). 4.25 Web-based shared workspace systems have become very useful for supporting distributed cooperative inter-organisation work between teams, providing functions such as shared document management, calendar management, task management and discussion groups. 4.26 Examples of such systems are: BSCW, Livelink, Hyperwave and TeamOffice. Distributed cooperative workspaces require support for the notification of important and relevant cooperative activities and events. This is in particular needed to support change request management systems. There are two types of awareness that these systems address: task oriented awareness and social awareness. Task-oriented awareness is the awareness that is focused on activities performed to achieve a specific shared task. Social awareness includes information about the presence and

37
activities of people in a shared environment, similar to the information received in the coffee room or when walking along an office floor. The internet notification services Elvin and Khronika follow a general approach, while the IST project TOWER has developed a generic and flexible infrastructure and environment that includes an event and notification service as well as a number of awareness indicators and displays for the creation of an awareness environment for collaborative workspaces.
38
BIBLIOGRAPHY Allison, G. T. (1971). Essence of decision: Explaining the Cuban missile crisis. Boston: Little, Brown and Company. Arayici, Y., Hamilton, A. and Hunter, G (2003) The use of laser scanning in construction management and urban planning. Presented at Measuring, Mapping and Managing Geospatial Information conference, as part of the “World of Geomatics” exhibition Telford UK. 6th-8th May 2003. Battelle (1995) Technology Forecasts: The Top Ten strategic technologies by 2005 Press Release http://www.battelle.org.forecasts/hightech.stm [Accessed 16 March 2004) Battelle (2002) Technology Forecasts: High Tech Haven – Forecast predicts the top ten innovations in home comfort and convenience in 2012 Press Release http://www.battelle.org.forecasts/hightech.stm [Accessed 16 March 2004) Bourdakis, V. and Day, A. (1997) A VRML model of BathIn, R.Coyne, M.Ramscar, J.Lee & K.Zreik (eds) Design and the Net europIA Productions, pp.13-22. ISBN 2-909285-07-3. Bourdakis, V. (1997) Making Sense of the City In, R. Junge (ed) CAAD Futures, Kluwer Academic Publishers, pp.663-678. ISBN 0-7923-4726-9. 2. Bourdakis, V. (1996), From CAAD to VRML: London Case Study. in The 3rd UK VRSIG Conference Full Paper Proceedings, De Montfort University, UK Bowman, B.A., Kruijff, K., LaViola, J.J. and Poupyrev, I. (2001) “An introduction to 3-D user interface design”, Presence, 10(1), pp.96-108, 2001.
Cheshire, J. D. & Feroz, E. H. (1989). Allison's models and the FASB statements no's 2, 5, 13 and 19. Journal of Business Finance and Accounting, 16 (1) 119-130.
Cohen, M. D., March, J. G. & Olsen, J. P. (1972). A garbage can model of organizational choice. Administrative Science Quarterly, 17 1-25. Commission of the European Communities (2003) Commission Staff Working Paper: Building the Knowledge Society: Social and Human Capital Interactions, Brussels, Commission of the European Communities Cross, M (2004) Call us, we’ll deliver. Guardian 17 March 2004 Curwell, S. and Hamilton, A. (2003) INTELCITY ROADMAP - Version 4 http://www.scri.salford.ac.uk/intelcity/documents/Docs/Roadmap/Roadmap%204.doc Accessed 23 Feb 2004
39
Curwell, S. Hamilton, A., and Cooper, I. (1998) Promoting BEQUEST: Building Environmental Quality Evaluation for Sustainability through Time. Proceedings of the CIB World Building Congress, Gåvle, Sweden, CIB Department of Local Government Transport and the Regions, (2001). Supporting Strategic Service-delivery Partnerships in Local Government - Invitation to join the Pathfinder programme. London, Best Value & DTLR Dongarra J. J., Hempel R., Hey A. J. G., and Walker D. W., (1993) A proposal for a user-level, message passing interface in a distributed memory environment. Technical Report TM-12231, Oak Ridge National Laboratory Egenhofer, M. and Kuhn, W., (1999). Interacting with GIS, in Longly, P., Goodchild, M. F., Maguire, D. J., and Rhind, D. W. (Eds.), Geographical Information Systems, Second Edition, New York, John Wiley & Sons. 2, pp.401-412. Eiser, R. and Van der Pligt, J. (1988) Attitudes and Decisions, London, Routledge European Union (2003a) Ministerial Declaration: European eGovernment Conference 2003, Villa Erba, Lagio Di Como 7-8 July 2003 European Union (2003b) Commission adopts a communication on the role of eGovernment for Europe’s future IP/03/1300 Brussels, 29 September 2003 Farnham Borough Council (2003) E-Governance Strategy 2002-2005 Update 2003 Available at http://www.fareham.gov.uk/council/departments/cx/section1.asp [accessed 17/02/04] Foley J D., Van Dam A, Feiner S K.,and Hughes J F. (1996) Computer Graphics: Principles and Practice in C. Addison-Wesley Foresman, T. W. (1998). The history of Geographic Information Systems: Perspectives from the Pioneers, Upper Saddle River, NJ: Prentice Hall PTR. Frank, A., and Mark, D. (1991). Language issues for geographical information systems, in Maguire, D. J., Goodchild, M. F. and Rhind, D. W. (Eds.), Geographical Information Systems: principles and applications, First Edition, (London: Longman), 1, pp. 227-37.
Frueh, C., and Zakhor, A.(2003) Constructing 3D City Models by Merging Ground-Based and Airborne Views. in IEEE Computer Vision and Pattern Recognition, Madison, Wisconsin, USA. Fuller, T., and Jones-Evans, D., (1994): Firm structures: developing a methodology to anticipate change within the small firm sector in the UK. British Academy of Management Conference, 1-11. Gill, S (2002) e-Planning or implementing e-Government Planning Service Planning Executives Association’s Newsletter Summer 2002 10(3) available on line at http://www.rtpi.org.uk/resources/panels/gis/gill.pdf [Accessed 19/02/04]
40
Hague, C., and Higgins, M., (2003). Workshops on participatory planning. [Online]. Available at: http://www.odpm.gov.uk/stellent/groups/odpm_planning/documents/pdf/odpm_ plan_pdf_025668.pdf [Accessed: 10/2/04] Hamilton, A., Curwell, S. and Davies, T. (1998) A Simulation of the Urban Environment in Salford. Proceeding of the CIB World Building Congress, Gåvle, Sweden, CIB Hamilton, A. and Fernando, T. (2000) Participation in Urban Planning: a visual approach, Proceedings of Cities and Sustainability International conference, Sri Lanka, 22-26th Feb 2000, ISBN 955-9027–09-3 Chapter 2 pp17 – 27 Hamilton, A., Trodd, N., Zhang, X., Fernando, T., and Watson, K., (2001). Learning Through Visual Systems To Enhance The Urban Planning Process, Environment and Planning B: Planning & Design, 28 (6) November, pp. 833-845. Harris, R (1998) Introduction to decision making http://www.virtualsalt.com/crebook5.htm [Accessed 26 March 2004]
Hudson-Smith, A., and Evans, S. (2001). Wired Regeneration: GIS in the third dimension. GIS@development.
Hill, K. (2004) Reform to get results. In: Changing the Culture: How the planning reforms are set to reinvent the profession. An ODPM supplement in association with Planning ODPM, London p 2
Jacobson, B., (1992). The ultimate user interface. Byte, 17, pp.175-182. Jepson, W. and Friedman, S. (not dated) A real-time visualization system for large scale urban environments ACE vision: The on-line magazine for building design technology http://www.aeccafe.com/AECVision/feature/realtime.php accessed March 16th 2004 Kammeier, H. (1999). New tools for spatial analysis and planning as components of an incremental planning-support system, Environment and Planning B: Planning and Design, 26(3), pp. 365-380. Keizer, G. (2004) The future of e-mail InternetWeek Jan 2, 2004 Kelly, G (1995) The Psychology of Personal constructs W.W.Horton Knipe, C (2004) Personal communication at the University of Salford/New Horizons workshop held on 29th and 30th March 2004 Koutek M, and Post H. F (2001). Spring-Based Manipulation Tools for Virtual Environments. Proceedings of the Eurographics Workshop in Stuttgart, Germany, May 16 – 18, p. 61 – 70.
41
Lahti, R. K. (1996) Group decision making within the organization: can models help? http://www.workteams.unt.edu/reports/lahti.htm [Accessed 26 March 2004] Land Use Consultants and Business Efficiency (2002) Information Communications Technology in planning Department for Transport, Local Government and the Regions, London Linstone, H; Turoff, M (Eds.) (1975): The Delphi Method. Techniques and applications. Addison-Wesley Publishing Company, Inc. LoPiccolo, P (2003) Prime prospects (editor’s note) Computer Graphics World March 2003 23(3) p2
Lovata, L. M. (1987). Behavioral theories relating to the design of information systems. MIS Quarterly, 11(2) 147-149.
Lyles, M. A. & Thomas, H. (1988). Strategic problem formulation: Biases and assumptions embedded in alternative decision-making models. Journal of Management Studies, 25(2) 131-145.
Maguire, D. J. (1991). An Overview and Definition of GIS. in Maguire, D. J. and Goodchild, M.F. and Rhind, D. W. (eds) Geographical Information Systems: Principles and Applications Longman Scientific & Technical, Essex Medyckyj-Scott, D. and Hearnshaw, H. (Eds.), (1993). Human factors in geographical information systems, Belhaven Press, London. Nedovic-Budic, Z. (1998). The Impact of GIS Technology. Environment and Planning B: Planning and Design, 25(5), 681-692. Neves, J. N. and Camara, A., (1999). Virtual environments and GIS, in Longley, P.A., Goodchild, M.F., Maguire, D.J., and Rhind, D.W. (Eds.), Geographical Information Systems, Second Edition,.2, pp.557-65 John Wiley & Sons, New York Norman, D. (1982) Learning and memory, W.H. Freeman and Co. Office of the Deputy Prime Minister (2004a) Consultation Paper on Planning Policy Statement 1: Creating sustainable communities Office of the Deputy Prime Minister: London Office of the Deputy Prime Minister (2004b) Community Involvement in Planning: The Government’s objectives Office of the Deputy Prime Minister: London Office of the Deputy Prime Minister (2004c) News Release 2004/0035: 16 February 2004 E- Planning has arrived Office of the Deputy Prime Minister: London Office of the Deputy Prime Minister (2003a) Local e-government: Process evaluation of the implementation of electronic local government in England Office of the Deputy Prime Minister: London

42
Office of the Deputy Prime Minister (2003b) Sustainable Communities: Delivering through planning – Second progress report Office of the Deputy Prime Minister: London Office of the Deputy Prime Minister (2003c). Participatory Planning for Sustainable Communities. [Online]. Available at: <http://www.odpm.gov.uk/stellent/groups/odpm_planning/documents/pdf/odpm _plan_pdf_023784.pdf >[Accessed: 10/2/04]. Office of the Deputy Prime Minister, (2001). Planning delivering a fundamental change. [Online]. Available at: http://www.odpm.gov.uk/stellent/groups/odpm_planning/documents/page/odp m_plan_605841.pdf [Accessed: 10/2/04]. Peng, Z., (1997) An assessment of the development of internet-GIS. Presented at 1997 ESRI User Conference Pierce, J S., Forsberg, A S., Conway, M J., Hong, S., Zeleznik, R. C., and Mine, M. R. (1997), Image plane interaction techniques in 3D immersive environments. Proceedings of the 1997 symposium on Interactive 3D graphics April 27 – 39, 1997, Procvidence, RI USA. p. 39. Pierce, J., Stearns, B. C., and Pausch, R. (1999). Voodoo dolls: seamless interaction at multiple scales in virtual environments. Proceedings of the 1999 symposium on Interactive 3D graphics April 26 – 29, 1999 Atlanta, GA USA. pp 141 – 145. Popper, K. (1974) Conjectures and Refutations: The growth of Scientific Knowledge, 5th. edition, Routledge and Kegan Paul, London Porritt, J. (2000) Optimism of the will, in “A new century a new resolution” Published by the World Wildlife Fund as a supplement to the Guardian, 1st January 2000. Pouypyrev I, Weghorst S, Billinghurst M, Ichikawa T (1997). A framework and testbed for studying manipulation techniques for immersive VR. Proceedings of the ACM symposium on Virtual reality software and technology. September 15 – 17, 1997, Lausanne Switzerland. pp 21 – 28.
Schmid, H., Dodd, P. & Tropman, J. E. (1987). Board decision making in human service organizations. Human Systems Management, 7(2) 155-161.
Schneider, J. K. , Shawver, M. M. & Martin, A. (1993). Applying a political model to program development. Nursing Management, 24(10) 52-55.
Skeffington Report, (1969). People and Planning Report of the committee on public participation in planning HMSO, London Song, Y (2004) Facilitating public participation in planning using geo-spatial information systems University of Salford, Unpublished PhD Thesis

43
Song, Y., Hamilton, A. Trodd, N. and Zhang X., (2003) Public Participation in Urban Planning facilitated by an Internet based Geographic Visual Information System, in the Proceedings of the 3rd International Postgraduate Research Conference in the Built and Human Environment, 3rd & 4th April 2003, ESAI, Lisbon, Portugal. ISBN 1-900491-951 pp. 797-806 Song, Y., Hamilton, A., Trodd, N. and Zhang X., (2002) Technical Design Issues of Linking Geospatial Technology for 3D Visualisation, Interaction and Analysis, in the Proceedings of the GIS Research in the UK 2002 Conference. pp256-262 Song, Y., Hamilton, A., Trodd, N. and Zhang X., (2002) Intelligent VR in GVIS To Support Public Participation In Urban Planning Process, in the Proceedings of the 2nd International Postgraduate Research conference in the Built and Human Environment, 11th&12th April 2002, University of Salford, UK. ISBN 1-900491-70-2 pp. 397-409 The Scottish Executive, (not dated). The e-planning compact. [Online]. Available at: http://www.scotland.gov.uk/library5/planning/epcomf.pdf [Accessed: 10/2/04]. UNECE (1998). The Aarhus Convention - The UNECE Convention on access to information, public participation in decision-making and access to justice in environmental matters. United Nations Economic Commission for Europe, Geneve United Nations, (1993) Agenda 21: Programme of action for sustainable development: Rio declaration on environment and development. United Nations Dept. of Public Information. New York Universities Scotland (2003) The Knowledge Society: A submission to the Scottish Higher Education Review Edinburgh, Universities Scotland Yeh, A. (1999). GIS and Urban Planning, in Longley, P.A., Goodchild, M.F., Maguire, D.J., and Rhind, D.W. (Eds.), Geographical Information Systems, 2nd ed, John Wiley & Sons, New York. 2, pp.877-888. Welsh Assembly Government (2003) People, Places, Futures: The Wales Spatial Plan (Consultation Draft) National Assembly for Wales, Cardiff Zhang, X. (2004) Designing a geographic visual information system (GVIS) to support participation in urban planning University of Salford, Unpublished PhD Thesis Zhang, X., Trodd, N. and Hamilton, A. (2002) Geographical visual information systems (GVIS) to support urban regeneration: design issues, in GIS Innovation 9, Socio-economic applications of geographic information science, ISBN 0-415-27910-0 pp 136-146 Zhang X., Trodd, N. and Hamilton,A., (2001) Geographical Visual information Systems (GVIS) to support urban regeneration: Design Issues, in the Proceedings of the GIS Research in the UK 2001 Conference. University of Glamorgan
44
Zhang, X., Trodd, N. and Hamilton, A., 2001. Geographical visual information system (GVIS) to support advanced urban planning: a research framework, in the proceedings of the First International Conference of Postgraduate Research in the Built and Human Environment. University of Salford, UK. 15th&16th March 2001 ISBN 1-90049-184-2 pp. 622-633. Web Sites
Hamilton, A., Curwell, S. R., and Turner, J., (2002) The INTELCITY EU Project Web site: http://www.scpm.salford.ac.uk/intelcity This includes information on the project, the research partners, current activities and links to related projects.
Hamilton, A Curwell, S. R., and Egan, B (1998), The BEQUEST Web site and Toolkit: http://www.surveying.salford.ac.uk/bqextra which includes records of 7 research workshops held in various cities around the EU and the final international conference held in Lisbon in April 2001, together with Newsletters explaining the main findings of the project. The toolkit represents the first integrated, sustainable urban development information source that links together good practice advice, a directory of environmental assessment methods, a database of advisors and a glossary of sustainable urban development terms.