enhancing the efficiency of stock markets in east asia...
TRANSCRIPT

Enhancing the Efficiency of Securities Markets in East Asia †
Swati Ghosh and Ernesto Revilla *
East Asia and Pacific Region The World Bank
Abstract
We explore the relative efficiency of stock markets across countries using newly available data on transaction costs and the quality of the informational environment of stock markets. These new measures are constructed from firm-level stock returns in a panel of 60 countries in the period 2000-2004. We then develop a framework to understand the linkages between efficiency, liquidity and their determinants. To give empirical content to the framework, we study the determinants of transactions costs and the quality of the informational environment. We find that some institutional arrangements –such as the availability of stock lending and short selling—and the openness of markets are associated with lower transactions costs. We also find that, although disclosure rules for directors and officers of listed firms are essential, the ability of shareholders to seek redress is more conducive to a better informational environment in stock markets. This in turn serves as the basis for the policy framework and recommendations for the East Asian region. In particular, the region needs to continue to strengthen the implementation and enforcement of corporate governance, to further enhance the market and institutional infrastructure, and focus on policy measures to foster a larger and more diversified investor base, to continue to see gains in the efficiency of stock markets. JEL Classification Numbers: G14, G15, G18, G38
† We thank Thorsten Beck, Stijn Claessens and Erik Feijen for their helpful comments. The findings, interpretations, and conclusions of this paper do not necessarily represent the views of the World Bank, their Executive Directors, or the countries they represent. * Emails: [email protected] and [email protected].

2
1. Introduction Capital markets serve a fundamental purpose in allocating capital to its most productive uses. Their health and functioning is a central determinant of the growth and development process. Therefore a substantial part of the policy and research agenda of financial market development has focused on fostering the creation of stock and bond markets and increasing their size. Less attention has been paid to understanding the channels and policies to improve their efficiency. Although the size of a market is in general correlated with other positive attributes, such as how they function of how stable they are, it is a distinctively different attribute from efficiency. Consider for example a large stock market as measured by market capitalization that only lists a few large firms which are rarely traded. Such a market will be ranked high in terms of size, but it will hardly be serving the purpose of an efficient allocation of resources. In that sense, the market will not be efficient. The efficiency of a stock market is essentially its ability to intermediate resources from suppliers of capital to their most productive use. To do that, prices—the fundamental allocation instrument—must accurately reflect all information in the marketplace. The finance literature has thus tested an immediate implication of efficiency: the lack of stock return predictability. A broad literature has followed this path for mature markets. However due to the lack of data, cross-country studies of stock market development have instead focused on the determinants of size, leaving efficiency implicit in the analysis.
In this paper, we concentrate on the efficiency of the East Asian stock markets, drawing on an analysis of stock markets around the world. To do this we focus on liquidity, which is a necessary condition for efficiency. Liquidity is the ability to buy and sell a good, in this case an asset, with ease. That is, to be able to buy or sell a good at will, at market prices, without incurring substantial costs to trade. It follows that every efficient market has to be liquid, although the converse is not necessarily true—a market can be liquid but inefficient.
We present a framework to understand the channels that affect liquidity of capital markets. The size and depth of the market, the physical infrastructure of trading, the institutional foundations of markets, and the heterogeneity of the investor base interact to make a market more or less liquid. In turn, liquidity feeds back and affects the size of the market and the presence and willingness to trade of heterogeneous investors.
We then empirically study the determinants of two attributes crucially related to
liquid and efficient markets, namely transactions costs and the quality of the informational environment. We use newly available data that benchmarks countries in the efficiency of their stock markets—trading costs and the use of firm specific information—independently of their size. We find that the quality of the physical and market infrastructure, along with certain institutional characteristics of stock markets is associated with lower transactions costs. Also we find that certain institutional and legal

3
underpinnings are more conducive to a better informational environment in stock markets. This in turn serves as the basis for the policy framework and recommendations. As noted, our focus is on East Asia. To that end, we discuss in deeper detail the key institutional characteristics of their stock markets, the specific issues that affect them, and the policies that could further enhance the efficiency of these markets.
2. Literature survey There is an abundant literature on the informational efficiency of the US stock markets1. This literature, starting with Samuelson (1965) and made famous by Fama (1970), takes advantage of the rich supply of detailed data for the US markets to test for a lack of return predictability –an implication of efficiency. Depending of the conditioning informational set used to predict returns, one is able to test for strong, semi-strong, or weak efficiency as defined in the theoretical finance literature2. As we mentioned before, our focus is not to test formally for efficiency as defined in this literature, but rather to study the determinants of positive attributes correlated with efficient markets, such as liquidity, low transaction costs, and a good informational environment. As such this paper is more closely related to recent cross-country studies of the determinants of positive stock market outcomes.
In cross-country studies of stock market development most authors have used market capitalization as a summary measure of the quality of markets. However, as mentioned before, the size of a market –as measured by market capitalization—is a distinct characteristic from its efficiency. Large markets may not be liquid or may not function efficiently. A large market capitalization may represent only a few firms and can be affected by rapid price changes. Furthermore, its calculation may vary across markets, depending on the use of the float or total shares outstanding (float plus restricted shares).
Some cross-country studies, such as La Porta et al (2005) and De la Torre and Schmukler (2005), attempt to use an outcome variable more related to efficiency to complement market capitalization. La Porta et al (2005) in one of their specifications use value traded as one of a set of stock market outcomes. Their focus is to study what particular specifications of securities markets laws matter for market development. They group those characteristics broadly into those related to “private monitoring” and those that depend on “public enforcement” of the law. They find that markets with more private monitoring are more efficient –as proxied by value traded— than those that rely on the public enforcement of the law.
On a study that focuses on the development of capital markets in Latin America, De la Torre and Schmukler (2004) present cross-country panel regressions on the
1 See Fama’s (1970 and 1991) survey articles and Schwert (2003) for overviews of the paths that the literature has followed in testing for market efficiency. 2 In the theoretical finance literature, a market is weakly-efficient if it reflects all available past information. Semi-strong form efficiency occurs when prices reflect all available public information, and strong form efficiency is when prices reflect all available public and private information. Researchers disagree on the actual level of efficiency of mature markets.

4
determinants of stock market development. Among their specifications they report results on regressions that study the determinants of value traded3. They find that richer countries, as measured by GDP per capita, tend to have more liquid markets. Also, a stable macroeconomic environment –proxied by low government budget deficits, and a more open economy, proxied by large equity inflows, tend also to have more liquid markets. Countries that reformed their trading environment, particularly the infrastructure of the exchanges, and the enforcement of insider trading laws, also saw increases in their trading activity.
Some other studies have considered the link between specific mechanisms and market efficiency in a cross-country basis. Bris, Goetzman, and Zhu (2006) analyze whether short sales restrictions affect the efficiency of the market. They find some empirical evidence that short-sales restrictions inhibit downward price discovery. Morck, Yeung, and Yu (2000) study the comovement of stock returns in markets across the world, interpret this indicator as a measure of efficiency, and perform a statistical analysis of its determinants. We use their measure and describe it in detail in section 4. There are some regional studies as well. For example, Ngugi, Muirinde, and Green (2003) study the impact of reforms on stock exchanges in Africa. They find that the modernization of trading systems leads to greater price efficiency and lower volatility.
In this paper we focus on a cross-country study of the determinants of two specific attributes related to market efficiency: low transaction costs and a high quality informational environment. As in the literature on stock market development we focus on cross-country determinants of positive outcomes, but as in the literature of mature markets, the focus is on efficiency.
3 Value traded (the value of stock trades in a year divided by the size of the economy) is a commonly used indicator of liquidity. However, it is an imperfect measure since its value can change without any increase is the volume of trades, for example, if prices rise. For that reason turnover (the value of stock trades in a year divided by market capitalization) is a better measure because is not affected by prices. De la Torre and Schmukler (2005) indicate that they also ran the regressions using turnover without any significant difference in the results.
5
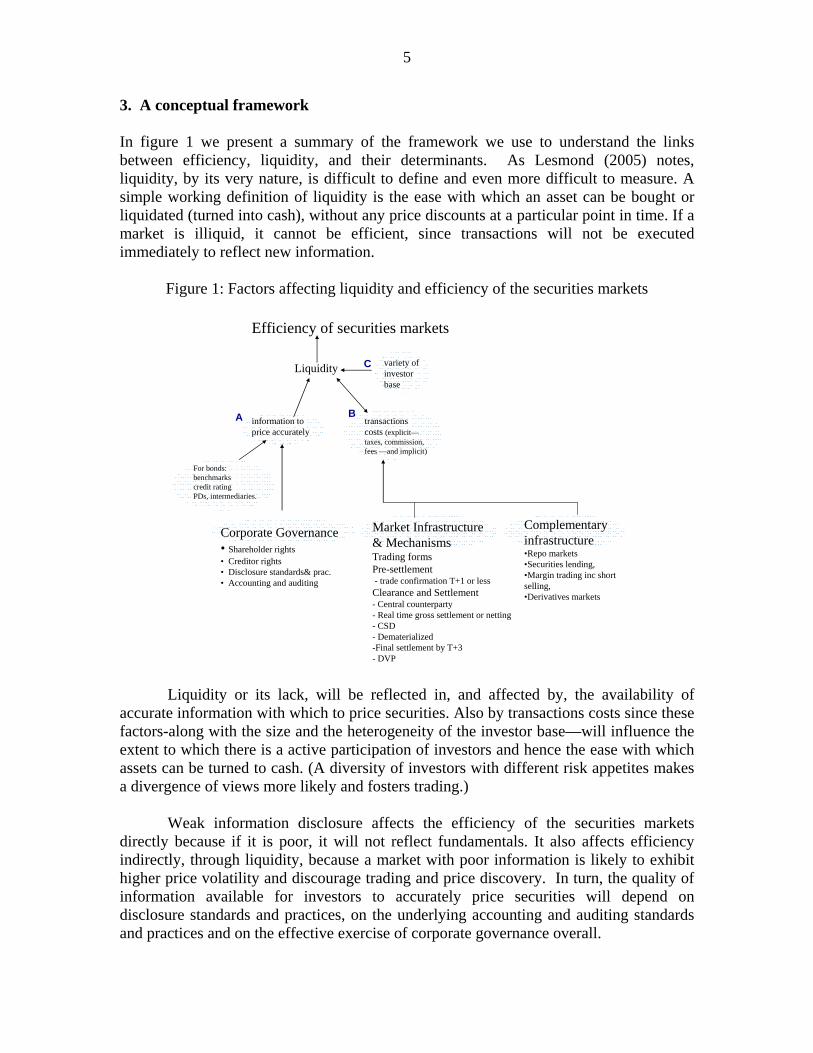
3. A conceptual framework In figure 1 we present a summary of the framework we use to understand the links between efficiency, liquidity, and their determinants. As Lesmond (2005) notes, liquidity, by its very nature, is difficult to define and even more difficult to measure. A simple working definition of liquidity is the ease with which an asset can be bought or liquidated (turned into cash), without any price discounts at a particular point in time. If a market is illiquid, it cannot be efficient, since transactions will not be executed immediately to reflect new information.
Figure 1: Factors affecting liquidity and efficiency of the securities markets
Efficiency of securities markets
Market Infrastructure& MechanismsTrading formsPre-settlement- trade confirmation T+1 or lessClearance and Settlement- Central counterparty - Real time gross settlement or netting - CSD- Dematerialized -Final settlement by T+3 - DVP
Complementary infrastructure•Repo markets•Securities lending,•Margin trading inc short selling, •Derivatives markets
transactions costs (explicit—taxes, commission, fees —and implicit)
Corporate Governance• Shareholder rights• Creditor rights• Disclosure standards& prac.• Accounting and auditing
information toprice accurately
Liquidity variety of investorbase
For bonds:benchmarkscredit ratingPDs, intermediaries.
A B
C
Liquidity or its lack, will be reflected in, and affected by, the availability of accurate information with which to price securities. Also by transactions costs since these factors-along with the size and the heterogeneity of the investor base—will influence the extent to which there is a active participation of investors and hence the ease with which assets can be turned to cash. (A diversity of investors with different risk appetites makes a divergence of views more likely and fosters trading.)
Weak information disclosure affects the efficiency of the securities markets directly because if it is poor, it will not reflect fundamentals. It also affects efficiency indirectly, through liquidity, because a market with poor information is likely to exhibit higher price volatility and discourage trading and price discovery. In turn, the quality of information available for investors to accurately price securities will depend on disclosure standards and practices, on the underlying accounting and auditing standards and practices and on the effective exercise of corporate governance overall.

6
Transactions costs comprise both the explicit costs of trading—such as
commissions, settlement fees and taxes—and the implicit costs of trading, which represents the opportunity costs of delaying or not executing a trade. The latter exist because orders, may, as a result of their size and/or scarcity of counterpart orders on the market execute at high prices (if they are buy orders) or low prices (if they are sell orders). A market with high transactions costs will see less trading and have fewer price movements in response to relevant news and will therefore be less liquid and less efficient. Both market infrastructure and the availability of “supporting” infrastructure—such as well functioning repo markets, securities lending, and derivatives markets, can affect transactions costs. 4. Methodology and data Our methodology will focus on giving empirical content to the various links presented in figure 1. That is, we would like to study the determinants of liquidity, as well as the determinants of the various factors that affect liquidity –such as transaction costs, and the quality of the informational environment.
The traditional indicators used to measure liquidity in stock markets are turnover and value. They complement market capitalization for conventional assessments. In this paper, we use the turnover ratio rather than value traded. The turnover ratio is the value of stock trades over a year divided by market capitalization. Value traded is the value of stock trades in a year divided by Gross Domestic Product. Since the value of trading increases with prices, there can be an improvement in the value traded measure without any corresponding increase in liquidity or efficiency. Hence, we prefer to use turnover which is not affected by this price effect, since prices are both in the numerator and denominator. Figure 2 shows the distribution of average stock market turnover ratios (during 2000-2004) of 109 countries across the world. A point to note is that most countries have fairly illiquid stock markets. Within the East Asia region, Indonesia and the Philippines in particular have low turnover ratios at 38 percent and 10 percent respectively. Only Korea has a high turnover ratio of over 250 percent (Figure 3). As can be seen from Figure 4 however, turnover ratios do tend to improve with per capita GDP (as an indicator of the general level of development) and actually China, Indonesia, Korea and Thailand are relatively well placed given their per capita income levels.

7
Figure 2. Distribution of countries in terms
of turnover ratios; histogram Figure 3. Turnover ratios in EA countries
0
5
10
15
20
25
30
35
40
45
10 50 100 150 More
Number of countries
Turnover below this number (%)
Chn Idn Kor Mys Phl Tha HK Sgp UK US0
50
100
150
200
250
300
percent
Figure 4. Turnover ratios and per capita GDP
0
50
100
150
200
6 7 8 9 10 11
Tunover (percent)
Log GDP per capita
CHN
THA
SGP
HKG
USAESP
JPN
MYSIDN
PHL
As shown in figure 1, transaction costs are a fundamental determinant of liquidity and efficiency. Measuring transactions costs, however, is difficult. As mentioned above, transactions costs cover the explicit costs of trading and the implicit costs of execution. Explicit costs represent the commissions, fees, and market impact of a trade4. Although even this is not entirely straightforward to measure, some companies specialize on collecting and making available these costs. For example, Table 1 shows the Elkins-McSherry trading costs in selected equity markets.
4 Some costs such as “market impact” are not straightforward to classify as either implicit or explicit.

8
Table 1. Explicit trading costs
Economy averages
Price ($)
Commissions (bp)
Fees(bp)
Market impact
(bp)
Total (bp)
Indonesia 0.3 47.7 10.6 9.9 68.1 Korea 34.3 29.3 12.4 19.2 60.9 Malaysia 1.6 34.2 6.1 15.7 55.9 Philippines 0.4 48.5 34.4 11.3 94.1 Thailand 1.0 43.7 1.8 11.4 56.9 Hong Kong 1.5 22.3 10.7 11.3 44.3 Singapore 3.1 25.7 2.0 13.8 14.5 Memorandum: Japan 14.7 12.9 0.3 6.3 19.5 Canada 17.5 20.3 0.2 6.5 27.0 France 31.0 17.9 0.4 7.7 36.0 Germany 33.8 17.6 0.6 14.1 32.3 UK Buys Sells
5.3 5.2
14.2 13.4
49.8
0.8
7.4
13.3
71.4 27.5
USA (NYSE) 25.0 18.2 0.3 7.8 26.3 Chile 0.7 29.1 10.2 15.7 55.0 Greece 12.9 28.7 19.2 10.9 58.8 Mexico 2.1 26.3 0.1 8.2 34.6 Peru 3.3 20.5 0.5 25.2 46.2 Spain 14.1 17.5 0.5 11.8 29.7 Turkey 0.0 31.4 2.7 20.6 54.7
Source: Elkins McSherry trading costs (2004). Implicit trading costs represent the opportunity costs of delaying a trade if
conditions are not appropriate, the expected cost of failure to complete the trade because of physical infrastructure failure, and any premium due to the illiquidity of the market. These costs are of course hard to measure.
In this paper we rely on a methodology developed by Lesmond et al (1999) that
captures both explicit and implicit costs. Their method exploits the fact that a trade only happens if the benefit of the transaction exceeds the cost. Hence, by using the fraction of zero-return days (i.e. when trades do not happen), one is able to disentangle econometrically an estimate of transaction costs. The underlying assumption is that the marginal trader will trade on new information not already incorporated in the price of a security only if the trade yields a profit net of transaction costs. Hence there will be an observed difference between the “real” and the perceived return. To extract a measure of transaction costs, a Limited Dependent Variable (LDV) model is estimated.

9
The relation between measured returns Rjt and true returns R*jt is given as:
R*jt = βjRmt + εjt, (1)
where
Rjt = R*jt –α1j if R*jt <α1j,
Rjt = 0 if α1j < R*jt < α2j,
Rjt = R*jt – α2j if R*jt > α2j.
In this setup j indexes firms, t indexes time, and m represents the market. For
firm j, the threshold for trades on negative information is α1j, while the threshold for trades on positive information is α2j. The difference α2j – α1j is a measure of the proportional round-trip costs for the competitive, marginal investor. This measure of transaction costs is then aggregated by country, taking the average over firms. (See Lesmond et al (1999) for an in depth discussion).
From figure 1, the second element associated with liquidity, as mentioned in our framework above, is the quality of available information. For informational quality and efficiency of stock markets, we rely on the stock return synchronicity measure (R2) of Morck, Yeung, and Yu (2000). Synchronicity measures the extent to which individual stock returns are correlated with the market return. If a high proportion of stock returns move together, then that particular market is not very efficient in conveying firm-specific information. On the other hand, the lower the correlation between individual stock returns and the market indicates that the market is more efficient in transmitting and using richer information sets.
Following Morck et al (2000), the stock return synchronicity measure is
calculated from the R2’s of the following regressions:
rit = αi + β1irmjt + β2i[rus,t + ejt] + εit, (2) where i represents firms, j represents countries, t a two-week period time index, rmjt is the domestic market return index, rus,t is the United States market return, and ejt is the rate of change in the exchange rate per US dollar. Certain adjustments described in their paper are made for the specific cases of the US (set β2i = 0) and the Far East economies (lag US returns one day to reflect time differences). Countries are the ranked according to the R2’s, where a lower R2 indicates less co-movement across stock returns –and hence, higher firm-specific informational efficiency. (See Morck et al (2000) for an in depth discussion and Morck and Yeung (2002) for a non-technical overview).
Figure 5 below shows the average scores in synchronicity (measuring
informational quality) and transactions costs by region. As can be seen, the East Asia region has relatively high synchronicity scores.

10
Figure 5. Average scores in transactions costs and quality of information by region
N Am LAC SA EAP MNA ECA SSA0.00
0.05
0.10
0.15
0.20
0.25
0
2
4
6
8
10
12
14stock return synchroncity (left axis)transactions costs (right axis)
Index Index
To study the determinants of transaction costs across countries, we use a set of institutional and physical infrastructure variables. Our hypothesis is that physical infrastructure as well as certain institutional characteristics, or what we call complementary infrastructure—the existence of repo markets, securities lending, margin trading and derivatives markets—affect transactions costs and liquidity (see Figure 1 above). In particular, we use dummy variables regarding the presence of derivative markets, short selling, and stock lending, to study if the presence of these crucial institutional arrangements are associated with lower costs of trading. We also incorporate a measure for the efficiency of the physical clearing and settlement infrastructure in the form of days until final settlement. We also include in the regressions, macroeconomic control variables in the form of inflation and the government budget balance, as well as the extent of equity capital inflows.
For the determinants of the informational quality of stock markets, we focus on indicators of the quality of investor protection for shareholders. We choose to use these variables only, since it is notoriously difficult to find variables that are able to explain synchronicity beyond GDP per capita (Morck and Yeung (2002)). In particular we take three measures from the World Bank Doing Business indicators: disclosure, director liability, and shareholder suits. The three of them are a measure of the strength of minority shareholder protections against director’s misuse of corporate assets for personal gain. In other words, by measuring how effective securities markets laws are regarding self-dealing, they serve as a proxy for the broader law and order environment in which stock markets operate. The disclosure index captures the transparency of disclosure and approval of related-party transactions. The extent of director liability index measure the degree of liability of those involved in self-dealing acts. And the ease of shareholder suits index captures the ability of shareholders to sue officers and directors for misconduct5. 5 We chose to use Doing Business indicators instead of the earlier measures from La Porta et al (2006) and Djankov et al (2005) on which they are based, because they have broader country coverage and a consistent methodology applied in each country. In particular, the way the three measures are obtained is by assuming a specific business transaction that involves self dealing. There are two companies B (for buyer) and S (for seller). A hypothetical Mr. James owns

11
In order to investigate the determinants of market efficiency, we would like to
create a summary measure of efficiency that lumps together the two dimensions of liquidity: transaction costs and the informational quality of stock markets and then study the determinants of this “composite efficiency measure”. Figure 6 plots such a composite index. It is constructed from the transaction costs and synchronicity measures, first by standardizing each one (subtracting the mean and dividing by variance), and then averaging the two measures.
Figure 6. Composite measure of efficiency
0
2
4
6
8
Standardized score
KorHK
MysSgp
ThaIdn
Phl
Chn
US
UK
Mex
CHLEsp
Jpn
TurRF
However, the difficulty with this index is that its components move in opposite directions in many countries in our sample. That is, it would appear that there are a significant number of countries which have relatively low transactions costs as a result of good physical or market infrastructure but at the same time rank low in terms of the quality of information disclosure and the exercise of corporate governance, resulting in high price synchronicity. This point can be seen from Figure 7, which shows the distribution of the countries in our sample (by region) along the two dimensions of transactions costs and quality of information disclosure. A sizable number of countries rank well in terms of transactions costs but not synchronicity, but equally a number of countries rank well on synchronicity but not in terms of transactions costs. As can also be seen from the figure, about 75 percent of the EAP countries in our sample rank in the
60% of B, owns 90% of S, and has a majority in both boards of directors. Company S wants to dispose of some assets and Mr. James proposes that company B buy them, at a price that is above market value. The transaction is approved, and the mandated disclosures are made. However, since the transaction is unfair, shareholders of B sue Mr. James and any other parties that approved the transaction. Using this common framework, Doing Business then ask lawyers from each country a set of questions regarding what disclosures should have been obligatorily made, what is the specific liability that directors and managers face, and how easy it is for shareholders to sue those who were responsible. A score is then computed for each of these categories.

12
bottom half of the distribution in terms of the quality of disclosure and 58 percent rank in the bottom half in terms of transactions costs (i.e. have high transactions costs). Also none of the countries in the region fall in the top right hand quadrant which represents the top half of the distribution of countries in both transactions costs and information (low transactions costs and good quality of information).
Figure 7. Distribution of sample on the dimensions of transactions costs and quality of information
Low
tran
sact
ions
cos
ts
Good information (Low R2)
Hig
h tra
nsac
tions
cos
ts
Weak information (High R2)
EAP ECA LAC MNA NA SA SSA0
10
20
30
40
50
60
percent Good on both
EAP ECA LAC MNA NA SA SSA0
10
20
30
40
50
60
percentGood on TC bad on R2
EAP ECA LAC MNA NA SA SSA0
10
20
30
40
50
60
percentBad on TC good on R2
EAP ECA LAC MNA NA SA SSA0
10
20
30
40
50
60Bad on both
percent
Consequently we run separate regressions for transaction costs and for
synchronicity to study their determinants. We run standard pooled OLS regressions with robust errors, as well as random effects panel regressions. 5. Empirical results Table 2 reports regression results on the determinants of stock return synchronicity. These regressions are pooled OLS with robust standard errors. In all specifications we control for the level of GDP per capita, since richer countries tend to have more developed financial sectors in all dimensions. In columns 1 to 3 we report results on the specifications that include only one of our three proxies for the quality of investor protection. In columns 3 and 4 we include two of them, while in column 5 we include all three. Some results stand out. As expected, countries with higher GDP per capita tend to have a higher informational quality in their stock markets as measured by stock return

13
synchronicity. As is well established the overall institutional and law and order framework of a country is highly correlated with its level of development. Turning to the investor protection determinants of synchronicity, we find that disclosure is not significant in these specifications. This result is somewhat counterintuitive, since one would think that the easy policy solution to facilitate more firm-specific information is more disclosure. Similarly, the extent of the director liability index is only significant by itself, but not in any other specification. What matters for the informational quality of stock markets is the ease of shareholder suits, which is significant in all of our specifications. An increase in the ease of suits from shareholders to officers or directors that misuse corporate assets reduces stock return synchronicity –which means a more efficient market. It is not surprising that the ease of shareholder suits reduces stock return synchronicity, and thus implies more informational efficiency. Shareholder suits, or at least the threat of them, will make effective the disclosure mandated in securities markets laws. That is, if directors and management perceive a risk of not disclosing material information to the markets, or of disclosing inaccurate information, an increase in the ease of shareholder suits will bring more firm-specific information to the market, and hence less synchronicity of returns. This result is notable since most studies that have looked at the determinants of synchronicity have not found any significant determinants beyond GDP per capita and the overall level of corruption in the economy (see Morck and Yeung (2002)).
On the determinants of transactions costs, Table 3 reports pooled OLS regression results with robust errors. GDP per capita is again always significant: richer countries tend to have more developed markets and lower transactions costs in their stock markets. Specification 1 shows that short selling of securities is strongly associated with lower transaction costs. We are not surprised since a market that allows –and exhibits- short selling attracts not only those investors and traders that expect an increase in prices, but also those that bet on the opposite direction. This means higher liquidity in those markets and thus lower costs of trading. Short trades assure better market conditions since they allow traders with heterogeneous views to profit also during negative market environments. Short sales also minimize the “analyst bias” which tends to make good news more prevalent than negative ones, and the ability to short sale might help stabilize markets by identifying overpriced stocks.
Probably a more important institutional feature is the ability to borrow and lend
stocks. After all, short selling relies on this ability, but it also opens up other advantages to traders and investors. In column 2, stock lending is significant at the 10% level, and in column 6 stock lending is significant at the 5% level, and with a large coefficient. Markets that don’t allow for stock lending tend to have higher transaction costs. The cross-country variation in days to final settlement of stocks trading does not significantly affect transaction costs.
Options and futures trading does not seem to affect transaction costs. However,
this could be a problem of our variable since it is only a dummy that equals zero if no trading in these instruments occurs at all and one if there is at least the trading of one instrument. Such broad aggregate may not be capturing the advantages that options and

14
futures bring to hedging, and hence in attracting more liquidity into the market. Finally, inflows of portfolio equity are always significant in reducing transaction costs. This might not only reflect the added liquidity in the market, but also the added heterogeneity of the investor base which facilitates trading, and hence reduces the costs of trading.
Table 2. Determinants of Stock Return Synchronicity
This table shows least square regressions estimated using pooled OLS for a panel of 50 countries between 2000 and 2004. A constant is estimated but not reported. t-statistics using robust standard errors are shown in brackets. An * means significance at 5 percent. See Appendix table 1 for the definition of the variables.
Dependent variable: stock return synchronicity 1 2 3 4 5 6 Log GDP per capita -0.02* -0.02* -0.02 -0.02* -0.02 -0.02* [-3.77] [-3.34] [-3.15] [-2.75] [-2.73] [-3.15] Disclosure 0.00 0.00 0.00 [0.59] [1.10] [0.97] Director liability -0.01* -0.01 0.00 [-1.88] [-1.56] [-1.46] Shareholder suits -0.01* -0.01* -0.01* -0.01* [-3.37] [-3.34] [-3.21] [-3.48] Num. Observations 223 223 223 223 223 223R-Squared 0.05 0.07 0.10 0.12 0.10 0.10
Table 3. Determinants of Transaction Costs
This table shows least square regressions estimated using pooled OLS for a panel of 50 countries between 2000 and 2004. A constant is estimated but not reported. t-statistics using robust standard errors are shown in brackets. An * means significance at 5 percent. See Appendix table 1 for the definition of the variables.
Dependent variable: transaction costs 1 2 3 4 5 6 7 Log GDP per capita -1.93 -2.16* -2.44* -2.17* -2.32* -2.97* -2.78* [-1.76] [-2.03] [-2.10] [-5.28] [-2.00] [-2.19] [-2.07] Short Selling -2.77* -5.02 [-2.10] [-1.34 Stock Lending -3.47 -4.09* [-1.58] [-1.93] Settlement period -0.17 0.12 0.18 [-0.49] [0.42] [0.63] Equity inflows -0.08* -0.08* 0.09* [-5.51] [-3.01] [-2.65] Options and futures tr. -1.16 0.17 -0.02 [-0.94] [0.16] [-0.02] Num. Observations 50 50 50 229 50 49 49 R-Squared 0.23 0.24 0.18 0.11 0.18 0.35 0.34

15
6. Policy priorities for East Asia 6.1. Strengthening the implementation and enforcement of corporate governance The empirical results suggest that corporate governance—as proxied by director liability and shareholder suits—is a significant determinant of stock market efficiency. In particular, it is an important determinant of the extent to which individual stock prices move in response to firm specific information.
As Table 4 shows, the EA region now fares quite well in terms of the coverage of securities laws with respect to these aspects, although individual countries, notably the Philippines, Thailand and Indonesia score relatively low in one or more aspects of the laws.
Table 4. Ratings of different aspects of securities laws
Economy Disclosure requirements index
Liability standards index
Anti self dealing standards index
China 10.0 1.0 4.0 Indonesia 8.0 5.0 3.0 Korea 7.0 2.0 7.0 Malaysia 10.0 9.0 7.0 Philippines 1.0 2.0 7.0 Thailand 10.0 2.0 6.0 Hong Kong 10.0 8.0 9.0 Singapore 10.0 9.0 9.0 Memorandum: Japan 7.0 6.0 8.0 Canada 8.0 9.0 8.0 Germany 5.0 5.0 5.0 UK 10.0 7.0 7.0 US 7.0 9.0 9.0 Chile 8.0 6.0 5.0 Greece 1.0 3.0 5.0 Mexico 8.0 5.0 5.0 Peru 8.0 5.0 7.0 Spain 5.0 6.0 4.0 Turkey 8.0 4.0 4.0 East Asia 5.2 4.4 6.1 ECA 4.7 3.8 6.0 Latin America 4.3 5.1 5.8 OECD 6.3 5.0 6.6
Score ranges from 10 (highest) -0 (lowest).
While on average the region scores well in terms of the coverage of some key aspects in the securities laws—including disclosure—the extent of disclosure in practice varies quite widely across countries. Figure 8 below shows an analysis done by Standard

16
and Poors of the extent of disclosure practiced by firms in their annual reports in selected countries in the region6.
Figure 8. Extent of disclosure practiced by listed firms
0
2
4
6
8
10
12
Indonesia
Mean 23.79Standard deviation 13.35
Number of companies
Scores
0-10
21-30
31-40
41-50
51-60
61-70
71-80
81-90
91-100
101-110
111-120
121-130
131-140
11-20
0
2
4
6
8
10
12
14
16
18
Malaysia
Mean 64.92Standard deviation 11.85
Number of companies
Scores
0-10
21-30
31-40
41-50
51-60
61-70
71-80
81-90
91-100
101-110
111-120
121-130
131-140
11-20
0
2
4
6
8
10
12
14
16Number of companies
Scores
Thailand
Mean 42.57Standard deviation 19.85
0-10
21-30
31-40
41-50
51-60
61-70
71-80
81-90
91-100
101-110
111-120
121-130
131-140
11-20
0
2
4
6
8
10
Hong Kong
Mean 42.75Standard deviation 19.85
Number of companies
Scores
0-10
21-30
31-40
41-50
51-60
61-70
71-80
81-90
91-100
101-110
111-120
121-130
131-140
11-20
0
2
4
6
8
10
12
14
16Singapore
Mean 80.58Standard deviation 28.57
Scores
Number of companies
0-10
21-30
31-40
41-50
51-60
61-70
71-80
81-90
91-100
101-110
111-120
121-130
131-140
11-20
Source: S&P (2005)
6 The analysis looks at disclosure of several elements including the disclosure of related party transactions that is covered in the disclosure requirements index in Table 4.

17
Here firms in Hong Kong (China) and Singapore score the best on average, although there is quite a large range in the performance of firms in Singapore (largely reflecting the performance of firms that are incorporated outside Singapore), followed by Malaysia, Korea, Thailand and Indonesia in that order. (The analysis did not cover China or the Philippines). More broadly, the importance of corporate governance has increasingly been recognized and, over the past few years, countries in the region have made significant efforts to strengthen the various elements that shape it. Table 5 provides market perceptions of where countries in East Asia stand with respect to the key elements of corporate governance. Rules and regulations pertaining to the exercise of corporate governance—which include well defined rights that can protect outside shareholders from the actions of controlling shareholders, regulations that ensure the equitable treatment of shareholders and well defined responsibilities of boards—are seen to still require strengthening in several countries—more notably in China7, the Philippines and Indonesia8.
Table 5. Corporate governance scores—a market perspective
Economy Rules and regulations
Enforcement Political and
regulatory
IGAAP CG culture Economy score
China 5.3 4.2 5.0 7.5 2.3 4.8 Indonesia 5.3 2.7 3.8 6.0 2.7 4.0 Malaysia 7.1 5.0 5.0 9.0 4.6 6.0 Korea 6.1 5.0 5.0 8.0 5.0 5.8 Philippines 5.8 3.1 5.0 8.5 3.1 5.0 Thailand 6.1 3.8 5.0 8.5 3.5 5.3 Hong Kong 6.6 5.8 7.5 9.0 4.6 6.7 Singapore 7.9 6.5 8.1 9.5 5.8 7.4 Score ranges from 1 (lowest) to 10 (highest). Source: CLSA 2005
The enforcement of the rules is seen to be more problematic across a larger
number of countries in the region. Indeed, while there are some aspects of the regulations pertaining to shareholder rights that could be strengthened in several countries, the key challenge for countries the region now lies in the implementation and enforcement of the regulations that are already in place.
In terms of accounting and auditing, East Asian countries are at different stages of convergence with international standards. From the market’s perspective, China and Indonesia are seen to be the furthest off from international standards and practices at present. Indeed, in China, while the government’s policy is to bring local accounting standards into line with international standards, there are currently significant 7 China has recently amended its Company Law, with several amendments relating to the strengthening of shareholder rights. 8 These assessments are based on a number of parameters under each category (see Credit Lyonnais Asia Pacific 2005 for the list of the parameters).

18
discrepancies. Indonesia is much closer to international standards, but there are some differences still.
The last column of Table 5 reflects the market’s rating of the overall corporate governance culture—as manifested by the degree to which institutional and retail investors are engaged in actively promoting corporate governance. Here again, there is room for further strengthening, particularly in Indonesia, China and the Philippines. 6.2. Enhancing market and institutional infrastructure Well-functioning market infrastructure and supporting infrastructure—such as repo markets, margin trading, securities lending and derivatives markets—can reduce transactions costs.
Although in our empirical results, market infrastructure does not turn out to be
significant, it is important to note that the only proxy that we have to capture market infrastructure is the number of days to settlement.
In any case, in terms market infrastructure, countries in EA are well placed, with
almost all jurisdictions having fairly advanced clearing and settlement systems with recommended features to minimize the various risks associated with pre-settlement and settlement of securities. This is borne out by the GSCS benchmark clearance and settlement ratings and by the Thomas Murray post settlement scores for countries in the region (see Table 6).
Table 6. Scores on pre-settlement and post settlement risks
Economy GSCS benchmark clearance and settlement score
Post settlement score
China 92.5 A- Indonesia 68.5 A Korea 97.3 A+ Malaysia 93.3 A+ Philippines 92.4 A Thailand 93.6 A Hong Kong n.a A+ Singapore n.a. AA- Memorandum: Greece 85.0 A+ Japan n.a. A+ Mexico 90.5 A+ Peru 97.8 A- Turkey 98.3 A Venezuela, RB 72.6 BBB
Source: GSCS and Thomas Murray. GSCS compares the settlement efficiency of markets, incorporating average trade size, local market interest rates, the proportion of trades that fail, and the length of time for which they fail. Thomas Murray produces ratings of post-trade risk exposures according to various criteria of clearing and settlement, safekeeping, and asset servicing. The ratings follow a standard alpha scale from AAA to C.

19
It is in the “supporting infrastructure”—such as repo markets, securities lending, margin trading and derivatives—that the East Asian countries vary quite widely (see Table 7). Our empirical results suggest that short selling is a significant factor in reducing transactions costs (equation 1). In several countries though, short selling is not practiced. In a few cases, this is because short selling is not allowed. In others, while allowed, it may not be practiced because of limitations in securities lending (a necessary element for efficient short selling to take place). All countries, (with the exception of China which at present does not allow margin trading with respect to either the short or long positions), however allow and practice margin purchases.
The merit of margin or leverage trading, particularly with respect to short
positions, is often debated. The argument for allowing margin trading is to introduce liquidity into the system. An argument against margin trading though is that it can fuel feedback trading and thus destabilize the market. A further argument is that margin trading, especially short selling, can make the market too susceptible to manipulation: in particular, a short seller’s loss when short squeezed can be unlimited while a margin purchaser’s losses will be limited to his initial exposure9. Thus short selling poses potential systemic risks. Often therefore countries prohibit short selling (or even if not explicitly prohibited, the lack of an efficient stock lending system effectively makes short selling impractical for both financial and operational reasons).
Nonetheless, market symmetry—in terms of allowing both margin purchases and
short sales is important for liquidity; in a leveraged and symmetrical market, a trader can efficiently buy and sell at minimal and uniformly applicable costs, immediately in response to new market information. Asymmetrical market liquidity—in which securities investments can be financially leveraged through margin selling but short sales are prohibited—can lead to long run deviations of stock prices from their fundamental value, reducing liquidity in a declining market and delaying market recovery. Moreover, even if all margin trading is prohibited, with the goal of ensuring symmetry, it is harder to enforce a restriction on margin purchases than on short sales, since it is hard to tell whether the funds used for purchasing a particular stock were borrowed or not, given that money is fungible. In contrast restrictions on short selling are easier to enforce, since to borrow securities systematically for short selling requires a stock lending system to be formally established and efficiently operated. Thus when margin trading is prohibited, a country may in practice end up with an asymmetrical situation in which margin purchases are taking place10.
Arguably therefore it may be better for countries to consider allowing both margin
purchases and short sales and ensuring that the requisite elements for margin trading within reasonable bounds of safety are in place. In addition to having margin accounts, and margin lending, one key element for short selling is an adequate securities lending system—that allows short sellers to be able to borrow shorted stocks. In fact, our
9 In a margin purchase, losses are limited to (purchase price) x (margin ratio), whereas gains are unlimited at [(unlimited sale price) x (margin ratio) – purchase price]. In a short sale, losses are unlimited at [(unlimited purchase price) x (the margin ratio) – sale price], while the gains are limited to (sale price) x (margin ratio). 10 For a deeper discussion of margin trading see Bris et al (2003) and Endo and Rhee (2005).

20
empirical results also point to the importance of securities lending in reducing transactions costs (equation 6).
As Table 7 shows, currently stock lending is not allowed in a couple of the East
Asian countries, countries. Moreover, simply allowing—in terms of regulation—stock lending is not enough. For countries to successfully introduce stock lending, certain elements need to be in place. First, a stock lending system must be efficient and robust not only to facilitate short sales but also to prevent abnormal short squeezes11. Wide participation by stock lenders in a stock lending system will reduce the risk of a short squeeze by making it easier and less expensive to cover short positions. In addition to stock brokers, lender of stocks can be securities depositories, custodial banks, investment managers and institutional investors (insurance and pension funds). In this regard Malaysia recently introduced measures to strengthen the securities lending facility for principal dealers and has also facilitated securities borrowing and lending via ISCAP which is a web based custodian system developed by the central bank, Bank Negara.
Second, since stock lending and borrowing exposes the transactions parties to the
credit risk of the counterparty and to the market risk of loaned securities, it can potentially lead to systemic risk due to the leveraged nature of the short sales underlying stock loans. The legal, regulatory, and supervisory framework of stock lending has to be comprehensive and coherent so that participants in the system can comply with relevant rules and regulations and manage risks properly. There is often a tradeoff between efficiency and robustness of the system and finding the right balance is important.
Third, since the stock borrower pledges collateral with the lender and the
borrower’s collateral is marked to market daily and subject to margin calls, stock lending poses a new challenge to the regulator in terms of collateral management. The regulator needs to address at least two aspects of risk management. The first relates to the variety of risks that the stock lender may be faced with, namely credit, interest, price, liquidity, operational and legal risks, depending on what sort of securities are made eligible for collateral. Thus regulators need to ensure that stock lenders have the necessary risk management processes in place. The second pertains to the scope of participants in the stock lending market. If stock lenders—individuals and institutions—are under different supervisory jurisdictions, the coherence and coordination of risk management regulation applicable to different categories of stock lenders could be a challenge.
Finally, within the ambit of supporting infrastructure, the development of
derivatives markets would help reduce transactions costs. Although the results of our empirical analysis do not find derivatives to be a significant determinant of transactions costs, one of the problems with our measures, as mentioned above, is that it is a binary variable that captures simply whether there is no trading in these instruments at all, and or if there is at least trading in one instrument and as such is a very broad aggregate measure
11 A short squeeze is a situation in which the lack of supply or an excess demand for a traded stock forces the price upward. For example, if a stock price starts to rise rapidly, short sellers may be forced to liquidate and cover their positions by purchasing the stock. This will push up the stock price even higher.

21
that may not be capturing the potential benefits of derivatives. In principle, derivatives can be an important in lowering explicit transactions costs.
Although five main derivatives are traded in East Asian markets (foreign
exchange products in which the region is estimated to account for 15 percent of the global trading); interest rate derivatives (about 2 percent of OTC trading and slightly more than 2 percent of the ETD trading); equity derivatives (under 4 percent of global trading); commodity derivatives and credit derivatives (among the fastest growing products), the bulk of the derivatives activity in the region is concentrated in Hong Kong (China), Singapore, and Korea.
Clearly though derivatives markets need to be developed within an appropriate
framework of solid product design, regulation and sound market infrastructure (Fratzcher (2006)). 6.3 Fostering a larger, more diversified investor base In our empirical results, portfolio equity inflows are found to be a significant positive determinant in reducing transactions costs. In fact, these flows could be taken as a proxy measure of a larger and more heterogeneous investor base. A more diversified investor base with different preferences and appetites encourages trading and can enhance liquidity.
One of the key elements in this regard is the development of the contractual
savings industry—that is the pensions and insurance industry. Pension fund assets are still relatively small in most of the EA countries as the
schemes are still relatively immature. With the exception of Singapore and Malaysia, pension fund assets amount to less than 50 percent in all the other countries. Even with at current asset size, however, it would be possible for pension funds to make more of a contribution to capital markets than they do at present. In general, with the exception of the main schemes in Hong Kong (where pension assets are held in equities) currently the asset allocation appears to be mainly confined to government securities and bank deposits. In the case of defined benefit schemes (such as the main pension schemes in Malaysia, Thailand), these could make a greater contribution to capital markets if an asset liability framework was adopted. The managers of pension funds have traditionally focused on investment management, managing their assets against a return benchmark for an asset class. This approach is not appropriate for defined contribution schemes given their predetermined liabilities or obligations. Rather the focus should be on liability benchmarking—whereby a liability benchmark is constructed and assets and liabilities are managed with regard to the correlation between the two. For defined contribution schemes, such as those in Hong Kong, Malaysia and Singapore, an argument could be made for increasing the annuitization component. This would improve both the inter- and intra-generational risk sharing properties of the systems and from the perspective of capital market developed, would likely increase the demand for securities (See Impavido and Sourrouille (2006)).

22
At the same time though it would be important to strengthen governance
structures and risk management capacity of these institutions before they invest a greater proportion of their assets in the securities markets.
The asset size of the life insurance industry for the East Asia region as a whole
amounted to US$ 362 billion at end 2004. In fact, the asset size is relatively small in most economies. Much of the impact on capital markets from the insurance industry is likely to come from increased coverage and a growing variety of products. There is considerable scope for further development of the industry, particularly in China, Indonesia, the Philippines and Thailand. One factor that may be reducing the role of the insurance industry in capital market development is the presence of many small players in several countries, partly as a result of low entry barriers in terms of minimum capital requirements.
The further development of the institutional investor asset base needs to be
complemented by measures that facilitate cross-border investments and financial integration. Indeed, since the 1997 crisis, policymakers in the region have undertaken several measures at the regional level to foster greater regional financial integration, particularly with respect to the bond markets. Equity markets are more integrated than bond markets—both globally and within the region. Nonetheless, in several countries in the region a still sizable proportion of the shares remains closed to cross border investors As of end 2004, foreign investors did not have access to 42 percent of the stock market in the Philippines, 41 percent in China and 36 percent in Thailand 12,13.
12 However, China is currently undertaking major reforms to increase investors’ access to shares. Thailand has also recently loosened restrictions on foreign investors. These figures are based on the IFC’s Investible Return Index (IFCI), which includes a subset of stocks included in IFC’s Global Index (IFCG), both now managed by Standard and Poors. Stocks in the IFCI are selected using a two step process: first, S&P determines which securities may be legally held by foreigners and next S&P screens stocks according to their size and liquidity. Thus the IFCI is designed to measure the composite stock market return of what foreign investors might receive from investing in emerging market securities that are legally and practically available to them. Note that the degree of investor accessibility may not be a good proxy of actual foreign ownership: a stock that is designated as investible may or may not be owned by foreign investors. 13 The combination of closely held shares and a sizable proportion of shares that are inaccessible to foreign investors can sizably dampen liquidity. The percentage of closely held shares is generally high in East Asian countries; as of 2004, it was 30 percent in Indonesia, and 40 percent in the Philippines. In the other countries the figures are lower: 28 percent in China and Hong Kong (China), 10 percent in Korea, 17 percent in Malaysia, 25 percent in Singapore, and 21 percent in Thailand—however they are significantly higher than the US at 1.5 percent, Canada at 2 percent and the UK at 3.3 percent.

23
Table 7. Key factors affecting the liquidity and efficiency of the securities markets Transactions costs
China Indonesia Korea Malaysia Philippines Thailand Hong Kong Singapore
Withholding taxes CGT: 5%. WHT on interest income: 10% for QFII investors.
CGT: 20%. WHT on interest income 20%. Other tax: 0.1% of gross sale proceeds is withheld by the broker as income tax for securities transactions executed on the exchange.
CGT: The lower of 11% of gross sales proceeds or 27.5% of net capital gains. WHT on interest income: 27.5%
. CGT: None WHT on interest income: None.
. CGT: None for transactions on the exchange. WHT on interest income: 20%
CGT: 15%. No CGT on government bonds or certain quasi- government bonds. WHT on interest income: None for government or government-guaranteed debt; 15% otherwise.
CGT: None. WHT on interest income: None.
CGT: None. WHT on interest income: None for government and certain quasi-government bonds.
Repo markets Planned in 2007a
Available for government bonds 7 days to 1 year.
Underdeveloped so dealers unable to short
Underdeveloped but available with tenors from overnight to 90 days
Relatively developed Available with maturities up to 1 year.
Underdeveloped. but available with overnight, 14 and 30 days.
Underdeveloped but available with maturities up to 6 months.
Mature repo market
Mature repo market
Margin purchases - margin purchase allowed? -margin loans allowed? -margin purchases practiced?
Nob
Nob
No
Yes
Yes
Yes
Yes
Yes
Yes
Yes
Yes
Yes
Yes
Yes
Yes
Yes
Yes
Yes
Yes
Yes
Yes
Yes
Yes
Yes Short sales -short sales allowed? - stock lending allowed -short sales practiced?
Nob
Nob
No
Yes
Yes
No
Yes
Yes
Yes
Noc
No
No
Yes
No
No
Yes
Yes
No
Yes
Yes
Yes
Yes
Yes
Yes
Notes: CGT = capital-gains tax. WHT = withholding tax. QFII= Qualified Foreign Institutional Investors. a. The new amendments to the securities law in China leave open the possibility of margin trading but do not specify purchases or sales. b. Repo markets in China are available for government bonds but not enterprise bonds. c. Malaysia has just announced a partial lifting of the ban on short sales that was imposed during the crisis. Short selling will be limited, however, to fewer than 100 stocks out of the nearly 1,000 listed.

24
7. Conclusions In this paper we explore the relative efficiency of stock markets across countries using newly available data on transaction costs and the quality of the informational environment of stock markets.
We then develop a framework to understand the linkages between efficiency, liquidity and the factors that matter for the efficiency of markets. To give empirical content to the framework, we study the determinants of transactions costs and the quality of the informational environment.
We find that certain indicators of the physical and market infrastructure, along
with certain institutional characteristics of stock markets is associated with lower transactions costs. We also find that certain institutional and legal underpinnings are more conducive to a better informational environment in stock markets.
This in turn serves as the basis for the policy framework and recommendations for
the East Asian region. In particular, the region needs to continue to strengthen the implementation and enforcement of corporate governance, to further enhance the market and institutional infrastructure, and focus on policy measures to foster a larger and more diversified investor base, to continue to see gains in the efficiency of their stock markets.

25
8. References Bris, A., W. Goetzmann, and N. Zhu (2003) “Short Sales in Global Perspective,” Mimeo,
Yale School of Management.
Credit Lyonnais Securities Asia (CLSA) and Asian Corporate Governance Association
(ACGA). Various years. “Corporate Governance Watch: Annual Survey of
Corporate Governance in Asia.”
De la Torre, A. and S. Schmukler (2005), “Whiter Latin American Capital Markets?”
Mimeo, World Bank.
Djankov, S., R. La Porta, F. Lopez de Silanes, and A. Shleifer. 2005. “The Law and
Economics of Self-Dealing” NBER Working Paper No. W11883.
Endo, T. and G. Rhee (2005) “Margin Purchases and Short Sales in Emerging Markets:
Their Rationales and Design Variables,” Mimeo, The World Bank.
Fama, E.F. (1970) “Efficient capital markets: a review of theory and empirical work”,
Journal of Finance 25:383-417.
Fama, E.F. (1991) “Efficient capital markets II”, Journal of Finance 46:1575-1617.
Fratzscher, O. (2006) “Emerging Derivative Markets in Asia”, Mimeo, The World Bank.
Hess, D. and G. Impavido. 2003. “Governance of Public Pension Funds: Lessons from
Corporate Governance and International Evidence”, World Bank Policy Research
Working Paper, No. 3110.
Impavido, G. and D. Sourrouille (2006) “The role of pensions in capital market
development in East Asia,” Mimeo, The World Bank.
La Porta, R., F. Lopez-de-Silanes, and A. Shleifer. 2006. “What Works in Securities
Laws?” Journal of Finance Vol. LXI, No. 1 pp. 1-32.• February 2006.
Lesmond, D. (2005) “Liquidity of emerging markets,” Journal of Financial Economics
77:411-452.
Lesmond, D., C. Trzcinka, and J. Ogden. 1999. “A New Estimate of Transaction Costs,” Review of Financial Studies 12 (5): 1113-1142.
Morck, R., B. Yeung, and W. Yu (2000), “The Information Content of Stock Markets:
Why Do Emerging Markets Have Synchronous Stock Price Movements”, Journal
of Financial Economics, 58: 215-260.

26
Morck, R. and B. Yeung (2002) “The puzzle of the harmonious stock prices,” World
Economics, Vol. 3 No. 3.
Ngugi, R.W, V. Murinde, and C. Green (2003) “How have the emerging stock exchanges
in Africa responded to market reform?”, Journal of African Business 4:2:89-127.
Purfield, C., H. Oura, C. Kramer, and A. Jobst (2006) “Asian equity markets: growth,
opportunities, and challenges,” IMF Working Paper WP/06/266.
Schwert, G.W. (2003) “Anomalies and market efficiency”, in Handbook of the
Economics of Finance, Vol. 1B Edited by G.M. Constantinides, M. Harris, and R.
Stulz, Elsevier North Holland.
Standard and Poor’s. 2005. “Corporate Governance Disclosures.” Studies of Hong Kong,
Indonesia, Malaysia, Singapore, and Thailand, produced jointly with the
Corporate Governance and Financial Reporting Center.
Tobin, J. (1982) “On the efficiency of the financial system,” Lloyd’s Banking Review
(July).
27
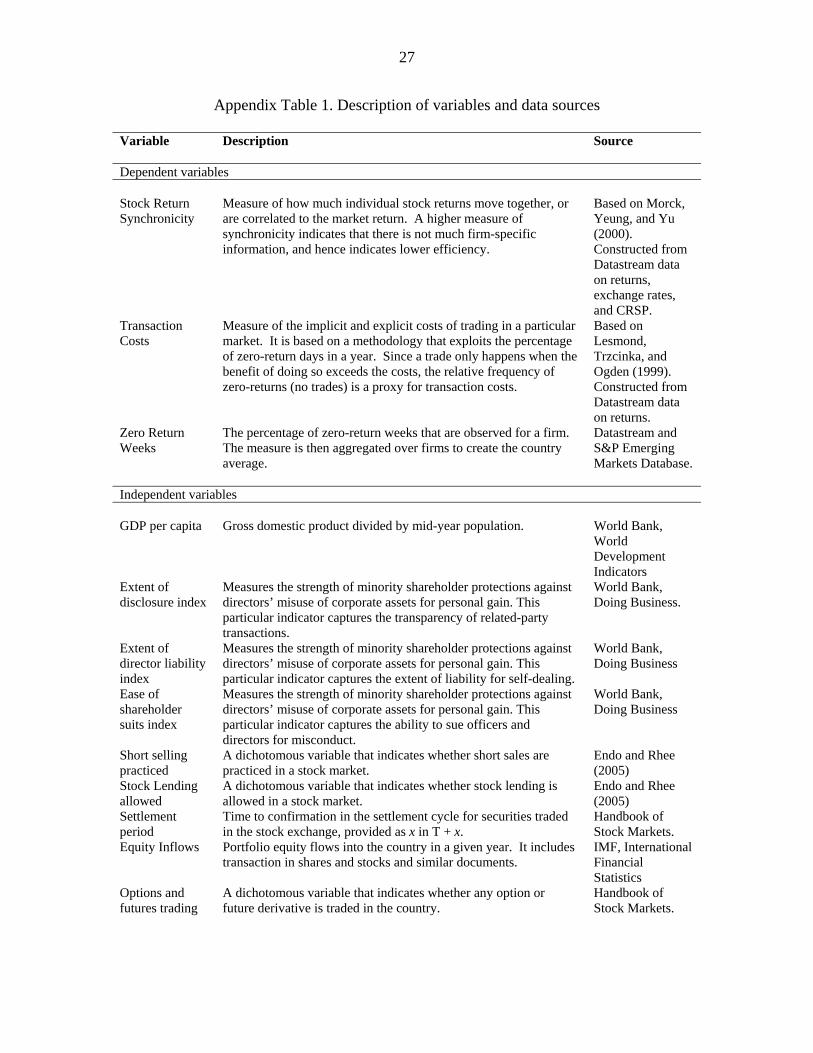
Appendix Table 1. Description of variables and data sources
Variable Description Source Dependent variables Stock Return Synchronicity
Measure of how much individual stock returns move together, or are correlated to the market return. A higher measure of synchronicity indicates that there is not much firm-specific information, and hence indicates lower efficiency.
Based on Morck, Yeung, and Yu (2000). Constructed from Datastream data on returns, exchange rates, and CRSP.
Transaction Costs
Measure of the implicit and explicit costs of trading in a particular market. It is based on a methodology that exploits the percentage of zero-return days in a year. Since a trade only happens when the benefit of doing so exceeds the costs, the relative frequency of zero-returns (no trades) is a proxy for transaction costs.
Based on Lesmond, Trzcinka, and Ogden (1999). Constructed from Datastream data on returns.
Zero Return Weeks
The percentage of zero-return weeks that are observed for a firm. The measure is then aggregated over firms to create the country average.
Datastream and S&P Emerging Markets Database.
Independent variables GDP per capita Gross domestic product divided by mid-year population. World Bank,
World Development Indicators
Extent of disclosure index
Measures the strength of minority shareholder protections against directors’ misuse of corporate assets for personal gain. This particular indicator captures the transparency of related-party transactions.
World Bank, Doing Business.
Extent of director liability index
Measures the strength of minority shareholder protections against directors’ misuse of corporate assets for personal gain. This particular indicator captures the extent of liability for self-dealing.
World Bank, Doing Business
Ease of shareholder suits index
Measures the strength of minority shareholder protections against directors’ misuse of corporate assets for personal gain. This particular indicator captures the ability to sue officers and directors for misconduct.
World Bank, Doing Business
Short selling practiced
A dichotomous variable that indicates whether short sales are practiced in a stock market.
Endo and Rhee (2005)
Stock Lending allowed
A dichotomous variable that indicates whether stock lending is allowed in a stock market.
Endo and Rhee (2005)
Settlement period
Time to confirmation in the settlement cycle for securities traded in the stock exchange, provided as x in T + x.
Handbook of Stock Markets.
Equity Inflows Portfolio equity flows into the country in a given year. It includes transaction in shares and stocks and similar documents.
IMF, International Financial Statistics
Options and futures trading
A dichotomous variable that indicates whether any option or future derivative is traded in the country.
Handbook of Stock Markets.