enrichment status of lakes in the southeastern region of ontario, 1987
TRANSCRIPT

CA2-O'3
COTTAGERS' SELF-HELP PROGRAM
ENRICHMENT STATUS
OF LAKES
IN THE
SOUTHEASTERN REGION
OF ONTARIO
1987
JANUARY 1989
Environment Ontario
Jim Bradley Minister
Copyright Provisions and Restrictions on Copying:
This Ontario Ministry of the Environment work is protected by Crown copyright (unless otherwise indicated), which is held by the Queen's Printer for Ontario. It may be reproduced for non-commercial purposes if credit is given and Crown copyright is acknowledged.
It may not be reproduced, in all or in part, for any commercial purpose except under a licence from the Queen's Printer for Ontario.
For information on reproducing Government of Ontario works, please contact ServiceOntario Publications at

0822-1251
cxJrrAcEPs' SflE-HELP
oF taxas
IN ThE
SCIJ'flIEASflPN OF
1987
Water Resources Assessnent Itit Technical Support Section
Scutheastem Region
January 1989
Copyright: Qieen' s Printer for Cttario, 1989

TABLE OF CONTENTS
Acknowledgments . . i
Abstract ii
1.0 INTRODUCTION I
2 . 0 METHODS . . . . . . . . . . . . . . . . . . S
3.0 RESULTS AND DISCUSSION ... 7
3.1 Water Clarity . 7
3.2 Chlorophyll . 10 3.3 Classification of lakes 11 3.4 Seasonal Variability within lakes 14 3.5 Annual Variability within lakes 17
4.0 CONCLUSIONS AND RECOMMENDATIONS 21
5.0 PROTECTIONOFTHELAKE 26
6.0 APPENDIX . . . . . . . . . . . . •......... . . . . . 31
FIGURE 1 Diagram illustrating the use of a Secchi disc to measure water clarity .. 6
TABLE 1 Mean Secchi disc visibility depth (m) and mean chlorophyll concentration (ug/L) for 1987..8

.1.
ACKNOWLEDGEMENTS
The Ministry of the Environment acknowledges the dedication of the volunteers who generously gave up part of the time they spent at their lake each week to collect a sample of water and arrange for its safe delivery or shipment to Kingston. It is truly their efforts during 1987 and in past years that have ensured the continuing success of the Self Help program.
We are especially grateful for the individuals and organizations that have provided a sampling record of 10 or more years.
The following have achieved a 10 or more year record of sampling with respect to their participation in the program:
Bass Lake Cottage Association Baptiste Lake Association Battersea — Loughborough Association Pinnacle Point (Big Gull - Clarendon Lake) Assoc. Bon Echo Provincial Park Buck Lake Protective Association Charleston Lake Provincial Park Charleston Lake Ratepayers Association Christie Lake Association Crowe Lake Cottage Owners Association Dalhousie Lake Association Desert Lake Property Owners Association Diamond Lake Cottagers Association West Devil Lake Property Owners Association Gananoque Lake Property Owners Association Glanmire Lake Cottagers Association North Shore Grippen Lake Cottage Association Kr. R. F. Sanderson (Hay Bay) Limerick Waterways Ratepayers Association Little Silver Lake Property Owners Association Mink Lake Betterment Association Mississippi Lakes Association Moira Cottagers for Clean Water Muskrat Lake Improvement Association Mr. 3. O'Dette (Mosque Lake) Mr. B. Briscoe (Olmstead Lake) Dr. A. W. Kahn (Otter Lake) Otty Lake Association Pike Lake Property Owners Association Salmon Trout Lake Cottage Association Sharbot Lake Provincial Park Silver Lake Protective Association Kr. 3. Arnold (Troy Lake) White Lake Water Quality Committee

ii
ABSTRACT
Since 1971, the Province has had the assistance of lake organizations, cottagers and other waterfront property owners with testing the water quality of our recreational lakes. The testing involves taking water clarity measurements and collecting water samples every week or two during the summer to determine the amount of algae present. Too much algae in
the water of the lake can interfere with its recreational use and enjoyment.
This report presents the results of testing for 101 lakes in
the Southeastern Region of Ontario during 1987. The results are summarized and discussed in terms of seasonal and yearly variations in water quality of the lakes. The Southeastern Region includes Hastings and Prince Edward Counties and extends eastward to the Quebec border.
In general, the lakes had very good water quality which was well suited for a variety of recreational purposes including swimming and bathing. With the possible exception of Hay Bay, no lake had algae levels high enough to be considered a
nuisance.
The results show that algae growth varies in intensity in some lakes at different times of the year. In lakes, where a
seasonal influence was apparent, the most common pattern was one of increasing algal levels and declining water clarity as the summer progressed.
Algal levels were lower and water clarity better in most lakes than they were during 1986. The weather was much drier than that experienced during the summer of 1986. Decreased amounts of rainfall compared to 1986 resulted in less phosphorus and nitrogen being washed into the lakes in stream flow and runoff. Phosphorus and nitrogen promote the growth of algae in a lake.
Since seasonal and yearly fluctuations occur in water quality, trends can only be established through constant monitoring over a long number of years. With this information the Ministry of the Environment will be better able to recommend appropriate management strategies such as restrictions on shoreline development and other land use controls to protect lakes.
The report contains a Section entitled "Protection of the Lake" which offers advice to cottagers on what they can do to help maintain and improve water quality at their lake.

1
1.0 INTRODUCTION
Ontario has countless thousands of inland lakes and borders
on 4 of the 5 Great Lakes. Increasing amounts of leisure
time, growing affluence and the easy accessibility of lakes
from urban centres of population have resulted in the
extensive development of their shorelines with summer
cottages, waterfront resorts and campgrounds.
Increasing development, and careless land use practices
around a lake can often lead to changes to the lake itself.
The clearing of land for building and seepage from sewage
disposal systems increases the rate of supply of plant
nutrients, particularly nitrogen and phosphorus, from the
land to the lake. Phosphorus more than any other nutrient
promotes the growth of aquatic plants and algae. Algae are
microscopic green plants. Along with other green plants they
use the radiant energy of sunlight to convert water, carbon
dioxide and inorganic nutrients such as phosphorus and
nitrogen to the chemical energy of plant tissue through the
process of photosynthesis. Plant growth is referred to as
primary production. An increase in primary productivity
gives rise to an increase in productivity at all levels of
the food chain, up to and including fish. The process of
increasing nutrient enrichment and biological productivity in
a body of water is known scientifically as eutrophication.

2
A certain amount of eutrophication is beneficial. All lakes
require nutrients for the production of aquatic life.
Aquatic plants and algae provide shelter, food and oxygen for
fish. Too much growth, however, can interfere with water
oriented recreational activities. While individually most
algae are invisible to the unaided eye, collectively they
contribute to the turbidity of a lake like particles of dust
illuminated in a ray of sunlight. Increased amounts of algae
cause a lake to become progressively more turbid and water
clarity declines as a result. Under conditions of extreme
eutrophication the lake turns green and pea-soup scums called
"algal blooms" and thick shoreline weed growth can occur. A
lake that is plagued with algal blooms and choked with weeds
is obviously of little or no recreational value.
Algal blooms and weeds affect more than just the surface of
the lake. As they die they sink and decompose using up the
limited oxygen supply at the bottom of a lake. If deep water
fish such as lake trout and other life that inhabit these
depths are present, they may be deprived of the oxygen they
need in order to survive. in this manner, highly sought
after sports species such as lake trout may be replaced by
less desirable fish.
In 1970, in response to growing concerns that the water
quality of our lakes was being threatened by too much
shoreline development, the Province initiated a comprehensive

3
lake water quality survey program. Detailed lake surveys
were carried out to evaluate the physical, chemical and
biological properties of lakes with a special emphasis on
defining their nutrient enrichment status. Since 1970 over
300 lakes have been surveyed in the Southeastern Region of
Ontario alone.
While these recreational lake surveys provide a detailed base
line evaluation of water quality, continual follow up
monitoring is necessary to maintain a current record of water
quality and to define and understand any changes or trends.
The Ministry of the Environment has neither the funds nor
the staff to visit more than a fraction of the hundreds of
cottaged lakes in the Province each year. Therefore the
assistance of lake associations and cottagers has been
enlisted with a "Self Help Program" to carry out the required
lake water quality monitoring. The Self Help program follows
two key water quality indicators — water clarity as measured
by a Secchi disc and the abundance of algae in the lake as
reflected by chlorophyll concentrations. Cottagers or other
lakefront property owners undertake the necessary water
clarity observations and water sample collections. The
Ministry of the Environment undertakes the analyses of the
water samples and interprets the results.

4
While Secchi disc readings and chlorophyll concentrations are
only two tests of water quality, they allow a fairly direct
and very good assessment of the trophic state or biological
health of a lake and hence its recreational water quality.
Water clarity is an important characteristic of a lake from
an aesthetic point of view. It is dependent on the amount of
algae in the water and is an indicator of how pristine or
nutrient enriched a lake may be. Chlorophyll is a
photosynthetic pigment found in all green plants. The
concentration of chlorophyll in a water sample is another
indication of the amount of algae in a lake.
In 1971 the Self Help Program began with just 12 lakes across
Ontario. During 1987 it included 101 lakes in the Southeast
Region alone. A total of 1143 observations were made on
these 100 lakes averaging over 11 observations per lake.
Over a period of time, the data provided by the Self Help
Program will assist in differentiating between year to year
changes that occur naturally in our lakes or the development
of any long term trends. The data also assist in assessing
the sensitivity of a lake to shoreline development
The Southeastern Region includes Hastings, Prince Edward and
Renfrew Counties and extends eastward to the Ontario-Quebec
border. The region encompasses an area of 35,523 square
kilometres and has a population of 1.2 million people.

S
2.0 METHODS
Volunteers in the Self Help program are supplied with a
sampling kit which includes a Secchi disc, a water sampler,
sample bottles and detailed sampling instructions. A Secchi
disc is a circular steel plate 20 cm. in diameter painted in
opposing black and white quadrants (figure 1). It is used to
measure the water clarity of a lake by lowering it into the
water and noting the depth at which it disappears from view.
Each volunteer is asked to select a single sampling location,
at a central or open water area of their lake, well removed
from any localized shoreline influences. The volunteers take
a Secchi disc visibility depth measurement and collect a
sample of water at this location on a regular weekly or
biweekly basis throughout the ice free season of the year,
depending upon their availability at the lake.
The water samples are submitted to the Ministry of the
Environment for analysis of their chlorophyll content.
Water samples are filtered using a 1.2 u nylon the
residue extracted with 90% acetone and chlorophyll
concentrations determined photospectometrically according to
standard methods of the Ministry of the Environment
Laboratory Services Branch.

6
S... S • •• S • . !,• •• •. • : • :. •
•S •• • I •. • .1 eS .. I, •. ' •..S
S • • S. ••• ••• — •4 • • •55 • S I S.... •. S. •
S
•••.• .. S • S •. •.••e •.. .5 •5• • • • .:'. . ••.• •••. •5• S •• •• . .:. • •..... .:
• .5. •..• S • •
•5 •5
• S. S
• "S •.Se S •••S S • •5 •• • •*• ••t •S S • ••S•
• : ••.. •. 0 •• 5*. 55 •• S. • • . •5 S
S S
S •. S • •
S • • • ••. , •, •. • IS • • S.. S•• S •• •
• • 55, 55 S
S
S •
S
S
FIgure 1: Diagram Illustrating the use of a Secchi disc to measure water quality. Good visibility characterizes clear lakes with low algal densities (left panel). Poor visibility characterizes productive lakes with high algal (right panel).
• •I pa •S5
'S.-. 5 5
•

7
30 RESULTS AND DISCUSSION
Mean Secchi disc visibility depth and mean chlorophyll
concentration results for 1987 are summarized in table 1.
Tables with all the 1987 data and a summary of previous
years' data for each lake are provided in an appendix to this
report. Chlorophyll concentrations for 1984 and previous
years are adjusted values. Previously reported values have
been multiplied by a factor of 1.5 to account for a change
in the analytical method for the determination of chlorophyll
concentrations introduced by the laboratory in 1985. The
new methodology has improved the recovery of chlorophyll from
water samples by fifty per cent. The adjustment allows the
direct comparison of chlorophyll samples analyzed before 1985
with chlorophyll samples analyzed since 1985.
3.1 Water Clarity
In general, the results indicate the water quality for most
lakes in the Southeast Region during 1987 was quite good for
most recreational use purposes. As a seasonal average,
Secchi disc visibility depths ranged from 1.5 metres for
South Lake to 9.1 metres Ear lukes Lake.
For swimming and bathing, the objective for water clarity is
a Secchi disc visibility of at least 1.2 metres C 4 feet ).
The basis of the objective is one of safety so that submerged
objects and swimmers who may require assistance are clearly

8
Table 1: Mean Chlorophyll Concentrations (ugh) and Mean Secchi Disc Visibility Depths Cm) 1987
LAxE ID NUMBER CHLORO SECCU! CODE
ASHBY 18—3490—001-01 1.5 3.6 BAGOT LONG 18—3490-041-01 1.8 4.5 BASS 12—0017—001-01 1.0 6.6 BAY 18-3490—008—01 0.9 6.7 BEAVER - SOUTH BASIN 17-0031-002-01 2.7 2.3 BELLAMY 18-0033—003—01 2.2 1.7 BIG GULL - CLARENDON 18-3430-003-01 1.8 4.3 BIG RIDEAU 18—0033—006—01 3.6 3.5 BIG RIDEAU - BRITON BAY 18-0033-Oo5-01 2.8 4.0 BLACK 18—0033—026—01 4.3 4.2 BLACK DONALD 18—3490—043-01 1.8 5.7 BOBS — EAST BASIN 18—0033—010—01 3.1 4.4 BOBS - GREEN BAY 18—0033—011-01 1.3 5.0 BOBS - LONG BAY 18-0033—010-01 2.4 4.4 BOBS - MUD BAY 18-0033-008-01 3.6 2.7 8015 DUR, LAC DU 18-4930-002—01 1.6 4.0 BRULE (WENSLEY) 18—3490—010—01 1.1 7.6 BUCK - NORTH BAY - NORTH END 12-0004-003-01 2.8 4.3 BUCK - NORTH BAY - SOUTH END 12-0004-002-01 2.8 4.2 BUCK - SOUTH BAY 12-0004-004—01 2.5 5.2 BURRIDGE 18—0033—014—el 2.2 4.5 CASHEL 17—0021-002—01 1.3 4.9 CHARLESTON GOOSE ISLAND 12-0017-006-01 2.7 3.9 CHARLESTON WEBSTERS BAY 12-0017-004-01 3.2 3.6 CHARLESTON WESTERN WATER 3.0 3.6 CHIPPEGO 17—0035—002—01 3.6 3.4 CHRISTIE 18—0033—015—01 4.5 4.4 CLEAR 18—3690—001—01 1.6 4.1 CROSBY (BIG CROSBY) 18-0033-016-01 2.8 4.2 CROW 18-0033-017—01 2.0 5.0 CROWE 17—0021-003-01 1.9 2.6 DAZJHOUSIE 18—3490—009—01 2.8 3.4 DAVERN 18-0033—033-01 2.0 5.4 DEMPSEYS (VIRGIN) 18-3490-014-01 2.1 4.8 DESERT 12—0004-009—01 2.6 4.5 DEVIL 12-0004-010-01 2.3 4.9 DIAMOND 18—3490-015-01 1.6 4.9 DICKEY - NORTH BASiN 17-0021-00i-oj 2.0 3.9 DICKEY - SOUTH BASIN 17-0021-005-0]. 1.8 4.3 DOG - NORTH BASIN 12-0004—011—01 8.5 2.6 EAGLE 18—0033—019—01 2.9 5.3 ELBOW 18—0033-035-01 4.8 2.8 FARADAY (TROUT) 18-3490-042-01 3.5 6.2 FARREN (FARRELL) 18-0033—020-01 2.6 5.0 GANANOQUE 12-0017—008—01 5.7 2.7 GREEN 18-3490-048-01 2.1 6.0 GRINDSTONE 18-3430-037-01 1.8 4.4 GRIPPEN 12—0017—010—01 3.3 2.8 GUNTER 17—0021—007—01 1.7 4.1 HAY BAY 17—0037—001—01 20.7 1.6

9
LAKE ID NUMBER CALORO SECCHI CODE
INDIAN 12-0004-013—01 ;.i JEFFERY 18-3490-047-01 1.1 6.7 JEFFERYS (OLMSTEAD) 18-4810-001-01 1.8 6.0 JOEPERRY 17-0026-001-01 1.9 3,0 KASHVAKAMAK 18-3490—010—01 1.8 3.0 KENNEBEC - EAST BASIN 17-0031-006-01 3.1 2.9 KENNEBEC - VEST BASIN 17-0031-007-01 3.4 2.9 KILLENBECK 12-0017—011—01 7.7 2.6 LIMERICK 17—0021—010—01 1.8 4.6 LITTLE SILVER 18—0033-021-01 3.2 3.6 LONG 18—0033-022-01 4.5 3.5 LOUGHEOROUCH - EAST BASiN 12-0004-014-01 6.0 3.0 LOWER BEVERLEY 12-0017-012-01 6.1 2.3 MAZINAW 18-3430—011—01 1.3 3.6 MINK 18—3690-006—01 2.5 3.3 MOIRA — EAST BASIN 17-0026—002—01 12.2 2.7 MOIRA — VEST BASIN 17-0026—003—01 13.1 1.8 MOSQUE - NORTH & SOUTH BASINS 18-3490-017-01 1.2 5.2 MOSQUE - VEST BASIN 18-3430—018—01 1.3 4.3 MUSKRAT 18-4810—002-01 9.3 2.7 NORWAY 18—3490—028—01 1.5 3.4 OPINICON 12-0004—016—01 3.7 3.3 OTTER 18—0033—024—01 2.7 2.1 OTT! 18—0033—025—01 2.1 4.1 PAUCH 18—3690—009-01 1.4 5.6 PIKE 18-0033—028—01 1.4 3.2 RED HORSE - EAST BASIN 12-0017-020-01 2.9 3.6 RED HORSE - VEST BASIN 12-0017-013-el 4.4 4.2 SAINT ANDREW 17-0035-006—01 5.4 2.5 SAINT PETER 18-3490-031-01 2.3 4.5 SALMON TROUT 18—3490-032-01 4.8 4.2 SAND 12—0004-017-01 3.0 3.4 SHABOMEKA 18—3430-034-oj 2.5 4.9 SILVER 18-3430-027—01 2.4 4.8 SKOOTAMATTA - VEST BASIN 17-0026-005-01 1.5 3.6 SOUTH 12—0017-019—01 12.2 1.5 STEENBURO 17-0021-011-01 1.7 3.9 STUCO - NORTH RASIN 17-0026-008-01 4.9 2.1 STOCO — SOUTH BASIN 17-0026—009-01 10.9 1.9 SYDENHAM 06-0180-003-01 1.6 3.5 SYDENHAM — EEL BAY 16-0180-004-01 1.2 3.7 SYDENHAM - LITTLE LONG LAKE 06-0180-002-01 1.2 3.7 THIRTEEN ISLAND 17—0035-015-01 4.1 3.4 TROY 12-0004—019-01 3.2 3.4 TWIN SISTER - EAST BASIN 17-0021-012-01 6.0 3.0 TWIN SISTER - WEST BASIN 17-0021-013-01 4.6 3.3 UPPER BEVERLY 12-0017—015—01 4.2 2.4 UPPER RIDEAU 18—0033—030—01 8.0 2.1 WHITE (DARLING TOWNSHIP) 18-3490-039-01 1.7 2.8 WHITE (OLDEN TOWNSHIP) 18-3430—031-01 1.4 5.0 YUKES 18—3490—049-01 0.7 9.1
Code 1 calculated with less than six sets of rreasurerrents

10
visible. Only three lakes failed to meet that objective and
then only on occasion. They were South Lake, Moira Lake and
Hay Bay. South Lake had a single reading of less than 1.2
metres on July 24, while Moira Lake and Hay Bay experienced
poor water clarity for the latter part of August and on into
the month of September. This period was one of high algal
productivity in these lakes as evidenced by chlorophyll
concentrations in excess of 20 ug/l.
Of course, from purely an aesthetic point of view if for no
other reason, much better water clarity is desirable. The
average Secchi disc visibility depth was greater than 3
metres in 76 per cent of the lakes and greater than 4 metres
in 47 per cent of the lakes enrolled in the program during
1987.
3.2 Chlorophyll
The seasonal average chlorophyll concentrations ranged from
0.7 ug/l for Yukes Lake to 20.7 ug/l for Hay Bay. The level
of algae or its surrogate measure, chlorophyll, that
may impair water quality for recreational use is not precise
and depends on the type of algae present in the lake at a
given time. Blue green algae that tend to float or
accumulate on the surface of the lake are more objectionable
at lower concentrations than other types of algae which tend
to remain more evenly dispersed throughout the water.

11
Experience indicates that a seasonal average chlorophyll
concentration of 6 ug/l is a value below which water quality
problems directly related to excessive levels of algae rarely
occur. In lakes with a seasonal average chlorophyll
concentration greater than 10 ug/l, an analysis of seasonal
algal diversity and taxonomic composition may be warranted to
determine if desirable or nuisance types predominate1 If
nuisance algae are impairing lake use, special studies may be
initiated to identify major sources of nutrient loading and
to determine cost effective remedial action.
3.3 Classification gj Lakes
Lakes are classified on a continuously rising trophic
(nutrient enrichment) scale according to their biological
productivity. Traditionally, trophic state classification
involves narrative descriptions of various factors
or manifestations of nutrient enrichment such as nutrient
concentrations, water transparency, profiles of dissolved
oxygen with depth, the presence or absence of algal "blooms",
the numbers and kinds of other plants and animals inhabiting
the lake and even the physical dimensions of the lake itself.
At the nutrient poor end of the scale are oligotrophic
(unenriched) lakes and at the high end eutrophiclakes.
Oligotrophic lakes are characterized by low levels of
chlorophyll and exceptionally clear water. They are usually

12
deep lakes (more than 30 m). The shoreline is sparsely
populated with aquatic plants. A stable fish population,
often lake trout, provides a fair angling catch. The lake is
well suited for a wide variety of recreational pursuits
including water contact activities such as swimming and
bathing.
In contrast, eutrophic (enriched) lakes are more productive
with higher concentrations of phosphorous and chlorophyll and
poor water clarity. Typically these lakes are shallow (less
than 10 m) and often weedy and muddy. Fish populations do
not include lake trout but may contain other sports species
such as pickerel and bass. Angling success is generally
better than for oligotrophic lakes since a more productive
lake can sustain a larger population of fish. There is a
good probability of one or more algal blooms developing in
late summer or early tall. Under conditions of advanced
eutrophication, the lake may sustain a prolonged bloom from
June to September.
Kesotrophic (moderately enriched) lakes occupy an
intermediate position in the classification scheme.
They are intermediate with respect to depth, chlorophyll
concentration, water clarity, and weeds. They may contain
both warm and cold water fish populations.

13
While changes from trophic state do not occur at sharply
defined stages, numeric criteria are useful to define this
classification scheme. The mean values for Secchi disc
visibility and chlorophyll concentration presented in table 1
can be used to rank the enrichment status of lakes in the
1987 Self Help program according to the following scheme.
Ministry of the Environment Secchi disc - chlorophyll a Lake Enrichment Status Classification Scheme.
Enrichment Secchi Chlorophyll Number of Status disc (m) (ug/L) lakes
oligotrophic >5 <3 13 mesotrophic 3 — 5 3 — 6 78 eutrophic <3 >6 10
A lake that is classified in one category by Secchi disc
visibility may be classified in another by its chlorophyll
concentration. For the purpose of the above table, a lake
was placed in the eutrophic category if both its seasonal
mean chlorophyll concentration and its seasonal mean Secchi
disc visibility depth so warranted. Thus a lake that had a
mean chlorophyll concentration greater than 6 ug/l and a mean
Secchi disc visibility depth less than 3 metres was
classified as an eutrophic lake. Similarly a lake was
classified as oligotrophic only if both the mean Secchi disc
depth was greater than 5 metres and the mean chlorophyll
concentration less than 3 ug/l. All other lakes were
classified as mesotrophic. In this way, the results of the
1987 Self Help water quality monitoring program indicate that

14
thirteen lakes are oligotrophtc, eighty are mesotrophic and
ten are eutrophic. Lakes that are borderline between
categories may change in classification due to natural
variations in lake trophic status between years.
As lake productivity increases water clarity becomes poorer.
The impact of these changes depends on the perception of the
individual and the intended use of the water. A shallow,
productive, weedy lake may be of more value to someone whose
main interest is fishing than to someone who is more
interested in swimming or water skiing. Although an
eutrophic lake has less water clarity and is more likely to
experience algal blooms periodically during the summer months
than less productive lakes, water quality may still be
acceptable for a diversity of recreational uses.
With the possible exception of Hay Bay, no lake was so
completely enriched to be entirely unsuitable for water
oriented recreational use such as swimming.
3.4 Seasonal Variability within Laicn
An analysis of the data for lakes where adequate seasonal
sampling was carried out suggests the presence of several
patterns in lake water quality.

15
Oligotrophic lakes with very low levels of algae and
exceptionally clear water transparency exhibited very little
variability in both chlorophyll concentrations and Secchi
disc visibility depth. Variability of chlorophyll and Secchi
disc visibility was greater in more productive lakes. For
some of the more productive lakes, the results show that
algae growth varies in intensity in different times of the
year.
In lakes where a seasonal influence was evident, the
predominant trend was one of gradually rising chlorophyll
concentrations as the summer progressed, culminating in peak
concentrations, generally sometime in late August or early
September. Almost invariably, the seasonal increases in
chlorophyll concentrations caused a decline in Secchi disc
visibility depths.
The increases in chlorophyll during the summer months are
likely due to profusions of blue-green algae after the
depletion of nitrogen by a variety of algae in the spring.
Blue-green algae can fix atmospheric nitrogen and have a
competitive advantage later in the season over other types of
algae when nitrogen is in scarce supply. This seasonal trend
is most apparent in shallow lakes that experience a feedback
of phosphorus from the lake sediments.
A seasonal pattern of increasing chlorophyll concentrations
and decreasing water clarity was most apparent in Hoira,

16
Black, Christie and South Lakes, but was observed in a number
of other lakes as well.
In contrast to the pattern of seasonally increasing algal
growth, there are a few lakes that experienced a decline in
algae in late May or early June. This type of spring decline
was seen in the North Bay of Buck Lake, Crow, Desert, Davern,
Desert, and Shabomeka Lakes. Spring declines in algae have
been reported in other lakes and are attributed to a die off
of spring species, sinking of the heavier diatoms, grazing by
zooplankton and depletion of nutrients in the euphotic zone.
The individual interpretive lake summaries in the appendix
comment upon seasonality in algal phytoplankton populations
where they occur.
Other lakes experience episodic increases in chlorophyll
concentrations from time to time that do not conform to any
seasonal pattern. Examples of these lakes are Farren, Long,
Lower Beverly, Twin Sister and White. The increases in
chlorophyll concentration were transitory. Under favorable
conditions of warm, sunny and calm weather, algal blooms can
materialize rapidly if sufficient phosphorus is available to
sustain a period of rapid cell division and algal growth.
The algae comprising these blooms may persist for only a few
days and then may die and settle to the bottom of the lake.

17
In other cases episodically high chlorophyll concentrations
may be due to localized accumulations of algae by wind drift.
The possibility of temporarily concentrated algal populations
emphasizes the need for regular sampling.
3.5 Annual Variability witMn Iakn
In the preceding section, the 1987 results were examined and
discussed primarily for the purpose of providing a better
understanding of a lake's water quality as it occurs within a
single year.
A matter of greater interest is the variability in water
quality which occurs from year to year. The Self Help
Program includes a considerable number of lakes for which a
record now exists for a growing number of consecutive years.
This record is differentiating long term trends from annual
variability in water quality conditions due to climatic and
other natural factors.
Concerning the 1987 results, the most evident finding is the
is the large number of lakes with an improvement in their
water quality compared to conditions measured in 1986. The
1987 and 1986 programs have 68 lakes in common. When these
68 lakes in common are compared it is found that 55
experienced a decrease in chlorophyll concentrations from
1986 to 1987. For most of these 55 lakes there was a

18
corresponding improvement in water clarity. These changes
are best exemplified by Troy Lake. During 1986 Troy Lake had
a seasonal mean chlorophyll concentration of 13.5 ugh.
During 1987 it was 3.2 ug/l. Secchi disc visibility improved
from 1.9 metres to 3.4 metres from 1986 to 1987. While the
improvement in water quality for the other lakes was not as
great as that for Troy Lake, the phenomenon is noteworthy in
terms of the large number of lakes affected.
When meteorological records are examined the amounts and
seasonal distribution of rainfall is correlated with
chlorophyll concentrations and in turn Secchi disc
visibility. During 1986, which was a very wet year,
chlorophyll concentrations reached near record high levels
and water clarity was markedly reduced. As the record
indicates, 1987 was quite dry by comparison and the trend was
reversed.
Comparison of monthly precipitation (mm) for the growing season months recorded by Environment Canada at Kingston
Month 1983 1984 1985 1986 1987 norm
April 84.8 155.2 47.7 48.8 78.4 69.6 May 39.6 94.2 76.6 80.6 46.8 71.0
June 71.5 45.4 51.8 131.6 59.6 64.0
July 98.6 41.3 67.4 74.6 47.7 53.2 Aug 50.8 194.0 100.8 129.2 71.0 76.2 September 142.2 41.2 72.2 174.4 119.2 80.9
October 97.6 25.2 84.6 81.8 86.4 77.1

19
It is believed that the reduced amounts of rainfall limited
the supply of algae producing nutrients available to the lake
from surface water runoff over the course of the growing
season with a resulting improvement in water quality. Not
only is the total amount of rainfall received over the course
of the growing season important, but also when it occurs.
Lake productivity as measured by chlorophyll and Secchi disc
visibility was low during 1983. Although the total amount of
rainfall of 585 mm received during the growing season from
April to October in 1983 exceeded the long term norm of 492
mm, much of the precipitation occurred in September and
October at a time when reduced hours of daylight and cooler
temperatures limit algae growth. Rainfall during the summer
months of June, July and August was well below the seasonal
norm during 1983.
In addition to providing information on natural year to year
variability in water quality, the Self Help Program
monitoring can be used to assess long term trends. For
example, the results have been used to assess the benefit of
pollution control measures.
Stoco, Kamaniskeg, Moira and Muskrat Lakes all receive
treated domestic waste from the municipalities bordering
their respective shores. Improvements to the sewage
treatment process were made at the Village of Madoc on Moira

20
Lake in 1973, at the Village of Tweed on Stoco Lake in 1975
and at the Village of Cobden on Muskrat Lake in 1981.
Notwithstanding a nuisance algal bloom that occurred on Stoco
Lake during 1984, the Self Help program results demonstrate
a lasting improvement in the water quality conditions of
these lakes since the introduction of improved waste
treatment practices and other efforts to reduce nutrient
inputs from within their watersheds. This situation
parallels similar improvements observed in the water quality
of the lower Great Lakes and the Bay of Quinte as a result of
municipal pollution and phosphorus control measures
implemented during the 1970's.
Elucidation of trends is dependent on the magnitude of change
relative to the magnitude of random and natural variability
due to weather and other natural factors. Water quality
improvements in the above noted lakes have been dramatic and
readily identifiable through the monitoring results. On the
other hand, gradual, subtle trends may take longer to
recognize, particularly in lakes that have a lot of natural
year to year variability. For some lakes in the program that
have been sampled regularly for ten or more years a detailed
analyses will be required to identify any possible trends.
Other lakes appear to have enough long term stability in mean
chlorophyll concentrations and mean Secchi disc visibility
depth from year to year to confirm the absence of any trends.

21
Examples of these lakes are Brule, Charleston, Davern,
Diamond, Dempseys, Devil, Diamond, Dickey, Limerick,
Shabomeka, and Otter.
4.0 CONCLUSIONS AND RECOMMENDATIONS
The Self Help Program in the province of Ontario and in the
Southeastern Region in particular has been invaluable in
establishing a wealth of information concerning the water
quality conditions of inland lakes. With the limited staff
and other resources and the many hundreds of lakes in the
region, the acquisition of water quality data on a regular
yearly basis from any significant number of lakes would
otherwise be all but impossible. The Self Help Program
provides the Ministry of the Environment the opportunity to
determine the enrichment status and water quality variability
of our lakes on an on going basis. We are fortunate and
grateful for a network of approximately 100 volunteer
samplers who have provided many years of highly valuable
data.
Each year the Self Help Program provides information that
continues to increase our understanding of water quality
conditions of lakes in southeastern Ontario. The information
reveals basic differences between lakes in terms of their
enrichment status, the presence or absence of seasonal
patterns in biological productivity, and a better knowledge

22
of between year variations in water quality conditions. For
some lakes, algal levels and water clarity are predictable
from spring to fall and the seasonal average chlorophyll
concentration and mean Secchi disc visibility depth is fairly
stable from year to year. For other lakes a predictable
pattern has not become evident. It is important that efforts
continue to characterize as many lakes as possible.
The enrollment of lakes in the Self Help Program is diverse
enough in terms of geographic distribution to provide a broad
picture of the water quality conditions in the Southeastern
Region of Ontario. In general, the picture that emerges is
one of very low biological productivity and excellent water
quality. Water quality in most lakes is well suited for a
wide variety of recreational pursuits including water contact
use sucn as 5wimxning and bathing. Unly a tew bodies 0±
water, such as Hay Bay for example, have chlorophyll
concentrations high enough to possibly interfere with their
water contact recreational use and enjoyment. It would be
impossible to generalize about the water quality conditions
of our lakes in this manner without the information provided
by the network of volunteer samplers through the Self Help
Program.
Year to year variability of some lakes is quite considerable
and more than enough to obscure any trends in water quality
that might be due to mans' activities. The effect of

23
shoreline development such as clearing shorelands for
building roads and cottage construction and seepage from
septic tank installations is often subtle and gradual.
Unlike that due to climatic conditions, the effect of mans'
activities is cumulative. It is essential that we have long
term data, probably on a continuous basis, to identify any
emerging trends with regard to these annual variations in
water quality. The water clarity and chlorophyll
measurements provided through the Self Help Program will
establish the necessary record against which any future
changes in the water quality of our lakes may be evaluated.
The identification of trends is important in directing and
assessing the effectiveness of lake management decisions. We
do not want to inappropriately restrict development on a
lake. On the other hand, we must be prepared to impose
strict land use controls if an increase in shoreline
development is going to jeopardize water quality of a lake.
The Self Help Program provides a basis for Input into land
use planning decisions for lakes in Ontario. The
data is used to assist with the establishment of guidelines
for the capacity of a lake to support shoreline development.
These guidelines are used by municipalities in drafting land
use policies for Official Plans and zoning by-laws.
The information is also used by the Ministry of the

24
Environment when providing comment on the water quality
implications of lakefront development proposals to the
Ministry of Housing and to the Ontario Municipal Board.
Our comments often require that the developer incorporate
measures that will reduce the impact of a development
proposal on water quality such as increased setbacks for
cottages and septic tanks, oversized lots and the
preservation of environmentally sensitive areas.
Every one in the Self Help Program is encouraged to continue
their participation during 1988. Sampling should be carried
out regularly and consistently over the entire period of
availability at the lake. Weekly sampling is desirable :o
define seasonal cycles on lakes where they exist. As a
minimum, a program should encompass the three months of June,
July and August wi-ten lakes receive most of their use. These
months are ctten when chlorophyll concentrations are bi'fliesc.
If a sampling is conducted during May and September as well
as during June, July and August then the presence or absence
of chlorophyll peaks in the spring and fall can be confirmed.
Cottagers who own property on a lake not enrolled in the
Kelp Program are encouraged to contact the Ministry of the
Environment for advice and assistance in establishing a
sampling program on their lake.
The Self Help Program has been in effect for some 16 years.

25
Data has been accumulated for ten or more years on a large
number of lakes. As stated earlier in the report, some of
these lakes have had stable enough average water clarity and
chlorophyll concentrations from year to year that it is
apparent that their water quality is not changing. For other
lakes, year to year fluctuations in these parameters have
been considerable and the assessment of long term trends in
water quality is difficult to make. For this reason it is
proposed to undertake a thorough technical review of the
accumulated data base and program protocols. The next report
will consist only of a tabular presentation and a narrative
summary of the results as contained in the appendix of this
report, pending completion of the review. At the completion
of the review a report will be issued with the findings and
recommendations for changes if required.
The Ministry of the Environment has a responsibility to
minimize the potential water quality effects of further
shoreline development on lakes. Existing cottage owners can
also play an important role in the protection of their lakes.
The following Section outlines some of the steps cottagers
can adopt to limit nutrient inputs to their lakes and thereby
help preserve their water quality.

26
5.0 PROTECTION OF THE LAKE
In order to prevent problems from developing there are a
number of actions and safeguards that cottagers can take.
Cottaging impacts are potentially of greater significance
than other land uses within a watershed because of their
greater proximity to the lake. Of the management options
available for dealing with water quality protection, the most
effective is prevention. Phosphorus has been identified as a
critical element in eutrophication. Phosphorus more than any
other nutrient promotes the growth of weeds and algae in a
lake. Phosphorus is present in a lake naturally but also
occurs as a result of mans' activities. Phosphorus
originates in overland runoff, from agricultural practices
within the watershed of a lake and by seepage from septic
tank systems. Care must be taken to minimize additional
phosphorus input from cottage development. Following is a
list of suggestions that cottagers can follow to limit
phosphorus inputs to the lake.
1) New cottage construction and septic tank systems should
be sited well back from the lake. This practice allows
phosphorus in runoff and seepage from the tile field to
be absorbed by soil and vegetation rather than reaching
the lake. Setbacks have the additional advantage of
preserving the natural scenic beauty of the shore by

27
preventing development from intruding unnaturally upon
the lake.
2) Building site preparation and construction activities
should be carried out in a manner which will minimize
disruption to the soil and vegetation on the property.
All areas that are exposed during construction should be
re-planted as soon as possible to prevent runoff and
erosion.
3) Sewage disposal systems must be constructed and
installed in compliance with Provincial Regulations
and should be properly maintained. Seepage of leachate
from improperly located or malfunctioning septic tank
tile field systems can contribute substantial amounts of
phosphorus to the lake. Septic tanks should be
periodically pumped out. The area over the tile ied
should be grassed and left open to sunlight and wind to
encourage evapotranspiration. Protect the tile field
bed from compaction by vehicular traffic including snow
mobiles. Snowmobiles compact the snow and this may
cause frost damage to the tiles. Check the system every
year for damp spots or ponding. If a problem is
apparent or suspected contact the local District Office
of the Ministry of the Environment for guidance.

28
4) Minimize the quantity of water used at the cottage to
avoid overloading the septic tank system. Dishwashers
and automatic washing machines use large volumes of
water. Moreover, automatic dishwashers require the use
of high phosphate detergents which should not be used at
the cottage. Laundry should be returned to the city.
5) If you must have a lawn do not fertilize it. Excess
application could wash off into the lake and may end up
promoting unwanted nuisance aquatic weed growths.
6) Do not bathe or shampoo in the lake. Many people find
this custom otfensive and in this day and age when most
of us embrace an environmental ethic such practices
should not occur.
7) The shallow near shore or "littoral" zone supports most
of the plant and animal life found in a lake.
Disruption of any part of this life support ecosystem
threatens the entire cycle of life in the lake. In
particular, habitat for fish and other wildlife may be
destroyed. Before undertaking any shoreline
modification activities such as dredging or filling,
contact the Ministry of Natural Resources for advice.
Prior approval may be required under the Navigable
Waters Protection Act or the Fisheries Act.

29
8) Preserve the natural shoreline of the lake. Retain a
protective buffer of trees, shrubs and other ground
cover between your cottage and the lake. Vegetation
slows storm and melt water runoff and filters
contaminants from roads, roofs, patios, and parking
lots. This runoff contains phosphorus and nitrogen from
soil particles, fertilizer residues and animal waste.
9) On lots where the natural ground cover along the shore
line has been lost, cottagers should reintroduce
vegetation native to the lake environment. The Ministry
of Natural Resources introduced a shoreland restoration
program on Christie Lake near Perth during 1984 as a
pilot project in Ontario. A Mutual Associations for the
Protection of the Lake Environment (MAPLE) has been
formed to continue the initiative began by the Ministry
of Natural Resources and to develop the program into a
broader, province wide program. The program involves
the active participation of cottage associations in
returning shorelines to their natural state with
herbaceous shrubs native to the area. Plants are
provided free of charge from a nursery established at
Christie Lake specifically for this purpose. The main
species that are planted are sweet gale, meadow sweet,
willow, red osier dog wood and Virginia creeper. Since
1984 the program has been extended to Black, Farren and
Mississippi Lakes. For more information about this

30
program contact 3. Patrick Ferris, Managing Director,
MAPLE Inc., 152 McLeod Street, Ottawa, K2P OZ7
(telephone 613 230 4548 home or 613 238 8865 business).
10) Participate in the Ministry of the Environment Cottagers
lake water quality monitoring Self Help Program. In
addition to contributing scientific data about the water
quality conditions of our lakes, the Self Help Program
involves cottagers in learning about lake ecology and
helps to raise their environmental awareness to the
point where they can better appreciate what they can do
individually to preserve and enhance the quality of
their lake and its surroundings.

31
6.0 APPENDIX
Chlorophyll concentrations and Secchi disc visibility depths, and summary of seasonal mean results from previous years for lakes in the Ministry of the Environment
Southeastern Region Cottagers Self Help Program. 1987

ASHBY LAKE
Insufficient sampling was carried out during 1987 to reach
any definite conclusions about Ashby Lake or make comparisons
with other years. A minimus of six sets of measurements are
necessary to adequately characterize water quality of a lake.
Preferably 12 or more measurements evenly timed throughout
the ice free season of the year from May to October should be
taken to define any seasonal trends in water quality if they
are present
Based on previous years' data Ashby Lake has excellent water
quality well suited for a variety of recreational uses
including water contact uses such as swisusing and bathing.

LAKE : ASHBV LAKE TWP : ASHBY COUNTY : LENNOX & ADD INGTON
ID NUMBER : 18—3490—001-01
WATERSHED AREA SURFACE AREA MAX DEPTH VOLUME
36.82 259.0
: 36.60 : 31.11 mill cu. m.
SI-IOREL I NE COTTAGES RESORTS 7. CROWN LAND
20.30 km. 84 :0
:70
NORTH BASIN HISTORICAL RECORD'
+ + 4 +
SAMPLE DATE SECCHI DEPTH CHLOROPHYLL A
(MM/DO/YYI (METERS) (1I8/L)
+ + + +
07/01/87 3.3 1.3 1 1976 1*
07/26/87 4.0 1 1.7 1977 + + +
+ 1978
MEAN 3.7 1.5 1979
MAX 1 4.0 1 1.7 1 1980
MIN 1 3.3 1 1.3 1 1 1981
N 2 1 2 1
1 1982
SD 0.50 0.28 19831* 4. + +
6.3 1.8
6.8 2.0 1 6.4
5.6 1 2.1 I I
I I
5.6 1.8 1 5.9 1 1.7
5.3 1 2.0
sq. km ha. m.
1 SAMPLE DATE I SECCHI DEPTH I CHLOROPHYLL A
(YEAR) 1 (METERS) (00/U + + + +
1987'
MEAN 1 5.7 1
MAX 1 6.8 1 2.5 I I
I £..J
N I 9 9
£3 L89 0:
NOtE t
ti j

BAGOT LONG LAKE
Insufficient sampling was carried out during 1987 to reach any definite conclusions about Bagot Long Lake or make comparisons with other years. A minimum of six sets of measurements are necessary to adequately characterize water quality of a lake. Preferably 12 or more measurements evenly timed throughout the ice free season of the year from Hay to October should be taken to define any seasonal trends in water quality if they are present

LAKE BAGOT LONG LAKE TWP : BAGOT COUNTY RENFREW
ID NUMBER : 18—3490—041—01
sq. km ha. m.
mill cu. m.
SHORELINE COTTAGES RESORTS X CROWN LAND
9.00 km. :28 :0 :70
CENTRE OF LAKE
1.
NOTE * Basec on :ess tflr H Re::rerional lares
WATERSHED AREA : 4.41 SURFACE AREA : 56.0 MAX DEPTH : 12.20 VOLUME : 2.62
SAMPLE DATE SECCH! DEPTH CHLOROPHYLL A
(MM/DD/YY) (METERS) (US/U —+ —. 4
4.9 1.6
08/2/3' 3.2
09/13/87 4.6 1.0
.h. ——4—————
.P———————t————————————
SAMPLE DATE SECCHI DEPTH CHLOROPHYLL A
(YEAR METERS (U6/L) —+
1983* 2.0 3.3
1986 * 11.6
1997' 4.!
4—————— —4—— 4.
MEAN 3.8
MEAN 4.5 1 1.8 MAX 1 4.9 : 11.6
4.9 1 3.2 MIN 1 2.7 1 1.8 :
3.9 1.0 N 1 2 '
N 4 4 : SD 1.09 1 5.26

BASS LAKE
Eleven samples were collected from July 19 to October 23.
Although the absence of more productive conditions in Bass
Lake during the spring cannot be confirmed without data for
the months of Kay and June, the results indicate Bass Lake
has excellent water clarity with very little algae present.
Chlorophyll concentrations were less than 1 ug/l for most of
July and throughout the entire month of August. Secchi disc
visibility depth increased as the season progressed with a record 9.1 metre reading measured on October 23. The
previous best water clarity was a reading of 8.5 metres on
October 28, 1985.
Water clarity was higher and chlorophyll concentrations lower
than those measured in the lake during 1986. The summer of
1987 was much drier than the weather experienced during the
previous summer. It is believed that reduced amounts of
surface runoff limited the supply of algae producing
nutrients available to the lake over the growing season with
a resulting Improvement in water quality. Similarly low
productivity was documented in 3ass a year with a dry summer period.

ID NUMBER 12—0017—001—01
WATERSHED AREA SURFACE AREA MAX DEPTH VOLUME
14.89 76.89 25.9
: 8.67
SHORELINE COTTAGES RESORTS % CROWN
8.2 km. 67 (1975)
:0 LAND : 0
* E;aspc on men 6
LAKE BASS LAKE TWF REAR OF LEEDS & LANSDOWNE COUNTY LEEDS
sq. km ha. m.
mill cii. in.
OUTLET
SAMPLE DATE SECCHI DEPTH CHLOROPHYLL A
(116/U
4. 4
I I
I
I
I
08/17/87 6.' 0,9
08/20/87 7.0 0.6 08/30/87 7.5 0,9
09/07/87 6.7 1.0
09/27/87 7.0 1.3 7 7
-
0.6 S — S
SAMPLE DATE SECCHI DEPTH CHLORONYLL P
(YEAR) (METERS) (116/U + + +
1977 6.6 :15 1978
197° 47 I Cr I
I e3UV I 9.1 I (001 7 I s?9L S.d a..
1982 6.0 1.8 1983 6.5 : 1.2 1984 6.6 2.5
1985 6.6 1.8
986 * s.: 1.? I a07 I C C I .d! I a.
MEAN : 5.6 1.0 ( MEAN
: 2.3 MAX
• 5.0 0.5 MIN
ED :.20 1 0.50
6. 1
6.6 V. —
3.6! St

BAY LAKE Eleven sets of samples were collected from July 19 to October 18. Although the absence of more productive conditions during the spring cannot be confirmed with out data from May and June, the results indicate Bay Lake has exceptionally transparent water with very extremely low levels of algae.
Chlorophyll concentrations were lower during 1987 than during 1986 and other previous years of record. The summer of 1981
was much drier than the weather experienced during the previous summer. It is believed that reduced amounts of
surface runoff limited the supply of algae producing nutrients available to the lake over the growing season with
a resulting improvement in water quality.

LAKE : BAY LAKE TWP : FARADAY COUNTY HASTINGS
ID NUMBER : 18—3490—008—0 1
WATERSHED AREA 7. 1 SURFACE AREA : 87.0 MAX DEPTH 24.0 VOLUME : 9.00
sq • km ha. m.
mill cu. m.
SHORELINE COTTAGES RESORTS X CROWN
VICINITY OF LEOFSKY'S POINT
km. 6.8 48
: 1(10) LAND : 3
HISTORICAL RECORD
+ + + +
SAMPLE DATE SECCHI DEPTH CHLORDPHYLL A
(YEAR) (NETERS) (1J13/L
+ + + +
SAMPLE DATE SECCHI DEPTH CHLOROPHYLL A
(MM/DD/YY) : (METERS) (US/L) + + + +
07/19187 6.4 0.9
08/09/87 7.9 0,8 08/16/87 05 08/30/87 6.4 0.4 09/07/87 1 7.0 0.5 09/13/87 8.5 1 1.1 1
1 09/20/87 6.7 0.8 09/27/87 7.0 0.7 10/04/87 7.0 1.7 1
10118/87 ',t)
lEAN
MAX 8.5 1.7
MEN 6.4 0.4
10 10
SD 066 0.47
1977 4*
1979* t985 4*
1987
MEAN
MAX
PUN
3. 4.7 1.4
8.5 1.0
7.: :, 9
11 t I.L ¶ I.e 8.5 1 1.4
4.7 0.9
:4
N 4 1 4
SD 1.69 0.22
NOTE I Based on less then S r2adinas. te Recreational lakes included.

BEAVER LAKE
Seven sets of results were collected. from July 24 to
September 19 on the South Basin of Beaver Lake. Although the
absence of more productive conditions during the spring
cannot be confirmed without sampling f or the months of May
and June, the results for the suer months indicate South Beaver Lake had low levels of algae with satisfactory water
quality for recreational use purposes.
Water clarity was higher and chlorophyll concentrations lower
than those measured in the lake durIng 1986. The summer of
1987 was much drier than the weather experienced during the
previous summer. It is believed that reduced amounts of
surface runoff limited the supply of algae producing
nutrients available to the lake over the growing season with
a resulting improvement in water quality. Similarly low
productivity was documented in Beaver Lake in 1983 which was
also a year with a dry summer period.
The Beaver Lake Protective Association is cautioned that wide
spread harvesting of aquatic weeds could result in increased
levels of algae in the lake by reducing the competition for
nutrients from rooted aquatic plants. Harvesting should be confined to the minimum areas needed to facilitate boating and swlmminq.

LAKE : BEAVER LAKE TWP SHEFFIELD COUNTY LENNOX & ADDINGTON
ID NUMBER 17—0031—001—01
sq. km ha. m.
mill cu. m.
SI-IOREL I NE COTTAGES RESORTS 7. CROWN LAND
15.6 km. 143 1 (10)
:0
NOTE ' Based on !ess then 6
t* axes
WATERSHED AREA : 534 SURFACE AREA : 280 MAX DEPTH : 6.10 VOLUME : 9.2
SOUTH BEAVER - CENTRE SOUTH BEAVER LAKE
t——————————— ——————t——
SAMPLE DATE SECCHI DEPTH CHLOROPHYLL A
(MM/DO/Yr (US/LI I
4 S + +
07/24/87 1.8 1.2 i I
I LiQ I
06/07/87 2.1 2.7 08/12/87 2.4 2.8 08/26/87 2.1 4.9 09/02/87 2.4 2.9
09/17/87 2.3 2.7 S 4 +
SAMPLE DATE SECCHI DEPTH I CHLOROPHYLL A
(YEAP (METERS) I (UG/L)
+ + 4 +
:975** 2.8 6.5
1976* 2.0 7.5 I
I &11J4, i
2.9 2.4
1985+e 2.7 4.6
1986 2.2 6.! 1987 2.3 2.7
4 4 4
MEAN 2.3 2.7 MEAN 2.7 : 4.9 mfl 4Q MAX 31 7t
:,s : ' 2.' -. A I
II ' 1
I
I
32 0.29 1.20 SD 0.34 : 1.93

BELLAMYS LAKE
Insufficient sampling was carried out during 1987 to reach any definite conclusions about Bellamys Lake or make
comparisons with other years. A minimum of six sets of measurements are necessary to adequately characterize *ater quality of a lake. Preferably 12 or more measurements evenly timed throughout the ice tree season of the year from Kay to October should be taken to define any seasonal trends in water quality if they are present.

LAKE BELLAMYS LAKE TWF KITLEY. BASTARD COUNTY LEEDS
ID NUMBER 18—0033—003-01
WATERSHED AREA SURFACE AREA MAX DEPTH VOLUME
sq. km ha. m.
mill cu. m.
SHORELiNE COTTAGES RESORTS % CROWN LAND
6.6 26 1 (130)
* Based or Q!E E
36.0 I
2.3 1.23
km.
4 t— SAMPLE DATE SECCH! DEPTH CHLOROPHYLL A
(METERS)
4———————— + —
8 -_ I
I
1.2 •
•
• "I- —.
I.—-— —————+———-——————————+————'——————————+
SAMPLE DATE I SECCHI DEPTH CHLOROPHYLL A
(YEAR) (METERS) (U8/L
I —11
2.0 7.
*
1980 t+ :. :987'
McAN ' :
'
MAY [ff111
I
I
I C I I
I I I ?1 I.a !
MAX : .2 : S.3
.7 1.3
BIG GULL (CLARENDON) LAKE
Eight samples collected from mid June to the end of September provided good seasonal coverage of water quality conditions. The results Indicate Big Cull Lake has very good water clarity with very low levels of algae.
Water clarity was higher and chlorophyll concentrations lower
than those measured In the lake during 1986. The surer of 1987 was much drier than the weather experienced during the previous summer. rt is believed that reduced amounts of surface runoff limited the supply of algae producing nutrients available to the lake over the growing season with a resulting improvement in water quality.

LAKE : BIG GULL (CLARENDON) LAKE TWP KENNEBEC, OLDEN, BARRIE, CLARENDON COUNTY : FRONTENAC
ID NUMBER : 18—3430—003—01
WATERSHED AREA 137.00 SURFACE AREA : 236.0
26.00 919.70
89.00 km. : 280 (1974) : 10 (156)
PINNACLE POINT
MAX DEPTH VOLUME
sq. km ha. in.
mill cii. in.
SHORELINE COTTAGES RESORTS X CROWN LAND : 25
SAMPLE DATE 1 SECCH1 DEPTH CHLOROPHYLL A
(MM/DD/YY) (METERS) (U6/L)
SAMPLE DATE SECCHI DEPTH I CHLOROPHYLL A
1 (YEAR) (METERS) W6/L) + + + +
0E114/87 1
4.0 1.3
1.3
1 1 1
1 1 1
1 1
1 1
1
a' 2.4
:976 4.6
: 4.6
1978 4.6
1979' 4.1
1980' 3.7
982 : 3,9 1983 1 3.7
1984 4.0 IGOC -, -. —
1986 4.1
4.3 1.8
." .L 2.5 ;
1
N 1
1
5.0 I
I S.
3.0
4.1
3.2
2.?
2.6
1.8
MEAN 4,2 3.0
MA1
3.4
SD
• Sasec ::r es: 3
'a Recreational lakes included.

BIG RIDEAU LAKE
Four locations were sampled on Big Rideau Lake during 1987. The seasonal Secchi disc visibility depth was greater
and the chlorophyll concentration lower in Briton Bay of Big Rideau Lake than either the Hudson Bay or vicinity of Sand Island sampling locations. A reason for this variation in water quality is not apparent but is not an established
pattern based on previous years' results.
Big Rldeau Lake is relatively uninfluenced by local runoff
as water clarity did not deteriorate during the extremely wet
summer experienced in 1986 or improve during the drier
weather experienced in 1987 as happened in other nearby
smaller lakes.
Secchi disc visibility has been lower and chlorophyll
concentrations higher since 1980 in Big Rideau Lake than for
the years prior to 1980. None the less, these parameters
indicate Big Rideau Lake has good water clarity with a low
level of algae.

LAKE ; BIG RIDEAU LAKE TWP : NORTH & SOUTH BURGESS & ELMSLEY, BASTARD COUNTY LANARK, LEEDS
ID NUMBER : 18—0033—006—01
WATERSHED AREA :
SURFACE AREA MAX DEPTH VOLUME
478.90 sq.km 4700 ha.
: 95.00 : 799.97 miii cu. at.
SHORELINE COTTAGES RESORTS X CROWN LAND
172.00km. 1063÷12 HOUSES 12 (621)
:5
BRITON BAY
7c
4 + +
MUSKRAT HOLE
/87
P'f /C7
•
rn.
t———
SAMPLE DATE SECCHI DEPTH CHLOROPHYLL A
(MM/OD/YY) (METERS)
4. 4 + +
I I .n3 I A.. +————
t I SAMPLE DATE SECCHI DEPTH : CHLOROPHYLL A
':MM/DD/YY) (METERS) (USIL) 4 —4 —-———+———————— —4
I At •'A1fl7 I '1 q
06/25/87 3.' 0.
07'03/87 6.
07/09/87 4.9
07/15/87 4.4 2.5
07/29/87 3.2 3.1
08/05/87 1 3.7 : 2.6 08/12/87 4.3 2.0
i.E l 2.?
• 'E7 —. 2.5 4 — 4
I' '.3
A.
1.1
MEAN
MAX
MIN
N
SD
BEThEEN SAND ISLAND ANt NORTH SHORE
SAMPLE DATE SECCPII DEPTh
(MM/DD/YY) (METERS) (US/U
SEAN 1 4.0 2.3
MA! 6.9 3.4 0.4
t:i.aa
3AV
2ATE DEPTH I CHLOROPHYLL A
(MM/DO/fl) (U8/L)
2.9
05/04/87 30 • 6' 06/03/87 2.5 : 4.5
2.3
.
- (I - — J.I
• 3,2 • Q/1f1
:.?
+
MEAN 3.8 2.0
MAX 1 5.5 5.
MIN : 2,7
:
N 7 7
SD

LAKE : BIG RIDEAL' LAKE TWP NORTH & SOUTH BURGESS & ELMSLEY, BASTARD COUNTY : LANARK, LEEDS
ID NUMBER 18—0033—006—0 1
sq. km ha. m.
mill
SHORELINE COTTAGES RESORTS
cu. m. X CROWN LAND
172.00km. : 1063+12 HOUSES : 12 (621) :5
£ ;&SEC
** Recreational aEes
WATERSHED AREA : 478.90 SURFACE AREA : 4700 MAX DEPTH : 95.00 VOLUME : 799.97
BRITON BAY HISTORICAL RECORD VARIOUS OPEN WATER LOCATIONS
SAMPLE DATE SECCHI DEPTH CHLOROPHYLL A
METERS W6/L)
+ + +
1975* 4.8 3.0 •0—,
1 3.3
1987 4.0 2.8
4—————— —1———————
MEAK 4.2 2.8 PiAX 4.8 3.3 Pith 3.3 1 2.0 ; 5 , 5
SD •)57 !
r SAMPLE DATE I SECCHI DEPTH CHLOROPHYLL A
(YEAR) (U6/L) ——-.+ ————+
(971+' 3.8 1 2.9 1973" 4.6
1976 4
I i&77 I
F
1978 4.5 3.0 1 1979 4.4 1 2.4
1980' 33 4.7
1981" 1 3.3 2.8
1983 1 2.9 4.7
1994 23 3.E
:985 CS 1996 35 1987 3.5 1 2.6
4 + 4 + NOTE : * Based on less then 6 readings. *3 lakes included, MEAN 3.9 1 3.5
M81 : 1,5 —,
Pith 2. !
:b I e, I ! v.

BLACK LAKE
A total of ten samples collected from June 1 to September 28
provided good seasonal coverage of water quality conditions in Black Lake.
Chlorophyll concentrations were higher and water clarity poorer during the Latter part of the season than the earlier part. This seasonal pattern of increasing productivity as
the summer progresses was evident in Black Lake during 1986
as well, and is a characteristic shared by many other lakes enrolled in the Self Help Program, including nearby Pike
Lake
Although Secchi disc visibility was improved over that of
1986, chlorophyll concentrations were somewhat higher. Both the current year's results and the historical record
Indicate Black Lake has very good water clarity with only a moderate amount of algae. Based on these results the lake
has good water quality from a recreational use point of view.
The Black Lake Association participated in a Shoreland Restoration program during 1987. The program involves the co-operation of cottagers in enhancing the lake environment by returning disturbed areas the shoreline to their natural state with cuttings of herbaceous shrubs native to the lake.

LAKE : BLACK LAKE TWP NORTH BURGESS COUNTY : LANARK
SOUTH WEST END OF LAKE
+————————————+——————————————+—_—---——————————+
SANPLE DATE SECCHI DEPTH CHLOROPHYLL A
(MM/DO/fl) (METERS) I (IJG/L) I
+ ——4 +
06/01/87 5.6 1.0
06/22/87 1 4.5 1.9 • I n.j
I I
I tnj 1 07/27/87 so 57
08/04/87 40 86 08/1787 37 34 08/17/87 4.0 5.0
2.3 1
(In •.n •
ID NUMBER 18—0033—026-01
SAMPLE DATE SECCHI DEPTH CHLOROPHYLL A
(YEAR) (NETERS (U3/L) + 4
1975" 3.7 : 6.0 1980* 1.3 5.7
1992 n 5,9
1985 4.8 1.3 1 1986 3.9 3.9
1987 4.2 : 4.3 4 —4——— —4———— —4
MEAN : 4.3 4.3 1
MAX : 5.8 5.0 1
I -
SD : 0.90 : :.29
WATERSHED AREA 67.1 sq.km SHORELINE : 20.1 km. SURFACE AREA 3.42 ha. COTTAGES : 188 MAX DEPTH : 23.0 m. RESORTS : 1
VOLUME : 24.84 miii Cu. m. Z CROWN LAND : 0
3.5
3.3 i III
2.17 ti NOTE * or Then 5
BLACK DONALD LAKE
A total of ten samples were cOllected from July 5 to October
12. Chlorophyll concentrations were higher during September
than at other times during the sampling period but water
clarity did not decline as a result.
Although the absence of a spring peak in productivity cannot
be confirmed without results for the months of May and June,
the Secchi disc visibility and chlorophyll concentrations
indicate Black Donald Lake has exceptionally clear water
transparency and extremely low levels of algae.
Water clarity was higher and chlorophyll concentrations lower
than those measured in the lake during 1986. The summer of
1987 was much drier than the weather experienced during the
previous summer. It is believed that reduced amounts of
surface runoff limited the supply of algae producing
nutrients available to the lake over the growing season with
a resulting improvement in water quality. Similarly low
productivity was documented in Black Donald Lake during 1983
which was also a year with a dry summer period.

LAKE : BLACK DONALD LAKE TWP : BROUGHAM COUNTY : RENFREW
ID NUMBER 18—3490—043—01
WATERSHED AREA SURFACE AREA MAX DEPTH VOLUME
7393.00 1550.0 44.00
SHOREL INE COTTAGES RESORTS X CROWN LAND
km. 103 2(102)
:20
Eased or :P!S then £ " flCEG.
sq. km ha. in.
mill Cu. in.
EAST BAY
—
SAMPLE DATE SECCHI DEPTH CHLOROPHYLL A
(MMfDD/YY) (METERS) (US/L) + —-+ 4— +
07/05/87 3.5 1.1
5.5 1.0
3.3 1.!
08/27/67 6.1 1.4
09/07/87 5.2 2.5
09/13/87 6.1 ? 3.3
09/20/87 5.8 3.0 I I I
I I I in! I
4 + + ——4
t—
SAMPLE DATE BECCHI DEPTH CHLOROPHYLL A
(YEAR) 1 (METERS) WGIL) 4—— 4 ——4 +
4.2 3.3
1982* 4.9 3.0
1983 5.6 1.7
1984 1 5.3 2.9
1985 5.7 1.7 I I t I AG I I I Ln.
1987 5.7 1.8 + ———4————————— 4————
1.8
a.: 3.2
' 3.2 : 1.0 h! I I \ i I
SD 0.32 0.94
MEAN 5.2 MAX : 5.7
1.: N 7
SD i 0.56
La 'I a.
0.68 4. +

BOBS LAKE
Bobs Lake is composed of a number of different basins and
bays that act independently of one another from a water
quality point of view. The best water clarity and the lowest chlorophyll concentrations were observed in Green Bay. The
poorest water clarity and the highest chlorophyll
concentrations were found in Mud Bay. The East Basin and
Long Bay are intermediate between these extremes. This
ranking of water quality among the basins is consistent with
that of other years. The results indicate that the major basins of Bobs Lake are well suited for a variety of
recreational uses including water based uses such as swimming
and bathing.
The results for all sampling locations on Bobs Lake
exemplified a pattern found in other lakes of improved water
clarity and reduced chlorophyll concentrations compared to
the 1986 results. The summer of 1987 was much drier than the
weather experienced during the previous summer. It is
believed that reduced amounts of surface runoff lowered the
supply of algae producing nutrients to the lake over the
growing season. Similarly low productivity was documented in
Bobs Lake during 1983 which was also a year with a dry summer
period.

LAKE : BOB'S LAKE : EAST BASIN TWP : BEDFORD COUNTY FRONTENAC
WATERSHED AREA : 351.32 SURFACE AREA : 927.0
ID NUMBER : 18—0033—010—01
RESORTS : 3(33) cu. m. 7. CROWN LAND : 2
EAST BASIN EAST BASIN HISTORICAL RECORD
NOTE )n 1?SS then 6 ri,djnqs i.25
3AY :r SASI 343N
SAMPlE DATE SECCH! 3E?TH •::CROPHYL: 4
US/I
_.N'3 3AY -.
A15 -
MAX DEPTH VOLUME
23.00 88.57
sq. km ha. m.
ml 1. 1
SHORELINE COTTAGES
: 66.00 187
km.
t——————
SAMPLE DATE I
t——---—————————.t——
SECCHI DEPTH I CHLOROPHYLL A
(Mft/DO/YY) I
4—————————+—
06/01/81
(METERS) 1 (116/1)
.——+————————————-—+
4.6 0.9 06/15/87 4.6 2.1
07105/87 43 '8 07/20/87 43 19 08/04/87 4.4 1 5.0
1 08/17/87 4.3 3.2
08/31/87 4.1 1 4.3
09/08/87 4. —
4.3 4.4 4——————————-——4—--—-— 4
t————————————— t SAMPLE DATE SECCHI DEPTH I CHLOROPHYLL A
(YEAR) 1 (METERS) (U6/L) +
1972's 4.1 5.5 197514 5.0 4.
:981 3.6 4.1 I IIflI 4 I
I
1983
1984 ' 5.0 3.2
1 1985 4.5 4.6
1986 1 4.2 5.0
1987 4.4 1 3.1 MEAN : 4.4 3.1 1
MAX 1 4.6 5.0 1
MIN 4.1 : 0,9
: 9 N
3D ').17
MEAN
MAX
SD
4.! 5.0 5.3
0.47
1 07/10/87
——t———————
1 4.6 1
t————— +
1.5
1 07/28/87 1 4.7 1 2.1
: 08/09/87 1 4.6 : 1.0
1 08/30/87 1 3.8 54 s————— — ——4.
lEAN .L,4
¶AX 1. 7 5,
IN 3.3 :
.1 4
).42 1.34
1 3.9
1 2.2 3.3
2.3
I
4.7
4.3 1 4.2
1975* 198!
1982
1983
1984
:985' 1998* :997'
TMIN
SD
3 3
1.03 0.36
NOTE * Based on less then 6 readings. *4 Recreatthnal lakes

LAKE : BOB'S LAKE : GREEN BAY TWP : BEDFORD COUNTY : FRONTENAC
ID NUMBER : 19—0033—011—01
WATERSHED AREA SURFACE AREA MAX DEPTH VOLUME
22.00 534.0 26.00
GREEN BAY GREEN BAY HISTORICAL RECORD
+ ..ess ;nen 5
4+ ?o
sq.km SHORELINE ha. COTTAGES : 106 in. RESORTS : 5 (54)
km.
I ————————+———-
SAMPLE DAtE SECCHI DEPTH CHLOROPHYLL A
(MMIDDIYY) I (METERS) (UG/L)
+ — +
04/27/87 3.6 [.4 05/'1/87 40 ' '6
i 06/10/87 4.3 0.7
06/25/87 : 7.3 0.2 1
07/12/87 5.5 1.3
1 5.2 0.8
08/07187 49 1' 08/20/87 5.5 2.2
09/02/87 5.5 2.4
4
SAMPLE DATE SECCHI DEPTH CHLOROPHYLL A
(YEAR) I WG/U I
4————— + + t 1972" 1 4.9 1 3.3
19154+ 5.6 3,6
1918 5.0 2.7
1979. : 5.8 2.7
1980' 5.3 5.0
19814* 1 4,7 2.5
1982' 2.9 1 2.5
1984' 5.6 1
1985 5.3 1.2
:996 F
1987 5J 4—-————— —4.———— — t MEAN
MAX
MIN
1.3 50 + 7.3
3.6 '.3
24 ' MEAN 1 51 F I
02 ' MAX F 53
10 F MN 2.3
!
'1
90 .1

LAKE : BOB'S LAKE MUD BAY TWP : BEDFORD COUNTY : FRONTENAC
ID NUMBER : 18—0033—008—01
WATERSHED AREA SURFACE AREA MAX DEPTh VOLUME
6.11 202.0 7.30
: 6.40 mill cu. m.
SHORELINE • COTTAGES
• RESORTS X CROWN LAND
0.00 km. : 150+15 HOUSES
4 (62) :20
MiD BAY MUD BAY HISTORICAL RECORD
NOTE * Based on less :hen
It lakes
sq. km ha. m.
t——————————— 4- —4.
SAMPLE DATE SECCH! DEPTH CHLOROPHYLL A
(MMIDD IVY) (METERS) (tJ8/L) 1——————— + +
04/10/87 3.0 1 0.4 2.7 1.5
06/30/87 1 2.7 1 0.8 01/15/87 1 3.3 4.4 07/27181 1 26 : 36 08/11187 1 21 : 72 08/26/87 2.3 7.1
4— — ———————+——————————————+———— ——4
SAMPLE DATE I SECCHI DEPTH CHLOROPHYLL A
(YEAR) (METERS) (UVL) 4———— +
1975" 1 4.0 7.6
1 1976 1 3.5 6.0 1 1977 1 3.8 3.8
1980 3.5 1 7.4
1981 2.9 6.0 1
1 1982 1 3.2 6.0 1983 2.8 1 4.! 1994 5.2
1985 3.1 5.5 I
19% I
I £70? /
'—-— A———— a
MEAN 1 '7 ' 36 !
MAX 1 3.3 12
MIN 2.1 : 0.4 1
N 7 : 7 1
0.40 1
+——————— i— 2.84
• ••
1
+
MEAN
MAX
SD
1
:
1
3.1
4.0
2.3
0.54
1
1
5.9 9.2 3.6 :: l.?2

LAC DU SIMS DUR
A total of six samples were collected beginning on August 20
and Einishing on October 1. Although suiaer conditions were not adequately assessed in the absence of samples from June and July, the results do indicate that Lac du Sois Dur has
good water quality.

LAKE : 8015 DUR, LAC flu — PETAWAWA RIVER TWP : PETAWAWA COUNTY : RENFREW
WATERSHED AREA :
SURFACE AREA : 2.42 MAX DEPTH : 58.0 VOLUME : 10.85
100 METRES OFT SOUTH SHORE
ID NUMBER : 18—4930—002—01
SHORELINE COTTAGES RESORTS 7. CROWN LAND
HISTORICAL RECORD
sq. km ha. m. mill cu. in.
: 24.15 km. :22
SAMPLE DATE SECCHI DEPTH CHLOROPHYLL A
(MM/DO/lY) (METERS) 1 (US/I) + + + +
08/20/87 3.8 1 3.1
: 08/28/87 : 3.7 1.0
1 09/03/87 4.1 1,2
' 09/11/87 : 44 io '
I
i
ff1 !
.
I AI\ 1fl7 LVIVLJOJ 11 J•l ! ç L.,j
I SECCHI DEPTH : CHLOROPHYLL A
(YEAR) 1 (METERS) (US/I) 4 + +
3.8 1.6
4.0 1.b
1986*
1987
MEAN
I MEN
3.9
MEAN 4.0 : 1.6
MAX 1 4.7 1 3.1
MEN 1 3.7 1.0
N 6 6
SD : 0.9
s..J
3.8 1.6
N 1 2 2
SD 1 0.14 1 0.00 + + +
NOTE + on tess then b reicim;s. 4*

BRULE (WENBLEY) LAKE
Ten sets of measurements were collected from June 21 to Sept
S providing good seasonal coverage of water quality conditions In Brule Lake. Chlorophyll concentrations were
higher during the three consecutive sampling dates in
September than through oUt the rest of the season but water
clarity declined only very slightly. The results indicate that Brule Lake has exceptionally clear water transparency
with a very low amount of algae.
Water clarity was higher and chlorophyll concentrations lower
than those measured in the lake during 1986. The summer of
1987 was much drier than the weather experienced during the previous summer. It is believed that reduced amounts of
surface runoff limited the supply of algae producing nutrients available to the lake over the growing season with a resulting improvement in water quality. Similarly low
productivity was documented in Brule lake during 1983 which was also a year with a dry summer period.

LAKE : BRULE (WENSLEV) LAKE TWP : MILLER COUNTY : FRONTENAC
ID NUMBER : 18—2490-010—01
WATERSHED AREA : 52.79 SURFACE AREA : 571.0 MAX DEPTH : 56.40 VOLUME : 126.65
sq. km ha. m.
mill in.
SHORELINE COTTAGES RESORTS
: 26.60 km. :85
2(3)
CENTRE OF LAKE HISTORICAL RECORD
NOTE * )fl 5
+4 Recreattonal :;kes
X CROWN LAND : 35
SAMPLE DATE SECCHI DEPTH CHLOROPHYLL A
(MMIDDIYY) 1 (METERS) (US/L) SAMPlE DATE SECCHI DEPTH I CHLOROPHYLL A
1 (YEAR) (METERS) (UG/L)
: 06/21/87 : 7.6 : 1.3 :
06/21/87 1 7.6 0.7
1 07/12/87 7.6 0.7 i
1 07/12/87 1 7.6 : 1.1 1
1 07/29/87 1 7.6 1 1.1 1
: 08/12/87 1 7.5 1 0.4 1
1 08/13/87 : 7.8 1 0.8 :
1 09/03/87 : 7.6 1 1.8 1
1 09/04/87 ' 75 1 12 '
: 09/05/87 : 7.5 1.6 1
7——
1 1976*4 : 7.7 2.9
t
1 1979 : 6.5 : t.8 :
1 1980 ; 6.8 : 2.1
1 1981 : 7.3 : 1.8
1 1982 1 7.5 1.4 :
1 1983 1 8.3 : ;
1 1984 .6.6 1 2.2 :
: 1985 : 7.2 :
: 1986 : 7.7 ! 1.6
1987 7.6
MEAN 1 7.6 1 1.! MEAN 1 7.3 MAX 1 7.8 1 1.8 1 MAX 1 8.3
MN 1 7.5 1 0.4 1 MIN 1 6.5
N 1 10 1 10 N 1 10
911 J,09 I ).44 3D 1.55
' is b.
' 11 1 10

BUCK LAKE - NORTH BAY
An intensive sampling program running from April 11 to
October 12, encompassing the entire growing season, provided
excellent seasonal coverage of water quality conditions in
the North Bay. The spring pulse and fall peak in chlorophyll
concentrations characteristic of the North Bay in previous
years was not as pronounced as it was in 1986 and overall the
lake was less productive
Water clarity was higher and chlorophyll concentrations lower
than those measured in the lake during 1986. The summer of
1987 was much drier than the weather experienced during the
previous summer. It is believed that reduced amounts of
surface runoff limited the supply of algae producing nutrients available to the lake over the growing season with
a resulting improvement in water quality. Similarly low
productivity was documented in the North Bay during 1983
which was another year with a very dry summer period.
The Secchi disc visibility and chlorophyll concentration
resuits indicate the North Bay has very good water quality
well suited for a variety of recreational pursuits.

LAKE : BUCK LAKE : NORTH BAY TWP : LOUGHBOROIJGH, BEDFORD, STORRINGTON COUNTV : FRONTENAC
ID NUMBER : 12—0004—002—01
WATERSHED AREA : 19.16 SURFACE AREA : 276.0 MAX DEPTH : 32.00 VOLUME : 27.78
sq. km ha. m.
mill cu. in.
SHOREL I NE COTTAGES
15.00 km. : 77 (1976)
NORTH BAY - NORTH END NORTH BAY — SOUTH END
NOTE * Based on less then 6 readinos. ci Recreational lakes included.
RESORTS : 1 (25) 7. CROWN LAND : 10
I SAMPLE DATE SECCHI DEPTH : CHLOROPHYLL A I SAMPLE DATE I SECCHI DEPTH CHLOROPHYLL A I
I (MM/DD/YY) 1 (METERS) I (U6/L) I 1 (MM/DD/YY) 1 (METERS) I (U6/L) 1
1 04/11/87 1 3.6 : 2.1 1
1 04/17/87 1 3.2 : 2.1 :
t I I
E 07/l'/87 : 43 : 28 ' 07/1/87 : 37 ' 27
07/24/87 5.7 2.6 :
: 07/30/87 4.0 1 2.4
; 08/03/87 : 4.3 1 3.2 1
'
• 4j : 08/10/87 1 5.3 1 1.3 1
: 08/23/87 1 419 1 1.6 1
; 08/15/87 1 5.0 1.4 :
08/18/87 1 4.6 2.0 :
: 08/25/87 4.3 3.9
: 09/01/87 1 4.3 : 3.6
09/07/87 1 4.1 2.9 09/27/87 : 4.2 5.2 :
' 10/01/87 ' 48 ' 45 :
1 10/11/87 4.9 4.0 :
04/26/87 1 3.4 1
1 05/31/87 1 53 1 21 I 4 0
07/01/87 5.3 0.6 07/12/87 3.7 3.6
- iS
08/03/87. 4.0 3.5 09/06/87 1 4.1 2.6 101:2187 .8 4.2
MEAN 1 4.2 2.8 MAX 1 5.3 1 4.2
MIN 3.4 0.6 I
e
SD 0.74 1 1.36 —————4——.-——— +
NORTH AND SOUTH ENDS COMBINED
—
MEAN 1 4.3 :.8 SAMPLE DATE SECCHI DEPTH CHLOROPHYLL A
: .3 : 5.2
N
L 3.2 I 1.3
.9
#—
1975+* 4.3 fl
I .4 ' I 2.2 5.:
: :977 L 3.3 :.4 : 1978 1 3.9 4.9
1 1979 1 3.2 1 5.8
i 1980 3.6 ; 4.6
1 1981 1 4.1 3.7 I 1982 : 3.9 : 3.1
' 1983 '
47 !
1984 3.9 1 4.8
: 1985 : 3.5 1 4.9 1986 3.8 1 5.0
; 1987 1 4.3 2.8
MEAN 3.9 1 4.2 MAX 4.7 : 5.8
rIN 1 3.2 2.5 II I fl
LQ L
sJ
SD 1 0.44 : 1.02

BUCK LAKE - SOUTH BAY
A total of 25 sets of measurements taken between April 12 and November 1, encompassing the entire growing season, provided excellent seasonal coverage of water quality conditions in
the South Bay. Neither a spring pulse or fall peak in
chlorophyll concentration was evident, perhaps because weekly variability obscured any seasonality in lake productivity.
As in previous years, water clarity was better and chlorophyll concentrations lower in the South Bay than in the
North Bay of Buck Lake. The results indicate the South Bay
has excellent water quality well suited for a variety of recreational uses.
Water clarity was higher and chlorophyll concentrations lower
than those measured In the lake during 1986. The summer of
1981 was much drier than the weather experienced during the previous summer. It is believed that reduced amounts of
surface runoff limited the supply of algae producing nutrients available to the lake over the growing season with
a resulting improvement in water quality.

LAKE : BUCK LAKE : SOUTH BAY TWP : LOUGHBOROUGH, BEDFORD, STORRINI3TON COUNTY : FRONTENAC
WATERSHED AREA 62. 14 SURFACE AREA : 467.4 MAX DEPTH : 39 VOLUME : 61.0
SOUTH BAY NEAR PORCUPINE ISLAND
ID NUMBER 12—0004-004-01
RESORTS : 1(4) X CROWN LAND : 0
SOUTH BAY — HISTORICAL RECORD
4.3 1.9
1.2
3.9 5.1
5 1 1 ii I J.V
4.6 1.7
I As!
5.0 0.6
5.3 1 0.5 4.9 1 1.4
4.7 hE
5.6 2.0 U.s I LaO
L.A I
.1st 1 L.Q
4,9 2.:
5.7 3.3
1•9
5.7 3.6 5.5 3.8 5.1 3.9
sq. kin ha. In. mill cu. in.
SHORELINE COTTAGES
30.9 km. 181 (1976)
I SAMPLE DATE SECCHI DEPTH CHLOROPHYLL A
(MM/DD/YY) (METERS) (UG/L)
SAMPLE DATE I SECCHI DEPTH CHLOROPHYLL A
(YEAR) I
I (UVL)
: j975*t : 4.3 ; 3,3 I
: 1978 ! 5.8 1 3.4
I 19794 4.3 1 5.4
: 1986 1 4.4 1 3.0 1
1 1987
*—————————————+
1 5.2 :
+
2.5 1
+
04/12/97 04/26/87 05/19187
06/06/87 06/14/87 06/21/87 06/27/87 07/10/87 07/13/87 07/20/07 07/26/27 08/03/87 08/06/87 08/10/87 08117/87
08/22/97
09/07/87
09/13/37 09/20/87 09/27/97
10/04/87 :0/h/37 10/19/87
10/25187
11/01/87
MEAN 4.8 : 7.8
MAX 5.8 6.
MN
5 5
NOTE : * Based on less then 6 readinas. *4 Recreational lakes i'cluded.
MEAN 1 5.2 1 2.5 5.; : 5.1
MN 3.9 : 0.5 I I
•
SD 1 0.58 1.10

BIJRRIDGE LAKE
A total of 19 sets of measurements collected from April 12 to October 29, encompassing the entire growing season, provided excellent seasonal coverage of water quality conditions in Burridge Lake.
A different volunteer looks after the sampling for each month of the program. The decline in water clarity as the season progresses observed in Burr idge Lake in some previous years was not apparent during 1987. However, as there is an element of individual subjectivity In Secchi disc readings, caution must be applied in interpretation of water clarity results.
The water clarity and chlorophyll concentration results for 1987 are comparable with those of other years since 1980 and indicate Burridge Lake has very good water quality well suited for a variety of recreational uses.

LAKE BURR IDGE LAKE TWP BEDFORD COUNTY FRONTENAC
CENTRE OF LAKE
ID NUMBER 12—0033—014—01
SHORELINE 6.30 km. COTTAGES 47 (1974) RESORTS Z CROWN LAND : 0
HISTORICAL RECORD
05/08/87 4.8 05/24/87 : 3.1
05129187 3 4
06/03/87 2.6
06/10/87 1 3.2 06/17/97 4.4
06/25/97 1 4.7 07/05/87 1 4.6
07/26/87 5.5 08/02/87 4.0 08/08/87 6.1
08/16/87 4.0 08/23/27
• 1/29/97 3.
• 10101/97
01!5/37 3
• 2129197
10.5 5.3 2.1
0.5 1.3 1.6
0.6
2.3 0.5
0.4
1.5
5.6 : 4.1
N i 8
SD 0.45
MEAN 3
isi MEN 2.6
N 19
SD 0.98
0.4 15
2.60
WATERSHED AREA : 4.53 sq.km SURFACE AREA : 81.0 ha. MAX DEPTH : 16.20 m.
VOLUME : 5.89 miii Cu. in.
I SAMPLE DATE I SECOHI DEPTH CHLOROPHYLL A
(METERS) (UG/L)
SAMPLE DATE I SECCHI DEPTH :HLGRDPHYLL 4
rYEAR)
: 1990 1 4,5 1 3.5 !
981 1 4 S
' 1982 1 47 '
' 1993*4 1 56 : 18 1
1 1984 4.1 3.0 !
1985 : 4.9 2.1 :
1986 4.6 ! 2.5 !
S
1q97 S
45 :
).76
• 9asea
•t :::•:2:.

CAB FIEL LAKE
A total of 15 samples taken from April 29 to September 28, encompassing most of the active growing season, provided very good coverage of seasonal water quality conditions in Cashel Lake. Secchi disc visibility was lower and chlorophyll concentrations higher in September than at any other time during the season. A late summer increases in lake productivity is a widespread occurrence at this time of year and is due to an upwelling of nutrient laden water from the deeper regions of the lake which occurs with seasonal cooling of the water.
Water clarity was higher and chlorophyll concentrations lower than those measured in the lake during 1986. The summer of 1987 was much drier than the weather experienced during the previous summer. It is believed that reduced amounts of surface runoff limited the supply of algae producing nutrients available to the lake over the growing season with a resulting improvement in water quality.
The chlorophyll concentration and Secchi disc visibility data
indicate Cashel Lake has very good water quality from a
recreational use point of view.

LAKE : CASHEL LAKE TWP : CASHEL COUNTY : HASTINGS
ID NUMBER : 17—0021—002—01
WATERSHED AREA : 28.59 SURFACE AREA : 168 MAX DEPTH : 27.4
: 13.10
sq.km ha. m. silt Cu. in.
SHOREL I NE COTTAGES RESORTS
: 10.2 km. :39 :0
SOUTH END (AUS 23 1 29 NORTH END) HISTORICAL RECORD
05/29/87 : 6.1
06/06/87 1 7.2 06/20/87 : 6.7 06/28/87 : 5.5 07105/87 5.0
I 01112181 1 5.2 01/231 V 1 3.3
1 08/02/87 3.1 08/08/81 5.8
I 08/14/81 1 6.4
I 08/23/87 1 5.5
08/29/87 1 4.3
09/12187 1 3.0
1 09/19/87 1 3.1
09/28/81 I 3.1
1.6
0.3 I A
I A I Vi
1 04 1 1.1
A , V.
1 1.2 0.6 0.4 1.5 1.1
3.7 34 Li
MEAN 1 5.2 1.7
MAX 1 5.8 2.1 MIII 4.4 1 1.3 N 5 : 5
SD 1 0.58 1 0.36
• 49 fly 111*
3.0
N 15
3* 1.42
1.3
0.2
15
1.15
VOLUME t CROWN LAND : 82
SMRE DAlE 1 SECCHI DEPTH I CHLORIPHY!.L A
(MN/DD/YY) (METERS) (US/I) SMPLE DATE I SECCHI DEPTH I CHLOROPHYLL A
1 (YEAR) 1 (METERS) I (US/I) .
I 1917" . '
. S2 i
' 1.5
-p
:
1 1980 ' I S08 ' • 21 .
I
I
1 1981 ' i S7 . '
• 21 . ' I
: 1985" ' I 44 i ' I 1.6 1
1
I
1981 ' I
I
4,9 ,
I
13 . I
NOTE : + Based on less then 6 readings. 1+ Recreational lakes included.

CHARLESTON LAKE
Three lecatlons were sampled on eight occasions from July 12
to August 30. Water quality was generally better with greater Secchi disc visibility and lower chlorophyll concentrations at the end of the sampling period than at the beginning but the absence of a spring or fall peak in productivity cannot be confirmed.
Water clarity was higher and chlorophyll concentrations lower than those measured in the lake during 1986. The summer of 1987 was much drier than the weather experienced during the previous summer. It is believed that reduced amounts of surface runoff limited the supply of algae producing nutrients available to the lake over the growing season with a resulting improvement in water quality.
The three sampling locations, Websters Bay, Western Water and the vicinity of Goose Island all share sImilar water quality with good clarity and only moderate levels of algae. the water quality of Charleston Lake is well suited for a variety of recreational uses incLuding water oriented uses such as swimming.

LAKE : CHARLESTON LAKE ID NUMBER 12—001.7-002—01. TWP : REAR OF LEEDS & LANSDOWNE, FRONT S. REAR OF YON'3E COUNTY LEEDS
WATERSHED AREA 300. 00 SURFACE AREA 2Z17.0 MAX DEPTH '31.00
437.00
so. km ha. m. mill Cu. in.
SHORELINE COTTAGES
• OOi<m
627 ±53 HOUSES PR
NEAR GOOSE ISLAND NEAR GOOSE ISLAND
VOLUME RESORTS 7. CROWN LAND 20
I SA$ftE DATE $ECCHI DEPTh I CHLOROPHYLL A I
I (MM/DO/YY) (METERS) (US/I) SAMPtE DATE SECCHI DEPTH CHLOROPHYLL A
(YEAR) 1 (METERS) I (UG/L) — t ——————t———— —t
1 07112/87 1 3.7 4.8
1 07119/87 1 2.7 2.7
: 07126/81 2.4 3.1
08/02/87 1 4.0 2.0 08/09/97 4.6 : 1.1
: 08/16/97 4.3 1 2.9
08/23/97 1 4.3 2.5 I
I VOIOVIOI I C4 I 44 J.L I —4
: 3. 1 2.1
-
MEAN
flAX 5.2 4.8
MIN 2.4 1 1.1
N 9 : 8
SD 0.94 : 1.06
4 —
BAY
1978 3.9 2.9
1979 4.2 3.2
1980 4.2 3.4
1981 3.6 5.0
1982 ' 41 1983 ' 44 '5 1984 7.3
*1 I I
1986 1 3.5 3.9
1987 3.9 2.7 4———— 4——————— —+——————
SEAS ' 10 P flfll! I .i.7 ¶ .1.7
MAX 4,4 S.D
3.4 2.3
'I U
SD 0.24 4—— — — 4———
WEBSTERS BAY
DAMPIE DATE : SECCHI EPTH CHLOROPHYLL
It/DO/fl) US/b)
SAflPLE DATE 5ECCHI -
YEAR) '
1 2.2 • 5.2 :
I )7119/87 .J !
1 07/26/81 1 2.7 : 3.2 1
1 08/02/87 1 3.7 : 2.0 :
1 08/09/87 ; 4.0 : 1.6 :
1 08/16/87 , 3.7 2.3 :
' 08/23/87 ' 43 I
: )8/30/87 :
#—————————————+—————————_————+————————————.—+
2.2 :
r 4
4.9 5.2
TMIN 2.4
N 3 3
3D 0.32 1.32
CU
:978 2.3
t979 4.4 3.2
1980 1 4.4 3.9
1981 3.7 5.2 1982 4.4 3.3 1983 4.5 2.2
:984 .5 2.?
:985 L5 :986 3,i
:
:987 CU D.C
SEAN
MAX 4.5
3.4 2,2 11 : 11
SD 1 0.45 1 0.83

LAKE : CHARLESTON LAKE ID NUMBER : 12—0017—002—01 TWP : REAR OF LEEDS & LANSDOWNE, FRONT & REAR OF VON'3E COUNTY : LEEDS
cu. m.
NOTE : ' ased
*4 lakes inciuoed.
WATERSHED AREA : 300.00 sq.km SHORELINE : 152.00km. SURFACE AREA : 2517.0 ha. COTTAGES : 627 +63 HOUSES MAX DEPTH : 91.00 m. RESORTS : 3(40)+(227) PR VOLUME : 437.00 miii X CROWN LAND : 20
WESTERN WATER
I SAMPLE DATE I SECCHI DEPTH CHLOROPHYLL A
(MMIDD/YY) : (METERS) I V6/U
+ + + 4.
07/12/87 3.0 1 5.1
07/19/87 2.4 1 3.7 07/26/87 2.4 5.0
08/02/87 3.3 1 2.0 08/09187 4.0 1 0.8 08/16/87 4.0 1 1.8
08/23/87 5.2 2.6 08/30/87 1 4.9 2.9
+ + + +
MEAN 3.7 1 3.0 MAX 5.2 5.1
2.4 O.d
N I
I I
SD 1 1.06 1.53 + + +
HISTORICAL RECORD
+ + + +
SAMPLE DATE I SECCHI DEPTH I CHLOROPHYLL A
(YEAR) INETERSI I 1M6/L)
+ + + +
1971*' 3.2 : 3.9 1978 4.0 1 3.0 1979 4.5 4.7 IOOA I
I
1 1
1 1
1 1 1
1 1
1
1
1
4.0 1
1 5.6 Slit I Fill! h.s N ii 11
CHIPPEGO LAKE
A good sampling program was carried out with a total of 13.
samples collected from June 1 to October 25. No seasonal pattern in the results was discernable.
Water clarity was higher and chlorophyll concentrations lower than those measured in the lake during 1986. The summer of 1987 was much drier than the weather experienced during the previous summer. It is believed that reduced amounts of surface runoff liaited the supply of algae producing nutrients available to the lake over the growing season with a resulting improvement in water quality. Similarly low productivity was documented in the lake during 1983 which was
also a year with a dry period.
The results indicate Chippego Lake has good water quality for recreational use purposes including water based activities such as swimming and bathing.
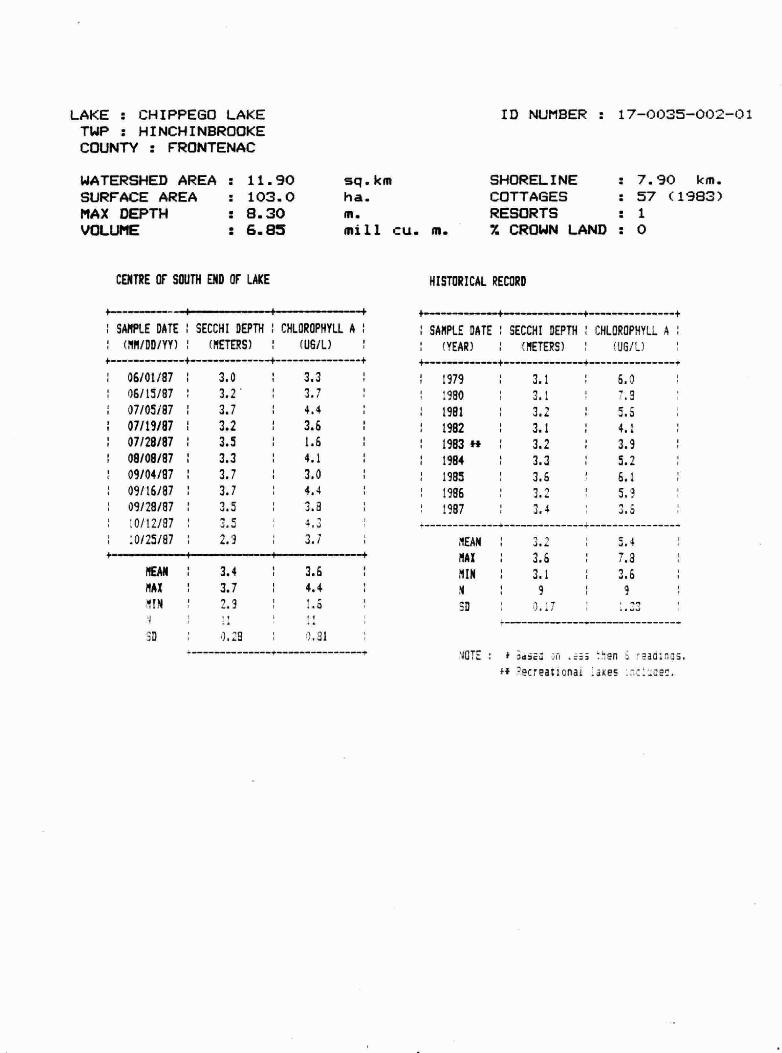
LAKE : CHIPPEGO LAKE TWP : HINCI-IINBROOKE COUNTY : FRONTENAC
CENTRE OF SOUTH END OF LAKE
ID NUMBER 17—0035—002—01
HISTORiCAL RECORD
'JOT! I +1
WATERSHED AREA : 11.90 sq.km SHORELINE : 7.90 km.
SURFACE AREA : 103.0 ha. COTTAGES : 57 (1983) MAX DEPTH : 8.30 in. RESORTS : 1
VOLUME : 6.85 miii. cu. in. X CROWN LAND : 0
SANPLE DATE SECCHI DEPTH CHLOROPHYLL A
(YEAR) (WETEPS)
t—--—. SAMPlE DATE SECCHI DEPTH CHLOROPHYLL A
(WNIDD/YY) (WETERS) (UGh) ——--+ + +
06/01/81 : 3.0 : 3.3
06/15/87 3.2 3.7
07/05/87 3.7 4.4
07/19/87 3.2 2.6 07/28/87 3.5 1.6
08/08/87 1 3.3 4.1
09/04/87 3.7 3.0
09116/87 : 3.7 4.4
09/28/87 i 3.5 3.3 I A '1/ni I —r • -. .u,ILIal
:0/25/87 2.9 3.7 I
: 1919 ; 3.1 : 6.3 ! 1980 3.1 '.2
1981 1 3.2 : 5.5
: 1982 3.1 4.1
: 1983t* : 3.2 3.9 1 1984 1 3.3 1 5.2 : 1985 1 3.6 6.1
1986 : 3.2 5.?
1987 1 3.4 • 3.
lEAN 3.2 5.4
MAX : 2.6 1 7.8
WIN ; 3.1 1 2.6 N 1 9 1 9
MEAN : 3.4 1 3.6 1
MAX 3.7 4.4 :
1

CHRISTIE LAKE
A thorough sampling program was carried out with a total of
13 samples collected from May 17 to September 27. Water
clarity was good and chlorophyll concentrations low
indicating very good water quality until the end of August.
In September extremely high chlorophyll concentrations resulted in much reduced Secchi disc visibility. This same
pattern of events was observed during 1986 and previous years
for Christie Lake. The reason for this late season peak in
productivity is not known but mey relate to phosphorus
recycling from bottom waters.
A clam mortality was reported again this year but the die off
was of shorter duration and involved fewer numbers than a
mortality that occurred in 1986.
The Christie Lake Association is a participant in the Lake
Shoreland Restoration Program. The program involves
cottagers in enhancing the lake environment by returning
disturbed areas of lakeshore to their natural condition with
cuttings of plants native to the lake.

LAKE : CHRISTIE LAKE TM' : SHERBROOKE, BATHURST COUNTV a LANARK
ID NUMBER 18—0033—015—01
WATERSHED AREA a 416 SURFACE AREA : 646 MAX DEPTH a 18.3 VOLUME : 55.17
sq. km ha. m.
mill cu. in.
SHORELINE COTTAGES RESORTS X CROWN LAND
+
1+
27.4 265
:5(20) :0
km.
I'-. 4——— -
SAMPLE DATE I SECCHI DEPTH CHLOROPHYLL A
(MM/DU/Y?) (METERS) (U6/L) t—,—.-———————+————————————+——————————————+
05117187 5.5 1.1
05124187 5.5 1.3
05131187 : 52 0.8 06113/97 49 19 06/20/87 46 13 06/28/87 46 1 07 07/04/87 46 • 20
F VT? Ill'? I 1 I
I J!IUIQI i ,J.A. I
07/19/87 4.3 2.2
37/26/87 4.2
08/29/87 3.1 6.6
09/06/87 2.7 12.0
09/27/87 2.1 22.0 4———---—————4 ——————4
4—. —4—————— ——4—— —————4
SAMPLE DATE SECCH! DEPtH CHL0ROPWYLL A
(YEAR) CUG/L)
+ +
1971 7.6 0.3
1975" 4.5 4.7 1976 4.3 4.2
1977 4.4 5.8 1 1978 1 4.8 4,2
1979 4.4 6.1
1980 4.7 5.0
1981 2.4 4,3
:982 r 4,2 2.?
4,3
1986 4.6 1
1 1987 4.4 1 4.5
1,4 :
4,5 dAY .''d -
'I 'IN :. 7
kJ 12
3D 1,38 ;.:s
¶EAN 4.7 4.4
MAX
IIN :,4
3D
?aseo :ren
.akes

CLEAR LAXE
A good sampling program was carried out with a total of nine
samples collected from June 27 to August 30. Chlorophyll
concentrations increased and water clarity declined as the
suaer progressed but other seasonal variations in
productivity cannot be confirmed without of spring and fall
results.
Although the absence of a spring or fall peak in lake
productivity cannot be confirmed, the data collected indicate
Clear Lake has very good water clarity and very low
chlorophyll concentrations. Althouqh the amount of algae in
the water in Clear Lake is very low, cottagers have observed
increasing amounts of algae attached to rocks and other
substrates on the lake bottom.

LAKE : CLEAR, LAKE TUP : SEBASTOPOL COUNTY : RENFREW
ID NUMBER 1B—3€90—O01—O1
4
44
Based ?S! ".?fl :akes
WATERSHED AREA : 94.32 sq.km SHORELINg : 31.5 km.
SURFACE AREA : 1730 ha. COTTAGES : 242 MAX DEPTH : 42.7 in. RESORTS : 2 (161) VOLUME : 193.04 mill cu. in. Z CROWN LAND : 0
4— — - .4.
SAMPLE DATE I SECCHI DEPTH CHLOROPHYLL A
(MM/DD/YY) (NETERS) (U6/L)
#————————————+————————————4——————————————+
06127/87 6.1 1 0.7 07/05/81 6.6 1.5
07/11/87 5.0 0.9
07/23/87 3.3 0.8
08/02/87 1 3.7 2.1
1 08/09/81 3.0 1.1
08/16/81 2.9 2.1
1 08/22/87 2.8 2.2
08/20/87 3.7 2.6 .————__——————.I.—————————————1 ———————-.
4
SAMPLE DATE SECCHI DEPTH CHLOROPHYLL A
(YEAR) I METERS) (US/U 4— —4. + +
1916" 4.7 2.7 :977n 3.7 2.9
1978'+ 1 3.8 3.4
1979 4.1 2.5
1980 4.2 3.6 I 1001 I I
I L.h
1983" 3.4 2.9
1987 4.1 1.6 £ S S S
MEAN ' I 41 ' I 16 ' I
MAX ' I 66 I 26 . ' I
MIN ' I 28 . ' 07 . ' ,
M ' I 9 ' 9 ' I
20 1.43 ),71
lEAN
MAX 4.7
MIN 3.0 N 1 8
3.6
1.5

CROSBY (BIG CROSBY) LAKE
A total of 12 samples collected from May 24 to November 11, enco.passing practically the entire growing season, provided good seasonal coverage of water quality conditions in Crosby Lake. Chlorophyll concentrations increased while wate± clarity declined as the summer progressed. this pattern of seasonally increasing productivity as the summer progresses was evident In Crosby Lake during 1986 as well, and is a
characteristic of other lakes enrolled in the Self Help Program including nearby Pike and Black Lakes. Nevertheless, Crosby Lake has very good water clarity. Chlorophyll concentrations were never of a magnitude to interfere with recreational use of the lake at any time during the year.
Water clarity was higher and chlorophyll concentrations lower than those measured In the lake during 1986. The summer of 1987 was much drier than the weather experienced during the previous summer. It is believed that reduced amounts of surface runoff limited the supply of algae producing nutrients available to the lake over the growing season with a resulting improvement in water quality. Similarly low productivity was documented in the lake during 1983 which was
another year with a dry summer period.

LAKE : CROSBY (BIG CROSBY) LAKE TWP : NORTH CROSBY COUNTY : LEEDS
WATERSHED AREA 26.60 SURFACE AREA : 263.0 MAX DEPTH : 19.00 VOLUME : 21.68
CENTRE OF LAKE
1D NUMBER : 18—0033—016—01
sq.km SHORELINE ha. m. mill cu. in.
HISTORICAL RECORD
SAMPlE DATE I SECCHI DEPTH CHLOROPHYLL A
(MN/DDIYY) (METERS) W6/L) I SAMPLE DATE SECCHI DEPTH CHLOROPHYLL A
(YEAR) (METERS) I ('JG/L)
+ 3as90 1255
+*
17.70 km. COTTAGES : 158 (1974) RESORTS : 0 t CROWN LAND : 0
1 05/24/97 ; 55 , O9 . t i 1974*' 1 3.7 5.0
1 06/07/87 ; 4.3 ' r O7 . , I
i j97514 4.1 5.4 1 06/21187; 4.3 I 17 .
'
I
• 1979* 1 3.4 7.1 : 06/28/87; 4.0 '
' ' 1 . ' ' ' . 1980 1 4.0 ; 3.9 1 07/05/87 : 4.9 ' I 2.8 ' I ' 1981 1 4.4 ; 2.8
1 07/19/871 4.0 ' I 10 I ' I ' , 1982 1 4.2 1 3.z 1 08/03/87 1 4.0 1 2.0 '
' . • 1983 ; 4.0 I
: 08/16/87 1 3.8 : 4.4 1 1984 4.5 I
:08/30/871 3.8 ' ' 65 I ' I ' , '985 ' ' ..J ' a...
: 09/07/87 ; 4•3 :
4.3 1 :986 2.5 ' .3
: 09/27/97 1 4.0 ' , :
1 1987 C 1 2.3 1 11/10/87 1 3.9 : 1.7 ' I —————4——————
MEAN; 4.2
MAX : 5.5 IIN 2.2
12
'30
2.8 5.5
In
MEAN : 4.0 : 4.5
WIN 2.4 '4
3D 1.36
1 4.2 7.1

CROW LIME
A comprehensive sampling effort was carried out with a total of fourteen samples from May 31 to September 2. This program provided good seasonal coverage of water quality conditions In Crow Lake.
Secchi disc visibility was less and chlorophyll concentrations higher for the initial three sampling dates than they were for the rest of the sampling period but otherwise no seasonal pattern was discernable. The results indicate Crow Lake has very good water quality well suited for all forms of water based recreation including swimming.
Water clarity was higher and chlorophyll concentrations lower than those measured In the lake during 1986. The summer of 1987 was much drier than the weather experienced during the previous summer. It Is believed that reduced amounts of surface runoff limited the supply of algae producing nutrients available to the lake over the growing season with
resulting improvement in water quality.

LAKE : CROW LAKE TWP : 050, BEDFORD COUNTV : FRONTENAC
WATERSHED AREA : 49 SURFACE AREA 436
ID NUMBER : 18—0033—017—c)1
:17 km. 95 (1372) 7 (53)
05/31/87 3.2 06/07/81 1 3.4 06/14/87 3.7 06/21/81 5.5 07105/87 5 5
011(2/87 : 4.0 07120/87 5.2 07t28/87 6.1 09105187 5.2 09/12187 6.1
09/23/87 5.2 09/01/87 1 5.5 09113/87 1 6.1
09/27/81 5.2
4.1
3.4 I 2.6
1.4 2.3
1 1.5
1.6 17
' I I 5. I 08
an 1 1.5
2.9
1.6
MEAN 4.9
5.9
MIN 4.! 9
SD 0.62
lEAN 5,0
14
SD 1.00 1 1.02
NOTE 3ased tess then
+4
MAX DEPTH VOLUME
: 38 63.38
sq.km ha. m. mill cii. in.
SHORELINE COTTAGES RESORTS X CROWN LAND : 5
SAMPLE DATE SECCHI DEPTH CHLOROPHYLL A
(MK/DD/YY) 1 (METERS) (LJ6/L)
SAMPLE DATE I SECCH! DEPTH CHLOROPHYLL A
(YEAR) 1 (METERS) (U6/L)
: 1972" : 4.4 1 3.8
t 1
1 1975" : 5.7 1 4.7 1
I
1 1
1 41 ' 52 : 1981" ' 42 : 25 '
' I 17U5 I
I
I I
1986 1 4.7 1 2.6 1
: 1987 1 5.0 S_____________S____________4.______
2.)
MIN 3.2 0.2
5.2 1 2.0
1.07

CROWE LAKE
Seven samples collected from July 5 to September 13. Although the presence or absence of a spring peak in productivity cannot be confirmed without results for the months of May and June, the data indicate Crowe Lake has very low levels of algae with satisfactory water quality for all forms of water based recreatlonai activity. An apparent decline in water clarity from 1977 to 1978 occurred when sampling changed hands and is probably a result of subjective differences between individuals in interpreting Secchi disc visibi].lty.
Water clarity was higher and chlorophyll concentrations lower than those measured in the lake during 1986. The summer of 1987 was much drier than the weather experienced during the previous summer. It is believed that reduced amounts of surface runoff limited the supply of algae producing nutrients available to the lake over the growing season with a resulting improvement in water 'quality, Similarly low productivity was documented in Crowe Lake during 1983 which was also a year with a dry summer period.

LAKE : CROWE LAKE TWP MARMORA COUNTY HASTINGS
ID NUMBER 17—0021—003—01
WATERSHED AREA SURFACE AREA MAX DEPTh VOLUME
1444.00 : 876.0
15.80 : 49.38
SHORELINE COTTAGES RESORTS X CROWN LAND
21.00 km. 328 6
:0
NOTE : Based on less then 6 readings. '4 Recreational lakes included.
sq. km ha. m.
mill cu. m.
REGULAR LOCATiON HISTORICAL RECORD
-4 —________
I SAMPLE DATE SECCHI DEPTH I CHLOROPHYLL A
(MM/DO/fl) (METERS) (IJS/L)
+ ————+ + +
07/05/87 1 2.9 1.5
1 07/19/87 1 2.4 2.3 1 07/26/87 1 2.7 1.6 1
08/03/81 2.7 1.2 1 08/16/87 2.4 2.0
08/30/87 2.6 1 3.3
09/13/87 1 2.4 1.2 4— —4——————— 4———— — —4
SAMPLE DATE SECCHI DEPTH I CHLOROPHYLL A I
(YEAR) (ME7223) W6/L) —+—— +
1 (972" 3.8 1 2.5 1974 4.7 1
1975* 4.7 1 4.1 1
1976 4.7 5.0 1 1977' 3.9 1 4.5
1978 1 2.4 3.2 1
1979 2.5 5.0 1980 3.0 5.0
1981 2.3 3.0 1992 2.2 2.4
1293 2.? 2.; 1 1984' 1 2.7 4.8 1 1985 1 2.5
1986 2.4 3.5 1 1987 2.6 1.3
MEAN '6 ! t9
:
MAX 2.9 3.2 1
: 2.4
N 1 7 1 7 1
SD 1 0.20 0.75 1
I IN
3D
2.4

DALHOIJSIE LAKE
Eight samples collected from July 22 to September 7. Although the presence or absence of a spring peak in lake productivity cannot be confirmed without samples for the months of May and June, the results indicate Dalhousie Lake has good water clarity and low levels of algae.
Water clarity was higher and chlorophyll concentrations lower than those measured in the lake during 1986. The summer of 1987 was much drier than the weather experienced during the previous summer. It is believed that reduced amounts of surface runoff limited the supply of algae producing nutrients available to the lake over the growing season with a resulting improvement in water quality. Similarly low productivity was documented in Dalhousie during 1983 which was also a year with a dry summer period.

LAKE : DALHOUSIE LAKE fliP : DALHOUSIE COUNTY : LANARK
WATERSHED AREA : 1288.00 sq.km SURFACE AREA : 591.0 ha. MAX DEPTH : 13.41 m.
43.22
ID NUMBER : 18—3430—009—01
BROWN'S BAY VARIOUS OPEN WATER LOCATIONS
SAflPU DATE : SECCHI DEPTH 1 CHlOROPHYLL A I
I INIDD/YY) 1 METERS) (US/U I SANPtI DATE SECCHI DEPTH I CHLOROPHYLL A
(YEAR) METERS) I (US/U
2.7 1.6 N I B 1 8
SD 1 0.43 1 0.89
NOTE + 3asS :.n .ass flen
ft jaKes
VOLUME
SHORELINE COTTAGES
mill cu. in.
13.50 kin.
: 184 + 8 HOUSES RESORTS : 4 (73) t CROWN LAND : 0
: 07/fl/87 : 3.7 1 3.6 1 1975" : 3.6 1 5.1
1 07/28/87 4.0 1 2.5 1 1976 1 3.9 1 3.4
1 08/04/87 3.7 1 1.6 : 1977 : 4.1 2.4 1 08/10/87 3.7 1 1.7 1 1978 4.6 1 2.1 1 08/17/87 : 3.3 1 2.5 1
1 1979 1 3.5 1 3.0 1 08/26/87 3.0 1 3.3 1 : 1980" 1 4.4 : 3.6
08/31/87 1 2.7 3.4 : : 1981 1 5.1 2.0 1 09/07/87 1 3.4
————
MEAN 3.4
4.0
2.8
: 1982
1983' 1986
1
1
1
4.6
2.8
:
:
2.7 1.2 2.2 1
4.0 1 4.3 ; :sv : ; 2.3
MEAN 4.1
MAX 1 51 MIM 2.3 'I I
3D
29 51 t I

DAVERN LAKE
A total of eleven samples collected from Nay 26 to September 18 provided good seasonal coveraqe of water quality conditions in Davern [.ake. A singularly high chlorophyll concentration of 5.1 ugh was recorded for the first sample collected but there was no seasonal pattern discernable in water quality.
The results indicate Davern Lake has excellent water quality with low very levels of algae present in the lake.
No change in water quality was observed compared to 1986 results. Most other lakes experienced less productivity during 1987.
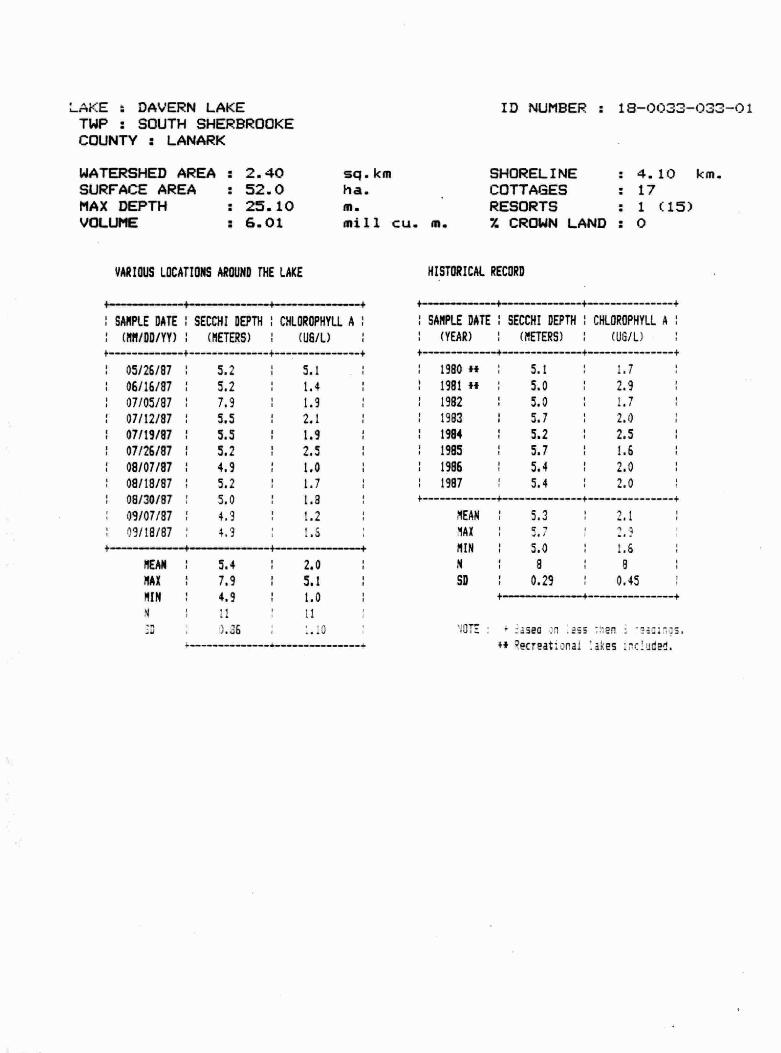
LAKE DAVERN LAKE TWP : SOUTH SHERBROOKE COUNTY : LANARK
ID NUMBER : 18—0033-033—01
WATERSHED AREA SURFACE AREA MAX DEPTH VOLUME
SI-f OREL I NE COTTAGES RESORTS X CROWN LAND
4.10 km. 17 1 (15) :0
2.40 52.0 25.10
sq. km ha. m.
6.01 miii Cu. m.
VARIOUS LOCATIONS AROUND THE LAKE HISTORICAL RECORD
SAMPLE DATE SECCHI DEPTH CHLOROPHYLL A I
(MM/DO/fl) (METERS) I (US/U 4 ——————4. — + — +
05126/87 5.2 5.1
06/16/87 5.2 : 1.4
07/05/87 7.9 : 1.9
07/12/87 5.5 2.1
07119/01 5.5 1.9
01/26/81 5.2 1 2.5 1
1 08/07/87 1 4.9 1 1.0 1 08/18/87 5.2 1.7
08/30/87 5.0 1.8
09/07/87 4.9 1 1.2
09/18/87 1.6 4— —— —4
4——— ————#—————————————-+—— +
SAMPLE DATE I DEPTH 1 CHLOROPHYLL A
(YEAR) (METERS) I UG/U —4——— + +
1980*' : 5.1 1.7
1981*' 5.0 2.9 1 1982 5.0 : 1.7
1 1983 5.7 2.0 1 1984 5.2 1 2.5 1 1985 5.7 1 1.6
1986 1 5.4 2.0 1987 5.4 2.0
MEAN
MAX
MEN
'4
-w
5.4 1 2.0 7.9 1 5.1
4.9
).36
10 11
WEAN 5.2 : 2.1 1
WAX ; 3.7 1 2.3 '
MIN 1 5.0 1 1.6 1
W I I I
I I
0 'J
I I
SD : 0.29 1 0.45 1
- 5isea

DEMPSEYS (VIRGIN) LAKE
Once monthly sampling from April to September provided good seasonal coverage but more frequent sampling would have provided a better picture of water quality conditions. The results indicate Dempseys Lake has very good water clarity with very low levels of algae present in the water.
Chlorophyll concentrations were lower than those recorded in previous years but there was no corresponding increase in water clarity. The summer of 1987 was much drier than the weather experienced during the previous summer. It is believed that reduced amounts of surface runoff limited the supply of algae producing nutrients available to the lake over the growing season with a resulting improvement in water quality. Similarly low productivity was documented in Dempseys Lake during 1983 which was also a year with a dry summer period.

LAKE : DEMPSEYS (VIRGIN) LAKE TWP : BAGOT, BLYTHFIELD COUNTY : RENFREW
WATERSHED AREA : 13.80 SURFACE AREA 46.0 MAX DEPTH :
VOLUME
MIDWAY BENEE1I POINT AND ISUND
ID NUMBER : 18—3490—014—01
SHORELINE COTTAGES RESORTS X CROWN LAND : 35
HISTORICAL RECORD
sq. km ha. m. mill cu. m.
km.
SAMPLE DATE SECCHI DEPTH CHLOROPHYLL A
(Mfl/DD/fl) : (METERS) I (U6/L)
t————————————,————————
04/26/87 1 4.1 1 0.5
——————7
: 05/19/87 1 4.6 : 1.5 1
: 06/23/87 1 5.3 1.6
: 07/28/87 1 4.7 : 3.9
: 08/25/87 1 5.0 : 3.9 1
1 09/28/87
4— - 1 4.8 1 1.4 1
SAMPLE DATE I SECCH1 DEPTH CHLOROPHYLL A
(YEAR) I (METERS) (UG/L)
+————————————#—————————————+ +
1980 4.2 3.6
1982 5.5 1.3
1983 5.7 2.3
1984 5.0 3.6
1985 5.3 2.5
1986 5.5 2.5
1987 1 4.8 2.1
4.——
MAX 1 5.3 3.9 MEA?é 1 5.1
MIN 0.5 MX 1 5.7
: 4.
SD 1 0.41 1.42 N 1 7 7
SD 1 0.52 0.74

DESERT LAKE
A total of 12 samples collected from each of South Bay and Deyos Bay from June 7 to September to October 4 provided good seasonal coverage of water quality conditions in Desert Lake.
Secchi disc visibility recorded for Deyos Bay was greater than that recorded for South Bay. The chlorophyll concentrations, however, are comparable indicating that there was no significant difference in water quality between the two locations. The apparent discrepancy in water clarity is likely a result of a subjective difference between individuals in reading the Secchi disc visibility depth.
The results indicate Desert Lake has very good water quality with no evidence of any deterioration over the period of record.
Water clarity was higher and chlorophyll concentrations lower than those measured in the lake durinq 1986. The summer of 1987 was much drier than the weather experienced during the previous summer. It is believed that reduced amounts of surface runoff limited the supply of algae producing nutrients available to the lake over the growing season with a resulting improvement in water quality. Similarly low productivity was documented in Desert Lake during 1983 which was also •a year with a dry 3'xmmer period.

LAKE : DESERT LAKE TWP : BEDFORD, LQUGHBOROUGH COUNTY FRONTENAC
ID NUMBER : 12—0004—009—01
WATERSHED AREA : 97.00 SURFACE AREA : 382.0
SHOREL INE COTTAGES RESORTS
28.00 km. 71 (1976) 3 (95)
SAMPLE DATE 1 SECCHI DEPTH I CHLOROPHYLL A I
I (MM/DD/YY) I (METERS) I (US/U
SAMPLE DATE SECCHI DEPTH I CHLOROPHYLL A
(NM/DD/YY) 1 (METERS) (U8/L)
+ +
MEAN 4.,3 SAY I .5
I I
MIN 4.4 2.0 N 12 12
SD 0.46 1 0.57 + .4.
NOTE * Based on less then 6 readtnqs.
MAX DEPTH VOLUME
DEVOS BAY
68.00 85.50
sq. km ha.
rn.
SOUTH BAY
% CROWN LAND : 0
1 06/07/87 1 3.9 1 3.3 1 1 06/07187 1 3.4 4.0
1 06/13/87 4.3 1 3.3 1 1 06/24/97 : 3.7 2.4
1 06/21/87 : 4.0 1 1.8 1 1 07/01/87 1 4.4 : :.4 1 07/05/87 4.9 : 2.1 : 1 07/08/87 : 4.5 1 2.! : 07/12/87 1 5.5 1.9 1 1 07/15/87 : 4.0 1 3.0
: 08/09/87 1 43 32 : : 07/29187 40 1 1.9
08/16/87 1 4.6 2.2 1 08/05187 1 4.1 1.5
1 08/23/87 1 5.2 : 3.2 1 1 08/13/87 1 4.2 2.5
1 08/30/87 1 5.2 1 2.8 : 08/18/87 : 4.1 2.8
09/13/87 1 5.4 1 2.5 1 08/27/87 1 4.1 : 3.2
1 09/21/87 1 5.5 1 3.0 1 09/09/97 1 4.1 2.4
1 10/04/87 5.8 1 2.9 1 : 09/15/87 1 4.2 2.7
MEAN 4.9 2.7 :
SAY IIfl& I
P J.U I
f
: 3.9 1 1.8 1
N : 12 1 12 1
SD : 0.65 1 0.56 :
F
MEAN 1 4.1 2.5
lAX 1 4.6 H C NIN 3.4 1.4
N : 12 : 12
SD
.'AP10118
1 0.31 1 0.73 +
:p..4ppj5 :PEN
SAMPLE DATE SECCHI :5P14 :YLOFjPU?LL
?E,4R) 'UG/L
rn •+ !. :.
1977 4.9 1 2.5
1978 : 5.5 2.5 1 1979 : 4.5 1 3.0
: 1980 : 4.6 3.4
1 1981 1 4.5 1 3.4
: 1982 4.9 : 2.) : 1983 : 5.2 2.
1984 : 5.0 3.3
1995 4,1 ! C 1 :985 C 1 1987 4.5 :

DEVIL (1AKE
Six samples collected from mid June to the end of September from each of Buce Bay and Hays Bay provided good seasonal coverage but sore frequent sampling would provide a better picture of water quality conditions. As in previous years chlorophyll concentrations were higher during the latter part of the season than during the earlier part.
The results from both locations indicate Devil Lake has excellent water clarity with very low levels of algae present in the water.
Devil Lake is relatively uninfluenced by local runoff as water clarity did not deteriorate during the extremely wet summer experienced in 1986 or improve during the drier weather experienced in 1987 as happened in other nearby smaller lakes.

LAKE : DEVIL LAKE TWP : BEDFORD COUNTY : FRONTENAC
ID NUMBER : 12—0004—010—01
WATERSHED AREA : 174.00 SURFACE AREA : 1061.0 MAX DEPTH VOLUME
8UCE BAY
sq.km ha. m.
mill cu. m.
SHORELINE COTTAGES RESORTS % CROWN LAND
36.20 km. : 220 + 3 HOUSES : 4 (51) :20
NOTE
4*
Based ore less Then 6 TEadiJigs.
RecreationaL lakes included.
45.00 152.39
HAYS BAY
I
I I
(METERS)
CHLOROPHYU.
(1J6/L)
A
(
4 4 — .—+ . -—4 1 06/15/87 1 4.6 : 1.9 1
: 07/07/87 5.3 ; 1.2 1
; 07/19/97 1 5.2 : 1.3 1
i 08/03/87 • 4.9 : :
; 08/30/87 4.7 : 2.9 1
t 09/27/97 1
+—
5.1 : 3.4 1
MEAN ' I 5O . ' I 23 . ' I
MAX ' I 53 . I I 34 . I
MEN ' I 46 . ' I 12 . ' 1
M l I 6 ' I 6 ' I
SD ' I 0.28 0.94 1
SAMPLE DATE I SECCHI DEPTH CHLOROPHYLL A
1 (METERS) (U6/L)
4—--—-----—-1—-—————-—————#———--————---+
06/15/87 4.5 2.1
07/07/87 : 5.0 : 1.3
07/19/87 1 5.0 1.7
08/03/87 1 4.6 1 3.1
08/30/87 47 ' 28 09/27/87 5.:
4- --4.- ——————t-
MEAN: 4.8 1 2.3
MAX 5.1 1 3.1
MIN ' 45 I 13 N
' 6 ' 6
SD ' 025 ' 075 4 +
/ARIOUS OPEN LOCATIONS
+——————————+———
SAMPLE DATE SECCHI DEPTH CHLOROPHYLL A
1 (YEAR) (U6/L)
— ——s————————————
H :975 n ;.: 2.2
I 1
I 977
:978 2.2 I
1980t 4.6 17 I 5.3 3.4
1982 1 5.7 1 2.7
1983 -: 5.7 : 2.2 In I 1'l I
*3 ' .J.L ' I
1995 '
loot £JLJU 41..
1987 4.3 2.2 + +——————
MEAN
!AX : 2.-
4.5 ! 2.2
N 4 4
SD 0.45

DIAMOND LAKE
A total of nine samples collected between the middle of June and the beginning of October provided good seasonal coverage of water quality conditions in Diamond Lake. Chlorophyll concentrations were slightly higher at the Last two sampling visits than they were previously during the season but no clear cut seasonal pattern was discernable.
The results indicate Diamond Lake has very good water clarity with very low Levels of algae present in the water.
Although Secchi disc visibility was not improved over that of 1986 chlorophyll concentrations were lower. The summer of 1987 was much drier than the weather experienced during the previous summer. It is believed that reduced amounts of surface runoff limited the supply of algae producing nutrients available to the lake over the growing season with a resulting improvement in water quality. Similarly low productivity was documented in Diamond Lake during 1983 which was also a year with a dry summer period.

LAKE : DIAMOND LAKE fliP : HERSHEL COUNTY : HASTINGS
ID NUMBER : 18—3490—015—01
WATERSHED AREA : 32.70 SURFACE AREA : 150.0
sq. km ha. m.
mill. cu0 m.
SHORELINE COTTAGES
: 10.00 km. : 65 + 16 HOUSES
ACROSS FRON CLIFFS AT 15 N DEPTH HISTORICAL RECORD
MUTE Based on less then 6 readings. *1 RecTeationai lakes included.
MAX DEPTh VOLUME
23.80 12.48.
RESORTS : 1 (6) 1 CROWN LAND : 60
SANPU DATE 2 SECCHI DEPTH I CHLOROPHYLL #: CNN/DD/fl) I (METERS) 1 (116/1)
I SAMPLE DATE I SECCH1 DEPTH I CHLOROPHYLL A
(YEAR) 1 NETERS) I (US/Li t— 1— - p
1 06/13/87 2 4.9 1 1.6 :
1 07/16/87 1 1 0.9 1
1 07/21/87 1 4.9 1 2.7 2
1 07/25/87 1 4.9 1 1.4 1
1 08/03/87 1 4.9 1 1.4 1
1 08/18/87 1 4.9 1 1.5 1
1 08/29/87 1 5.2 1 1.5 1
1 *9/27/87 1 4.9 1 2.1 1
1 10/03/87 1 4.6 1 2.7 :
I 1977" 1 51.4 . . 17 . .
1 1978 ' I 5.I ! I 1.5 I
1 1979k 1 4.9 ' 1 2.0 .
1 1980 • 1 42 . • I 2.0 '
I I I
1 I
1 1 5.9 ' , t5 .
' ,
1 29841+ 1 5.1 ' , 2.1 ,
,
: 2985" 1 5.5 • I 25 , I
1 2986 '
. 5L , ' . 24 , '
: 2987 • I 49 . , I 25 ' ' MEAN 1 4.9 1.5
MAX 5.2 2.7
MIW 1 44 0.9 N a 1 9
SD 1 0.16 1 0.51
NEAIt ' , 52 . ' I 19 t ' I
MAX , , 59 . ' I 25 . ' I
"IN , I 43 . ' I 15 . ' I
K , , U ' I 11 ' I
SD 0.41 ).26
DICKEY LAKE
A total of 14 samples collected from each of the north and south basins between April 20 and September 7 provided
excellent seasonal coverage of water quality conditions in
Dickey Lake. Analysis of the two samples collected in April
was considerably delayed beyond the date of sampling and
degradation of the chlorophyll pigment may have occurred. Therefore the extremely low results recorded should be viewed
with some caution.
As in previous years the deeper south basin was less productive than the smaller north basin of Dickey Lake. The
results for both basins indicate Dickey Lake has good water
clarity with very little algae present in its water.
Water clarity was higher and chlorophyll concentrations lower than those measured in the lake during 1986. The summer of
1987 was much drier than the weather experienced during the previous summer. It is believed that reduced amounts of
surface runoff limited the supply of algae producing nutrients available to the lake over the growing season with a resulting improvement in water quality. Similarly low productivity was documented in Dickey Lake during 1983 which was also a year with a dry summer period.

LAKE : DICKEY LAKE : NORTH BASIN TWP : LAKE COUNTY : HASTINGS
ID NUMBER 17—0021—004—01
WATERSHED AREA : 49.00 SURFACE AREA : 54.0
12.20 : 9.69
SHOREL I NE COTTAGES RESORTS X CROWN LAND :
4.59 km. 73
NORTH BASIN HISTORICAL RECORD
lAX U
MAX DEPTH VOLUME
sq. km ha.
mill cu. m. 0 0
SAMPLE DATE SECCHE DEPTH CHLOROPHYLL A
(MM/DD/fl) (METERS) (UG/L)
+ +—————— + +
04120/87 3.3 0.2 04/26/87 3.4 0.8
05/18/87 2.9 2.5
06115/87 3.2 2.4 07/06/87 1 3.4 2.1
07/13/87 1 44 22 07120/87 37 26 07/27/87 ' 39 11 08/03/87 4.2 2.4 ')9110187 4,6 L 5
4.2
08/27/87 4.2 : 2.3
09/01/87 4.0 1.4
09/07/87 4.6 2.2
+————————. t ———————————+ +
SAMPLE DATE SECCHI DEPTH CHLOROPHYLL A
(YEAR) 1 (METERS) (US/I) +———— 4——— +
1971' 44 15
I I
r . ...L 1976'* 5.0 : 1.7
1980" 45 20 1981 5.2 2.0 1982 4.6 1.8
1983 4" 1
17 1984* 43
1986 La 1987 39 20
4————————————4—————— —-.4 4
'tAN
IA! :1 IN
'0 4.6
2.3
:4
lEAN 44 I 13
,' 3
j . fl
. :. •
:: + 3asec
:i+Bs :ncL..Ga.

LAKE : DICKEY LAKE SOUTH BASIN TWP : LAKE COUNTY : HASTINGS
ID NUMBER : 17—0021—005—01
WATERSHED AREA : 5.46 SURFACE AREA : 149.0 MAX DEPTH : 46.30 VOLUME : 26.74
sq. km ha. m.
mill cu. in.
SHORELINE : 12.55 km. COTTAGES 24 RESORTS : 0 X CROWN LAND : 0
SOUTH BASIN HISTOIICk
I SAMPLE DATE SECCHI DEPTH CHLOROPHYLL A
(MMIOD/YY) (METERS) : (US/I) + + + +
04/20/87 3.6 0.6 04/26/87 3.8 0.6
05/18/87 1 3.7 : 2.3 06115/87 3.4 1.8
07/06/87 4.3 1 1.9 07/13/87 1 4.3 : 2.8
07/20/87 : 3.6 1.5
07/27/87 1 4.5 1.8
08/03/871 45 1 1/ 08/10/V 4.2 1.1
08/17/87 4.6 1 1.7
08/27/87 5.3 1 2.7 09/01/87 1 50 1 24 09/07/87 5.3 1 2.2
+ — —+
lEAK 1 1.3 2.8
MAX 5.3 1 2.3 MIN 1 3.4 0.6 N 14 1 14
90 1 0.62 1 0.68 f + +
SAMPLE DATE I SECCHI DEPTH I CHLOROPHYLL A 1
(YEAR) (METERS) I (U6/L)
+ 4. + +
1971' 4.1 2.2 1972 : 4.5 2.0 1973 : 4.8 1 1.7
1976*' 1 5.2 1980 1 5.1 1 2.0 1981 1 5.4 1 LB 1982 1 5.2 1.8
1983 4.5 1.2 1984 1 5.0 2.9 1985 4.6
1986 4.2 2.1
1987 1 4.3 1 1.8 + 4.— + +11
MEAN : 4.7 1.9
MAX 5.4 2,9
N I' SD tj,+4
NOTE : * Based tess then 6 reaaings. ec;eaL:unas

DOG LAKE
Insufficient sampling was carried out during 1987 to reach any definite conclusions about Dog Lake or make comparisons with other years. A minimum of six sets of measurements are necessary to adequately characterize water quality of a lake. Preferably 12 or more measurements evenly timed throughout the ice free season of the year from May to October should be taken to define any seasonal trends in water quality if they are present
Previous data indicate high chlorophyll concentrations in some years result in poor water clarity in Dog Lake

LAKE : DOG LAKE : NORTH BASIN TWP : STORRINGTON COUNTY : FRONTENAC
ID NUMBER : 12—0004—011—01
• 2S • 13.0
1 9 ' 14.1 • . U
12 ' • , 34.2 • 24 ' 3.6 I * U
21 ' 17.9
26 ' 8.5 U .
WATERSHED AREA : 62.00 sq.km SHORELINE : 23.00 km. SURFACE AREA z 471.0 ha. COTTASES : 105 MAX DEPTH x 49.70 in. SURTS $ 2 (fl).. YOLLNE i 39.90 Mu as. a. X CROWN LAND : 0
NEAR ST.HELEIA iSLAND
t I SAIIPLE DATE I SECCNI DEPTH : A
I (NM/DO/fl) I (METERS) I (US/I) I
4— 4— —4————— +
1 06110/87 1 3.0 1 1.4
06/17/87 I 3.0 1 5.5 1 06/24/81 1 2.7 1 8.2 1 08112/87 1 1.8 1 19.0
NORTH BASIN HISTORICAL RECORD
+ + + +
I SAMPLE DATE I SUCH! DEPTH I CHLOROPHYLl A
(YEAR) I (PETERS) I (US/I)
1975 *1
1979
1 1980
1 1983
1 1984 +4
.1 1987+ NEAN 1 2.6 1 8.5 MAX 1 3.0 1 19.0
MIN 1 1.8 1 1.4
N 1 4 1 4
SD 1 0.57 1 7.52 I * +
+ + +
MEAN 1 2.2 1 16.1
MAX 1 2.8 34.2
MIN 1 1.2 1 8.5 I
N ' I I
I U I
SD 0.58 1 9.58 + + +
NOTE Based on less then 6 readAngs.
+1 Recreational lakes included.
EAGLE LAKE
A combined total of 23 samples collected by two volunteers from Nay 24 to October 12 provided excellent seasonal coverage of water quality conditions in Eagle Lake. Chlorophyll concentrations were higher during the spring and fall than they were during the suer.
The results indicate Eagle Lake has excellent water clarity with very little algae in its water.
Eagle [sake is relatively uninfluenced by local runoff as water clarity did not deteriorate much during the extremely wet summer experienced in 1986 or improve during the drier weather experienced in 1987 as happened in other nearby smaller lakes.

LAKE : EAGLE LAKE TWP OLDEN, HINCHINBROOKE COUNTY : FRONTENAC
WATERSHED AREA 40.10 sq.km SURFACE AREA .s 665.0 MAX DEPTH : 31.10
: 67.20
NORTH SIDE OF OPEON6O POINT
ID NUMBER : 18-0033—019—01
$ 41.40 km. COTTAGES : 135 + 1 HOUSE RESORTS t 2 % CROWN LAND : 5
NORTH END OF LAKE
I SAMPLE DATE I SECCHI DEPTH I CILDIOPHYLL A I
I (MN/DD/YY) I (METERS) I (116/LI I
SAMPLE DATE SECCHI DEPTH CHLOROPHYLL A
(MM/DDIYY) (METERS) I (06/U
3.I I I
6.4
VOLUME
kit. m. mill cii. m.
1 05/24/87 1 4.7 1 6.4 1 1 06/23/87 1 6.4 I 1.0
1 06/08/07 1 5.0 1 4.2 1 1 07/06/87 5.2 1 1.5
1 06/14/87 1 5.0 1 1.1 1 1 07119/87 1 4.7 1 2.0
1 06/21/87 1 6.2 1 1.1 1 1 07/24/87 1 6.1 1 3.2 1 07/14/87 5.9 1 2.6 1 1 07/31/87 1 5.2 1 4.7
1 07/26/87 5.0 1 2.0 1 1 08/05187 1 4.9 1 1.5 1 08/03/87 ; 5.3 1 2.4 1 1 08/15/87 1 5.8 1 2.1
1 08116/81 : 5.3 1 1.8 1 1 08/21/87 1 5.5 : 3.2 I 08/30/87 1 5.0 1 2.6 1 : 08/31/87 1 4.7 1 2.4
1 09/14/87 1 5.2 1 3.5 : 1 09/05/87 1 5.6 1 4.3
1 09/27/87 : 5.1 1 4.1 1 1 09/10/87 1 6.4 1 4.2
I 10/12/87 1 5.1 1 4.2 1 t + + +
MEAN 1 5.2 MAX 6.2 MIN 4.7
N 1 12
1 1.1
12
SD 1 0.42 1 1.49 t + 4
MEAN 1 5.5 1 2.7
MAX 1 6.4 1 4.7 MIN 1 4.7 1 1.0
N I ii 1 11
SD 1 0.62 1 1.27

LAKE : EAGLE LAKE ID NUMBER : 18—0033-019-01 TWP s OLDEN, HINCHIMBROOKE COUNTY : FRONTENAC
WATERSHED AREA : 40.10 sq.km SHORELINE : 41.40 km. SURFACE AREA : 665.0 ha. COTTAGES : 135 + 1 HOUSE MAX DEPTH i 31. 10 rn RESORTS z 2 VOLUME : 67.20 miii cu a. X CRO*1 LAND : 5
HISTORICAL RECORD
4——-———. + + +
SAMPLE DATE : SECCHI DEPTH CILOROPHYLL A
(YEAR) : (METERS) 1 (06/1) t t t
1 1975" 1 5.! 1 3.6 1
1 1977 1 4.3 1 2.0 1
1 1979 1 4.7 1 3.3 1
1 1980 : 4.8 1 4.3 1
1 198! " 1 4.5 1 3.0 1
1 1982 : 4.9 1 2.7 1
: 1983 1 5.3 1 2.5 1
1 1984 1 5.9 1 3.4 1
1 1985 1 5.4 1 2.4 1
I 1986 1 5.4 1 2.9 1
1
4
1987 1
+
5.3 —
1
+
2.9 1
+
MEAN 1 5.1 1 3.0 MAX 1 5.9 1 4.3
NIN 4.3 1 2.0 Ii I II I II I n I
1
+ +
NOTE : • Based on less then £ ieadings. ft Recreational lakes included.
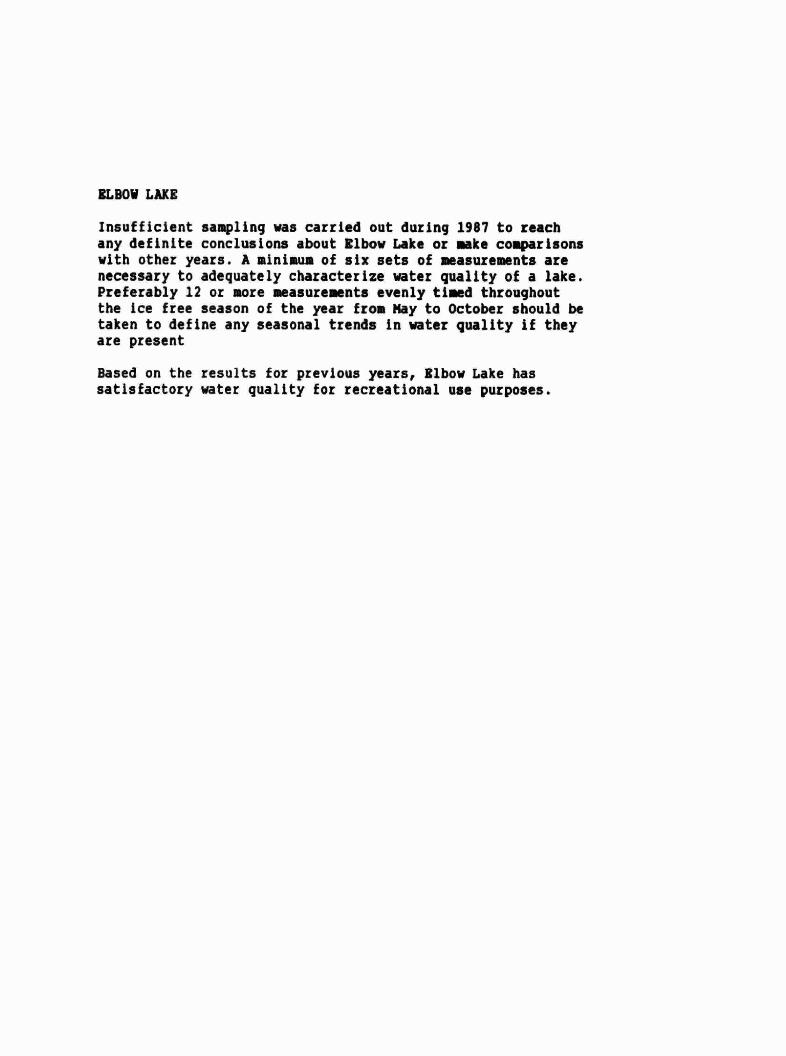
ELBOW LAKE
Insufficient sampling was carried out during 1987 to reach any definite conclusions about Elbow Lake or make comparisons with other years. A minimum of six sets of measurements are necessary to adequately characterize water quality of a lake. Preferably 12 or more measurements evenly timed throughout the ice free season of the year from Kay to October should be taken to define any seasonal trends in water quality if they are present
Based on the results for previous year5, Elbow Lake has satisfactory water quality for recreational use purposes.
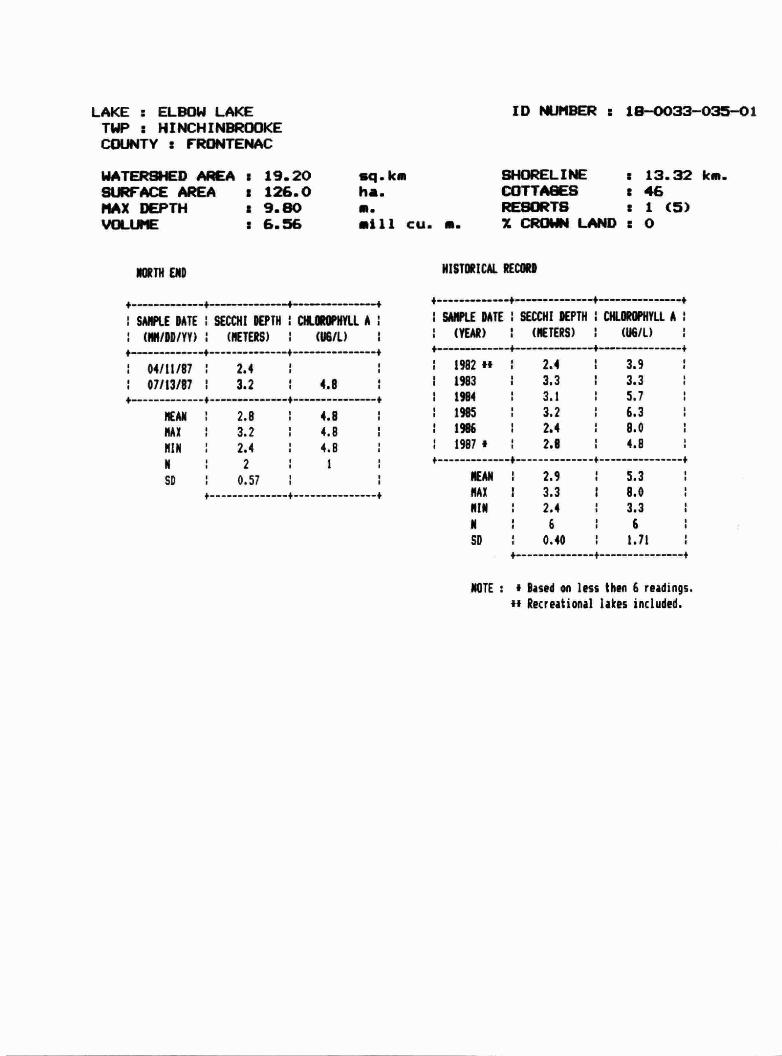
LAKE : ELBOW LAKE ID NUMBER : 18—0033--035--01 NP : HINCHINBROOKE COUNTY : FRONTENAC
WATERSHED AREA z 19.20 SHORELINE : 13.32 ks. SURFACE AREA • 126.0 ha. COTTASES : 46 MAX DEPTH • 9.80 a. RESORTS : 1 (5) YOLIPE : 6.56 •ill cu. a. X CROWN LAND : 0
HISTORICAL RECORI
+ £ , + +—————— +
SAIWLE DATE I SECCHI DEPTH CILIMOPHYLI A : : SANPI.E DATE : SECCHI DEPTH CHLOROPHYLL A
thM/DDIYfl 1 (METERS) (11611) (YEAR) 1 (METERS) (116/I)
• .4 + _____•
:04111187: 2.4 1 1 1982" 2.4 : 3.9
07113/87 1 3.2 4.8 1983 1 3.3 1 3.3 ,.. ..• :1984 a.z 1 5.1
MEAN: 2.8 1 4.8 1 :1985 3.2 1 6.3
MAX 1 3.2 1 4.8 1 11986 1 2.4 : 8.0
NIH 2.4 4.8 :1987' 1 2.8 4.8 U I I I
I £ I t I
SD 0.57 1 MEAN: 2.9 5.3
+ + + MAX 1 3.3 1 8.0 HIM 1 2.4 1 3.3 H 1 6 1 6
SD 1 0.40 1 1.11 + + +
NOTE : Based on less then 6 readings. 4* Recreational lakes included.

FARADAY (TROUT) LUB
Insufficient sampling was carried out during 1987 to reach any definite conclusions about Faraday Lake or make
with other years. A minimum of six sets of measurements are necessary to adequately characterize water quality of a lake. Preferably 12 or more measurements evenly timed throughout the ice free season of the year from Nay to October should be taken to define any seasonal trends in water quality if they are present
Based on previous years results Faraday Lake has excellent water clarity with very little algae present in its water.

LAKE : FARADAY (TROUT) LAKE TWP : FARADAY COUNTY : HASTINGS
ID NUMBER : 18-3490—042-01
WATERSHED AREA SURFACE AREA MAX DEPTH YOLUME
19.20 : 113.0 i 24.40 a 10a19
SHOREL— I PE COTTAGES RESORTS X CROWN LAND
u 7.57 km. :89 a 1 (15) :35
CENTRE (1 LAKE HiSTORICAL RECORD
NOTE : Based on less then 6 readings. I' Recreational lakes included.
sq. km ha. ii. mill Cu. •.
SAMPlE DATE SECCHI DEPTH 1 CJLOROPHYLL A
I (MN/DO/fl) 1 (METERS) thRiLl +
1 08/16/87 1
I-—-——
5.8
t 1 3.5
+
1
I 09/15/87 1 6.5 1 2.0 1
1
4
09/23/87 —-—4
1 6.3 1
4—————
5.0 :
————4
t SAMPLE DATE SECCHI DEPTH CHLOROPHYLL A I
(YEAR) 1 (METERS) I (116/li
+ + — +
1918ff 1 6.1 1 2.1
1982' 1 5.5 1 1.8
1983" 6.2 1 2.1
1984*' 1 4.4 1 2.1
I 1985" 1 6.0 1.5 1987' 62 35
S .1 1. S
lEAN 1 6.2 1 3.5
MAX : 6.5 5.0
NIH 1 5.8 1 2.0
N 3 1 3
SD 0.36 1 1.50 + 4. +
MEAN • I 5.7 • S 2.2 ' I
MX ' I 6.2 ' I 35 . ' I
NW ' S 44 . I 1.5 ' I
N ' I 6 ' I 6 ' I
SD ' I 070 . ' I 069 . ' I

FARREN LAKE
An excellent sampling program was carried out with a combined total of 12 samples between May 20 and November 2. A
singularly high chlorophyll concentration of 12.5 ug/l was detected on September 1 along with a reduction in water clarity. The results indicate there mey have been a slight algal bloom or localized concentration of algae due to wind drift on that date. No seasonal pattern in the results was discernable.
Farren Lake has excellent water clarity and apart from the September 1. sampling date very low levels of algae present in its water.
Water clarity was higher and chlorophyll concentrations lower than those measured in the lake during 1986. The summer of 1987 was much drier than the weather experienced during the previous summer. It is believed that reduced amounts of surface runoff limited the supply of algae producing nutrients available to the lake over the growing season with a resulting improvement in water quality.
The Farren Lake Association participated in a Shoreland Restoration program during 1987. The program involves the co-operation of cottagers in enhancing the lake environment by returning disturbed areas of the shoreline to their natural state with cuttings of plants native to the lake.

LAKE : FARREN (FARRELL) LAKE TWP : SOUTH SHERBROOKE COUNTY : LANARK
WATERSHED AREA : 12.25 SURFACE AREA : 173.0 MAX DEPTH 21.30 VOLUME : 14.32
CENTRE / EAST END OF LAXE
ID NUMBER : 18—0033—020—01
SHOREL I NE COTTAGES RESORTS
HISTORiCAL RECORD
+ + + +
SAMPLE DATE SECCHI DEPTH CHLOROPHYLL A
(MM/DD/YY) (METERS) : (UGh) SAMPLE DATE SECCHI DEPTH CHLOROPHYLL A I
(YEAR) (METERS) I (U6/L) + + +
5.4
1.5
0.9 0.8 1.4
0.8 1.0
2.4
12.5
I
1.2 1
sq. km ha. m.
mill CU. In. X CROWN LAND : 0
: 9.50 km. 1 101 (1974) 1 1 (6)
1 05/20/87 : 5.4 1 1 1975 u 1 4.7 1 3.0 1 06/10/87 4.8 1 1 1980'+ 5.2 3.3
1 07/09/87 : 5.5 1 1 1981 1 5.7 1 2.4 1 07/17/97 1 5.3 : 1982 5.0 2.0 : 07/26/87 : 4.6 : 1 1983 4.9 1.8 1 08/06/87 1 4.9 : 1 1984 1 4.8 1 2.9 1 08/12/87 4.9 1 1 1985 1 5.0 1 1.8 1 1 4.9 1 1986* 1 4.1 2.7 1 09/01/87 1 4.1 1 1 1987 1 5.0 2.5 I 09/15/87 1 5.5 1 + + + +
: 09/30/87 1 4.9 11/02/87 : 4.8
+ + + •1-
MEAN 5.0 2.6
MAX 5.5 12.5
MIN 1 4.1 0.8
N 12 it SD 0.41 3.53
MEAN 4.9 1 2.5 MAX 5.7 3.3
MIN 4.1 1.8
N 9 1 9
SD 0.43 1 0.54 + + +
NOTE I Based on less then £ readings. + + + *4 Recreational lakes included.

GANANOOUE LAXE
A total of eight samples collected between June 23 and October 6 provided good coverage of water quality conditions in Gananoque Lake. No seasonal pattern in water quality was discernable. The results indicate although Gananoque Lake has levels of algae present in its waters, it has satisfactory water quality for recreational use purposes.
Gananoque Lake is relatively uninfluenced by local runoff as water clarity did not deteriorate during the extremely wet summer experienced in 1986 or improve during the drier weather experienced in 1987 as happened in other nearby lakes.

LAKE : GANANOQIJE LAKE TWP : REAR & FRONT OF LEEDS LANSDOWNE COUNTY : LEEDS
WATERSHED AREA u 424.40 SURFACE AREA s 617.0 MAX DEPTH i 22.77 VOLUME 42.82
MEAR TURTLE IS.AND
ID MJMBER s 12—0017—008—01
SHORELINE a 33.17 km. COTTAGES a 111 RESORTS a 2 (19) XcROWNLAPr 3
MIITDflCAI.
NOTE : t Based on less then 6 readings. Recreational lakes inciSed.
sq. km ha. a. mill cu. a.
SAMPLE DATE SECCHZ DEPTH CHIORIPHYLI A
(MM/DD/YY) 1 (METERS) I (118/I)
SAMPLE DATE I SECCHI DEPTH I CILIWOPHYU. A
(YEAR) I (DETERS) (US/I) V
1 06/23/87 : 2.7 : 8.8 :
I 07/05/87 2.7 I 6.0 1
1 07/12/87 1 2.4 1 4.0 1
1 07/19/87 2.6 1 3.6 1
1 07/26/87 1 2.5 1 5.3 1
1 08/23/87 : 2.9 : 6.2 1
1 09120/81 1 2.9 1 6.6 1
1
4
10/06/87 1
4
2.6 1
—-———4
5.1 1
4
1 1977 ' I 22 . ' 4.7 I ,
1 1978 ' , 3O . ' . 71 . ' .
1 1979 . '
. 32 . ' . 47 , ,
1 1980 ' I 1.8 I 8.0 , .
I 1981ti ' , 31 . , , 69 '
1 1982" ' , 2.6 ' I 52 . ' I
1 1983" ' I 3.2 ' I 45 ' I
1 1984" ' 4.1 ' I 74 . I I
1 1985 ' . 26 . , , 76 . ' I
1 1986 ' I 28 . ' I 57 . 1
I
1 1987 ' I 27 . ' 57 . I I
+ 4.— I +
MEAN 1
I 2.7 I 5.7 I
MI ' 1 2,9 ' I 88 ' I
MIN I I 24 . • I 3.6 ' I
N I I 9 ' I 8 ' I
SD , I 018 . ' I 163 . I I
I + +
DEAN ' 28 ' 6.1 I I I
Mx , 41 I . , 8.0 NIN ' 18 1 4•5 • I
N ' 11 11 I I
SD , 060 ' 1.30 I I I

GREEN LAKE
A total of seven samples were collected during the months of
August and September. the results indicate Green fake has excellent water clarity with very little algae dispersed through out the water.
In recent years a profuse growth of filamentous algae characteristic of acidic waters has materialized in the shallow areas around the shoreline of Green Lake. The presence of this algae is not detected by chlorophyll analyses of water samples. An experimental liming program with the co—operation of property owners on the lake is being planned to evaluate the effectiveness of lake neutralization as a control approach In dealing with this algae.

LAKE : GREEN LAKE lISP RADCLIFFE COUNTY : RENFREW
WATERSHED AREA : 15.61 SURFACE AREA : 29.1 MAX DEPTH : 22.5 VOLINIE 2.12
sq • km ha. a. mill Cu. •.
CENTRE (1 LAKE HISTORICAL RECORD
1986 : 5.6 : 2.2 1 1987 6.0 : 2.1
ID NUMBER : 18—3490-048-01
SHORELINE : 2.9 km. : 3
RESORTS z 0
I SAMPLE DATE I SECCH! I€PTH CHLOROPHYLL A I
(Mff/DD/YY) I (METERS) (06/U I
I SAMPLE DATE I SECCHZ IEPTH I CHLOROPHYLL A I
(YEAR) 1 thETERS 1 (06/1) t t 1 08/02/87 1 5.8 1 1.9 1
I 08/18/87 1 5.8 1 1.5 1
1 08/25/87 1 5.5 1 1.5 1
1 09/02/87 1 6.4 1 4.0 1
1 09/10/87 1 5.8 1 1.6 1
1 09/15/87 1 6.4 1 1.8 1
1 09/22/87 1 6.4 1 2.6 1
t-. + + I
MEAN 1 6.0 2.1 MAX 1 6.4 1 4.0 HIM 5.5 1.5 N 1 7 1 7
SD 0.38 1 0.91
MEAN ' I 5.8 1 2.2 1
MAX ' I 'O . r I 22 . '
I I I
I 2 I 2 1
SD ' , 028 . ' I 010 . ' I

GRINDSTONE LAKE
Grindstone Lake was included in the Self Help Program for the first time during 1987. Previous information for Grindstone Lake was collected by the Ministry in 1976 and 1980 as part of our lake survey program.
A total of 12 samples collected from June 1 to August 17 provided a good picture of water quality conditions. The data indicate that Grindstone Lake has very good clarity with very low levels of algae. The water quality of Grindstone Lake should be well suited for a variety of recreational uses including swiaing and bathing use of the lake.

LAKE c GRINDSTONE LAKE TWP z MILLER, CLARENDON COUNTY : FRONTENAC
ID NUMBER : 18—3430—037—01
WATERSHED AREA z 6.51 SURFACE AREA u 174 • 82 MAX DEPTH z 18.29
sq.km ha. a. mill Cu. •.
SHOREL I IcE COTTAGES
X LNID :
NORTH EAST END OF LAKE HISTORICAL RECORD
VOLUME
I
1 I
I 1 I I
I SECCHI DEPTH CILOROPHYLL A
1 (YEAR) 1 (METERS) I (US/U
1 06/01/81 1 5.5 1 2.8 1
1 06108187 1 4.1 1 0.8 1
1 06/15/87 1 4.1 1 1.6 1
1 06/21/87 1 4.1 1 1.4 1
1 06/29/87 1 3.8 1 1.2 1
1 07106/87 1 4.0 1 2.6 1
1 07/13/81 1 4.1 1 1.7 2
1 07/20/81 1 4.3 1 1.6 1
1 07/27/87 1 4.3 1 1.6 1
1 08/03/87 1 4.6 1 2.3 1
I 08/09/87 1 4.3 1 2.1 1
1 08/17/87 1 4.7 1 1.3 1
1 1916" 1 5.2 1 2.7 1
1 1980" 1 4.6 1 2.4 1
1
4
1987 1
4— 4.4 1
——4
1.8 1
+ p
NEAR 1 4.7 1 2.3
MAX 1 5.2 1 2.7
MEN 4.4 1 2.8
N 1 3 1 3
SD 1 0.42 1 0.46
MEM ' S 44 • I 18 . ' I
MX ' I 5.S ' I 28 . • I
MIN • S 38 . S
S 08 • ' I
N ' I 12 ' I 12 I
50 ' S O45 I ' I 059 . S
NOTE : t Mud cm less then 6 rndings. 44 Recreational lakes isciuded.
GRIPPEN LAXE
A total of eight samples collected from May 18 to September 20 provided good seasonal coverage of water quality conditions in Grippen Lake. Secchi disc visibility was better in September than at other times over the course of the sampling program but there was no evidence of seasonality in the chlorophyll results. The variation in water clarity may have been due to factors not related to the presence of algae in the water of the lake.
Water clarity was higher and chlorophyll concentrations lower than those measured in the lake during 1986. The suer of 1987 was much drier than the weather experienced during the previous summer. It is believed that reduced amounts of surface runoff limited the supply of algae producing nutrients available to the lake over the growing season with a resulting improvement in water quality. Similarly low productivity was documented in Crow Lake during 1983 which was also a year with a dry summer period.
The current year's results and the historical record data indicate that Grippen Lake has good water quality which should not limit its recreational use.

LAKE a GRIPPEN LAKE TWP a REAR OF LEEDS & LANSDOWNE COUNTY a LEEDS
ID P&$BER a 12—0017-010—01
WATERSHED AREA : 20.30 SURFACE AREA a 191.0
sq.km ha. S. mill Cu. S.
SHORS.. DdE a 7.72 km. t76
NORTH EAST END OF LAKE HISTORICAL RECORD
NOTE : based on Ins then 6
it Recreational lakes InciSed.
MAX DEPTh VOLL$E
a 16.00 a 22.03
RESORTS a 1 (24) XCROMlLNW a 0
I SAWLE PATE I SECCHI DEPTH I CtflIIYIL A: I (MNfDD/YY) I (NETERS) 1 (11611) 1
SMIPLE DATE I SECCHI PEPTO CILORORWYLL A
(YEAR) I UtTERS) I (US/I) t 1 05/18/87
t 1 1.9
—t I 3.6
+
1
1 06/28/87 1 2.9 1 0.3 1
07/10/87 1 2.1 1 2.3 1
1 07/19/87 I 3.2 1 3.0 1
I 07/28187 1 2.4 1 3.4 1
1 00117/81 1 2.1 1 3.8 1
1 09/07/87 1 4.1 1 4.2 1
I
4
09/20/87 —----—4--—
1 3.5 1 5.9 1
4
1 1975 ' I 2.9 ' I 3.9 ' I 1 1916 ' I 3.9 ' I 4.1 ' I
1 1977 ' , 2.6 ' . 32 . ' .
1 1978 ' I 313 ' I 4.1 ' I
: ' . 29 . ' 3.8 '
1 1980 1 3.8 ' I 60 . ' I 1 1981° ' I 3.2 1 6.9 1
1 1982tt I I
I I So •
, I
I 1983tt ' I 2.8 I 5.6 ' I
I 1984u 2.4 ' 45 . I
1 1985 I 3.6 ' I 4.2 ' I
1
1
1986
1987
I .
' I
29 .
2.8 ' • I
54 •
33 .
I
' I
IEAH ' I 28 . I 33 . ' I
MAX I I 41 I I 59 . ' I
NIH ' I 19 U ' I 0.3 1
N ' I B I I 9 1
SD ' I 078 ' I 160 • ' I
itAli I 3.! : 4.7 1
MAX 1 3.9 1 6.9 1
NIH 1 2.4 1 3.2 1
N 1 13 1 13 1
SD 1
+
0.46 1
I————
1.08 1
——4

GUNTER LAKE
Insufficient sampling was carried out during 1987 to reach any definite conclusions about Cunter Lake or make comparisons with other years. A minimum of six sets of measurements are necessary to adequately characterize water quality of a lake. Preferably 12 or more measurements evenly timed throughout the ice free season of the year from Hay to October should be taken to define any seasonal trends in water quality if they are present
Based on the historical record Gunter Lake has good water quality which should be well suited for a variety of recreational pursuits including swising and bathing.
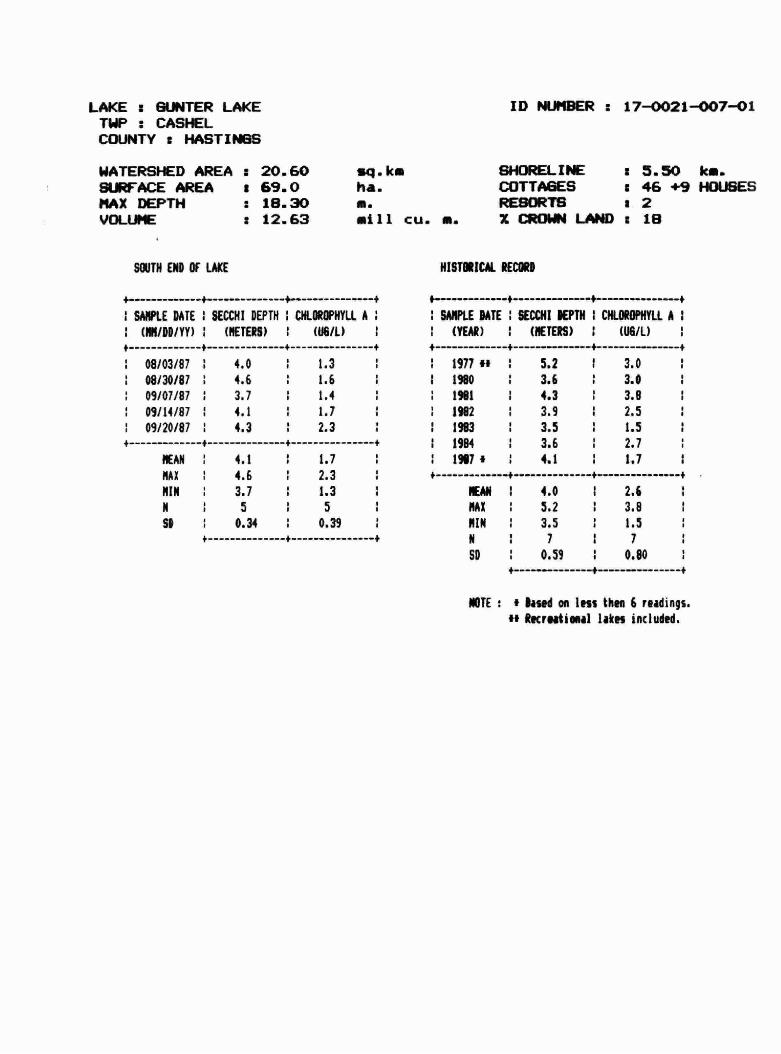
LAKE : GUNTER LAKE TWP : CASHEL COUNTY r HASTINGS
WATERSHED AREA : 20.60 SURFACE AREA 69.0 MAX DEPTH : 18.30 VOLUME 12.63
sq • km ha. m. mill cu. a.
ID NUMBER : 17—0021—007—01
SOUTH END OF LAII HISTORICAL RECORD
WifE 4 hiS on ni INto 6 reidings. 44 Recrntieual lakes included.
SHORELINE x 5.50 km. COTTAGES : 46 +9 HOUSES RESORTS u 2 X LN4D 18
SAMPLE DATE : SECCI4I DEPTH CHLOROPHYLL A
I (MN/DD/YY) 1 (METERS) I (US/I)
08/03/87 1 4.0 08/30/87 4.6 09/07/87 : 3.1 09/14/87 4.1
09/20/87 4.3
SAMPLE DATE : SECCHI DEPTH I CHLOROPHYLL A I
1 (YEAR) 1 (METERS) (US/U
1.3 1.6
1.4
1.7 2.3
19714' 1
t-——.-—-————
5.2 1 3.0 1
1 1980 1 3.6 1 3.0 I
I I I
I I
I I
I I
1 1982 1 3.9 1 2.5 1
1983 1 3.5 1 1.5 1
1 1984 1 3.6 1 2.7 1
1 1907' 1 4.1 1 1.7 1 MEAN 1 4.1 1 1.7
MAX 1 4.6 1 2.3 KIN 1 3.7 1.3 1
II I C I C I II I .1 I II I
Si o.as + 4 +
MEAN 4.0 1 2.6 MAX 1 5.2 1 3.8 NIH 1 3.5 1 1.5
N 1 1 7
SD 1 0.59 1 0.80
HAY BAY
An excellent sampling program that was initiated April 1 and continued until October 20 provided good seasonal coverage of water quality conditions in Hay Bay. Chlorophyll concentrations were generally very high except for the three sampling dates during the month of June. A Secchi disc visibility depth of 3.7 metres on June 3 is the best water clarity measurement on record for Hay Bay.
Vater quality in Hay Bay is not particularly well suited for water oriented activities such as swiing and bathing.
Hay Bay has not responded to reductions in nutrient loads with an improvement in water quality as has the rest of the Bay of Quinte. Major nutrient load reductions have been achieved over recent years by improved treatment of sewage by municipalities discharging to the Bay of Quinte.

LAKE ; HAY MAY — BAY OF QUINTE TIP : NORTH & SQJTH FREDERICKSBURG COUNTY : LENNOX & ADD INGTON
ID NUMBER u 17—0031—001-o1
WATERSHED AREA : SURFACE AREA: MAX DEPTh VOLUME 1
sq.km ha. a. mill Cu. a.
SHOREL INE
RESORTS : 6 (211) XCROWNLAND: 0
SOUTH SHORE OF HAY BAY HISTORICAL RECORD
1 SAMPLE DATE I SECC$I DEPTH I C#LORW'HYLL A
(METERS) I (OR/Li SAMPLE PATE SECCHI DEPTH I OLOROPHYLL A
1 (YEAR) I (METERS) I (1$/I) ———-——4 — +
km.
1 04/01/87 ' 1.7 1 3.2 ' .
' . I,76t ' . 08 • ' . 240 . ' .
1 05/08/87 . ' 2.0 I 15.5 I ' I 1977 ' I 11 • ' I 249 . ' I 1 05/13/87' I 1.8 1 12.0 ' I ' j 197B ' I 15 t ' I 183 •
' I
: 05/25/87 ' I 2.3 1 12.0 ' I ' • 1919 ' . 1.2 I 24.9 ' I
106/03/87' I 3.7 4.5 I I , 1980 ' I 10 • ' I 298 .
I I
:06/17/87' I 1.7 1 2.9 ' I ' • 1981 • I 14 • ' I 213 I ' I 1 07/01/871 I 1.5 1 1.3 '
, ' , 1982 ' , I' • • , 170 . '
1 07/08/87' I 1.7 1 17.0 I , '
19S3 , ' • 20 , ' • 168 , '
08121/81 . ' 0.7 91.5 ' I ' , 1984' ' I 12 •
I I 303 ' I
1 08/26/87' I 0.8 1 26.0 ' I '
19B5. . ' . 13 • ' . 242 • '
1 09/02/87 . I 1.0 1 42.0 I '
J986 ' 13 . ' , 250 . '
1 09/11/87 ' 1.2 1 18.5 ' I ' , 1987 ' I 16 I ' I 207 . ' I
1
I
10/15/87
10/20/87
1
'
1.4
1.4
1
1
20.0
23.5
I ,
' I
IWM ' I 16 • ' I 207 . ' I
Mx ' I I I
I I I I
I 14 ' 1 14 '
SD • I 074 . ' I 2314 . ' I
I I3 I ' I 229 . ' I
MAX • I 20 . ' I 298 I ' I
HIM ' I 08 • ' I 168 I ' I
N ' I 12 • I 12 ' I
SD ' I 032 I ' I 419 . ' I
NOTE Bind on less then 6 readieqs. 1* Recreational lates included.

INDIAN LAKE
A very thorough sampling progra. was carried out with a total of 18 samples taken from June 18 to October 18. Although chlorophyll concentrations ranged from 1.1 ug/l to 5.3 ug/l, was no seasonal pattern discernable.
Water clarity was higher and chlorophyll concentrations lower than those measured in the lake during 1986. The summer of 1987 was much drier than the weather experienced during the previous summer. It is believed that reduced amounts of surface runoff limited the supply of algae producing nutrients available to the lake over the growing season with a resulting improvement in water quality. Similarly low productivity was documented in Indian Lake during 1983 which was also a year with a dry summer period.
The results show that Indian Lake has very good water clarity with little algae present in its water.

LAKE i INDIAN LAKE TWP : SOUTh CROSBY COUNTY i LEEDS
WATERSHED : 359.00 SIMACE AREA a 266.0 MAX DEPTH a 26.00 VOLUME r 26.79
sq.km ha. ma mill Cu. S.
ID NUMBER a 12-0004-013-01
LAKE HISTORICAL RECORD
1 3.1
5.3 I . : 18
1.13
NOTE t a Based on less then 6 nadinqs.
SHORELINE a 16.58 km. COTTAGES a 106 RESORTS a 2 (11)
0
I SANPI.E BATE I SUCH! DEPTK 1 OLOROPHYLL A 1 I SMILE DATE I SECCHI IEPTH I OILOROPHYLI. A I
I (MN/BD/YY) I (METERS) I (IiG/L) 1 I (YEAR) 1 (METERS) (lulL) 1
I 06/18/87 1 4.0 1 19 1
1 06/24/87 1 3.7 1 3.2 1 1 1 1
1 1 1 1
1 1 1 1
3
1 1 1 1
4.6 1 1
1 1 1 1
1 1 1 1
1 1 1 1
1 1 1 1
1 1 1 1
1 1 1 1
1 1 1 1
1 1 1 1
1 1 1 1
1 1 1 1
1 1 1 1
1 1 1
1 1 1
1 1
1 1 1 1
1 1 1 1
1 1 1 1
1 1 1 3.6 I 1 3.9 1 1
1 1 1 I
I I I
I I I I
I I I I
I I
I I 10 I
I I I
I I I
MEAN 1 4.3 MAX 1 5.5 HIM 1 2.9 N 1 lB
SD 1 0.77
Recreational lakes included.

JEFFREY LAKE
A sampling program that was initiated May 18 and continued until September 27 provided good seasonal coverage of water quality conditions in Jeffrey Lake.
Water clarity was excellent and chlorophyll concentrations very low over the entire sampling period.
Water clarity was higher and chlorophyll concentrations lower than those measured in the lake during 1986. The suxeer of 1981 was much drier than the weather experienced during the previous suwr. It is believed that reduced amounts of surface runoff limited the supply of algae producing nutrients available to the lake over the growing season with a resulting improvement in water quality.

LAKE : JEFFREY LAKE TWP : FARADAY COUNTY : HASTINGS
ID NUMBER : 18—3490—047—01
WATERSHED AREA : 19.20 SURFACE AREA : 113.0 MAX DEPTH : 24.4 VOLUME : 10.19
sq. km ha. m. mill cu. m.
SHORELINE : 7.57 km. COTTAGES : 89 RESORTS : 1 (15) X CROWN LAND : 35
CENTRE OF LAKE
+ + + +
I SAMPLE DATE I SECCHI DEPTH CHLOROPHYLL A I
(MM/DD/YY) (METERS) I (US/LI I
+ + + +
05/10/87 1 7.0 1 0.7 05/24/87 7.1 1 1.0 1
06/14/87 59 1 11 06/28/87 6.1 1 0.7
1 07/09/87 1 5.2 1.2 1
1 07/19/87 5.8 0.8 07/26/87 6.4 1.1
08/03/87 6.7 1.4
1 08/08/87 7.0 1.5
08/29/87 7.9 1.2 09/07/87 : 6.9 1 1.9
09/27/87 8.5 1.1
+ + + +
MEAN 6.7 1 1.1
MAX 8.5 1 1.9
MIN 52 07 P4 12 12
SD 0.92 0.35 + +
HISTORICAL RECORD
+ + + +
I SAMPLE DATE SECCHI DEPTH I CHLOROPHYLL A
(YEAR) 1 (METERS) (1J8/L) I
+ + +— +
1 1977*' 1 7.9 1 1.2
1985 1 7.0 1 1.8 1
1 1986 1 6.2 : 2.0
1987 1 6.7 1.1 1
+ t— +
MEAN 7.0 1 1.5 1
MAt 7.9 1 2.0 MIN 1 6.2 1 1.1 1
N I I I I I
SD 1 0.72 1 0.44 1
+ + 4
NOTE * Based on less then 6 readings. ii Recreational lakes included.

JEFFREYS (OLMSTEAD) LAKE
A total of seven samples were collected from July 13 to November 16. Chlorophyll concentration was higher and water clarity less after the end September than asured during the summer. This change in water quality might be the result of upwelling of nutrient laden bottom water as the lake begins the process of fall overturn.
Water clarity was higher and chlorophyll concentrations lower than those measured in the lake during 1986. The summer of 1987 was much drier than the weather experienced during the previous summer. It is believed that reduced amounts of surface runoff limited the supply of algae producing nutrients available to the lake over the growing season with a resulting improvement in water quality. Similarly low productivity was documented in Jet freys Lake during 1983 which was also a year with a dry summer period.
The results demonstrate that Jeffreys Lake has excellent water quality which should lend Its self well to a variety of recreational uses including swimming and bathing.

LAKE : JEFFREY'S (OLMSTEAD) LAKE TWP : ROSS COUNTY RENFREW
ID NUMBER : 18—4810—001—01
WATERSHED AREA : 26.80 SURFACE AREA : 180.0 MAX DEPTH : 29.30
11.6
sq. km ha. m. mill cu. m.
SHORELINE COTTAGES RESORTS
10.60 km. 98
: 2 (305)
CENTRE 01 LAKE
SAMPLE DATE SECCHI DEPTH I CHLOROPHYLL A
(MM/DD/YY) (METERS) 1 (118 IL)
HISTORICAL RECORD
+ + $ +
SAMPLE DATE SECCHI DEPTH I CHLOROPHYLL A
(YEAR) I (METERS) (06/L)
+ + + +
07/13/87 1 5.8 07/30/87 6.1
08111/87 70 09/02/87 6 1
09/21/87 7.0 10/05187 55 11/16/87 4.3
MEAN 6.0 MAX 7.0
MIN 4.3
N 7
NOTE * Based on less then 6 readings. 'a Recreational lakes included.
VOLUME X CROWN LAND : 0
+ + + +
' I IS •
' ' ' 1917 I ' I 63 ' I 2! • ' I
' I I.2 '
I ' 1978*' I ' I 60 • ' I 22 . l I
' I I4 •
' I 1979 I ' I 63 •
1
I 1.8 I I
I I I4 •
' I 1980 I ' I 54 • ' I 39 •
I I
' I I0 I ' I
1
I
I
1
I I I I I
I
I 1 I
I
I I
l
I
I I ' p
I I
I I
P I
I I I
P I I
' 6 ' p
SD 0.93 1.20
+ + +
+ + + +
MEAN 1 5.9 1 2.7 1
MAX 1 6.7 1 5.8 NIh 1 5.3 1.7
fl I
I II I I
I
SD 1 0.47 1 1.33

JOEPERRY LAKE
A total of 12 samples were collected from the middle of June to the beglnninq of September. Although chlorophyll concentrations ranged from a low of 0.9 ugh on July 16 to a high of 4 ugh on August 27 no seasonal pattern was discernable.
Water clarity was higher and chlorophyll concentrations lower than those measured in the lake during 1986. the summer of 1987 was much drier than the weather experienced during the previous summer. It is believed that reduced amounts of surface runoff limited the supply of algae producing nutrients available to the lake over the growing season with a resulting improvement in water quality.
The results indicate Joeperry Lake has good water quality.

LAKE s JOEPERRY LAKE TWP . EFF INOHAM COUNTY : LENNOX & ADDINGTON
WATERSHED AREA : 15.40 SURFACE AREA a 169.0 MAX DEPTH a 23.00 YOLUPE a 12.35
sq. km ha. a. mill cu. a.
ID MIlDER a 17—0026-001-01
ECHO PROVINCIAL PARK NISTIWICAI. DECON
SARPLE DATE SECCHI DEPTH I CILORI1PHYLL A
I (MN/DD/YY) I (lEVERS) I (0811)
I SAlUtE DATE I SECCHI DEPTH CHLOROPHYLl. A
1 (YEAR) I (lEVERS) (UI/I)
06/18/87 1 06/25/87 2.7
07/02/87 1 2.7 07/09/87 1 3.3 07/16/87 1 3.0
1 07/23/87 1 3.0 07/30/87 1 2.7 08/06/87 1 3.7 08/13/87 I 3.3
1 08/20/87 2.7 1 08/27/87 1 2.7
09/03/87 3.1
1 1.5
1.3 2.5
1 0.9 1 2.8
1.6
1 2.4 1.7
I t •
4.0 1.3
1 2.4 1 3.1 1 3.9
3.2 1 3.2
2.5 3.0
1 3.3 1 2.7 I 3.0 1 2.8 1 1.9
NOTE : • Based on less then 6 readings. *1 Recreational lakes iecluded.
SHORELIPiE a 900 km. COTTAGES a
a 0 Z CROWN LAND a 100
I ' I97641 ' 4.4 I I
• ' 1977 4.2 • I I
• 1978* 1 3.8 1979' 3.6 • , I
• , I 3.1 • • 1900*
I981t ' • 5.6 •
' 1982 I 3.8 I I I
I I 1913" ' 4.0 • I I
• 1984*4 I 3.0 , I I
• I 1985a* ' 3.1 I I I I 1986 1 2.7 I I
• ' I911 • I • 3,0
NEM' I 30 I ' I 19 • I JEAN' I 37 • • I 30 • ' I
MI ' I 37 . ' I 40 . • I MX • , 56 . ' , 39 . I I
NIN ' I 27 . ' I 09 . • I fIN I 27 . ' I 19 • ' I
N I 11 ' I 12 ' I N ' I 12 I 12 I I
SD 1 0.34 ' I 086 . ' I SD I 081 . ' I 057 I ' I

KASHWAXAMAK
Insufficient sampling was carried out during 1987 to reach any definite conclusions about kashwakamak Lake or make comparisons with other years. A minimum of six sets of measurements are necessary to adequately characterize water quality of a lake. Preferably 12 or more measurements evenly timed throughout the ice free season of the year from May to October should be taken to define any seasonal trends in water quality if they are present
Based on previous years' data Kashwakamak Lake has good water quality well suited for a variety of recreational uses including water contact uses such as swiming and bathing.

LAKE . KASHWAKAMAK LAKE TWP : CL.ARENDON, BARRIE, MILLER COUNTY r
ID NUMBER i 18—3430—010—01
i 409.8 * 119.1 $ 21.9 * 96.71
sq.km ha. S. mill cu. a.
SHOREL INE COTTAGES RESORTS X LAND
.66 km. '445 I
NEAR WEiSS POINT HISTORICAL.
NOTE : * Based en less then S
4* Recreattowal lakes Included.
WATERSHED AREA AREA
MAX DEPTH VOLUNE
SAMPU DATE : SECøtt DEPTH 1 CILflHYLL A I
: (MNIDD/YYI I (METERS) 1 ($1611)
4—-——— —4 — 4 4
08106/87
08/06/87 08/06/87 08/06/87
24 ' 19 • I p I
24 ' 24 • I . I
4O ' 17 • I • I
3.3 1 1.3
I SAMPLE DATE I SECCHI DEPTh I CItOROPIIT IL A I
1 (YEAR) (METERS) I (US/I) 1
4— —-4———— ———4
I 1914" 1 6.4 1.5
1976" I 5.4 1 2.4 Iwo 1 3.1 1 3.2 $986 1 5.2 1 2.0 1
1987' 1 3.0 1.8 1
MEAN 3.0 1.8 MI 1 4.0 1 2.4 1
NIH 1 2.4 1 1.3 1
N I I
I I I
SD : 0.78 1 0.46 1
MEAN 1 4.6 I 2.2 MAN I 6.4 1 3.2 Mffi 1 3.0 1 1.5 1
N 1 5 1 5 I
SD 1 1.50 1 0.66 I

KENNEBEC LAKE
A good sampling program was carried out in the west basin beginning on June 8 and finishing on October 12. A shorter sampling program was carried out in the east basin. Generally, chlorophyll concentrations were higher during July than during the other months of the sampling program.
There was no appreciable difference in Secchi disc visibility or chlorophyll concentrations between the east basin and west basin. The results indicate that Kennebec Lake has good water quality with no problems related to algae in the water of the lake.

LAKE : KENNEBEC LAKE TWP : KENNEBEC, OLDEN COUNTY : FRONTENAC
ID NUMBER : 17—0031—006—01
WATERSHED AREA : 286.3 SURFACE AREA : 5.47 MAX DEPTH : 30.5 VOLUME : 43.60
sq. km ha. m. mill cu. m.
SHORELINE COTTAGES
30.6 km. 99
BASIN EAST OF CAUSEWAY
BASIN WEST OF CAUSEWAY
+ + + +
HISTORICAL RECORD
** Recreational lakes included.
H1STORICAL RECORD
+ + +
NOTE * Based on less then 6 readings. If Recreational lakes included.
RESORTS : 3(29) X CROWN LAND : 10
SAMPLE DATE SECCHI DEPTH CHLOROPHYLL A
(NM/DDIYY) (METERS) I (US/I) SAMPLE DATE I SECCHI DEPTH : CHLOROPHYLL A
(YEAR) (METERS) I (US/I)
1 07105/87 1 2.7 1 1.9
t 1
: 07111/87 1 2.7 1 4.3 1
1 07/19/87 1 2.7 1 2.2 1
1 07/19/87 1 2.4 1 4.2 08/03/87 1 3.0 1 2.5 :
1 08/16/87 : 3.0 1 3.0 1
1 08/30/87 1 3.4 1 3.4 :
1 09/01/87 1 2.9 : 3.4 1
1 09107/87 1 3.7 : 3.4 1
1
4
08/10/87 1
4
2.6 1
4
2.9 1
4
1976*' : 3.6 51 37 ' 29 1977 a a a a a
1978 ' 35 32 I a I a a
1979 , . I a a 32 I 34 I
1980 ' 26 ' 96 I a a a a
1981 a a a a a 33 ' 29 a
1904" 2.6 a a a 48 1987 29 ' 31 a a I a a
+ + + +
MEAN 3.2 a a a
1 44 '
MAX 1 3.7 1 9.6 a
MJN 1 2.6 ' 29 a •
N ' 5 a
5 a
SD 0.43 a 228 I a
NOTE : * Based on less then 6 readings.
MEAN : 2.9 1 3.1 :
MAX 1 3.7 1 4.3 1
MIN 1 2.4 1 1.9 1
N 1 10 1 10
SD 1 0.39 1 0.79 1
+ + +
SAMPLE DATE SECCHI DEPTH I CHLOROPHYLL A
(MN/DD/YY) (METERS) (US/U SAMPLE DATE SECCHI DEPTH I CHLOROPHYLL A
(YEAR) (METERS) (U6/L) + + + +
06/08/87 1 2.7 1 0.8 1 06/17/87 1 2.6 6.2
06/23/87 1 2a6 3.4 1 06/30/87 1 2a7 : 1.2
1 07/08/87 1 3.7 5.1
07/26/87 1 3.3 1 5.2 1 08/07/87 1 2a9 2.3
08/19/87 1 2.4 2.7
MEAN 2.9 1 3.4 MAX 1 3.7 1 6.2 MIN 2.4 1 0.8 N 8 8
SD 0.43 1.97
1 1976 u 1 3.2
1977 3.7
1 197$ 3.5 1979 1 3.2 1980 1 2.4 1981 3.1
1 1984 ** 2.9 1 1987 : 2.9
a 4.1 a 2.9 a 3.4
3.6 a 7.6 a 3.6 a 5.2 a 3.3
MEAN I 3.1 4.2 MAX 1 3.7 7.6 MIN 2.4 1 2.9 N 8 8
SD 1 0.40 1 1.53

ICILLENBECK LAKE
An extremely thorough and comprehensive sampling program 'as carried out beginning on May 13 and ending on October 20 with a total of 24 measurements collected.
Chlorophyll concentrations were much higher and water clarity somewhat less during the suer months than during either the spring or fall periods. However, the results indicate that water quality was much improved over conditions experienced during 1986. The summer of 1987 was much drier than the weather experienced during the previous summer. It is
believed that reduced amounts of surface runoff limited the supply of algae producing nutrients available to the lake over the growing season with a resulting improvement in water quail ty.
The results indicate that Killenbeck Lake has satisfactory water quality for swimming and bathing but that during the summer months the presence of algae may be visibly apparent.

LAKE : KILLENBECK LAKE TWP : REAR 0F LEEDS & LANSDOWNE COUNTY : LEEDS
ID NUMBER i 12—0017-011-701
WATERSHED AREA a 10.90 StM'ACE AREA a 44.0 MAX DEPTH a 27.70
sq. km ha. a. mill cu. a.
RESORTS I ZcROWNLNJD :0
flTHMEST EJU W LANE HISIIECAL RECUR)
I (PM/fl/TI) I (UtTERS)
I——— +——————
05/13/87 1 2.9 05/20/87 1 2.4 03/27/87 1 2.4 06/03/87 1 2.4 06/10/87 1 2.4 06/17/87 1 3.0 06/24/87 1 2.4
1 07/01/87 1 1.8 07/07/87 1 1.5 07/14/87 1 1.8
07/21/87 1 2.1
1 01/28/87 2.1 1 08/05/87 1 1.8
08/11/87 1 2.4 08/19/87 1 2.4
1 08/26/87 1 2.7 1 09/02/87 1 3.4 1 09/09/87 1 3.4
09/16/87 1 4.0 1 09/23/87 1 2.7 1 09/29/87 1 3.4
10/06/Si 2.7 1 10/14/87 1 3.!
10/20/87 1 3.4
I I
1 5.2
1 2.5 5.0
1 6.4 1 11.5
I 17.3
16.5
1 10.5
11.9
15.5 11.0
10.0
9.4 6.0
1 7.5 1 7.0
1 3.2 1 6.6
2.9 1 6.2
3.0 1.7
4 -. 7.7
17.3 1 1.7
24 • A I
MEAN 1 2.7 1 8.0 MAX 1 3.! 1 13.9
KIN 1 2.0 1 6.0 N 1 5 1 3
SD 1 0.46 1 3.35
:4.3
SHORe_INE , 4.70 km. :14
I SANtE DATE I SECCNI DEPTH I CItflhIYU. A 1
I (06/1) I SANtE PATE 1DEC01! DEPTH I OUROPIIYLL Al
1 (YSM) I (METERS) I (1$/i.)
: in' 1 3.1 1 6.5 1
I I
I £
I a
I a
LA u.v I a
I 1 1
1 1
I 1
£
MITE i C laid on ins then 6 rndlqs. Recreational hIts included.
MEAN 1 2.6 MAX I 4.0 MIII 1.5 N 1 24
SD 1 0.62

LIMERICK LAKE
A sampling program that began on May 19 and finished on September 20 with a total of 10 sets of measurements provided very good seasonal coverage of water quality conditions in Limerick Lake. Although some sampling variability is evident no seasonal pattern was discernable.
The results indicate Limerick Lake has very good water quality.
Water clarity was higher and chlorophyll concentrations lover than those measured in the lake during 1986. The summer of 1987 was much drier than the weather experienced during the previous summer. It Is believed that reduced amounts of surface runoff limited the supply of algae producing nutrients available to the lake over the growing season with a resulting improvement in water quality. The improvement was less pronounced for Limerick Lake than for other lakes. Low productivity was also observed in Limerick Lake during 1983 which was also a year with a dry summer period.

LAKE LIMERICK LAKE TIP : LIMERICK COUNTY : HASTINGS
ID NLMBER . 17—0021-010401
WATERSHED AREA z 181.41 SURFACE AREA : 744.0
i 29.00
tq.k. ha. a.
SHOREL I NE COTTAGES RESORTS
r 27.00 km. s 130 + 3 HOUSES s 1 (14)
OFF HALTER COTTAGE HISTIRICM. RECORD
MITE: tlaudaelnstlin6rndings. It Recrestlaual lakes inciSed.
MAX DEPTH YOUME . 62.87 .111 cu. a. X CROWN LAND s 1
IMWLE DATE : SECOU DEPTH: QLOROPWVLL A: (MI/ID/fl) 1 (PETERS) : (UG/L)
I SAIIPLE HATE SECCHI DEPTH I OILOROPIIYU. A I
(YEAR) I (PETERS) I (I$/L) 1
1
t——————————-—-t
05/19/87 1 3.7 1 1.0
t I
1 06/15/87 1 4.9 1 1.5 1
: 07/02/87 1 4.0 1 2.1 1
1 07/15/87 1 46 1 2.3 1
1 07/22/87 1 5.2 1 1.6 1
1 07/31/87 1 4.9 1 1.6 1
1 08/12/87 1 5.2 1 1.6 1
1 01/21/87 I 4.9 1 Ii 1 09/01/87 1 4.3 1 1.5 1
1 09/20/87 1 4.3 1 2.5 :
1 1975 ' , SO . S , 17 . ,
1 1976 1 4.9 ' I 17 . '
S
I 1977cc ' I SO . S I 18 . ' I
4 1978 ' I 49 . ' S 20 '
I
1 1979 1 4.5 ' I 21 . '
I
1 1980 1 4.1 • S 22 . ' S
I 1981k 1 4.4 S 20 . ' I
1 1982 ' S 44 . ' S 1.8 '
S
1 1983 ' I 44 •
' S I4 . I
1 1904 ' , 4.S ' 2.7 ' .
I 1915n 1 4.7 ' I 24 . '
I
: 1986 ' I 45 . ' I I9 . '
I
1 1981 • ' 4.6 I
' . 18 I
' PEAN
' I 46 . • I 18 S
' I
Mi ' I 52 I
' P 25 .
' I
MIN ' I 37 •
' I 1.0 ' I
N ' I 10
I I 10 ' I
SD , I 051 . ' I 044 . ' I
PEAK ' I 47 . ' 2.O ' I
NA! , S 50 . ' I 21 . ' I
KIN 1 4.4 ' , 14 .
N 1 13 I , 13 1
SD ' I 023 I ' I 034 . I I

LITTLE SILVER LAKE
A total of 23 observations made at two locations from May 9
to September 26 provided very good seasonal coverage of water quality conditions of Little Silver Lake.
A slight deterioration in water clarity during September was marked by higher chlorophyll concentrations than observed previously during the year. A weak fall peak in the abundance of algae as reflected by chlorophyll concentrations and Secchi disc visibility was detected by sampling on Little Silver Lake during 1986 and 1985 as well.
Water clarity was higher and chlorophyll concentrations lower than those measured in the lake during 1986. The summer of 1987 was much drier than the weather experienced during the previous summer. It is believed that reduced amounts of surface runoff limited the supply of algae producing nutrients available to the lake over the growing season with a resulting improvement in water quality. Similarly low productivity was documented in Little Silver Lake during 1983 which was also a year with a dry summer period.
Overall, the results show that Little Silver Lake has good water quality.
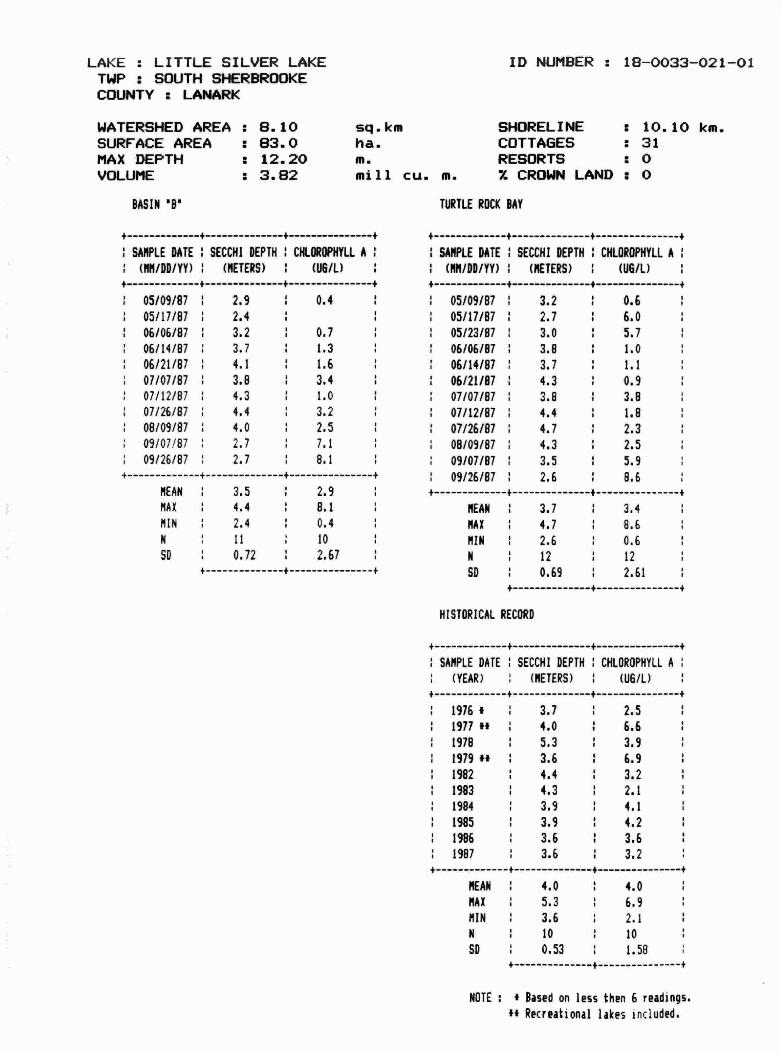
LAKE LITTLE SILVER LAKE TWP : SOUTH SHERBROOKE COUNTY : LANARK
ID NUMBER : 18—0033—021—01
WATERSHED AREA : 8.10 SURFACE AREA 83.0 MAX DEPTH : 12.20 VOLUME 3.82
sq. km ha. m.
mill cu. m.
SHORELINE : 10.10 km. COTTAGES : 31 RESORTS : 0 X CROWN LAND : 0
BASIN 'F TURTLE ROCK BAY
+ + + +
SAMPLE DATE SECCIII DEPTH C}LORDPHYLL A
(MM/DD/YY) 1 (METERS) I (US/LI + + + +
05/09/87 1 2.9 1 0.4 05/17/87 2.4
06/06/87 3.2 0.7
06/14/87 3.7 1 1.3
06/21/87 1 4.1 1 1.6
07/07/87 3.8 3.4 07/12/87 4.3 1.0
07/26/87 4.4 3.2 08/09/87 4.0 2.5 09/07/87 2.7 7.1
09/26/87 2.7 8.1 4 + + +
MEAN 3.5 2.9 MAX 1 4.4 1 8.1
MIN 1 0.4
N II 10
SD 0.72 2.67 4. 4. +
MEAN 3.7
MAX 4.7 2.6
N 12
SD 0.69 2.61 + + +
HISTORICAL RECORD
+ + + +
SAMPLE DATE SECCHI DEPTH : CHLOROPHYLL A I
(YEAR) 1 (METERS) WElL) I
+ + + 4.
1976' 3.7 2.5 1
19771* 1 4.0 1 6.6 1
1978 1 5.3 1 3.9 1979" 1 3.6 1 6.9 1982 4.4 1 3.2 1983 4.3 1 2.1
1984 1 3.9 4.1
1985 1 3.9 4.2 1986 1 3.6 1 3.6 1987 1 3.6 1 3.2
+ + + +
MEAN 1 4.0 4.0 MAX 5.3 6.9 MEN 1 3.6 2.1 N 1 10 1 10
SD 1 0.53 1 1.58 + + +
NOTE * Based on less then 6 readings. 4* Recreational lakes included.
+ + 4. +
I SAMPLE DATE 1 SECCHI DEPTH : CHLOROPHYLL A
I (MM/DD/YY) 1 (METERS) I (US/I)
05/09/87 3.2 1 0.6
05/17/87 1 2.7 1 6.0 05/23/87 3.0 1 5.7 06/06/87 3.8 1 1.0
06/14/87 3.7 1 1.1
06/21/87 1 4.3 0.9 07/07/87 3.6 1 3.6 07/12/87 4.4 1.6 07/26/87 4.7 1 2.3 08109/87 i 4.3 • 2.5 09/07/87 3.5 1 5.9 09/26/87 1 2.6 1 8.6
+ + + +
3.4
I a
1 0.6 1 12

LONG
A total of ten samples were collected from August 24 to October 23. Chlorophyll concentrations and water clarity after mid September showed some improvement over measurements made earlier in the sampling program but any clear cut seasonal pattern was obscured by considerable variability from one sampling date to the next.
Chlorophyll concentrations revealed the presence of generally only moderate levels of algae in Long Lake, although without samples for the months of June and July sumner conditions were not fully assessed.
The results therefore indicate that water quality is satisfactory for swimeing and bathing and other water related recreational uses of the lake.

LAKE : LONG LAKE TWP z OLDEN, HINCHINSROOKE COUNTY : FRONTENAC
ID MJMBER x 19—0033—022-01
sq • km ha. S. sill CU. S.
SHOREL I It RESIPTS x LAND
• 16.91 km. .64
1 C16) iO
VARIOUS IIZSTIWICAI. RECORD
WATERSHED AREA • 79.9 SURFACE AREA • 301 MAX DEPTH • 13.4 VOLUME t 19.50
SANPU DATE I SECCHI DEPTH CILIflHYLL A I
(TdIIPDIYY) I ULTERS I UIGIL) I
+ + —4— 4.
1 08/24/87 1 2.3 1 6.4
1 08/30/87 1 2.3 1 5.1
1 09/07/87 1 2.2 1 13.0
1 09115/87 3.9 2.5 1 09/22/87 1 4.8 1.1
09/27/87 5.4 1 3.0
I 10/04/87 1 3.5 1 4.5 1 10/11/87 1 4.5 1 1.0
1 10/18/87 1 3.2 1 6.6 10/23/87 1 3.2 1 1.8
S S —1. ——4
I SWLE DATE I SECCHI DEPTH I OLOROPHYLI A I
I (YEAR) I (METERS) 1 (08/1) 1
+ ——-+—-—————————-+-----———-- 4.
1117 1 2.4 1 7.1
1 1979" I 1.9 1 11.7
1 1987 1 3.5 I 4.5 4 ——4——— ———4 +
MEAN ' a 26 . ' I
I I I
I I I
I I I
I
1 1 1
1 1 1
1 1
N ' I
IA LY
I I
(A tIP
I I
SD 1 1.12 1 3.62 1
+
NOTE z • Based on then 6 readinp. U Recreational Iakei included.

LOUGNBOROUGH LAKE
A total of ten sets of measurements were made on the east basin of Loughborough Lake from July 20 to October 26. Water clarity showed some improvement as the season progressed but there was no corresponding decline observed in chlorophyll concentrations.
The east basin is relatively uninfluenced by local runoff as water clarity did not deteriorate during the extremely wet summer experienced In 1986 or improve during the drier weather experienced in 1987 as happened in other nearby lakes.
These results indicate that although the east basin is
moderately productive, water clarity is good and nuisance algae are not a problem. The east basin has water quality suitable for water based recreation such as swimming and bathing.

LAKE a LOUSHOOROUGH LAKE a EAST BAS IN TIP a STORRINSTON, LOLSWOROUSH COIJITY a
WATERSHED AREA a 120.00 sq.k. SURFACE AREA a 1065.0 MAX DEPTH a 6.10
a 22.00
ID MIlDER a 12—0004-014—01
SHORELIPE a 72.40 kit. COTTASES 240 + 10 HOUSES RESORTS a 2 (74)
NOTE: 'ksSseltntltnárudinp. It Iscriotissil lan IscISS.
VOLUME
ha. S. Mill CU.'S.
: SAMPLE PATE I SECCIII DEPTH : C11.OROPNYLL A I I SAMPLE PATE SECCII1 WIN I atoiorwvu *: I (Ill/OP/fl) 1 (METERS) I (tM/I) 1 1 UEAR 1 (METERS) I (01/1) t——
1 07120187 1
—t————————-
2.7 1
—
6.6
t 1
1 01130/87 1 2.3 8.4 1
1 01/08187 1 2.4 1 4.2 1
1 08/19/87 : 2.4 1 3.9 1
1 08/30187 1 2.4 1 7.2 I
I 09/09/87 1 3.2 1 6.6 1
09/20/81 1 3.4 1 7.1 1
1 09129/87 1 3.4 1 6.4 1
I 10/11/87 1 4.0 1 3.7 1
1 10/26/87 1 3.5 1 I
I I
.- 1
-- 1973'
.-- 1 3.3
.
' ' 50 . ' .
1 1974 ' • 2.1 • • 3., ' •
1 1975" I 2.4 ' • 6, .
.
.
1 1976 • I 34 . ' I 32 . ' I
1977 I • 2.8 1 5.6 1
1 1978 ' • 3.0 ' 5.4 I •
11979 I , 3.3 ' • 5.4 .
1 1W • I 3.2 ' I 76 . ' I
1 1981 1 2.9 I 7.4 , .
1 1*2 1 2.8 1 4.7 ' I
1 1983 ' I 3.6 1 3.3 ' I
I 1984 ' , 29 . ' , 52 . ' •
1 1985 ' • 26 • • . 64 . '
1 1986 I , 33 . . • 59 . I ,
1 1*7 • • 3O . • , 60 . ' I
MEAN ' I 3.O ' I 60 I ' I
MAX 1 4.0 ' I 84 . ' I
MIN I I 23 . ' I 37 . ' I
N 1 10 I I 9 $
SD I I 0.60 ' I 1.67 ' I
MEAN ' I 30 I ' I S5 . ' I
MAX I 3$ I 7.6 1
MIN I I 24 p ' I 32 • ' I
N I 15 1 15 I ,
SD ' I O33 . • I 1.33 I

LOWER BEVERLY LAKE
Very good seasonal coverage of water quality conditions of Lower Beverly Lake was provided by sampling programs on Oak Bay and on the eastern and central areas of the lake.
Water clarity was lover and chlorophyll concentrations higher by the end of the summer than they were at the beginning of the sampling program. This pattern of seasonally increasing productivity as the summer progresses was evident in Lower Beverly Lake during 1986 as well and is a characteristic of moderately productive lakes.
The results indicate that although Lower Beverly Lake is a
productive body of water, Secchl disc visibility is
satisfactory for swimming and bathing use of the lake and nuisance algae are not a problem.

LAKE z LOWER BEVERLEY LAKE TWP z SOUTH CROSBY, BASTARD COUNTY s LEEDS
ID MMBER a 12—0017-012-01
WATERSHED AREA SLWACE AREA MAX DEPTH VOLUME
• 281.50 1 766.0 a 25.90 a 70.2
SHORELI NE COTTAGES RESORTS X CROWN LAND
a 44.00 km. a 247+ I3HOMES a 4 (272) aO
OAk BAY tENTRK MS EAST B LOCATJUE
NOTE : Based an ins then 6 readings. H Recreatfanal lakes included.
sq.km ha. S. sill Cu. S.
SA*LE DATE I SEWII DEPTH I CILOPOPIfYLL A I
(IUI/H/YY) I (DETERS) I (US/U I
—t—— ———t————————— t SAIWII DATE I SECCNI DEPTH I CILOROPHYU. A:
1 (MIDDIYY) I CItiES) 1 (116/LI I
+ ——I ————+ — I 04/20/87 1 2.1 1 2.2 05/18/87 1 2.1 1 6.0
1 05/31/87 1 1.9 1 8.1
1 06/21/87 1 2.1 1 4.5 06/28/87 1 2.0 1 4.6 07/15/87 1 1.7 8.8 07/24/87 1.8 1 9.8 1
1 07/29/87 1 1.7 1 7.4
08/02/87 1 1.8 1 11.0 1 08/09/87 1 1.7 1 1.4 1
08/23/87 1 1.5 1 6.7
1 09/07/87 1 1.5 1 15.0 4 + 4———-— —4
1 06/02/87 1 2.9 1 2.0 1
1 06/17/87 3.0 1 4.1 1
1 06/22/87 1 2.9 1 3.0 I
1 07/02/87 1 2.9 I 9.3 1
1 07/09/87 I 2.9 1 3.7 1
I 07/17/87 1 3.3 1 3.0 1
I 07/21/87 1 2.4 I 6.4 1
I 1 2.4 1 4.0 08/03/87 1 2.1 1 5.3 1
1 08/05/87 1 2.9 1 6.3 1
I 08/20/87 1 2.1 1 6.7 1
1 (4/26/87 1 2.7 1 6.3 1
DEAN 1 2.4 1 9.! 1
NA! 1 3.5 1 14.6 1
Nil 1 1.7 1 3.9 1
U I I
IA LV
I I
IA IV I I
SD 1 0.55 3.60 1
DEAN • I 18 . • I 71 . ' I' HA' , I 2.1 • I 150 . ' I
MIN I I 15 I I I
I I 12
I I
I I I I
+ + —I

LAKE : LOWER BEVERLEY LAKE TWP : SOUTH CROSBY, BASTARD COUNTY : LEEDS
ID NUMBER : 12—0017—012—01
WATERSHED AREA SURFACE AREA MAX DEPTH VOLUME
281.80 : 766.0 : 25.90 : 70.2
SHOREL I NE COTTAGES RESORTS X CROWN LAND
44.00 km. 247 + 13 HOMES 4 (272)
:0
VARIOUS OPEN WATER LOCATIONS
+ + +
NOTE : Based on less then 6 readings. it Recreational lakes included.
sq.km ha. m. mill cu. m.
4 + t t I SAMPLE DATE I SECCHI DEPTH I CHLOROPHYLL A
(YEAR) (METERS) I (US/L) + + +
1971" 1 2.0 9.0 1975" 1 3.5 6.! 1977 1 2.4 7.8
1 1978 1 2.4 5.4 1 1981 1 2.5 1 9.6
1982" 1 2.4 1 3.9 1983" 3.0 1 8.6 1984" 2.2 1 12.9
1985 1.7 13.6
1986 1.7 1 14.6
1987 1 2.3 1 6.1
MEAN 1 2.4 I 89 . I
MAX ' I 3S I ' I 14.6 :
MIN I I 17 • • I 3.9 •
N I
I • I 11 I
SD I 053 • 354 I

HAZINAW LAKE
Reasonably good seasonal coverage of water quality conditions in Nazinaw Lake was provided by two separate programs. Although water clarity and chlorophyll levels varied from one sampling date to the next, there was no apparent seasonal pattern. The higher Secchi disc visibility readings for Hungry Bay may be the result of individual subjectivity in interpreting the disappearance of the disc rather than a reflection of better water clarity.
The results indicate that Mazinaw Lake has very good water clarity with very little algae.
Chlorophyll concentrations were lower than those measured in the lake during 1986. The summer of 1987 was much drier than the weather experienced during the previous summer. It is believed that reduced amounts of surface runoff limited the supply of algae producing nutrients available to the lake over the growing season with a resulting improvement in water quality. Similarly low productivity was documented in Hazinaw 1983 which was also a year with a dry summer period.
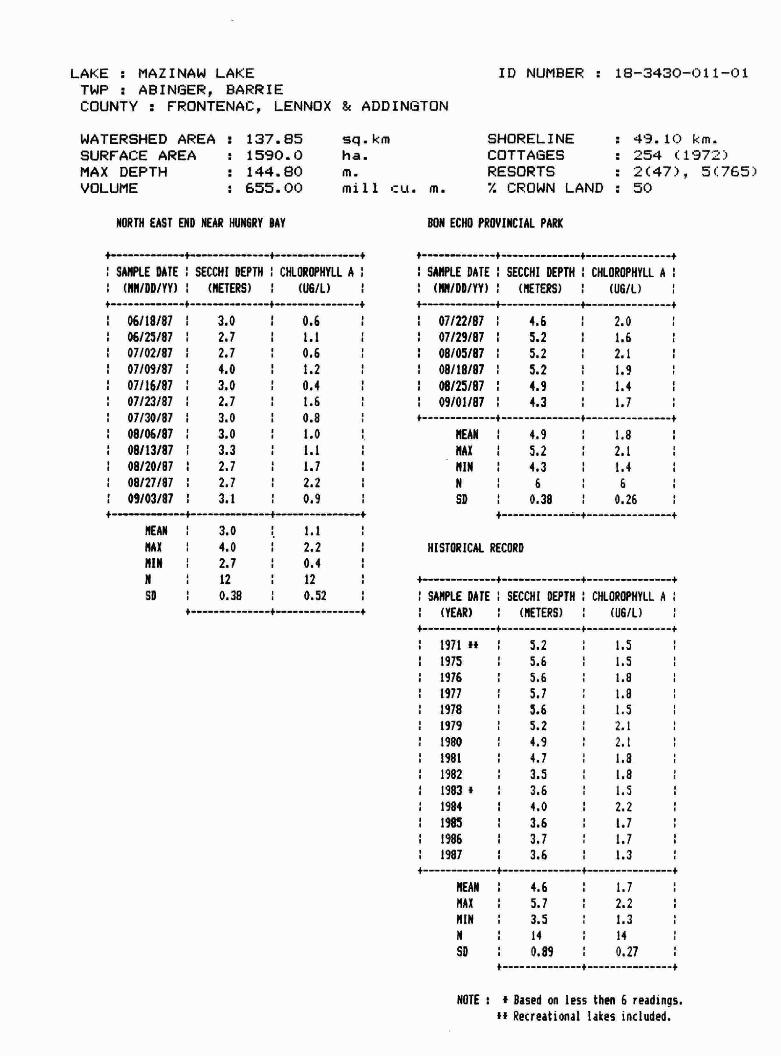
LAKE MAZINAW LAKE TWP : ABINI3ER, BARRIE COUNTY : FRONTENAC, LENNOX & ADDINGTON
ID NUMBER : 1B—3430—011—01
WATERSHED AREA : 137.85 SURFACE AREA : 1590.0 MAX DEPTH : 144.80 VOLUME : 655.00
sq. km ha. m.
mill cu. m.
49. 10 km. 254 (1972)
NORTH EAST END NEAR HUNGRY BAY 80$ ECHO PROYINCIAL PARK
SAMPLE DATE 1 SECCHI DEPTH I CHLOROPHYLL A
(MM/DD/YY) (METERS) (US/I) SAIIPLE DATE I SECCHI DEPTH I CHLOROPHYLL A I
I (M/DD/YY) (METERS) I (US/U
NOTE * Based on less then 6 readings. If Recreational lakes included.
SHOREL I NE COTTAGES RESORTS 2(47), 5(765) % CROWN LAND 50
1 06/19/87 1 3.0 1 0.6 1 1 07/22/87 4.6 2.0 1 06/25/87 1 2.7 1 1.1 : 1 07/29/07 1 5.2 1 1.6 1 07/02/87 1 2.7 1 0.6 1 1 08/05/87 1 5.2 1 2.1 1 07/09/87 1 4.0 1 1.2 : 1 08/18/87 5.2 1.9 1 07115/87 1 3.0 1 0.4 1 1 08/25/87 1 4.9 1.4 1 07/23/81 2.7 1 1.6 1 09/01/87 1 4.3 1 1.7 1 07/30/81 I 3.0 1 0.8 1
+ + +
1 08/06187 1 3.0 1 1.0 1. MEAN 1 4.9 1 1.8
1 08/13/87 1 3.3 1 1.1 1 MAX 5.2 1 2.1 1 08/20/87 1 2.7 1 1.7 1 MIN 4.3 1.4 1
1 08121/87: 2.7 1 2.2 1 N 6 1 6
1 09/03/87 1 3.1 1 0.9 1 SD 1 0.38 1 0.26
MEAN ' I 30 ' I_ 11 . ' I
MAX ' I 40 ' I 22 • ' I
MIN ' I 27 . ' I 04 . ' I
N I I 12 • I 12 ' I
SD ' I 038 . ' I 052 . ' I
HISTORICAL RECORD
1 SAMPLE DATE I SECCHI DEPTH I CHLOROPHYLL A
1 (YEAR) 1 (METERS) (US/I)
S2 ' 15 1 1971" • . I
1 1975 • 56 ' 15 I I I
1 1976 • . I
• S6 18 S7 ' 18 1 1977 . ' .
1 1978 56 ' 15 I I •
1979 • 52 ' 2I I • I I
1980 I 49 21 I . I . I
I 47 ' I 1981 I . , 1.8
1 1982 . . 3S • 18 I
1 1983' I 36 , 15 I • I I
1 1984 • . I I • 40 • 22 .
I I 1985 • 3.6 1 1.7
1986 I 37 • 11 I . t . I
2987 • 36 1 13 I . I . I
+ — + + 4.
MEAN • 46 • 17 I . I
I I . I
I • 3.5 1 1.3
N ' 14 • 14 I I I
SD ' 089 ' 027 I I I

MINK LAKE
A total of four samples were collected from each of two locations from August 3 to September 27.
Both the eastern and western areas of the lake contain water with good clarity and relatively low levels of algae.
The historical record provides no evidence of any continuing trend towards improving or deteriorating conditions in water quality in Mink Lake.

LAKE MINK LAKE TWP WILBERFORCE COUNTY RENFREW
WATERSHED AREA SURFACE AREA MAX DEPTH VOLUME
SHORELINE COTTA GES RESORTS X CROWN LAND
119 2 (102) 4)
+ + + +
MEAN
MAX
MI N
p4
'I C I C
5.2 3.7
4 4
SD 1 1.03 u.B3
1973
:975
1977
1378 **
:979
1380
1981
1382 +
1384 n :335 4+
1986t 1987
I 74 18 I ')3 I
I I *
3.5 2.2
4.2 .3.1
4.1 5.2 I I
I I
I -, I 7
.2.2 4.7 I
J,I.j
• 'I C
+ + +
+ + + +
MEAN
MAX I
fiN I
4.2 5.2 17
I 7 I
I I a
3D Q.44 1.08
4. + +
ID NUMBER 1S—3&3C-C':B—Ol
: 40.20 sq.km : 556.0 ha. : 13.70 m.
: 72.3 miii cu. m.
SITE I
km -
SITE 2
SAMPLE DATE 1 SECCHX DEPTH I CHLOROPHYLL A
(MM/DO/fl) (METERS)
1 08/03187
1 08/29/87 1 09/13/37
09/27/87
I S..
3.0 1 2.5 e , .•% -. V
3.1 3.7
SAMPLE DATE I SECCHI DEPTH
+ + 4
08/03/87 1.3
08/29/87 3.2 2.
09/13/87 2.6
09127187 3.1
MEAN 1 2.0
lAX I
6
N 4 4
SD 0.29 1.21 + *
HISTORICAL
+ + + +
SAMPLE DATE SECCHI I •:?LCRCPHYLb A
(YEAR) 1 (METERS) 1 (U6/L) I
3.5 : 2.9
NOTE Based on ess than 6 readings. +4 Recreational lakes included.
MOIRA LAKE
A good sampling program was carried out on each of the east and west basins of Moira Lake during 1987. Chlorophyll concentrations rose markedly in July in both basins of tloira Lake and remained high for the duration of the sampling programs. In the west basin algal turbidity became high enough that water clarity was unsuitable for swimming and bathing.
There have been a long history of water quality investigations of Moira Lake dating back to 1960 with major surveys in 1964, 1967 and 1972 to 1975. These investigations established that Moira Lake is naturally eutrophic and productive of weeds and algae.
The historical record results indicate there has been a continuing improvement In water quality since 1973. In that year sewage treatment facilities at the Village of Madoc were upgraded. Sewage is discharged to the west basin via Deer Creek in the spring and fall of the year, before and after the growing season for aquatic plants, respectively. The sewage is treated for the removal of phosphorus before It is discharged.

LAKE : MOIRA LAKE : EAST BASIN 1141' : HUNTINGTON COUNTY : HASTINGS
WATERSHED AREA : 596.00 SURFACE AREA : 611.0 MAX DEPTH : 11.00 VOLUME
ID NUMBER : 17—0026—002—01
EAST BASIN HISTORICAL RECORD
NOTE : * Based on less then 6 readings. it Recreational lakes included.
sq.km SHORELINE ha. COTTAGES m. mill cu. m.
: 14.70 km.
RESORTS X CROWN LAND : 0
SANFLE DATE : SECCHI DEPTH CHlOROPHYLL A
I (MM/DDIYY) (PETERS) 1 UJG/L)
SAMPLE DATE I SECCHI DEPTH I CHLOROPHYLL A
1 (YEAR) (PETERS) I (VEIL)
1 06/13/87 1 4.1 1 3.2 1
1 06/24/87 1 4.0 1 1
1 07/04/87 1 2.1 1 3.1 1
1 07/13/87 1 310 1 6.1 1
1 07/25/87 1 2.4 1 8.8 1
1 01/30/87 1 2.1 1 34.0 1
1 08/06/87 1 2.1 1 10.0 1
1 08/16/87 1 2.4 1 12.0 1
1 08/24/81 1 2.1 1 17.0 1
1 08/30/87 +—————
1
+
2.2 1
+
16.0 1
I 19724* 1 1.2 1 37.8 I
1 1974 1 2.1 1 13.8 :
1 1977 1 2.4 1 10.8 1
1 1978 1 2.0 1 12.0 1
1 1979* 1 2.0 1 15.3 1
1 2981 1 3.1 1 7.6 1
1 1982 1 2.0 1 11.0 1
1 2983 1 1.8 1 15.2 :
1 1984 1 2.3 1 15.9 ;
1 1985 1 2.0 1 14.7 1
1 1986 1 1.9 1 11.0 :
1. 1987 1 2.7 1 12.2 1 MEAN ' I 27 ' I 122 I
I I I
I I I
I I I I
I I I
I I I
I I I I
I I
1 I I
1
I i

LAKE : MOIRA LAKE : WEST BASIN TWP : HUNTINGTON COUNTY : HASTINGS
ID NUMBER : 17-0026—003-01
WEST BASIN HISTORICAL RECORD
WATERSHED AREA : 546.00 sq.km SHORELINE : 9.30 km. SURFACE AREA : 216.0 ha. COTTAGES : 64 (1972) MAX DEPTH : 7.30 m. RESORTS :
VOLUME : 7.47 miii Cu. in. X CROWN LAND z 0
SAMPLE DATE : SECCHZ DEPTH 1 CHLOROPHYLL A
(MM/DD/YY) 1 (METERS) (06/1) + 4. +
SAMPLE DATE I SECCH! DEPTH I CHLOROPHYLL A
1 (YEAR) 1 (METERS) (U6/L) + + + +
06/04/87
06/10/87 06/17/87
06/24/87 07/02/87 07/08/87 07/21/87
07/27/87 08/05/87
08/10/87 08/24/87 09/01/87 09/09/07
2.7 1 1.6
2.9 1 2.1
2.4 4.3 2.6 3.6 2.0 1 6.5 2.3 1 5.3 1,8 8.5 1.5 1 14.0
1.4 15.0
1.1 19.0
0.9 1 23.0
0.8 25,0
1.1 21.5
1 1972 *4
1973 1*
1974
1979
1983
1984
1986
1987
' Il l I 39.0
I6 15.6 I I
1.7 I 13.8
19 I 9.8 S I
I8 ' 6.9
2O ' 16.5 I I
1 1.5 I 9,5
i 1.8 1 11.5 + + + +
+ + + +
MEAN 1 1.7 15.3
MAX 1 2.0 : 39.0
MIN 1 1.1 6.9
N 8 8
SD 1 0.28 10.10
MEAN 1.8 1 11.5 t + +
MAX 1 2.9 1 25.0
MIN 0.8 : 1.6 NOTE 4 Based on less then 6 readings.
N 13 : 13 " Recreational lakes included.
SD 0.73 : 8.48 + + +

MOSQUE LAKE
A total of six samples was collected from each of three locations on Mosque Lake, the small west basin and the north and south areas of the main basin.
The three locations shared similar water quality in terms of chlorophyll concentrations, but Seccbi disc visibility was appreciably better in the main part of the lake than it was in the west basin. In previous years the main basin has had lower levels of chlorophyll than the west basin as well as better water clarity.
The results from all three sampling locations indicate that Mosque Lake has excellent water quality.
Water clarity was higher and chlorophyll concentrations lower than those measured in the lake during 1986. The summer of 1987 was much drier than the weather experienced during the previous summer. It is believed that reduced amounts of surface runoff limited the supply of algae producing nutrients available to the lake over the growing season with a resulting improvement in water quality. Similarly low productivity was documented in Mosque Lake in 1983 which was also a year with a dry summer period.

LAKE : MOSQUE LAKE TWP MILLER, CLARENDON COUNTY : FRONTENAC
WATERSHED AREA : 6.21 SURFACE AREA 138.0 MAX DEPTH : 34.10 VOLUME 9.7
sq. km ha. m. mill cu. m.
ID NUMBER : 18-3430—017-01
SAMPLE DATE SECCHI DEPTH CHLOROPHYLL A
(MM/DO/fl) (METERS) W8/L) + + + +
4 1 t C m VQFL?fU$ i
07/15/87 4.0
07/15/97 5.5
08/22/87 5.2
09/05/87 4.9
10/11/87 4.6 1.2 + + + +
MEAN ; 5.0 1.4
!
5
SD 0.58 0.83 + 1 +
+ + + +
1.2 1
I I
MEAN 5.2 MAX 5.5
MIN 4.6
N 1 6 6
0.34 0.66
+ + +
NORTH & SOUTH BASINS COMBINED
+ + + +
SAMPLE DATE SECCHI DEPTH I CHLOROPHYLL A
(YEAR) (METERS) I (U6/L) + + 4. +
1976ff 6.3 2.7 1977 5.2 1 2.5
1978 5.5 2.5
1979 5.6 2.1
1980** 6.0 2.4
198! 5.6 2.4
1982 5.0 2.1
1983 5.4 1.4
1984 5.2 2.7 1985 : 4.9 1.8
1986 4.6 2.1
1987 5.1 1 1.3 + 4. + +
MEAN 5.4 1 2.2
MAX 1 6.3 1 2.7 MIN 1 4.6 1 1.3
N 1 12 12
SD 0.47 0.47 + + +
NOTE * Based on less then 6 readings. if Recreational lakes included.
NORTH BASIN
SHORELINE : 13.20 km. COTTAGES : 43 RESORTS : 1 (3)
X CROWN LAND : 65
SOUTH BASIN
2.9
1.2 0.8
1.1
SAMPLE DATE SECCHI DEPTH I CHLOROPHYLL A
(MNIDD/YY) 1 (METERS) 1 (06/1) + + + +
1 06/27/87 1 5.5 1 0.3
1 07/15/87 1 5.0 1 1.1
09/06/87 5.5 1 1.4
1 08/22/87 5.2 0.9
1 09105/87 5.2 1.0
10/11/87 4.6 2.3

LAKE : MOSQUE LAKE TWP : MILLER, CLARENDON COUNTY r FRONTENAC
ID NUMBER z 18—3430—017—01
SHORELINE : 13.20 km. COTTAGES r 43 RESORTS u 1 (3) X CROWN LAND c 65
WEST DASIM WEST OASIS HISTORICAL RECORD
SAMPLE DATE SECCIII SEPT11 I CILIWOPWYLL A I
(MM/DDIYY) (METERS) (LM/L)
SAMPLE RATE I SECCHJ DEPTH I CItOROPHYIL *
(YEAR) 1 (METERS) I (US/I)
1982
• 1983 • I
• '1984 • I
I I • 1985
I • 1986 • I • 2987
'I
WATERSHED AREA u 6.21 SURFACE AREA : 138 • 0 MAX DEPTH VOLUME
1 34.10 9.7
sq. km ha. S. mill cii. m.
1 06/27/87 1 4.0 00/06/87 : 5.5 08/06/87 4.6
1 08/22/87 1 4.0 1 09/05/87 1 3.8 1 10/lI/Si 1 3.7
MEAN 1 4.3 MAX 1 5.5 MIll 3.7
• A • VI
1.7
0.9 'IS
1.5
I 1.3 LB
1 0.2
• I I9761* 4.8 • I I
1977 • 3.9 I I I
a I I 4.5 • 1978
1 1979 1 4.6 19B0. I I I 5.1 1981 4.5 I I I
1 6 1 6
SD 1 0.68 1 0.63
1 6.9 1 4.3 1 5.6 1 4.0
3.9 2.5
1 2.0 2.1
1 3.1 2.4 1.3
4.0 4.2
1 4.6 3.7 3.8
1 4.3
MEAN 1 4.3 un 1 5.1 MIN 1 3.7 H 12
SD 0.43
3.5 6.9 1.3
12
1.66
NOTE : Based on less then 6 readings. If Recrntionl Lakes included.

MUSKRAT LAKE
A good sampling program was carried out on Muskrat Lake during 1987 with a total of ten samples collected from July 1
to September 2. While the presence or absence of a spring peak in chlorophyll cannot be confirmed the results clearly show an increase in chlorophyll concentrations and a deterioration in water quality during the month of August. This seasonal pattern of increasing productivity as the summer progresses is characteristic of the lake. In some years late summer algal blooms detract from the aesthetic appeal of the water and interfere with the use of the lake for swimming and bathing.
The historical record continues to indicate an improvement in the water quality of Muskrat Lake since improvements to the sewage treatment facilities serving the Village of Cobden in 1981 and other efforts to reduce nutrient inputs to Muskrat Lake.
Stop logs were removed from the control dam at Pembroke for a three year experimental period to determine it a further improvement in water quality or other benefit to Muskrat Lake can be brought about. The results this year show that water quality has deteriorated compared to conditions in Muskrat Lake during the previous year. This trend relate to annual variability in weather conditions in which case it may reverse Itself or it may be due to other factors such as the new operating level for the control dam. Continuing water quality monitoring Is required to clarify this trend and the reasons for it.

LAKE u MUSKRAT LAKE fliP : WESTPIEATH, ROSS COUNTY :
ID NLUWER * 18—4810—002-01
SHORELIPE s 34.00 km. s 132 + 21 HOUSEE
RESORTS i 5 (357) ZCROWNLANDs 0
MID LAkE HISTORICAL RECORD
MITE * Based on less then 6 readings. 4* Recreational lakes included.
WATERSI€D AREA : 481.00 SURFACE AREA i 1202.0 MAX DEPTH VOLUME
t 64.00 r 213.2
sq • km ha. m. sill Cu. S.
SWU DATE 1 swuii i&m : ULflHYI.L Al (NMID*IYY) 1 (METERS) I (US/I)
SAlUtE DATE I SECOII DEPTH I CILOROPHYIL A I
(YEAR) 1 (METERS) I (US/I)
I 07101/07 1 3.5 1 07/08/87 1 3.3 I 07/VIOl 3.2 1 07/21/87 3.0 1 08/06/87 1 2.6
08/12/87 2.1 08/19/87 1 1.7
08/26/87 1 2.4 09/02/87 1 2.3
1 2.6 3.2
1 8.7 U
U *.Ji
1 9.4 12.0
1 17.0
1 6.0 9.5
: 1977 1 1.7 1 15.5 1
1 1978*' 1 2.8 1 12.0 1
1 1979 1 2.4 1 10.7 1
1 1981 1 1.6 1 29.4 1
1 1982*' 1 2.3 1 14.9 1
1 1983 1 23 1 14.0 1
1 1914 1 3.1 1 12.0 1
1 1985 1 4.4 1 3.5 1
1 1986 1 3.4 1 10.4 1
1
4.
1987 1
+
2.1 1
—4.———
9.3 1
+ MEAN 1 2.7 1 9.3 NA! 1 3.5 1 17.0
NIH 1 1.7 : 2.6 1 9 1 9
SD 1 0.61 4.38
MEAN • U 27 . ' U 132 . U
NA! ' I 44 • U U n4 U ' U
N1N ' U 16 ' U 3.5 U
U
N 1 10 U IO U U
SD ' U 083 . U
U 6,65 U
U

NORWAY LAKE
One sample for the month of May and another nine samples running from July 5 to Oct 11 were collected from Norway Lake. Water clarity was very good and the lake has very low levels of algae.
Water clarity was higher and chlorophyll concentrations lower than those measured in the lake during 1986. The summer of 1987 was much drier than the weather experienced during the previous summer. It Is believed that reduced amounts of surface runoff limited the supply of algae producing nutrients available to the lake over the growing season with a resulting improvement in water quality.

LAKE : NORWAY LAKE TWP : BAGOT, BLYTHFIELD COUNTY : RENFREW
WATERSHED AREA : 14.40 SURFACE AREA : 271.0 MAX DEPTH : 36.60 VOLUME : 25.38
CENTRE or LAKE
ID NUMBER : 18-3490-028—01
HISTORICAL RECORD
SAMPLE DATE SECCHI DEPTH CHLOROPHYLL A
(MMIDD/YY) : (METERS) th6/L) SAMPLE DATE 1 SECCHI DEPTH I CHLOROPHYLL A I
(YEAR) (METERS) (USIL) + + + +
+ + +
NOtE : f Based on less then 6 readings. *4 Recreational lakes included.
sq.km SHORELINE ha. m. mill cu. m.
: 12.90 km. COTTAGES : 124 RESORTS : 0 X CROWN LAND : 99
05131/87: 5.5 0.4 1 1978*; 1 4.8 I 2.4 1
07/05/871 5.8 : 1.1 1 : 1979 1 4.7 1 2.5 :
:07/29187' 52 20 1 1981* I 51 1 15 :
:08/05/87: 5.2 1 0.5 : 1982* 1 4.8 1 1.4 :
:08/12/87: 6.1 1.0 : 1 1983 : 5.1 1 3.3 :
:08/20/87: 5.3 1.9 1 1 1984* : 4.6 1 5.0 :
08/27/87 : 5.2 1 1.4 1 1985** : 5.4 1 1.6 :
09/06/87 : 4.3 1 1.8 : 1 1986* : 5.1 1 2.7 :
:09/24187: 5.8 1 3.1 : 1987 : 5.4 1 1.5 :
10/11/87 : 6.1 1 2.2
+ + + + MEAN
MAX
I
1
5.0 5.4
1
1
2.4
5.0
:
: MEAN 5.4 MAX 1 6.1
1.5
3.1
1 4.3 1 0.4
N 10 1 10
SD 0.54 1 0.83
MIN I 4.6 1 1.4
N I 9 1 9
SD I 0.29 1.17

OPINICON LAKE
A comprehensive sampling program which ran from June 7 to October 10 provided very thorough seasonal coverage of water conditions in Opinicon Lake. Chlorophyll concentrations were generally higher and Secchi disc visibility generally less at the end of the season than at the beginning. This pattern of seasonally increasing productivity has been observed previously in Opinicon Lake.
Water clarity was higher and chlorophyll concentrations lower than those measured in the lake during 1986. The summer of
1987 was much drier than the weather experienced during the previous summer. It is believed that reduced amounts of surface runoff limited the supply of algae producing nutrients available to the lake over the growing season with a resulting improvement in water quality. Similarly low productivity was documented in Opinicon Lake in 1983 which was also a year with a dry period.
The results indicate Opinicon Lake has good water quality. and is well suited for recreational use purposes.

LAKE z OPINICON LAKE TWP i BEDFORD, SOUTH CROSBY, STORRINGTON COUNTY . rRONTENAc, LEEDS
ID NUMBER : 12—0004-016—01
WATERSHED AREA z 580.00 SURFACE AREA : 785.0 MAX DEPTH i 9.15 VOLUME s 38.61
SHOREL I NE COTTAGES
52.00 km. : 120 (1971)
DETIEEN SWE & HIflLEIERRY ISUNDS HISTORICAL RECORD
+ I + —4
I SA*IE DATE I %cCK1 DEPTh CM.ORGPHYLL A I
(*IDD/YY) NETERS) I (88/I) I DATE I SECCH I DEPTH I CHLOROPHYLL A
(YEAR) I (NETERS) I (116/I)
sq.km ha. m. mill Cu. ii.
RESORTS : 6 (104) X CROWN LAND : 0
1 06/07/871 3.0 1 0.2 : 11971*' 1 2.9 1 4.1
:06/14/87: 3.2 1 3.1 1 1 I975n1 3.0 1 4.7
1 06/21/81 1 4.1 1 1.8 1 1 1977 1 2.8 1 3.9 :06/28/87: 3.2 1 0.6 1 11978 1 3.0 1 5.4
:07/05/87: 3.8 1 2.3 1 :1979 1 3.3 1 5.6
1 07/12/87 1 4.1 1 2.5 I 1 1980 1 3.2 5.8 :07/22/871 3.7 1 3.4 1 11981 : 3.2 : 4.1
107/28/87; 3.7 1 3.4 1 11982 1 3.1 1 4.1
:08/04/87; 3.0 1 4.2 1 11983 1 3.2 3.3
:08/10/87: 3.3 1 4.3 1 11984 1 3.1 1 5.8 1 08/17/87 1 3.2 1 2.3 1 1 1985 1 3.1 1 3.8
08/24/87 I 2.4 1 5.5 1 1986 1 3.1 1 5.1 1 08/31/87 1 2.9 1 5.6 1 1 1981 3.3 1 3.7
09/07/87 I 3.4 1 3.9 1 + + —4 +
109/13/871 3.7 1 3.9 DEAN: 3.1 1 4.6 1 09/21/87 1 2.9 1 7.0 1 NAI 1 3.3 1 5.8 1 09/27/87 1 2.9 1 5.9 1 fIN 2.8 1 3.3 I
1 10/10/871 3.3 1 6.2 1 N 1 13 1 13
SD 1 0.15 1 0.86 1 3.3 1 3.1 1
fAX 1 4.1 1 7.0 1
fIN 1 2.4 0.2 1
N I I
I I
I I
I
1 1
NOTE : • land on Ins tSn 6 riadtngs. *4 Recreational lakes tncludS.

OTTER LAKE
Two separate programs resulted in the collection of 18 samples from June 13 to September 27. Chlorophyll concentrations were slightly higher by the end of the season than they were at the beginning.
Water clarity was higher and chlorophyll concentrations lover than those measured in the lake during 1986. The summer of 1987 was much drier than the weather experienced during the previous summer. It is believed that reduced amounts of surface runoff limited the supply of algae producing nutrients available to the lake over the growing season with a resulting improvement in water quality.
The results indicate Otter Lake has little algae present in its water and the clarity is satisfactory for recreational use purposes such as swimming and bathing.

LAKE : OTTER LAKE ID NUMBER : 18—0033-024—0 1 TWP s BASTARD, SOUTH ELMSLEY, SOUTH BURGESS, KITLEY COUNTY : LEEDS
WATERSHED AREA : 46.55 SURFACE AREA : 602.0 MAX DEPTH i 36.60 VOLUME : 60.46
sq. km ha. m. mill cu. m.
SHORELINE COTTAGES
20.1 km. : 291 + 5 HOUSES
STATIOM 2 1 — FRAYN ROAD
SAMPLE DATE 1 SECCHI DEPTH I CHLOROPHYLL A I
I (NM/DD/YY) (METERS) 1 ((16/1) 1
t 1 06/14/87 1 3.4 1 2.4 1
1 06/28/87 1 3.0 1 (.0 1
1 07/22/87 1 2.4 1 2.4 1
1 07/19/87 1 2.4 1 2.6 1
1 07/25/87 1 2.1 1 1.8 1
1 08/02/87 1 2.3 1 2.9 1
1 08/15/87 1 2.1 1 2.2 1
1 08/29/87 1 2.7 1 2.6 1
1 09/06/87 1 2.7 1 2.4 1
1
4
09/27/87 1
4 3.4 1
4
3.3 — 4
SAMPLE MTEI SEWN! DEPTH 1 CHLOROPHYLL A I
1 (II/DS/YY) I (METERS) 1 ((16/1) 4——— +—————————.-————t———— +
06/13/87 1 3.2 3.1
1 07/12/87 1 2.6 1 2.2 I 07/22/87 1 2.6 1 3.8
07/26/87 1 2.4 1 2.6 1
08/04/87 1 2.6 1 3.3 08/12/87 1 3.0 I 2.8
1 08/19/87 1 2.9 4.0 1 09/02/87 1 2.9 1 3.9 + + 4 +
MEAN 1 2.8 1 3.2
NA! 1 3.2 1 4.0 NIN 1 2.4 I 2.2 U I C I I II I C I C I
SD 1 0.27 1 0.66 + + 4
HISTORICAL RECORD
SAMPLE DATE I SECCHI DEPTH I C1tOROPHYIL A
(YEAR) 1 (METERS) I (US/I) 1
+ + I +
1975ff 3.4 1 2.4 1976 1 3.1 1 3.8
1 1977 1 3.0 1 3.2 I
1978 3.3 1 3.0 1 1979 1 3.1 1 3.4 1
1980 1 2.7 1 3.4 1 1981*4 1 3.1 1 3.2 1 1982*4 1 3.1 1 2.2 I
1 1983 1 3.2 1 2.1 1
1 1984 1 3.0 1 3.2 1 1985 1 3.0 1 2.3 1 1986 1 2.9 1 3.4 1 1987 1 2.7 1 2.7
MEAN 1 3.0 MAX 1 3.4 MIN 1 2.7 N 1 13
SD 1 0.21
1 2.9 1 3.8 1 2.1 1 13
1 0.55
RESORTS : 6 (214) 7. CROWN LAND • 1
MEAN 1 2.7 MAX 1 3.4 NiH 2 2.1 K 1 10
SD 1 0.49
• 2.4 I
I I I
• 1.0 I I
• Lo s I I
0.62 1
NOTE : • Based on Less then 6 readings. 44 Recreational lakes included.

OTT! LAKE
A very good sampling program was carried out with a total of 12 samples collected from each of two locations on otty Lake from June 9 to August 30. No seasonal pattern in the results is discernable. The two locations share similar water quality.
The Secchi disc visibility and chlorophyll results indicate Otty Lake has very good water quality.
Water clarity was higher and chlorophyll concentrations lower
than those measured in the lake during 1986. The summer of 1987 was much drier than the weather experienced during the previous summer. It is believed that reduced amounts of surface runoff limited the supply of algae producing nutrients available to the lake over the growing season with a resulting improvement in water quality. Similarly low productivity was documented in Otty Lake in 1983 which was also a year with a dry summer period.

LAKE : OTTY LAKE TWP NORTH BURGESS, NORTH ELMSLEY COUNTY LANARK
ID NUMBER 18—0033—025—01
WATERSHED AREA : 47.9 SURFACE AREA : 625 MAX DEPTH : 27.4 VOLUME : 56.41
SITE 'A'
sq.km ha. m.
mill cu. an.
SITE '8'
SHORELINE : 35.4 km. COTTAGES : 336 + 41 HOUSEE RESORTS : 3 (27) X CROWN LAND : 0
+ + + +
SAMPLE DATE SECCHI DEPTH CHLOROPHYLL A
(MMJDD/YY) (METERS) WGIL) + + + +
o6/o9/r 3.0 0.6 06/15/87 4.0 2.3 07/02/57 4,0 1.3
I I I
I Li
07113/87 3.3 2.1
07/20/8? 3.0 2.7 07/27/87 4.3 2.6 1
08/04/87 4.9 2.5 1
08/10/87 4.0 1.9
08/17/87 4.6 1.9
08/24/87 5.2 2.1
08/30/87 4.0 1 2.9 + + + +
MEAN 4. 2.1
MAX 5. 2.9
3.0 0.6
N 12 12
SD 0.69 1 0.63 + + +
+ + + +
I SAMPLE DATE SECCHI DEPTH 1 CHLOROPHYLL A
(MM/DD/YY) 1 (METERS) (OS/L) 1
+ + + +
06/09/87 1 3.0 1 0.4 06/15/87 4.0 1 2.3
07/02/87 1 3.9 1 0.8 07/06/87 1 4.9 1.2
07/13/87 3.0 1 2.4 1
1 07/20/87 3.0 3.1
07/27/87 1 4.0 1 3.3 08/04/87 1 5.2 1 1.6
08/10/87 1 4.3 1.9
1 08/17/87 1 4.6 1 2.2 08/24/87 1 4.9 1 2.4 08/31/87 i 4.0 1 2.9
+ + + +
MEAN 4.1 1 2.0 1
MAX 1 5.2 1 3.3 1
MIN i 3.0 i 0.4 1
N i 12 1 12
50 1 0.77 1 0.90 1
+ + +

LAKE OTTY LAKE TWP : NORTH BURGESS, NORTH ELMSLEY COUNTY : LANARK
WATERSHED AREA 47.9 SURFACE AREA : 625 MAX DEPTH : 27.4 VOLUME : 56.41
HISTORICAL RECORD
ID NUMBER : 18—0033—025—01
SHORELINE : 35.4 km. COTTAGES : 336 + 41 HOUSEE RESORTS : 3 (27) X CROWN LAND : 0
SAMPLE DATE SECCHI DEPTH I CHLOROPHYLL A I
(YEAR) (METERS) : (116/1)
+ + + +
1 1971" 3.2 3.3 1973" 4.1 2.9
1 1974" 4.1 3.0 1 1975" 4.4 3.2 1 1976 4.5 2.7
1977 4.0 2.5
1978 4.2 3.2 1979 4.4 3.2
1980 4.5 4.1
1981 3.9 3.3 I Iflfl'. *7 I I
I L7QL I
I
1 I I
I I
i h.
1986 4.2 3.4 1987 4.! 2.1
+ + +
MEAN 42 31 MAX 4.7 i 4.2
NIH 2.2 • 2.0
N 16 16
SD 1 0.37 0.62 1
+ + +
NOTE * Based on less then 6 readings. *4 Recreational lakes included.
sq.km ha. m.
mill cu. in.
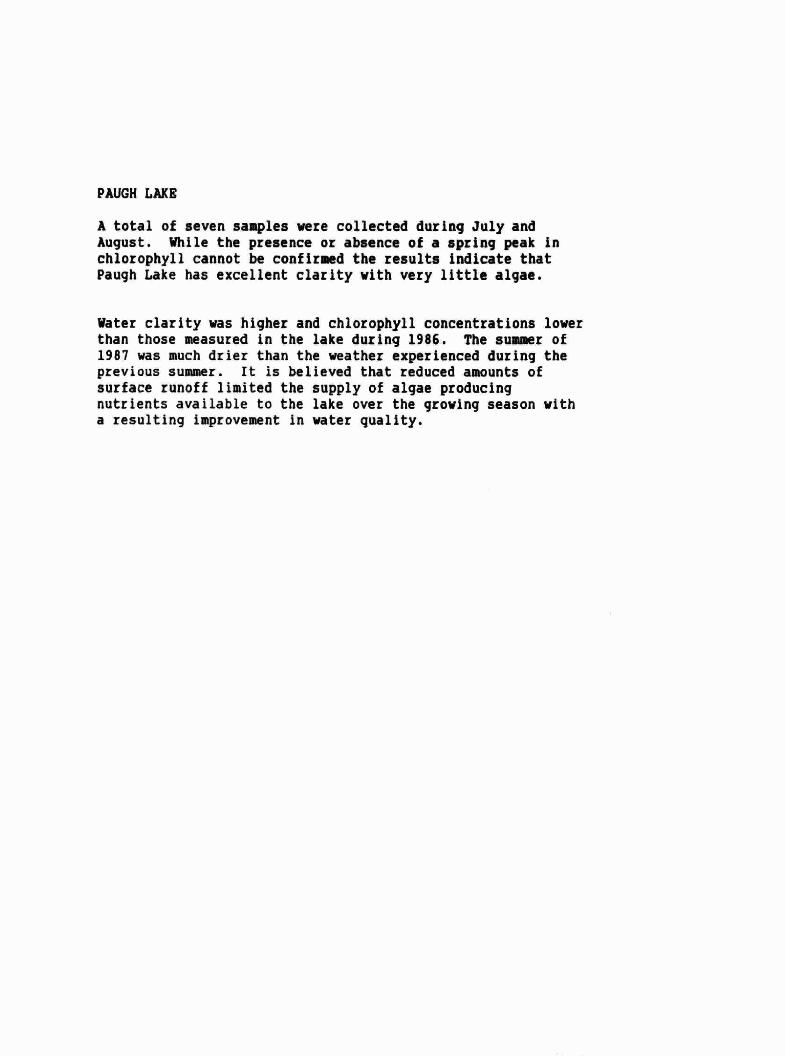
PAUGH LAKE
A total of seven samples were collected during July and August. While the presence or absence of a spring peak in chlorophyll cannot be con! irmed the results indicate that Paugh Lake has excellent clarity with very little algae.
Water clarity was higher and chlorophyll concentrations lower than those measured in the lake during 1986. The summer of 1987 was much drier than the weather experienced during the previous summer. It is believed that reduced amounts of surface runoff limited the supply of algae producing nutrients available to the lake over the growing season with a resulting improvement in water quality.

LAKE r PAIJSH LAKE TWP : BURNS, SHERWOOD COUNTY :
ID NLNIBER : 18-3690—009—01
WATERSHED AREA : 15.00 SURFACE AREA 713.0 MAX DEPTH . 51.80
z 100
sq. km ha. S. mill Cu. •.
SHOREL I NE * 18.00 km. *17
WEST Eli) (F LAKE NIBTIWICAL RECORD
NOTE : * Based on less thu S readinqs. *4 Recreational likes included.
RESORTS el(7) X cROI*1 LAND • 80
SAMPLE DATE I SECCNI DEPTH 1 CItIWOPHYLL A I
(NMIDDIYY) 1 (METERS) (06/1)
I SAMPI.E DATE I SECCHI DEPTH I CILONUPHYLL A I
1 (YEAR) (DETERS)
1
t————
07105/87 1 5.5 I 0.6
t 1
1 07/12/87 1 5.6 1 1.1 1
1 07/27/87 : 6.4 1 1.6 1
1 07/31/87 1 5.5 0.6 1
1 08/05/87 1 5.8 1 2.2 1
1 08/16/87 1 5.3 1 2.! 1
1 08/30/87 1 4.9 1 1.9 1
t———
1 1977" —t
: 5.4 1 1.5 1
1980 1 5.2 1 2.2 :
1 1911 1 5.3 1 2.0 1
I • & I
d, .L I
1 1983" 1 5.3 1 1.4 1
1 1984" 1 4.2 1 2.4 1
1 1985" 1 5.2 1 1.0 1
1986' 1 5.0 1 1.9 1
1987 1 5.6 1 1.4 1 DEM • p 56 • • I 14 • ' I
MM ' I 6.4 ' I 2.2 ' I
KIN ' I 4.9 ' I 0.6 ' I
N • I 7 • I 7 ' I
SD , I 046 • I 068 . ' I
+ I +
MEAN • I 52 . ' I 17 . ' I
MAX ' I Sk6 • I 24 . I
KIN ' I 4.2 ' I 1.0 I
N • I 9 • • 9 I I
SB , I 040 . ' I 046 . ' p

PIKE LAKE
A total of 18 samples collected from Nay 24 to November 1
provided very good seasonal coverage of water quality conditions in Pike Lake. Chlorophyll concentrations increased and water clarity declined as the season progressed. This pattern of seasonally increasing productivity as the summer progresses was evident in Pike during 1986 and is a characteristic shared by many other lakes including nearby Black Lake.
This late season increase in chlorophyll and reduction in water clarity probably did not interfere with recreational use of the lake. In general, the Secchi disc depth and chlorophyll record indicate Pike Lake has good water quality for recreational use purposes.

LAKE z PIKE LAKE TWP : NORTH BURGESS, NORTH CROSBY COUNTY : LANARK, LEEDS
ID NUMBER : 18-0033—028-01
WATERSHED AREA : 60.00 SURFACE AREA : 316.0 MAX DEPTH : 32.60 VOLUME • 26.50
CENTRE (N LAkE
sq • km ha. —-
mill cu. a.
NORTH END OF LAkE
I SAIIFtE DATE SECCHI DEPTH I CILIWOPHYLL A
(I'MIDD/YY} (METERS) I (US/I)
SAIVLE DATE SECCHI DEPTH : CHLOROPHYLl. A
I (IVI/DI/YT) (METERS) (US/LI
I 05/24/87 1 4.4 06/21/87 : 4.6
1 07/19/87 I 3.3 08/05/87 1 3.2
1 08/16/87 1 2.7 09/07187 1 3.1
09/27/87 : 2.9 1 10/11/87 1 2.6
1 11/01/87 1 2.9
1.4
1 2.5
1 4.0 7.3
1 9.4
14.0
9.6
+ + + +
PEAN 1 3.3 1 6.7 MAX 1 4.6 1 14.0
MEN 2.6 1 1.4
H 9 1 8
SD 1 0.72 4.22 + + +
; 5.4
1 6.0 6.1 5.0 5.0
1 6.1
1 8.3 1 14.0
1 16.0
MEAN 3.0 1.0 MX 1 3.3 I 16.0
DIN 1 2.6 1 5.0 N 1 9 1 9
SD 1 0.29 1 4.12
SAIRE DATE I SECCHI DEPTH I CHLOROPHYLL A I
(YEAE 1 METERS I (US/I)
SHORELIPE : 22.10 km. COTTAGES s 143 (1974) RESORTS z 2 (38) X CROWN LAND t 0
1 07/19/87 1 3.3 07/21/87 1 3.3
1 08/03/87 1 3.3 1 08/10/87 1 2.9 1 08/18/87 1 3.2 I 08/30/87 1 3.0
08/07/87 1 2.9 09/27/87 1 2.6 10/04/87 1 2.6
I 19751* 1 3.9 1 5.1 1
1 1976 1 24 : 6.6 1
1 1977 1 3.1 1 6.0 1
1 1978 1 4.2 1 4.3 1
1 1979 1 3.7 1 6.0 1
1 1* 1 3.8 : 6.5 1
1 1981 1 3.7 1 5.4 1
1 1982 1 2.5 5.4 1
1 1913*1 1 4.3 1 2.5 1
1 1984. 1 3.0 1 1.6 1
1 1985 1 2.6 1 5.5 1
I 1986 1 3.2 1 6.8 1
1 1987 1 3.2 1 7.4 1
MEANI 3.4 MAX 1 4.3 MIN 2.4 N 13
SD 1 0.63
5.8 1 7.6
2.5 13
I I I
•1—
NOTE Based on Less then 6 readings. It Recreational lakes incluJed.

RED HORSE LAKE
An extremely thorough sampling program was carried out on the east basin with a total of 20 samples collected from May 9 to November 18 while nine samples were collected on the west basin from July 19 to October 21. Chlorophyll concentrations were lower and water clarity somewhat better during the month of August and the first part of September in both basins of Red Horse Lake than during other times of the sampling period. This is in contrast to the situation during 1986 when water quality was a little better during the spring and fall than during the month of August.
Water clarity was higher and chlorophyll concentrations lower than those measured in the lake during 1986. The summer of 1987 was much drier than the weather experienced during the previous summer. It is believed that reduced amounts of surface runoff limited the supply of algae producing nutrients available to the lake over the growing season with a resulting improvement in water quality.
The chlorophyll and Secchi disc visibility depth record show that Redhorse Lake is moderately productive with good water clarity.

LAKE i RED HORSE LAKE . EAST BASIN TWP : REAR OF LEEDS & LANSDOWNE COUNTY : LEEDS
ID MIlDER : 12—0017—020—01
WATERSHED AREA : 335.00 SURFACE AREA i 135.0 MAX DEPTH r 37.00 VOLUME v 15.55
2.9 I S
1.2 1 19 ' I I
sq. km ha. mu mill cu. m.
LAST DASIN
SHORELINE 1 12.90 km. COTTADES • 24 RESORTS i 1 C16) XCROWPILNID •0
HISTORICAL RECORD
I SAlUtE DATE I SEWNI DEPTH I CItOROPIff LI A: (YEAR) 1 (PETERS) I (US/I) I
I SAIIPtE DATE I SEWN! DEPTH I CHIOROPWYU. A I
I (NN/DD/YY) I (PETERS) I (US/i) I
1 05/09187 2.1 1 2.3 1
1 05/09/87 1 2.1 1 2.3 1
1 05/16/87 I 2.7 1 2.1 1
1 05/30/87 3.4 1 1.4 1
1 06/14/87 2.7 1 5.6 1
1 06/20/87 1 2.6 1 5.8 1
1 07/04/87 3.7 1 1.3 1
1 01/15/87 : 3.0 1 2.4 1
1 07/20/87 1 3.7 2.8 1
1 07/29/87 1 4.6 2.9 1
1 08/01/87 4.9 I 1.5 I
1 08/08/87 1 4.0 1 1.2 1
: 08/15/87 1 3.7 1 1.9 1
1 09/05/87 1 4.6 : 1.8 1
1 09/12/87 1 3.9 1 2.6 1
1 09/26/87 1 3.9 3.0 1
1 10/03/87 4.5 1 4.8 1
1 10/17/87 4.0 1 4.6 1
1 10/24/87 1 4.5 1 3.9 1
1 11/18/81 1 3.4 1 1
1 19750 I 3.8 1 5.6 1
1 1981" 2.8 1 7.8 I
1 1982" 1 2.7 1 4.7 1
I 1 3.7 1 3.9 1
I 19840 1 3.0 1 7.4 1
1 1985 1 3.8 1 4.0 1
1 1986 1 3.5 1 4.3 1
1
4
1987 1
4
3.6 4
2.9 1
DEAN ' I 34 . ' I 51 . ' I
NAT 1 3.8 ' 78 . '
"IN • I 27 . ' I 29 . ' I
N ' I 8 I 8 ' I
SD ' I 046 • ' I 174 . ' I
NOTE: 'DasSonlnsthn6readinqs. H Ricrotional lakes included.
PEASI 3.6 NAT 1 4.9 MIN 1 2.1
N 1 20
SD I 0.84

LAKE , RED HORSE LAKE z WEST BAG IN TWP : REAR OF LEEDS & LANSDOWNE COUNTY , LEEDS
WATERSHED AREA : 330.00 sq.km SURFACE AREA : 167.0 MAX DEPTH : 37.00
ID NUMBER : 12—0017—013—01
SHORELiNE : 13.80 km. COTTAGES : 18 RESORTS : 0 Z CROWN LAND u 0
lEST BASIN HISTORICAL RECORD
NOTE : * Based on less then 6 readings. 4* Recreational likes included.
ha. It.
a 15.07 miii cu. a.
I SAMPLE DATE I SECCHI DEPTH I CII3OPHYLL A
(Npl/DD/YY) : NUERS i web
I SAMPLE DATE I SECCHI DEPTH I CHLOROPHYU. A 1
(YEAR) I (METERS) I (1$/I) I.
1 07/19/87 1 4.0 3.9 1
1 07/26/87 1 4.3 1 3.6 1
1 08/03/87 1 4.3 1 4.2 1
: os/it/si : 3.7 I 2.4 1
1 08/27/87 1 4.6 1 2.5 1
I 09/06/87 : 5.8 1 2.7 1
1 09/25/87 1 3.5 1 9.1 1
1 10/11/87 1 4.3 1 7.3 1
1 10/21/87 4--————-—————4
1 3.7 1
4
3.7 I
4
t—-—-——— t--———————--——t -
1 19154* 1 3.7 1 6.0 :
1 1979 1 3.4 1 6.6 1
1 1980 1 3.4 I 9.2 1
I 1981" I 3.2 I 7.8 1
1 1982" 1 3.3 1 4.3 1
1 1983" 1 3.8 1 4.2 I
I 1984" 1 3.0 1 7.1 1
1 1985 1 3.2 1 5.6 1
I I I
I I
I 1 1
I I I I
MAX ' ' 58 . ' 9.1 1
MiN I , 35 . ' I 24 . ' I
N ' I 9 • I 9 1
I
SD • I 069 . • I 230 . ' I
+ + +
MEAN 1 3.4 '
. 63 • '
MAX ' , 42 I ' I 92 . ' I
MIN ' , 30 I • I 42 ' I
N ' I 10 ' I 10 ' I
SD ' I 036 ' I 172 ' I

SAINT ANDREW LAKES
A total of 13 samples collected from June 22 to September 19 provided good seasonal coverage of water quality conditions in Saint Andrew Lakes. Although variability from one sampling date to the next obscures any seasonal pattern in the results, chlorophyll concentrations were generally higher and Secchi disc visibility less at the end of the season than at the beginning.
Although not confirmed by water clarity readings, chlorophyll concentrations indicate algae levels were much lower in Saint Andrew Lakes than they were during 1986. The summer of 1987 was much drier than the weather experienced during the previous summer. It is believed that reduced amounts of surface runoff limited the supply of algae producing nutrients available to the lake over the growing season with a resulting improvement in water quality.
Although Saint Andrew Lakes are slightly eutrophic the results indicate that the water quality is satisfactory for recreational purposes.

LAKE : SAINT ANDREW LAKES TWP : HINCHINDROOKE COUNTY : FRONTEIIAC
ID NUMBER : 17—0035—006—01
WATERSHED AREA : 2.80 SURFACE AREA : 79.0 MAX DEPTH : 15.80 VOUJIE : 5.05
sq • km ha.
mill cu. m.
SHOREL I NE COTTAGES RESORTS
: 7.60 km. 20 (1983) :0
UPPER LAKE HISTORICAL RECORD
XCRO*ILAND: 0
SAMPLE DATE SECCHI DEPTH CHLOROPHYLL A
(PM/DD/YY) 1 (METERS) 1 (11611)
+ + C +
SAMPLE DATE I SECCHI DEPTH I CHLOROPHYLL A I
1 (YEAR) 1 (METERS) 1 (118/1)
06/22/87 1 2.9 1 06/28/87 1 2.9
07/05/87 1 2.6 07/13/87 1 2.9
1 07/19/87 1 2.3 07/26/87 1 2.6 08104/87 1 2.9 08/09/87 1 2.9
1 08/16/87 1 1.7
I 08/23/87 1 2.0 08/30/87 1 2.0 09/07/87 1 2.6 09/19/87 2.3
3.5 0.9 6.3 4.4 6.4 5.5 6.9 7.9 4.0 3.8 1.0 6.0 8.2
1 1917 1 1.8 10.2 1
1 1978' 1 1.9 1 8.9 :
1 1980 1 1.8 1 15.8 1
1 1981 1 1.7 1 12.3 1
1 1982 1 2.8 1 3.9 1
1 1983+' 1 3.5 1 3.4 I 1984 1 3.1 1 5.4 1
1 1985 1 3.3 1 2.8 1
1 1986 1 2.9 1 10.4 1
1 1987 1 2.5 1
£
5.4 1
4
MEAN 2.5 MAX 1 2.9 MIN 1.1
N 13
SD 1 0.41
S.4 I I
82 . I • I
O9 I . I
13 I I
I 2O5 I . I
MEAN ' I 2S . I I 79 . I
I
MAX • I 35 . • I 158 • I I
MN • I I7 • • I 28 • I I
N ' I 10 I I 10 • I
SD • I 069 . • I 433 • I
+ + +
NOTE : Based on less then 6 readings. ft Recreational lakes included.
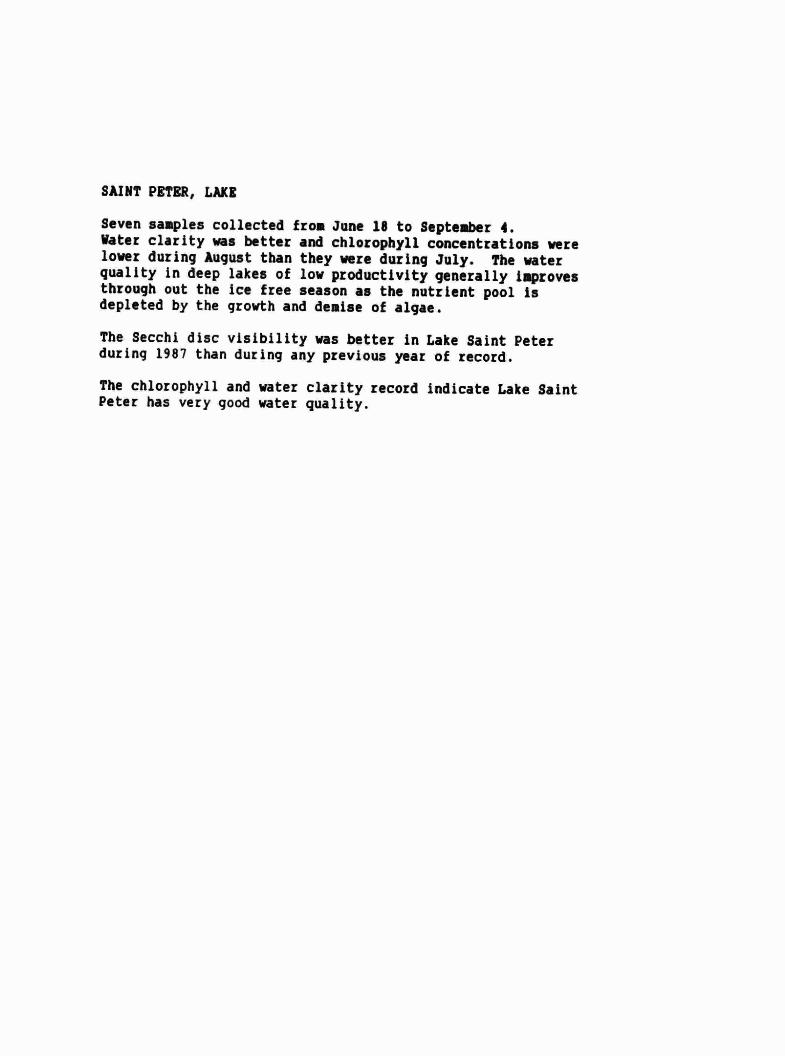
SAINT PETER, LAKE
Seven samples collected from June 18 to September 4. Vater clarity was better and chlorophyll concentrations were lower during August than they were during July. The water quality in deep lakes of low productivity generally improves through out the ice free season as the nutrient pool is depleted by the growth and demise of algae.
The Secchi disc visibility was better in Lake Saint Peter during 1987 than during any previous year of record.
The chlorophyll and water clarity record indicate Lake Saint Peter has very good water quality.

LAKE r SAINT PETER, LAKE TIP i PICL.URE COUNTY r HASTINGS
WATERSHED AREA z 67.00 SURFACE AREA s 234.0 MAX DEPTH a 28.70 VOL.LJME a 17.78
sq.km ha. rn
mill cu. a.
ID P&RIBER : 18—3490—031-01
NOTE Based on less then 6 readings. ft Recreational lakes included.
SHORELII€ a 13.20 km. : 182
RESORTS . 10 (301) X CROWN LAND i 10
SAMPLE lATE : SECCNI DEPTH C&ORtWHYU. A
(il/DIllY) : (METERS) 1 (08/1) I SAMPLE BATE I SECCIII 19114 1 CILOROP$Y1L A I
(YEAR) 1 (METERS) I (08/LI
: 06/18/87 : 3.8 1 2.2 1
1 07108/87 1 4.3 1 2.6 1
1 07/12/87 : 4.4 1 3.4 1
07/27/87 1 4.6 : 2.3 1 08/05/87 : 4.6 1.6 1
1 08/18/87 1 4.3 1 1.9 1
1 09/04/87 1 5.2 1 1.8 1
1 1976'e 1 3.8 1 2.7 1 1977's ' p 4.B ' p 17 . p
1 1978*' • p 39 . p 24 . ' p
I 1979n ' . 34 • • . 27 , .
: 1w p . 33 • . 33 p
1 1983" 1 3.9 . 2.O •
1 19843* . 3.8 • . 2.5 p
1%5*t , 3.8 • p 17 .
1 1986*3 p 41O • p 16 . p
1 1987 4——
P
• 4.5 4--—————
, .
—.4—
2.3 ' . —--——-4
MEAN . p 4.5 ' p 2.3 p
MAX • p 5.2 • p 3.4 p
niw p 38 . p 16 . p
N p 7 p p 7 p p
SD . p 0.43 p 061 . p
MEAN I 3.9 NA! 1 4.8 MN 1 3.3 N 1 11
SI : 0.44
• 23 . p . p
p 3s3 p p
I.' , p p
to p p
O.54 p p

SALMON TROUT LAKE
A total of nine sets of measurements from May 10 to November 9 provided good seasonal coverage of water quality conditions of Salmon Trout Lake.
Chlorophyll concentrations tended to increase during the summer months but did not affect Secchi disc depth visibility to any appreciable degree. In fact water clarity was very good in Salmon Trout Lake. The Secchi disc visibility matched a record for water clarity in Salmon Trout Lake of 4.2 metres set in 1978.
Water clarity was higher and chlorophyll concentrations lower than those measured in the lake during 1986. The summer of 1987 was much drier than the weather experienced during the previous summer. It is believed that reduced amounts of surface runoff limited the supply of algae producing nutrients available to the lake over the growing season with a resulting improvement in water quality.

LAKE : SALMON TROUT LAKE TWP : MONTEAGLE COUNTY : HASTINGS
ID NUMBER • 18—3490—032—01
MAX DEPTH VOLUME
$ 14.00 :3.8
sq.ks ha. S. sill cu. m.
SHOREL I NE COTTAGES RESORTS ; 0 X CROI*I LAND $ 21
CENTRE V LAKE HISTORICAL RECORD
NOTE : * Based on less then 6 readings. it Recreational lakes included.
WATERSHED AREA : 9.25 SURFACE AREA : 100.0
: 7.90 km. :70
SAMPLE DATE SECCHI DEPTH I CILOROPIIYLL Al I (NM/DD/YY) : (METERS) : (1$/I)
SAII'tE BATE I SECOII DEPTH I C*JEPHYLL A I
(YEAR) (METERS) (06/1) 1
• + I. +
: 05/10/87 1 4.2 1 1.7 1
1 07/05/87 1 4.6 1 1.9 1
1 07/21/87 1 4.1 1 4.6 1
1 08/07/87 1 4.7 1 6.1 1
1 08/18/87 1 4.! 1 7.4 1
1 09/10/87 1 4.2 1 6.7 1
1 09/21/87 1 3.5 : 8.3 1
1 10/13/87 1 4.8 1 1.6 1
I 11/09/87 1
+
4.0 1
————4.
1
+
1 1974 ' 37 . ' . 21 .
1 1975' . 3O . ' . 119 . .
I 1976t4 . I
. 34 , • 9.9 . I
1 1977" ' • 38 • ' 61 . ' .
1 1978 ' I 42 . • I 7S • '
1 1979 ' . 32 . • , 111 . ' .
1 1980 • 33 • • • 176 . .
1 1981 • 35 . • • S6 . .
1 1982 • I 31 . , I 36 ' I
1 1983 • I 39 . ' S 47 . ' I
1 1984 I 3.6 ' . 41 • .
1 1985 ' , 33 ' • S 9B . ' I
I • , 36 . • I 57 . ' I
1 1987 ' . 4'2 • . 4.8
MEAN ' I 42 • ' I 4.8 ' I
MX ' I 4,8 • I 83 • . I
"IN • I 35 I • S 16 . ' I
H ' I 9 I 8 ' I
SD ' I 041 • • I 274 . I
+ + + MEAN 1 3.6 1 7.5 1
MAX 1 4.2 1 17.6 :
MIN 1 3.0 1 2.1 1
S II I
I 5J S
I
SD 1 0.35 1 4.16 1

SAND LAKE
A very thorough sampling program running from May 19 to October 28 provided a total of 25 sets of measurements of water quality for Sand Lake. Chlorophyll concentrations were higher and Secchl disc visibility lower towards the end of the sampling program than they were at the beginning. This pattern of seasonally increasing productivity as the summer progresses was observed in Sand Lake during 1985 and is
characteristic of many lakes.
Water clarity was higher and chlorophyll concentrations lower
than those measured in the lake during 1986. The suer of 1987 was much drier than the weather experienced during the previous summer. It is believed that reduced amounts of
surface runoff limited the supply of algae producing nutrients available to the take over the growing season with a resulting improvement in water quality.
The results indicate Sand Lake has good water clarity with only moderate levels of algae. The water quality is well suited for recreational uses such as swimming and bathing.

LAKE : SAND LAKE TWP : SOUTH CROSBY COUNTY : LEEDS
JD NUMBER : 12—0004—017—01
WATERSHED AREA : 7.32 SURFACE AREA : 732.0 MAX DEPTH : 14.30 VOLUME : 37.81
SHOREL INE COTTAGES RESORTS
51.50 km. 110
: 3 (36)
13 TO 14 METRE DEPTH
+ + + +
HISTORICAL RECORD MAIN BASIN
SAMPLE DATE SECCHI DEPTH I CHLOROPHYLL A
(MM/DD/YY) 1 (METERS) I (116/1)
SAMPLE DATE I SECCHI DEPTH I CHLOROPHYLL A
(YEAR) (METERS) 1 (116/1)
+ + 4 +
sq.km ha. m.
mill cu. in. X.CROWNLAND: 0
: 05/19/871 3.7 1 0.5 1 :1971": 2.9 1 2.5
1 05127/87 1 3.7 1 2.4 1 1 1975" 1 3.7 1 5.7
06/04/87: 3.9 1 1.1 : 1980 3.0 1 7.2
: 06/11/871 3,9 1 0.8 I :1983 2.7 1 3.3
1 06/17/87: 3,3 1 2.2 : 11984 1 2.8 : 5.2 1
1 06/23/871 4.0 1 1.0 1 1985 1 3.4 1 5.1 1
1 07/01/87: 33 ' 16 1 '1996 1 30 1 4.5
1 07/14/87: 3.3 : 1.7 1 11987 : 3.5 1 3.0
1 07/18/87 4.3 1 1.2 1
+ + + +
1 07/21/87 : 3.7 1 3.2 1 MEAN 1 3.1 1 4.6
1 07/23/87 1 3.7 : 1.2 I MAX 1 3.7 1 7.2 1
: 07/28/87 4.3 1 2.7 1 MIN 1 2.7 1 2.5 1
1 08/06/87: 3.3 1 1.9 1 N 1 8 1 8 1
:
1
:
08/11/87
08/18187
08/24/87
:
:
3.3 4.3 3.7
1
1
1
3.0 4.6 4.1
1
1
1
SD 1 0.36 1 1.57 1
+ + +
1 09/02/87 1 3.1 : 5.2 : NOTE Based on less then 6 readings. 09/09/87 1 3.1 : 6.6 : *1 Recreational lakes included.
1 09/15/87 3.1 : 2.! I
1 09/23/87 1 2.4 1 5.9 :
1 09/30/87 : 2.7 : 4.2 1
1 10/08/87 2.7 1 4.6 1
: 10/16/87 : 3.1 1 4.7 1
1 10/21/87 1 3.7 1 3.3 1
1 10/28/87 1 3.4 : 4.0 1
+ + + +
MEAN 1 35 I 30 MAX 1 4.3 1 6.6 MIN 1 2.4 0.5 1
N 1 25 1 25 1
SD 1 0.50 1 1.71
+ + +

SHABONEKA LAKE
An extremely thorough sampling program running from Hay S to October 12 provided excellent seasonal coverage of water quality conditions in Shabomeka Lake. Chlorophyll concentrations were higher in the spring and tall than during the summer months. This stands in contrast to the pattern observed during 1986 when mid summer values were slightly higher than those at other times of the sampling period.
The results indicate Shabomeka Lake has very good water quality with relatively low levels of algae. There is very little year to year variability in the water quality.

LAKE : SHABOPIEKA LAKE TWP u BARRIE COUNTY : FRONTENAC
ID NUMBER g 18—3430—034—01
WATERSHED AREA : 40.90 SURFACE AREA : 269.0 MAX DEPTH : 32.00 VOLUME : 33.19
SHOREL I NE COTTAGES RESORTS
: 13.70 km. : 104 $0
CENTRE OF IME HISTORiCAl. RECORD
I SAMPtE DATE I SECCH1 DEPTH I CHLOROPHYLl A I
(YEAR) I (PETERS) (P16/I)
sq. km ha. m. mill cu. m.
SAMPLE DATE I SECCHI DEPTH I CHLOROPHYLL A I
(NM/DDIYY) (PETERS) I (US/I)
X CROWN LAND : 50
1 05/05/87 1 3.0 1 3.9 1 1976*' 5.1 1 2.7 1 05/12187 1 4.1 1 4.9 1 1980" 1 5.1 3.8 105/19/87: 3.9 1 5.0 1 3981 1 4.4 1 3.2 1 05/28/811 4.2 1 1.8 1
1 1983' 1 4.8 : 2.1 I
1 06/01/87 1 4.8 1 0.5 1 1984 1 5.2 1 3.2 106/10/87: 4.8 I 1.3 11985 1 4.3 1 2.5 106/15/871 4.9 1 2.2 1 11986 I 4.5 1 2.4 1 06/22/871 4.9 2.3 1 11987 1 4.9 1 2.5 I
I 06/29/87 1 5.0 1.1 1 + +
1 07/06/87 1 5.2 1 2.9 1 MEAN 1 4.8 1 2.8 1 07113/87 1 5.1 1 3.0 1 MAX 1 5.2 1 3.8
07/21/87 1 5.1 1 2.9 1 MIN 1 4.3 1 2.1 107/29/871 5.5 1 2.1 1 N 1 8 I 8
1
I
1
08/06/87 08/19/87 08/26/87
1
1
5.2 5.1 5.0
1
1
1.6
1.8 1.7
1
1
I
SD : 0.35 1 0.56
1 09/02/87 1 4.7 1 1.1 1
1 09/08/87 5.6 1 2.8 1
1 09/13/87 1 6.1 1 3.3 1
1 09/20/87 1 5.3 I 2.2 1
1 09/28/87 1 5.8 1 3.2 1
1 10/05/87 1 4.5 1 3.3 1
1 10/12/87 1 5.1 1 2.3 1
+ + + +
PATE : * Based on less then 6 readinqs. U Recreational lakes included.
MEAN I 4.9 1 2.5 MAX 6.1 5.0 MIN 3.0 I 0.5 N 1 23 1 23
SD 1 0.66 1 1.14

SILVER LAKE
A total of 13 samples collected from June 17 to October 7
provided good coverage of conditions of water quality conditions in Silver Lake. Although Secchi disc visibility was somewhat less during the month of August than it was during the months of July and September no clear cut seasonal was detected.
Although water clarity declined in August readings remained extremely good. In fact, the seasonal mean Secchi disc visibility depth of 4.8 metres establishes a record high water clarity reading for Silver Lake. Chlorophyll concentrations were much lower than those observed during 1986.
The summer of 1987 was much drier than the weather experienced during the previous summer. It is believed that reduced amounts of surface runoff limited the supply of algae producing nutrients available to the lake over the growing season with a resulting improvement in water quality.
The Secchi disc visibility depth and chlorophyll concentration record indicate that the lake has very good water quality.
An introduction of Eurasian milfoil along the southeast shoreline of Silver Lake was investigated in 1986 and found to occupy an area of about 9.4 hectares. A follow up Inspection in 1987 indicated there has been some further spread of the weed.

LAKE : SILVER LAKE TWP OSO, SOUTh SHERBROOKE COUNTY : rRONTENAc, LANARK
CENTRE N LAKE
ID NUMBER : 18-3430—027—01
SHORELINE : 9.20 km. COTTAGES •87+1HOUSE RESORTS : 3 (185) X CR0111 LAND z 10
HISTORICAL RECORD
SAMPLE DATE I SECCHL DEPTH I CHLOROPHYLL A
I (NII/DDIYY) 1 (METERS) I (1J6/L)
I SAMPLE PATE SECCHI DEPTH I CHLOROPHYLL A i
1 (YEAR) 1 (METERS) I (US/U
NOTE : • hiS on less thet 6 readings. te Recreational lakes included.
WATERSHED AREA : 29.70 sq.km SURFACE AREA : 246.0 ha. MAX DEPTH z 24.40 in. VOLUME a 24.91 .111 cu. in.
:06/17/87' S 38 • ' 45 . ' I ' I 37 • ' e 25 . '
I I ' I I I I
24 I ' I I I I 27 t ' U
:07/15/87, ' 56 • • , 2S . ' I ' • 1979tt ' . 40 • ' • 27 . ' • :07/19/97' I 47 • ' I 27 . ' I ' I 1980 ' I 34 I I
I I I I I I
1 I I , ' , 1982 • 41 . , 24 . ' 108/18/87' I 44 I , I 17 . ' I ' I 1983 ' I 39 • ' I 20 . ' I 1 08/23/87' I 42 • I 20 ' I ' I 1984 ' I 34 • ' I 30 . ' I
1 09/02/87, ' . 47 , • 10 ' ' 1985 ' . 37 • ' . 23 . ' :09/10/87' S so I I ' I I 43 . ' S 32 • ' I
1
109/27/87' 10/07/87
I
I
51 S
4, •
' I
, ,
38 •
25 .
' S
' •
'1987 ' 48 ' 24 I I • U • I
4 + +
MEAN 1 4.8 ' U 24 . ' I
MAX ' I Si . , U 45 . ' I
"IN ' I 38 • ' I 10 • ' I N ' I 13 ' U 13 ' I
SD ' I 058 I ' I 102 . ' I
MEAN , I 38 . ' I 27 S ' I
MAX ' , 48 . ' U 36 • ' I
fIN ' I 34 . , I 20 ' •
N ' I 12 ' I 12 I I
SD ' I 042 . ' U 045 p 5

SKOOTANATTA LAKE
Six samples collected from June 27 to August 5 indicated good water quality, but the absence of an early spring or lake tall algae bloom cannot be confirmed.
Water clarity was higher and chlorophyll concentrations lower than those measured in the lake during 1986. The summer of 1987 was much drier than the weather experienced during the previous summer. It is believed that reduced amounts of surface runoff limited the supply of algae producing nutrients available to the lake over the growing season with a resulting improvement in water quality.
The results indicate Skootamatta Lake has good water clarity and very little algae. The water quality is well suited for recreational use such as swimming and bathing.

LAKE : SKOOTAMATTA LAKE : UPPER LAKE (W.B) ID NLJPIBER : 17—0026—005—01 TWP : ANGLESEA COUNTY : LENNOX & ADD INGTON
sq.km SHORELINE : 9.60 km. ha. COTTAGES : 36 (1974) m. RESORTS : 0 mill cu. m. X CROWN LAND : 0
UPPER LAkE (WEST BASIN) HISTORICAL RECORD
+ + + + + +
3.8 1 1.0 1 1974 ft 3.8 2.0 : 1975 ii 3.8 : 2.8 1 1980* 3.5 1.5 1 1982* 3.2 0.8 1 1983
3.5 : 1.1 1984
1985
3.6 1.5 1 1906
3.8 2.8 1987
3.2 1 0.8
MEAN 3.6 1 2.0 MAX 4.2 1 5.2
MIN 3.0 1 1.5
N 1 9 9
SD 0.36 1 1.13 + + +
WATERSHED AREA : 49.34 SURFACE AREA : 456.0 MAX DEPTH : 29.30 VOLUME : 4.33
SAMPLE DATE I SECCHI DEPTH 1 CHLOROPHYLL A I
(MM/DO/VU 1 (METERS) I (US/I) + + + +
06/27/87
07/09/07 07/19/87 07/29/87 08104/87
08/05/87
I SAMPLE DATE SECCHI DEPTH CHLOROPHYLL A
(YEAR) (METERS) I (U6/L) + + + 4
+ + + +
MEAN
MAX
MIN
N
4.2 ' 3.0 I I I
I 3.7 ' 5.2 3.7 ' 3.2 I I I
4.O ' 3.4 I I I
I 3.4 ' 1.5 I I I
3.3 ' 3.0 I 1 I
I 3.5 ' 2.3 I I
3.O 2.4
3.6 ' 1.5 I I 1
C I I U 1
SD 1 0.24 1 0.75 4 + +
+ + + +
NOTE Based on less then 6 readings. ft Recreational lakes included.

SOUTH LAKE
Six samples collected from the end of July to the beginning of September provided an indication of water quality conditions comparable to those for the same period during 1986.
While Secchi disc depth measurements indicated adequate visibility for swimming and bathing purposes, chlorophyll concentrations were high and the presence of algae in the lake may have been visibly apparent.
Recyling of nutrients from lake sediments and bottom waters may be instrumental in maintaining a high level of productivity in the waters of South Lake.
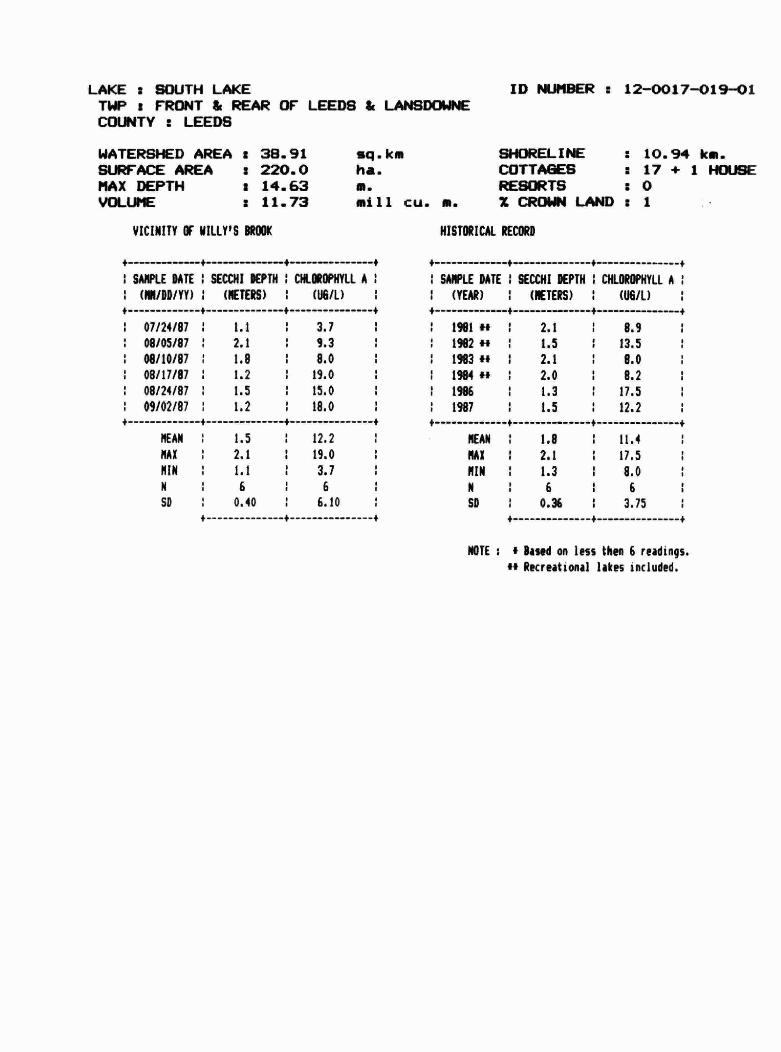
LAKE : SOUTH LAKE TWP z FRONT & REAR OF LEEDS & LANSDCIWNE COUNTY : LEEDS
ID NUMBER : 12—0017-019-01
WATERSHED AREA s 38.91 SURFACE AREA MAX DEPTH VOLUME
sq. km ha. a. mill cu. a.
SHOREL 1 NE COTTAGES RESORTS 2 CROWN LAND
1.5 1 12.2
2.1 1 19.0
1.1 1 3.7 6 6
0.40 6.10 + + +
1 1981" • I 2.1 : 8.9 I
1 1982" ' I 1.5 1 13.5 ' I
1 1983" I • 2.1 1 8.0 ' I
1 1984" ' I 2.0 1 8.2 • I
1 1986 ' I 1.3 1 11.5 ' I
1 1987 I I 1.5 1 12.2 I
+ + + +
MEAN 1.8 1 11.4
MAX 2.1 1 17.5
MIN 1 1.3 1 8.0 N
I I • I I
SD 1 0.36 1 3.75 + + +
• 220.0 2 14.63 : 11.73
ViCINITY IF WILLY'S BROOK
10.94 km. 17 + 1 HOUSE :0 :1
HISTORICAL RECORD
4————.
I SAMPLE DATE I SECCHI DEPTH I CHLOROPHYLL A
(YEAR) I (METERS) ((POlL)
I SAMPLE DATE I SECCHI DEPTH I CHLOROPHYLL A I
I (MM/DO/fl) 1 (METERS) I ((POlL)
• + + +
07/24/87 1 1.1 I 3.7 1 08/05/87 1 2.1 1 9.3 1 08/10187 I 1.8 1 8.0 I 08/17/87 1 1.2 1 19.0
1 08/24/87 1 1.5 1 15.0 1 09/02/87 1 1.2 1 18.0
MEAN
MAX
Ml N
N
SD
NOTE a Based on less then 6 readings. *4 Recreational lakes included.

STEENBLJRG LAKE
Although a total of six samples were collected from Steenburg Lake, sampling occurred on only three dates and therefore the results may not be representative of water quality conditions as they occurred over the season in the lake. The data are therefore insufficient to draw any definite conclusions about Steenburq Lake or make comparisons with previous years.
A minimum of six sampling dates are necessary to adequately characterize water quality of a lake. Preferably 1.2 or more measurements evenly timed throughout the ice free season of the year from May to October should be taken to define any seasonal trends in water quality if they are present.
Based on the historical record the Secchi disc visibility depth and chlorophyll concentrations indicate Steenburg Lake has very good water quality.

LAKE : STEENBURG LAKE 11W : TUDOR, LIMERICK COUNTY : HASTINGS
ID NUMBER : 17—0021—011—01
BEACH BAY HISTORiCAL. RECORD
' 2.8
3.6 , I I
1.7 I
9 ,
I I
WEST BAY
SAMPLE DATE : SECCHI DEPTH 1 CHLOROPHYLL A
(MN/DD/YY) (METERS) (116/I) + + + +
1 08/02/87 1 3.7 1 1.7
08/16/87 1 4.3 1 LI
SD 1 0.34 1 0.57 + + +
NOTE : Based on ins then 6 readinqs. Recreational lakes included.
WATERSHED AREA : 21.50 sq.km SHORELINE z 13.70 km. SURFACE AREA s 277.0 ha. COTTAGES s 203 MAX DEPTH • 20.10 ii. RESORTS s 0 VOLUME : 15.62 miii cu. a. X CROWN LAND a 0
I (Iffi/DD/YY)
SAMPLE DATE I SECCI4 I DEPTH I CHLOROPHYLL A
(METERS) I (116/I) + ————+ + +
1 07/19/87 1 3.0 1 1.9 1
1 08/02/87 1 4.0 1 2.1 1
PHILLIPS BAY
+ + + +
SAMPLE DATE I SECCHI DEPTH I CHLOROPHYLL A I
(NM/DD/YY) I (METERS) (US/I) I
t + t -4
ISAMPLE DATE ISECCHI DEPTH 1CHLDROPWYLLA
(YEAR) 1 (METERS) I (U6/L) I
4----— -.4 ———-—-——+ — —4
1976*' 1 4.6 1 2.4 1977 1 4.7 1 3.0
1 1978 1 4.3 1 3.0 1 1979 1 4.5 1 3.2
1983 1 4.3 2.4
1984 1 3.8 1 3.6 1985' 1 4.2 1 3.1
1986 1 3.8 1 3.1
1 1987 1 3.9 1.7
07/19/87 08/02/87
43 I I S
40 I6 I . I
MEAN
MAX
M1N
N
4.2 4.7
1 3.8

STOCO LAKE
A total of nine samples collected by a progra. running from the end of April to mid September provided good seasonal coverage of water quality conditions in Stoco Lake. Nigh chlorophyll concentrations were intermittently encountered, which during the first and second week of August were accompanied by diminished water clarity.
Recyling of nutrients from lake sediments and bottom waters is believed to be instrumental in maintaining a high level of productivity In the waters of Stoco Lake.
While Secchi swimming and high and the from time to
disc depths indicated adequate visibility for bathing purposes chlorophyll concentrations were presence of algae may have been visibly apparent t i me.

LAKE : STOCO LAKE TWP : HUNGERFORD COUNTY : HASTINGS
ID NUMBER : 17—0026—008—01
NORTH IAS1N SOUTH BASiN HISTORICAL RECORD
WATERSHED AREA . 2230.00 sq.k. SHORELINE : 16.00 cm. SURFACE AREA z 500.0 ha. COTTAGES : 90 MAX DEPTH : 9.76 a. RESORTS z 4 (26) VOLUME • 19.93 •I11 cii. a. X CROWN LAND s 0
, 4. 4. —t
SAMPLE DATE 1 SECCHI DEPTH 1 CHLOROPHYLL A I
1 (YEAR) I (PETERS) (US/I) + 4 4.— —+ 1 1972" 1 1.3 1 9.0
1913" 1 1.5 1 22.5
1914*' 1 2.4 1 5.8 1975" 1 2.0 1 20.1 1
1 1984" 1 1.2 1 22.6
1985 1 1.5 1 21.9
1986' 1 2.0 1 10.7
1987 1.9 1 10.9 £ £ 4 —4
t + + t I SAMPLE DATE I SECCHI DEPTH I CHLOROPHYLL A I
I (MN/DD/YY) I (PETERS) I (tElL) 1
+ * + 4
07/15/87 1 2.1 1 4.9 + + 4 +
SOOTH BASIN
+ + ——--4 +
1 SAMPLE DATE I SECCHI DEPTH I CHLOROPHYLL A I
I (MNIDD/YY) 1 (METERS) I (tElL) I
4. + 4 +
1 05/26/87 1 2.1 1 7.8
1 06/17/87 1 2.1 1 6.4 07/07/87 1 1.8 1 7.0
1 07/15/87 2.1 1 11.0
07/27/87 1 2.3 4.6 08/06/87 1 1.5 18.5
08/18/87 1 1.5 25.5
1 08/31/87 1 1.8 8.6 09/17/87 1 1.8 1 8.5
MEAN' , 17 . ' , 142 . ' I Mx • I 24 . • I 226 • I
IIIN • I 1.2 ' I 5.8 ' I N ' I 8 • • 8 I
SO , I 04! . ' I 655 . ' I
NOTE: *Baud on in' then 6 readiugs. U Recreational lakes inciSed.
DEAN I , I.9 • I 109 . ' t
MAX • I 2.3 ' I 25.5 ' I
HIM I I 1.5 ' I 46 . ' •
N • I 9 I I 9 I
SD • I 0.28 I I 6.77 • P

SYDENHAJI LAKE
Although a total of six samples were collected from Sydenhaa Lake, sampling occurred on only two dates and therefore the results may not be representative of water quality conditions as they occurred over the season. The data are therefore insufficient to draw any definite conclusions about Sydenham Lake or make comparisons with previous years.
A minimum of six sampling dates are necessary to adequately characterize water quality of a lake. Preferably 12 or more measurements evenly timed throughout the ice free season of the year from May to October should be taken to define any seasonal trends in water quality if they are present.
Based on the historical record the Secchi disc visibility depth and chlorophyll concentrations indicate Sydenham Lake has good water quality.

LAKE : SYDENHAM LAKE TWP : LOUGHBOROUGH COUNTY : FRONTENAC
CENTRE OF LAKE
4 + 4 +
SAMPLE DATE ! SECCHI DEPTH CHLOROPHYLL A
(MM/DD/YY) (METERS) (UGIL)
+ I + +
06/21/87 : 4.3 : 2.3 06/28/81 3.1 2.6 1
+ 4 + +
MEAN 1 4.0 2.5 MAX 4.3 2.6 MEN 3.7 2.3 1
N 2 2
SD 0.42 0.22
MEAN
MAX
MIN
N
SD
ID NUMBER : 06—0180—003—01
4.0 3.8 5.0 5.1
3.6 2.2 I 0 I 0
U
I Based on less then 6 readings. *1 Recreational lakes included.
+ + + +
SAMPLE DATE SECCHE DEPTH : CHLOROPHYLL A
(MM/DDIYY) (METERS) (US/I) + + + +
1 06121/87 3.7 1 2.7 06/28/87 1 3.3 1 0.5
+ + + +
MEAN 3.5 1 1.6
MAX 3.7 1 2.7
MEN 1 3.3 1 0.5
N 2 1 2
SD 1 0.28 1.56 I + +
+ t I I SAMPLE DATE I SECCHI DEPTH CHLOROPHYLL A
(YEAR) (METERS) I (118/L)
+ + + +
1 1977* 1 4.3 1 4.7 1983 1 2.9 1 4.2
1 1907* 3.5 1 1.6 + + + +
MEAN 3.6 1 3.5 MAX 4.3 4.7
MEN 1 2.9 1 1.6 U I I I
n s a . a
so : 0.70 1.66 + + +
NOTE Based on less then 6 readings. 4* Recreational lakes included.
WATERSHED AREA : 49.00 sq.km SHORELINE : 42.00 km. SURFACE AREA : 451.0 ha. COTTAGES : 152 MAX DEPTH : 37.00 m. RESORTS : 2 (51) VOLUME : 32.05 miii cu. in. X CROWN LAND : 0
MAIN LAKE HISTORICAL RECORD
+
SAMPLE DATE SECCHI DEPTH I CHLOROPHYLL A
(YEAR) 1 (METERS) I (USIL)
1917
1978
1979
1980
1982* 1983
1984
1987*
5.0 ' SI I •
3.6 ' 3.2
3.6 ' 4.5 4.3
' 4.0
37 ' 3.G
3.8 ' 2.2
3.B ' 4.2 4.O 2.5
+ + + +
EEL BAY EEL BAY HISTORICAL RECORD

LAKE : LITTLE LONG LAKE TWP : LOIJGHBOROUGH COUNTY : FRONTENAC
ID NUMBER : 06—O1BO—002--O1
WATERSHED AREA :
SURFACE AREA :
MAX DEPTH VOLUME
sq. km ha. m. mill cu. a.
SHORELINE COTTAGES RESORTS X CROWN LAND
LITTLE LONG LAKE
+ + +
LITTLE LONG LAKE
NOTE • Baud on less then 6 readings. cc Recreational lakes included.
km. S
S
U
SAMPLE DATE I SECCHI DEPTH A
I (MN/DD/YY) : (METERS) 1 (11611)
+ 4. + +
06/21/87 1 3.7 1 1.2
1 06/28/87 1 3.7 1 1.3
4.— + 4. $
I SAMPLE DATE SECCHI DEPTH I CHLOROPHYLL A
1 (YEAR) 1 (METERS) I I
+ + + 4.
1 1971' 1 4.9 4.3 1 1987* 1 3.7 1 1.3
MEAN ' I 31 ' I 13 . • I MEAN' I 43 I ' I
I I I I I I I I I
I I I I I I I
I I N ' I 2 ' I 2 ' I
I ' I I SD ' I 212 . '

THIRTEEN ISLAND LAKE
A very thorough sampling program with a total of 23 samples taken from April 20 to October 25 provided excellent seasonal coverage of water quality conditions in Thirteen Island Lake.
While chlorophyll concentrations were generally a little higher during July and August than at other times of the year water clarity did not vary much.
Chlorophyll concentrations were lower and Secchi disc visibility higher than they were during 1986. The suiEser of 1987 was much drier than the weather experienced the previous suamier. It is believed that reduced amounts of surface runoff limited the supply of algae producing nutrients available to the lake over the growing season with a resulting improvement In water quality.
The Secchi disc visibility and chlorophyll concentration results indicate the lake has good water quality.

LAKE : THIRTEEN ISLAND LAKE ID NUMBER : 17—0035-015-01 TWP : BEDFORD, HINCHINBROOKE, LOUGHBOROUGH, PORTLAND COUNTY : FRONTENAC
WATERSHED AREA : 40.00 SURFACE AREA : 132.0 MAX DEPTH : 25.90
6.63
sq. km ha. m. mill cu. m.
SHORELINE COTTAGES
13.80 km. :60
CENTRE OF LAKE HISTORICAL RECORD
SAMPLE DATE 1 SECCHI DEPTH : CILOROPHYU. A
(YEAR) (METERS) (11611)
VOLUME RESORTS : 2 (4)
X CROWN LAND : 0
SAMPLE DATE SECCIPI DEPTH : A
(MN/DD/YY) 1 (METERS) : COG/I)
1 04/20/87: 3.0 1 0.7 : : 1975" 1 4.3 1 4.2
I 04/26/971 3.0 1 0.4 1 1 1983 1 3.3 1 3.4
1 05/18/871 3.4 : 2.0 1 1 1984*' : 3.8 I 4.3
:05/24/971 3.3 1 9.3 1 1 1985 1 3.5 1 3.7
1 06/01/87: 3.4 : 3.9 : : 1986 ; 3.3 : 6.7 1
I 06/14/87 1 3.3 1 1.6 1 1 1987 1 3.4 1 4.1
1 06/21/87 1 37 1 21 1
1 06/28/97 1 3.3 : 0.3 MEAN 1 3.6 1 4.4
1 07/05/87 1 3.3 1 5.2 1 MAX 1 4.3 1 6.7
: 07/12/87 1 3.3 1 5.2 1 MIN 1 3.3 1 3.4
1 07/19/871 3.7 1 4.7 1 N 1 6 1 6
1
1
1
07/26/87 08/03/87 08/09/87
:
1
1
3.0 3.7
1
1
1
4.8 8.4 5.7
1
1
1
SD 1 0.39 1.18 + + 7
1 08/16/87 1 3.3 1 3.0 1 NOTE : t Based on less then 6 readings.
1 08/20/87 1 3.4 1 5.7 1 at Recreational lakes included.
1 08/23/87 1 3.3 1 3.7 1
1 08/30/87 1 3.4 1 4.9 1
1 09/07/87 1 3.4 1 3.9 1
1 09/13/87 1 3.5 1 4.8 1
1 09/27/87 1 3.7 1 5.6 1
1 10/04/87 1 3.7 1 4.5 1
1 10/12/87 1 37 1 39 1
1 10/25/87 3.6 1 3.6 1
MEAN 1 3.4
MAX 33 MZN 1 3.0 N : 23
SD 1 0.23
4.1
9.3 0.3
1 24
1 2.22

TROY LAKE
A total of 16 samples collected from April 10 to October 12 provided excellent seasonal coverage of water quality conditions in Troy Lake. The best water quality conditions occurred from the end of May to the middle of July during which time Secchi disc visibility depth reached 4.6 metres.
Chlorophyll concentrations were much lower and Secchi disc visibility much higher than they were during 1986. The summer of 1987 was much drier than the weather experienced the previous summer. It is believed that reduced amounts of surface runoff limited the supply of algae producing nutrients available to the lake over the growing season with a resulting improvement in water quality.
The results during 1987 indicate that Troy Lake had good water quality with low levels of algae present. The lake was well suited for recreation including swimming and bathing.
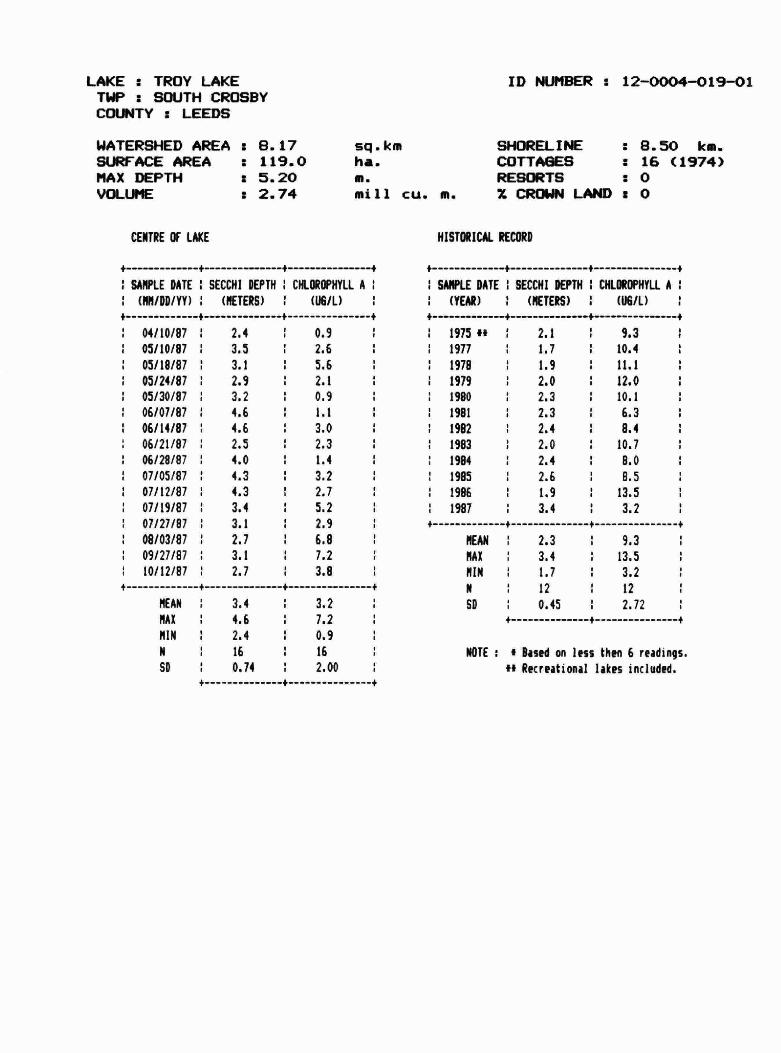
LAKE : TROY LAKE TWP : SOUTH CROSBY COUNTY : LEEDS
ID NUMBER : 12-0004—019-01
WATERSHED AREA : 0. 17 SURFACE AREA : 119.0 MAX DEPTH : 5.20
: 2.74
sq. km ha. ii. mill cu. ii.
SHOREL I NE COTTAGES RESORTS
8.50 km. 1 16 (1974) :0
CENTRE OF LAKE HISTORICAL RECORD
SAMPLE DATE : SECCHI DEPTH CHLOROPHYLL A I
(MM/DO/fl) 1 (METERS) I W6/L) I
SAMPLE DATE I SECCHI DEPTH I CHLOROPHYLL A
(YEAR) 1 (METERS) I W6/L)
VOLUME Z CROWN LAND : 0
04/10/87 1 2.4 05/10/87 1 3.5 05/18/87 3.1
05/24/87 1 2.9 05/30/87 3.2 06/07/87 4.6
06/14/87 4.6 06/21/87 1 25 06/28/87 4.0
07/05/87 1 4.3 07/12/87 4.3
07/19/87 3.4 07/27/87 1 3.1
08/03/87 2.7 09/27/87 1 3.! 10/12/87 2.7
0.9 2.6 5.6 2.1
0.9
3.0 2.3 1.4
3.2 2.7
5.2 2.9
6.8 7.2 3.8
1975 a' 1 2.1
1977 1 1.7
1978 1 1.9
1979 1 2.0 1980 2.3 1981 1 2.3 1982 : 2.4
1983 1 2.0 1984 2.4 1985 26 1986 1.9
1987 1 3.4
9.3 10.4
11.1
12.0 10.1
6.3 8.4
10.7
8.0
8.5 13.5
3.2 + + 4 +
MEAN 3.4 MAX 4.6 MIH 1 2.4
N 1 16
SO 1 0.74
MEAN 2.3 MAX 3.4
MIN 1.7
N 1 12
3.2 '
7.2 . I I
O.9 I I
16 ,
2.O0 I I
9.3 13.5
3.2
12
+ 4 +
SO 0.45 2.72 + + +
NOTE : a used on less then 6 readings. at Recreational lakes included.

TWIN SISTERS LAKE
A total of 16 samples from June S to September 30 provided good seasonal coverage of water quality conditions in the east basin of Twin Sisters Lake. Fewer samples were collected from the west basin but the number was sufficient to conclude that the water quality in the two basins is
similar. Chlorophyll concentrations were higher from the end of July to mid September than they were earlier in the season and water clarity declined as a result.
The results indicate that although Twin Sister Lake has moderate levels of algae present in the water, the clarity is good. The lake is suitable for recreational uses such as swimming and bathing.

LAKE : TWIN SISTER LAKES : EAST BASIN TWP : MARMORA COUNTY : HASTINGS
ID NUMBER : 17—0021—012—01
WATERSHED AREA : 6.90 SURFACE AREA : 51.0
sq. km ha. m. mill cu. m.
SHOREL I NE COTTAGES RESORTS
4.40 km. :20 :0
EAST BASIN HISTORICAL RECORD
SAMPLE DATE SECCHI DEPTH 1 CILOROPHYLI A
(NN/DDIYY) 1 (METERS) I
SAlUtE DATE SECCHI DEPTH CHLOROPHYLL A
(YEAR) (METERS) 1 WElL)
MAX DEPTH VOLUME
8.54 1 1.74 X CROWN LAND : 0
:06/05/871 3.2 1 3.5 : : 1980"l 3.9 1 5.2 1 06/l6/07 3.5 1 1.9 1 :1981* : 3.5 1 5.0 :06/24/87: 3.8 1 1.0 1 :1982 1 3.4 1 2.2
: 07/02/871 3.5 1 6.9 I 1983 3.5 I 3.3 1 07/12/87 1 3.2 1 0.7 1 1984 1 3.8 1 5.0 :07/20/871 3.2 1 2.7 11985 1 3.6 1 4.7 1 07/26/871 3.0 1 8.4 1 11986 1 3.4 1 4.0 1
:09/01/871 3.2 1 9.5 1 :1987 : 3.0 1 6.0 1
1 08/04/87 1 3.0 1 14.0 1 + + + +
08/09/87 1 2.9 1 11.0 1 MEAN 1 3.5 1 4.4 1
1 08/21/87 1 2.7 1 7.5 MAX 1 3.9 1 6.0 1 08/28/87 1 2.3 6.5 1 MIN 1 3.0 1 2.2 1 09/02/87: 2.3 1 7.7 1 : 8 1 8
1
1
1
09/09/87 09/13/87 09/30/87
1
I
1
2.6 2.6
2.3
1
1
1
6.0 6.0 3.3
:
1
SD 1 0.28 1 1.21 + + +
MEAN 1 3.0 MAX 1 3.8 1 14.0
MIN 1 2.3 1 0.7
N 1 16 1 16
SD 1 0.46 1 3.72 + 4 4.
1 6.0 1 cc Recreational lakes included. NOTE * Based on less then 6 readings.

LAKE : TWIN SISTER LAKES : WEST BASIN ID NUMBER : 17—0021—013—01 TWP : MARMORA COUNTY : HASTINGS
WATERSHED AREA : 8.70 SURFACE AREA : 35.0 MAX DEPTH : 13.40
1.96
sq. km
rn. mill cu. m.
SHOREL I NE COTTAGES RESORTS
3.20 km. :21 :0
WEST BASIN HISTURICAL RECORD
SAMPLE DATE SECCHI DEPTH CILOROPHYLL A
(MM/DD/YY) : (METERS) (1J8/L)
SAMPLE DATE I SECCHI DEPTH I CJLOROPHYLL A
(YEAR) 1 (METERS) I (1$/I)
I + +
NOTE : ' Based on Less then 6 readings. •' Recreational lakes included.
VOLUME X CROWN LAND : 0
105/18/87: 3.5 ' 18 ' I I ' I977 ' 36 ' 29 I I . I
t9 06/16/87. . . . • 2980" • 39 ' 43 • • . • . • Ioo ' 08/01/87 4.1 • 1981 ' 44 • 29 1
• • . • •
08/29/87: 3.5 79 1
I • I 1982 I 36 33 I I I . I • I
• 65 . 09/07/87: 3.4 . • ' 1983 35 25 • I • . I
• . 109/19/87: 3.! . • 2984 35 • 47 I • . .
10/04/87 1 3.1 • S3 I I 1985 • 38 • 53 I I . I
:10,10/87: 2.9 iS I 1 . I '1986 • 30 • 37 • I . I . I
1 10/31/87 1 3.1 I 1987 33 • 46 I . I . I
11/07/87 1 2.7 : : + + + +
+ + + + MEAN • 36 • 38 I
MEAN • 33 ' 46 • I I • I MAX • 44 ' 53 I . I I
MAX 1 4.1 ' 100 • I • I MW • 30 ' 25 I I I
MIN I 27 15 I I I • I N • 9 I 9 I •
N 9 : 8
SD ' 041 1 . 3.35 1
SD • 039 • 097 • •
+ + +

UPPER HEVERLEY LAKE
A good sampling program provided a total of 10 observations of water quality from June 15 to August 24. Chlorophyll concentrations were higher and Secchi disc visibility lower at the end of the sampling period than they were at the beginning. This seasonal increase in productivity as the summer progresses is characteristic of many lakes.
Water quality was comparable to that measured from 198]. to 1984. The Secchi disc visibility depth and chlorophyll concentration record indicate Lower Beverley Lake has satisfactory water quality for recreational purposes such as swimming and bathing.

LAKE : UPPER BEVERLEY LAKE TWP : BASTARD, REAR OF LEEDS & LANSDOWNE COUNTY : LEEDS
ID NUMBER 12—0017—015—01
WATERSHED AREA SURFACE AREA MAX DEPTH VOLUME
: 100.06 551.0 7.01
: 13.3
SHOREL INE COTTAGES RESORTS X CROWN LAND
25.70 km. : 57+2HOjJSES : 2 (7) :0
VICINITY OF 6IFFORDS POINT VARIOUS OPEN WATER LOCATIONS
sq. km ha. m.
mill cu. m.
SAMPLE DATE I SECCHI DEPTH : CHLOROPHYLL A
(YEAR) (METERS) 1 CU6/L)
+ + + +
SAMPLE DATE : SECCHI DEPTH : CILOROPHYLL A
(NM/DD/YY) 1 (METERS) (LIGIL)
+ + + 4
06/15/87 1 1 3.5 06/21/87 : 2.9 1 2.3 1
06/28/87 2.4 2.0 07/05/87 1 2.7 3.4 07112/87 2.7 3.3 1
07/19/87 1 2.3 4.2
07/25/87 2.4 5.2 1 07/31/87 1 2.3 1 3.7
08/09/87 2.0 1 6.2
1 08/24/87 I 1.8 1 7.9
1 1981" ' , 25 . ' I 41 . ' I
1 1982" ' , 18 I ' I 61 . ' I
I 1983*' ' I 33 • ' I 32 • ' I
1 1984*' , ' . 26 ' ' . 63 ' '
1 1987 ' , 24 .
' , 4.2 ,
MEAN ' I 25 . ' I 4.8 '
MAX ' I 33 . ' I 63 . ' I
MIN I I 18 • ' I 32 . ' I
N I I S ' I 5 ' I
SD • I 054 I ' I 136 ' I
MEAN 1 2.4 1 4.2 1
MAX 1 2.9 1 7.9 :
MIN 1 1.8 1 2.0 :
N : 9 1 10 :
SD 0.35 1 1.81
+ + +
NOTE * Based on less then 6 readinqs. 4* Recreational lakes included.

UPPER RIDEAU LAKE
Eight naples were collected from July 12 to September 27. Water quality was not as good during the month of August as during the months of July and September. Although the August water clarity was satisfactory for sviing and bathing the chlorophyll concentrations indicate the presence of algae in
the water have been visibly apparent.

LAKE : UPPER RIDEAU LAKE TWP : NORTH CROSBY COUNTY : LEEDS
ID NUMBER : 18-0033—030—01
WATERSHED AREA : 155 SURFACE AREA : 136.2 MAX DEPTH VOLUME
sq. km ha.
SHORELINE COTTAGES RESORTS
39.0 km. : 240 (1971) : 10 (307)
NOT SPECIFIED VARIOUS OPEN WATER LOCATIONS
SAMPLE DATE I SECCHI DEPTH I CHLOROPHYLL A I
1 (NM/DD/YY) 1 (METERS) I (IJG/L)
I SAMPLE DATE I SECCHI DEPTH CHLOROPHYLL A I
(YEAR) 1 (METERS) I (U8/L) I + + ———.4
: 22.0 m.
109.74 miii Cu. m.
1 07/12/87 1 3.0 1 1.1 1 1971" : 2.6 1 8.9 1
I 07/20/87 1 LB 1 5.8 : 1975 n 1 2.7 : 13.7 ;
:08/03/871 2.0 1 8.4 1977 I 2.6 1 7.8 1
1 08/09/87 1 2.2 1 15.0 1 1980" 1 2.8 : 13.8 :
I 08/16/87 1 1.3 1 11.0 : 1983+' 1 3.4 : 3.9 :
1 08/30/87 1 1.9 I 7.2 1 1987 I 2.1 1 8.0
1 09/07/87 1 2.1 1 7.8 + + +
1 09/27/87 1 2.2 1 7.6
MEAN ' I 2! • P 80 ' I
MAX ' I 30 . • P 150 1 I
N!N ' I 12 • ' I 1.1 '
N ' , 8 ' I 8 ' P
SD ' I 048 ' I 3.99 I
MEAN 1 2.7 1 9.4
MAX 3.4 1 13.8
MIN 1 2.1 1 3.9 N 6 1 6
SD : 0.42 1 3.82
I + + NOTE ' based on less then 6 readings. ii Recreational lakes included.

WHITE LAKE
A very thorough sampling program running from April 6 to September 23 was carried out on White Lake. The results indicate there is no difference in water quality between the two sampling locations. Chlorophyll concentrations were higher and Secchi disc visibility lower at the end of the sampling program than they were at the beginning. This seasonal increase in productivity as the summer progresses is characteristic of lakes.
The results indicate that White Lake has suitable water quality for recreational uses such as and bathing.
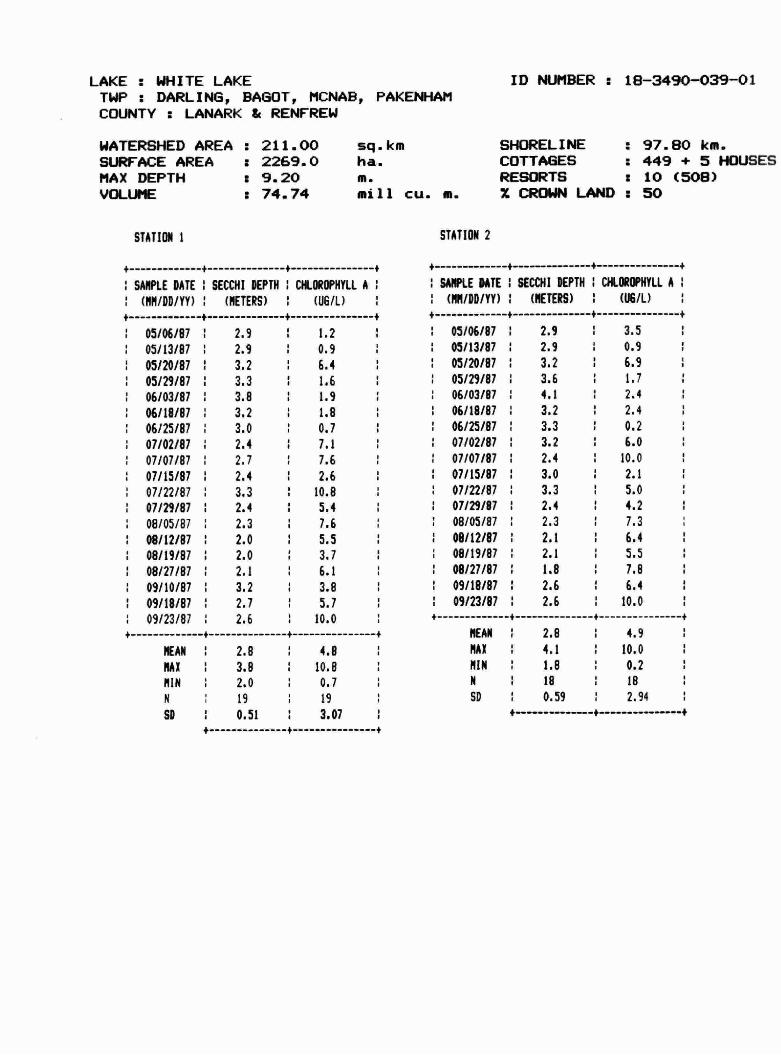
LAKE : WHITE LAKE TWP : DARLING, BAGOT, MCNAB, PAKENHAPI COUNTY : LANARK & RENFREW
WATERSHED AREA 211.00 SURFACE AREA : 2269.0 MAX DEPTH : 9.20 VOLUME : 74.14
ID NUMBER : 18-3490—039—0 1
SHORELINE : 97.80 km. COTTAGES 449 + 5 HOUSES RESORTS : 10 (508) X CROWN LAND : 50
+ + + +
09/23/87 2.6 Io.o
4.B I I
• Io.e • I
STATIOU I
sq. km ha. in. mill cu. in.
STATION 2
SAMPLE DATE SECCHI DEPTH CHLOROPHYLL A I I SAMPLE DATE I SECCHI DEPTH I CHLOROPHYLL A
(Mff/DD/YY) (METERS) I W6/L) I thMIDD/Yfl 1 (METERS) (US/I)
+ + + + + + I +
05/06/871 29 1 12 1 1 05/06/871 29 1 35
05/13/87 1 2.9 1 0.9 1 1 05/13/87 1 2.9 0.9
05/20/87 I 3.2 : 6.4 1 05/20/87 : 3.2 1 6.9
05/29/87 1 3.3 : 1.6 : : 05/29/87 1 3.6 1 1.7
06/03/87 1 3.8 1 1.9 06/03/87 1 4.1 2.4 1
06/18/87 3.2 1 1.8 1 06/18/87 1 3.2 1 2.4 1
1 06/25/87 1 3.0 1 0.7 1 1 06/25/87 1 3.3 I 0.2
07/02/87: 24 1 71 :07/02/87: 32 : 60 07/07/87 1 2.7 1 7.6 : 1 07/07/87 1 2.4 : 10.0
07/15/87: 24 1 26 1 107/15/87: 30 1 21
07/22/87 : 3.3 1 10.8 1 07/22/87 1 3.3 1 5.0
07/29/87 : 2.4 1 5.4 : 1 07/29/87 1 2.4 1 4.2
08/05/87 2.3 1 7.6 1 : 08/05/87 1 2.3 7.3
08/22/87 1 2.0 1 5.5 : I 08/12/87 1 2.1 1 6.4
08/19/87 1 2.0 1 3.7 1 1 08/19/87 1 2.1 : 5.5
1 08/27/87 I 2.1 1 6.1 : 1 08/27/87 1 1.8 1 7.8 1
1 09/10/87 1 3.2 i 3.8 1 09/18/87 1 2.7 : 5.7 1
1 09/18/87 1 2.6 1 6.4 1 09/23/87 1 2.6 1 10.0
+ + + +
MEAN 1 2.8 MAX 1 3.8
MIN 1 2.0 1 0.7
N 19 : 19
SD 1 0.51 1 3.07 + I +
+ + + +
MEAN 1 2.8 1 4.9 MAX I 4.1 1 20.0
MIN 1 1.8 I 0.2 N I 18 1 18
SD 1 0.59 1 2.94

LAKE : WHITE LAKE ID NUMBER : 10-3490—039—01 TWP : DARLING, BAGOT, MCNAB, PAKENHAM COUNTY : LANARK & RENFREW
WATERSHED AREA : 211.00 sq.km SHORELINE : 97.80 km. SURFACE AREA 2269.0 ha. COTTAGES : 449 + 5 HOUSES MAX DEPTH : 9.20 a. RESORTS : 10 (508) VOLUME : 74.74 miii cu. m. X CROWN LAND : 50
STATIONS I AND 2 COMBINED
+ + + +
SAMPLE DATE SECCHI DEPTH I CHLOROPHYLL A
(YEAR) I (METERS) I tUG/U + + + +
1972* 1.8 7.2
1973 1 2.6 6.5
1974 3.0 1 3.3
1975" 3.2 5.7
1976 2.4 1 9.6 1977 2.8 1 5.4 1978 3.2 1 5.6 1979 3.0 4.5 1980 2.7 8.0 1
1981 2.8 1 5.8
1982 1 2.4 5.1 1983 1 2.8 : 4.3 1984 1 2.7 5.4 1985 1 2.5 1 7.9
1 1986 1 2.9 1 5.0 1 1987 1 2.8 1 4.8 + + + +
MEAN 2.7 1 5.9
MAX 1 3.2 9.6 MEN 1 1.8 3.3
N 1 16 1 16
90 0.35 1 1.61 1
NOTE : * Based on less then 6 Teadings. *4 Recreational lakes included.
WHITE LAKE
A total of 12 samples were collected from June 10 to August 19. There was little seasonal variation in chlorophyll results but water clarity appeared to decline somewhat after mid summer.
The results indicate White Lake has very good water quality with very little algae present in the water of the lake.

LAKE : WHITE LAKE TWP : OLDEN COUNTY : FRONTENAC
ID NUMBER : 18—3430—031—01
WATERSHED AREA : 10.9 sq.km SURFACE AREA : 253 ha. MAX DEPTH : 29.6 VOLUME
SHORELINE km. COTTAGES : 14 (1972) RESORTS : 0 X CROWN LAND :
MAIM BASIN HISTORICAL RECORD
SAMPLE DATE : SECCHI DEPTH : CHLOROPHYLL A
(NM/DD/YY) : (METERS) (116/L)
SAMPLE DATE : SECCH1 DEPTH I CHLOROPHYLL A
(YEAR) (METERS) : (U6/L) + + + +
I 1975 I
I I
I
•
I
1
1
1
1
4.6 1
1 4.9 08/19/87 4.4
4.9 4.8 4.6 5.0
1.0
0.8 I 2.1
0.5 1.5
1.6
2.2
1.6 1.7
1.6 1 1.0
l.a
2.0 2.1
2.1
1.4 + + + +
MEAN 1 4.8 1 1.9
MAX 5.0 1 2.1
MIN 1 4.6 1.4
N 4 1 4
SD 1 0.17 1 0.34 + + +
+ + + +
MEAN 1 5.0 MAX 1 6.0 MIII 4.1
1 1.4
1 2.2 0.5
N 12 12
SO 1 0.60 0.51 + + +

VUKES LAKE
The very limited sampling that was conducted indicate that Yukes Lake has exceptionally clear water with extremely low levels of algae in the lake.
Six sets of measurements are required to adequately characterize the water quality of a lake. Preferably 12 or mote sets of measurements evenly timed from May until October are needed to define any seasonal trends if they are present.

LAKE u VUKES LAKE TWP z RRLJDENELL COUNTY r RENFREW
1D NUMBER : 19-3490—049—01
WATERSHED AREA z
SURFACE AREA : MAX DEPTH : 10
sq. km ha. a. miii Cu. a.
SHOREL INE COTTAGES RESORTS x LN4D
km.
I
I
£EKIRE LA&E HISTORICAL RECORD
SARPLE DATE I SECCHI DEPTH 1 ULORUPHYLL fl : (IM/DD/YY) flEas) I (ILL) I
+
09/06/87 1 8.1 1 0.8 09113181 1 9.6 0.6
1 09/20/87 1 9.1 1 0.7 S £ S
SMFLE DATE I S(CCHI DEPTH : CIUWOPHYLL A
(YEAR) I (IETERS) I
I.———— ——-——t———————————- ,- -
i,sit 1
+—————————————+——————
9.1 1
—4—
0.1 • I
—4
ItAN 1 9.1 1 0.7 1
NM 1 9.6 1 0.8 1
KIN 1 Li 1 0.6 1
U I,
4
I J , I I
SD : 0.45 1 0.10 1

\l I
TE ,ixcrAM: SOUTH I HAtWN H.
DATE SSUED TO
- -CAT. 23•115 PRINTED IN U. S. A