enrollment - university of alaska anchorage
TRANSCRIPT

Enro
llmen
t


2020 Fact Book - Enrollment
Student Credit Hours by Discipline within Campus/CollegeFall Semesters 2015-2019
Table 2.01
2015 2016 2017 2018 2019
43
Anchorage Campus College of Arts & Sciences
Alaska Native Studies 373 552 591 628 845 American Sign Language 620 516 576 604 516 Anthropology 2,143 2,138 1,854 1,299 1,429 Art 2,490 2,236 2,431 2,301 1,859 Astronomy 471 474 451 467 320 Biology 7,569 7,288 7,375 6,710 5,656 Chemistry 3,547 3,531 3,336 3,034 2,411 Chinese 200 180 152 100 87 Creative Writing & Literary Arts 195 188 160 140 137 Dance 555 483 473 301 265 English 6,834 6,751 1,609 1,522 1,199 Environmental Studies 296 365 405 397 330 French 534 468 398 386 298 Geography 429 381 342 324 321 Geology 1,765 1,710 1,811 1,703 1,388 German 441 442 360 382 307 History 2,781 3,000 3,058 2,508 2,261 Interdisciplinary Studies 132 132 96 192 108 International Studies 63 60 36 48 12 Japanese 698 516 588 494 457 Journalism & Public Communications 784 694 676 757 672 Linguistics 207 189 174 135 198 Mathematics 3,270 2,754 2,750 2,600 2,281 Microbiology 33 27 33 Music 2,619 2,255 2,274 2,140 1,491 National Student Exchange 217 172 138 40 116 Philosophy 2,160 2,145 1,914 1,869 1,569 Physics 2,337 1,774 1,747 1,551 1,244 Political Science 873 873 891 1,032 693 Psychology 5,899 5,518 5,121 5,138 4,954 Russian 180 196 212 112 100 Sociology 1,288 1,179 1,350 1,263 1,122 Spanish 1,216 1,199 1,102 943 730 Statistics 528 442 467 503 377 Theater 636 783 784 878 485 Women’s Studies 201 120 141 165 129

Enrollment - 2020 Fact Book
Student Credit Hours by Discipline within Campus/CollegeFall Semesters 2015-2019
Table 2.01
2015 2016 2017 2018 2019
44
Anchorage Campus - College of Arts & Sciences (continued) School of Education (SOE)
SOE: Counselor Education 252 78 28 SOE: Early Childhood 997 930 864 658 147 SOE: Early Childhood Development 59 91 37 69 SOE: Development & Leadership 780 651 495 820 883 SOE: Education 1,072 2,059 2,171 2,270 3,295 SOE: Educational Technology 3 SOE: Elementary Education 434 468 606 637 SOE: Engaged Leadership 27 SOE: Foundations 752 698 786 607 42 SOE: Physical Education 40 47 51 110 45 SOE: Research 108 75 75 78 15 SOE: Secondary Education 168 231 189 225 SOE: Special Education 754 637 648 658 338 SOE: Speech Language Pathology 252 273 222 268 230 SOE: Teaching and Learning 69 54 76 95 49
School of Education Total 5,740 6,319 6,211 6,463 5,113
College of Arts & Sciences Total 60,291 58,023 52,087 49,156 41,513
College of Business & Public Policy Accounting 2,796 2,430 2,385 2,208 2,019
Business Administration 5,245 5,597 5,842 5,969 5,648 Computer Information Systems 2,226 1,965 1,887 1,539 1,356 Economics 2,449 2,079 1,998 1,995 1,788 Logistics 285 156 99 192 210 Logistics Operations 264 258 153 141 216 Public Administration 222 198 162 237 132
College of Business & Public Policy Total 13,487 12,683 12,526 12,281 11,369
College of Engineering Applied Environmental Science & Technology 85 17 1
Arctic Engineering 177 186 174 171 Civil Engineering 627 845 883 911 779 Computer Science & Computer Engineering 1,117 1,252 1,503 1,488 1,511 Computer Science 222 201 177 42 Computer Systems Engineering 99 63 78 66 39 Electrical Engineering 776 744 786 662 606 Engineering 550 509 544 424 241 Engineering & Science Management 303 294 234 132 159 Engineering Science 1,233 1,240 1,362 1,069 1,010 Geographic Information Systems 228 276 318 240 183 Geomatics 386 524 427 484 352

2020 Fact Book - Enrollment
Student Credit Hours by Discipline within Campus/CollegeFall Semesters 2015-2019
Table 2.01
2015 2016 2017 2018 2019
45
Mechanical Engineering 917 982 1,164 1,264 921 Project Management 411 336 240 171 213
College of Engineering Total 7,131 7,469 7,891 7,124 6,014
College of Health Biomedical Program - WWAMI 36 39 5 5 4 COH Interprofessional 21 21 9 39 Civic Engagement & Learning 153 153 180 147 93 Dental Assisting 308 313 312 185 220 Dental Hygiene 375 422 392 212 193 Diagnostic Medical Sonography 106 99 126 129 162 Dietetics & Nutrition 1,119 1,022 1,000 1,090 1,031 Disability & Long-Term Support 43 6 9 57 30 Emergency Medical Technology 366 294 315 242 141 Fire Science 366 329 295 249 165 Health 36 183 Health Care Assisting 152 184 176 60 Health Science 721 1,011 1,278 1,603 1,490 Human Services 1,261 945 810 738 633 Justice 1,568 1,323 1,281 1,305 765 Legal Nurse Consultant 2 5 Legal Studies 561 525 687 570 732 Medical Assisting 887 952 787 702 509 Medical Laboratory Technology 658 780 705 685 702 Medicine Doctorate 357 718 700 700 738 Nursing 2,201 2,145 2,014 2,131 2,271 Nursing Doctorate 96 178 169 38 Nursing Science 2,708 2,772 3,024 3,203 3,367 Nursing Science Graduate 262 296 Pharmacy Technology 201 171 168 159 246 Physical Education & Recreation 604 495 442 463 388 Physical Education Professional 884 969 1,054 938 672 Physical Education 9 16 Physical Therapist Assistant 127 135 144 144 134 Radiologic Technology 454 555 552 535 484 Social Work 1,609 1,424 1,232 1,375 1,289 Surgical Technology 144 144 144
College of Health Total 17,988 17,985 18,026 18,050 17,142 Community & Technical College Aerospace Science ROTC 74 107 137 136 123 Air Traffi c Control 275 291 320 211 248 Architect Engineering Technology 425 573 500 388 341

Enrollment - 2020 Fact Book
Student Credit Hours by Discipline within Campus/CollegeFall Semesters 2015-2019
Table 2.01
2015 2016 2017 2018 2019
46
Anchorage Campus - Community & Technical College (continued) Auto/Diesel Technology 706 705 834 891 794
Aviation Maintenance Technology 1,204 1,004 980 1,037 1,136 Aviation Tech/Admin/Mgmt 1,056 1,023 1,143 1,047 795 Aviation Tech/Professional Piloting 444 453 607 396 467 Career & Technical Education 32 36 16 9 Communication 2,337 2,469 2,403 1,914 2,418 Computer & Networking Technology 1,000 852 728 617 508 Computer Information & Offi ce Systems 126 68 Construction Management 691 450 417 366 393 Counseling 53 148 20 81 126 Culinary Arts 545 643 544 426 515 English as a Second Language 393 324 Guidance 834 699 576 Hospitality Administration 54 150 Library Science 21 23 11 1 15 Mathematics 6,492 6,506 5,746 5,326 4,728 Military Science 87 95 76 77 88 Occupational Safety & Health 634 493 430 411 318 Preparatory English 2,003 1,924 241 48 56 Statistics 489 399 426 477 585 Technology 179 177 144 201 171 University Studies 510 1,016 Welding Technology 650 708 577 350 358 Writing 6,180 6,179 5,847
Community & Technical College Total 20,750 20,170 23,056 21,153 21,196
Honors College Complex Systems 9 18 15
Honors 274 334 213 168 227 Undergrad Research & Scholarship 36
Honors College Total 283 388 228 168 227
Chugiak-Eagle River Accounting 69 51 81
American Sign Language 64 132 116 104 60 Anthropology 234 177 135 108 Art 147 255 132 120 45 Biology 180 201 159 114 57 Business Administration 261 267 240 171 Chemistry 177 105 75 45 Communication 444 375 393 381 111 Computer Information & Offi ce Systems 7

2020 Fact Book - Enrollment
Student Credit Hours by Discipline within Campus/CollegeFall Semesters 2015-2019
Table 2.01
2015 2016 2017 2018 2019
47
Computer Information Systems 96 66 36 51 Dietetics & Nutrition 66 Economics 186 189 231 195 120 English 771 993 72 57 Environmental Studies 69 Geography 117 117 90 66 Geology 265 186 106 96 Guidance 231 303 438 219 History 249 327 333 336 69 Human Services 27 Justice 42 9 6 6 Mathematics 969 1,109 1,030 625 123 Medical Assisting 45 57 48 39 42 Music 63 36 51 84 Philosophy 339 324 129 168 69 Political Science 93 120 135 111 Psychology 243 264 219 216 75 Spanish 100 96 88 Statistics 207 168 183 243 99 Writing 951 585 222
Chugiak-Eagle River Total 5,692 5,927 5,308 4,378 1,092
Military Programs Anthropology 96 93
Art 123 84 Biology 36 128 52 Chemistry 33 24 45 27 Communication 144 90 60 24 English 450 309 History 297 171 54 54 Mathematics 261 168 169 93 40 Music 27 18 24 Philosophy 135 192 Political Science 45 Preparatory English 33 Psychology 132 99 69 45 30 Spanish 52 32 Technology 51 Writing 33 30
Military Programs Total 1,915 1,408 421 276 152
Anchorage Campus Total 127,536 124,052 119,543 112,586 98,705

Enrollment - 2020 Fact Book
Student Credit Hours by Discipline within Campus/CollegeFall Semesters 2015-2019
Table 2.01
2015 2016 2017 2018 2019
48
Kenai Peninsula College Anchorage Extension Site
Electronics Technology 60 45 Petroleum Technology 39 Physics 15 Process Technology 624 410 227 Technology 3 3
Anchorage Extension Site Total 687 509 230
Kachemak Bay Campus American Sign Language 16 Anthropology 105 Art 241 89 72 137 99 Astronomy 24 Biology 221 268 313 463 509 Business Administration 84 123 90 102 99 Chemistry 116 130 114 105 207 Communication 99 93 102 57 51 Community Education 12 Computer Science 39 Creative Writing & Literary Arts 27 Dietetics & Nutrition 141 165 222 273 195 Economics 21 Education 8 7 Education: Early Childhood 48 Emergency Medical Technology 45 English 263 380 215 177 204 Fire Science 24 12 French 12 Geology 4 10 39 49 8 Health Care Assisting 42 60 60 60 60 Health Science 75 90 93 30 24 History 126 213 360 387 303 Human Services 159 186 162 138 117 Humanities 93 87 93 39 Justice 111 150 99 69 87 Mathematics 241 332 388 403 332 Medical Assisting 15 18

2020 Fact Book - Enrollment
Student Credit Hours by Discipline within Campus/CollegeFall Semesters 2015-2019
Table 2.01
2015 2016 2017 2018 2019
49
Physical Education & Recreation 3 10 Physics 15 6 6 18 Political Science 36 69 36 30 42 Preparatory English 30 Process Technology 6 3 Psychology 255 208 378 261 291 Social Work 27 Statistics 28 28 76 Theater 54 30 Welding Technology 40 36 44 28 Writing 252 201 126
Kachemak Bay Campus Total 2,659 2,811 3,187 3,160 2,887 Kenai River Campus Accounting 177 204 252 306 210 Alaska Native Studies 97 116 124 85 192 American Sign Language 32 Anthropology 216 158 194 273 159 Art 288 270 264 228 246 Astronomy 50 40 Biology 385 406 571 421 452 Business Administration 210 321 258 231 249 Chemistry 626 639 544 595 312 Communication 486 465 378 426 261 Community Education 4 9 Computer Information & Offi ce Systems 8 2 2 Computer Information Systems 240 225 141 126 87 Computer Science 117 51 9 Dietetics & Nutrition 78 63 Economics 42 48 Education 174 46 370 123 42 Education: Early Childhood 134 122 125 90 60 Education: Elementary Education 15 10 29 Education: Foundations 78 87 111 Electronics Technology 206 280 171 61 68 Emergency Medical Technology 78 168 82 120 83 English 909 1,056 195 81 15 Environmental Studies 85 58 35 25 30 Fire Science 153 75 French 40 28 36 Geology 90 87 93 98 Guidance 27 51 36

Enrollment - 2020 Fact Book
Student Credit Hours by Discipline within Campus/CollegeFall Semesters 2015-2019
Table 2.01
2015 2016 2017 2018 2019
50
Kenai Peninsula College - Kenai River Campus (continued) Health Care Assisting 60 60 48 60 History 162 156 201 117 63 Human Services 15 18 63 54 86 Japanese 28 72 40 44 28 Justice 66 60 63 51 66 Library Science 14 10 5 9 2 Linguistics 9 Logistics Operations 39 48 24 33 27 Mathematics 2,051 2,583 2,173 2,146 1,557 Medical Assisting 30 30 Music 93 105 81 102 51 Occupational Safety & Health 36 Paramedical Technology 168 108 144 144 228 Petroleum Technology 166 126 108 69 36 Philosophy 51 129 93 Physical Education & Recreation 10 21 Physics 357 194 183 157 180 Political Science 9 3 30 30 30 Preparatory English 210 240 Process Technology 959 768 698 868 739 Psychology 397 317 295 279 368 Social Work 6 Sociology 72 114 114 72 72 Spanish 52 44 56 32 36 Statistics 341 263 297 318 171 University Studies 21 Welding Technology 128 180 148 176 148 Writing 939 1,074 1,059
Kenai River Campus Total 10,292 10,395 9,721 9,467 7,814
Resurrection Bay Extension Site Biology 36 English 21 15 Mathematics 27 27 30 Philosophy 21 Physical Education & Recreation 9 Political Science 36 54 18 27 Writing 21 18 33
Resurrection Bay Extension Site Total 93 63 105 36 96
Kenai Peninsula College Total 13,731 13,778 13,243 12,663 10,797

2020 Fact Book - Enrollment
Student Credit Hours by Discipline within Campus/CollegeFall Semesters 2015-2019
Table 2.01
2015 2016 2017 2018 2019
51
Kodiak College Accounting 189 255 180 216 204 Alaska Native Studies 56 188 108 109 99 Anthropology 114 132 183 123 90 Architectural & Engineering Technology 54 54 18 18 Art 59 36 102 105 93 Auto/Diesel Technology 54 Aviation Tech/Professional Piloting 42 27 Biology 397 353 450 467 376 Business Administration 261 228 258 282 306 Chemistry 67 95 70 65 Civic Engagement & Learning 45 12 Communication 69 69 60 48 24 Computer Information & Offi ce Systems 105 35 33 19 32 Computer Information Systems 96 78 69 60 39 Construction Management 32 Dietetics & Nutrition 105 Economics 54 51 57 66 63 Education 13 29 Education: Early Childhood 102 75 51 102 57 Education: Elementary Education 38 41 36 51 Education: Foundations 51 27 24 Education: Special Education 96 51 48 45 Electronics Technology 44 28 English 423 360 117 30 21 Environmental Studies 41 Guidance 39 27 History 54 18 48 36 9 Humanities 45 45 39 24 24 Justice 42 21 Liberal Studies: Integrated Core 27 Liberal Studies: Integrated Science 45 Mathematics 246 261 159 93 60 Medical Assisting 92 94 102 114 99 Music 39 12 Occupational Safety & Health 59 3 Philosophy 21 36 30 18 3 Physical Education & Recreation 14 15 8 12 19

Enrollment - 2020 Fact Book
Student Credit Hours by Discipline within Campus/CollegeFall Semesters 2015-2019
Table 2.01
2015 2016 2017 2018 2019
52
Kodiak College (continued) Preparatory English 114 114 Psychology 100 96 154 111 115 Russian 56 Sociology 153 162 147 108 99 Spanish 12 32 56 108 Statistics 30 18 15 30 36 Technology 4 4 University Studies 24 Welding Technology 66 342 279 177 239 Writing 300 330 358
Kodiak College Total 3,328 3,460 3,400 3,044 2,814
Matanuska-Susitna College Accounting 294 276 285 252 258 American Sign Language 184 184 64 184 136 Anthropology 585 546 417 411 414 Art 561 564 474 417 417 Auto/Diesel Technology 3 Biology 983 980 1,018 910 740 Business Administration 657 675 600 423 540 Chemistry 424 435 446 436 390 Communication 342 339 345 261 342 Computer & Networking Technology 349 352 307 345 288 Computer Information & Offi ce Systems 245 173 207 114 18 Computer Information Systems 105 135 153 120 129 Computer Science 12 Culinary Arts 2 Dance 14 Dental Assisting 9 Dietetics & Nutrition 42 57 33 18 Economics 270 177 261 150 159 Education: Early Childhood 54 48 Education: Elementary Education 122 48 Education: Foundations 51 42 Emergency Medical Technology 180 286 184 198 128 Engineering 53 59 Engineering Science 45 30
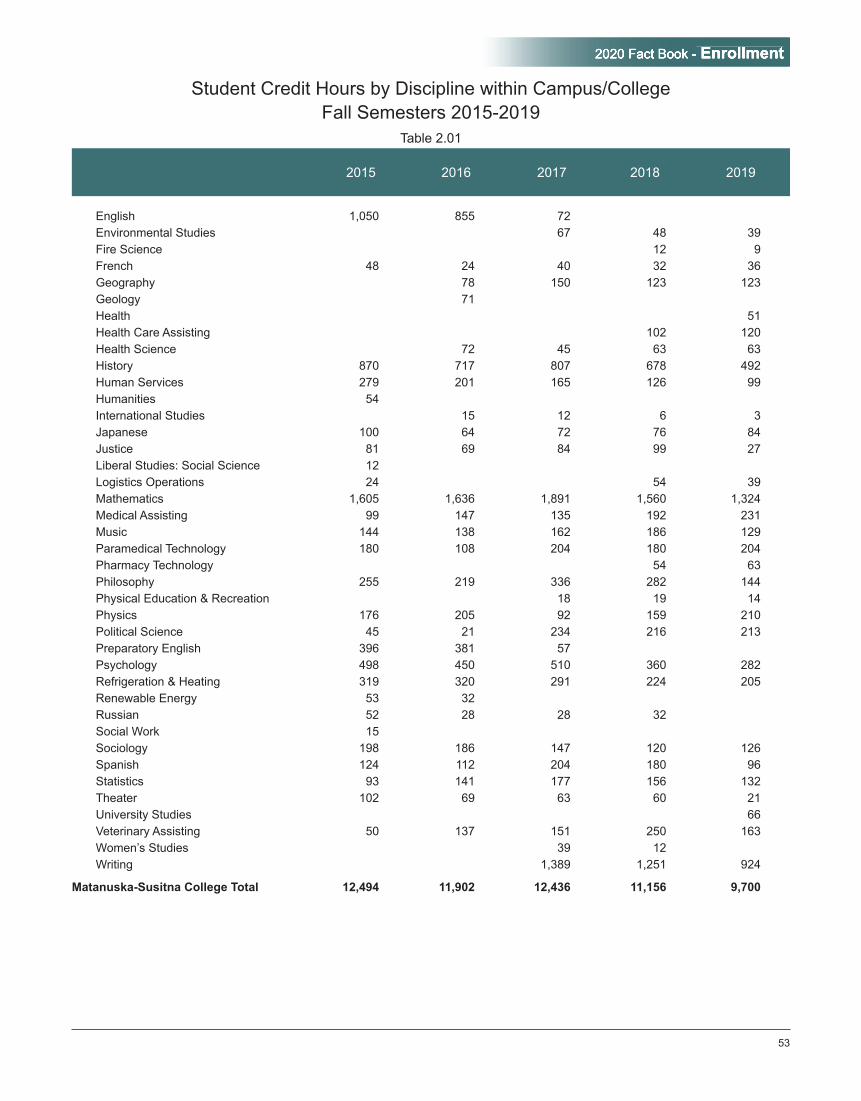
2020 Fact Book - Enrollment
Student Credit Hours by Discipline within Campus/CollegeFall Semesters 2015-2019
Table 2.01
2015 2016 2017 2018 2019
53
English 1,050 855 72 Environmental Studies 67 48 39 Fire Science 12 9 French 48 24 40 32 36 Geography 78 150 123 123 Geology 71 Health 51 Health Care Assisting 102 120 Health Science 72 45 63 63 History 870 717 807 678 492 Human Services 279 201 165 126 99 Humanities 54 International Studies 15 12 6 3 Japanese 100 64 72 76 84 Justice 81 69 84 99 27 Liberal Studies: Social Science 12 Logistics Operations 24 54 39 Mathematics 1,605 1,636 1,891 1,560 1,324 Medical Assisting 99 147 135 192 231 Music 144 138 162 186 129 Paramedical Technology 180 108 204 180 204 Pharmacy Technology 54 63 Philosophy 255 219 336 282 144 Physical Education & Recreation 18 19 14 Physics 176 205 92 159 210 Political Science 45 21 234 216 213 Preparatory English 396 381 57 Psychology 498 450 510 360 282 Refrigeration & Heating 319 320 291 224 205 Renewable Energy 53 32 Russian 52 28 28 32 Social Work 15 Sociology 198 186 147 120 126 Spanish 124 112 204 180 96 Statistics 93 141 177 156 132 Theater 102 69 63 60 21 University Studies 66 Veterinary Assisting 50 137 151 250 163 Women’s Studies 39 12 Writing 1,389 1,251 924
Matanuska-Susitna College Total 12,494 11,902 12,436 11,156 9,700

Enrollment - 2020 Fact Book
Student Credit Hours by Discipline within Campus/CollegeFall Semesters 2015-2019
Table 2.01
2015 2016 2017 2018 2019
54
Prince William Sound College Anthropology 42 87 69
Art 15 7 4 Astronomy 77 86 80 96 Biology 48 78 64 25 36 Business Administration 15 27 39 Chemistry 5 Communication 57 69 54 63 78 Computer Information & Offi ce Systems 52 6 6 3 Computer Information Systems 30 18 9 6 Computer Science 24 24 Dietetics & Nutrition 39 Education 21 14 23 1 Education: Development & Leadership 24 Emergency Medical Technology 84 48 15 9 English 162 171 18 52 Environmental Studies 28 19 Film 15 18 18 18 Geology 109 113 90 85 111 Guidance 27 24 21 History 57 90 132 72 Human Services 64 12 Humanities 42 30 48 39 30 Industrial Technology 249 613 660 723 755 Justice 21 30 45 Marine Technology 493 Mathematics 152 161 159 326 371 Medical Assisting 63 102 117 111 102 Music 36 21 30 36 Occupational Safety & Health 15 147 96 168 Outdoor Studies 102 Physical Education & Recreation 19 87 84 74 77 Physical Education Professional 21 41 64 83 Physics 18 27 Political Science 75 39 42 24 Psychology 33 126 66 30 Sociology 36
Spanish 44 Statistics 30 Technology 33 Theater 30 12 24 27 University Studies 21 18 Writing 153 228 99
Total 2,190 2,015 2,105 2,421 2,350

2020 Fact Book - Enrollment
Student Credit Hours by Discipline within Campus/CollegeFall Semesters 2015-2019
Table 2.01
2015 2016 2017 2018 2019
55
Source: UA Data Strategy and Institutional Research (DSIR) Decision Support Database (DSD) data system at semester closing freeze.
Notes: 1. Student credit hours are based on course level, representing credit courses at the 050 level and above, and do not include auditors. 2. Totals may not equal the sum of all categories due to rounding. 3. A restructuring of English and Math GER courses, starting fall 2017, have shifted their credit hours from College of Arts & Sciences to Community & Technical College. Additionally, English GER courses have been renamed to Writing.
Copper Basin Extension Center Art 54 42 72 45 18
Biology 56 Computer Information & Offi ce Systems 15 Education 28 18 Emergency Medical Technology 21 English 15 Health Care Assisting 36 History 21 Mathematics 33 44 Music 54 39 27 48 42 Political Science 33 33 Sociology 69 51 60 15 48 Spanish 84 64 56 36 84
Copper Basin Extension Center Total 309 358 263 239 192
Cordova Extension Center Biology 8
Computer Information & Offi ce Systems 12 Education 36 English 45 33 History 33 6 57 36 Mathematics 28 20 32 32 40 Physical Education Professional 7 Political Science 15 45 Writing 30
Cordova Extension Center Total 162 74 119 77 83
Prince William Sound College Total 2,660 2,447 2,487 2,737 2,625
UAA Total 159,749 155,639 151,109 142,186 124,641

Enrollment - 2020 Fact Book
56
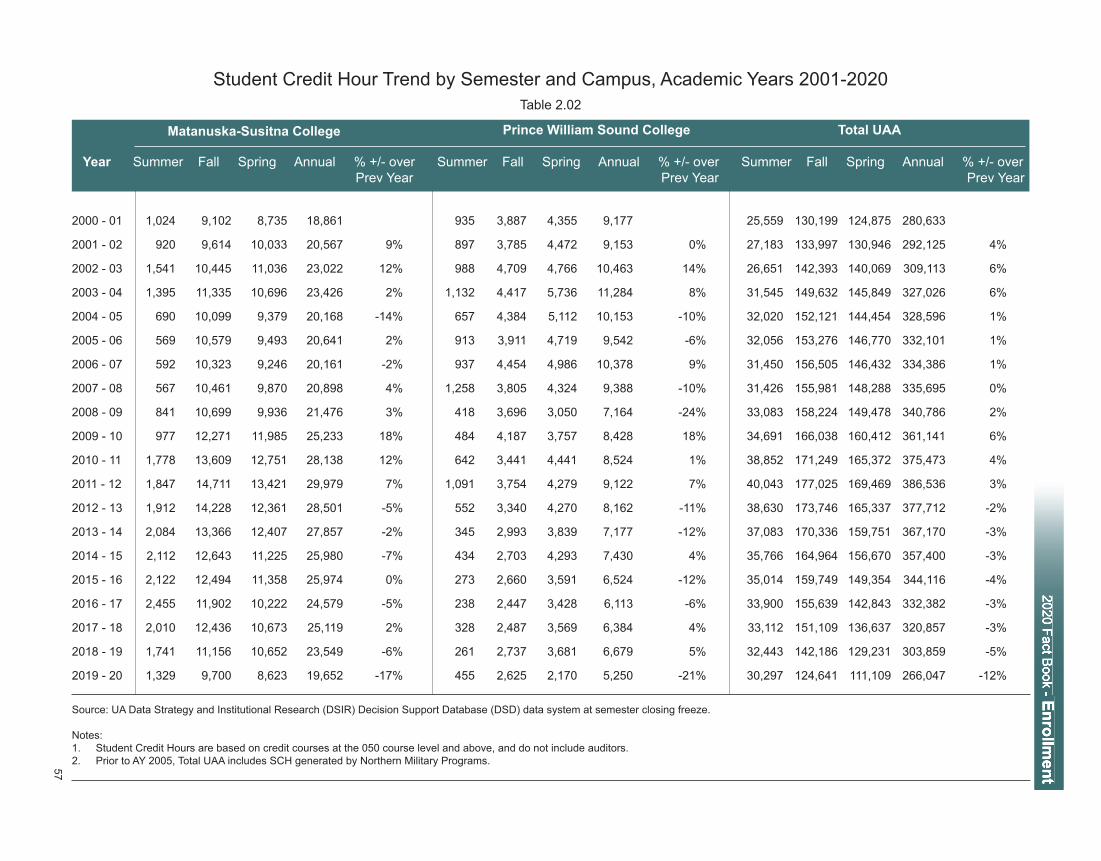
Student Credit Hour Trend by Semester and Campus, Academic Years 2001-2020Table 2.02
Anchorage Campus Kenai Peninsula College Kodiak College
Year Summer Fall Spring Annual % +/- over Summer Fall Spring Annual % +/- over Summer Fall Spring Annual % +/- over Prev Year Prev Year Prev Year
2000 - 01 22,478 103,783 98,054 224,315 607 8,602 9,084 18,293 65 2,909 2,862 5,836
2001 - 02 23,762 106,149 102,242 232,153 4% 760 9,712 9,362 19,834 8% 153 2,998 3,095 6,246 7%
2002 - 03 23,133 112,999 109,799 245,930 6% 359 9,274 9,065 18,698 -6% 115 3,080 3,622 6,817 9%
2003 - 04 27,493 119,871 116,406 263,769 7% 727 9,509 8,396 18,632 0% 137 2,935 3,120 6,192 -9%
2004 - 05 29,718 124,891 117,540 272,148 3% 489 8,958 8,904 18,351 -2% 101 2,406 2,529 5,036 -19%
2005 - 06 29,397 127,294 120,947 277,638 2% 567 9,277 8,972 18,816 3% 157 2,215 2,639 5,011 -1%
2006 - 07 29,102 129,625 120,528 279,254 1% 782 9,883 9,230 19,895 6% 37 2,220 2,442 4,699 -6%
2007 - 08 28,575 129,803 121,429 279,807 0% 885 9,567 9,708 20,160 1% 141 2,345 2,957 5,443 16%
2008 - 09 30,409 131,305 123,090 284,803 2% 1,228 10,137 10,707 22,072 10% 188 2,387 2,696 5,271 -3%
2009 - 10 31,438 135,284 128,769 295,490 4% 1,326 12,270 12,901 26,497 20% 466 2,027 3,000 5,493 4%
2010 - 11 33,916 138,504 130,713 303,132 3% 2,116 13,141 13,815 29,072 10% 400 2,555 3,652 6,607 20%
2011 - 12 33,418 139,882 132,334 305,633 1% 3,040 15,403 15,301 33,744 16% 648 3,276 4,134 8,058 22%
2012 - 13 32,196 137,666 130,075 299,937 -2% 3,237 14,859 14,755 32,851 -3% 733 3,653 3,876 8,262 3%
2013 - 14 31,078 135,749 124,372 291,199 -3% 2,792 14,695 14,840 32,327 -2% 784 3,533 4,293 8,610 4%
2014 - 15 29,491 130,469 122,128 282,088 -3% 3,030 15,734 14,823 33,587 4% 699 3,415 4,201 8,315 -3%
2015 - 16 28,408 127,536 118,447 274,390 -3% 3,417 13,731 12,487 29,635 -12% 794 3,328 3,471 7,593 -9%
2016 - 17 27,244 124,052 112,844 264,140 -4% 3,164 13,778 12,937 29,879 1% 799 3,460 3,412 7,671 1%
2017 - 18 26,710 119,543 107,312 253,565 -4% 3,220 13,243 11,937 28,400 -5% 844 3,400 3,146 7,390 -4%
2018 - 19 26,249 112,586 100,971 239,805 -5% 3,386 12,663 11,157 27,206 -4% 806 3,044 2,770 6,620 -10%
2019 - 20 25,080 98,705 88,747 212,532 -11% 2,804 10,797 9,172 22,773 -16% 629 2,814 2.398 5,841 -12%
2020 Fact Book - Enrollment
57
Student Credit Hour Trend by Semester and Campus, Academic Years 2001-2020Table 2.02
Matanuska-Susitna College Prince William Sound College Total UAA
Year Summer Fall Spring Annual % +/- over Summer Fall Spring Annual % +/- over Summer Fall Spring Annual % +/- over Prev Year Prev Year Prev Year
2000 - 01 1,024 9,102 8,735 18,861 935 3,887 4,355 9,177 25,559 130,199 124,875 280,633
2001 - 02 920 9,614 10,033 20,567 9% 897 3,785 4,472 9,153 0% 27,183 133,997 130,946 292,125 4%
2002 - 03 1,541 10,445 11,036 23,022 12% 988 4,709 4,766 10,463 14% 26,651 142,393 140,069 309,113 6%
2003 - 04 1,395 11,335 10,696 23,426 2% 1,132 4,417 5,736 11,284 8% 31,545 149,632 145,849 327,026 6%
2004 - 05 690 10,099 9,379 20,168 -14% 657 4,384 5,112 10,153 -10% 32,020 152,121 144,454 328,596 1%
2005 - 06 569 10,579 9,493 20,641 2% 913 3,911 4,719 9,542 -6% 32,056 153,276 146,770 332,101 1%
2006 - 07 592 10,323 9,246 20,161 -2% 937 4,454 4,986 10,378 9% 31,450 156,505 146,432 334,386 1%
2007 - 08 567 10,461 9,870 20,898 4% 1,258 3,805 4,324 9,388 -10% 31,426 155,981 148,288 335,695 0%
2008 - 09 841 10,699 9,936 21,476 3% 418 3,696 3,050 7,164 -24% 33,083 158,224 149,478 340,786 2%
2009 - 10 977 12,271 11,985 25,233 18% 484 4,187 3,757 8,428 18% 34,691 166,038 160,412 361,141 6%
2010 - 11 1,778 13,609 12,751 28,138 12% 642 3,441 4,441 8,524 1% 38,852 171,249 165,372 375,473 4%
2011 - 12 1,847 14,711 13,421 29,979 7% 1,091 3,754 4,279 9,122 7% 40,043 177,025 169,469 386,536 3%
2012 - 13 1,912 14,228 12,361 28,501 -5% 552 3,340 4,270 8,162 -11% 38,630 173,746 165,337 377,712 -2%
2013 - 14 2,084 13,366 12,407 27,857 -2% 345 2,993 3,839 7,177 -12% 37,083 170,336 159,751 367,170 -3%
2014 - 15 2,112 12,643 11,225 25,980 -7% 434 2,703 4,293 7,430 4% 35,766 164,964 156,670 357,400 -3%
2015 - 16 2,122 12,494 11,358 25,974 0% 273 2,660 3,591 6,524 -12% 35,014 159,749 149,354 344,116 -4%
2016 - 17 2,455 11,902 10,222 24,579 -5% 238 2,447 3,428 6,113 -6% 33,900 155,639 142,843 332,382 -3%
2017 - 18 2,010 12,436 10,673 25,119 2% 328 2,487 3,569 6,384 4% 33,112 151,109 136,637 320,857 -3%
2018 - 19 1,741 11,156 10,652 23,549 -6% 261 2,737 3,681 6,679 5% 32,443 142,186 129,231 303,859 -5%
2019 - 20 1,329 9,700 8,623 19,652 -17% 455 2,625 2,170 5,250 -21% 30,297 124,641 111,109 266,047 -12%
Source: UA Data Strategy and Institutional Research (DSIR) Decision Support Database (DSD) data system at semester closing freeze.
Notes: 1. Student Credit Hours are based on credit courses at the 050 course level and above, and do not include auditors. 2. Prior to AY 2005, Total UAA includes SCH generated by Northern Military Programs.

Enrollment - 2020 Fact Book
Matriculation Campus
Headcount Enrollment (Seat Count) Student Credit Hours
Anc
hora
ge
Ken
ai
Kod
iak
Mat
-Su
PW
SC
Non
UAA
TO
TAL
58
e-Learning: Origin of Courses vs. Origin of Students Admitted, Academic Years 2016-2020Table 2.03
Anc
hora
ge
Ken
ai
Kod
iak
Mat
-Su
PW
SC
Non
UAA
TO
TAL
Campus that
Provides DistanceCourses
Anc
hora
ge
Ken
ai
Kod
iak
Mat
-Su
PW
SC
Non
UAA
TO
TAL
Anchorage Campus 2015 - 2016 8,661 109 34 172 12 336 9,287 17,900 129 46 258 20 424 18,777 52,286 386 136 763 58 1,151 54,7802016 - 2017 8,737 117 37 167 14 380 9,418 19,420 168 42 254 19 465 20,368 57,027 502 116 751 57 1,216 59,6692017 - 2018 9,483 154 39 158 23 594 10,418 21,513 226 53 270 33 704 22,799 62,665 498 141 805 80 1,609 65,7982018 - 2019 10,144 134 44 169 24 618 11,105 23,488 194 75 282 31 798 24,868 68,501 526 216 836 88 1,839 72,0062019 - 2020 9,919 190 40 155 27 771 11,065 23,303 306 60 254 36 1,071 25,030 66,703 623 172 745 83 2,298 70,624
Kenai Peninsula College 2015 - 2016 2,300 757 46 131 12 191 3,385 3,755 1,712 77 200 17 226 5,987 11,310 4,941 227 605 51 745 17,8792016 - 2017 2,437 656 51 178 15 398 3,690 3,996 1,561 78 279 18 513 6,445 11,889 4,503 231 821 56 1,765 19,2652017 - 2018 2,644 616 39 149 17 247 3,679 4,436 1,516 79 246 33 326 6,636 13,118 4,362 239 726 91 1,065 19,6012018 - 2019 2,582 658 36 143 15 268 3,673 4,455 1,564 61 221 22 356 6,679 13,013 4,517 170 653 66 1,067 19,4862019 - 2020 2,129 593 57 129 19 230 3,129 3,678 1,568 87 201 29 293 5,856 10,624 4,507 264 593 84 930 17,002
Kodiak College 2015 - 2016 848 32 214 46 9 57 1,202 1,269 41 424 69 10 72 1,885 3,447 118 1,113 189 24 189 5,080 2016 - 2017 808 38 216 94 8 63 1,215 1,171 50 450 127 10 81 1,889 3,189 143 1,302 327 32 219 5,2122017 - 2018 850 35 208 61 4 63 1,214 1,259 49 467 85 6 100 1,966 3,399 133 1,329 227 18 243 5,3492018 - 2019 868 46 137 68 7 58 1,170 1,241 70 289 86 7 93 1,786 3,350 186 799 249 19 224 4,8272019 - 2020 725 37 161 51 10 38 1,016 1,079 49 303 66 17 62 1,576 2,899 133 863 194 42 156 4,287
Matanuska-Susitna College 2015 - 2016 911 24 9 358 3 39 1,331 1,216 41 15 588 3 49 1,912 3,585 102 40 1,621 9 131 5,4882016 - 2017 789 18 8 360 7 34 1,211 991 21 12 614 7 42 1,687 2,892 55 29 1,606 21 109 4,7122017 - 2018 722 11 5 374 2 29 1,141 935 14 5 670 2 32 1,658 2,757 42 13 1,721 6 101 4,6402018 - 2019 656 13 4 352 1 22 1,037 809 17 6 544 2 27 1,405 2,424 49 17 1,587 6 74 4,1572019 - 2020 623 14 4 235 2 25 894 779 15 6 344 2 26 1,172 2,338 45 17 1,081 6 78 3,565

2020 Fact Book - Enrollment
59
e-Learning: Origin of Courses vs. Origin of Students Admitted, Academic Years 2016-2020Table 2.03
Matriculation Campus
Headcount Enrollment (Seat Count) Student Credit Hours
A
ncho
rage
Ken
ai
Kod
iak
Mat
-Su
PW
SC
Non
UAA
TO
TAL
Anc
hora
ge
Ken
ai
Kod
iak
Mat
-Su
PW
SC
Non
UAA
TO
TAL
Anc
hora
ge
Ken
ai
Kod
iak
Mat
-Su
PW
SC
Non
UAA
TO
TAL
Campus that
Provides DistanceCourses
Source: UA Data Strategy and Institutional Research (DSIR) Decision Support Database (DSD) data system at semester closing freeze.
Notes:1. Enrollment includes auditors. Student credit hours include audit hours. 2. An Academic Year (AY) includes summer, fall and spring semesters, starting with summer as the fi rst term counted.3. Totals may not equal the sum of all categories due to rounding.4. Distance courses are 0% to 50% location based using specifi c Banner codes 0, 1, 2 where: 0 = 0% location based; 1 = 1-20% location based; 2 = 21-50% location based. Courses included in this
report are session codes 0, 1, and 2.
Prince William Sound College 2015 - 2016 125 10 7 3 131 41 315 167 10 10 3 323 54 567 460 32 24 9 923 153 1,6012016 - 2017 296 21 3 27 136 52 534 404 24 3 37 290 68 826 1,049 70 9 99 831 183 2,2412017 - 2018 408 20 12 20 86 36 580 550 21 14 25 193 47 850 1,463 61 40 71 525 122 2,2822018 - 2019 494 38 9 45 91 39 715 617 44 11 52 244 47 1,015 1,675 128 31 149 695 140 2,8182019 - 2020 394 27 16 28 96 34 595 506 35 24 43 190 43 841 1,402 96 67 114 549 120 2,348
UAA Total 2015 - 2016 10,008 808 247 521 145 606 12,198 24,307 1,933 572 1,118 373 825 29,128 71,088 5,579 1,540 3,187 1,065 2,369 84,8282016 - 2017 10,041 712 247 536 150 830 12,402 25,982 1,824 585 1,311 344 1,169 31,215 76,046 5,273 1,687 3,604 997 3,492 91,0992017 - 2018 10,765 708 238 545 109 901 13,177 28,693 1,826 618 1,296 267 1,209 33,909 83,402 5,096 1,762 3,550 720 3,140 97,6702018 - 2019 11,329 720 160 524 114 911 13,657 30,610 1,889 442 1,185 306 1,321 35,753 88,963 5,406 1,233 3,474 874 3,344 103,2942019 - 2020 10,933 716 189 391 122 1,027 13,292 29,345 1,973 480 908 274 1,495 34,475 83,966 5,404 1,383 2,727 764 3,582 97,826
