ensemble of ground subsidence hazard maps using fuzzy logic3dgis.uos.ac.kr/papers/ensemble of ground...
TRANSCRIPT
Cent. Eur. J. Geosci. • 6(2) • 2014 • 207-218DOI: 10.2478/s13533-012-0175-y
Central European Journal of Geosciences
Ensemble of Ground Subsidence Hazard Maps usingFuzzy Logic
Research Article
Inhye Park1, Jiyeong Lee1, Saro Lee2,3∗
1 Department of Geoinformatics, University of Seoul, Siripdae-gil 13, Dongdaemun-gu, Seoul 130-743, Republic of Korea
2 Geoscience Information Center, Korea Institute of Geoscience & Mineral Resources (KIGAM), Gwahang-no 124, Yuseong-gu,Daejeon, 305-350, Korea
3 Korea University of Science and Technology, 217 Gajeong-ro Yuseong-gu, Daejeon 305-350, Korea
Received 06 November 2013; accepted 17 February 2014
Abstract: Hazard maps of ground subsidence around abandoned underground coal mines (AUCMs) in Samcheok, Korea,were constructed using fuzzy ensemble techniques and a geographical information system (GIS). To evaluatethe factors related to ground subsidence, a spatial database was constructed from topographic, geologic, minetunnel, land use, groundwater, and ground subsidence maps. Spatial data, topography, geology, and variousground-engineering data for the subsidence area were collected and compiled in a database for mapping ground-subsidence hazard (GSH). The subsidence area was randomly split 70/30 for training and validation of the models.The relationships between the detected ground-subsidence area and the factors were identified and quantifiedby frequency ratio (FR), logistic regression (LR) and artificial neural network (ANN) models. The relationshipswere used as factor ratings in the overlay analysis to create ground-subsidence hazard indexes and maps. Thethree GSH maps were then used as new input factors and integrated using fuzzy-ensemble methods to makebetter hazard maps. All of the hazard maps were validated by comparison with known subsidence areas thatwere not used directly in the analysis. As the result, the ensemble model was found to be more effective in termsof prediction accuracy than the individual model.
Keywords: Ensemble modeling • fuzzy logic • ground subsidence • abandoned underground coal mine • GIS • Korea© Versita Sp. z o.o.
1. Introduction
Ground subsidence is a geological hazard that has variouscauses, including changes in mining activity, excessivegroundwater extraction, earthquake and volcanic activity,floods, and sudden or progressive ground collapse.It is also time-dependent deformation of the surface∗E-mail: [email protected]
topography caused by readjusting the overburden abovevoids, such as those created by underground mining.Subsidence can result in major financial losses and poserisks to human life [1].The coal industry played a major role in the developmentof the Korean economy from the 1960s to the late 1980s.However, most of these coal mines were abandoned in the1990s when the profitability of the industry plummeted.Of the 173 coalmines operating in 1988 in Jeongseon,Kangwon-do (the largest coal mining region in Korea),none are in operation today. In addition, the water flowing207
Ensemble of Ground Subsidence Hazard Maps
through these mines is contaminated with heavy metals,and eventually pollutes rivers and soil.The subsidence of underground mining cavities canthreaten human life, property, and infrastructure,including railways, roads, houses, and other buildings.Ground recovery following subsidence is difficult andrehabilitation is expensive. Most countermeasuresfor ground subsidence involve simple reinforcementafter the ground has already subsided [2–4]. As aresult, it is important to have a systematic predictionand management plan for areas experiencing groundsubsidence.Recent studies have analyzed ground subsidence hazardsusing the results of geological and geotechnicalinvestigations and of probability, statistical, fuzzy algebra,and artificial neural network models in tandem with GISapplications [2, 4–15]. Some studies have assessedand identified areas with a high subsidence risk. Forexample, Ambrožic and Turk [5] and Kim et al. [9]applied ANN models to predict ground subsidence. As aprobabilistic model, Zahiri et al. [16] applied the weights-of-evidence technique to derive the rock fall potentialassociated with mining-induced subsidence. Kim etal. [6] and Oh and Lee [14] assessed the spatial groundsubsidence hazard potential using GIS techniques withfrequency ratio and weights-of-evidence models. Oh etal. [15] applied probabilistic-based sensitivity analysis todetermine the effect of input factors on ground subsidencehazard maps. Esaki et al. [7] used a stochastic model topredict subsidence in coal mining areas, while Manciniet al. [13] applied a multi-criteria decision model toanalyze salt mining activities. Choi et al. [11] constructedsubsidence susceptibility maps based on fuzzy relationsfor an AUCM area. Lee and Park [4] applied frequencyratio and decision tree model to mapping GSH maps.For the same study site, Lee et al. [12] applied alogistic regression model, and Oh and Lee [15] integratedGSH maps using various models such as frequency ratiomodel, weight of evidence, logistic regression and artificialneural network model. According to the geologicalhazard, these models have been used to analyze landslidesusceptibility mapping in many recent studies [17–27]. Inthis study, the fuzzy algebra model was used to integrateground subsidence hazard maps, withthis model beingused most frequently in analysis landslide susceptibilitymapping [28–32]. Ercanoglu and Gokceoglu [28, 29]proposed an assessment of landslide susceptibility forlandslide prone areas using fuzzy relationships, Pradhanet al. [30] and Sezer et al. [31] used neuro-fuzzy models toanalysese landslide susceptibility, and Akgun et al. [32]applied Mamdani fuzzy algorithm for the assessment oflandslide susceptibility mapping.
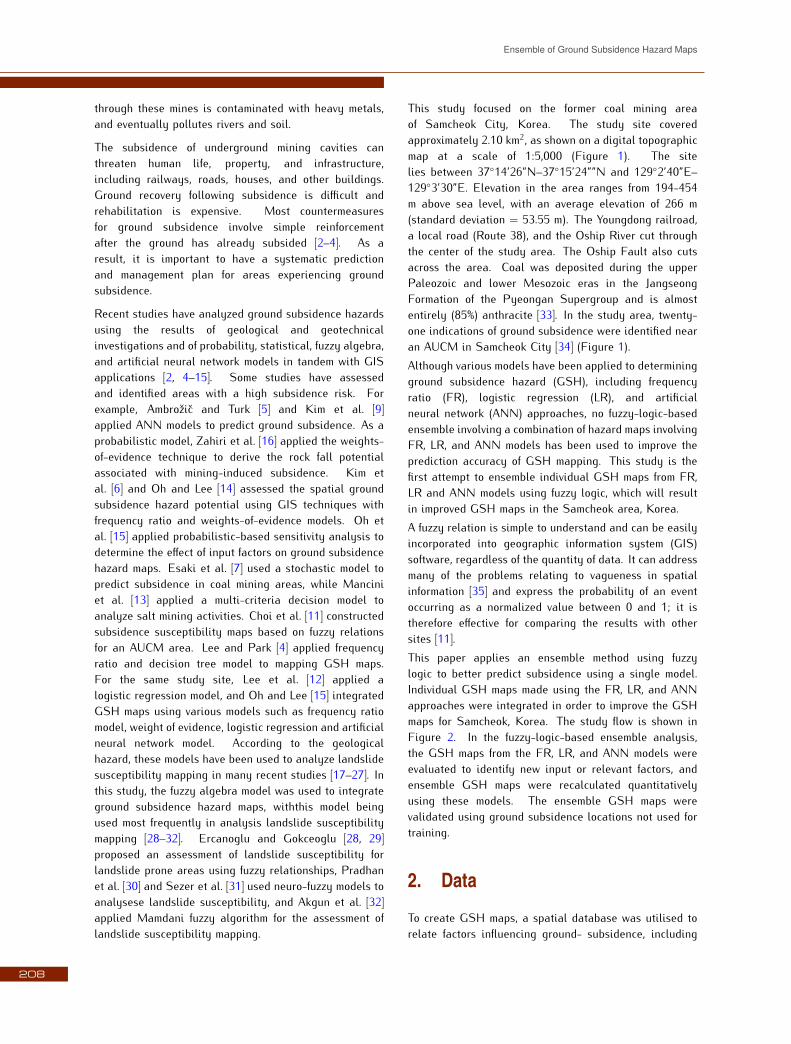
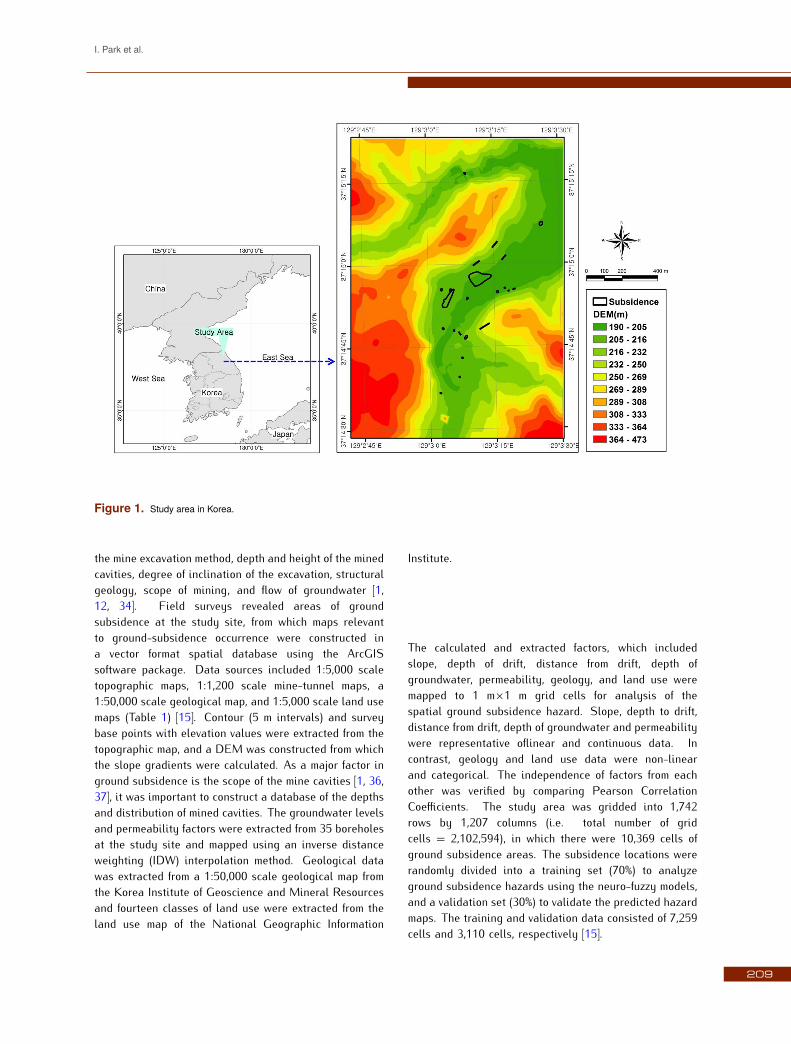
This study focused on the former coal mining areaof Samcheok City, Korea. The study site coveredapproximately 2.10 km2, as shown on a digital topographicmap at a scale of 1:5,000 (Figure 1). The sitelies between 37◦14’26”N–37◦15’24””N and 129◦2’40”E–129◦3’30”E. Elevation in the area ranges from 194-454m above sea level, with an average elevation of 266 m(standard deviation = 53.55 m). The Youngdong railroad,a local road (Route 38), and the Oship River cut throughthe center of the study area. The Oship Fault also cutsacross the area. Coal was deposited during the upperPaleozoic and lower Mesozoic eras in the JangseongFormation of the Pyeongan Supergroup and is almostentirely (85%) anthracite [33]. In the study area, twenty-one indications of ground subsidence were identified nearan AUCM in Samcheok City [34] (Figure 1).Although various models have been applied to determiningground subsidence hazard (GSH), including frequencyratio (FR), logistic regression (LR), and artificialneural network (ANN) approaches, no fuzzy-logic-basedensemble involving a combination of hazard maps involvingFR, LR, and ANN models has been used to improve theprediction accuracy of GSH mapping. This study is thefirst attempt to ensemble individual GSH maps from FR,LR and ANN models using fuzzy logic, which will resultin improved GSH maps in the Samcheok area, Korea.A fuzzy relation is simple to understand and can be easilyincorporated into geographic information system (GIS)software, regardless of the quantity of data. It can addressmany of the problems relating to vagueness in spatialinformation [35] and express the probability of an eventoccurring as a normalized value between 0 and 1; it istherefore effective for comparing the results with othersites [11].This paper applies an ensemble method using fuzzylogic to better predict subsidence using a single model.Individual GSH maps made using the FR, LR, and ANNapproaches were integrated in order to improve the GSHmaps for Samcheok, Korea. The study flow is shown inFigure 2. In the fuzzy-logic-based ensemble analysis,the GSH maps from the FR, LR, and ANN models wereevaluated to identify new input or relevant factors, andensemble GSH maps were recalculated quantitativelyusing these models. The ensemble GSH maps werevalidated using ground subsidence locations not used fortraining.2. DataTo create GSH maps, a spatial database was utilised torelate factors influencing ground- subsidence, including
208
I. Park et al.
Figure 1. Study area in Korea.
the mine excavation method, depth and height of the minedcavities, degree of inclination of the excavation, structuralgeology, scope of mining, and flow of groundwater [1,12, 34]. Field surveys revealed areas of groundsubsidence at the study site, from which maps relevantto ground-subsidence occurrence were constructed ina vector format spatial database using the ArcGISsoftware package. Data sources included 1:5,000 scaletopographic maps, 1:1,200 scale mine-tunnel maps, a1:50,000 scale geological map, and 1:5,000 scale land usemaps (Table 1) [15]. Contour (5 m intervals) and surveybase points with elevation values were extracted from thetopographic map, and a DEM was constructed from whichthe slope gradients were calculated. As a major factor inground subsidence is the scope of the mine cavities [1, 36,37], it was important to construct a database of the depthsand distribution of mined cavities. The groundwater levelsand permeability factors were extracted from 35 boreholesat the study site and mapped using an inverse distanceweighting (IDW) interpolation method. Geological datawas extracted from a 1:50,000 scale geological map fromthe Korea Institute of Geoscience and Mineral Resourcesand fourteen classes of land use were extracted from theland use map of the National Geographic Information
Institute.
The calculated and extracted factors, which includedslope, depth of drift, distance from drift, depth ofgroundwater, permeability, geology, and land use weremapped to 1 m×1 m grid cells for analysis of thespatial ground subsidence hazard. Slope, depth to drift,distance from drift, depth of groundwater and permeabilitywere representative oflinear and continuous data. Incontrast, geology and land use data were non-linearand categorical. The independence of factors from eachother was verified by comparing Pearson CorrelationCoefficients. The study area was gridded into 1,742rows by 1,207 columns (i.e. total number of gridcells = 2,102,594), in which there were 10,369 cells ofground subsidence areas. The subsidence locations wererandomly divided into a training set (70%) to analyzeground subsidence hazards using the neuro-fuzzy models,and a validation set (30%) to validate the predicted hazardmaps. The training and validation data consisted of 7,259cells and 3,110 cells, respectively [15].209
Ensemble of Ground Subsidence Hazard Maps
Figure 2. Study flow for ground subsidence hazard mapping.
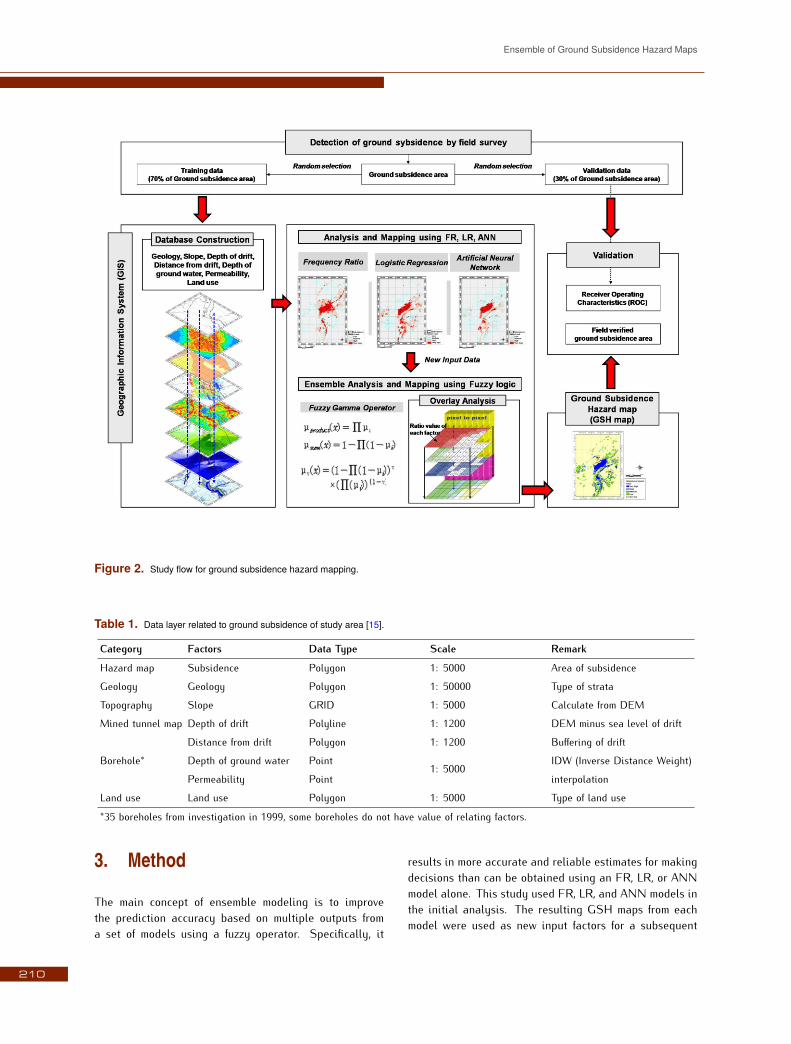
Table 1. Data layer related to ground subsidence of study area [15].
Category Factors Data Type Scale RemarkHazard map Subsidence Polygon 1: 5000 Area of subsidenceGeology Geology Polygon 1: 50000 Type of strataTopography Slope GRID 1: 5000 Calculate from DEMMined tunnel map Depth of drift Polyline 1: 1200 DEM minus sea level of driftDistance from drift Polygon 1: 1200 Buffering of driftBorehole* Depth of ground water Point 1: 5000 IDW (Inverse Distance Weight)Permeability Point interpolationLand use Land use Polygon 1: 5000 Type of land use*35 boreholes from investigation in 1999, some boreholes do not have value of relating factors.3. Method
The main concept of ensemble modeling is to improvethe prediction accuracy based on multiple outputs froma set of models using a fuzzy operator. Specifically, it
results in more accurate and reliable estimates for makingdecisions than can be obtained using an FR, LR, or ANNmodel alone. This study used FR, LR, and ANN models inthe initial analysis. The resulting GSH maps from eachmodel were used as new input factors for a subsequent210
I. Park et al.
analysis to generate ensemble-based GSH maps using afuzzy operator. In other words, the relationships betweenground subsidence locations and three new input factorswere identified and re-quantified using a fuzzy operatorto generate improved GSH maps.3.1. Ground subsidence hazard mappingusing various modelsUsing the frequency ratio, the spatial relationshipbetween ground subsidence occurrence and subsidence-related factor was derived. The data layers containingscale factors were subdivided into a convenient numberof classes, and the class or type of each factor wasobtained as the subsidence occurrence ratio [12, 15]. TheGSH index (GSHIFR ), equation (1), was calculated by asummation of each factor ratio value [38], where FRn isthe frequency ratio of each subsidence-related factor typeor range:
GSHIFR = FR1 + FR2 + FR3 + . . .+ FRn (1)The relation analysis is the ratio of the area wheresubsidence occurred to the total area. Therefore ahigh probability indicated a greater hazard to groundsubsidence, while a lower value indicated a lower hazard.Logistic regression, which is one of the multivariateanalysis models used, allows one to form a multivariateregression relation between a dependent and severalindependent variables. In the present situation, thedependent variable is binary, representing the presenceor absence of ground subsidence. The quantitativelyrelationship between the occurrence and its dependencyon several variables can be expressed as [6, 15]:
p = 11 + e−x (2)where p is the probability of an event occurring that is theestimated probability of ground subsidence occurrence inthese circumstances. The probability varies from 0 to 1 onan S-shaped curve and z is a linear function. When thereare multiple explanatory variables z can be expressedas [12, 15]:
z = b0 + b1x1 + b2x2 + . . .+ bnxn (3)where b0 is the intercept of the model, the bi (i =0, 1, 2, . . . , n) are the slope coefficients of the logisticregression model, and the xi (i = 0, 1, 2, . . . , n) are theindependent variables. The linear model formed is then
a logistic regression of presence or absence of groundsubsidence on the independent variables.Using this approach, logistic multiple regressioncoefficients of the related factors were calculated. Afterinterpretation, equation (4) (which predicts the groundsubsidence-occurrence possibility) was created (Table 3in [15]):Z = (−0.126 × SLOPE) + (−0.001 × DEPTHDRIFT)+ (−0.071 × DISTDRIFT) + (0.532 × WATERLEVEL)+ (−0.555 × PERMEABILITY) + GEOLOGYa+ LANDUSEa − 26.351, (4)where SLOPE is slope value; DEPTHDRIFT is depthof drift, DISTDRIFT is the distance from the drift,WATERLEVEL is the depth to the groundwater level,PERMEABILITY is permeability value, GEOLOGYa andLANDUSEa is the logistic regression coefficient value,and Z is a prediction parameter.The ANN model is a ”computational mechanism ableto acquire, represent, and compute a mapping from onemultivariate space of information to another, given a setof data representing that mapping” [39]. It providesa network which can generalize and predict outputsfrom inputs that it has not previously seen. The mostfrequently used ANN model is the back propagation-learning algorithm, which trains the network until sometarget minimal error is achieved between the desired andactual output values of the network [15]. Oh and Lee [15]built up the network which consisted of three layers; input,hidden and output layers for analysis ground subsidencehazard.The structure of 7×14×2, input, hidden and output layers,respectively, was selected for the networks with input datanormalized to the range 0.1 to 0.9. The learning rateparameter was set to 0.01 and the momentum parameterwas set to 0.01. The subsidence-prone (occurrence)locations and the locations that were not prone tosubsidence were selected as training sites. From each ofthe two classes, 7,259 grid cells per class were selectedas training cells. Areas where the GSHILR was zerowere classified as ’areas not prone to subsidence’, andareas where subsidence was known were assigned to an’areas prone to subsidence’ training set. To lessen theerror between the predicted output values and the actuallycalculated output values, the back propagation algorithmwas used. The ground subsidence hazard index value wasacquired by calculating the weights determined from backpropagation and the spatial database [15].Oh and Lee [15] applied and compared FR, WOE (weightof evidence), LR, ANN and their integrated models tomapping GSH maps for the same study area. The four
211
Ensemble of Ground Subsidence Hazard Maps
GSH maps were developed and reflected as the new inputfactors and integrated using FR, WOE, LR, and ANNmodels to make a hazard map. As a result, integrated GSHmaps used four new subsidence-related input factors thatshowed a greater accuracy than individual models. In thisstudy, three GSH maps were used using individual models(FR, LR and ANN) of Oh and Lee [15] as input factors andapplied ensemble method to create GSH maps using fuzzyoperator.3.2. Fuzzy logic and operatorThe fuzzy set theory was used to integrate the calculatedsubsidence hazard indices through each model in thisstudy. The fuzzy set theory introduced by Zadeh [40] isone of the tools used to handle the complex problems,and is utilized across many disciplines. The concept offuzzy logic is to consider the spatial objects on a map asmembers of a set. In the classical set theory, an object is amember of a set if it has a membership value of 1, or is nota member if it has a membership value of 0. In the fuzzyset theory, membership can take on any value between0 and 1 reflecting the degree of certainty of membership.The fuzzy set theory employs the idea of a membershipfunction that expresses the degree of membership withrespect to some attribute of interest.Zimmerman [41] discussed a variety of combination rules.Bonham-Carter [42] discussed five operators, namelythe fuzzy and, fuzzy or, fuzzy algebraic product, fuzzyalgebraic sum and fuzzy gamma operator. This studyuses the fuzzy gamma operator for combining the fuzzymembership functions.The Fuzzy Algebraic Product is defined as:
µcombination = n∏i=1 µi (5)
where µi is the fuzzy membership function for the ith map,and i = 1, 2, . . . , n maps are to be combined.The fuzzy algebraic sum is complementary to the fuzzyalgebraic product, being defined as:µcombination = 1 −
n∏i=1 (1 − µi). (6)
The gamma operation is defined in terms of the fuzzyalgebraic product and the fuzzy algebraic sum by:µcombination =(Fuzzy algebraic sum)λ · (Fuzzy algebraic product)1−λ,(7)
where λ is a parameter chosen in the range (0,1), andthe fuzzy algebraic sum and fuzzy algebraic product arecalculated using equations (5) and (6) respectively. Inthe fuzzy gamma operation, when λ is 1 the combinationis the same as the fuzzy algebraic sum, and when λ is0 the combination equals the fuzzy algebraic product.Judicious choice of λ produces output values that ensure aflexible compromise between the ’increase’ tendencies ofthe fuzzy algebraic sum and the ’decrease’ effects of thefuzzy algebraic product.Like the membership function, the frequency ratio wascalculated. The spatial relationships between thesubsidence location and each subsidence-related factorwere analyzed by using the probability model-frequencyratio. The frequency ratio, a ratio between the occurrenceand absence of subsidence locations in each cell, wascalculated for each factor’s type or range that had beenidentified as significant with respect to causing groundsubsidence. An area ratio for each factor’s type or range tothe total area was calculated. Finally, frequency ratios foreach factor’s type or range were calculated by dividing thesubsidence occurrence ratio by the area ratio. If the ratiowas greater than 1, the relationship between subsidencelocations and the factors was higher and, if the ratio wasless than 1, the relationship between subsidence locationand each factor’s type or range was lower. The frequencyratio was then normalized between 0.00 and 1.00 to createthe fuzzy membership value.4. Results
4.1. Ensemble-based ground subsidencehazard mapping using fuzzy operator
The ensemble methodology integrates factors causingground subsidence to generate a GSH map. The inputfactors used to produce three GSH maps using the FR,LR and ANN models included slope, depth of the drift,distance from the drift, depth of groundwater, permeability,geology, and land. The index used for the hazard mapswas classified into seven classes, using the equal areaapproach in the GIS environment for cases in which eachclass did not have a similar number of cells for the totalarea based on the distribution area of GSHILR. The firstclass comprised 40% of the area, while the remaining sixclasses (classes 2 to 7) each comprised 10% of the area.The first class of GSHIFR and GSHIANN was set to 40%of the study area because the GSHILR value of the 0.00value (the first class) comprised 41.64% of the study area.The other hazard map classes were each set to 10% of thestudy area with a similar number of cells in the remaining212
I. Park et al.
(a)
(b)
213
Ensemble of Ground Subsidence Hazard Maps
(c)
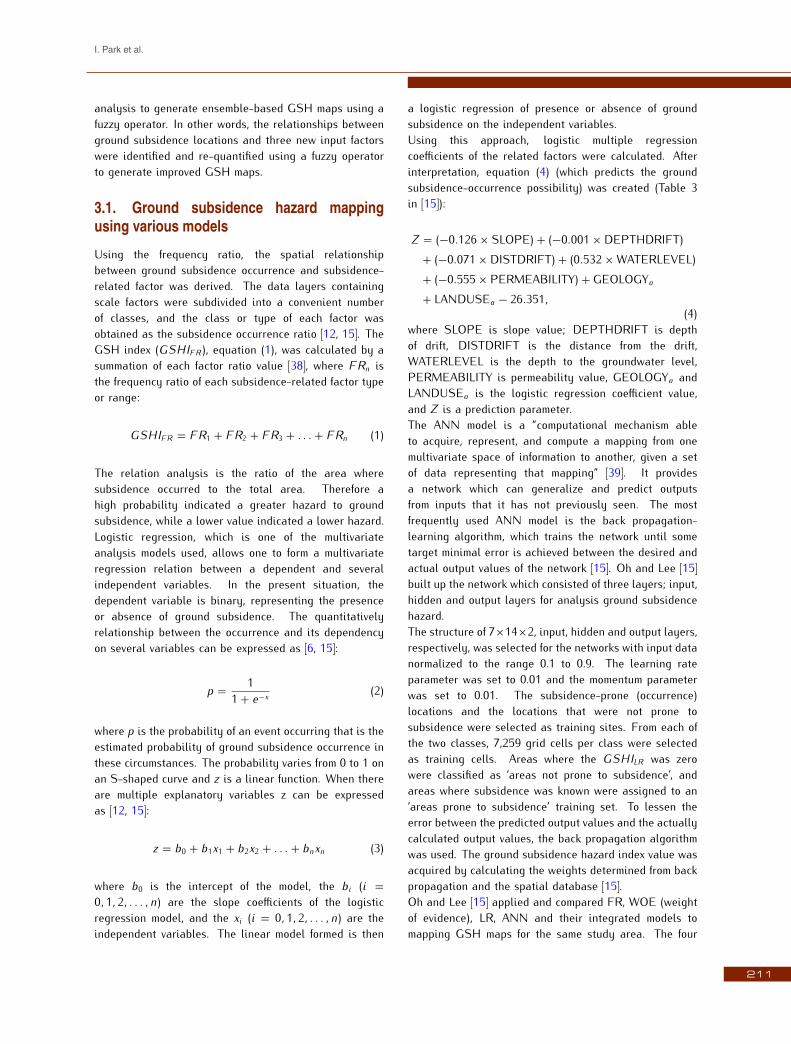
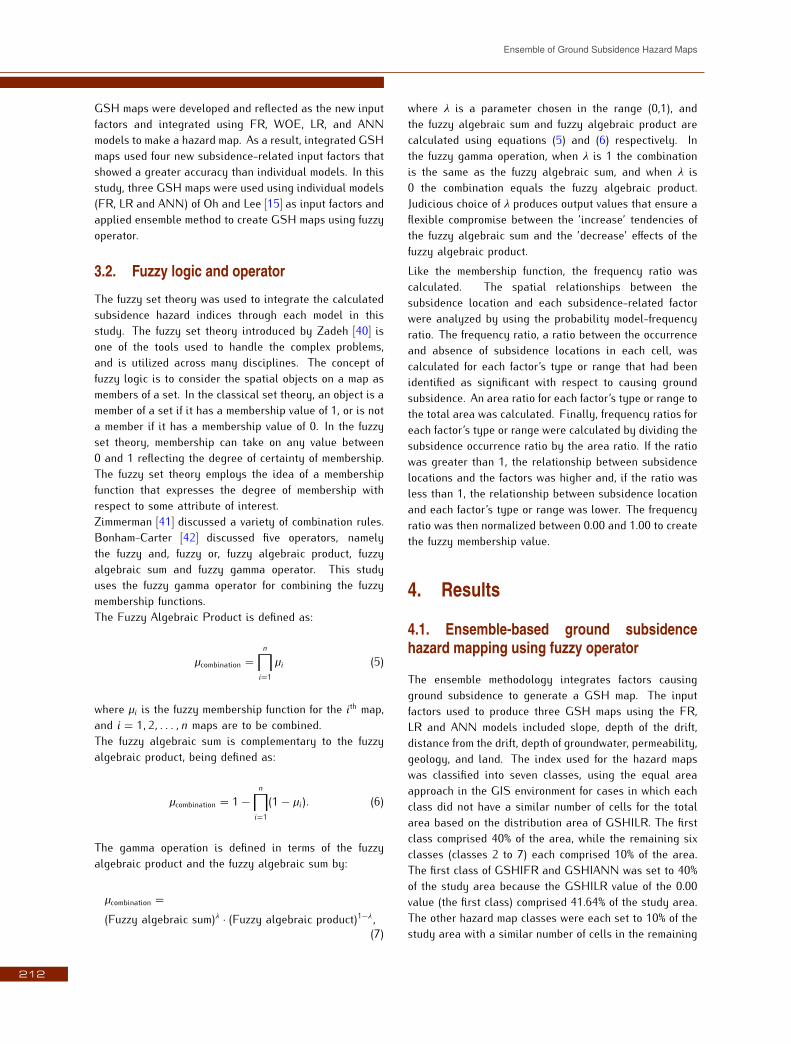
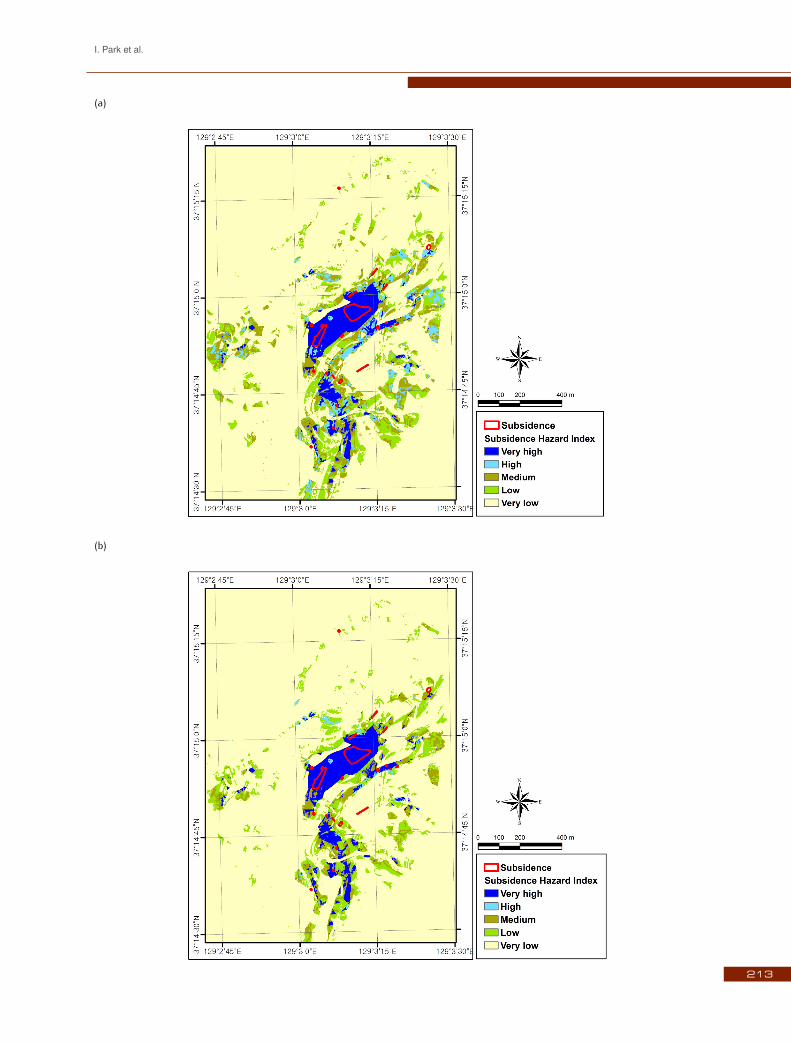
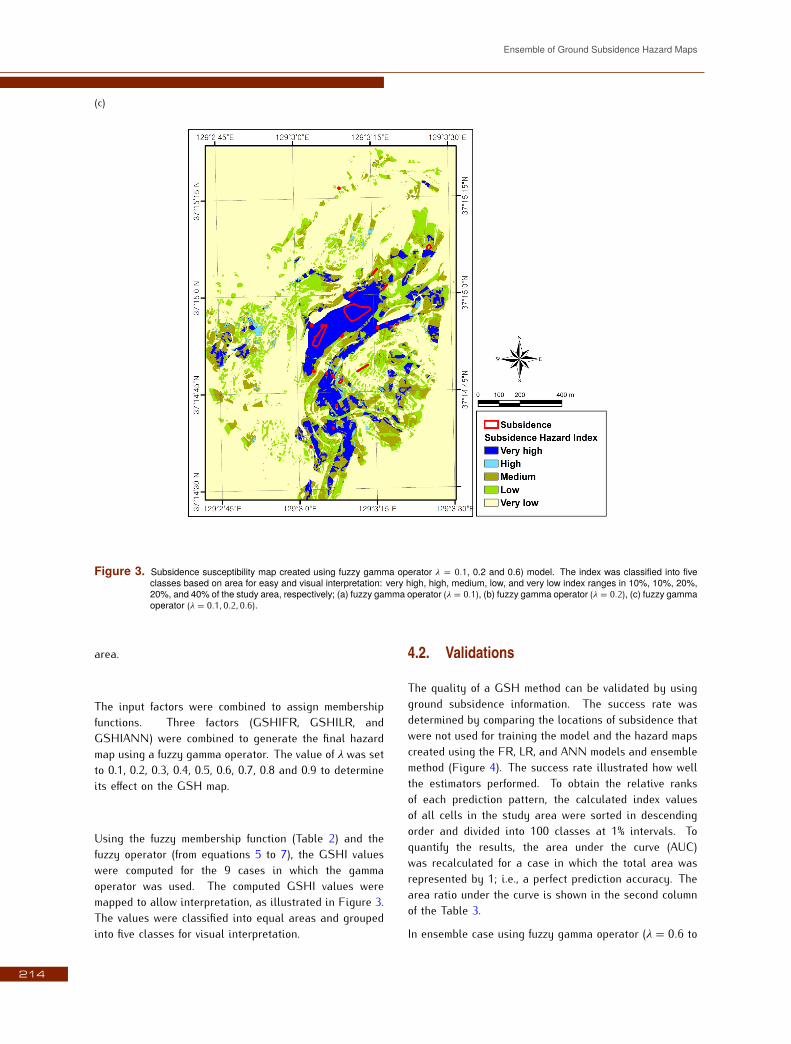
Figure 3. Subsidence susceptibility map created using fuzzy gamma operator λ = 0.1, 0.2 and 0.6) model. The index was classified into fiveclasses based on area for easy and visual interpretation: very high, high, medium, low, and very low index ranges in 10%, 10%, 20%,20%, and 40% of the study area, respectively; (a) fuzzy gamma operator (λ = 0.1), (b) fuzzy gamma operator (λ = 0.2), (c) fuzzy gammaoperator (λ = 0.1, 0.2, 0.6).
area.The input factors were combined to assign membershipfunctions. Three factors (GSHIFR, GSHILR, andGSHIANN) were combined to generate the final hazardmap using a fuzzy gamma operator. The value of λ was setto 0.1, 0.2, 0.3, 0.4, 0.5, 0.6, 0.7, 0.8 and 0.9 to determineits effect on the GSH map.Using the fuzzy membership function (Table 2) and thefuzzy operator (from equations 5 to 7), the GSHI valueswere computed for the 9 cases in which the gammaoperator was used. The computed GSHI values weremapped to allow interpretation, as illustrated in Figure 3.The values were classified into equal areas and groupedinto five classes for visual interpretation.
4.2. Validations
The quality of a GSH method can be validated by usingground subsidence information. The success rate wasdetermined by comparing the locations of subsidence thatwere not used for training the model and the hazard mapscreated using the FR, LR, and ANN models and ensemblemethod (Figure 4). The success rate illustrated how wellthe estimators performed. To obtain the relative ranksof each prediction pattern, the calculated index valuesof all cells in the study area were sorted in descendingorder and divided into 100 classes at 1% intervals. Toquantify the results, the area under the curve (AUC)was recalculated for a case in which the total area wasrepresented by 1; i.e., a perfect prediction accuracy. Thearea ratio under the curve is shown in the second columnof the Table 3.In ensemble case using fuzzy gamma operator (λ = 0.6 to214
I. Park et al.
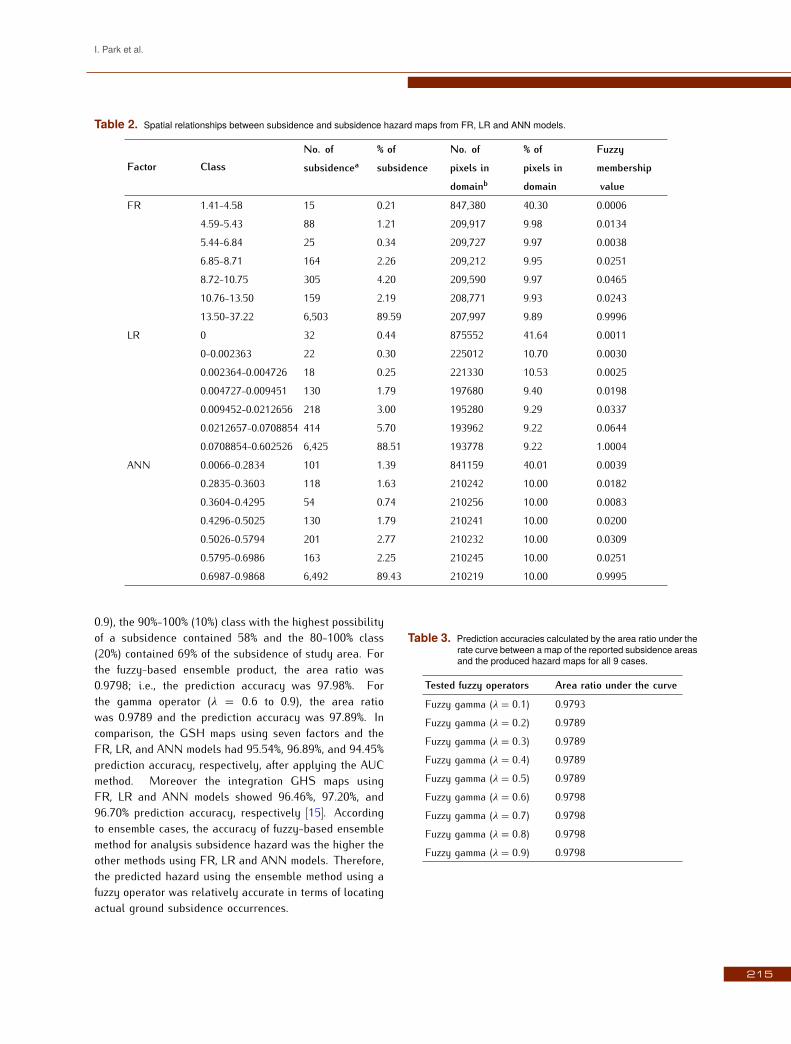
Table 2. Spatial relationships between subsidence and subsidence hazard maps from FR, LR and ANN models.
Factor ClassNo. of % of No. of % of Fuzzysubsidencea subsidence pixels in pixels in membership
domainb domain valueFR 1.41-4.58 15 0.21 847,380 40.30 0.00064.59-5.43 88 1.21 209,917 9.98 0.01345.44-6.84 25 0.34 209,727 9.97 0.00386.85-8.71 164 2.26 209,212 9.95 0.02518.72-10.75 305 4.20 209,590 9.97 0.046510.76-13.50 159 2.19 208,771 9.93 0.024313.50-37.22 6,503 89.59 207,997 9.89 0.9996LR 0 32 0.44 875552 41.64 0.00110-0.002363 22 0.30 225012 10.70 0.00300.002364-0.004726 18 0.25 221330 10.53 0.00250.004727-0.009451 130 1.79 197680 9.40 0.01980.009452-0.0212656 218 3.00 195280 9.29 0.03370.0212657-0.0708854 414 5.70 193962 9.22 0.06440.0708854-0.602526 6,425 88.51 193778 9.22 1.0004ANN 0.0066-0.2834 101 1.39 841159 40.01 0.00390.2835-0.3603 118 1.63 210242 10.00 0.01820.3604-0.4295 54 0.74 210256 10.00 0.00830.4296-0.5025 130 1.79 210241 10.00 0.02000.5026-0.5794 201 2.77 210232 10.00 0.03090.5795-0.6986 163 2.25 210245 10.00 0.02510.6987-0.9868 6,492 89.43 210219 10.00 0.99950.9), the 90%-100% (10%) class with the highest possibilityof a subsidence contained 58% and the 80-100% class(20%) contained 69% of the subsidence of study area. Forthe fuzzy-based ensemble product, the area ratio was0.9798; i.e., the prediction accuracy was 97.98%. Forthe gamma operator (λ = 0.6 to 0.9), the area ratiowas 0.9789 and the prediction accuracy was 97.89%. Incomparison, the GSH maps using seven factors and theFR, LR, and ANN models had 95.54%, 96.89%, and 94.45%prediction accuracy, respectively, after applying the AUCmethod. Moreover the integration GHS maps usingFR, LR and ANN models showed 96.46%, 97.20%, and96.70% prediction accuracy, respectively [15]. Accordingto ensemble cases, the accuracy of fuzzy-based ensemblemethod for analysis subsidence hazard was the higher theother methods using FR, LR and ANN models. Therefore,the predicted hazard using the ensemble method using afuzzy operator was relatively accurate in terms of locatingactual ground subsidence occurrences.
Table 3. Prediction accuracies calculated by the area ratio under therate curve between a map of the reported subsidence areasand the produced hazard maps for all 9 cases.
Tested fuzzy operators Area ratio under the curveFuzzy gamma (λ = 0.1) 0.9793Fuzzy gamma (λ = 0.2) 0.9789Fuzzy gamma (λ = 0.3) 0.9789Fuzzy gamma (λ = 0.4) 0.9789Fuzzy gamma (λ = 0.5) 0.9789Fuzzy gamma (λ = 0.6) 0.9798Fuzzy gamma (λ = 0.7) 0.9798Fuzzy gamma (λ = 0.8) 0.9798Fuzzy gamma (λ = 0.9) 0.9798
215
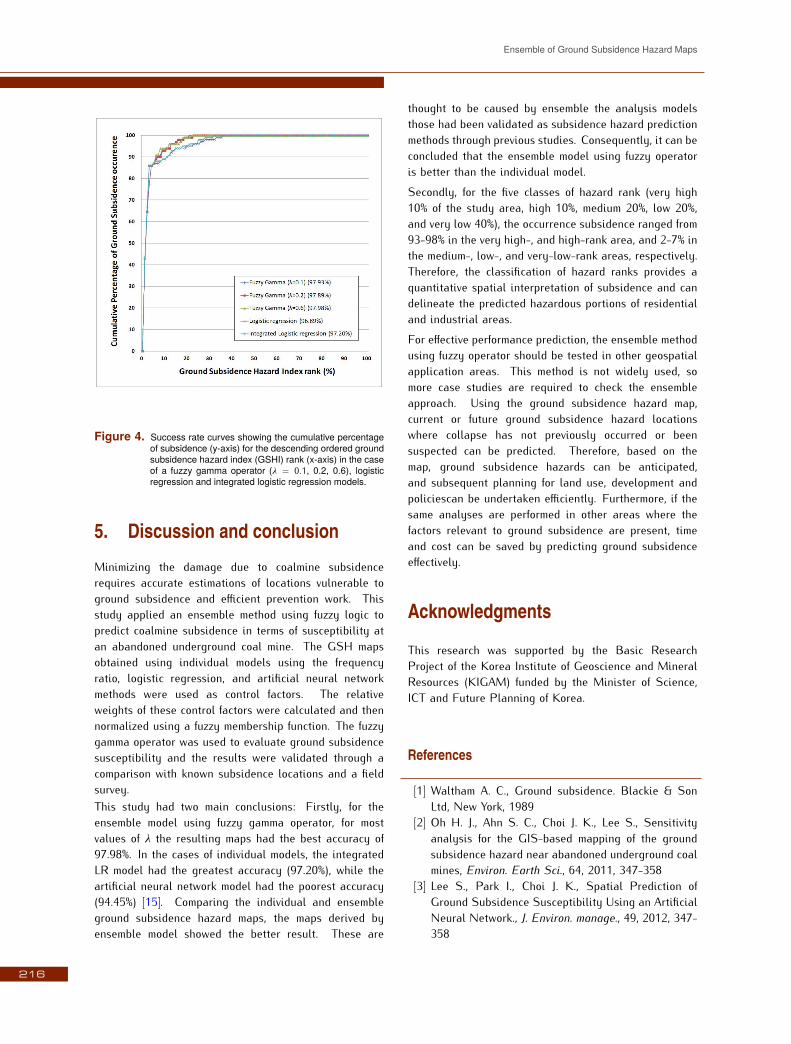
Ensemble of Ground Subsidence Hazard Maps
Figure 4. Success rate curves showing the cumulative percentageof subsidence (y-axis) for the descending ordered groundsubsidence hazard index (GSHI) rank (x-axis) in the caseof a fuzzy gamma operator (λ = 0.1, 0.2, 0.6), logisticregression and integrated logistic regression models.
5. Discussion and conclusionMinimizing the damage due to coalmine subsidencerequires accurate estimations of locations vulnerable toground subsidence and efficient prevention work. Thisstudy applied an ensemble method using fuzzy logic topredict coalmine subsidence in terms of susceptibility atan abandoned underground coal mine. The GSH mapsobtained using individual models using the frequencyratio, logistic regression, and artificial neural networkmethods were used as control factors. The relativeweights of these control factors were calculated and thennormalized using a fuzzy membership function. The fuzzygamma operator was used to evaluate ground subsidencesusceptibility and the results were validated through acomparison with known subsidence locations and a fieldsurvey.This study had two main conclusions: Firstly, for theensemble model using fuzzy gamma operator, for mostvalues of λ the resulting maps had the best accuracy of97.98%. In the cases of individual models, the integratedLR model had the greatest accuracy (97.20%), while theartificial neural network model had the poorest accuracy(94.45%) [15]. Comparing the individual and ensembleground subsidence hazard maps, the maps derived byensemble model showed the better result. These are
thought to be caused by ensemble the analysis modelsthose had been validated as subsidence hazard predictionmethods through previous studies. Consequently, it can beconcluded that the ensemble model using fuzzy operatoris better than the individual model.Secondly, for the five classes of hazard rank (very high10% of the study area, high 10%, medium 20%, low 20%,and very low 40%), the occurrence subsidence ranged from93-98% in the very high-, and high-rank area, and 2-7% inthe medium-, low-, and very-low-rank areas, respectively.Therefore, the classification of hazard ranks provides aquantitative spatial interpretation of subsidence and candelineate the predicted hazardous portions of residentialand industrial areas.For effective performance prediction, the ensemble methodusing fuzzy operator should be tested in other geospatialapplication areas. This method is not widely used, somore case studies are required to check the ensembleapproach. Using the ground subsidence hazard map,current or future ground subsidence hazard locationswhere collapse has not previously occurred or beensuspected can be predicted. Therefore, based on themap, ground subsidence hazards can be anticipated,and subsequent planning for land use, development andpoliciescan be undertaken efficiently. Furthermore, if thesame analyses are performed in other areas where thefactors relevant to ground subsidence are present, timeand cost can be saved by predicting ground subsidenceeffectively.Acknowledgments
This research was supported by the Basic ResearchProject of the Korea Institute of Geoscience and MineralResources (KIGAM) funded by the Minister of Science,ICT and Future Planning of Korea.References
[1] Waltham A. C., Ground subsidence. Blackie & SonLtd, New York, 1989[2] Oh H. J., Ahn S. C., Choi J. K., Lee S., Sensitivityanalysis for the GIS-based mapping of the groundsubsidence hazard near abandoned underground coalmines, Environ. Earth Sci., 64, 2011, 347-358[3] Lee S., Park I., Choi J. K., Spatial Prediction ofGround Subsidence Susceptibility Using an ArtificialNeural Network., J. Environ. manage., 49, 2012, 347-358216
I. Park et al.
[4] Lee S., Park I., Application of decision tree modelfor the ground subsidence hazard mapping nearabandoned underground coal mines, J. Environ.manage., 127, 2013, 166-176[5] Ambrožic T., Turk G., Prediction of subsidence dueto underground mining by artificial neural networks.,Comput. Geosci., 29, 2003, 627-637[6] Kim K. D., Lee S., Oh H. J., Choi J. K., Won J.S., Assessment of ground subsidence hazard nearan abandoned underground coal mine using GIS,Environ. Geol., 50, 2006, 1183-1191[7] Esaki T., Djamaluddin I., Mitani Y., A GIS-basedprediction method to evaluate subsidence-induceddamage from coal mining beneath a reservoir, Kyushu,Japan, Q. J. Eng. Geol. Hydroge., 41, 2008, 381-392[8] Turer D., Nefeslioglu H. A., Zorlu K., GokceogluC., Assessment of geo-environmental problems of theZonguldak province (NW Turkey), Environ. Geol., 55,2008, 1001-1014[9] Kim K. D., Lee S., Oh H. J., Prediction of groundsubsidence in Samcheok City, Korea using artificialneural networks and GIS, Environ. Geol., 58, 2009,61-70[10] Quanyuan W., Jiewu P., Shanzhong Q., Yiping L.,Congcong H., Tingxiang L., Limei H., Impacts ofcoal mining subsidence on the surface landscape inLongkou city, Shandong Province of China, Environ.Earth Sci., 59, 2009, 783-791[11] Choi J. K., Kim K. D., Lee S., Won J. S., Application ofa fuzzy operator to susceptibility estimations of coalmine subsidence in Taebaek City, Korea, Environ.Earth Sci., 59, 2010, 1009-1022[12] Lee S., Oh H. J., Kim K. D., Statistical SpatialModeling of Ground Subsidence Hazard nearan Abandoned Underground Coal Mine, DisasterAdvances, 3, 2010, 11-23[13] Mancini F., Stecchi F., Gabbianelli G., GIS-basedassessment of risk due to salt mining activities atTuzla (Bosnia and Herzegovina), Eng. Geol., 109,2009, 170-182[14] Oh H. J., Lee S., Assessment of ground subsidenceusing GIS and the weights-of-evidence model., Eng.Geol., 115, 2010, 36-48[15] Oh H. J., Lee S., Integration of ground subsidencehazard maps of abandoned coal mines in Samcheok,Korea, Int. J. Coal Geol., 86, 2011, 58-72[16] Zahiri H., Palamara D. R., Flentje P., BrassingtonG.M., Baafi E., A GIS-based Weights-of-Evidencemodel for mapping cliff instabilities associated withmine subsidence, Environ. Geol., 51, 2006, 377-386[17] Pradhan B., A comparative study on the predictiveability of the decision tree, support vector machine
and neuro-fuzzy models in landslide susceptibilitymapping using GIS, Comput. Geosci., 51, 2013, 350-365[18] Pradhan B., Chaudhari, A., Adinarayana, J.,Buchroithner M. F., Soil erosion assessment andits correlation with landslide events using remotesensing data and GIS: A case study at Penang Island,Malaysia, Environ. Monit. Assess., 184(2), 2012, 715-727[19] Pradhan B., Mansor, S., Pirasteh, S., BuchroithnerM. F., Landslide hazard and risk analyses at alandslide prone catchment area using statisticalbased geospatial model, Int J Remote Sens., 32(14),2011, 4075-4087[20] Lee M. J., Choi J. W., Oh H. J., Won J. S., Park I., LeeS., Ensemble-based landslide susceptibility maps inJinbu area, Korea, Environ. Earth Sci., 67(1), 2012,23-37[21] Lee S., Dan N. T., Probabilistic landslidesusceptibility mapping in the Lai Chau provinceof Vietnam: focus on the relationship betweentectonic fractures and landslides, Environ. Geol., 48,2005, 778-787[22] Lee S., Hwang J., Park I., Application of data-drivenevidential belief functions to landslide susceptibilitymapping in Jinbu, Korea, Catena, 2013, 100, 15-30[23] Lee S., Sambath T., Landslide susceptibility mappingin the Damrei Romel area, Cambodia using frequencyratio and logistic regression models, Environ. Geol.,50, 2006, 847-855[24] Lee S., Song K. Y., Oh H. J., Choi J., Detectionof landslides using web-based aerial photographsand landslide susceptibility mapping using geospatialanalysis, Int J Remote Sens., 33(16), 2012, 4937-4966[25] Oh H. J., Lee S., Cross-application used to validatelandslide susceptibility maps using a probabilisticmodel from Korea, Environ. Earth Sci., 64(2), 2011,395-409[26] Oh H. J., Lee S., Landslide susceptibility mappingon Panaon Island, Philippines using a geographicinformation system, Environ. Earth Sci., 62(5), 2011,935-951[27] Oh H. J., Park N. W., Lee S. S., Lee, S., Extraction oflandslide-related factors from ASTER imagery anditsapplication to landslide susceptibility mapping, Int JRemote Sens., 33(10), 2012,545084, 3211-3231[28] Ercanoglu M., Gokceoglu C., Assessment of landslidesusceptibility for a landslide prone area (North ofYenice, NW Turkey) by fuzzy approach, Environ.Geol., 41(6), 2002, 720-730[29] Ercanoglu M., Gokceoglu C., Use of fuzzy relations toproduce landslide susceptibility map of a landslide
217
Ensemble of Ground Subsidence Hazard Maps
prone area (West Black Sea Region, Turkey), Eng.Geol., 75(3/4), 2004, 229-250[30] Pradhan B., Sezer E. A., Gokceoglu C., Buchroithner,M.F., Landslide susceptibility mapping by neuro-fuzzy approach in a landslide prone area (CameronHighland, Malaysia), IEEE T Geosci Remote, 48(12),2010, 4164-4177[31] Sezer E. A., Pradhan B., Gokceoglu C., Manifestationof an adaptive neuro-fuzzy model on landslidesusceptibility mapping: Klang valley, Malaysia,Expert Syst Appl., 38(7), 2011, 8208-8219[32] Akgun A., Sezer E. A., Nefeslioglu H. A.,Gokceoglu C., Pradhan B., An easy-to-use MATLABprogram (MamLand) for the assessment of landslidesusceptibility using a Mamdani fuzzy algorithm,Comput. Geosci., 38(1), 2012, 23-34[33] Geological Society of Korea, Gosari geological mapsheet. Korea Institute of Geoscience and MineralResources, Daejeon, 1962[34] Coal Industry Promotion Board, Fundamentalinvestigation report of the stability test for Gosari.Coal Industry construction method of subsidenceprevention, Coal Industry Promoton Board, Seoul, 99,1999, 7-22
[35] Robinson V. B., A perspective on the fundamentalsof fuzzy sets and their use in geographic informationsystems, Trans GIS, 7, 2003, 3-30[36] National Coal Board, Subsidence engineer’shandbook. National Coal Board Mining Department,London, 1975[37] Goel S. C., Page C. H., An empirical methodfor predicting the probability of Chimney Caveoccurrence over a mining area, Int. J. Rock Mech. Min.Sci. Geomechanics, 19, 1982, 325-337[38] Lee S., Min K., Statistical analysis of landslidesusceptibility at Yongin, Korea, Environ. Geol., 40,2001, 1095-1113[39] Garrett J. H., Where and why artificial neuralnetworks are applicable in civil engineering, J.Comput. Civil Eng., 8, 1994, 129-130[40] Zadeh L. A., Fuzzy sets, IEEE Inform. Control, 8, 1965,338-353[41] Zimmerman H. J., Fuzzy set theory and it applications.Kluwer Academic Publisher, Massachusetts, 1996[42] Bonham-Carter G. F., Geographic InformationSystems for Geoscientists: Modeling with GIS.Pergamon, Ontario, 1994
218