enso: humanitarian implications and...
TRANSCRIPT

ENSO: Humanitarian Implications and Scenarios
The El Niño Aftermath and Perspectives for 2016-2017

El Niño-La Niña: Summary Highlights for 2016-2017
Region Current Timing Context Outlook
EAST AFRICA(Ethiopia, Sudan, Eritrea, Djibouti, Somaliland)
First half of 2016 main season
Severe and widespread drought throughout 2015. Ethiopia and producing regions of Sudan hit particularly hard.
Early season of 2016 (March-May) favourable over most of Ethiopia (except SW), Eritrea, Somaliland
Some dryness in June-July in S Ethiopia, Uganda, NW Kenya.
Current season developing appropriately in Sudan.
Favourable forecasts for July to October rainfall across the region.
EAST AFRICA(Kenya, Somalia)
First half of long dry season prior to Short Rains / Deyr (Oct-Dec 2016)
Oct-Dec 2015: No large scale flooding, extended season and good rainfall in Uganda, W Kenya. Poor in Southern Somalia.March-May 2016: Dry in Somalia and coastal Kenya
Drier than average conditions expected for Short Rains / Deyr season
If a La Niña materializes, possible poor season also in March-May 2017.
SOUTHERN AFRICADry Season prior to re-start of rains from October 2016
Extreme 2 year long drought widespread across the region (2014-2016).
Large regional scale crop losses for two years in a row
Regional scale drought related emergency with high level of assistance required until May 2017
Seasonal forecasts point to favourable rainfall patterns though February 2017, leading to perspectives of a good agricultural season in 2016-2017. A La Niña event will enhance favourable perspectives further. Enhanced flood risk as downside.
CENTRAL AMERICAPrimera Season (April-August)
Severe 2 year long drought in the region (2014-2016).
Regional scale crop losses for two years in a row
Drier than average conditions across many of the areas hit by drought in previous seasons
Seasonal rainfall forecasts for second half of 2016 not very consistent, probably no better than on average rainfall to be xpected.
ASIA and PACIFICMid way through main rainfall season
Severe 2 year long drought in SE Asia and Philippines (2014-2016). PNG severely affected by drought and frostsSE Asia and Philippines very dry until May 2016, improving since then. Current fairly wet conditions across India and China and most of the region.
Forecasts indicate wetter than average season across most of Asia.
Good crop production perspectives for Indian subcontinent, moderated by enhanced flood risk.
However, SE Asia and Philippines, to remain on average at best.
SOUTH AMERICA Dry SeasonRainfall deficits in the northern half of the continent, and excessive rainfall and flooding in southern regions during 2015-2016
Broadly favourable rainfall patterns expected for first stages of the next season (Oct-Jan), in particular western Amazon, Pacific regions
WEST AFRICA First half of the seasonLittle or no impact from extended El Niño across the Sahel in 2015Very persistent drier than average conditions along Gulf of Guinea
Drier than average conditions extending from Senegal across the Guineas and along the Gulf of Guinea. Good conditions from Mali eastwards to Chad. Forecasts indicate to on or above average rainfall for Sahel, but the Senegal region may face poor prospects.
Red=Negative; Orange=Watch; Green=Positive

El Niño 2015-2016 At A Glance:
A Long Lived and Intense Event

El N
iño
20
15
-20
16
at a
Gla
nce
The El Niño 2015-16 in the Context of Past El Niños
The Special Nature of the 2015-16 El Niño
Some particular features of this El Niño deserve specialconsideration. We can highlight these features by comparing theevolution of the three strongest El Niños on record from the yearpreceding their onset until the year of their ending.
We can see that the El Niño 2015-16:
• was preceded by El Niño-like effects – borderline El Niñoconditions were in place since mid-2014 but neverfulfilled the required criteria. Nevertheless, significant ElNiño like impacts were felt across the Globe
• was one of the strongest in the available record
• was one of the longest lived El Niños on record
This combination of precursor El Niño-like impacts in the run-up tothe main event, its high intensity and its long duration resulted inan extended period of extreme dryness at a near global scalewhich had serious implications for the food security of largenumbers of people around the globe.
The 2015/16 El Niño Event
An El Niño event was officially declared in March 2015, gaining in intensity until it reached its peak in December 2015. The event came to an end in May 2016,becoming one the strongest on record, together with the El Niños of 1982-83 and 1997-98.
Variation of the Sea Surface Temperature (SST) anomalies in the Pacific Niño3.4 area (classic ENSO strength indicator) for the three largest El Niño events on record: 1982-83, 1997-98 and 2015-16. The plot displays a period of two and a half years covering the year before the event, and the year and a half enclosing the event duration (start-peak-end) – this emphasises the way the El Niños evolved from run-up to peak.
Official Start: March 2015
End: May 2016
El N
iño
20
15
-20
16
at
a G
lan
ceThe El Niño 2015-16: Global Multi-Year Impacts
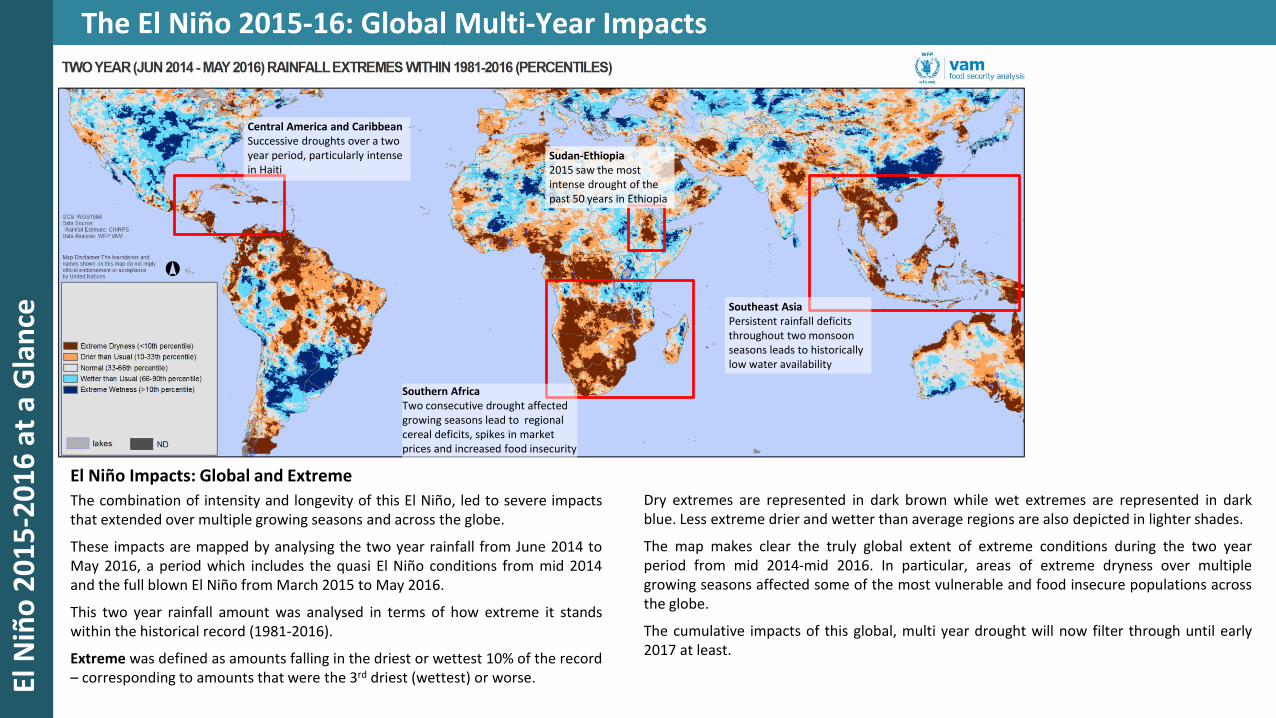
Sudan-Ethiopia2015 saw the most intense drought of the past 50 years in Ethiopia
Central America and CaribbeanSuccessive droughts over a two year period, particularly intense in Haiti
Southern AfricaTwo consecutive drought affected growing seasons lead to regional cereal deficits, spikes in market prices and increased food insecurity
Southeast AsiaPersistent rainfall deficits throughout two monsoon seasons leads to historically low water availability
El Niño Impacts: Global and Extreme
The combination of intensity and longevity of this El Niño, led to severe impactsthat extended over multiple growing seasons and across the globe.
These impacts are mapped by analysing the two year rainfall from June 2014 toMay 2016, a period which includes the quasi El Niño conditions from mid 2014and the full blown El Niño from March 2015 to May 2016.
This two year rainfall amount was analysed in terms of how extreme it standswithin the historical record (1981-2016).
Extreme was defined as amounts falling in the driest or wettest 10% of the record– corresponding to amounts that were the 3rd driest (wettest) or worse.
Dry extremes are represented in dark brown while wet extremes are represented in darkblue. Less extreme drier and wetter than average regions are also depicted in lighter shades.
The map makes clear the truly global extent of extreme conditions during the two yearperiod from mid 2014-mid 2016. In particular, areas of extreme dryness over multiplegrowing seasons affected some of the most vulnerable and food insecure populations acrossthe globe.
The cumulative impacts of this global, multi year drought will now filter through until early2017 at least.

El N
iño
20
15
-20
16
at
a G
lan
ceTiming of El Niño 2015-2016 Impacts and Humanitarian Requirements
El Niño
MARCH 2015Official start
MAY 2016Official end
Peak IntensityQuasi El Niño
Conditions
HumanitarianRequirements
DEC 2016
Peak Requirements
Jul SepAug Oct Nov DecJan MarFeb Apr May JunJul SepAug Oct Nov DecJan MarFeb Apr May Jun
2016
Jan MarFeb Apr May Jun
2017
Jul SepAug Oct Nov DecJan MarFeb Apr May Jun
2014 2015
El Niño Ends but Humanitarian Requirements Increase
These multiple-season impacts of the El Niño of 2015-2016 and its precursor conditionshad very important consequences upon humanitarian requirements and levels ofassistance.
The first impacts upon the growing seasons of 2014-2015 resulted in increased foodinsecurity of poor rural communities and enhanced their vulnerability to further shocks.
The more severe impacts upon the growing seasons of 2015-2016 resulting from themain El Niño event, hit already weakened populations, resulting in enhanced negativeeffects upon household food security and nutrition.
However, these effects on food security and nutrition of the El Niño impacts on cropproduction and pasture resources are delayed in time:
Harvests (even if very meagre) and national stocks will supply households andmarkets for a period of time – major increases in food insecurity therefore tend tohappen at a later date, when cereal availability is low and market prices increase.
Because of these delays, the levels of required humanitarian assistance areexpected to keep rising and to reach a peak around late 2016 – early 2017.
One of the hardest hit regions is Southern Africa, where the harvests have justended – given the regional scale and high magnitude of crop losses, this region willcontribute substantial numbers of food insecure people to the large numbers thathave already resulted from the droughts in Ethiopia, Latin America and Caribbean,SE Asia and Pacific region.

Is a La Niña on the Cards?
Hopes of Recovery Tempered by Risks

Current Evidence and Scenarios for a La Niña EventIs
a L
a N
iña
Eve
nt
On
Th
e C
ard
s?
Current Forecasts
The El Niño event of 2015-2016 is nowover.
Neutral conditions are holding nowfor a short while, with the likelihoodof a La Niña event increasing (bluebars, left plot), to about 60% in late2016.
Forecasts of ENSO evolution (plotbelow right) predict that La Niñaconditions are possible from midSummer – early Autumn according tothe majority of model results.
Unlike the 1997/1998 episode, thisyear’s La Niña episode is expected toremain weak in its intensity – seeblack line (consensus forecast) justabout going under the La Niñathreshold.
Probability of a La Niña developing (blue bars) vs neutral conditions (green ) and El Niño (red).
Forecasts of El Niño / La Niña indicator.Neutral conditions between red and blue lines.Black line is consensus forecast
How Does This Compare to Previous Large El Niños?
Post El Niño situations can be very diverse as shown by the evolution of thethree strongest El Niños on record – shown in the plot below (two yearsenclosing the event’s duration and the third year following year).
The latest El Niño decayed fast much like the 1997-98 event; however whilethis progressed into a strong and long lived La Niña event, the current eventis forecast (purple line) to evolve into a short-lived, weak La Niña episode.The El Niño of 1982-82 decayed more slowly and only entered a proper LaNiña event more than a year later compared to 1997-98.
El Niño Threshold
La Niña Threshold
Variation of the SST anomalies in the Pacific Niño3.4 area (classic ENSO strength indicator) for the three largest El Niño events on record: 1982-83, 1997-98 and 2015-16. The plot displays a period of three years covering the two years enclosing the event duration (start-peak-end) plus the year that follows – this shows the El Niño decay phase and the post-El Niño period.
El Niño
La Niña

What Else Will Influence Global Weather?Is
a L
a N
iña
Eve
nt
On
Th
e C
ard
s?
What else might play a role?
The El Niño and La Niña events translate the influence of the inter-tropical PacificOcean sea surface temperature (SST) patterns on the global weather.
Although these are of major importance, they are not the only determinant of theperformance of growing seasons around the world. SST patterns in other oceans alsoplay an important, if maybe less well researched and not always recognised, role. Thefollowing sea surface patterns are of particular relevance:
• Tropical Atlantic Ocean patterns influence rainfall in the western Sahel and alongthe Gulf of Guinea.
• Indian Ocean patterns influence rainfall both in the Indian subcontinent and inEastern and Southern Africa. These influences are being increasingly recognizedand are now translated into numerical indicators such as the Indian Ocean Dipole(IOD) and the Subtropical Indian Ocean Dipole (SIOD). These indicators arecalculated as differences in average sea surface temperatures between twolocations
Atlantic and Indian Ocean SST patterns can enhance, minimize or alter ENSO influencesand may explain some of the historical variability seen in ENSO impacts.
In the Atlantic, typically, warmer (cooler) waters off West Africa and cooler (warmer)waters in the Gulf of Guinea lead to wetter (drier) conditions in the Sahel and drier(wetter) conditions along the Gulf of Guinea.
Indian Ocean SST patterns can influence rainfall patterns in Southern Africa, EasternAfrica as well as Indonesia and Australia. Positive SIOD values are broadly associatedwith increased rainfall in southern Africa while positive IOD values are associated withenhanced rainfall in Eastern Africa.
However, Indian Ocean SST patterns are very variable and difficult to forecast far inadvance. Their influence on the late 2016 rainfall seasons in southern and easternAfrica can only be evaluated later in the year.
More details are provided in the region-specific slides.
ENSO
IOD
SIOD
ATLANTIC
Map of sea surface temperature showing the location of ocean areas either used to derive monitoring indicators (ENSO, IOD, SIOD) or otherwise of significant influence on the weather of areas of humanitarian intervention (ATLANTIC). Sea surface temperature patterns in the Atlantic or those represented by the Indian Ocean indicators can enhance, minimise or alter ENSO influences.
East Africa:
Intense El Niño Impacts, Contrasting Outlooks

East
Afr
ica:
Inte
nse
Imp
acts
, Co
ntr
asti
ng
Ou
tlo
oks
El Niño Impacts on the 2015 Seasons
NDVI in late April 2015 (centre) and late August 2015 (right) as a percentage of the average. These are times of the peak vegetation development for the Belg and Meher seasons, respectively. Greens for wetter than average, orange shades for below average conditions. Red boxes highlight areas of greatest impact.
Major Drought Events in Ethiopia and Surrounding Regions
Intense drought affected the 2015 rainfall seasons in Ethiopia, Sudan, Eritrea,Djibouti and Somaliland. Ethiopia was the country most severely affected, havingendured two severe drought events in the same calendar year:
• From March to May affecting pastoral semi-arid regions (specially Afar),areas where the first (Belg) of two growing seasons takes place as well asneighbouring areas of Somaliland, Djibouti and Eritrea
• From July to September, affecting the same regions plus more northern andcentral areas with a single main growing season.
The second drought affected a wider geographical area that also included most ofSudan’s major agricultural and pastoral areas. Although from October there was arecovery in rainfall, with the rains lasting longer than usual, this came too late toprovide significant relief.
April 2015 August 2015
No Flooding and Localized Dryness for Kenya and Somalia
In Somalia and Kenya, fears of large scale flooding during the Short Rains (Oct-Dec)as in the 1997-98 intense El Niño did not materialize. Flooding was limited to earlyseason episodes in central Somalia and localised flooding and flash floods in centraland western Kenya, where seasonal rainfall was more consistently above average.
The El Niño also led to a longer than usual season in South Sudan and neighbouringareas of Uganda and NW Kenya leading to exceptional vegetation cover levels.Tanzania also benefitted from above average rainfall.
In contrast, NE and coastal Kenya as well as southern and coastal Somaliaexperienced irregular and below average rainfall, with moderately negative impactson crop production and pasture resources. Dryness remained in in central Ethiopiaand northern Somalia (Puntland) during these very late stages of the local season.
October-December 2015
October to December 2016 rainfall as a percentage of the average (left). Blues for wetter than average, orange and browns for below average conditions. NDVI in December 2015 (right) as a percentage of the average. Greens for wetter than average, orange shades for below average conditions.
March-October 2015
East
Afr
ica:
Inte
nse
Imp
acts
, Co
ntr
asti
ng
Ou
tlo
oks
Developments During 2016
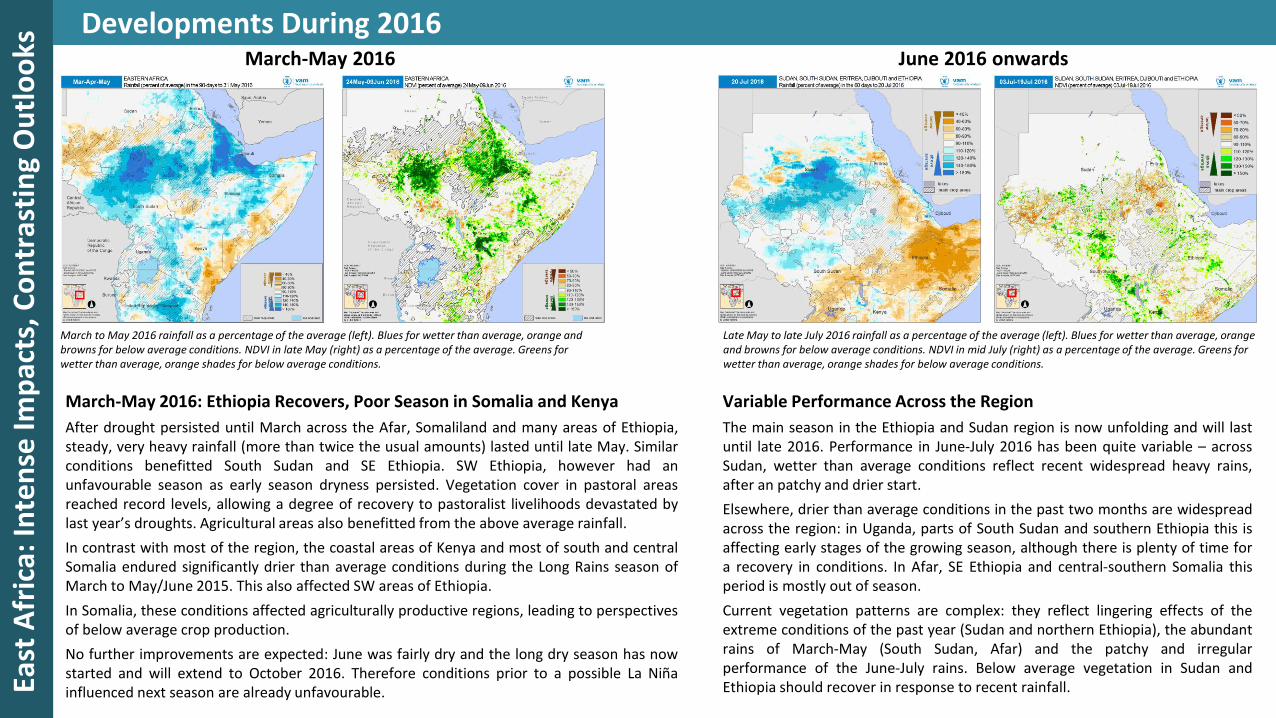
March to May 2016 rainfall as a percentage of the average (left). Blues for wetter than average, orange and browns for below average conditions. NDVI in late May (right) as a percentage of the average. Greens for wetter than average, orange shades for below average conditions.
March-May 2016: Ethiopia Recovers, Poor Season in Somalia and Kenya
After drought persisted until March across the Afar, Somaliland and many areas of Ethiopia,steady, very heavy rainfall (more than twice the usual amounts) lasted until late May. Similarconditions benefitted South Sudan and SE Ethiopia. SW Ethiopia, however had anunfavourable season as early season dryness persisted. Vegetation cover in pastoral areasreached record levels, allowing a degree of recovery to pastoralist livelihoods devastated bylast year’s droughts. Agricultural areas also benefitted from the above average rainfall.
In contrast with most of the region, the coastal areas of Kenya and most of south and centralSomalia endured significantly drier than average conditions during the Long Rains season ofMarch to May/June 2015. This also affected SW areas of Ethiopia.
In Somalia, these conditions affected agriculturally productive regions, leading to perspectivesof below average crop production.
No further improvements are expected: June was fairly dry and the long dry season has nowstarted and will extend to October 2016. Therefore conditions prior to a possible La Niñainfluenced next season are already unfavourable.
Variable Performance Across the Region
The main season in the Ethiopia and Sudan region is now unfolding and will lastuntil late 2016. Performance in June-July 2016 has been quite variable – acrossSudan, wetter than average conditions reflect recent widespread heavy rains,after an patchy and drier start.
Elsewhere, drier than average conditions in the past two months are widespreadacross the region: in Uganda, parts of South Sudan and southern Ethiopia this isaffecting early stages of the growing season, although there is plenty of time fora recovery in conditions. In Afar, SE Ethiopia and central-southern Somalia thisperiod is mostly out of season.
Current vegetation patterns are complex: they reflect lingering effects of theextreme conditions of the past year (Sudan and northern Ethiopia), the abundantrains of March-May (South Sudan, Afar) and the patchy and irregularperformance of the June-July rains. Below average vegetation in Sudan andEthiopia should recover in response to recent rainfall.
March-May 2016 June 2016 onwards
Late May to late July 2016 rainfall as a percentage of the average (left). Blues for wetter than average, orange and browns for below average conditions. NDVI in mid July (right) as a percentage of the average. Greens for wetter than average, orange shades for below average conditions.

East
Afr
ica:
Inte
nse
Imp
acts
, Co
ntr
asti
ng
Ou
tlo
oks
Perspectives for mid-2016 (Sudan-Ethiopia): Favourable Outlook
Mar-May 2016Evidence: Historical AnalysisEthiopia (Belg)EritreaSomaliland
Wetter than average Wetter than average
Jul-Oct 2016: Evidence: ForecastEthiopia (Meher, Second)EritreaSudan (Main)
Mar-May 2016Evidence: Actual DataEthiopia (Belg)EritreaSomaliland
2016
Jan Feb Mar Apr May Jun Jul SepAug Oct Nov Dec
2017
Jan Feb Mar Apr May Jun Jul SepAug Oct Nov Dec
Mixed / Poor?
ECMWF rainfall forecast for July-September 2016 (left), GHACOF climate outlook (right). Green shades = wetter than average conditions. Yellow and brown shades drier than average conditions.
Ethiopia-Sudan, July-October 2016
The forecasts for the main rainfall season of July-October indicate on or aboveaverage rainfall across Sudan, Ethiopia and Eritrea. Favourable conditions mayextend to South Sudan and neighbouring areas of Uganda, NW Kenya and SWEthiopia.
This implies a continuation of the recovery in ground moisture conditions thatstarted in April 2016 and opens favourable perspectives for improved cropproduction and pasture resources across the region, particularly in the regions moreseverely affected by drought in 2015.
Note however, that meaningful recovery from the large livestock losses endured in2015 will take a significant time and requires a succession of good seasons. A goodmain season (Meher) harvest is a must to improve cereal availability as it typicallymakes up 90% of Ethiopia’s annual cereal production. Therefore, any substantialreduction in humanitarian requirements will not take place until after the Meherharvests in late 2016.
La Niña impacts on Belg season performance are variable – may favour some NWareas with earlier starts of the season but lead to below average rainfall in mostother Belg areas. Impacts maybe fairly moderate as the event at this stage isexpected to be weak and short lived.

East
Afr
ica:
Inte
nse
Imp
acts
, Co
ntr
asti
ng
Ou
tlo
oks
Perspectives for 2016-2017: Worries for Somalia and Kenya
Somalia-Kenya, late 2016-early 2017
Forecasts for the next Short Rains season (October-November 2016)indicate widespread below average rainfall (map left) across theregion, in agreement with a typical La Niña situation.
For the Long Rains of March-May 2017, a comparison of the averageMarch-May rainfall between La Niña and neutral seasons based onhistorical data for 1981-2013 (map right) shows that La Niñaseasons are associated with drier than average seasons across muchof the region.
This configures unfavourable developments for Somalia and easternKenya until mid 2017:
• Households are more vulnerable to drought impacts as a result ofthe poor performance of the Long Rains season of 2016 that hasrecently ended.
• According to forecasts, this will be followed by a drier thanaverage Short Rains season in late 2016
• In the worst case scenario, under La Niña conditions, anotherpoor Long Rains season in March-May 2017 may follow.
Note that the 2010-2011 catastrophic drought in these regions, alsoassociated with a la Niña event, remains a major historical outlierand an outcome of that magnitude is therefore unlikely.
March-May: Historical La Niña
Left: ECMWF rainfall forecast for October-December 2016. Green shades, wetter than average, brown shades drier than average.Right: Average March-May rainfall for La Niña seasons 1981-2013 compared to same average for Neutral seasons. Yellows and browns = La Niña drier than neutral seasons, purples = La Niña wetter than neutral seasons
October-December 2016: Forecast
Mar-May 2016Evidence: Actual DataN KenyaSomalia
Mixed, Somalia poor
Oct-Dec 2016Evidence: Actual DataN KenyaSomalia
Jul SepAug Oct Nov Dec
2016
Jan Feb Mar Apr May Jun Jul SepAug Oct Nov Dec
2017
Jan Feb Mar Apr May Jun
Drier than average
Mar-May 2016Evidence: ForecastsN KenyaSomalia
Drier than average
Mar-May 2016Evidence: Historical DataN KenyaSomalia
Drier than average

Southern Africa:
The Aftermath of a Two Year Drought

Sou
the
rn A
fric
a: A
fte
rmat
h o
f a
Two
Ye
ar D
rou
ght
Extent and Impact of a Two Year Regional Drought
Two Year Drought causes a wide range of cross-sectoral impacts
Southern Africa has been affected by drought in two consecutive growingseasons. The previous growing season of October 2014 to April 2015 wascharacterized by extensive rainfall deficits during key stages of the staple maizecrop development (planting and flowering/grain filling). Significant, thoughlocalized, flooding in Malawi and northern Mozambique further compounded theproblems.
The growing season of 2015-2016 that has just ended was one of the driest onrecord, being particularly intense in its earlier stages – this led to major impactson crop production as it led to extensive decreases in planted area. Whereplanting was successful, yields were affected by much drier than averageconditions that lasted until late February 2016. An improvement in rainfall fromMarch onwards did little to alleviate the problems affecting crop production,though it improved water reservoir and hydro power production perspectives inthe Zambezi.
Two Year Rainfall from June2014 to May 2016 expressedin terms of how extreme it waswithin the historical record(1981-present).
Extreme dryness or wetnesswas defined as amounts fallingin the driest or wettest 10% ofthe record – corresponding tothe 3rd driest (wettest) orworse. The map also showsless extreme drier and wetterthan average regions.
Southern Africa regional maizeproduction in two seasons ofdrought:
2014-15 and 2015-16 maizeproduction is compared to theaverage of the 5 harvests thatpreceded the two droughtaffected seasons.
Major concerns highlighted:Sharp production drops in largeproducers (SA) and countrieswith large food insecurepopulations (Malawi andZimbabwe ).
Data: SADC / FAO-Stat
MAIZE PRODUCTION ('000 MT)
CountryPre-Drought
Average 2015 %Change 2016 %Change
Angola 1205 34% 86%
Botswana 18 -18% -78%
Lesotho 77 -4% -67%
Malawi 3661 -21% -42%
Mozambique 1602 17% 12%
Namibia 63 -39% -40%
South Africa 12495 -16% -38%
Swaziland 89 6% -63%
Zambia 2910 -10% -6%
Zimbabwe 1173 -37% -56%
TOTAL 23293 -12% -26%
Maize Production Hit Hard for the Second Year Running
Two consecutive droughts had a major impact on regional crop production. The table aboveshows maize production for the harvests of 2015 and 2016 as variations from a pre-droughtbaseline (average of the 5 harvests 2010 to 2014): the region as a whole suffered two majorconsecutive drops in production, of 12 percent and 26 percent relative to this pre-droughtbaseline.
Of particular relevance are the sharp falls in maize production of the major regionalproducer – South Africa, with consecutive drops of 16 and 38 percent – and in the twocountries with highest numbers of food insecure people, Zimbabwe (consecutive drops of37 and 56 percent) and Malawi (consecutive drops of 21 and 42 percent). Also notable areproduction near wipe outs in Lesotho, Swaziland and Botswana.
Only Mozambique, Angola and Zambia (to a lesser degree) escape this tendency as theirmore northern producing areas make them less sensitive to El Niño impacts.
Optimistic Perspectives for the Next 2016-17 Growing Season
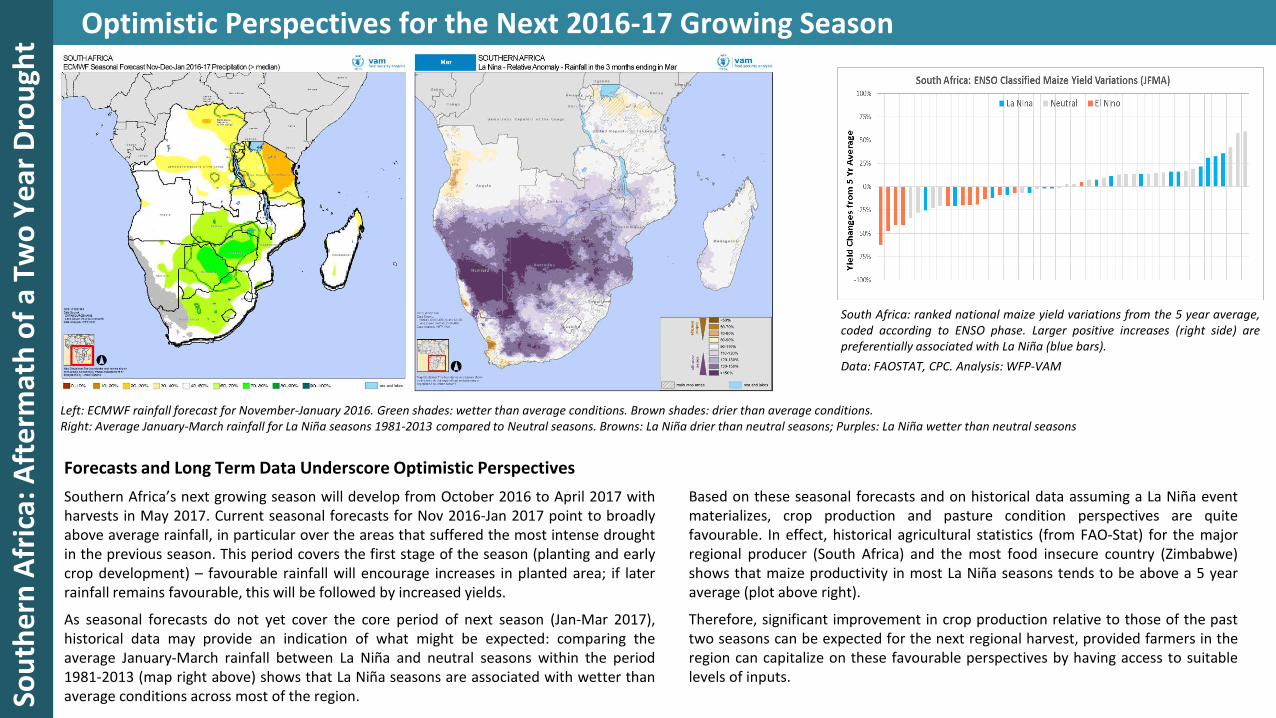
Based on these seasonal forecasts and on historical data assuming a La Niña eventmaterializes, crop production and pasture condition perspectives are quitefavourable. In effect, historical agricultural statistics (from FAO-Stat) for the majorregional producer (South Africa) and the most food insecure country (Zimbabwe)shows that maize productivity in most La Niña seasons tends to be above a 5 yearaverage (plot above right).
Therefore, significant improvement in crop production relative to those of the pasttwo seasons can be expected for the next regional harvest, provided farmers in theregion can capitalize on these favourable perspectives by having access to suitablelevels of inputs.
Forecasts and Long Term Data Underscore Optimistic Perspectives
Southern Africa’s next growing season will develop from October 2016 to April 2017 withharvests in May 2017. Current seasonal forecasts for Nov 2016-Jan 2017 point to broadlyabove average rainfall, in particular over the areas that suffered the most intense droughtin the previous season. This period covers the first stage of the season (planting and earlycrop development) – favourable rainfall will encourage increases in planted area; if laterrainfall remains favourable, this will be followed by increased yields.
As seasonal forecasts do not yet cover the core period of next season (Jan-Mar 2017),historical data may provide an indication of what might be expected: comparing theaverage January-March rainfall between La Niña and neutral seasons within the period1981-2013 (map right above) shows that La Niña seasons are associated with wetter thanaverage conditions across most of the region.So
uth
ern
Afr
ica:
Aft
erm
ath
of
a Tw
o Y
ear
Dro
ugh
t
South Africa: ranked national maize yield variations from the 5 year average,coded according to ENSO phase. Larger positive increases (right side) arepreferentially associated with La Niña (blue bars).
Data: FAOSTAT, CPC. Analysis: WFP-VAM
Left: ECMWF rainfall forecast for November-January 2016. Green shades: wetter than average conditions. Brown shades: drier than average conditions.Right: Average January-March rainfall for La Niña seasons 1981-2013 compared to Neutral seasons. Browns: La Niña drier than neutral seasons; Purples: La Niña wetter than neutral seasons
Central America and Caribbean:
In the Grip of Long Term Dryness

Ce
ntr
al A
me
rica
: In
Th
e G
rip
of
Lon
g Te
rm D
ryn
ess
El Niño 2015 Outcomes and Current Status
Long Term Dryness Followed by a Poor Start of the 2016 Season
The Central America and Caribbean region has been affected by extremely dryconditions during the two years from June 2014 to May 2016. This period covers mostof the Primera (April to August) and Postrera (August to November) seasons of 2014and 2015, as well as the initial conditions of the current Primera season of 2016.
The map above left shows the extent of areas where the 2014-2016 period was one ofthe driest on record. The areas most affected by this long term extended dryness wereHispaniola (Haiti and Dominican Republic) as well as Nicaragua, Honduras, El Salvadorand Guatemala, in particular areas with poorer, more vulnerable populations.
Left: Two Year Rainfall from June 2014 to May 2016expressed in terms of how extreme it was within thehistorical record (1981-present).
Extreme dryness or wetness was defined as amountsfalling in the driest or wettest 10% of the record –corresponding to the 3rd driest (wettest) or worse. Themap also shows less extreme drier and wetter thanaverage regions.
Right: February to mid July 2016 rainfall as a percentageof the average (left). Blues for wetter than average,orange and browns for below average conditions.
Impacts have been more pronounced during the Primera season when the bulk of theregion’s maize crop is produced. This has resulted in general drops in maize production(and beans to a lesser degree) with significant additional impacts on water resources foragriculture and livestock.
The first growing season of 2016 (Primera) has so far been unfavourable across most ofthe region, in particular in Guatemala, Salvador and Honduras. Unfavourable perspectiveswill hold for the Primera season unless the situation is quickly reversed.
This will add further problems to the vulnerable poor rural populations already hit by asuccession of droughts in past seasons.

Ce
ntr
al A
me
rica
: In
Th
e G
rip
of
Lon
g Te
rm D
ryn
ess
Perspectives Until Late 2016
Uncertain Perspectives for the Remainder of 2016Current seasonal forecasts for rainfall in the Postrera season of 2016 present mixed outcomes,from moderately drier than average conditions (ECMWF, map left) to above average rainfallfrom CPC/NOAA.
If the more pessimistic forecasts are realized, the region may not see significant improvementsin the availability of cereal and level of hydrological resources (rivers levels, reservoirs, longterm soil moisture reserves). Given the poor start so far, this maybe the more likely outcomefor 2016.
Left: ECMWF rainfall forecast for August-October2016. Green shades = wetter than averageconditions. Brown shades drier than averageconditions.
Right: Average June-August rainfall for La Niñaseasons 1981-2013 compared to Neutral seasons. Browns – La Niña drier than neutral seasons; Purples – La Niña wetter than neutral seasons
Should a La Niña materialize it will have little impact on the current seasonrainfall patterns and may not last long enough to influence next year’s Primeraseason rainfall.
In any case, historical data (1981-2013) shows at best a weak tendency forwetter than average Primera seasons during La Niña seasons (map right above)and no well defined expectation can be outlined.
South America:
A typical El Niño season

Sou
th A
me
rica
: A t
ypic
al E
l Niñ
ose
aso
nEl Niño Impacts and Current Status
Typical El Niño Impacts Spread over two Seasons
South America has not been immune to El Niño influences and as other regions, thetwo years from June 2014 to May 2016 have been characterized by rainfall extremes.Extremely drier than average conditions can be seen (map left) extending fromEquador, Colombia, Venezuela and through western Brazil into eastern Bolivia. Astypical of El Niño season, most of the northern half of Brazil had a drier than averageseason.
In contrast, southernmost Brazil, Paraguay, Uruguay and areas of northern Argentine,registered very wet conditions, resulting in flood events.
The growing season that has recently ended was characterized by severely belowaverage rainfall in more northern areas of the continent, from the Guyanas to centralcoastal Brazil. Dry conditions also affected Bolivia and NW Peru. On the other hand,extreme wet conditions occurred during this period affecting southernmost Brazil,Paraguay and Uruguay.
Later phases of the season saw a maintenance of drier than average conditions inBolivia and in western states of Brazil (Bahia, Pernambuco, Piaui).
Left: Two Year Rainfall from June 2014 to May 2016 expressed in terms of how extreme it was within the historical record (1981-present). Extreme dryness or wetness was defined as amounts falling in the driest or wettest 10% of the record – corresponding to the3rd driest (wettest) or worse. The map also shows less extreme drier and wetter than average regions.
Right: October-December 2015 and March to May 2016 rainfall as a percentage of the average. Blues for wetter than average,orange and browns for below average conditions.
Sou
th A
me
rica
: A t
ypic
al E
l Niñ
ose
aso
nExpectations for 2016-17: Forecasts and Historical Patterns
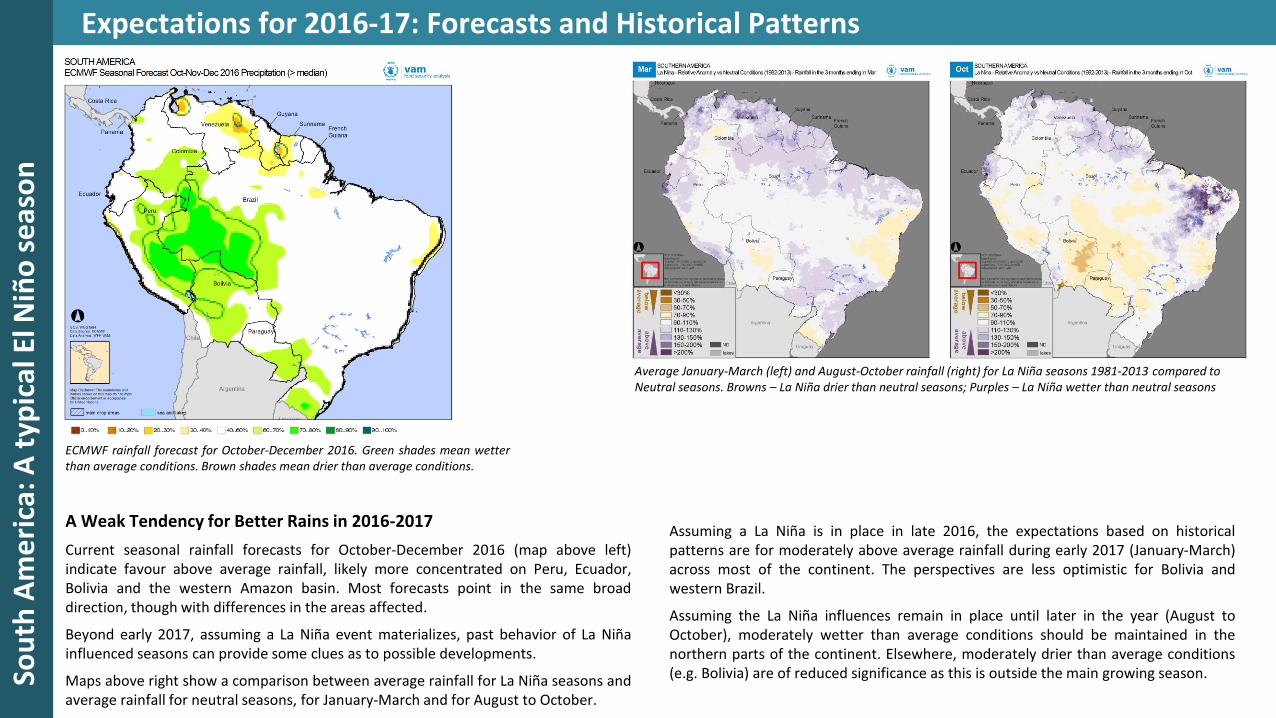
A Weak Tendency for Better Rains in 2016-2017
Current seasonal rainfall forecasts for October-December 2016 (map above left)indicate favour above average rainfall, likely more concentrated on Peru, Ecuador,Bolivia and the western Amazon basin. Most forecasts point in the same broaddirection, though with differences in the areas affected.
Beyond early 2017, assuming a La Niña event materializes, past behavior of La Niñainfluenced seasons can provide some clues as to possible developments.
Maps above right show a comparison between average rainfall for La Niña seasons andaverage rainfall for neutral seasons, for January-March and for August to October.
Assuming a La Niña is in place in late 2016, the expectations based on historicalpatterns are for moderately above average rainfall during early 2017 (January-March)across most of the continent. The perspectives are less optimistic for Bolivia andwestern Brazil.
Assuming the La Niña influences remain in place until later in the year (August toOctober), moderately wetter than average conditions should be maintained in thenorthern parts of the continent. Elsewhere, moderately drier than average conditions(e.g. Bolivia) are of reduced significance as this is outside the main growing season.
ECMWF rainfall forecast for October-December 2016. Green shades mean wetterthan average conditions. Brown shades mean drier than average conditions.
Average January-March (left) and August-October rainfall (right) for La Niña seasons 1981-2013 compared to Neutral seasons. Browns – La Niña drier than neutral seasons; Purples – La Niña wetter than neutral seasons
Asia and the Pacific:
Variable post-El Niño scenarios

El Niño Outcomes and Current Status
2014-2016: Two Years of Rainfall Extremes
Across many areas of Asia, the two year rainfall from June 2014 to May 2016 reachedhistorical extremes, particularly on the dry end of the scale. This period covers two Asianmonsoons and two main seasons of the Indonesian region. SE Asia is the area mostaffected by this extended dryness – in areas of central and south Vietnam, central Laosand eastern Cambodia, conditions over this two year time span have been the driest onrecord (since 1981).
Similarly dry conditions predominated in Indonesia and southern Philippines plus theborder regions between the two Koreas. Severe drought also affected Papua New Guineaand many Pacific Islands. In contrast, SE China endured extremely wet conditions.Ea
st A
sia:
Var
iab
le p
ost
-El N
iño
sce
nar
ios
Two Year Rainfall from June 2014 to May 2016 expressed in terms of how extreme it waswithin the historical record (1981-present).
Extreme dryness or wetness is defined as amounts falling in the driest or wettest 10% ofthe record – corresponding to the 3rd driest (wettest) or worse. The map also shows lessextreme drier and wetter than average regions.
Cumulative rainfall February to mid July2016, as a percentage of the 20-year average. Hashed pattern indicates main agricultural areas. Brown shades indicate below-average rainfall; blue shades indicate above-average seasonal rainfall.
Drier than average first half of 2016 in SE Asia
Markedly drier than average conditions have dominated across SE Asia, Philippinesand parts of Borneo until May 2016. Conditions have improved since, thoughrainfall patterns are still irregular and overall seasonal rainfall is still below average
In contrast, wetter than average conditions have predominated across the rest ofthe continent, with the exception of southern India. Improvements have beennoticed in PNG and the Pacific region.

Outlook for the main 2016 season and 2016-2017Ea
st A
sia:
Var
iab
le p
ost
-El N
iño
sce
nar
ios
Forecasts for the Main Season
Rainfall forecasts for the August-October period (bulk of the monsoon rainfall)indicate wetter than average conditions over most of India, SW China and in mostof Indonesia (though here this period is not the main rainfall season).
For SE Asia (Myanmar to Vietnam and Philippines) the forecasts indicate on orbelow average rainfall for this main period of the growing season.
Hence, there may not be a substantial relief from the conditions that haveprevailed since early 2015, in particular considering the strong rainfall deficits thathad already accumulated until mid 2016.
NOAA/CPC rainfall forecast for August-October 2016. Green shades, wetter than average conditions. Yellow-red shades, drier than average conditions
NOAA/CPC rainfall forecast for October-December 2016. Green shades, wetter than average conditions. Yellow-red shades, drier than average conditions.
Forecasts for 2016-17
Rainfall forecasts for December-February 2016 (early-mid season in the Indonesianregion) indicate on average conditions over Java and Borneo. Elsewhere in Indonesia,tendencies are less well defined, with some forecasts pointing to drier conditions overthe southeastern areas of Indonesia and PNG and others to above average rainfall.
Elsewhere in Asia, most of India and parts of SE Asia (Cambodia-southern Vietnam),forecasts of above average rainfall may indicate a longer lasting monsoon.
These conditions extend to the Philippines where the secondary cropping season mayenjoy favourable conditions, helping a recovery from the pronouncedly dry conditionsof the past two years.

West Africa:
Largely Untouched by El Niño

We
st A
fric
a: L
arge
ly U
nto
uch
ed
by
El N
iño
El Niño 2015 Outcomes and Current Status
Sahel Left Untouched by El NiñoUnlike many other regions of the globe, West Africa endured little impact from the ElNiño event and the drier period that preceded it. During 2014-2016, the Sahelian regionin particular, enjoyed two regular seasons with at most fairly localized drier thanaverage areas and a much wetter than average period in Burkina Faso – Mali.
The Gulf of Guinea countries in contrast endured a much drier than average 2014-2016,along a region from northern Cote d’Ivoire, western Ghana, southern Nigeria andCameroun, with impacts on crop production and water resources.
These two patterns are related: El Niño is not the single influence on West Africaweather and in this case, sea surface temperature patterns in the Atlantic changed in away that enhanced rainfall in the Sahel and suppressed rainfall along the Gulf ofGuinea.
Two Year Rainfall fromJune 2014 to May 2016expressed in terms of howextreme it was within thehistorical record (1981-present).
Extreme dryness orwetness is defined asamounts falling in thedriest or wettest 10% ofthe record – correspondingto the 3rd driest (wettest)or worse. The map alsoshows less extreme drierand wetter than averageregions.
2016 Season with Variable PerformanceThe 2016 season is starting its core period and so far shows variable performanceacross West Africa. Western regions – Sierra Leone, Guineas and Senegal in particular,as well as the Gulf of Guinea (Ghana-Cote d’Ivoire) have endured drier than averageconditions from the start of the season. In the Gulf of Guinea this implies acontinuation of the drier than average conditions that have persisted for the past twoseasons.
In contrast, regions extending from central Mali across to Chad have been enjoyingregular and abundant rainfall. In particular the marginal sahelian areas of Niger, theLake Chad region and most of Chad have been extremely wet during June and July,with corresponding good perspectives for the agricultural season and pastoralresources.
Cumulative rainfallFebruary to mid July 2016,as a percentage of the 20-year average. Hashedpattern indicates mainagricultural areas. Brownshades indicate below-average rainfall; blueshades indicate above-average seasonal rainfall.

We
st A
fric
a: L
arge
ly U
nto
uch
ed
by
El N
iño
ave
rOutlook for the 2016 season
Variable Outlooks for the Remainder of the 2016 SeasonCurrent seasonal forecasts offer variable outlooks for the rest of the season – this hasalso been the case for other regions, and no clear guidance can be offered at this stage.
Forecasts from the ECMWF provide an outlook that resembles the current seasonalrainfall pattern, with a continuation of drier than average conditions in the westernareas of the region and along the Gulf of Guinea. In more central and eastern areas thetendency is for average conditions until the end of the season.
Other forecasts offer contrasting perspectives, with CPC/NOAA predicting aboveaverage rainfall across most of the region and the UK Metoffice predicting belowaverage rainfall for all regions west of Chad.
The La Niña event, even if it materializes is not expected to influence the regionthis season, since its onset will happen during the last stages of the Sahelianseason at the earliest. La Niña influences upon Sahelian rainfall are also poorlydefined, with a only a fairly moderate tendency for wetter than averageconditions. Atlantic sea surface temperatures will remain a greater influence.
NOAA/CPC rainfall forecast for August-October 2016. Green shades, wetter than average conditions. Yellow-red shades, drier than average conditions
ECMWF rainfall forecast for August-October 2016. Green shades mean wetter thanaverage conditions. Orange and yellow shades mean drier than average conditions.

Data Sources:Rainfall: CHIRPS, Climate Hazards Group, UCSB
Vegetation: MODIS NDVI, EOSDIS-NASA
Land Cover: FAO GLC-Share
Seasonal Forecasts: ECMWF, Regional COFs, CPC, UKMetOffice
Processing:
VAM software components, ArcGIS
For more information, please contact:
Rogerio Bonifacio
[email protected]+39 06 6513 3917