enstar group limited | investor relations
TRANSCRIPT

UNITED STATES SECURITIES AND EXCHANGE COMMISSIONWashington, D.C. 20549
FORM 10-Q
QUARTERLY REPORT PURSUANT TO SECTION 13 OR 15(d) OF THE SECURITIES EXCHANGE ACT OF 1934
For the quarterly period ended June 30, 2016Commission File Number 001-33289
ENSTAR GROUP LIMITED(Exact name of Registrant as specified in its charter)
BERMUDA N/A(State or other jurisdiction of incorporation or organization) (I.R.S. Employer Identification No.)
Windsor Place, 3rd Floor, 22 Queen Street, Hamilton HM JX, Bermuda(Address of principal executive offices, including zip code)
Registrant’s telephone number, including area code: (441) 292-3645
Indicate by check mark whether the registrant (1) has filed all reports required to be filed by Section 13 or 15(d) of the Securities ExchangeAct of 1934 during the preceding 12 months (or for such shorter period that the registrant was required to file such reports), and (2) has beensubject to such filing requirements for the past 90 days. Yes þ No ¨
Indicate by check mark whether the registrant has submitted electronically and posted on its corporate Web site, if any, every InteractiveData File required to be submitted and posted pursuant to Rule 405 of Regulation S-T during the preceding 12 months (or for such shorter periodthat the registrant was required to submit and post such files). Yes þ No ¨
Indicate by check mark whether the registrant is a large accelerated filer, an accelerated filer, a non-accelerated filer, or a smaller reportingcompany. See the definitions of “large accelerated filer,” “accelerated filer” and “smaller reporting company” in Rule 12b-2 of the Exchange Act.
Large accelerated filer þ Accelerated filer ¨ Non-accelerated filer ¨ Smaller reporting company ¨
Indicate by check mark whether the registrant is a shell company (as defined in Rule 12b-2 of the Exchange Act). Yes ¨ No þ
As of August 5, 2016, the registrant had outstanding 16,225,391 voting ordinary shares and 3,130,408 non-voting convertible ordinary shares,each par value $1.00 per share.

Table of Contents
Enstar Group Limited
Quarterly Report on Form 10-QFor the Period Ended June 30, 2016
Table of Contents
PagePART I
Item 1. Financial Statements 1Item 2. Management's Discussion and Analysis of Financial Condition and Results of Operations 46Item 3. Quantitative and Qualitative Disclosures about Market Risk 82Item 4. Controls and Procedures 84
PART II
Item 1. Legal Proceedings 85Item 1A. Risk Factors 85Item 6. Exhibits 85

Table of Contents
PART I — FINANCIAL INFORMATION
ITEM 1. FINANCIAL STATEMENTSENSTAR GROUP LIMITED
UNAUDITED CONDENSED CONSOLIDATED BALANCE SHEETSAs of June 30, 2016 and December 31, 2015
June 30,
2016 December 31,
2015
(expressed in thousands of U.S. dollars,
except share data)ASSETS Short-term investments, trading, at fair value $ 122,746 $ 87,350
Short-term investments, available-for-sale, at fair value (amortized cost: 2016 — $2,406; 2015 — $8,630) 2,401 8,622
Fixed maturities, trading, at fair value 4,986,615 4,990,794
Fixed maturities, held-to-maturity, at amortized cost 770,655 790,866
Fixed maturities, available-for-sale, at fair value (amortized cost: 2016 — $297,327; 2015 — $300,160) 299,929 293,679
Equities, trading, at fair value 117,293 115,941
Other investments, at fair value 936,158 1,034,032
Other investments, at cost 129,636 133,071
Total investments 7,365,433 7,454,355
Cash and cash equivalents 800,846 821,925
Restricted cash and cash equivalents 446,293 511,339
Premiums receivable 416,354 381,412
Deferred tax assets 116,047 121,035
Prepaid reinsurance premiums 145,184 121,427
Reinsurance balances recoverable 1,345,115 1,474,004
Funds held by reinsured companies 1,190,899 109,358
Deferred acquisition costs 101,227 89,123
Goodwill and intangible assets 187,555 191,304
Other assets 544,213 556,850
TOTAL ASSETS $ 12,659,166 $ 11,832,132
LIABILITIES Losses and loss adjustment expenses $ 6,433,845 $ 5,720,149
Policy benefits for life and annuity contracts 1,286,276 1,304,697
Unearned premiums 576,970 542,771
Insurance and reinsurance balances payable 318,072 274,598
Deferred tax liabilities 94,676 92,588
Loans payable 614,030 600,250
Other liabilities 276,186 358,633
TOTAL LIABILITIES 9,600,055 8,893,686
COMMITMENTS AND CONTINGENCIES REDEEMABLE NONCONTROLLING INTEREST 439,656 417,663
SHAREHOLDERS’ EQUITY Share capital authorized, issued and fully paid, par value $1 each (authorized 2016 and 2015: 156,000,000):
Ordinary shares (issued and outstanding 2016: 16,166,652; 2015: 16,133,334) 16,167 16,133
Non-voting convertible ordinary shares: Series A (issued 2016: nil; 2015: 2,972,892)
— 2,973
Series C (issued and outstanding 2016: 2,725,637; 2015: 2,725,637) 2,726 2,726
Series E (issued and outstanding 2016: 404,771; 2015: 404,771) 405 405
Series C Preferred Shares (issued and outstanding 2016: 388,571; 2015: nil) 389 —
Treasury shares at cost (Preferred shares 2016: 388,571; Series A non-voting convertible ordinary shares 2015: 2,972,892) (421,559) (421,559)
Additional paid-in capital 1,376,590 1,373,044
Accumulated other comprehensive loss (21,527) (35,162)
Retained earnings 1,662,623 1,578,312
Total Enstar Group Limited Shareholders’ Equity 2,615,814 2,516,872
Noncontrolling interest 3,641 3,911

TOTAL SHAREHOLDERS’ EQUITY 2,619,455 2,520,783
TOTAL LIABILITIES, REDEEMABLE NONCONTROLLING INTEREST AND SHAREHOLDERS’ EQUITY $ 12,659,166 $ 11,832,132
See accompanying notes to the unaudited condensed consolidated financial statements
1

Table of Contents
ENSTAR GROUP LIMITED
UNAUDITED CONDENSED CONSOLIDATED STATEMENTS OF EARNINGSFor the Three and Six Months Ended June 30, 2016 and 2015
Three Months Ended
June 30, Six Months Ended
June 30,
2016 2015 2016 2015
(expressed in thousands of U.S.
dollars, except share and per share data)INCOME
Net premiums earned $ 226,928 $ 212,023 $ 436,337 $ 410,929Fees and commission income 7,243 9,131 12,590 20,611Net investment income 54,223 34,655 114,286 65,072Net realized and unrealized gains (losses) 37,987 (11,249) 75,951 31,771Other income 4,048 11,838 6,461 15,314
330,429 256,398 645,625 543,697EXPENSES
Net incurred losses and loss adjustment expenses 96,462 65,900 179,680 136,036Life and annuity policy benefits 19,778 28,090 40,758 50,937Acquisition costs 46,489 37,094 93,754 71,644General and administrative expenses 105,878 93,963 200,324 190,561Interest expense 5,424 4,876 10,825 8,879Net foreign exchange losses (gains) (1,856) 2,452 (84) (2,619)
272,175 232,375 525,257 455,438EARNINGS BEFORE INCOME TAXES 58,254 24,023 120,368 88,259INCOME TAXES (8,473) (5,816) (15,982) (16,560)NET EARNINGS 49,781 18,207 104,386 71,699Less: Net earnings attributable to noncontrolling interest (9,187) (3,662) (18,272) (12,307)NET EARNINGS ATTRIBUTABLE TO ENSTAR GROUP LIMITED $ 40,594 $ 14,545 $ 86,114 $ 59,392EARNINGS PER SHARE — BASIC Net earnings per ordinary share attributable to Enstar Group Limitedshareholders $ 2.10 $ 0.76 $ 4.46 $ 3.09EARNINGS PER SHARE — DILUTED Net earnings per ordinary share attributable to Enstar Group Limitedshareholders $ 2.09 $ 0.75 $ 4.43 $ 3.07Weighted average ordinary shares outstanding — basic 19,295,280 19,252,359 19,289,119 19,244,951Weighted average ordinary shares outstanding — diluted 19,430,464 19,383,753 19,420,541 19,364,775
See accompanying notes to the unaudited condensed consolidated financial statements
2

Table of Contents
ENSTAR GROUP LIMITED
UNAUDITED CONDENSED CONSOLIDATED STATEMENTS OF COMPREHENSIVE INCOMEFor the Three and Six Months Ended June 30, 2016 and 2015
Three Months Ended
June 30, Six Months Ended
June 30,
2016 2015 2016 2015 (expressed in thousands of U.S. dollars)NET EARNINGS $ 49,781 $ 18,207 $ 104,386 $ 71,699Other comprehensive income, net of tax:
Unrealized holding gains (losses) on fixed income investments arisingduring the period 2,174 2,162 9,094 (2,194)Reclassification adjustment for net realized losses (gains) included in netearnings 113 (38) 135 (144)Unrealized gains (losses) arising during the period, net of reclassificationadjustment 2,287 2,124 9,229 (2,338)Currency translation adjustment (4,542) 3,299 6,053 (12,587)
Total other comprehensive income (loss) (2,255) 5,423 15,282 (14,925)Comprehensive income 47,526 23,630 119,668 56,774
Less comprehensive income attributable to noncontrolling interest (9,353) (533) (19,919) (6,169)COMPREHENSIVE INCOME ATTRIBUTABLE TO ENSTAR GROUPLIMITED $ 38,173 $ 23,097 $ 99,749 $ 50,605
See accompanying notes to the unaudited condensed consolidated financial statements
3

Table of Contents
ENSTAR GROUP LIMITED
UNAUDITED CONDENSED CONSOLIDATED STATEMENTS OF CHANGES IN SHAREHOLDERS’ EQUITYFor the Six Months Ended June 30, 2016 and 2015
Six Months Ended
June 30,
2016 2015
(expressed in thousands of U.S. dollars)Share Capital — Ordinary Shares
Balance, beginning of period $ 16,133 $ 15,761
Issue of shares 34 54
Conversion of Series E Non-Voting Convertible Ordinary Shares — 12
Balance, end of period $ 16,167 $ 15,827
Share Capital — Series A Non-Voting Convertible Ordinary Shares Balance, beginning of period $ 2,973 $ 2,973
Shares converted to Series C Convertible Participating Non-Voting Perpetual Preferred Stock (2,973) —
Balance, end of period $ — $ 2,973
Share Capital — Series C Non-Voting Convertible Ordinary Shares Balance, beginning and end of period $ 2,726 $ 2,726
Share Capital — Series E Non-Voting Convertible Ordinary Shares Balance, beginning of period $ 405 $ 714
Conversion to Ordinary Shares — (12)
Balance, end of period $ 405 $ 702
Share Capital — Series C Convertible Participating Non-Voting Perpetual Preferred Stock Balance, beginning of period $ — $ —
Conversion of Series A Non-Voting Convertible Ordinary Stock 389 —
Balance, end of period $ 389 $ —
Treasury Shares Balance, beginning and end of period $ (421,559) $ (421,559)
Additional Paid-in Capital Balance, beginning of period $ 1,373,044 $ 1,321,715
Issue of shares and warrants 360 911
Conversion of Series A Non-Voting Convertible Ordinary Stock 2,584 —
Amortization of equity incentive plan 602 2,821
Equity attributable to Enstar Group Limited on acquisition of noncontrolling shareholders’ interest in subsidiaries — 39,569
Balance, end of period $ 1,376,590 $ 1,365,016
Accumulated Other Comprehensive Income (Loss) Balance, beginning of period $ (35,162) $ (12,686)
Currency translation adjustment Balance, beginning of period (23,790) (2,779)
Change in currency translation adjustment 6,053 (10,227)
Purchase of noncontrolling shareholder's interest in subsidiaries — 2,937
Balance, end of period (17,737) (10,069)
Defined benefit pension liability Balance, beginning and end of period (7,723) (7,726)
Unrealized gains (losses) on investments Balance, beginning of period (3,649) (2,181)
Change in unrealized losses on investments 7,582 (1,809)
Purchase of noncontrolling shareholders’ interest in subsidiaries — 312
Balance, end of period 3,933 (3,678)
Balance, end of period $ (21,527) $ (21,473)
Retained Earnings Balance, beginning of period $ 1,578,312 $ 1,395,206
Net earnings attributable to Enstar Group Limited 86,114 59,392
Accretion of redeemable noncontrolling interests to redemption value (1,803) —
Balance, end of period $ 1,662,623 $ 1,454,598
Noncontrolling Interest (excludes redeemable noncontrolling interests)

Balance, beginning of period $ 3,911 $ 217,970
Sale of noncontrolling shareholders' interest in subsidiaries — (182,819)
Dividends paid — 680
4

Table of Contents
Contribution of capital — (323)
Net earnings (loss) attributable to noncontrolling interest (270) 291
Foreign currency translation adjustments — (1,558)
Net movement in unrealized holding losses on investments — (123)
Balance, end of period $ 3,641 $ 34,118
See accompanying notes to the unaudited condensed consolidated financial statements
5

Table of Contents
ENSTAR GROUP LIMITED
UNAUDITED CONDENSED CONSOLIDATED STATEMENTS OF CASH FLOWSFor the Six Months Ended June 30, 2016 and 2015
Six Months Ended
June 30,
2016 2015
(expressed in thousands
of U.S. dollars)OPERATING ACTIVITIES:
Net earnings $ 104,386 $ 71,699
Adjustments to reconcile net earnings to cash flows used in operating activities: Realized gains on sale of investments (786) (19,782)
Unrealized gains on investments (75,165) (11,989)
Other non-cash items 3,811 5,553
Depreciation and other amortization 24,320 28,262
Net change in trading securities held on behalf of policyholders (996) 1,728
Sales and maturities of trading securities 1,666,796 1,669,290
Purchases of trading securities (1,615,299) (2,299,395)
Changes in: Reinsurance balances recoverable 132,938 210,401
Funds held by reinsured companies (17) 20,773
Losses and loss adjustment expenses (380,111) (188,793)
Policy benefits for life and annuity contracts (20,881) (14,028)
Insurance and reinsurance balances payable 41,473 33,828
Unearned premiums 34,200 26,505
Other operating assets and liabilities (131,001) (12,097)
Net cash flows used in operating activities (216,332) (478,045)
INVESTING ACTIVITIES: Acquisitions, net of cash acquired $ 9,924 $ 56,369
Sales and maturities of available-for-sale securities 55,443 97,733
Purchase of available-for-sale securities (47,798) (48,548)
Maturities of held-to-maturity securities 15,302 5,246
Movement in restricted cash and cash equivalents 65,116 242,365
Purchase of other investments (40,166) (133,411)
Redemption of other investments 125,100 42,415
Other investing activities (1,597) (2,016)
Net cash flows provided by investing activities 181,324 260,153
FINANCING ACTIVITIES: Contribution by noncontrolling interest $ — $ 680
Contribution by redeemable noncontrolling interest — 15,728
Dividends paid to noncontrolling interest — (7,433)
Receipt of loans 154,048 374,700
Repayment of loans (140,500) (46,000)
Net cash flows provided by financing activities 13,548 337,675
EFFECT OF EXCHANGE RATE CHANGES ON FOREIGN CURRENCY CASH AND CASH EQUIVALENTS 381 (6,226)
NET INCREASE (DECREASE) IN CASH AND CASH EQUIVALENTS (21,079) 113,557
CASH AND CASH EQUIVALENTS, BEGINNING OF PERIOD821,925 963,402
CASH AND CASH EQUIVALENTS, END OF PERIOD $ 800,846 $ 1,076,959
Supplemental Cash Flow Information: Income taxes paid, net of refunds $ 15,830 $ 13,343
Interest paid $ 10,578 $ 7,952
See accompanying notes to the unaudited condensed consolidated financial statements
6


Table of Contents
ENSTAR GROUP LIMITED
NOTES TO THE UNAUDITED CONDENSED CONSOLIDATED FINANCIAL STATEMENTSJune 30, 2016 and December 31, 2015
(Tabular information expressed in thousands of U.S. dollars except share and per share data)
1. SIGNIFICANT ACCOUNTING POLICIES
Basis of Preparation and Consolidation
These unaudited condensed consolidated financial statements have been prepared in conformity with accounting principles generallyaccepted in the United States of America ("U.S. GAAP") for interim financial information. Accordingly, they do not include all of the informationand footnotes required by U.S. GAAP for complete financial statements. In the opinion of management, these financial statements reflect alladjustments consisting of normal recurring items considered necessary for a fair presentation under U.S. GAAP. The results of operations for anyinterim period are not necessarily indicative of results of the full year. These consolidated financial statements should be read in conjunction withthe consolidated financial statements and related notes included in our Annual Report on Form 10-K for the year ended December 31, 2015. Inter-company accounts and transactions have been eliminated. Results of operations for subsidiaries acquired are included from the dates on which weacquired them. In these notes, the terms "we," "us," "our," or "the Company" refer to Enstar Group Limited and its consolidated subsidiaries.Certain prior period amounts have been reclassified to conform to the current period presentation. These reclassifications had no impact on netearnings.
The preparation of these financial statements requires management to make estimates and assumptions that affect the reported amount ofassets and liabilities and disclosure of contingent assets and liabilities at the date of the financial statements and the reported amounts ofrevenues and expenses during the reporting period. Actual results may differ materially from these estimates. Results of changes in estimates arereflected in earnings in the period in which the change is made. Our principal estimates include, but are not limited to:
• liability for losses and loss adjustment expenses ("LAE");
• liability for policy benefits for life and annuity contracts;
• reinsurance balances recoverable;
• gross and net premiums written and net premiums earned;
• impairment charges, including other-than-temporary impairments on investment securities classified as available-for-sale or held-to-maturity, and impairments on goodwill, intangible assets and deferred charges;
• fair value measurements of investments;
• fair value estimates associated with accounting for acquisitions; and
• redeemable noncontrolling interests.
New Accounting Standards Adopted in 2016
Accounting Standards Update ("ASU") 2015-16, Business Combinations, Simplifying the Accounting for Measurement-Period Adjustment
In September 2015, the Financial Accounting Standards Board ("FASB") issued ASU 2015-16, which eliminates the requirement for anacquirer to retrospectively adjust the financial statements for measurement-period adjustments that occur in periods after a business combinationis consummated. Under the new guidance, an acquirer must recognize adjustments to provisional amounts that are identified during themeasurement period in the reporting period in which the adjustment amounts are determined. The adoption of this guidance did not have a materialimpact on our consolidated financial statements and disclosures.
7

Table of ContentsENSTAR GROUP LIMITED
NOTES TO THE UNAUDITED CONDENSED CONSOLIDATED FINANCIAL STATEMENTS — (Continued)
ASU 2015-07, Disclosures for Investments in Certain Entities that Calculate Net Asset Value or its Equivalent
In May 2015, the FASB issued ASU No. 2015-07, which eliminates the requirement to categorize investments in the fair value hierarchy iftheir fair value is measured at the net asset value ("NAV") per share (or its equivalent) using the practical expedient in the FASB’s fair valuemeasurement guidance. Instead, an entity is required to include those investments as a reconciling line item so that the total fair value amount ofinvestments in the disclosure is consistent with the amount on the balance sheet. In addition, the scope of current disclosure requirements forinvestments eligible to be measured at NAV is limited to investments for which the practical expedient is applied. While the adoption of thisguidance impacted our disclosures, it did not have an impact on our consolidated financial statements.
ASU 2015-02, Amendments to the Consolidation Analysis
In February 2015, the FASB issued ASU 2015-02, which requires entities to evaluate whether they should consolidate certain legal entities.The new consolidation guidance changes the way entities evaluate whether (1) they should consolidate limited partnerships and similar entities; (2)fees paid to a decision maker or service provider are variable interests in a variable interest entity ("VIE"), and (3) variable interests in a VIE heldby related parties of a registrant require the registrant to consolidate the VIE. The new guidance also eliminates the VIE consolidation model basedon majority exposure to variability that applied to certain investment companies and similar entities. The ASU also significantly changes how toevaluate voting rights for entities that are not similar to limited partnerships when determining whether the entity is a VIE, which may affect entitiesfor which decision making rights are conveyed through a contractual arrangement. The adoption of this guidance did not have a material impact onour consolidated financial statements and disclosures.
Recently Issued Accounting Pronouncements Not Yet Adopted
ASU 2016-13, Financial Instruments - Credit Losses - Measurement of Credit Losses on Financial Instruments
In June 2016, the FASB issued ASU 2016-13, which amends the guidance on impairment of financial instruments and significantly changeshow entities will measure credit losses for most financial assets and certain other instruments that are not measured at fair value through netincome. The ASU will replace the existing “incurred loss” approach, with an “expected loss” model for instruments measured at amortized cost andrequire entities to record allowances for available-for-sale debt securities rather than reduce the carrying amount under the existing other-than-temporary-impairment model. The ASU also simplifies the accounting model for purchased credit-impaired debt securities and loans. The ASU iseffective for interim and annual reporting periods beginning after December 15, 2019. We are currently evaluating the impact of the adoption of thisguidance on our consolidated financial statements.
ASU 2016-09, Improvements to Employee Share-Based Payment Accounting
In March 2016, the FASB issued ASU 2016-09, which simplifies several aspects of the accounting for employee share-based paymenttransactions, including the accounting for income taxes, forfeitures, and statutory tax withholding requirements, as well as classification in thestatement of cash flows. The ASU is effective for interim and annual reporting periods beginning after December 15, 2016. We are currentlyevaluating the impact of the adoption of this guidance on our consolidated financial statements.
ASU 2016-08, Principal versus Agent Considerations (Reporting Revenue Gross versus Net)
In March 2016, the FASB issued ASU 2016-08, which amends the principal-versus agent implementation guidance and illustrations in itsnew revenue standard (ASU 2014-09). The ASU clarifies that an entity should evaluate whether it is the principal or the agent for each specifiedgood or service promised in a contract with a customer. Similar to ASU 2014-09, this guidance is effective for interim and reporting periodsbeginning after December 15, 2017, as amended by the one-year deferral and the early adoption provisions in ASU 2015-14. We are currentlyevaluating the impact of the adoption of this guidance on our consolidated financial statements.
ASU 2016-07, Simplifying the Transition to the Equity Method of Accounting
In March 2016, the FASB issued ASU 2016-07, which simplifies the equity method of accounting by eliminating the requirement toretrospectively apply the equity method to an investment that subsequently qualifies for such accounting as a result of an increase in the level ofownership interest or degree of influence. Entities are therefore required to apply the guidance prospectively to increases in the level of ownershipinterest or degree of influence occurring after the ASU’s effective date. The ASU further requires that unrealized holding gains or losses inaccumulated
8

Table of ContentsENSTAR GROUP LIMITED
NOTES TO THE UNAUDITED CONDENSED CONSOLIDATED FINANCIAL STATEMENTS — (Continued)
other comprehensive income related to an available-for-sale security that becomes eligible for the equity method be recognized in earnings as ofthe date on which the investment qualifies for the equity method. The ASU is effective for interim and annual reporting periods beginning afterDecember 15, 2016, with early adoption permitted. The adoption of this guidance is not expected to have a material impact on our consolidatedfinancial statements.
ASU 2016-02, Leases
In February 2016, the FASB issued ASU 2016-02, which amends the guidance on the classification, measurement and disclosure of leasesfor both lessors and lessees. The ASU requires lessees to recognize a right-of-use asset and a lease liability on the balance sheet and to disclosequalitative and quantitative information about leasing arrangements. The ASU is effective for interim and annual reporting periods beginning afterDecember 15, 2018. We are currently evaluating the impact of the adoption of this guidance on our consolidated financial statements.
ASU 2016-01, Recognition and Measurement of Financial Instruments
In January 2016, the FASB issued ASU 2016-01, which amends the guidance on the classification and measurement of financialinstruments. Although the ASU retains many of the current requirements, it significantly revises an entity’s accounting related to (1) theclassification and measurement of investments in equity securities, and (2) the presentation of certain fair value changes for financial liabilitiesmeasured at fair value. The ASU also amends certain disclosure requirements associated with the fair value of financial instruments. The ASU iseffective for interim and annual reporting periods beginning after December 15, 2017. We are currently evaluating the impact of the adoption of thisguidance on our consolidated financial statements.
2. SIGNIFICANT NEW BUSINESS
2016
Coca-Cola
On August 5, 2016, we entered into a reinsurance transaction with The Coca-Cola Company and its subsidiaries (“Coca-Cola”) pursuant towhich we reinsured certain of Coca-Cola’s retention and deductible risks under its subsidiaries’ U.S. workers’ compensation, auto liability, generalliability, and product liability insurance coverage. We assumed total gross reserves of $109.1 million, received total assets of $102.7 million andrecorded a deferred charge of $6.4 million, included in other assets. We have transferred approximately $109.1 million into trust to support ourobligations under the reinsurance agreements. We provided a limited parental guarantee, subject to an overall maximum of approximately $27.0million.
Allianz
On March 31, 2016, we completed our previously announced transaction with Allianz SE ("Allianz") to reinsure portfolios of Allianz's run-offbusiness. Pursuant to the reinsurance agreement effective January 1, 2016, our subsidiary reinsured 50% of certain portfolios of workers'compensation, construction defect, and asbestos, pollution, and toxic tort business originally held by Fireman's Fund Insurance Company, andassumed net reinsurance reserves of approximately $1.1 billion. Affiliates of Allianz retained approximately $1.1 billion of reinsurance premium asfunds withheld collateral for the obligations of our subsidiary under the reinsurance agreement, and we transferred approximately $110.0 million to areinsurance trust to further support our subsidiary's obligations. Interest on the funds withheld is earned by us based upon an initial fixed interestrate. We have also provided a limited parental guarantee, which is subject to a maximum cap. The combined monetary total of the support offeredby us through the trust and parental guarantee is calculated in accordance with contractually defined terms and is capped at $270.0 million.
In addition to the reinsurance transaction described above, we have entered into a claims consulting agreement with San FranciscoReinsurance Company, an affiliate of Allianz, with respect to the entire $2.2 billion portfolio, including the 50% share retained by affiliates ofAllianz.
9

Table of ContentsENSTAR GROUP LIMITED
NOTES TO THE UNAUDITED CONDENSED CONSOLIDATED FINANCIAL STATEMENTS — (Continued)
3. INVESTMENTS
We hold: (i) trading portfolios of fixed maturity investments, short-term investments and equities, carried at fair value; (ii) a held-to-maturityportfolio of fixed maturity investments carried at amortized cost; (iii) available-for-sale portfolios of short-term and fixed maturity investmentscarried at fair value; and (iv) other investments carried at either fair value or cost.
Trading
The fair values of our fixed maturity investments, short-term investments and equities classified as trading were as follows:
June 30,
2016 December 31,
2015U.S. government and agency $ 771,489 $ 750,957Non-U.S. government 309,794 359,002Corporate 2,612,211 2,631,682Municipal 8,691 22,247Residential mortgage-backed 474,820 391,247Commercial mortgage-backed 281,052 284,575Asset-backed 651,304 638,434
Total fixed maturity and short-term investments 5,109,361 5,078,144Equities — U.S. 109,903 108,793Equities — International 7,390 7,148 $ 5,226,654 $ 5,194,085
Included within residential and commercial mortgage-backed securities as at June 30, 2016 were securities issued by U.S. governmentalagencies with a fair value of $447.0 million (as at December 31, 2015: $359.4 million). Included within corporate securities as at June 30, 2016were senior secured loans of $89.9 million (as at December 31, 2015: $94.4 million).
The contractual maturities of our fixed maturity and short-term investments classified as trading are shown below. Actual maturities maydiffer from contractual maturities because issuers may have the right to call or prepay obligations with or without call or prepayment penalties.
As at June 30, 2016 Amortized
Cost Fair Value
% of TotalFair
ValueOne year or less $ 732,723 $ 723,589 14.2%More than one year through two years 927,837 928,798 18.2%More than two years through five years 1,266,491 1,279,337 25.0%More than five years through ten years 551,552 563,660 11.0%More than ten years 197,290 206,801 4.0%Residential mortgage-backed 473,782 474,820 9.3%Commercial mortgage-backed 280,949 281,052 5.5%Asset-backed 669,975 651,304 12.8%
$ 5,100,599 $ 5,109,361 100.0%
10

Table of ContentsENSTAR GROUP LIMITED
NOTES TO THE UNAUDITED CONDENSED CONSOLIDATED FINANCIAL STATEMENTS — (Continued)
Held-to-maturity
We hold a portfolio of held-to-maturity securities to support our annuity business. The amortized cost and fair values of our fixed maturityinvestments classified as held-to-maturity were as follows:
As at June 30, 2016 Amortized
Cost
GrossUnrealized
Gains
GrossUnrealized
LossesNon-OTTI
FairValue
U.S. government and agency $ 19,886 $ 1,068 $ (62) $ 20,892Non-U.S. government 33,233 1,193 — 34,426Corporate 717,536 36,782 (1,457) 752,861 $ 770,655 $ 39,043 $ (1,519) $ 808,179
As at December 31, 2015 Amortized
Cost
GrossUnrealized
Gains
GrossUnrealized
LossesNon-OTTI Fair Value
U.S. government and agency $ 19,771 $ 8 $ (458) $ 19,321Non-U.S. government 40,503 48 (1,493) 39,058Corporate 730,592 3,398 (23,298) 710,692 $ 790,866 $ 3,454 $ (25,249) $ 769,071
The contractual maturities of our fixed maturity investments classified as held-to-maturity are shown below. Actual maturities may differ fromcontractual maturities because issuers may have the right to call or prepay obligations with or without call or prepayment penalties.
As at June 30, 2016 Amortized
Cost Fair
Value
% of TotalFair
Value
One year or less $ 17,293 $ 17,318 2.1%More than one year through two years 23,600 23,784 3.0%More than two years through five years 66,940 68,813 8.5%More than five years through ten years 107,660 110,845 13.7%More than ten years 555,162 587,419 72.7% $ 770,655 $ 808,179 100.0%
11

Table of ContentsENSTAR GROUP LIMITED
NOTES TO THE UNAUDITED CONDENSED CONSOLIDATED FINANCIAL STATEMENTS — (Continued)
Available-for-sale
The amortized cost and fair values of our short-term and fixed maturity investments classified as available-for-sale were as follows:
As at June 30, 2016 Amortized
Cost
GrossUnrealized
Gains
GrossUnrealized
LossesNon-OTTI
FairValue
U.S. government and agency $ 13,364 $ 164 $ — $ 13,528Non-U.S. government 89,836 2,530 (2,159) 90,207Corporate 184,886 3,820 (1,945) 186,761Municipal 6,500 102 — 6,602Residential mortgage-backed 569 55 — 624Asset-backed 4,578 30 — 4,608 $ 299,733 $ 6,701 $ (4,104) $ 302,330
As at December 31, 2015 Amortized
Cost
GrossUnrealized
Gains
GrossUnrealized
LossesNon-OTTI
FairValue
U.S. government and agency $ 25,102 $ 80 $ (341) $ 24,841Non-U.S. government 89,631 42 (3,889) $ 85,784Corporate 182,773 1,040 (3,429) $ 180,384Municipal 5,959 4 (36) $ 5,927Residential mortgage-backed 665 51 (1) $ 715Asset-backed 4,660 — (10) $ 4,650 $ 308,790 $ 1,217 $ (7,706) $ 302,301
The contractual maturities of our short-term and fixed maturity investments classified as available-for-sale are shown below. Actualmaturities may differ from contractual maturities because issuers may have the right to call or prepay obligations with or without call or prepaymentpenalties.
As at June 30, 2016 Amortized
Cost Fair
Value
% of TotalFair
Value
One year or less $ 51,327 $ 50,119 16.6%More than one year through two years 68,189 67,500 22.3%More than two years through five years 87,040 86,492 28.6%More than five years through ten years 41,192 42,841 14.2%More than ten years 46,838 50,146 16.6%Residential mortgage-backed 569 624 0.2%Asset-backed 4,578 4,608 1.5% $ 299,733 $ 302,330 100.0%
12

Table of ContentsENSTAR GROUP LIMITED
NOTES TO THE UNAUDITED CONDENSED CONSOLIDATED FINANCIAL STATEMENTS — (Continued)
Gross Unrealized Losses
The following tables summarize our fixed maturity and short-term investments in a gross unrealized loss position:
12 Months or Greater Less Than 12 Months Total
As at June 30, 2016 Fair
Value
GrossUnrealized
Losses Fair
Value
GrossUnrealized
Losses Fair
Value
GrossUnrealized
Losses
Fixed maturity and short-term investments, at fair value Non-U.S. government $ — $ — $ 20,177 $ (2,159) $ 20,177 $ (2,159)
Corporate 3,089 (137) 32,647 (1,808) 35,736 (1,945)
Total $ 3,089 $ (137) $ 52,824 $ (3,967) $ 55,913 $ (4,104)
Fixed maturity investments, at amortized cost U.S. government and agency $ 447 $ (62) $ — $ — $ 447 $ (62)
Corporate 18,469 (643) 37,889 (814) 56,358 (1,457)
Total 18,916 (705) 37,889 (814) 56,805 (1,519)
Total fixed maturity and short-term investments $ 22,005 $ (842) $ 90,713 $ (4,781) $ 112,718 $ (5,623)
12 Months or Greater Less Than 12 Months Total
As at December 31, 2015 Fair
Value
GrossUnrealized
Losses Fair
Value
GrossUnrealized
Losses Fair
Value
GrossUnrealized
Losses
Fixed maturity and short-term investments, at fair value U.S. government and agency $ 523 $ (2) $ 21,694 $ (339) $ 22,217 $ (341)
Non-U.S. government 18,995 (2,633) 50,080 (1,256) 69,075 (3,889)
Corporate 54,295 (2,394) 81,047 (1,035) 135,342 (3,429)
Municipal — — 4,609 (36) 4,609 (36)
Residential mortgage-backed 71 (1) — — 71 (1)
Asset-backed 4,649 (10) — — 4,649 (10)
Total $ 78,533 $ (5,040) $ 157,430 $ (2,666) $ 235,963 $ (7,706)
Fixed maturity investments, at amortized cost U.S. government and agency $ 7,221 $ (48) $ 12,024 $ (410) $ 19,245 $ (458)
Non-U.S. government 24,424 (1,255) 8,885 (238) 33,309 (1,493)
Corporate 209,000 (9,038) 330,833 (14,260) 539,833 (23,298)
Total 240,645 (10,341) 351,742 (14,908) 592,387 (25,249)
Total fixed maturity and short-term investments $ 319,178 $ (15,381) $ 509,172 $ (17,574) $ 828,350 $ (32,955)
As at June 30, 2016 and December 31, 2015, the number of securities classified as available-for-sale in an unrealized loss position was 120and 332, respectively. Of these securities, the number of securities that had been in an unrealized loss position for twelve months or longer was13 and 124, respectively.
As at June 30, 2016 and December 31, 2015, the number of securities classified as held-to-maturity in an unrealized loss position was 14and 109, respectively. Of these securities, the number of securities that had been in an unrealized loss position for twelve months or longer was 6and 53, respectively.
13

Table of ContentsENSTAR GROUP LIMITED
NOTES TO THE UNAUDITED CONDENSED CONSOLIDATED FINANCIAL STATEMENTS — (Continued)
Other-Than-Temporary Impairment
For the six months ended June 30, 2016 and 2015, we did not recognize any other-than-temporary impairment losses on either our available-for-sale or held-to-maturity securities. We determined that no credit losses existed as at June 30, 2016. A description of our other-than-temporaryimpairment process is included in Note 2 to the consolidated financial statements contained in our Annual Report on Form 10-K for the year endedDecember 31, 2015. There were no changes to our process during the six months ended June 30, 2016.
Credit Ratings
The following table sets forth the credit ratings of our fixed maturity and short-term investments as of June 30, 2016:
Amortized
Cost Fair Value % of Total
Investments AAA Rated AA Rated A Rated BBB
Rated Non-
InvestmentGrade Not Rated
Fixed maturity and short-term investments, at fairvalue
U.S. government and agency $ 771,905 $ 785,017 12.6% $ 778,456 $ 6,561 $ — $ — $ — $ —
Non-U.S. government 405,688 400,001 6.4% 129,956 185,750 52,705 20,284 11,306 —
Corporate 2,777,899 2,798,972 45.1% 164,171 451,121 1,312,900 721,700 143,010 6,070
Municipal 14,987 15,293 0.2% 5,395 7,710 2,188 — — —
Residential mortgage-backed 474,351 475,444 7.6% 465,622 452 6,029 2,302 1,036 3
Commercial mortgage-backed
280,949
281,052
4.5%
114,235
34,730
73,995
15,538
2,674
39,880
Asset-backed 674,553 655,912 10.6% 232,047 128,948 182,307 43,362 69,051 197
Total 5,400,332 5,411,691 87.0% 1,889,882 815,272 1,630,124 803,186 227,077 46,150
% of total fair value 34.9% 15.1% 30.0% 14.9% 4.2% 0.9%
Fixed maturity investments,at amortized cost
U.S. government and agency 19,886 20,892 0.3% 19,491 1,378 — — — 23
Non-U.S. government 33,233 34,426 0.6% — 9,446 24,980 — — Corporate 717,536 752,861 12.1% 41,800 114,014 488,429 108,522 — 96
Total 770,655 808,179 13.0% 61,291 124,838 513,409 108,522 — 119
% of total fair value 8.3% 15.4% 64.7% 11.5% —% 0.1%
Total fixed maturity andshort-term investments $ 6,170,987 $ 6,219,870 100.0% $ 1,951,173 $ 940,110 $ 2,143,533 $ 911,708 $ 227,077 $ 46,269
% of total fair value 31.4% 15.1% 34.4% 14.7% 3.7% 0.7%
14

Table of ContentsENSTAR GROUP LIMITED
NOTES TO THE UNAUDITED CONDENSED CONSOLIDATED FINANCIAL STATEMENTS — (Continued)
Other Investments, at fair value
The following table summarizes our other investments carried at fair value:
June 30,
2016 December 31,
2015Private equities and private equity funds $ 229,756 $ 254,883Fixed income funds 248,815 291,736Fixed income hedge funds 111,543 109,400Equity funds 163,050 147,390Multi-strategy hedge fund 98,416 99,020Real estate debt fund — 54,829CLO equities 65,156 61,702CLO equity funds 13,513 13,928Call options on equities 4,850 —Other 1,059 1,144 $ 936,158 $ 1,034,032
The valuation of our other investments is described in Note 4 - "Fair Value Measurements." Due to a lag in the valuations of certain fundsreported by the managers, we may record changes in valuation with up to a three-month lag. We regularly review and discuss fund performancewith the fund managers to corroborate the reasonableness of the reported net asset values and to assess whether any events have occurred withinthe lag period that would affect the valuation of the investments. The following is a description of the nature of each of these investmentcategories:
• Private equities and private equity funds invest primarily in the financial services industry. All of our investments in private equities andprivate equity funds are subject to restrictions on redemptions and sales that are determined by the governing documents and limit ourability to liquidate those investments. These restrictions have been in place since the dates of our initial investments.
• Fixed income funds comprise a number of positions in diversified fixed income funds that are managed by third-party managers.Underlying investments vary from high-grade corporate bonds to non-investment grade senior secured loans and bonds, but are generallyinvested in liquid fixed income markets. These funds have regularly published prices. The funds have liquidity terms that vary from dailyup to quarterly.
• Fixed income hedge funds invest in a diversified portfolio of debt securities. The hedge funds have imposed lock-up periods of up to threeyears from the time of initial investment. Once eligible, redemptions are permitted quarterly with 60 days’ notice.
• Equity funds invest in a diversified portfolio of international publicly traded equity securities. The funds are eligible for bi-monthlyredemption.
• Multi-strategy hedge fund comprises an investment in a hedge fund that invests in a variety of asset classes including funds, fixedincome, equity securities and other investments. The fund is eligible for quarterly redemption after September 1, 2016. Once eligible,redemptions will be permitted quarterly with 60 days’ notice.
• Real estate debt fund invests primarily in U.S. commercial real estate loans and securities. A redemption request for this fund can bemade 10 days after the date of any monthly valuation. The fund was fully redeemed as at March 31, 2016.
• CLO equities comprise investments in the equity tranches of term-financed securitizations of diversified pools of corporate bank loans.CLO equities denote direct investments by us in these securities.
• CLO equity funds comprise two funds that invest primarily in the equity tranches of term-financed securitizations of diversified pools ofcorporate bank loans. One of the funds has a fair value of $3.6 million, part of a self-liquidating structure that is expected to pay out overtwo to six years. The other fund has a fair value of $9.9 million and is eligible for redemption in 2018.
15

Table of ContentsENSTAR GROUP LIMITED
NOTES TO THE UNAUDITED CONDENSED CONSOLIDATED FINANCIAL STATEMENTS — (Continued)
• Call options on equities comprise directly held options to purchase the common equity of publicly traded corporations.
• Other primarily comprises a fund that provides loans to educational institutions throughout the United States and its territories.
Investments of $0.8 million in fixed income hedge funds were subject to gates or side-pockets, where redemptions are subject to the sale ofunderlying investments. A gate is the ability to deny or delay a redemption request, whereas a side-pocket is a designated account for which theinvestor loses its redemption rights.
As at June 30, 2016, we had unfunded commitments to private equity funds of $138.4 million.
Other Investments, at cost
Our other investments carried at cost of $129.6 million as of June 30, 2016 consist of life settlement contracts acquired during 2015. Duringthe six months ended June 30, 2016 and 2015, net investment income included $10.0 million and $2.0 million, respectively, related to investmentsin life settlements. There were impairment charges of $2.9 million and nil recognized during the six month periods ended June 30, 2016 and 2015,respectively. The following table presents further information regarding our investments in life settlements as of June 30, 2016 and December 31,2015.
June 30, 2016 December 31, 2015
Number ofContracts
Carrying Value
Face Value(Death Benefits)
Number ofContracts
Carrying Value
Face Value(Death Benefits)
Remaining Life Expectancy of Insureds: 0 – 1 year 2 $ 436 $ 700 2 $ 417 $ 7001 – 2 years 3 2,725 4,500 4 3,032 5,0002 – 3 years 18 25,556 53,900 19 24,072 39,1233 – 4 years 16 14,855 30,328 14 9,695 20,9324 – 5 years 21 9,882 22,759 16 9,025 22,457Thereafter 187 76,182 432,601 221 86,830 491,499
Total 247 $ 129,636 $ 544,788 276 $ 133,071 $ 579,711
Remaining life expectancy for year 0-1 in the table above references policies whose current life expectancy is less than 12 months as of thereporting date. Remaining life expectancy is not an indication of expected maturity. Actual maturity in any category above may vary significantly(either earlier or later) from the remaining life expectancies reported.
At June 30, 2016, our best estimate of the life insurance premiums required to keep the policies in force, payable in the 12 months endingJune 30, 2017 and the four succeeding years ending June 30, 2021 is $17.5 million, $17.4 million, $17.5 million, $17.2 million and $15.7 million,respectively.
16

Table of ContentsENSTAR GROUP LIMITED
NOTES TO THE UNAUDITED CONDENSED CONSOLIDATED FINANCIAL STATEMENTS — (Continued)
Net Realized and Unrealized Gains (Losses)
Components of net realized and unrealized gains (losses) for the three and six months ended June 30, 2016 and 2015 are summarized asfollows:
Three Months Ended
June 30, Six Months Ended
June 30,
2016 2015 2016 2015Net realized gains on sale:
Gross realized gains on fixed maturity securities, available-for-sale $ 114 $ 39 $ 379 $ 153Gross realized (losses) on fixed maturity securities, available-for-sale (1) (1) (244) (9)Net realized investment gains (losses) on fixed maturity securities, trading 1,535 1,886 (377) 3,752Net realized investment gains on equity securities, trading 555 5,169 1,028 15,886
Total net realized gains on sale $ 2,203 $ 7,093 $ 786 $ 19,782Net unrealized gains (losses):
Fixed maturity securities, trading $ 40,472 $ (22,953) $ 82,212 $ (9,065)Equity securities, trading 617 (6,445) 2,223 (13,564)Other investments (5,305) 11,056 (9,270) 34,618
Total net unrealized gains (losses) 35,784 (18,342) 75,165 11,989Net realized and unrealized gains (losses) $ 37,987 $ (11,249) $ 75,951 $ 31,771
The gross realized gains and losses on available-for-sale securities included in the table above resulted from sales of $18.2 million and $33.6million for the three and six months ended June 30, 2016, respectively, and $16.5 million and $59.8 million for the three and six months endedJune 30, 2015, respectively.
Net Investment Income
Major categories of net investment income for the three and six months ended June 30, 2016 and 2015 are summarized as follows:
Three Months Ended
June 30, Six Months Ended
June 30,
2016 2015 2016 2015Fixed maturity investments $ 40,531 $ 28,551 $ 77,109 $ 54,800Short-term investments and cash and cash equivalents 870 1,387 2,049 4,106Equity securities 1,387 1,315 2,509 2,996Other investments 5,693 3,558 11,727 4,440Funds held 7,633 (184) 15,237 (10)Life settlements and other 1,335 2,788 10,161 3,095Gross investment income 57,449 37,415 118,792 69,427
Investment expenses (3,226) (2,760) (4,506) (4,355)Net investment income $ 54,223 $ 34,655 $ 114,286 $ 65,072
17

Table of ContentsENSTAR GROUP LIMITED
NOTES TO THE UNAUDITED CONDENSED CONSOLIDATED FINANCIAL STATEMENTS — (Continued)
Restricted Assets
We are required to maintain investments and cash and cash equivalents on deposit to support our insurance and reinsurance operations. Theinvestments and cash and cash equivalents on deposit are available to settle insurance and reinsurance liabilities. We also utilize trust accountsto collateralize business with our insurance and reinsurance counterparties. These trust accounts generally take the place of letter of creditrequirements. The assets in trusts as collateral are primarily highly rated fixed maturity securities. The carrying value of our restricted assets,including restricted cash of $446.3 million and $511.3 million, as of June 30, 2016 and December 31, 2015, respectively, was as follows:
June 30,
2016 December 31,
2015Collateral in trust for third party agreements $ 2,863,608 $ 3,053,692Assets on deposit with regulatory authorities 955,123 915,346Collateral for secured letter of credit facilities 195,277 212,544Funds at Lloyd's (1) 350,146 382,624 $ 4,364,154 $ 4,564,206
(1) Our underwriting businesses include three Lloyd's syndicates. Lloyd's determines the required capital principally through the annual business plan of each syndicate.This capital is referred to as "Funds at Lloyd's" and will be drawn upon in the event that a syndicate has a loss that cannot be funded from other sources. As at June30, 2016, our combined Funds at Lloyd's were comprised of cash and investments of $312.2 million and letters of credit supported by collateral of $37.9 million.
4. FAIR VALUE MEASUREMENTS
Fair Value Hierarchy
Fair value is defined as the price at which to sell an asset or transfer a liability (i.e. the "exit price") in an orderly transaction between marketparticipants. We use a fair value hierarchy that gives the highest priority to quoted prices in active markets and the lowest priority to unobservabledata. The hierarchy is broken down into three levels as follows:
• Level 1 - Valuations based on unadjusted quoted prices in active markets for identical assets or liabilities that we have the ability toaccess. Valuation adjustments and block discounts are not applied to Level 1 instruments.
• Level 2 - Valuations based on quoted prices in active markets for similar assets or liabilities, quoted prices for identical assets orliabilities in inactive markets, or for which significant inputs are observable (e.g. interest rates, yield curves, prepayment speeds, defaultrates, loss severities, etc.) or can be corroborated by observable market data.
• Level 3 - Valuations based on unobservable inputs where there is little or no market activity. Unadjusted third party pricin g sources ormanagement's assumptions and internal valuation models may be used to determine the fair values.
18

Table of ContentsENSTAR GROUP LIMITED
NOTES TO THE UNAUDITED CONDENSED CONSOLIDATED FINANCIAL STATEMENTS — (Continued)
We have categorized our investments that are recorded at fair value on a recurring basis among levels based on the observability of inputsas follows:
June 30, 2016
Quoted Prices inActive Markets forIdentical Assets
(Level 1)
SignificantOther Observable
Inputs(Level 2)
SignificantUnobservable
Inputs(Level 3)
Total FairValue
U.S. government and agency $ — $ 785,017 $ — $ 785,017Non-U.S. government — 400,001 — 400,001Corporate — 2,771,188 27,784 2,798,972Municipal — 15,293 — 15,293Residential mortgage-backed — 472,663 2,781 475,444Commercial mortgage-backed — 226,217 54,835 281,052Asset-backed — 579,208 76,704 655,912Equities — U.S. 102,734 7,169 — 109,903Equities — International 2,850 4,540 — 7,390Other investments — 310,266 80,470 390,736Total investments $ 105,584 $ 5,571,562 $ 242,574 $ 5,919,720
December 31, 2015
Quoted Prices inActive Markets forIdentical Assets
(Level 1)
SignificantOther Observable
Inputs(Level 2)
SignificantUnobservable
Inputs(Level 3)
Total FairValue
U.S. government and agency $ — $ 775,798 $ — $ 775,798Non-U.S. government — 444,786 — 444,786Corporate — 2,812,066 — 2,812,066Municipal — 28,174 — 28,174Residential mortgage-backed — 391,962 — 391,962Commercial mortgage-backed — 255,169 29,406 284,575Asset-backed — 458,328 184,756 643,084Equities — U.S. 99,467 9,326 — 108,793Equities — International 2,702 4,446 — 7,148Other investments — 321,076 77,016 398,092Total investments $ 102,169 $ 5,501,131 $ 291,178 $ 5,894,478
Certain of our other investments are measured at fair value using NAV per share (or its equivalent) as a practical expedient and have notbeen classified within the fair value hierarchy above. The following table reconciles our other investments in the tables above with the amountspresented on our consolidated balance sheets:
Other investments: June 30, 2016 December 31, 2015
Other investments measured at fair value $ 390,736 $ 398,092Other investments measured at NAV as practical expedient 545,422 635,940Total other investments shown on balance sheets $ 936,158 $ 1,034,032
19

Table of ContentsENSTAR GROUP LIMITED
NOTES TO THE UNAUDITED CONDENSED CONSOLIDATED FINANCIAL STATEMENTS — (Continued)
Valuation Methodologies of Financial Instruments Measured at Fair Value
Fixed Maturity Investments
The fair values for all securities in the fixed maturity investments portfolio are independently provided by the investment accounting serviceproviders, investment managers and investment custodians, each of which utilize internationally recognized independent pricing services. Werecord the unadjusted price provided by the investment accounting service providers, investment managers or investment custodians and validatethis price through a process that includes, but is not limited to: (i) comparison of prices against alternative pricing sources; (ii) quantitative analysis(e.g. comparing the quarterly return for each managed portfolio to its target benchmark); (iii) evaluation of methodologies used by external partiesto estimate fair value, including a review of the inputs used for pricing; and (iv) comparing the price to our knowledge of the current investmentmarket. Our internal price validation procedures and review of fair value methodology documentation provided by independent pricing serviceshave not historically resulted in adjustment in the prices obtained from the pricing service.
The independent pricing services used by the investment accounting service providers, investment managers and investment custodiansobtain actual transaction prices for securities that have quoted prices in active markets. For determining the fair value of securities that are notactively traded, in general, pricing services use "matrix pricing" in which the independent pricing service uses observable market inputs including,but not limited to, reported trades, benchmark yields, broker-dealer quotes, interest rates, prepayment speeds, default rates and such other inputsas are available from market sources to determine a reasonable fair value. In addition, pricing services use valuation models, using observabledata, such as an Option Adjusted Spread model, to develop prepayment and interest rate scenarios. The Option Adjusted Spread model iscommonly used to estimate fair value for securities such as mortgage-backed and asset-backed securities.
The following describes the techniques generally used to determine the fair value of our fixed maturity investments by asset class.
• U.S. government and agency securities consist of securities issued by the U.S. Treasury and mortgage pass-through agencies such asthe Federal National Mortgage Association, the Federal Home Loan Mortgage Corporation and other agencies. Non-U.S. governmentsecurities consist of bonds issued by non-U.S. governments and agencies along with supranational organizations. The significant inputsused to determine the fair value of these securities include the spread above the risk-free yield curve, reported trades and broker-dealerquotes. These are considered to be observable market inputs and, therefore, the fair values of these securities are classified as Level 2.
• Corporate securities consist primarily of investment-grade debt of a wide variety of corporate issuers and industries. The fair values ofthese securities are determined using the spread above the risk-free yield curve, reported trades, broker-dealer quotes, benchmarkyields, and industry and market indicators. These are considered observable market inputs and, therefore, the fair values of thesesecurities are classified as Level 2. Where pricing is unavailable from pricing services, such as in periods of low trading activity or whentransactions are not orderly, we obtain non-binding quotes from broker-dealers. Where significant inputs are unable to be corroboratedwith market observable information, we classify the securities as Level 3.
• Municipal securities consist primarily of bonds issued by U.S.-domiciled state and municipal entities. The fair values of these securitiesare determined using the spread above the risk-free yield curve, reported trades, broker-dealer quotes and benchmark yields. These areconsidered observable market inputs and, therefore, the fair values of these securities are classified as Level 2.
• Asset-backed securities consist primarily of investment-grade bonds backed by pools of loans with a variety of underlying collateral.Residential and commercial mortgage-backed securities include both agency and non-agency originated securities. The significantinputs used to determine the fair value of these securities include the spread above the risk-free yield curve, reported trades, benchmarkyields, broker-dealer quotes, prepayment speeds and default rates. These are considered observable market inputs and, therefore, thefair values of these securities are classified as Level 2. Where pricing is unavailable from pricing services, we obtain non-binding quotesfrom broker-dealers. This is generally the case when there is a low volume of trading activity and current transactions are not orderly.Where significant inputs are unable to be corroborated with market observable information, we classify the securities as Level 3.
20

Table of ContentsENSTAR GROUP LIMITED
NOTES TO THE UNAUDITED CONDENSED CONSOLIDATED FINANCIAL STATEMENTS — (Continued)
Equities
Our investments in equities are predominantly traded on the major exchanges and are primarily managed by our external advisors. We usean internationally recognized pricing service to estimate the fair value of our equities. Our equities are widely diversified and there is no significantconcentration in any specific industry.
We have categorized all of our investments in equities other than preferred stock as Level 1 investments because the fair values of theseinvestments are based on unadjusted quoted prices in active markets for identical assets or liabilities. The fair value estimates of our investmentsin preferred stock are based on observable market data and, as a result, have been categorized as Level 2.
Other investments, at fair value
We have ongoing due diligence processes with respect to the other investments carried at fair value in which we invest and their managers.These processes are designed to assist us in assessing the quality of information provided by, or on behalf of, each fund and in determiningwhether such information continues to be reliable or whether further review is warranted. Certain funds do not provide full transparency of theirunderlying holdings; however, we obtain the audited financial statements for funds annually, and regularly review and discuss the fund performancewith the fund managers to corroborate the reasonableness of the reported net asset values.
The use of NAV as an estimate of the fair value for investments in certain entities that calculate NAV is a permitted practical expedient. Dueto the time lag in the NAV reported by the fund managers we adjust the valuation for capital calls and distributions. Other investments measured atfair value using NAV as a practical expedient have not been classified in the fair value hierarchy. Other investments for which we do not use NAVas a practical expedient have been valued using prices from independent pricing services, investment managers and broker-dealers.
The following describes the techniques generally used to determine the fair value of our other investments.
• For our investments in private equities and private equity funds, we measure fair value by obtaining the most recently available NAV fromthe external fund manager or third-party administrator. The fair values of these investments are measured using the NAV as a practicalexpedient and therefore have not been categorized within the fair value hierarchy.
• Our investments in fixed income funds and equity funds are valued based on a combination of prices from independent pricing services,external fund managers or third-party administrators. For the publicly available prices we have classified the investments as Level 2. Forthe non-publicly available prices we are using NAV as a practical expedient and therefore these have not been categorized within the fairvalue hierarchy.
• For our investments in fixed income and multi-strategy hedge funds, we measure fair value by obtaining the most recently available NAVas advised by the external fund manager or third-party administrator. The fair values of these investments are measured using the NAV asa practical expedient and therefore have not been categorized within the fair value hierarchy.
• Our investment in the real estate debt fund is valued based on the most recently available NAV from the external fund manager. The fairvalue of this investment is measured using the NAV practical expedient and therefore has not been categorized within the fair valuehierarchy. As at March 31, 2016 this fund was fully redeemed.
• We measure the fair value of our direct investment in CLO equities based on valuations provided by our external CLO equity manager. Ifthe investment does not involve an external CLO equity manager, the fair value of the investment is valued based on valuations providedby the broker or lead underwriter of the investment (the "broker"). Our CLO equity investments have been classified as Level 3 due to theuse of unobservable inputs in the valuation and the limited number of relevant trades in secondary markets.
In providing valuations, the CLO equity manager and brokers use observable and unobservable inputs. Of the significant unobservablemarket inputs used, the default and loss severity rates involve the most judgment and create the most sensitivity. A significant increase(or decrease) in either of these significant inputs in isolation would result in lower (or higher) fair value estimates for direct investments inCLO equities and, in general, a change in default rate assumptions will be accompanied by a directionally similar change in loss severityrate assumptions. Collateral spreads and estimated maturity dates are less judgmental inputs because they are based on the historicalaverage of actual spreads and the weighted average life of the current underlying
21

Table of ContentsENSTAR GROUP LIMITED
NOTES TO THE UNAUDITED CONDENSED CONSOLIDATED FINANCIAL STATEMENTS — (Continued)
portfolios, respectively. A significant increase (or decrease) in either of these significant inputs in isolation would result in higher (or lower)fair value estimates for direct investments in CLO equities. In general, these inputs have no significant interrelationship with each other orwith default and loss severity rates.
On a quarterly basis, we receive the valuation from the external CLO manager and brokers and then review the underlying cash flows andkey assumptions used by the manager/broker. We review and update the significant unobservable inputs based on information obtainedfrom secondary markets. These inputs are our responsibility and we assess the reasonableness of the inputs (and if necessary, updatethe inputs) through communicating with industry participants, monitoring of the transactions in which we participate (for example, toevaluate default and loss severity rate trends), and reviewing market conditions, historical results, and emerging trends that may impactfuture cash flows.
If valuations from the external CLO equity manager or brokers are not available, we use an income approach based on certain observableand unobservable inputs to value these investments. An income approach is also used to corroborate the reasonableness of thevaluations provided by the external manager and brokers. Where an income approach is followed, the valuation is based on available tradeinformation, such as expected cash flows and market assumptions on default and loss severity rates. Other inputs used in the valuationprocess include asset spreads, loan prepayment speeds, collateral spreads and estimated maturity dates.
• For our investments in the CLO equity funds, we measure fair value by obtaining the most recently available NAV as advised by theexternal fund manager or third party administrator. The fair values of these investments are measured using the NAV as a practicalexpedient and therefore have not been categorized within the fair value hierarchy.
• For our investments in call options on publicly traded equities, we measure fair value by obtaining the latest option price as of our reportingdate. These are classified as Level 2.
Changes in Leveling of Financial Instruments
Transfers into or out of levels are recorded at their fair values as of the end of the reporting period, consistent with the date of determinationof fair value. During the six months ended June 30, 2016, we transferred $28.2 million of corporate, $24.1 million of asset-backed, $40.1 million ofcommercial mortgaged-backed and $2.8 million of residential mortgaged-backed securities from Level 2 to Level 3. The transfers from Level 2 toLevel 3 were securities valued using single prices for which we were unable to obtain sufficient information to determine whether the inputs usedwere observable. Where we utilize single unadjusted broker-dealer quotes, they are generally provided by market makers or broker-dealers who arerecognized as market participants in the markets in which they are providing the quotes. During the six months ended June 30, 2016, wetransferred $12.1 million of commercial mortgaged-backed and $126.2 million of asset-backed securities from Level 3 to Level 2. The transfersfrom Level 3 to Level 2 were based upon us obtaining market observable information regarding the valuations of the specific assets. There were notransfers between Levels 1 and 2.
The following table presents a reconciliation of the beginning and ending balances for all investments measured at fair value on a recurringbasis using Level 3 inputs during the three months ended June 30, 2016 and 2015:
Three Months Ended June 30, 2016 Three Months Ended June 30, 2015
Fixed
MaturityInvestments
OtherInvestments Equity Securities Total
FixedMaturity
Investments Other
Investments Equity Securities Total
Beginning fair value $ 112,577 $ 74,289 $ — $ 186,866 $ — $ 427,362 $ — $ 427,362Purchases 32,616 664 — 33,280 — 54,407 — 54,407Sales (12,618) — — (12,618) — (28,533) — (28,533)Total realized and unrealizedgains 1,576 5,517 — 7,093 — 10,669 — 10,669Net transfers into (out of)Level 3 27,953 — — 27,953 — — — —Ending fair value $ 162,104 $ 80,470 $ — $ 242,574 $ — $ 463,905 $ — $ 463,905
22

Table of ContentsENSTAR GROUP LIMITED
NOTES TO THE UNAUDITED CONDENSED CONSOLIDATED FINANCIAL STATEMENTS — (Continued)
The following table presents a reconciliation of the beginning and ending balances for all investments measured at fair value on a recurringbasis using Level 3 inputs during the six months ended June 30, 2016 and 2015:
Six Months Ended June 30, 2016 Six Months Ended June 30, 2015
Fixed
MaturityInvestments
OtherInvestments
EquitySecurities Total
FixedMaturity
Investments Other
Investments Equity
Securities Total
Beginning fair value $ 214,162 $ 77,016 $ — $ 291,178 $ 600 $ 349,790 $ 4,850 $ 355,240Purchases 32,616 6,885 — 39,501 — 136,385 — 136,385Sales (36,720) (4,658) — (41,378) (600) (42,415) (5,000) (48,015)Total realized andunrealized gains(losses) (4,851) 1,227 — (3,624) — 20,145 150 20,295Net transfers into(out of) Level 3 (43,103) — — (43,103) — — — —Ending fair value $ 162,104 $ 80,470 $ — $ 242,574 $ — $ 463,905 $ — $ 463,905
Net realized and unrealized gains (losses) related to Level 3 assets in the table above are included in net realized and unrealized gains(losses) in our unaudited condensed consolidated statements of earnings.
23

Table of ContentsENSTAR GROUP LIMITED
NOTES TO THE UNAUDITED CONDENSED CONSOLIDATED FINANCIAL STATEMENTS — (Continued)
Disclosure of Fair Values for Financial Instruments Carried at Cost
The following tables present our fair value hierarchy for those assets carried at cost or amortized cost in the unaudited condensedconsolidated balance sheet but for which disclosure of the fair value is required:
June 30, 2016
Quoted Prices inActive Markets for
Identical Assets(Level 1)
SignificantOther Observable
Inputs(Level 2)
SignificantUnobservable
Inputs(Level 3) Fair Value Carrying Value
Fixed maturity investments, held-to-maturity:
U.S. government and agency $ — $ 20,892 $ — $ 20,892 $ 19,886Non-U.S. government — 34,426 — 34,426 33,233Corporate — 752,861 — 752,861 717,536
Sub-total — 808,179 — 808,179 770,655Other investments:
Life settlements — — 126,442 126,442 129,636Total $ — $ 808,179 $ 126,442 $ 934,621 $ 900,291
December 31, 2015
Quoted Prices inActive Markets for
Identical Assets(Level 1)
SignificantOther Observable
Inputs(Level 2)
SignificantUnobservable
Inputs(Level 3) Fair Value Carrying Value
Fixed maturity investments, held-to-maturity:
U.S. government and agency $ — $ 19,321 $ — $ 19,321 $ 19,771Non-U.S. government — 39,058 — 39,058 40,503Corporate — 710,692 — 710,692 730,592
Sub-total — 769,071 — 769,071 790,866Other investments:
Life settlements — — 130,268 130,268 133,071Total $ — $ 769,071 $ 130,268 $ 899,339 $ 923,937
The fair value of investments in life settlement contracts, in the table above, is determined using a discounted cash flow methodology thatutilizes unobservable inputs. Due to the individual nature of each investment in life settlement contracts and the illiquidity of the existing market,significant inputs to the fair value include our estimates of premiums necessary to keep the policies in-force, and our assumptions for mortalityand discount rates. Our mortality assumptions are based on a combination of medical underwriting information obtained from a third-partyunderwriter for each referenced life and internal proprietary mortality studies of older aged U.S. insured lives. These assumptions are used todevelop an estimate of future net cash flows that, after discounting, are intended to be reflective of the asset's value in the life settlement market.
Disclosure of fair value of amounts relating to insurance contracts is not required. Our remaining assets and liabilities were generally carriedat cost or amortized cost, which due to their short-term nature approximates fair value as of June 30, 2016 and December 31, 2015.
24

Table of ContentsENSTAR GROUP LIMITED
NOTES TO THE UNAUDITED CONDENSED CONSOLIDATED FINANCIAL STATEMENTS — (Continued)
5. DERIVATIVE INSTRUMENTS
From time to time, we may utilize derivative instruments as part of our overall foreign currency risk management strategy or to obtainexposure to a particular financial market, as well as for yield enhancement.
The following table sets forth the estimated fair value of derivative instruments recorded within other investments on the unauditedcondensed consolidated balance sheet as at June 30, 2016 and the unrealized losses on derivative instruments recorded in net earnings for thethree and six months ended June 30, 2016:
Fair Value Unrealized losses in net earnings
Purchase Date June 30, 2016 December 31, 2015 Three Months Ended
June 30, 2016 Six Months Ended
June 30, 2016Call options on equities March 1, 2016 $ 4,850 $ — $ (1,210) $ (650)
The derivatives in the table above are not designated as hedging instruments. We had no derivative instruments as at June 30, 2015 andDecember 31, 2015 or during the three and six months ended June 30, 2015.
Subsequent to June 30, 2016, we entered into forward exchange contracts for notional amounts of AUD $63.0 million and CAD $50.0 million.These contracts are designated as hedges of the net investments in our Australian and Canadian operations.
6. REINSURANCE BALANCES RECOVERABLE
The following tables provide the total reinsurance balances recoverable as at June 30, 2016 and December 31, 2015:
June 30, 2016
Non-lifeRun-off Atrium StarStone
Life andAnnuities Total
Recoverable from reinsurers on unpaid: Outstanding losses $ 502,667 $ 7,142 $ 171,289 $ 20,940 $ 702,038IBNR 441,240 17,798 121,997 298 581,333
Fair value adjustments (16,182) 1,916 (4,085) — (18,351)Total reinsurance reserves recoverable 927,725 26,856 289,201 21,238 1,265,020
Paid losses recoverable 62,454 762 15,885 994 80,095
$ 990,179 $ 27,618 $ 305,086 $ 22,232 $ 1,345,115
December 31, 2015
Non-lifeRun-off Atrium StarStone
Life andAnnuities Total
Recoverable from reinsurers on unpaid: Outstanding losses $ 587,164 $ 6,772 $ 182,076 $ 22,786 $ 798,798IBNR 465,211 16,581 123,732 306 605,830
Fair value adjustments (17,628) 2,499 (6,025) — (21,154)Total reinsurance reserves recoverable 1,034,747 25,852 299,783 23,092 1,383,474
Paid losses recoverable 72,213 430 16,568 1,319 90,530
$ 1,106,960 $ 26,282 $ 316,351 $ 24,411 $ 1,474,004
Our insurance and reinsurance run-off subsidiaries, prior to acquisition, used retrocessional agreements to reduce their exposure to the riskof insurance and reinsurance assumed. On an annual basis, both Atrium and StarStone purchase a tailored outwards reinsurance programdesigned to manage their risk profiles. The majority of Atrium’s and StarStone's third-party reinsurance cover is with highly rated reinsurers or iscollateralized by letters of credit.
The fair value adjustments, determined on acquisition of insurance and reinsurance subsidiaries, are based on the estimated timing of lossand LAE recoveries and an assumed interest rate equivalent to a risk free rate for securities with similar duration to the acquired reinsurancerecoverables plus a spread for credit risk, and are amortized over the estimated recovery period, as adjusted for accelerations in timing ofpayments as a result of commutation settlements.
25
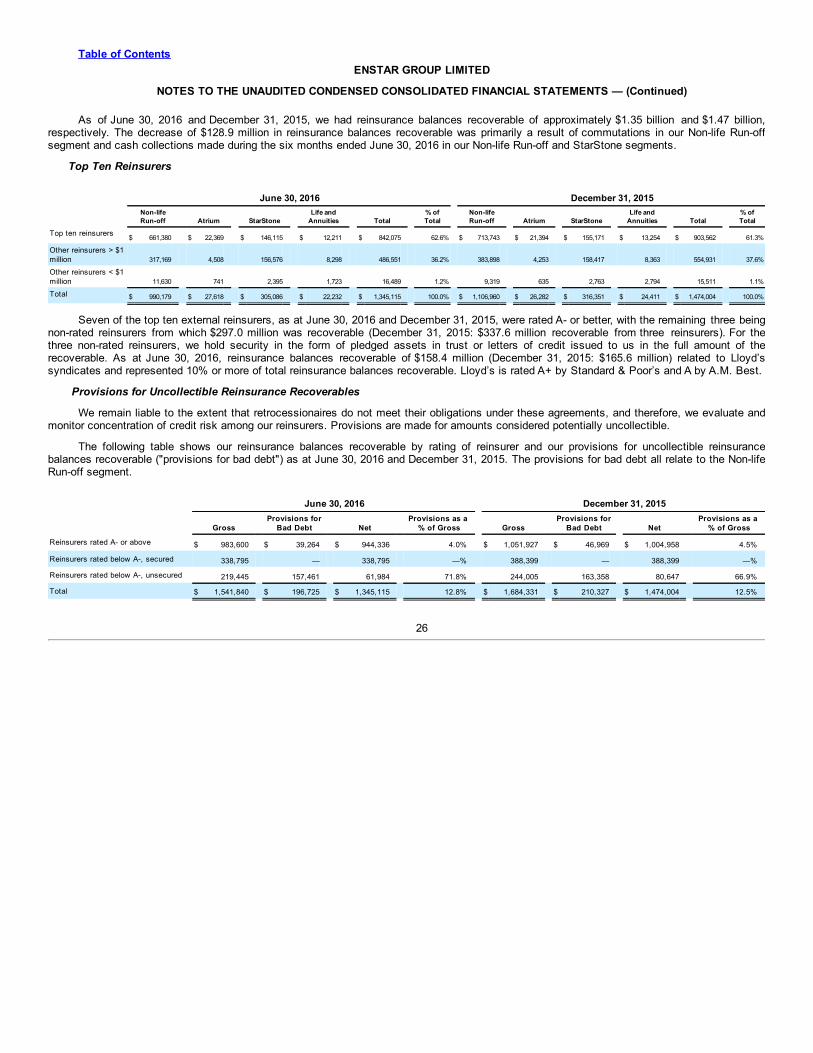
Table of ContentsENSTAR GROUP LIMITED
NOTES TO THE UNAUDITED CONDENSED CONSOLIDATED FINANCIAL STATEMENTS — (Continued)
As of June 30, 2016 and December 31, 2015, we had reinsurance balances recoverable of approximately $1.35 billion and $1.47 billion,respectively. The decrease of $128.9 million in reinsurance balances recoverable was primarily a result of commutations in our Non-life Run-offsegment and cash collections made during the six months ended June 30, 2016 in our Non-life Run-off and StarStone segments.
Top Ten Reinsurers
June 30, 2016 December 31, 2015
Non-lifeRun-off Atrium StarStone
Life andAnnuities Total
% ofTotal
Non-lifeRun-off Atrium StarStone
Life andAnnuities Total
% ofTotal
Top ten reinsurers $ 661,380 $ 22,369 $ 146,115 $ 12,211 $ 842,075 62.6% $ 713,743 $ 21,394 $ 155,171 $ 13,254 $ 903,562 61.3%
Other reinsurers > $1million 317,169 4,508 156,576 8,298 486,551 36.2% 383,898 4,253 158,417 8,363 554,931 37.6%
Other reinsurers < $1million 11,630 741 2,395 1,723 16,489 1.2% 9,319 635 2,763 2,794 15,511 1.1%
Total $ 990,179 $ 27,618 $ 305,086 $ 22,232 $ 1,345,115 100.0% $ 1,106,960 $ 26,282 $ 316,351 $ 24,411 $ 1,474,004 100.0%
Seven of the top ten external reinsurers, as at June 30, 2016 and December 31, 2015, were rated A- or better, with the remaining three beingnon-rated reinsurers from which $297.0 million was recoverable (December 31, 2015: $337.6 million recoverable from three reinsurers). For thethree non-rated reinsurers, we hold security in the form of pledged assets in trust or letters of credit issued to us in the full amount of therecoverable. As at June 30, 2016, reinsurance balances recoverable of $158.4 million (December 31, 2015: $165.6 million) related to Lloyd’ssyndicates and represented 10% or more of total reinsurance balances recoverable. Lloyd’s is rated A+ by Standard & Poor’s and A by A.M. Best.
Provisions for Uncollectible Reinsurance Recoverables
We remain liable to the extent that retrocessionaires do not meet their obligations under these agreements, and therefore, we evaluate andmonitor concentration of credit risk among our reinsurers. Provisions are made for amounts considered potentially uncollectible.
The following table shows our reinsurance balances recoverable by rating of reinsurer and our provisions for uncollectible reinsurancebalances recoverable ("provisions for bad debt") as at June 30, 2016 and December 31, 2015. The provisions for bad debt all relate to the Non-lifeRun-off segment.
June 30, 2016 December 31, 2015
Gross Provisions for
Bad Debt Net Provisions as a
% of Gross Gross Provisions for
Bad Debt Net Provisions as a
% of Gross
Reinsurers rated A- or above $ 983,600 $ 39,264 $ 944,336 4.0% $ 1,051,927 $ 46,969 $ 1,004,958 4.5%
Reinsurers rated below A-, secured 338,795 — 338,795 —% 388,399 — 388,399 —%
Reinsurers rated below A-, unsecured 219,445 157,461 61,984 71.8% 244,005 163,358 80,647 66.9%
Total $ 1,541,840 $ 196,725 $ 1,345,115 12.8% $ 1,684,331 $ 210,327 $ 1,474,004 12.5%
26

Table of ContentsENSTAR GROUP LIMITED
NOTES TO THE UNAUDITED CONDENSED CONSOLIDATED FINANCIAL STATEMENTS — (Continued)
7. LOSSES AND LOSS ADJUSTMENT EXPENSES
The liability for losses and loss adjustment expenses ("LAE") includes an amount determined from reported claims and an amount based onhistorical loss experience and industry statistics for incurred but not reported ("IBNR") using a variety of actuarial methods. Our loss reservescover multiple lines of business, which include workers' compensation, general casualty, asbestos and environmental, marine, aviation and transit,construction defects and other non-life lines of business. Refer to Note 9 to the consolidated financial statements contained in our Annual Reporton Form 10-K for the year ended December 31, 2015 for more information on establishing the liability for losses and LAE.
The following table summarizes the liability for losses and LAE by segment as at June 30, 2016 and December 31, 2015:
June 30, 2016 December 31, 2015
Non-lifeRun-off Atrium StarStone Total
Non-lifeRun-off Atrium StarStone Total
Outstanding losses $ 2,991,786 $ 69,268 $ 476,941 $ 3,537,995 $ 2,757,774 $ 68,913 $ 457,175 $ 3,283,862IBNR 2,385,358 129,422 518,558 3,033,338 1,991,009 115,613 477,990 2,584,612Fair value adjustments (151,017) 14,534 (1,005) (137,488) (163,329) 16,491 (1,487) (148,325)Total $ 5,226,127 $ 213,224 $ 994,494 $ 6,433,845 $ 4,585,454 $ 201,017 $ 933,678 $ 5,720,149
The overall increase in the liability for losses and LAE between December 31, 2015 and June 30, 2016 was primarily attributable to theassumed reinsurance agreement with Allianz in our Non-life Run-off segment as described in Note 2 - "Significant New Business."
The table below provides a reconciliation of the beginning and ending liability for losses and LAE for the three and six months endedJune 30, 2016 and 2015:
Three Months Ended
June 30, Six Months Ended
June 30,
2016 2015 2016 2015Balance as at beginning of period $ 6,641,507 $ 5,724,623 $ 5,720,149 $ 4,509,421
Less: reinsurance reserves recoverable 1,302,738 1,518,102 1,360,382 1,154,196Less: deferred charges on retroactivereinsurance 254,300 — 255,911 —
Net balance as at beginning of period 5,084,469 4,206,521 4,103,856 3,355,225
Net incurred losses and LAE: Current period 126,634 121,335 241,936 234,349
Prior periods (30,172) (55,435) (62,256) (98,313)
Total net incurred losses and LAE 96,462 65,900 179,680 136,036
Net paid losses: Current period (17,022) (21,490) (22,356) (32,654)
Prior periods (203,010) (194,485) (389,413) (312,641)
Total net paid losses (220,032) (215,975) (411,769) (345,295)
Effect of exchange rate movement (28,127) 24,723 (23,246) (29,423)
Acquired on purchase of subsidiaries 10,019 — 10,019 774,758
Assumed business — 305,763 1,084,251 495,631
Net balance as at June 30 4,942,791 4,386,932 4,942,791 4,386,932
Plus: reinsurance reserves recoverable 1,243,782 1,491,113 1,243,782 1,491,113Plus: deferred charge on retroactivereinsurance 247,272 265,426 247,272 265,426
Balance as at June 30 $ 6,433,845 $ 6,143,471 $ 6,433,845 $ 6,143,471
27

Table of ContentsENSTAR GROUP LIMITED
NOTES TO THE UNAUDITED CONDENSED CONSOLIDATED FINANCIAL STATEMENTS — (Continued)
The tables below provide the net incurred losses and LAE in the Non-life Run-off, Atrium and StarStone segments for the three and sixmonths ended June 30, 2016 and 2015:
Three Months Ended June 30, 2016 Three Months Ended June 30, 2015
Non-life Run-
off Atrium StarStone Total Non-lifeRun-off Atrium StarStone Total
Net losses paid $ 143,056 $ 12,523 $ 64,453 $ 220,032 $ 164,440 $ 12,121 $ 39,414 $ 215,975
Net change in case and LAE reserves (74,560) 2,035 21,736 (50,789) (104,330) 136 46,729 (57,465)
Net change in IBNR reserves (102,836) 3,538 17,285 (82,013) (75,957) 5,186 (5,690) (76,461)
Increase (reduction) in estimates of net ultimatelosses (34,340) 18,096 103,474 87,230 (15,847) 17,443 80,453 82,049
Reduction in provisions for bad debt (5,184) — — (5,184) (625) — — (625)
Increase (reduction) in provisions for unallocatedLAE (6,571) 50 758 (5,763) (7,711) (8) 1,055 (6,664)
Amortization of fair value adjustments 21,405 (1,013) (213) 20,179 (4,687) (3,678) (495) (8,860)
Net incurred losses and LAE $ (24,690) $ 17,133 $ 104,019 $ 96,462 $ (28,870) $ 13,757 $ 81,013 $ 65,900
Six Months Ended June 30, 2016 Six Months Ended June 30, 2015
Non-life Run-
off Atrium StarStone Total Non-lifeRun-off Atrium StarStone Total
Net losses paid $ 275,369 $ 20,271 $ 116,129 $ 411,769 $ 229,700 $ 24,032 $ 91,563 $ 345,295
Net change in case and LAE reserves (183,345) 263 34,391 (148,691) (111,330) (883) 44,943 (67,270)
Net change in IBNR reserves (139,899) 13,429 44,372 (82,098) (113,235) 1,376 20,049 (91,810)
Increase (reduction) in estimates of net ultimatelosses (47,875) 33,963 194,892 180,980 5,135 24,525 156,555 186,215
Reduction in provisions for bad debt (6,630) — — (6,630) (20,439) — — (20,439)
Increase (reduction) in provisions for unallocatedLAE (14,361) 134 1,768 (12,459) (21,686) (70) 1,711 (20,045)
Amortization of fair value adjustments 20,622 (1,375) (1,458) 17,789 (4,980) (3,678) (1,037) (9,695)
Net incurred losses and LAE $ (48,244) $ 32,722 $ 195,202 $ 179,680 $ (41,970) $ 20,777 $ 157,229 $ 136,036
28

Table of ContentsENSTAR GROUP LIMITED
NOTES TO THE UNAUDITED CONDENSED CONSOLIDATED FINANCIAL STATEMENTS — (Continued)
Non-Life Run-off Segment
The table below provides a reconciliation of the beginning and ending reserves for losses and LAE for the three and six months endedJune 30, 2016 and 2015 for the Non-life Run-off segment:
Three Months Ended June 30, Six Months Ended June 30,
2016 2015 2016 2015
Balance as at beginning of period $ 5,459,216 $ 4,693,262 $ 4,585,454 $ 3,435,010
Less: reinsurance reserves recoverable 977,096 1,210,933 1,034,747 800,709Less: deferred charges on retroactiveinsurance 254,300 — 255,911 —
Net balance as at beginning of period 4,227,820 3,482,329 3,294,796 2,634,301
Net incurred losses and LAE: Current period 518 22,547 6,587 43,273
Prior periods (25,208) (51,417) (54,831) (85,243)
Total net incurred losses and LAE (24,690) (28,870) (48,244) (41,970)
Net paid losses: Current period (2,058) (9,434) (4,048) (14,005)
Prior periods (140,998) (155,006) (271,321) (215,695)
Total net paid losses (143,056) (164,440) (275,369) (229,700)
Effect of exchange rate movement (18,963) 25,876 (14,323) (12,362)
Acquired on purchase of subsidiaries 10,019 — 10,019 774,758
Assumed business 0 305,763 1,084,251 495,631
Net balance as at June 30 4,051,130 3,620,658 4,051,130 3,620,658
Plus: reinsurance reserves recoverable 927,725 1,178,053 927,725 1,178,053Plus: deferred charge on retroactivereinsurance 247,272 265,426 247,272 265,426
Balance as at June 30 $ 5,226,127 $ 5,064,137 $ 5,226,127 $ 5,064,137
Net incurred losses and LAE in the Non-life Run-off segment for the three months ended June 30, 2016 and 2015 were as follows:
Three Months Ended June 30,
2016 2015
Prior
Period CurrentPeriod Total
PriorPeriod
CurrentPeriod Total
Net losses paid $ 140,998 $ 2,058 $ 143,056 $ 155,006 $ 9,434 $ 164,440Net change in case and LAE reserves (74,832) 272 (74,560) (108,819) 4,489 (104,330)Net change in IBNR reserves (101,240) (1,596) (102,836) (84,581) 8,624 (75,957)Increase (reduction) in estimates of net ultimate losses (35,074) 734 (34,340) (38,394) 22,547 (15,847)Increase (reduction) in provisions for bad debt (5,184) — (5,184) (625) — (625)Increase (reduction) in provisions for unallocated LAE (6,355) (216) (6,571) (7,711) — (7,711)Amortization of fair value adjustments 21,405 — 21,405 (4,687) — (4,687)Net incurred losses and LAE $ (25,208) $ 518 $ (24,690) $ (51,417) $ 22,547 $ (28,870)
Net change in case and LAE reserves comprises the movement during the year in specific case reserve liabilities as a result of claimssettlements or changes advised to us by our policyholders and attorneys, less changes in case reserves recoverable advised by us to ourreinsurers as a result of the settlement or movement of assumed claims. Net change in IBNR represents the gross change in our actuarialestimates of IBNR, less amounts recoverable.
Three Months Ended June 30, 2016
The reduction in net incurred losses and LAE for the three months ended June 30, 2016 of $24.7 million included net incurred losses andLAE of $0.5 million related to current period net earned premium of $0.5 million, primarily for
29

Table of ContentsENSTAR GROUP LIMITED
NOTES TO THE UNAUDITED CONDENSED CONSOLIDATED FINANCIAL STATEMENTS — (Continued)
the run-off business acquired with Sussex. Excluding current period net incurred losses and LAE of $0.5 million, net incurred losses and LAEliabilities relating to prior periods were reduced by $25.2 million, which was attributable to a reduction in estimates of net ultimate losses of $35.1million, a reduction in provisions for bad debt of $5.2 million and a reduction in provisions for unallocated LAE of $6.4 million, relating to 2016 run-off activity, partially offset by amortization of fair value adjustments over the estimated payout period relating to companies acquired amounting to$21.4 million.
The reduction in provisions for bad debt of $5.2 million was a result of the collection of certain reinsurance recoverables against whichprovisions for bad debt had been provided in earlier periods.
Three Months Ended June 30, 2015
The reduction in net incurred losses and LAE for the three months ended June 30, 2015 of $28.9 million included net incurred losses andLAE of $22.5 million related to current period net earned premium of $17.2 million, primarily for the run-off business acquired with Sussex.Excluding current period net incurred losses and LAE of $22.5 million, net incurred losses and LAE liabilities relating to prior periods were reducedby $51.4 million, which was attributable to a reduction in estimates of net ultimate losses of $38.4 million, a reduction in provisions for bad debt of$0.6 million, a reduction in provisions for unallocated LAE of $7.7 million, relating to 2015 run-off activity, and amortization of fair valueadjustments over the estimated payout period relating to companies acquired amounting to $4.7 million.
Net incurred losses and LAE in the Non-life Run-off segment for the six months ended June 30, 2016 and 2015 were as follows:
Six Months Ended June 30,
2016 2015
Prior
Period CurrentPeriod Total
PriorPeriod
CurrentPeriod Total
Net losses paid $ 271,321 $ 4,048 $ 275,369 $ 215,695 $ 14,005 $ 229,700Net change in case and LAE reserves (183,801) 456 (183,345) (118,813) 7,483 (111,330)Net change in IBNR reserves (141,753) 1,854 (139,899) (135,020) 21,785 (113,235)Increase (reduction) in estimates of net ultimate losses (54,233) 6,358 (47,875) (38,138) 43,273 5,135Increase (reduction) in provisions for bad debt (6,630) — (6,630) (20,439) — (20,439)Increase (reduction) in provisions for unallocated LAE (14,590) 229 (14,361) (21,686) — (21,686)Amortization of fair value adjustments 20,622 — 20,622 (4,980) — (4,980)Net incurred losses and LAE $ (54,831) $ 6,587 $ (48,244) $ (85,243) $ 43,273 $ (41,970)
Six Months Ended June 30, 2016
The reduction in net incurred losses and LAE for the six months ended June 30, 2016 of $48.2 million included net incurred losses and LAEof $6.6 million related to current period net earned premium of $5.0 million, primarily for the run-off business acquired with Sussex. Excludingcurrent period net incurred losses and LAE of $6.6 million, net incurred losses and LAE liabilities relating to prior periods were reduced by $54.8million, which was attributable to a reduction in estimates of net ultimate losses of $54.2 million, a reduction in provisions for bad debt of $6.6million and a reduction in provisions for unallocated LAE of $14.6 million, relating to 2016 run-off activity, partially offset by amortization of fairvalue adjustments over the estimated payout period relating to companies acquired amounting to $20.6 million.
The reduction in provisions for bad debt of $6.6 million was a result of the collection of certain reinsurance recoverables against whichprovisions for bad debt had been provided in earlier periods.
Six Months Ended June 30, 2015
The reduction in net incurred losses and LAE for the six months ended June 30, 2015 of $42.0 million included net incurred losses and LAEof $43.3 million related to current period net earned premium of $35.8 million, primarily for the run-off business acquired with Sussex. Excludingcurrent period net incurred losses and LAE of $43.3 million, net incurred losses and LAE liabilities relating to prior periods were reduced by $85.2million, which was attributable to a reduction in estimates of net ultimate losses of $38.1 million, reduction in provisions for bad debt of $20.4million, a reduction in provisions for unallocated LAE liabilities of $21.7 million, relating to 2015 run-off activity, and amortization of fair valueadjustments over the estimated payout period relating to companies acquired amounting to $5.0 million.
30

Table of ContentsENSTAR GROUP LIMITED
NOTES TO THE UNAUDITED CONDENSED CONSOLIDATED FINANCIAL STATEMENTS — (Continued)
Atrium
The table below provides a reconciliation of the beginning and ending liability for losses and LAE for the three and six months endedJune 30, 2016 and 2015:
Three Months Ended
June 30, Six Months Ended
June 30,
2016 2015 2016 2015Balance as at beginning of period $ 209,919 $ 202,873 $ 201,017 $ 212,611
Less: reinsurance reserves recoverable 26,249 26,629 25,852 28,278
Net balance as at beginning of period 183,670 176,244 175,165 184,333
Net incurred losses and LAE: Current period 20,568 17,495 36,631 32,373
Prior periods (3,435) (3,738) (3,909) (11,596)
Total net incurred losses and LAE 17,133 13,757 32,722 20,777
Net paid losses: Current period (5,255) (4,538) (7,493) (7,408)
Prior periods (7,268) (7,583) (12,778) (16,624)
Total net paid losses (12,523) (12,121) (20,271) (24,032)
Effect of exchange rate movement (1,912) 1,608 (1,248) (1,590)
Net balance as at June 30 186,368 179,488 186,368 179,488
Plus: reinsurance reserves recoverable 26,856 26,011 26,856 26,011
Balance as at June 30 $ 213,224 $ 205,499 $ 213,224 $ 205,499
Net incurred losses and LAE in the Atrium segment for the three and six months ended June 30, 2016 and 2015 were as follows:
Three Months Ended June 30,
2016 2015
Prior
Period CurrentPeriod Total
PriorPeriod
CurrentPeriod Total
Net losses paid $ 7,268 $ 5,255 $ 12,523 $ 7,583 $ 4,538 $ 12,121Net change in case and LAE reserves (3,391) 5,426 2,035 (3,946) 4,082 136Net change in IBNR reserves (6,181) 9,719 3,538 (3,560) 8,746 5,186Increase (reduction) in estimates of net ultimate losses (2,304) 20,400 18,096 77 17,366 17,443Increase (reduction) in provisions for unallocated LAE (118) 168 50 (137) 129 (8)Amortization of fair value adjustments (1,013) — (1,013) (3,678) — (3,678)Net incurred losses and LAE $ (3,435) $ 20,568 $ 17,133 $ (3,738) $ 17,495 $ 13,757
Six Months Ended June 30,
2016 2015
Prior Period Current Period Total Prior Period Current Period TotalNet losses paid $ 12,778 $ 7,493 $ 20,271 $ 16,624 $ 7,408 $ 24,032Net change in case and LAE reserves (7,351) 7,614 263 (7,657) 6,774 (883)Net change in IBNR reserves (7,772) 21,201 13,429 (16,553) 17,929 1,376Increase (reduction) in estimates of net ultimate losses (2,345) 36,308 33,963 (7,586) 32,111 24,525Increase (reduction) in provisions for unallocated LAE (189) 323 134 (332) 262 (70)Amortization of fair value adjustments
(1,375) — (1,375) (3,678) — (3,678)Net incurred losses and LAE $ (3,909) $ 36,631 $ 32,722 $ (11,596) $ 32,373 $ 20,777
31

Table of ContentsENSTAR GROUP LIMITED
NOTES TO THE UNAUDITED CONDENSED CONSOLIDATED FINANCIAL STATEMENTS — (Continued)
StarStone
The table below provides a reconciliation of the beginning and ending liability for losses and LAE for the three and six months endedJune 30, 2016 and 2015:
Three Months Ended
June 30, Six Months Ended
June 30,
2016 2015 2016 2015
Balance as at beginning of period $ 972,372 $ 828,488 $ 933,678 $ 861,800
Less: reinsurance reserves recoverable 299,393 280,540 299,783 325,209
Net balance as at beginning of period 672,979 547,948 633,895 536,591
Net incurred losses and LAE: Current period 105,548 81,293 198,718 158,703
Prior periods (1,529) (280) (3,516) (1,474)
Total net incurred losses and LAE 104,019 81,013 195,202 157,229
Net paid losses: Current period (9,709) (7,518) (10,815) (11,241)
Prior periods (54,744) (31,896) (105,314) (80,322)
Total net paid losses (64,453) (39,414) (116,129) (91,563)
Effect of exchange rate movement (7,252) (2,761) (7,675) (15,471)
Net balance as at June 30 705,293 586,786 705,293 586,786
Plus: reinsurance reserves recoverable 289,201 287,049 289,201 287,049
Balance as at June 30 $ 994,494 $ 873,835 $ 994,494 $ 873,835
Net incurred losses and LAE in the StarStone segment for the three and six months ended June 30, 2016 and 2015 were as follows:
Three Months Ended June 30,
2016 2015
Prior Period Current Period Total Prior Period Current Period TotalNet losses paid $ 54,744 $ 9,709 $ 64,453 $ 31,896 $ 7,518 $ 39,414Net change in case and LAE reserves (26,737) 48,473 21,736 6,397 40,332 46,729Net change in IBNR reserves (28,321) 45,606 17,285 (38,584) 32,894 (5,690)Increase (reduction) in estimates of net ultimate losses (314) 103,788 103,474 (291) 80,744 80,453Increase (reduction) in provisions for unallocated LAE (1,002) 1,760 758 506 549 1,055Amortization of fair value adjustments (213) — (213) (495) — (495)Net incurred losses and LAE $ (1,529) $ 105,548 $ 104,019 $ (280) $ 81,293 $ 81,013
Six Months Ended June 30,
2016 2015
Prior Period Current Period Total Prior Period Current Period TotalNet losses paid $ 105,314 $ 10,815 $ 116,129 $ 80,322 $ 11,241 $ 91,563Net change in case and LAE reserves (22,102) 56,493 34,391 (3,934) 48,877 44,943Net change in IBNR reserves (83,234) 127,606 44,372 (76,262) 96,311 20,049Increase (reduction) in estimates of net ultimate losses (22) 194,914 194,892 126 156,429 156,555Increase (reduction) in provisions for unallocated LAE (2,036) 3,804 1,768 (563) 2,274 1,711Amortization of fair value adjustments (1,458) — (1,458) (1,037) — (1,037)Net incurred losses and LAE $ (3,516) $ 198,718 $ 195,202 $ (1,474) $ 158,703 $ 157,229
32

Table of ContentsENSTAR GROUP LIMITED
NOTES TO THE UNAUDITED CONDENSED CONSOLIDATED FINANCIAL STATEMENTS — (Continued)
8. POLICY BENEFITS FOR LIFE AND ANNUITY CONTRACTS
Policy benefits for life and annuity contracts as at June 30, 2016 and December 31, 2015 were as follows:
June 30,
2016 December 31,
2015Life $ 419,453 $ 436,603Annuities 916,729 921,654 1,336,182 1,358,257Fair value adjustments (49,906) (53,560) $ 1,286,276 $ 1,304,697
Refer to Note 10 of the consolidated financial statements contained in our Annual Report on Form 10-K for the year ended December 31,2015 for more information on establishing policy benefit reserves.
9. PREMIUMS WRITTEN AND EARNED
The following table provides a summary of net premiums written and earned in our Non-life Run-off, Atrium, StarStone and Life and Annuitiessegments for the three and six months ended June 30, 2016 and 2015:
Three Months Ended June 30, Six Months Ended June 30,
2016 2015 2016 2015
Premiums
Written Premiums
Earned Premiums
Written Premiums
Earned Premiums
Written Premiums
Earned Premiums
Written Premiums
EarnedNon-life Run-off Gross $ 7,066 $ 9,216 $ 14,797 $ 53,184 $ 13,763 $ 17,163 $ 24,914 $ 78,157Ceded (4,290) (4,740) (39,590) (35,886) (5,716) (7,252) (39,867) (42,367)Net $ 2,776 $ 4,476 $ (24,793) $ 17,298 $ 8,047 $ 9,911 $ (14,953) $ 35,790Atrium Gross $ 37,781 $ 35,908 $ 35,786 $ 37,913 $ 79,299 $ 71,342 $ 84,699 $ 76,067Ceded (4,619) (4,150) (3,966) (3,956) (7,957) (7,673) (8,521) (8,238)Net $ 33,162 $ 31,758 $ 31,820 $ 33,957 $ 71,342 $ 63,669 $ 76,178 $ 67,829StarStone Gross $ 223,368 $ 208,548 $ 241,057 $ 195,963 $ 440,412 $ 402,664 $ 431,754 $ 364,495Ceded (41,023) (37,513) (59,692) (58,267) (107,930) (77,547) (125,566) (103,177)Net $ 182,345 $ 171,035 $ 181,365 $ 137,696 $ 332,482 $ 325,117 $ 306,188 $ 261,318Life and Annuities Life $ 20,533 $ 19,659 $ 22,922 $ 23,072 $ 38,459 $ 37,640 $ 45,655 $ 45,992Total $ 238,816 $ 226,928 $ 211,314 $ 212,023 $ 450,330 $ 436,337 $ 413,068 $ 410,929
33

Table of ContentsENSTAR GROUP LIMITED
NOTES TO THE UNAUDITED CONDENSED CONSOLIDATED FINANCIAL STATEMENTS — (Continued)
10. GOODWILL, INTANGIBLE ASSETS AND DEFERRED CHARGE
The following table presents a reconciliation of the beginning and ending goodwill, intangible assets and the deferred charge during the sixmonths ended June 30, 2016:
Goodwill
Intangibleassets with
a definite life -Other
Intangible assets with
an indefinite life Total
Intangible assets with
a definite life -FVA
Other assets -Deferred Charge
Balance as at December 31, 2015 $ 73,071 $ 31,202 $ 87,031 $ 191,304 $ 180,730 $ 255,911Amortization — (3,749) — (3,749) (11,687) (8,639)Balance as at June 30, 2016 $ 73,071 $ 27,453 $ 87,031 $ 187,555 $ 169,043 $ 247,272
Refer to Note 12 to the consolidated financial statements contained in our Annual Report on Form 10-K for the year ended December 31,2015 for more information on goodwill, intangible assets and the deferred charge.
Intangible asset amortization for the three and six months ended June 30, 2016 and 2015 was $15.3 million and $15.4 million, respectively,compared to $(4.9) million and $(2.2) million for the comparative periods in 2015.
The gross carrying value, accumulated amortization and net carrying value of intangible assets by type and the deferred charge at June 30,2016 and December 31, 2015 were as follows:
June 30, 2016 December 31, 2015
GrossCarrying
Value AccumulatedAmortization
NetCarrying
Value
GrossCarrying
Value AccumulatedAmortization
NetCarrying
ValueIntangible assets with a definite life:
Fair value adjustments: Losses and LAE liabilities $ 458,202 $ (320,714) $ 137,488 $ 456,110 $ (307,785) $ 148,325Reinsurance balances recoverable (175,924) 157,573 (18,351) (175,774) 154,619 (21,155)Policy benefits for life and annuity contracts 86,332 (36,426) 49,906 86,332 (32,772) 53,560
Total $ 368,610 $ (199,567) $ 169,043 $ 366,668 $ (185,938) $ 180,730Other:
Distribution channel $ 20,000 $ (3,445) $ 16,555 $ 20,000 $ (2,777) $ 17,223Technology 15,000 (9,294) 5,706 15,000 (6,561) 8,439Brand 7,000 (1,808) 5,192 7,000 (1,460) 5,540
Total $ 42,000 $ (14,547) $ 27,453 $ 42,000 $ (10,798) $ 31,202Intangible assets with an indefinite life:
Lloyd’s syndicate capacity $ 37,031 $ — $ 37,031 $ 37,031 $ — $ 37,031Licenses 19,900 — 19,900 19,900 — 19,900Management contract 30,100 — 30,100 30,100 — 30,100Total $ 87,031 $ — $ 87,031 $ 87,031 $ — $ 87,031
Deferred charge on retroactive reinsurance $ 271,176 $ (23,904) $ 247,272 $271,176 $ (15,265) $255,911
34

Table of ContentsENSTAR GROUP LIMITED
NOTES TO THE UNAUDITED CONDENSED CONSOLIDATED FINANCIAL STATEMENTS — (Continued)
11. LOANS PAYABLE
We utilize debt facilities primarily for acquisitions and, from time to time, for general corporate purposes. Under these facilities, loanspayable and accrued interest as of June 30, 2016 and December 31, 2015 were as follows:
Facility Origination Date Term June 30, 2016 December 31, 2015EGL Revolving Credit Facility September 16, 2014 5 years $ 549,798 $ 505,750Sussex Facility December 24, 2014 4 years 63,500 94,000
Total long-term bank debt 613,298 599,750Accrued interest 732 500
Total loans payable $ 614,030 $ 600,250
For the three months ended June 30, 2016 and 2015, interest expense was $5.4 million and $4.8 million, respectively. For the six monthsended June 30, 2016 and 2015, interest expense was $10.8 million and $8.8 million, respectively.
EGL Revolving Credit Facility
This 5-year revolving credit facility, originated on September 16, 2014, and amended on February 27, 2015, February 15, 2016, and mostrecently on August 5, 2016, is among Enstar Group Limited and certain of its subsidiaries, as borrowers and as guarantors, and various financialinstitutions. We are permitted to borrow up to an aggregate of $665.0 million, and as of August 5, 2016 we have an option to obtain additionalcommitments of up to $166.25 million. As of June 30, 2016, there was $115.2 million of available unutilized capacity under this facility. We are incompliance with the covenants of the EGL Revolving Credit Facility.
During the three months ended June 30, 2016 we borrowed €75.0 million. This has been designated as a non-derivative hedge of our netinvestment in certain subsidiaries whose functional currency is denominated in Euros. The foreign exchange effect of revaluing these Euroborrowings resulted in a gain of $2.1 million recognized in the currency translation adjustment within accumulated other comprehensive income(loss) for the three and six months ended June 30, 2016. This gain was offset against an equivalent loss recognized upon the translation of thosesubsidiaries' financial statements from functional currency into U.S. dollars. There were no ineffective portions of the net investment hedge duringthe three or six months ended June 30, 2016, which would have required reclassification from accumulated other comprehensive income (loss) intoearnings.
Sussex Facility
On December 24, 2014, we entered into a 4-year term loan (the "Sussex Facility", formerly called the Companion Facility) with two financialinstitutions. This facility was fully utilized to initially borrow $109.0 million to fund 50% of the consideration payable for the acquisition of Sussex,which was completed on January 27, 2015. During 2015, we repaid $15.0 million and during the six months ended June 30, 2016, we repaid $30.5million of the outstanding principal on the facility, bringing the outstanding principal to $63.5 million. We are in compliance with the covenants ofthe Sussex Facility.
Refer to Note 13 to the consolidated financial statements contained in our Annual Report on Form 10-K for the year ended December 31,2015 for further information on the terms of the above facilities.
35
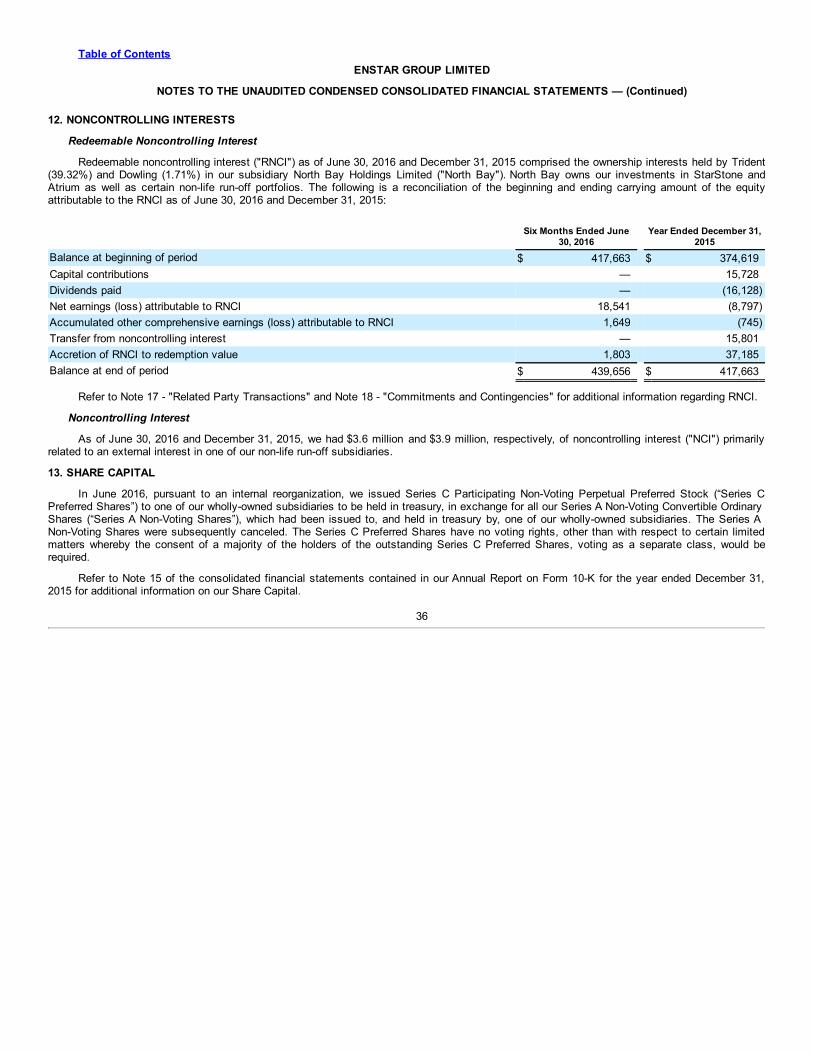
Table of ContentsENSTAR GROUP LIMITED
NOTES TO THE UNAUDITED CONDENSED CONSOLIDATED FINANCIAL STATEMENTS — (Continued)
12. NONCONTROLLING INTERESTS
Redeemable Noncontrolling Interest
Redeemable noncontrolling interest ("RNCI") as of June 30, 2016 and December 31, 2015 comprised the ownership interests held by Trident(39.32%) and Dowling (1.71%) in our subsidiary North Bay Holdings Limited ("North Bay"). North Bay owns our investments in StarStone andAtrium as well as certain non-life run-off portfolios. The following is a reconciliation of the beginning and ending carrying amount of the equityattributable to the RNCI as of June 30, 2016 and December 31, 2015:
Six Months Ended June
30, 2016 Year Ended December 31,
2015Balance at beginning of period $ 417,663 $ 374,619Capital contributions — 15,728Dividends paid — (16,128)Net earnings (loss) attributable to RNCI 18,541 (8,797)Accumulated other comprehensive earnings (loss) attributable to RNCI 1,649 (745)Transfer from noncontrolling interest — 15,801Accretion of RNCI to redemption value 1,803 37,185Balance at end of period $ 439,656 $ 417,663
Refer to Note 17 - "Related Party Transactions" and Note 18 - "Commitments and Contingencies" for additional information regarding RNCI.
Noncontrolling Interest
As of June 30, 2016 and December 31, 2015, we had $3.6 million and $3.9 million, respectively, of noncontrolling interest ("NCI") primarilyrelated to an external interest in one of our non-life run-off subsidiaries.
13. SHARE CAPITAL
In June 2016, pursuant to an internal reorganization, we issued Series C Participating Non-Voting Perpetual Preferred Stock (“Series CPreferred Shares”) to one of our wholly-owned subsidiaries to be held in treasury, in exchange for all our Series A Non-Voting Convertible OrdinaryShares (“Series A Non-Voting Shares”), which had been issued to, and held in treasury by, one of our wholly-owned subsidiaries. The Series ANon-Voting Shares were subsequently canceled. The Series C Preferred Shares have no voting rights, other than with respect to certain limitedmatters whereby the consent of a majority of the holders of the outstanding Series C Preferred Shares, voting as a separate class, would berequired.
Refer to Note 15 of the consolidated financial statements contained in our Annual Report on Form 10-K for the year ended December 31,2015 for additional information on our Share Capital.
36

Table of ContentsENSTAR GROUP LIMITED
NOTES TO THE UNAUDITED CONDENSED CONSOLIDATED FINANCIAL STATEMENTS — (Continued)
14. EARNINGS PER SHARE
The following table sets forth the comparison of basic and diluted earnings per share for the three and six months ended June 30, 2016 and2015:
Three Months Ended June 30, Six Months Ended June 30,
2016 2015 2016 2015Basic earnings per ordinary share: Net earnings attributable to Enstar Group Limited $ 40,594 $ 14,545 $ 86,114 $ 59,392Weighted-average ordinary shares outstanding — basic 19,295,280 19,252,359 19,289,119 19,244,951Net earnings per ordinary share attributable to Enstar Group Limited —basic $ 2.10 $ 0.76 $ 4.46 $ 3.09Diluted earnings per ordinary share: Net earnings attributable to Enstar Group Limited $ 40,594 $ 14,545 $ 86,114 $ 59,392Weighted-average ordinary shares outstanding — basic 19,295,280 19,252,359 19,289,119 19,244,951Effect of dilutive securities:
Unvested shares 25,762 39,524 25,448 38,017Restricted share units 17,092 13,620 16,014 12,031Warrants 92,330 78,250 89,960 69,776
Weighted-average ordinary shares outstanding — diluted 19,430,464 19,383,753 19,420,541 19,364,775Net earnings per ordinary share attributable to Enstar Group Limited —diluted $ 2.09 $ 0.75 $ 4.43 $ 3.07
15. EMPLOYEE BENEFITS
We provide various employee benefits including share-based compensation, an employee share purchase plan, an annual incentivecompensation program, and pension plans. These are described in Note 17 to the consolidated financial statements contained in our AnnualReport on Form 10-K for the year ended December 31, 2015. On June 14, 2016, our shareholders approved the 2016 Equity Incentive Plan, whichgoverns the terms of awards granted subsequent to its adoption. The plan replaced the expiring 2006 Equity Incentive Plan. Any outstandingawards granted under the 2006 plan remain in effect pursuant to their terms.
Share-based compensation expense for the three and six months ended June 30, 2016 was $3.7 million and$11.9 million, respectively, ascompared to $7.7 million and $9.1 million for the comparative periods in 2015.
Employee share purchase plan expense for the three and six months ended June 30, 2016 and 2015, was less than $0.1 million and $0.2million, respectively.
Annual incentive compensation program expense for the three and six months ended June 30, 2016, was $4.2 million and $5.0 million,respectively, as compared to $(0.9) million and $7.0 million for the comparative periods in 2015.
Pension expense for the three and six months ended June 30, 2016 was $2.8 million and $5.9 million, respectively, as compared to $2.8million and $5.2 million for the comparative periods in 2015.
37

Table of ContentsENSTAR GROUP LIMITED
NOTES TO THE UNAUDITED CONDENSED CONSOLIDATED FINANCIAL STATEMENTS — (Continued)
16. TAXATION
Interim Tax Calculation Method
We use the estimated annual effective tax rate method for computing our interim tax provision. This method applies our best estimate of theeffective tax rate expected for the full year to our year-to-date earnings before income taxes. We provide for income tax expense or benefit basedupon our pre-tax earnings and the provisions of currently enacted tax laws. Certain items deemed to be unusual, infrequent or not reliablyestimated, are excluded from the estimated annual effective tax rate. In the event such items are identified, the actual tax expense or benefit isreported in the same period as the related item. Certain other items are not included in the estimated annual effective tax rate, such as changes inthe assessment of valuation allowance on deferred tax assets and uncertain tax positions, if any.
Interim Tax Expense (Benefit)
The effective tax rates on income for the three and six months ended June 30, 2016 were 14.5% and 13.3%, respectively, as compared to24.2% and 18.8%, respectively, for the comparative periods in 2015. The effective tax rate on income differs from the statutory rate of 0% due totax on foreign operations (primarily the United States and United Kingdom) and an increase in the assessment of valuation allowance on deferredtax assets. We have foreign operating subsidiaries and branch operations principally located in the United States, United Kingdom, ContinentalEurope and Australia that are subject to federal, foreign, state and local taxes in those jurisdictions. Deferred income tax liabilities have not beenaccrued with respect to the undistributed earnings of our foreign subsidiaries. If the earnings were to be distributed, as dividends or otherdistributions, withholding taxes may be imposed by the jurisdiction of the paying subsidiary. For our U.S. subsidiaries, we have not currentlyaccrued any withholding taxes with respect to un-remitted earnings as management has no current intention of remitting these earnings. For ourUnited Kingdom subsidiaries, there are no withholding taxes imposed. For our other foreign subsidiaries, it would not be practicable to computesuch amounts due to a variety of factors, including the amount, timing, and manner of any repatriation. Because we operate in many jurisdictions,our net earnings are subject to risk due to changing tax laws and tax rates around the world. The current, rapidly changing economic environmentmay increase the likelihood of substantial changes to tax laws in the jurisdictions in which we operate.
Assessment of Valuation Allowance on Deferred Tax Assets
We have estimated the future taxable income of our foreign subsidiaries and have provided a valuation allowance in respect of losscarryforwards where we do not expect to realize a benefit. We have considered all available evidence using a “more likely than not” standard indetermining the amount of the valuation allowance. During the three and six months ended June 30, 2016, we recognized an increase of $1.3million and $2.2 million, respectively, in our deferred tax asset valuation allowance.
Accounting for Uncertainty in Income Taxes
We had no unrecognized tax benefits relating to uncertain tax positions as at either June 30, 2016 or December 31, 2015.
Tax Examinations
Our operating subsidiaries may be subject to audit by various tax authorities and may have different statutes of limitations expiration dates.With limited exceptions, our major subsidiaries that operate in the United States, United Kingdom and Australia are no longer subject to taxexaminations for years before 2012, 2012 and 2009, respectively.
38

Table of ContentsENSTAR GROUP LIMITED
NOTES TO THE UNAUDITED CONDENSED CONSOLIDATED FINANCIAL STATEMENTS — (Continued)
17. RELATED PARTY TRANSACTIONS
Stone Point Capital LLC
Through several private transactions occurring from May 2012 to July 2012, Trident acquired 1,350,000 of our Voting Ordinary Shares (whichnow constitutes approximately 8.3% of our outstanding Voting Ordinary Shares). On November 6, 2013, we appointed James D. Carey to ourBoard of Directors. Mr. Carey is the sole member of an entity that is one of four general partners of the entities serving as general partners forTrident, is a member of the investment committees of such general partners, and is a member and senior principal of Stone Point Capital LLC("Stone Point"), the manager of the Trident funds.
In addition, we have entered into certain agreements with Trident with respect to Trident’s co-investments in the Atrium, Arden, andStarStone acquisitions. These include investors’ agreements and shareholders’ agreements, which provide for, among other things: (i) our right toredeem Trident’s equity interest in the Atrium/Arden and StarStone transactions in cash at fair market value within the 90 days following the fifthanniversary of the Arden and StarStone closings, respectively, and at any time following the seventh anniversary of the Arden and StarStoneclosings, respectively; and (ii) Trident’s right to have its equity co-investment interests in the Atrium/Arden and StarStone transactions redeemedby us at fair market value (which we may satisfy in either cash or our ordinary shares) following the seventh anniversaries of the Arden closing andStarStone closing, respectively. As of June 30, 2016, we have included $439.7 million (December 31, 2015: $417.7 million) as RNCI on ourbalance sheet relating to these Trident co-investment transactions. Pursuant to the terms of the shareholders’ agreements, Mr. Carey serves as aTrident representative on the boards of the holding companies established in connection with the Atrium/Arden and StarStone co-investmenttransactions. Trident also has a second representative on these boards who is a Stone Point employee.
As at June 30, 2016, we had investments in funds (carried within other investments) and a registered investment company affiliated withentities owned by Trident or otherwise affiliated with Stone Point. The fair value of the investments in the funds was $190.1 million and $237.9million as of June 30, 2016 and December 31, 2015, respectively. The decrease was primarily due to a sale of one of the fund investments duringthe three months ended June 30, 2016. The fair value of our investment in the registered investment company was $21.2 million and $21.0 millionas at June 30, 2016 and December 31, 2015, respectively. For the six months ended June 30, 2016 and 2015, we recognized net realized andunrealized gains of $5.8 million and $5.5 million, respectively, in respect of the fund investments and net unrealized losses of $0.5 million and netunrealized gains of $0.2 million, respectively, in respect of the registered investment company investment. For the six months ended June 30,2016 and 2015, we recognized interest income of $1.3 million in respect of the registered investment company.
We also have separate accounts, with a balance of $237.9 million and $157.8 million as at June 30, 2016 and December 31, 2015,respectively, managed by Eagle Point Credit Management and PRIMA Capital Advisors, which are affiliates of entities owned by Trident, withrespect to which we incurred approximately $0.2 million and $0.1 million in management fees for the six months ended June 30, 2016 and 2015,respectively.
In addition, we are invested in funds (carried within other investments) managed by Sound Point Capital, an entity in which Mr. Carey has anindirect minority ownership interest and serves as a director. The fair value of our investments in Sound Point Capital funds was $24.1 million and$34.5 million as of June 30, 2016 and December 31, 2015, respectively; the decrease was primarily due to a partial sale of a fund investmentduring the six months ended June 30, 2016. For the six months ended June 30, 2016 and 2015, we have recognized net unrealized gains of $0.7million and $1.6 million, respectively, in respect of investments managed by Sound Point Capital.
Sound Point Capital has acted as collateral manager for certain of our direct investments in CLO equity securities. The fair value of theseinvestments was $18.8 million and $18.2 million as at June 30, 2016 and December 31, 2015, respectively. For the six months ended June 30,2016 and 2015, we recognized net unrealized gains of $0.7 million and net unrealized losses of $0.7 million, respectively. For the six monthsended June 30, 2016 and 2015, we recognized interest income of $3.6 million and $0.9 million in respect of these investments
During 2015 we opened a separate account managed by Sound Point Capital, with a balance of $56.8 million and $53.5 million as atJune 30, 2016 and December 31, 2015, respectively, with respect to which we incurred approximately $0.1 million in management fees for the sixmonths ended June 30, 2016 and 2015, respectively.
Fees charged pursuant to investments affiliated with entities owned by Trident or Sound Point Capital were negotiated on an arm's-lengthbasis.
39

Table of ContentsENSTAR GROUP LIMITED
NOTES TO THE UNAUDITED CONDENSED CONSOLIDATED FINANCIAL STATEMENTS — (Continued)
Goldman Sachs & Co.
Affiliates of Goldman Sachs own approximately 4.1% of our Voting Ordinary Shares and 100% of our Series C Non-Voting Ordinary Shares.Sumit Rajpal, a managing director of Goldman Sachs, was appointed to our Board of Directors in connection with Goldman Sachs’ investment inEnstar. As of both June 30, 2016 and December 31, 2015, we had investments in funds (carried within other investments) affiliated with entitiesowned by Goldman Sachs, which had a fair value of $13.9 million and $39.6 million, respectively. The decrease was primarily due to a sale of oneof the fund investments during the three months ended June 30, 2016. As of June 30, 2016 and December 31, 2015, we had an indirectinvestment in non-voting interests of two companies affiliated with Hastings Insurance Group Limited, which had a fair value of $42.6 million and$44.6 million, respectively. Goldman Sachs affiliates have an approximately 38% interest in the Hastings companies, and Mr. Rajpal serves as adirector of the entities in which we have invested. For the six months ended June 30, 2016 and 2015, we recognized net unrealized gains of $2.8million and net unrealized losses of $2.4 million, respectively, in respect of the Goldman Sachs-affiliated investments. For the six months endedJune 30, 2016 and 2015, we recognized interest income of $0.7 million and $nil in respect of the Goldman Sachs-affiliated investments.
During 2015, a Goldman Sachs affiliate began providing investment management services to one of our subsidiaries. Our interests are heldin accounts managed by affiliates of Goldman Sachs, with a balance of $786.6 million and $758.9 million as at June 30, 2016 and December 31,2015, respectively, with respect to which we incurred approximately $0.4 million and $0.3 million in management fees for the six months endedJune 30, 2016 and 2015, respectively.
Fees charged pursuant to investments with affiliates of Goldman Sachs were negotiated on an arm's-length basis.
CPPIB
Canada Pension Plan Investment Board ("CPPIB"), together with management of Wilton Re, own 100% of the common stock of Wilton Re.Subsequent to the closing of our transaction with Wilton Re, on June 3, 2015, CPPIB purchased voting and non-voting shares in Enstar from FRXI Offshore AIV, L.P., First Reserve Fund XII, L.P., FR XII-A Parallel Vehicle L.P. and FR Torus Co-Investment, L.P. (collectively, "FirstReserve", and the transaction, the "CPPIB-First Reserve Transaction"). These shares constitute a 9.3% voting interest and a 9.8% aggregateeconomic interest in Enstar. On September 29, 2015, CPPIB exercised its acquired right to appoint a representative to our Board of Directors. Inaddition, 4.6% of our voting shares are held indirectly by CPPIB through CPPIB Epsilon Ontario Limited Partnership ("CPPIB LP"). CPPIB is thesole limited partner of CPPIB LP, CPPIB Epsilon Ontario Trust ("CPPIB Trust") is the general partner, and CPPIB's director representative is thetrustee of CPPIB Trust.
We also have a pre-existing reinsurance recoverable based on normal commercial terms from a company later acquired by Wilton Re, whichwas carried on our balance sheet at $11.2 million as of June 30, 2016.
18. COMMITMENTS AND CONTINGENCIES
Concentrations of Credit Risk
We believe that there are no significant concentrations of credit risk associated with our cash and cash equivalents, fixed maturityinvestments, or other investments. Cash, cash equivalents and fixed maturity investments are managed pursuant to guidelines that follow prudentstandards of diversification and limit the allowable holdings of a single issue and issuers. Other investments are managed pursuant to guidelinesthat emphasize diversification and liquidity. Pursuant to these guidelines, we manage and monitor risk across a variety of investment funds andvehicles, markets and counterparties. We are also subject to custodial credit risk on our fixed maturity and equity investments, which we manageby diversifying our holdings amongst large financial institutions that are highly regulated.
We have exposure to credit risk on certain of our assets pledged to ceding companies under insurance contracts. In addition, we arepotentially exposed should any insurance intermediaries be unable to fulfill their contractual obligations with respect to payments of balances owedto and by us.
Credit risk exists in relation to reinsurance balances recoverable. We remain liable to the extent that retrocessionaires do not meet theircontractual obligations and, therefore, we evaluate and monitor concentration of credit risk among our reinsurers. These amounts are discussed inNote 6 - "Reinsurance Balances Recoverable."
40

Table of ContentsENSTAR GROUP LIMITED
NOTES TO THE UNAUDITED CONDENSED CONSOLIDATED FINANCIAL STATEMENTS — (Continued)
We are also subject to credit risk in relation to funds held by reinsured companies. Under funds held arrangements, the reinsured companyhas retained funds that would otherwise have been remitted to our reinsurance subsidiaries. The funds balance is credited with investment incomeand losses payable are deducted. We are subject to credit risk if the reinsured company is unable to honor the value of the funds held balances,such as in the event of insolvency. However, we generally have the contractual ability to offset any shortfall in the payment of the funds heldbalances with amounts owed by us to the reinsured for losses payable and other amounts contractually due. We routinely monitor thecreditworthiness of reinsured companies with whom we have funds held arrangements. We have a significant concentration of $1.1 billion to onereinsured company which has financial strength credit ratings of A+ from A.M. Best and AA from Standard & Poor's.
We limit the amount of credit exposure to any one counterparty, and none of our counterparty credit exposures, excluding U.S. Governmentinstruments and the funds held counterparty noted above, exceeded 10% of shareholders’ equity as of June 30, 2016.
Legal Proceedings
We are, from time to time, involved in various legal proceedings in the ordinary course of business, including litigation and arbitrationregarding claims. Estimated losses relating to claims arising in the ordinary course of business, including the anticipated outcome of any pendingarbitration or litigation, are included in the liability for losses and LAE in our consolidated balance sheets. In addition to claims litigation, we may besubject to other lawsuits and regulatory actions in the normal course of business, which may involve, among other things, allegations ofunderwriting errors or omissions, employment claims or regulatory activity. We do not believe that the resolution of any currently pending legalproceedings, either individually or taken as a whole, will have a material effect on our business, results of operations or financial condition. Weanticipate that, similar to the rest of the insurance and reinsurance industry, we will continue to be subject to litigation and arbitration proceedingsin the ordinary course of business, including litigation generally related to the scope of coverage with respect to asbestos and environmental andother claims.
Unfunded Investment Commitments
As at June 30, 2016, we had original commitments to investment funds of $380.0 million, of which $241.6 million has been funded, and$138.4 million remains outstanding as unfunded commitments.
Guarantees
As at June 30, 2016 and December 31, 2015, parental guarantees supporting subsidiaries' insurance obligations were $501.7 million and$334.2 million, respectively.
Redeemable Noncontrolling Interest
We have the right to purchase the RNCI interests from the RNCI holders at certain times in the future (each such right, a "call right"), andthe RNCI holders have the right to sell their RNCI interests to us at certain times in the future (each such right, a "put right"). The RNCI rights heldby Trident are described in Note 17 - "Related Party Transactions." Dowling has a right to participate if Trident exercises its put right.
41

Table of ContentsENSTAR GROUP LIMITED
NOTES TO THE UNAUDITED CONDENSED CONSOLIDATED FINANCIAL STATEMENTS — (Continued)
19. SEGMENT INFORMATION
We monitor and report our results of operations in four segments: Non-life Run-off, Atrium, StarStone and Life and Annuities. Thesesegments are described in Note 1 and Note 22 to the consolidated financial statements contained in our Annual Report on Form 10-K for the yearended December 31, 2015.
The following tables set forth selected and condensed consolidated statement of earnings results by segment for the three and six monthsended June 30, 2016 and 2015:
Three Months Ended June 30, 2016
Non-lifeRun-off Atrium StarStone
Life andAnnuities Eliminations Consolidated
INCOME Net premiums earned $ 4,476 $ 31,758 $ 171,035 $ 19,659 $ — $ 226,928Fees and commission income 865 6,378 — — — 7,243Net investment income 37,581 635 5,753 11,113 (859) 54,223Net realized and unrealized gains (losses) 26,161 68 8,021 3,737 — 37,987Other income 2,036 65 1,584 363 — 4,048 71,119 38,904 186,393 34,872 (859) 330,429EXPENSES Net incurred losses and LAE (24,690) 17,133 104,019 — — 96,462Life and annuity policy benefits — — — 19,778 — 19,778Acquisition costs (56) 11,240 32,518 2,804 (17) 46,489General and administrative expenses 61,449 6,629 31,311 6,467 22 105,878Interest expense 6,016 — — 272 (864) 5,424Net foreign exchange losses (gains) (3,096) 256 1,027 (43) — (1,856) 39,623 35,258 168,875 29,278 (859) 272,175EARNINGS BEFORE INCOME TAXES 31,496 3,646 17,518 5,594 — 58,254INCOME TAXES (3,486) (580) (3,970) (437) — (8,473)NET EARNINGS 28,010 3,066 13,548 5,157 — 49,781Less: Net losses (earnings) attributable tononcontrolling interest (2,370) (1,258) (5,559) — — (9,187)NET EARNINGS ATTRIBUTABLE TOENSTAR GROUP LIMITED $ 25,640 $ 1,808 $ 7,989 $ 5,157 $ — $ 40,594
42

Table of ContentsENSTAR GROUP LIMITED
NOTES TO THE UNAUDITED CONDENSED CONSOLIDATED FINANCIAL STATEMENTS — (Continued)
Six Months Ended June 30, 2016
Non-liferun-off Atrium StarStone
Life andannuities Eliminations Consolidated
INCOME Net premiums earned $ 9,911 $ 63,669 $ 325,117 $ 37,640 $ — $ 436,337Fees and commission income 7,431 10,210 — — (5,051) 12,590Net investment income 73,811 1,189 11,033 29,534 (1,281) 114,286Net realized and unrealizedgains (losses) 49,551 108 22,370 3,922 — 75,951Other income 3,836 99 1,595 931 — 6,461 144,540 75,275 360,115 72,027 (6,332) 645,625EXPENSES Net incurred losses and LAE (48,244) 32,722 195,202 — — 179,680Life and annuity policybenefits — — — 40,758 — 40,758Acquisition costs 1,926 22,327 64,578 5,206 (283) 93,754General and administrativeexpenses 119,562 13,037 61,466 11,027 (4,768) 200,324Interest expense 11,496 — — 610 (1,281) 10,825Net foreign exchange losses(gains) (2,216) 2,071 (272) 333 — (84) 82,524 70,157 320,974 57,934 (6,332) 525,257EARNINGS BEFOREINCOME TAXES 62,016 5,118 39,141 14,093 — 120,368INCOME TAXES (8,159) (1,258) (5,988) (577) — (15,982)NET EARNINGS 53,857 3,860 33,153 13,516 — 104,386Less: Net earningsattributable to noncontrollinginterest (3,085) (1,584) (13,603) — — (18,272)NET EARNINGSATTRIBUTABLE TO ENSTARGROUP LIMITED $ 50,772 $ 2,276 $ 19,550 $ 13,516 $ — $ 86,114
43

Table of ContentsENSTAR GROUP LIMITED
NOTES TO THE UNAUDITED CONDENSED CONSOLIDATED FINANCIAL STATEMENTS — (Continued)
Three Months Ended June 30, 2015
Non-lifeRun-off Atrium StarStone
Life andAnnuities Eliminations Consolidated
INCOME Net premiums earned $ 17,298 $ 33,957 $ 137,696 $ 23,072 $ — $ 212,023Fees and commission income 4,892 7,457 — — (3,218) 9,131Net investment income 18,569 523 4,058 11,577 (72) 34,655Net realized and unrealized gains (4,308) 38 (3,355) (3,624) — (11,249)Other income 9,875 76 1,303 584 — 11,838 46,326 42,051 139,702 31,609 (3,290) 256,398EXPENSES Net incurred losses and LAE (28,870) 13,757 81,013 — — 65,900Life and annuity policy benefits — — — 28,090 — 28,090Acquisition costs (5,871) 12,301 27,365 3,299 — 37,094General and administrative expenses 53,168 6,670 32,891 4,452 (3,218) 93,963Interest expense 2,826 1,482 — 640 (72) 4,876Net foreign exchange losses (gains) (4,543) 2,213 4,200 582 — 2,452 16,710 36,423 145,469 37,063 (3,290) 232,375EARNINGS BEFORE INCOME TAXES 29,616 5,628 (5,767) (5,454) — 24,023INCOME TAXES (6,104) (2,252) 694 1,846 — (5,816)NET EARNINGS 23,512 3,376 (5,073) (3,608) — 18,207Less: Net losses (earnings) attributable tononcontrolling interest (3,761) (1,982) 2,081 — — (3,662)NET EARNINGS ATTRIBUTABLE TOENSTAR GROUP LIMITED $ 19,751 $ 1,394 $ (2,992) $ (3,608) $ — $ 14,545
44

Table of ContentsENSTAR GROUP LIMITED
NOTES TO THE UNAUDITED CONDENSED CONSOLIDATED FINANCIAL STATEMENTS — (Continued)
Six Months Ended June 30, 2015
Non-liferun-off Atrium StarStone
Life andannuities Eliminations Consolidated
INCOME Net premiums earned $ 35,790 $ 67,829 $ 261,318 $ 45,992 $ — $ 410,929Fees and commission income 9,729 16,985 14 — (6,117) 20,611Net investment income 37,433 1,030 6,189 20,652 (232) 65,072Net realized and unrealizedgains (losses) 30,352 129 1,347 (57) — 31,771Other income 12,915 154 1,366 879 — 15,314 126,219 86,127 270,234 67,466 (6,349) 543,697EXPENSES Net incurred losses and LAE (41,970) 20,777 157,229 — — 136,036Life and annuity policybenefits — — — 50,937 — 50,937Acquisition costs (7,576) 21,707 51,508 6,005 — 71,644General and administrativeexpenses 108,159 18,293 63,104 7,122 (6,117) 190,561Interest expense 5,346 2,965 — 800 (232) 8,879Net foreign exchange losses(gains) 595 (302) (2,180) (732) — (2,619) 64,554 63,440 269,661 64,132 (6,349) 455,438EARNINGS BEFOREINCOME TAXES 61,665 22,687 573 3,334 — 88,259INCOME TAXES (11,211) (4,136) 12 (1,225) — (16,560)NET EARNINGS 50,454 18,551 585 2,109 — 71,699Less: Net earningsattributable to noncontrollinginterest (3,357) (8,710) (240) — — (12,307)NET EARNINGSATTRIBUTABLE TO ENSTARGROUP LIMITED $ 47,097 $ 9,841 $ 345 $ 2,109 $ — $ 59,392
Assets by Segment
Invested assets are managed on a subsidiary-by-subsidiary basis, and investment income and realized and unrealized gains (losses) oninvestments are recognized in each segment as earned. Our total assets as at June 30, 2016 and December 31, 2015 by segment were as follows(the elimination items include the elimination of intersegment assets):
2016 2015Total assets:
Non-life Run-off $ 8,337,022 $ 7,629,184Atrium 577,235 555,621StarStone 2,915,503 2,778,275Life and annuities 1,687,902 1,734,945Less: Eliminations (858,496) (865,893)
$ 12,659,166 $ 11,832,132
45

Table of Contents
ITEM 2. MANAGEMENT’S DISCUSSION AND ANALYSIS OF FINANCIAL CONDITION AND RESULTS OF OPERATIONS
The following discussion and analysis of our financial condition as of June 30, 2016 and results of operations for the three and six monthsended June 30, 2016 and 2015 should be read in conjunction with our unaudited condensed consolidated financial statements and the relatednotes included elsewhere in this quarterly report and the audited consolidated financial statements and notes thereto contained in our AnnualReport on Form 10-K for the year ended December 31, 2015. Some of the information contained in this discussion and analysis or includedelsewhere in this quarterly report, including information with respect to our plans and strategy for our business, includes forward-looking statementsthat involve risks, uncertainties and assumptions. Our actual results and the timing of events could differ materially from those anticipated bythese forward-looking statements as a result of many factors, including those discussed under "Cautionary Statement Regarding Forward-LookingStatements", and "Risk Factors" included in Item 1A of our Annual Report on Form 10-K for the year ended December 31, 2015.
Table of Contents
Section Page
Business Overview 47Key Performance Indicator 47Current Outlook 47Recent Developments 48Non-GAAP Financial Measures 48
Consolidated Results of Operations — for the Three and Six Months Ended June 30, 2016 and 2015 50Results of Operations by Segment — for the Three and Six Months Ended June 30, 2016 and 2015 53
Non-life Run-off Segment 54Atrium Segment 58StarStone Segment 62Life and Annuities Segment 66
Investments 69Liquidity and Capital Resources 76
Overview 76Cash and Cash Equivalents 76Investments 77Reinsurance Balances Recoverable 77Funds Held by Reinsured Companies 77Loan Facilities 78Contractual Obligations 78Off-Balance Sheet Arrangements 79
Critical Accounting Policies 79Cautionary Statement Regarding Forward-looking Statements 80
46

Table of Contents
Business Overview
We are a Bermuda-based holding company with a core focus of acquiring and managing insurance and reinsurance companies in run-off andportfolios of insurance and reinsurance business in run-off, and providing management, consulting and other services to the insurance andreinsurance industry. We operate our business internationally through our insurance and reinsurance subsidiaries and our consulting subsidiaries inBermuda, the United States, the United Kingdom, Continental Europe, Australia, and other international locations.
The majority of our acquisitions have been in the non-life run-off business, which for us generally includes property and casualty, workers’compensation, asbestos and environmental, construction defect, marine, aviation and transit, and other closed business.
While our core focus remains acquiring and managing non-life run-off business, in recent years, we expanded our business to include activeunderwriting through our acquisitions of Atrium and StarStone. We partnered with the Trident V Funds ("Trident") in the Atrium and StarStoneacquisitions, with Enstar owning a 59.0% interest, Trident owning a 39.3% interest, and Dowling Capital Partners, L.P. ("Dowling") owning a 1.7%interest. We also expanded our portfolio of run-off businesses to include closed life and annuities, primarily through our acquisition of Pavonia fromHSBC Holdings plc in 2013.
We have four segments of business that are each managed, operated and reported upon separately: (i) Non-life Run-off; (ii) Atrium;(iii) StarStone; and (iv) Life and Annuities. For additional information relating to our segments, see "Item 1. Business - Operating Segments" in ourAnnual Report on Form 10-K for the year ended December 31, 2015.
Our business strategies are discussed in "Item 1. Business - Company Overview", "- Business Strategy", and "- Recent Acquisitions andSignificant New Business" in our Annual Report on Form 10-K for the year ended December 31, 2015.
Key Performance Indicator
Our primary corporate objective is to grow our fully diluted book value per share. This is driven primarily by growth in our net earnings, whichis in turn driven in large part by successfully completing new acquisitions, effectively managing companies and portfolios of business that we haveacquired, and executing our active underwriting strategies. The drivers of our book value growth are discussed in "Item 1. Business - BusinessStrategy" in our Annual Report on Form 10-K for the year ended December 31, 2015.
During the six months ended June 30, 2016, we increased our book value per share on a fully diluted basis by 3.9% to $134.68 per share.The increase was primarily due to net earnings attributable to Enstar Group Limited of $86.1 million.
Current Outlook
Our business strategy includes generating growth through acquisitions and reinsurance transactions, particularly in our Non-life Run-offsegment. On August 5, 2016, we entered into a transaction to assume $109.0 million of reserves from The Coca-Cola Company and itssubsidiaries (“Coca-Cola”). On March 31, 2016, we completed an agreement to assume net reserves of $1.1 billion from Allianz SE ("Allianz")effective January 1, 2016. We are also providing claims consulting services to Allianz on this portfolio of business. We will continue to employ adisciplined approach when assessing, acquiring and managing portfolios of risk.
Our industry continues to experience challenging market conditions in underwriting and investing. We continue to see overcapacity in manymarkets for insurable risks, resulting in continued pressure on premium rates and terms and conditions. We seek to maintain a disciplinedunderwriting approach to underwrite for profitability in our active underwriting segments, StarStone and Atrium. For the six months ended June 30,2016 compared to 2015, gross premiums written decreased in our Atrium segment as certain business no longer met our underwriting standards. Inour StarStone segment, gross premiums written increased through selective growth in certain specialty lines, which included the addition of newunderwriting teams during late 2015.
Low yields persist in the investment markets and investment returns remain volatile. We expect to maintain our investment strategy, whichemphasizes the preservation of our assets, credit quality, and diversification. We will continue to seek superior risk-adjusted returns by allocatinga portion of our portfolio to non-investment grade securities or alternative investments in accordance with our investment guidelines. For the sixmonths ended June 30, 2016 compared to the six months ended June 30, 2015, net investment income increased primarily due to our higheraverage
47

Table of Contents
invested assets and a higher yield obtained on those assets. Net investment income for the six months ended June 30, 2016 also benefited fromincome on life settlements contracts and interest on funds held relating to the portfolio assumed from Allianz.
In a referendum on June 23, 2016, the United Kingdom voted to leave the European Union (commonly referred to as "Brexit"). Although therewas significant volatility in the financial and foreign exchange markets during the three months ended June 30, 2016, this did not have a materialimpact on our financial statements. This volatility is expected to continue as the timing and nature of the United Kingdom's exit is yet to bedetermined. For companies based in the United Kingdom there is heightened uncertainty regarding trading relationships with countries in theEuropean Union. Both our StarStone and Atrium operations have well-diversified sources of premium which may mitigate the potential impact ofBrexit. The majority of business written in StarStone and Atrium is in United States dollars, so the impact of currency volatility on those segmentshas not been significant. In addition, StarStone already has established operations within the European Economic Area. Lloyd's has stated itsintention is to retain passporting rights and to lobby the government to include this in its negotiations with the European Union, whilst alsoevaluating alternative models to access the markets. In the near-term, access to markets is unaffected until the United Kingdom triggers Article50, and all contracts entered into up until that time are expected to remain valid into the post-Brexit period.
Recent Developments
Our transactions take the form of either acquisition of companies or loss portfolio transfer, where a reinsurance contract transfers a portfolioof loss and loss adjustment expenses ("LAE") liabilities from a (re)insurance counterparty to an Enstar-owned reinsurer.
Coca-Cola
On August 5, 2016, we entered into a reinsurance transaction with Coca-Cola pursuant to which we reinsured certain of Coca-Cola’sretention and deductible risks under its subsidiaries’ U.S. workers’ compensation, auto liability, general liability, and product liability insurancecoverage. We assumed total gross reserves of $109.1 million, received total assets of $102.7 million and recorded a deferred charge of $6.4million, included in other assets. We have transferred approximately $109.1 million into trust to support our obligations under the reinsuranceagreements. We provided a limited parental guarantee, subject to an overall maximum of approximately $27.0 million.
Allianz
On March 31, 2016, we completed our previously announced transaction with Allianz to reinsure portfolios of Allianz's run-offbusiness. Pursuant to the reinsurance agreement effective January 1, 2016, our subsidiary reinsured 50% of certain portfolios of workers'compensation, construction defect, and asbestos, pollution, and toxic tort business originally held by Fireman's Fund Insurance Company, andassumed net reinsurance reserves of approximately $1.1 billion. Affiliates of Allianz retained approximately $1.1 billion of reinsurance premium asfunds withheld collateral for the obligations of our subsidiary under the reinsurance agreement and we transferred approximately $110.0 million to areinsurance trust to further support our subsidiary's obligations. We earn interest on the funds withheld based upon an initial fixed interest rate. Wehave also provided a limited parental guarantee, which is subject to a maximum cap. The combined monetary total of the support offered by usthrough the trust and parental guarantee is calculated in accordance with contractually defined terms and is capped at $270.0 million.
In addition to the reinsurance transaction described above, we have entered into a claims consulting agreement with San FranciscoReinsurance Company, an affiliate of Allianz, with respect to the entire $2.2 billion portfolio, including the 50% share retained by affiliates ofAllianz.
Non-GAAP Financial Measures
In presenting our results for the Atrium and StarStone segments, we discuss the loss ratio, acquisition cost ratio, other operating expenseratio, and the combined ratio of our active underwriting operations within these segments. While we consider these measures to be non-GAAP,management believes that these ratios provide the most meaningful measure for understanding our underwriting profitability. These non-GAAPmeasures may be defined or calculated differently by other companies. There are no comparable GAAP measures to our insurance ratios.
The loss ratio is calculated by dividing net incurred losses and LAE by net premiums earned. The acquisition cost ratio is calculated bydividing acquisition costs by net premiums earned. The other operating expense ratio is calculated by dividing other operating expenses by netearned premiums earned. The combined ratio is the sum of the loss ratio, the acquisition cost ratio and the other operating expense ratio. Theratios exclude expenses related to
48

Table of Contents
the holding companies, which we believe is the most meaningful presentation because these expenses are not incremental and/or directly relatedto the individual underwriting operations.
In the loss ratio, the excluded net premiums earned and net incurred losses and LAE of the holding companies relate to the amortizationof our fair value adjustments associated with the liabilities for unearned premiums and losses and LAE acquired on acquisition date. Fair valuepurchase accounting adjustments established at the date of acquisition are recorded by the holding companies.
In Atrium’s other operating expense ratio, the excluded general and administrative expenses relate to amortization of the definite-livedintangible assets in the holding company, and expenses relating to Atrium Underwriters Limited ("AUL") including managing agency employeesalaries, benefits, bonuses and current year share grant costs. The excluded AUL general and administrative expenses relate to expensesincurred in managing the syndicate, and eliminated items represent Atrium 5’s share of the fees and commissions paid to AUL. We believe it is amore meaningful presentation to exclude the costs in managing the syndicate because they are principally funded by the profit commission feesearned from Syndicate 609, which is a revenue item not included in the insurance ratios.
In StarStone’s other operating expense ratio for 2016, the excluded general and administrative expenses relate to the amortization of thedefinite-lived intangible assets, recorded at the holding company level. In StarStone’s other operating expense ratio for 2015, the excluded generaland administrative expenses relate to management fee expenses charged by our Non-life Run-off segment primarily related to our costs incurred inmanaging StarStone, the amortization of the definite-lived intangible assets, and acquisition-related expenses, in each case recorded at theholding company level.
49

Table of Contents
Consolidated Results of Operations - For the Three and Six Months Ended June 30, 2016, and 2015
The following table sets forth our consolidated statements of earnings for each of the periods indicated. For a discussion of the criticalaccounting policies that affect the results of operations, see "Critical Accounting Policies" in our Annual Report on Form 10-K for the year endedDecember 31, 2015.
Three Months Ended June 30, Six Months Ended June 30,
2016 2015 2016 2015 (in thousands of U.S. dollars)INCOME
Net premiums earned $ 226,928 $ 212,023 $ 436,337 $ 410,929Fees and commission income 7,243 9,131 12,590 20,611Net investment income 54,223 34,655 114,286 65,072Net realized and unrealized gains (losses) 37,987 (11,249) 75,951 31,771Other income 4,048 11,838 6,461 15,314
330,429 256,398 645,625 543,697EXPENSES
Net incurred losses and LAE 96,462 65,900 179,680 136,036Life and annuity policy benefits 19,778 28,090 40,758 50,937Acquisition costs 46,489 37,094 93,754 71,644General and administrative expenses 105,878 93,963 200,324 190,561Interest expense 5,424 4,876 10,825 8,879Net foreign exchange losses (gains) (1,856) 2,452 (84) (2,619)
272,175 232,375 525,257 455,438EARNINGS BEFORE INCOME TAXES 58,254 24,023 120,368 88,259INCOME TAXES (8,473) (5,816) (15,982) (16,560)NET EARNINGS 49,781 18,207 104,386 71,699Less: Net earnings attributable to noncontrolling interest (9,187) (3,662) (18,272) (12,307)NET EARNINGS ATTRIBUTABLE TO ENSTAR GROUP LIMITED $ 40,594 $ 14,545 $ 86,114 $ 59,392
Highlights
Consolidated Results of Operations for the Three Months Ended June 30, 2016
• Consolidated net earnings of $40.6 million and basic and diluted earnings per share of $2.10 and $2.09, respectively
• Net earnings from Non-life Run-off and Life and Annuities segments of $25.6 million and $5.2 million, respectively
• Net premiums earned of $226.9 million, including $171.0 million and $31.8 million in our StarStone and Atrium segments
• Combined ratios of 98.2% and 100.1% for the active underwriting operations within our StarStone and Atrium segments, respectively (referto "Non-GAAP Financial Measures" above)
• Net investment income of $54.2 million and net realized and unrealized gains of $38.0 million
Consolidated Results of Operations for the Six Months Ended June 30, 2016
• Consolidated net earnings of $86.1 million and basic and diluted earnings per share of $4.46 and $4.43, respectively
• Net earnings from Non-life Run-off and Life and Annuities segments of $50.8 million and $13.5 million, respectively
50

Table of Contents
• Net premiums earned of $436.3 million, including $325.1 million and $63.7 million in our StarStone and Atrium segments
• Combined ratios of 99.0% and 97.3% for the active underwriting operations within our StarStone and Atrium segments, respectively (referto "Non-GAAP Financial Measures" above)
• Net investment income of $114.3 million and net realized and unrealized gains of $76.0 million
Consolidated Financial Condition as at June 30, 2016:
• Total investments and cash of $8,612.6 million
• Total reinsurance balances recoverable of $1,345.1 million
• Total assets of $12,659.2 million
• Shareholder's equity of $2,615.8 million and redeemable noncontrolling interest of $439.7 million
• Total gross reserves for losses and LAE of $6,433.8 million, with $1,094.3 million of net reserves assumed in our non-life run-offoperations during the six months ended June 30, 2016
• Policy benefits for life and annuity contracts of $1,286.3 million
• Diluted book value per common share of $134.68
Consolidated Overview - For the Three Months Ended June 30, 2016 and 2015
We reported consolidated net earnings attributable to Enstar Group Limited shareholders of $40.6 million for the three months endedJune 30, 2016, an increase of $26.1 million from $14.5 million for the three months ended June 30, 2015. Our comparative results were impactedby our acquisition activity during 2015, when we acquired Sussex, Wilton Re’s life settlements business, and Alpha, and by our completed lossportfolio transfer reinsurance transactions during 2016 and 2015 with Allianz SE, Reciprocal of America, Voya and Sun Life.
The most significant drivers of our consolidated financial performance during the three months ended June 30, 2016 as compared to thethree months ended June 30, 2015 included:
• Non-life Run-off - Net earnings provided by the Non-life Run-off segment for the three months ended June 30, 2016 were $25.6 millioncompared to $19.8 million for the three months ended June 30, 2015. The increase in net earnings was primarily due to improvedinvestment results, partially offset by a lower reduction in estimates of net ultimate incurred losses and higher general andadministrative expenses;
• StarStone - Net earnings attributable to the StarStone segment were $8.0 million for the three months ended June 30, 2016, comparedto net losses of $3.0 million for the three months ended June 30, 2015. This was primarily due to improved investment performanceduring the period;
• Atrium - Net earnings for the three months ended June 30, 2016 and 2015 were relatively consistent at $1.8 million and $1.4 million,respectively;
• Life and Annuities - Net earnings for the three months ended June 30, 2016 were $5.2 million compared to net losses of $3.6 million forthe three months ended June 30, 2015, with the 2016 earnings primarily due to improved investment performance during the period;
• Net Investment Income - Total net investment income was $54.2 million and $34.7 million for the three months ended June 30, 2016 and2015, respectively. The increase in net investment income was primarily attributable to a higher yield obtained on our invested assets.Net investment income for the three months ended June 30, 2016 also benefited from an increase of $7.6 million from the interest onfunds held relating to the portfolio assumed from Allianz;
• Net Realized and Unrealized Gains (Losses) - For the three months ended June 30, 2016, net realized and unrealized gains were $38.0million compared to net realized and unrealized losses of $11.2 million in 2015. This increase was primarily attributable to higher netunrealized gains in 2016 due to the increase in valuations of our fixed maturity securities as treasury yields moved lower and creditspreads tightened during the period, which was partially offset by a decrease in net realized gains in 2016;
51

Table of Contents
• Noncontrolling Interest - Noncontrolling interest in earnings is directly attributable to the results from those subsidiary companies inwhich there are either noncontrolling interests or redeemable noncontrolling interests. For the three months ended June 30, 2016 and2015, the noncontrolling interest in earnings was $9.2 million and $3.7 million, respectively, primarily reflecting improved results in theStarStone segment.
Consolidated Overview - For the Six Months Ended June 30, 2016 and 2015
We reported consolidated net earnings attributable to Enstar Group Limited shareholders of $86.1 million for the six months ended June 30,2016, an increase of $26.7 million from $59.4 million for the six months ended June 30, 2015. Our comparative results were impacted by ouracquisition activity and completed loss portfolio transfer reinsurance transactions noted above.
The most significant drivers of our consolidated financial performance during the six months ended June 30, 2016 as compared to the sixmonths ended June 30, 2015 included:
• Non-life Run-off - Net earnings provided by the Non-life Run-off segment for the six months ended June 30, 2016 and 2015 wererelatively consistent at $50.8 million and $47.1 million respectively, as improved investment results were partially offset by a lowerreduction in estimates of net ultimate incurred losses and higher general and administrative expenses;
• StarStone - Net earnings attributable to the StarStone segment were $19.6 million for the six months ended June 30, 2016, compared to$0.3 million for the six months ended June 30, 2015. This was primarily due to improved investment results during the period and someimprovement in underwriting profitability;
• Atrium - Net earnings for the six months ended June 30, 2016 were $2.3 million compared to $9.8 million for the six months endedJune 30, 2015. The current period included lower favorable prior year loss development and some large loss activity, partially offset by adecrease in general and administrative expenses;
• Life and Annuities - Net earnings for the six months ended June 30, 2016 were $13.5 million compared to $2.1 million for the six monthsended June 30, 2015. The increase was primarily due to higher net investment income in the six months ended June 30, 2016, whichincluded net earnings of $8.6 million from our life settlements business that we acquired in May 2015;
• Net Investment Income - Total net investment income was $114.3 million and $65.1 million for the six months ended June 30, 2016 and2015, respectively. Net investment income increased due to our higher average invested assets and a higher yield obtained on thoseassets. Net investment income for the six months ended June 30, 2016 also benefited from an increase in income from our lifesettlements business as well as interest on funds held of $15.2 million relating to the portfolio assumed from Allianz;
• Net Realized and Unrealized Gains (Losses) - For the six months ended June 30, 2016, net realized and unrealized gains were $76.0million compared to $31.8 million in 2015. This increase was primarily attributable to higher net unrealized gains due to the increase invaluations of our fixed maturity securities as treasury yields moved lower and credit spreads tightened during the period, which waspartially offset by a decrease in net realized gains in 2016;
• Noncontrolling Interest - Noncontrolling interest in earnings is directly attributable to the results from those subsidiary companies inwhich there are either noncontrolling interests or redeemable noncontrolling interests. For the six months ended June 30, 2016 and 2015,the noncontrolling interest in earnings was $18.3 million and $12.3 million, respectively, primarily reflecting improved results in theStarStone segment.
52

Table of Contents
Results of Operations by Segment - For the Three and Six Months Ended June 30, 2016, and 2015
We have four segments of business that are each managed, operated and reported on separately: (i) Non-life Run-off; (ii) Atrium;(iii) StarStone; and (iv) Life and Annuities. For a description of our segments, see "Item 1. Business - Operating Segments" in our Annual Reporton Form 10-K for the year ended December 31, 2015.
The below table provides a split by operating segment of the net earnings attributable to Enstar Group Limited:
Three Months Ended June 30, Six Months Ended June 30,
2016 2015 2016 2015 (in thousands of U.S. dollars)Segment split of net earnings attributable to Enstar Group Limited:
Non-life Run-off $ 25,640 $ 19,751 $ 50,772 $ 47,097Atrium 1,808 1,394 2,276 9,841StarStone 7,989 (2,992) 19,550 345Life and Annuities 5,157 (3,608) 13,516 2,109
Net earnings attributable to Enstar Group Limited $ 40,594 $ 14,545 $ 86,114 $ 59,392
The following is a discussion of our results of operations by segment.
53

Table of Contents
Non-life Run-off Segment
Our Non-Life Run-off segment comprises the operations of our subsidiaries that are running off their property and casualty and other non-life lines of business, including the run-off business of Arden Reinsurance Company Ltd. ("Arden") and StarStone. It also includes our smallermanagement business, which manages the run-off portfolios of third parties through our service companies. The following is a discussion andanalysis of the results of operations for our Non-life Run-off segment for the three and six months ended June 30, 2016, and 2015, which aresummarized below.
Three Months Ended June 30, Six Months Ended June 30,
2016 2015 Increase
(decrease) 2016 2015 Increase
(decrease) (in thousands of U.S. dollars)INCOME
Net premiums earned $ 4,476 $ 17,298 $ (12,822) $ 9,911 $ 35,790 $ (25,879)Fees and commission income 865 4,892 (4,027) 7,431 9,729 (2,298)Net investment income 37,581 18,569 19,012 73,811 37,433 36,378Net realized and unrealized gains (losses) 26,161 (4,308) 30,469 49,551 30,352 19,199Other income 2,036 9,875 (7,839) 3,836 12,915 (9,079)
71,119 46,326 24,793 144,540 126,219 18,321EXPENSES
Net incurred losses and LAE (24,690) (28,870) 4,180 (48,244) (41,970) (6,274)Acquisition costs (56) (5,871) 5,815 1,926 (7,576) 9,502General and administrative expenses 61,449 53,168 8,281 119,562 108,159 11,403Interest expense 6,016 2,826 3,190 11,496 5,346 6,150Net foreign exchange losses (gains) (3,096) (4,543) 1,447 (2,216) 595 (2,811)
39,623 16,710 22,913 82,524 64,554 17,970EARNINGS BEFORE INCOME TAXES 31,496 29,616 1,880 62,016 61,665 351INCOME TAXES (3,486) (6,104) 2,618 (8,159) (11,211) 3,052NET EARNINGS 28,010 23,512 4,498 53,857 50,454 3,403Less: Net loss (earnings) attributable tononcontrolling interest (2,370) (3,761) 1,391 (3,085) (3,357) 272NET EARNINGS ATTRIBUTABLE TO ENSTARGROUP LIMITED $ 25,640 $ 19,751 $ 5,889 $ 50,772 $ 47,097 $ 3,675
Overall Results
Three Months Ended June 30: Net earnings were $25.6 million and $19.8 million for the three months ended June 30, 2016 and 2015,respectively, an increase of $5.9 million. This was primarily due to more favorable investment results, partially offset by higher general andadministrative expenses, amongst other items.
Six Months Ended June 30: Net earnings for the six months ended June 30, 2016 and 2015 were relatively consistent period over period,as favorable investment results in 2016 were partially offset by increases in general and administrative expenses, amongst other items.
The major components of earnings are discussed below, except for investment results which are separately discussed below in"Investments."
54

Table of Contents
Net Premiums Earned:
Three Months Ended June 30, Six Months Ended June 30,
2016 2015 Increase
(decrease) 2016 2015 Increase
(decrease) (in thousands of U.S. dollars)Gross premiums written $ 7,066 $ 14,797 $ (7,731) $ 13,763 $ 24,914 $ (11,151)Ceded reinsurance premiums written (4,290) (39,590) 35,300 (5,716) (39,867) 34,151Net premiums written 2,776 (24,793) 27,569 8,047 (14,953) 23,000Gross premiums earned 9,216 53,184 (43,968) 17,163 78,157 (60,994)Ceded reinsurance premiums earned (4,740) (35,886) 31,146 (7,252) (42,367) 35,115Net premiums earned $ 4,476 $ 17,298 $ (12,822) $ 9,911 $ 35,790 $ (25,879)
Because business in this segment is in run-off, our general expectation is for premiums associated with legacy business to decline in futureperiods. However, the actual amount in any particular year will be impacted by new acquisitions during the year, and the run-off of premiums fromacquisitions completed in recent years.
Three and Six Months Ended June 30: Premiums written and earned in the three and six months ended June 30, 2016 and 2015 wereprimarily attributable to Sussex and Alpha's run-off business for the obligatory renewal of certain policies that we are in the process of placing intorun-off. The premiums earned are generally offset by net incurred losses and LAE relating to the premiums.
Fees and Commission Income:
Three and Six Months Ended June 30: Our management companies in the Non-life Run-off segment earned fees and commission incomeof $0.9 million and $4.9 million for the three months ended June 30, 2016 and 2015, respectively, and $7.4 million and $9.7 million for the sixmonths ended June 30, 2016 and 2015, respectively. While our consulting subsidiaries continue to provide management and consultancy services,claims inspection services and reinsurance collection services to third-party clients in limited circumstances, the core focus of these subsidiariesis providing in-house services to companies within the Enstar group.
Net Incurred Losses and LAE:
The following table shows the components of net incurred losses and LAE for the Non-life-Run-off segment for the three and six monthsended June 30, 2016 and 2015:
Three Months Ended June 30,
2016 2015
Prior
Periods CurrentPeriod Total
PriorPeriods
CurrentPeriod Total
(in thousands of U.S. dollars)Net losses paid $ 140,998 $ 2,058 $ 143,056 $ 155,006 $ 9,434 $ 164,440Net change in case and LAE reserves (1) (74,832) 272 (74,560) (108,819) 4,489 (104,330)Net change in IBNR reserves (1) (101,240) (1,596) (102,836) (84,581) 8,624 (75,957)Increase (reduction) in estimates of net ultimate losses (35,074) 734 (34,340) (38,394) 22,547 (15,847)Increase (reduction) in provisions for bad debt (5,184) — (5,184) (625) — (625)Increase (reduction) in provisions for unallocated LAE (6,355) (216) (6,571) (7,711) — (7,711)Amortization of fair value adjustments 21,405 — 21,405 (4,687) — (4,687)Net incurred losses and LAE $ (25,208) $ 518 $ (24,690) $ (51,417) $ 22,547 $ (28,870)
(1) Net change in case and LAE reserves comprises the movement during the period in specific case reserve liabilities as a result of claims settlements or changesadvised to us by our policyholders and attorneys, less changes in case reserves recoverable advised by us to our reinsurers as a result of the settlement ormovement of assumed claims. Net change in IBNR represents the gross change in our actuarial estimates of IBNR, less amounts recoverable.
55

Table of Contents
Six Months Ended June 30,
2016 2015
Prior
Periods CurrentPeriod Total
PriorPeriods
CurrentPeriod Total
(in thousands of U.S. dollars)Net losses paid $ 271,321 $ 4,048 $ 275,369 $ 215,695 $ 14,005 $ 229,700Net change in case and LAE reserves (1) (183,801) 456 (183,345) (118,813) 7,483 $ (111,330)Net change in IBNR reserves (1) (141,753) 1,854 (139,899) (135,020) 21,785 $ (113,235)Increase (reduction) in estimates of net ultimate losses (54,233) 6,358 (47,875) (38,138) 43,273 5,135Increase (reduction) in provisions for bad debt (6,630) — (6,630) (20,439) — (20,439)Increase (reduction) in provisions for unallocated LAE (14,590) 229 (14,361) (21,686) — (21,686)Amortization of fair value adjustments 20,622 — 20,622 (4,980) — (4,980)Net incurred losses and LAE $ (54,831) $ 6,587 $ (48,244) $ (85,243) $ 43,273 $ (41,970)
(1) Net change in case and LAE reserves comprises the movement during the period in specific case reserve liabilities as a result of claims settlements or changesadvised to us by our policyholders and attorneys, less changes in case reserves recoverable advised by us to our reinsurers as a result of the settlement ormovement of assumed claims. Net change in IBNR represents the gross change in our actuarial estimates of IBNR, less amounts recoverable.
Three Months Ended June 30: The reduction in net incurred losses and LAE for the three months ended June 30, 2016 of $24.7 millionincluded net incurred losses and LAE of $0.5 million related to current period net premiums earned of $0.5 million, primarily related to the run-offbusiness acquired with Sussex. Excluding current period net incurred losses and LAE of $0.5 million, net incurred losses and LAE liabilitiesrelating to prior periods were reduced by $25.2 million, which was attributable to a reduction in estimates of net ultimate losses of $35.1 million, areduction in provisions for bad debt of $5.2 million and a reduction in provisions for unallocated LAE of $6.4 million, relating to 2016 run-off activity,partially offset by amortization of fair value adjustments over the estimated payout period relating to companies acquired amounting to $21.4million. The reduction in provisions for bad debt of $5.2 million was a result of the collection of certain reinsurance recoverables against whichprovisions for bad debt had been provided in earlier periods.
The reduction in net incurred losses and LAE for the three months ended June 30, 2015 of $28.9 million included net incurred losses andLAE of $22.5 million related to current period net premiums earned of $17.2 million, primarily related to the run-off business acquired with Sussex.Excluding current period net incurred losses and LAE of $22.5 million, net incurred losses and LAE liabilities relating to prior periods were reducedby $51.4 million, which was attributable to a reduction in estimates of net ultimate losses of $38.4 million, a reduction in provisions for bad debt of$0.6 million, a reduction in provisions for unallocated LAE of $7.7 million, relating to 2015 run-off activity, and amortization of fair valueadjustments over the estimated payout period relating to companies acquired amounting to $4.7 million.
Six Months Ended June 30: The reduction in net incurred losses and LAE for the six months ended June 30, 2016 of $48.2 million includednet incurred losses and LAE of $6.6 million related to current period net premiums earned of $5.0 million, primarily related to the run-off businessacquired with Sussex. Excluding current period net incurred losses and LAE of $6.6 million, net incurred losses and LAE liabilities relating to priorperiods were reduced by $54.8 million, which was attributable to a reduction in estimates of net ultimate losses of $54.2 million, a reduction inprovisions for bad debt of $6.6 million and a reduction in provisions for unallocated LAE of $14.6 million, relating to 2016 run-off activity, partiallyoffset by amortization of fair value adjustments over the estimated payout period relating to companies acquired amounting to $20.6 million. Thereduction in provisions for bad debt of $6.6 million was a result of the collection of certain reinsurance recoverables against which provisions forbad debt had been provided in earlier periods.
The reduction in net incurred losses and LAE for the six months ended June 30, 2015 of $42.0 million included net incurred losses and LAEo f $43.3 million related to current period net earned premium of $35.8 million, primarily related to the run-off business acquired with Sussex.Excluding current period net incurred losses and LAE of $43.3 million, net incurred losses and LAE liabilities relating to prior periods were reducedby $85.2 million, which was attributable to a reduction in estimates of net ultimate losses of $38.1 million, reduction in provisions for bad debt of$20.4 million, a reduction in provisions for unallocated LAE liabilities of $21.7 million, relating to 2015 run-off activity, and amortization of fair valueadjustments over the estimated payout period relating to companies acquired amounting to $5.0 million.
56

Table of Contents
Acquisition Costs:
Three and Six Months Ended June 30: Acquisition costs were $(0.1) million and $(5.9) million for the three months ended June 30, 2016and 2015, respectively, and $1.9 million and $(7.6) million for the six months ended June 30, 2016 and 2015, respectively. Acquisition costs forthe three and six months ended June 30, 2016 primarily related to net premiums earned on the Alpha Insurance business that was placed into run-off, whereas the recovery in the three and six months ended June 30, 2015 related to StarStone's legacy business that was placed into run-off.
General and Administrative Expenses:
Three and Six Months Ended June 30: General and administrative expenses were $61.4 million and $53.2 million for the three monthsended June 30, 2016 and 2015, respectively, and $119.6 million and $108.2 million for the six months ended 2016 and 2015, respectively. Theincrease in general and administrative expenses was primarily related to our recent acquisitions resulting in both an increased employee headcountand certain non-recurring charges which were incurred in 2016.
Interest Expense:
Three and Six Months Ended June 30: Interest expense was $6.0 million and $2.8 million for the three months ended June 30, 2016 and2015, respectively, and $11.5 million and $5.3 million for the six months ended 2016 and 2015, respectively. The increase in interest expense wasprimarily due to the increase in loans outstanding in 2016 as a result of drawdowns for acquisitions and significant new business during 2015.
Net Foreign Exchange Losses (Gains)
Three and Six Months Ended June 30: Net foreign exchange gains were $3.1 million and $4.5 million for the three months ended June 30,2016 and 2015, respectively. We recorded net foreign exchange gains of $2.2 million compared with net foreign exchange losses of $0.6 million forthe six months ended June 30, 2016 and 2015, respectively. Refer to Item 3. Quantitative and Qualitative Disclosures About Market Risk - ForeignCurrency Risk" of this Quarterly Report for further information regarding our foreign currency exposures, how we manage them, and recent actionstaken to hedge certain net exposures denominated in Euros, Canadian dollars and Australian dollars.
Noncontrolling Interest:
Three and Six Months Ended June 30: There was no significant change in noncontrolling interests. Noncontrolling interest in earnings ofour Non-life Run-off segment was $2.4 million and $3.8 million for the three months ended June 30, 2016 and 2015, respectively, and $3.1 millionand $3.4 million for the six months ended June 30, 2016 and 2015, respectively. During the year ended December 31, 2015, the number ofsubsidiaries in this segment with a noncontrolling interest decreased from 7 as at December 31, 2014 to 2 as at December 31, 2015 due primarilyto the repurchases made during 2015 as described in "Item 1. Business - Other Transactions" in our Annual Report on Form 10-K for the yearended December 31, 2015.
57

Table of Contents
Atrium Segment
The Atrium segment includes Atrium 5 Ltd. ("Atrium 5"), AUL, Northshore Holdings Limited ("Holding Company"), and an allocation offinancing costs up until December 31, 2015 ("Enstar Specific Expenses"). Atrium 5 results represent its proportionate share of the results ofSyndicate 609 for which it provides 25% of the underwriting capacity and capital. AUL results largely represent fees charged to Syndicate 609 anda 20% profit commission on the results of the syndicate less general and administrative expenses incurred in managing the syndicate. AUL alsoincludes other Atrium Group non-syndicate fee income and associated expenses. The Holding Company results include the amortization ofintangible assets that were fair valued upon acquisition and Enstar Specific Expenses represent our acquisition financing costs.
The following is a discussion and analysis of the results of operations for our Atrium segment for the three and six months ended June 30,2016 and 2015, which are summarized below.
Three Months Ended June 30, Six Months Ended June 30,
2016 2015 Increase
(decrease) 2016 2015 Increase
(decrease) (in thousands of U.S. dollars)INCOME
Net premiums earned $ 31,758 $ 33,957 $ (2,199) $ 63,669 $ 67,829 $ (4,160)Fees and commission income 6,378 7,457 (1,079) 10,210 16,985 (6,775)Net investment income 635 523 112 1,189 1,030 159Net realized and unrealized gains 68 38 30 108 129 (21)Other income 65 76 (11) 99 154 (55)
38,904 42,051 (3,147) 75,275 86,127 (10,852)EXPENSES
Net incurred losses and LAE 17,133 13,757 3,376 32,722 20,777 11,945Acquisition costs 11,240 12,301 (1,061) 22,327 21,707 620General and administrative expenses 6,629 6,670 (41) 13,037 18,293 (5,256)Interest expense — 1,482 (1,482) — 2,965 (2,965)Net foreign exchange losses (gains) 256 2,213 (1,957) 2,071 (302) 2,373
35,258 36,423 (1,165) 70,157 63,440 6,717EARNINGS BEFORE INCOME TAXES 3,646 5,628 (1,982) 5,118 22,687 (17,569)INCOME TAXES (580) (2,252) 1,672 (1,258) (4,136) 2,878NET EARNINGS 3,066 3,376 (310) 3,860 18,551 (14,691)Less: Net earnings attributable to noncontrollinginterest (1,258) (1,982) 724 (1,584) (8,710) 7,126NET EARNINGS ATTRIBUTABLE TO ENSTARGROUP LIMITED $ 1,808 $ 1,394 $ 414 $ 2,276 $ 9,841 $ (7,565)
Overall Results
An analysis of the components of the segment's net earnings is shown below, after the attribution of net earnings to noncontrolling interest.
58

Table of Contents
Three Months Ended June 30, Six Months Ended June 30,
2016 2015 Increase
(decrease) 2016 2015 Increase
(decrease) (in thousands of U.S. dollars)Atrium 5 $ 415 $ 790 $ (375) $ 742 $ 9,580 $ (8,838)AUL 1,598 3,494 (1,896) 2,129 5,019 (2,890)
Atrium Total 2,013 4,284 (2,271) 2,871 14,599 (11,728)Holding Company (205) (1,408) 1,203 (595) (1,793) 1,198Enstar Specific Expenses — (1,482) 1,482 — (2,965) 2,965NET EARNINGS ATTRIBUTABLE TOENSTAR GROUP LIMITED $ 1,808 $ 1,394 $ 414 $ 2,276 $ 9,841 $ (7,565)
Net earnings shown above excludes unrealized investment gains (losses) and foreign currency translation adjustments relating to Atrium'savailable-for-sale investments, which are recognized in accumulated other comprehensive income. After attribution to noncontrolling interests,these amounts were a loss of $(0.2) million and a gain of $3.0 million for the three and six months ended June 30, 2016, respectively, and a gainof $2.0 million and a loss of $(0.8) million for the three and six months ended June 30, 2015, respectively.
Underwriting Performance
In evaluating the underwriting performance of the Atrium segment, we consider the insurance ratios of Atrium 5, which is the activeunderwriting component of the segment and excludes AUL and the Holding Company. Atrium 5's insurance ratios are shown below.
Three Months Ended June 30, Six Months Ended June 30,
2016 2015 (Favorable)Unfavorable 2016 2015
(Favorable)Unfavorable
Loss ratio (1) 53.6% 35.8% 17.8 % 51.2% 28.3% 22.9 %Acquisition cost ratio (1) 34.4% 36.2% (1.8)% 34.6% 32.0% 2.6 %Other operating expense ratio (1) 12.1% 17.1% (5.0)% 11.5% 16.0% (4.5)%Combined ratio (1) 100.1% 89.1% 11.0 % 97.3% 76.3% 21.0 %
(1) Refer to "Non-GAAP Financial Measures" for a description of how these ratios are calculated. The ratios are based upon the following amounts for Atrium 5, whichexclude amounts for AUL and the Holding Company, for the three months ended June 30, 2016 and 2015, respectively: net premiums earned of $31,758 and $33,957,net incurred losses and LAE of $17,020 and $12,162, acquisition costs of $10,935 and $12,300, and other operating expenses of $3,830 and $5,797. The ratios arebased upon the following amounts for Atrium 5, which exclude amounts for AUL and the Holding Company, for the six months ended June 30, 2016 and 2015,respectively: net premiums earned of $63,669 and $67,829, net incurred losses and LAE of $32,570 and $19,181, acquisition costs of $22,022 and $21,707, and otheroperating expenses of $7,295 and $10,835.
The higher combined ratio of Atrium 5 for the three and six months ended June 30, 2016 as compared to the three and six months endedJune 30, 2015 was due to an increase in the net loss ratio, partially offset by a lower operating expense ratio. This was primarily attributable tolower favorable prior year loss development in the three and six months ended June 30, 2016 as compared to the three and six months endedJune 30, 2015, and a series of large losses in 2016. The 2016 large losses included earthquakes in Taiwan, Ecuador and Japan; flooding inEurope; wildfires in Canada and hailstorms in the United States.
The decrease in the AUL result in the three and six months ended June 30, 2016 as compared to the three and six months ended June 30,2015 reflects decreased profit commission earned from the results of Syndicate 609.
Holding Company Expenses and Enstar Specific Expenses are included below under "General and Administrative Expenses" and "InterestExpense", respectively.
Investment results are separately discussed below in "Investments."
59

Table of Contents
Gross Premiums Written:
The following table provides gross premiums written by line of business for the Atrium segment for the three and six months ended June 30,2016 and 2015:
Three Months Ended June 30, Six Months Ended June 30,
2016 2015 Increase
(decrease) 2016 2015 Increase
(decrease) (in thousands of U.S. dollars)Marine $ 5,179 $ 4,481 $ 698 $ 9,347 $ 11,598 $ (2,251)Property and Casualty Binding Authorities 9,298 7,909 1,389 18,976 16,221 2,755Upstream Energy 3,613 3,529 84 6,484 8,440 (1,956)Reinsurance 3,642 3,441 201 10,029 11,653 (1,624)Accident and Health 3,335 2,348 987 7,603 7,244 359Non-Marine Direct and Facultative 4,653 4,580 73 8,566 8,412 154Liability 4,787 5,092 (305) 10,055 10,355 (300)Aviation 542 1,538 (996) 3,221 4,901 (1,680)War and Terrorism 2,732 2,868 (136) 5,018 5,875 (857)Total $ 37,781 $ 35,786 $ 1,995 $ 79,299 $ 84,699 $ (5,400)
See below for a discussion of the drivers of the change in net premiums earned for the three and six months ended June 30, 2016 and 2015.
Net Premiums Earned:
The following table provides net premiums earned by line of business for the Atrium segment for the three and six months ended June 30,2016 and 2015:
Three Months Ended June 30, Six Months Ended June 30,
2016 2015 Increase
(decrease) 2016 2015 Increase
(decrease) (in thousands of U.S. dollars)Marine $ 4,079 $ 4,847 $ (768) $ 7,979 $ 10,032 $ (2,053)Property and Casualty BindingAuthorities 8,296 7,336 960 16,807 14,318 2,489Upstream Energy 2,573 3,569 (996) 4,687 7,312 (2,625)Reinsurance 3,174 3,270 (96) 5,953 6,382 (429)Accident and Health 3,313 2,915 398 6,468 6,130 338Non-Marine Direct and Facultative 3,106 3,570 (464) 6,674 7,196 (522)Liability 4,030 4,970 (940) 8,948 9,358 (410)Aviation 1,102 1,494 (392) 2,393 3,262 (869)War and Terrorism 2,085 1,986 99 3,760 3,839 (79)Total $ 31,758 $ 33,957 $ (2,199) $ 63,669 $ 67,829 $ (4,160)
Three and Six Months Ended June 30: Net premiums earned for the Atrium segment were $31.8 million and $34.0 million for the threemonths ended June 30, 2016 and 2015, respectively. Net premiums earned for the Atrium segment were $63.7 million and $67.8 million for the sixmonths ended June 30, 2016 and 2015, respectively. The decrease in net premiums earned was due to our underwriting discipline to non-renewcertain business that no longer met our underwriting standards, particularly in the marine and upstream energy lines. We are seeing continuedpressure on premium rates and terms and conditions due to overcapacity in many markets for insurable risks. We continue to focus on riskselection and underwriting for profitability. These premium decreases were partially offset by the increase in the property and casualty bindingauthority line, which reflects the continued success of AU Gold, Atrium's proprietary online underwriting platform.
Fees and Commission Income:
Three and Six Months Ended June 30: Fees and commission income were $6.4 million and $7.5 million for the three months endedJune 30, 2016 and 2015, respectively, and $10.2 million and $17.0 million for the six months
60

Table of Contents
ended June 30, 2016 and 2015, respectively. The fees primarily represent profit commission fees earned by us in relation to AUL’s management ofSyndicate 609 and other underwriting consortiums. The decrease was due primarily to less profit commission on lower syndicate profits in thethree and six months ended June 30, 2016 as compared with the three and six months ended June 30, 2015.
Net Incurred Losses and LAE:
Three Months Ended June 30: Net incurred losses and LAE for the three months ended June 30, 2016 and 2015 were $17.1 million and$13.8 million, respectively. Net favorable prior year loss development for the three months ended June 30, 2016 and 2015 was $3.5 million and$4.2 million, respectively. Net favorable prior year loss development in the three months ended June 30, 2016 was spread across most lines ofbusiness. Net favorable prior year loss development in the three months ended June 30, 2015 primarily related to the professional indemnity, hull,upstream energy and non-marine direct and facultative lines of business. Excluding prior year loss development, net incurred losses and LAE forthe three months ended June 30, 2016 and 2015 were $20.5 million and $18.0 million, respectively. The increase in net incurred losses and LAE,excluding prior year loss development, was due to the large losses in 2016, as discussed above in "Underwriting Performance", compared to alower level of losses in 2015.
Six Months Ended June 30: Net incurred losses and LAE for the six months ended June 30, 2016 and 2015 were $32.7 million and $20.8million, respectively. Net favorable prior year loss development for the six months ended June 30, 2016 and 2015 was $4.1 million and $13.2million, respectively. Net favorable prior year loss development in the six months ended June 30, 2016 primarily related to the non-marine directand facultative lines of business. Net favorable prior year loss development in the six months ended June 30, 2015 primarily related to theaviation, marine, upstream energy and non-marine direct and facultative lines of business. Excluding prior year loss development, net incurredlosses and LAE for the six months ended June 30, 2016 and 2015 were $36.8 million and $34.0 million, respectively. The increase in net incurredlosses and LAE, excluding prior year loss development, was due to the large losses in 2016 as described above, and other notable 2016 losses inthe war and terrorism and aviation lines, compared to a lower level of losses in 2015.
Acquisition Costs:
Three and Six Months Ended June 30: Acquisition costs were $11.2 million and $12.3 million for the three months ended June 30, 2016and 2015, respectively, and $22.3 million and $21.7 million for the six months ended June 30, 2016 and 2015, respectively. The Atrium 5acquisition cost ratios for the three months ended June 30, 2016 and 2015 were 34.4% and 36.2%, respectively, a decrease of 2.2%. The Atrium 5acquisition cost ratios for the six months ended June 30, 2016 and 2015 were 34.6% and 32.0%, respectively, an increase of 2.6%. The increasefor the six months ended June 30, 2016 was due to higher profit commissions payable on certain underlying business that performed well.
General and Administrative Expenses:
Three and Six Months Ended June 30: General and administrative expenses for the Atrium segment were relatively consistent at $6.6million and $6.7 million for the three months ended June 30, 2016 and 2015, respectively. General and administrative expenses for the Atriumsegment were $13.0 million and $18.3 million for the six months ended June 30, 2016 and 2015, respectively. The decrease of $5.3 million wasprimarily due to lower bonus accruals resulting from lower net earnings in the six months ended June 30, 2016 as compared to the six monthsended June 30, 2015, and more compensation costs allocated to Syndicate 609.
Interest Expense:
Three and Six Months Ended June 30: For the three and six months ended June 30, 2016, interest was no longer incurred by the Atriumsegment. Interest expense was $1.5 million and $3.0 million for the three and six months ended June 30, 2015, respectively. The interest expensefor the three and six months ended June 30, 2015 was in respect of borrowings under the Enstar revolving credit facility, which was an EnstarSpecific Expense.
Noncontrolling Interest:
Three and Six Months Ended June 30: Noncontrolling interest in earnings of the Atrium segment was $1.3 million and $2.0 million for thethree months ended June 30, 2016 and 2015, respectively. Noncontrolling interest in earnings of the Atrium segment was $1.6 million and $8.7million for the six months ended June 30, 2016 and 2015, respectively. As of June 30, 2016 and 2015, Trident and Dowling had a combined41.03% noncontrolling interest in the Atrium segment, although their share of net earnings for the three and six months ended June 30, 2015 washigher due primarily to the interest expense recorded in the segment, which was an Enstar specific expense.
61

Table of Contents
StarStone Segment
The results of our StarStone segment include the results of StarStone Insurance Bermuda Limited and its subsidiaries ("StarStone") andStarStone Specialty Holdings Limited ("Holding Company"), which was formerly known as Bayshore Holdings Limited. StarStone results representits active underwriting operations. The Holding Company's results include the amortization of fair value adjustments such as for intangible assetsthat were fair valued upon acquisition, and other expenses incurred.
The following is a discussion and analysis of the results of operations for the StarStone segment for the three and six months endedJune 30, 2016 and 2015, which are summarized below.
Three Months Ended June 30, Six Months Ended June 30,
2016 2015 Increase
(decrease) 2016 2015 Increase
(decrease) (in thousands of U.S. dollars)INCOME
Net premiums earned $ 171,035 $ 137,696 $ 33,339 $ 325,117 $ 261,318 $ 63,799Fee and commission income — — — — 14 (14)Net investment income 5,753 4,058 1,695 11,033 6,189 4,844Net realized and unrealized gains (losses) 8,021 (3,355) 11,376 22,370 1,347 21,023Other income 1,584 1,303 281 1,595 1,366 229
186,393 139,702 46,691 360,115 270,234 89,881EXPENSES
Net incurred losses and LAE 104,019 81,013 23,006 195,202 157,229 37,973Acquisition costs 32,518 27,365 5,153 64,578 51,508 13,070General and administrative expenses 31,311 32,891 (1,580) 61,466 63,104 (1,638)Net foreign exchange losses (gains) 1,027 4,200 (3,173) (272) (2,180) 1,908
168,875 145,469 23,406 320,974 269,661 51,313EARNINGS (LOSSES) BEFORE INCOMETAXES 17,518 (5,767) 23,285 39,141 573 38,568INCOME TAXES (3,970) 694 (4,664) (5,988) 12 (6,000)NET EARNINGS 13,548 (5,073) 18,621 33,153 585 32,568Less: Net earnings (losses) attributable tononcontrolling interest (5,559) 2,081 (7,640) (13,603) (240) (13,363)NET EARNINGS (LOSSES) ATTRIBUTABLE TOENSTAR GROUP LIMITED $ 7,989 $ (2,992) $ 10,981 $ 19,550 $ 345 $ 19,205
Overall Results
An analysis of the components of the segment's net earnings is shown below, after the attribution of net earnings to noncontrolling interest.
Three Months Ended June 30, Six Months Ended June 30,
2016 2015 Increase
(decrease) 2016 2015 Increase
(decrease) (in thousands of U.S. dollars)StarStone(1) $ 7,712 $ 826 $ 6,886 $18,975 $5,723 $13,252Holding Company 277 (3,818) 4,095 575 (5,378) 5,953NET EARNINGS (LOSSES) ATTRIBUTABLE TOENSTAR GROUP LIMITED $ 7,989 $ (2,992) $ 10,981 $19,550 $ 345 $19,205
(1) StarStone's net earnings before noncontrolling interest were $13.1 million and $32.2 million for three and six months ended June 30, 2016, respectively, and $1.4 millionand $9.7 million for the three and six months ended June 30, 2015, respectively.
62

Table of Contents
Three Months Ended June 30: Net earnings (losses) were $8.0 million and ($3.0) million for the three months ended June 30, 2016 and2015, respectively, an increase of $11.0 million. This was primarily due to an increase of $11.4 million in net realized and unrealized gains (losses)in the three months ended June 30, 2016 as compared to the three months ended June 30, 2015. Investment results are separately discussedbelow in "Investments."
Six Months Ended June 30: Net earnings were $19.6 million and $0.3 million for the six months ended June 30, 2016 and 2015,respectively, an increase of $19.2 million. This was primarily due to an increase of $21.0 million in net realized and unrealized gains (losses) in thesix months ended June 30, 2016 as compared to the six months ended June 30, 2015.
StarStone has not been significantly impacted by the catastrophe and weather events in the second quarter. We are maintaining our focus ondisciplined underwriting, expense rationalization, improvements to operational infrastructure and delivering on our brand.
The Holding Company result comprises the amortization of definite-lived intangible assets and some general and administrative expenses.
Underwriting Performance
In evaluating the underwriting performance of the StarStone segment, we consider the insurance ratios of StarStone, which is the activeunderwriting component of the segment and excludes the Holding Company. StarStone's insurance ratios are shown below.
Three Months Ended June 30, Six Months Ended June 30,
2016 2015 (Favorable)Unfavorable 2016 2015
(Favorable)Unfavorable
Loss ratio (1) 60.9% 59.0% 1.9 % 60.6% 60.0% 0.6 %Acquisition cost ratio (1) 19.0% 19.8% (0.8)% 19.9% 19.5% 0.4 %Other operating expense ratio (1) 18.3% 19.3% (1.0)% 18.5% 21.0% (2.5)%Combined ratio (1) 98.2% 98.1% 0.1 % 99.0% 100.5% (1.5)%
(1) Refer to "Non-GAAP Financial Measures" for a description of how these ratios are calculated. The ratios are based upon the following amounts for StarStone, whichexclude Holding Company amounts, for the three months ended June 30, 2016 and 2015, respectively: net premiums earned of $171,172 and $138,064, net incurredlosses and LAE of $104,232 and $81,507, acquisition costs of $32,518 and $27,365, and other operating expenses of $31,390 and $26,604.The ratios are basedupon the following amounts for StarStone, which exclude Holding Company amounts, for the six months ended June 30, 2016 and 2015, respectively: net premiumsearned of $324,669 and $263,737, net incurred losses and LAE of $196,660 and $158,265, acquisition costs of $64,578 and $51,508, and other operating expensesof $60,121 and $55,429.
Three Months Ended June 30: The combined ratio was consistent for the three months ended June 30, 2016 as compared to the threemonths ended June 30, 2015, reflecting an overall increase of 0.1% comprised of an increase in the loss ratio offset by lower acquisition cost andoperating expense ratios. The increase in the loss ratio was primarily due to writing a higher proportion of workers’ compensation business andutilizing higher planned loss ratios across most classes of business, which reflected continued pressure on premium rates and terms andconditions.
Six Months Ended June 30: The combined ratio improved by 1.5% for the six months ended June 30, 2016 as compared to the six monthsended June 30, 2015, primarily due to a reduction in the other operating expense ratio of 2.5% as a result of an increase in net premiums earnedwhilst we maintained a relatively consistent expense base.
63

Table of Contents
Gross Premiums Written:
The following table provides gross premiums written by line of business for the StarStone segment for the three and six months endedJune 30, 2016 and 2015:
Three Months Ended June 30, Six Months Ended June 30,
2016 2015 Increase
(decrease) 2016 2015 Increase
(decrease) (in thousands of U.S. dollars)Casualty $ 66,229 $ 61,934 $ 4,295 $ 133,541 $ 121,756 $ 11,785Marine 42,987 30,319 12,668 112,364 87,956 24,408Property 61,980 103,017 (41,037) 103,978 139,295 (35,317)Aerospace 14,421 26,093 (11,672) 25,876 37,210 (11,334)Workers' Compensation 37,751 19,694 18,057 64,652 45,537 19,115Total $ 223,368 $ 241,057 $ (17,689) $ 440,411 $ 431,754 $ 8,657
Three Months Ended June 30: Gross premiums written were $223.4 million and $241.1 million for the three months ended June 30, 2016and 2015, respectively, a decrease of $17.7 million. Premiums written in the property and aerospace lines decreased by $41.0 million and $11.7million, respectively. Premiums written in the property line were higher in 2015 due to an initial assumption of in-force unearned premium of $31.0million under quota share agreements with Sussex upon its acquisition. The decrease in aerospace was due to our decision in the third quarter of2015 to cease writing space business. The casualty, marine and workers’ compensation lines of business continued to grow, increasing by $4.3million, $12.7 million and $18.1 million, respectively, as we continued to selectively underwrite certain specialty products and expand ourdistribution in these lines of business.
Six Months Ended June 30: Gross premiums written were $440.4 million and $431.8 million for the six months ended June 30, 2016 and2015, respectively, an increase of $8.7 million. Premiums written in the casualty, marine and workers' compensation lines increased by $11.8million, $24.4 million and $19.1 million, respectively, as a result of selective growth in new business, partly due to new business underwritten byteams of underwriters we hired in late 2015. This was partially offset by the decreases in the property and aerospace lines of $35.3 million and$11.3 million, respectively, for the reasons noted in the three month discussion above.
Net Premiums Earned:
The following table provides net premiums earned by line of business for the StarStone segment for the three and six months endedJune 30, 2016 and 2015:
Three Months Ended June 30, Six Months Ended June 30,
2016 2015 Increase
(decrease) 2016 2015 Increase
(decrease) (in thousands of U.S. dollars)Casualty $ 60,341 $ 42,996 $ 17,345 $ 108,750 $ 83,141 $ 25,609Marine 40,246 28,240 12,006 74,235 52,104 22,131Property 32,049 30,066 1,983 66,140 53,910 12,230Aerospace 16,207 16,314 (107) 33,614 35,636 (2,022)Workers' Compensation 22,192 20,080 2,112 42,378 36,527 5,851Total $ 171,035 $ 137,696 $ 33,339 $ 325,117 $ 261,318 $ 63,799
Three Months Ended June 30: Net premiums earned for the StarStone segment for the three months ended June 30, 2016 increased from2015 by $33.3 million to $171.0 million. The lines of business driving the increase were casualty and marine, which is consistent with theincreases in premiums written for these lines. The modest growth in workers’ compensation net premiums earned in comparison to the growth ingross premiums written is due to ceded reinsurance premium as we manage the amount of risk we retain on this business.
64

Table of Contents
Six Months Ended June 30: Net premiums earned for the StarStone segment for the six months ended June 30, 2016 increased from 2015by $63.8 million to $325.1 million. The lines of business driving the increase were primarily casualty and marine.
Net Incurred Losses and LAE:
Three Months Ended June 30: Net incurred losses and LAE for the three months ended June 30, 2016 and 2015 were $104.0 million and$81.0 million, respectively, an increase of $23.0 million. The increase was primarily attributable to the increase in net premiums earned. Netfavorable prior year loss development for the three months ended June 30, 2016 and 2015 was $1.5 million and $0.3 million, respectively. The lossratio for the three months ended June 30, 2016 increased by 1.9% to 60.9%, driven by increases in the marine, property and workers’compensation lines of business.
Six Months Ended June 30: Net incurred losses and LAE for the six months ended June 30, 2016 and 2015 were $195.2 million and $157.2million, respectively, an increase of $38.0 million. The increase was primarily attributable to the increase in net premiums earned. Net favorableprior year loss development for the six months ended June 30, 2016 and 2015 was $3.5 million and $1.5 million, respectively. The loss ratios forthe six months ended June 30, 2016 and 2015 were relatively consistent at 60.6% and 60.0%, respectively; the increase of 0.6% was primarily inrespect of the marine, property and workers’ compensation lines of business.
Acquisition Costs:
Three Months Ended June 30: Acquisition costs were $32.5 million and $27.4 million for the three months ended June 30, 2016 and 2015,respectively, an increase of $5.1 million. The increase was primarily attributable to the increase in net premiums earned. The acquisition costratios for the three months ended June 30, 2016 and 2015 were 19.0% and 19.8%, respectively, a decrease of 0.8% reflecting a change in the mixof business.
Six Months Ended June 30: Acquisition costs were $64.6 million and $51.5 million for the six months ended June 30, 2016 and 2015,respectively, an increase of $13.1 million. The increase was primarily attributable to the increase in net premiums earned. The acquisition costratios for the six months ended June 30, 2016 and 2015 were 19.9% and 19.5%, respectively, an increase of 0.4% reflecting a change in the mixof business.
General and Administrative Expenses:
Three and Six Months Ended June 30: General and administrative expenses for the three months ended June 30, 2016 and 2015 were$31.3 million and $32.9 million, respectively. General and administrative expenses for the six months ended June 30, 2016 and 2015 were $61.5million and $63.1 million, respectively. The decrease of $1.6 million for the three and six months ended June 30, 2016 compared with 2015 wasprimarily related to lower professional and consulting fees, partially offset by higher accruals for long-term equity-based compensation awards dueto an increase in the share price during the year.
Noncontrolling Interest:
Three Months Ended June 30: Noncontrolling interest in earnings (loss) of the StarStone segment was $5.6 million and ($2.1) million forthe three months ended June 30, 2016 and 2015, respectively. The increase was due to higher net earnings before noncontrolling interest for thethree months ended June 30, 2016 compared with a net loss before noncontrolling interest for the three months ended June 30, 2015.
Six Months Ended June 30: Noncontrolling interest in earnings of the StarStone segment was $13.6 million and $0.2 million for the sixmonths ended June 30, 2016 and 2015, respectively. The increase was due to higher net earnings before noncontrolling interest for the six monthsended June 30, 2016 compared with the six months ended June 30, 2015. As of June 30, 2016 and 2015, Trident and Dowling had a combined41.03% noncontrolling interest in the StarStone segment.
65

Table of Contents
Life and Annuities Segment
For our Life and Annuities segment, our run-off strategy differs from the non-life run-off business, in particular because we have limitedability to shorten the duration of the liabilities in this business through either early claims settlement, commutations or policy buy-backs. Instead,we will hold the policies associated with the life and annuities business to their natural maturity or lapse and will pay claims as they fall due.
The following is a discussion and analysis of our results of operations for our Life and Annuities segment for the three and six months endedJune 30, 2016 and 2015, which are summarized below.
Three Months Ended June 30, Six Months Ended June 30,
2016 2015 Increase
(decrease) 2016 2015 Increase
(decrease) (in thousands of U.S. dollars)INCOME
Net premiums earned $ 19,659 $ 23,072 $ (3,413) $ 37,640 $ 45,992 $ (8,352)Net investment income 11,113 11,577 (464) 29,534 20,652 8,882Net realized and unrealized gains (losses) 3,737 (3,624) 7,361 3,922 (57) 3,979Other income 363 584 (221) 931 879 52
34,872 31,609 3,263 72,027 67,466 4,561EXPENSES
Life and annuity policy benefits 19,778 28,090 (8,312) 40,758 50,937 (10,179)Acquisition costs 2,804 3,299 (495) 5,206 6,005 (799)General and administrative expenses 6,467 4,452 2,015 11,027 7,122 3,905Interest expense 272 640 (368) 610 800 (190)Net foreign exchange losses (gains) (43) 582 (625) 333 (732) 1,065
29,278 37,063 (7,785) 57,934 64,132 (6,198)EARNINGS (LOSS) BEFORE INCOME TAXES 5,594 (5,454) 11,048 14,093 3,334 10,759INCOME TAXES (437) 1,846 (2,283) (577) (1,225) 648NET EARNINGS (LOSS) ATTRIBUTABLE TOENSTAR GROUP LIMITED $ 5,157 $ (3,608) $ 8,765 $ 13,516 $ 2,109 $ 11,407
Overall Results:
Three Months Ended June 30: Net earnings (loss) were $5.2 million and ($3.6) million for the three months ended June 30, 2016 and 2015,respectively, an increase of $8.8 million. The increase was primarily due to an increase of $7.4 million in net realized and unrealized gain (losses).Investment results are separately discussed below in "Investments." The remaining $1.4 million increase was due to lower policy benefits andincome taxes, offset by less premium earned and higher general and administrative expenses.
Six Months Ended June 30: Net earnings were $13.5 million and $2.1 million for the six months ended June 30, 2016 and 2015,respectively, an increase of $11.4 million. The increase was primarily due to higher net investment income in the six months ended June 30, 2016,including $8.6 million of net earnings from the life settlements business, acquired by us from Wilton Re Limited in May 2015. Life settlementsincome was comprised of $10.0 million from policy maturity events, offset by expenses of $1.4 million.
66

Table of Contents
Net Premiums Earned:
A summary of our net premiums earned by type of major product is below. In general, net premiums earned are expected to reduce atapproximately 15% to 20% per annum as we run-off this business.
Three Months Ended June 30, Six Months Ended June 30,
2016 2015 Increase
(decrease) 2016 2015 Increase
(decrease) (in thousands of U.S. dollars)Term life insurance $ 7,426 $ 6,491 $ 935 $ 15,050 $ 13,354 $ 1,696Assumed life reinsurance 4,992 5,511 (519) 8,863 9,951 (1,088)Credit life and disability 7,241 11,070 (3,829) 13,727 22,687 (8,960) $ 19,659 $ 23,072 $ (3,413) $ 37,640 $ 45,992 $ (8,352)
Three Months Ended June 30: Net premiums earned were $19.7 million and $23.1 million for the three months ended June 30, 2016 and2015, respectively. The decrease in credit life and disability premiums of $3.9 million included a decrease of $2.3 million related to our strategicdecision to utilize the cancellation option on certain credit products in the third quarter of 2015. Net premiums earned in term life insuranceincluded $1.1 million related to Alpha Insurance for the three months ended June 30, 2016. We acquired Alpha Insurance in November 2015.
Six Months Ended June 30: Net premiums earned were $37.6 million and $46.0 million for the six months ended June 30, 2016 and 2015,respectively. The decrease in credit life and disability premiums of $9.0 million included a decrease of $5.0 million in the six months ended June30, 2016 related to our strategic decision to utilize the cancellation option on certain credit products in the third quarter of 2015. Net premiumsearned in term life insurance included $2.3 million related to Alpha Insurance for the six months ended June 30, 2016, which was offset by reducedpremium in other life businesses.
Life and Annuity Policy Benefits:
Three Months Ended June 30, Six Months Ended June 30,
2016 2015 Increase
(decrease) 2016 2015 Increase
(decrease) (in thousands of U.S. dollars)Annuity benefits paid $ 10,398 $ 10,516 $ (118) $ 20,954 $ 21,714 $ (760)Life and disability benefits paid 18,001 22,118 (4,117) 38,460 42,530 (4,070)Total benefits paid 28,399 32,634 (4,235) 59,414 64,244 (4,830)Change in annuity benefit reserves (866) (3,333) 2,467 (4,927) (8,162) 3,235Change in life and disability reserves (9,679) (3,884) (5,795) (17,388) (10,360) (7,028)Amortization of fair value adjustments 1,924 2,673 (749) 3,659 5,215 (1,556)Total change in reserves (8,621) (4,544) (4,077) (18,656) (13,307) (5,349)Life and annuity policy benefits $ 19,778 $ 28,090 $ (8,312) $ 40,758 $ 50,937 $ (10,179)
Three Months Ended June 30: Life and annuity policy benefits were $19.8 million and $28.1 million for the three months ended June 30,2016 and 2015, respectively. The decrease of $8.3 million is consistent with the run-off of policyholders in both the annuity and life business, andwas primarily comprised of a decrease in life and disability policy benefits of $9.9 million, partially offset by an increase in annuity policy benefitsof $2.3 million.
Annuity policy benefits increased by $2.3 million for the three months ended June 30, 2016 as compared with the three months ended June30, 2015. Annuity policy benefits during the three months ended June 30, 2016 were $9.5 million, comprised of benefits paid of $10.4 millionpartially offset by a reduction in reserves of $0.9 million. Annuity policy benefits during the three months ended June 30, 2015 were $7.2 million,comprised of benefits paid of $10.5 million partially offset by a reduction in reserves of $3.3 million.
Life and disability policy benefits decreased by $9.9 million for the three months ended June 30, 2016 as compared with the three monthsended June 30, 2015. Life and disability policy benefits during the three months ended June 30, 2016 were $8.3 million, comprised of benefits paidof $18.0 million, partially offset by a reduction in reserves of $9.7 million. Life and disability policy benefits during the three months ended June 30,2015 were $18.2 million, comprised
67

Table of Contents
of benefits paid of $22.1 million, partially offset by a reduction in reserves of $3.9 million. The decrease in life and disability policy benefits from2015 to 2016 was primarily because of a decrease in premiums earned, as well as the cancellation of certain credit products, partially offset byclaims relating to Alpha Insurance, which were not included in the comparative period.
Six Months Ended June 30: Life and annuity policy benefits were $40.8 million and $50.9 million for the six months ended June 30, 2016and 2015, respectively. The decrease of $10.2 million is consistent with the run-off of policyholders in both the annuity and life business, and wasprimarily comprised of a decrease in life and disability policy benefits of $11.1 million, partially offset by an increase in annuity policy benefits of$2.5 million.
Annuity policy benefits decreased by $2.5 million for the six months ended June 30, 2016 as compared with the six months ended June 30,2015. Annuity policy benefits during the six months ended June 30, 2016 were $16.0 million, comprised of benefits paid of $20.9 million, partiallyoffset by a reduction in reserves of $4.9 million. Annuity policy benefits during the six months ended June 30, 2015 were $13.6 million, comprisedof benefits paid of $21.7 million, partially offset by a reduction in reserves of $8.2 million.
Life and disability policy benefits decreased by $11.1 million for the six months ended June 30, 2016 as compared with the six monthsended June 30, 2015. Life and disability policy benefits during the six months ended June 30, 2016 were $21.1 million, comprised of benefits paidof $38.5 million, partially offset by a reduction in reserves of $17.4 million. Life and disability policy benefits during the six months ended June 30,2015 were $32.2 million, comprised of benefits paid of $42.5 million, partially offset by a reduction in reserves of $10.4 million. The decrease in lifeand disability policy benefits from 2015 to 2016 was primarily as a result of a decrease in premiums earned, as well as the cancellation of certaincredit products, offset by claims relating to Alpha Insurance, which were not included in the comparative period.
Acquisition Costs:
Three Months Ended June 30: Acquisition costs for the three months ended June 30, 2016 and 2015 were $2.8 million and $3.3 million,respectively. In the three months ended June 30, 2016, the commissions on credit business were lower by $0.7 million, partially offset by $0.2million of commissions on the Alpha Insurance business.
Six Months Ended June 30: Acquisition costs for the six months ended June 30, 2016 and 2015 were $5.2 million and $6.0 million,respectively. In the six months ended June 30, 2016, the commissions on credit business were lower by $1.2 million, partially offset by $0.3million of commissions on the Alpha Insurance business.
General and Administrative Expenses:
Three Months Ended June 30: General and administrative expenses were $6.5 million and $4.5 million for the three months ended June 30,2016 and 2015, respectively. The increase of $2.0 million for the three months ended June 30, 2016 primarily related to expenses of acquiredcompanies that were not included in 2015 due to the date of acquisition; namely $1.1 million relating to Alpha Insurance and $0.7 million relating tothe life settlements business.
Six Months Ended June 30: General and administrative expenses were $11.0 million and $7.1 million for the six months ended June 30,2016 and 2015, respectively. The increase for the six months ended June 30, 2016 primarily related to the timing of acquisitions occurring in 2015after June 30, 2015; namely $2.5 million relating to Alpha Insurance. In addition, the six months ended June 30, 2015 included the release of apreviously accrued acquisition date liability of $1.8 million attributable to the finalization with the seller of the purchase price for the Pavoniabusiness.
68

Table of Contents
Investments
We define invested assets as the sum of total investments, cash and cash equivalents and restricted cash and cash equivalents.Investments consist primarily of investment grade, liquid, fixed maturity securities of short-to-medium duration, equities and other investments.Cash and cash equivalents and restricted cash and cash equivalents are comprised mainly of cash, high-grade fixed deposits, and other highlyliquid instruments such as commercial paper with maturities of less than three months at the time of acquisition and money market funds.
Invested assets, including cash and cash equivalents, were $8.6 billion and $8.8 billion as at June 30, 2016 and December 31, 2015,respectively. Invested assets were maintained at a consistent level reflecting cash used in operations offset by increased valuations and improvedinvestment performance during the quarter.
A description of our investment strategies is included in "Item 7. Management's Discussion and Analysis of Financial Condition and Resultsof Operations - Investments" in our Annual Report on Form 10-K for the year ended December 31, 2015.
69

Table of Contents
Composition of Investment Portfolio By Asset Class
The following table summarizes the fair value and composition of our investment portfolio by asset class as at June 30, 2016 and December31, 2015:
June 30, 2016 December 31, 2015 Fair Value Fair Value
Investment
Grade (1)
Non-Investment
Grade (2) Total % Investment
Grade (1)
Non-Investment
Grade (2) Total % (in thousands of U.S. dollars)Fixed maturity and short-terminvestments, trading and available-for-sale
U.S. government & agency $ 785,017 $ — $ 785,017 10.6% $ 775,798 $ — $ 775,798 10.4%Non-U.S. government 388,695 11,306 400,001 5.4% 415,995 28,791 444,786 6.0%Corporate 2,649,892 149,080 2,798,972 37.8% 2,673,311 138,755 2,812,066 37.8%Municipal 15,293 — 15,293 0.2% 28,174 — 28,174 0.4%Residential mortgage-backed 474,405 1,039 475,444 6.4% 390,809 1,153 391,962 5.3%Commercial mortgage-backed 238,498 42,554 281,052 3.8% 241,208 43,367 284,575 3.8%Asset-backed 586,664 69,248 655,912 8.8% 577,280 65,804 643,084 8.7%
Total 5,138,464 273,227 5,411,691 73.0% 5,102,575 277,870 5,380,445 72.4%
Fixed maturity investments, held-to-maturity
U.S. government & agency 20,869 23 20,892 0.3% 19,288 33 19,321 0.3%Non-U.S. government 34,426 — 34,426 0.5% 39,058 — 39,058 0.5%Corporate 752,765 96 752,861 10.2% 710,546 146 710,692 9.6%
Total 808,060 119 808,179 11.0% 768,892 179 769,071 10.4%
Equities
U.S. 109,903 1.5% 108,793 1.5%International 7,390 0.1% 7,148 0.1%
Total 117,293 1.6% 115,941 1.6%
Other investments Private equity funds 229,756 3.1% 254,883 3.4%Fixed income funds 248,815 3.4% 291,736 3.9%Fixed income hedge funds 111,543 1.5% 109,400 1.5%Equity funds 163,050 2.2% 147,390 2.0%Multi-strategy hedge fund 98,416 1.3% 99,020 1.3%Real estate debt fund — —% 54,829 0.7%CLO equities 65,156 0.9% 61,702 0.8%CLO equity funds 13,513 0.2% 13,928 0.2%Call options on equities 4,850 0.1% — —%Other 1,059 —% 1,144 —%
Total 936,158 12.7% 1,034,032 13.8%
Other investments Life settlements 126,442 1.7% 130,268 1.8%
Total investments $ 5,946,524 $ 273,346 $ 7,399,763 100.0% $ 5,871,467 $ 278,049 $ 7,429,757 100.0%
(1) Investment Grade are securities with a rating of BBB- or higher.
(2) Non-Investment Grade included non-rated securities with a fair value of $46.3 million and $44.1 million as at June 30, 2016 and December 31, 2015, respectively.
A description of our investment valuation processes is included in "Item 7. Management's Discussion and Analysis of Financial Conditionand Results of Operations - Critical Accounting Policies" of our Annual Report on Form 10-K for the year ended December 31, 2015 and "Note 4 -Fair Value Measurements" included within Item 1 of this Quarterly Report on Form 10-Q.
70

Table of Contents
Composition of Invested Assets By Segment
Across all of our segments, we strive to structure our investments in a manner that recognizes our liquidity needs for future liabilities. In thatregard, we attempt to correlate the maturity and duration of our investment portfolio to our general liability profile. If our liquidity needs or generalliability profile unexpectedly change, we may adjust the structure of our investment portfolio to meet our revised expectations. The following tablessummarize the composition of total invested assets by segment as at June 30, 2016 and December 31, 2015:
Non-lifeRun-off Atrium StarStone Life and Annuities Total
(in thousands of U.S. dollars)June 30, 2016 Short-term investments, trading, at fair value $ 118,839 $ — $ 3,907 $ — $ 122,746
Short-term investments, available-for-sale, at fair value — 282 — 2,119 2,401
Fixed maturities, trading, at fair value 3,372,711 37,000 1,233,050 343,854 4,986,615
Fixed maturities, held-to-maturity, at amortized cost — — — 770,655 770,655
Fixed maturities, available-for-sale, at fair value 3,281 165,738 — 130,910 299,929
Equities, trading, at fair value 105,091 — 7,662 4,540 117,293
Other investments, at fair value 785,636 — 120,064 30,458 936,158
Other investments, at cost — — — 129,636 129,636
Total investments 4,385,558 203,020 1,364,683 1,412,172 7,365,433
Cash and cash equivalents 895,779 73,937 208,354 69,069 1,247,139
Total invested assets $ 5,281,337 $ 276,957 $ 1,573,037 $ 1,481,241 $ 8,612,572
Duration 1.79 1.24 2.12 6.56 2.56
Average Credit Rating A+ AA- AA- A A+
Non-lifeRun-off Atrium StarStone Life and Annuities Total
(in thousands of U.S. dollars)December 31, 2015 Short-term investments, trading, at fair value $ 72,163 $ — $ 12,941 $ 2,246 $ 87,350
Short-term investments, available-for-sale, at fair value — 1,848 — 6,774 8,622
Fixed maturities, trading, at fair value 3,444,752 37,000 1,204,376 304,666 4,990,794
Fixed maturities, held-to-maturity, at amortized cost — — — 790,866 790,866
Fixed maturities, available-for-sale, at fair value 6,464 181,027 — 106,188 293,679
Equities, trading, at fair value 102,412 — 9,083 4,446 115,941
Other investments, at fair value 856,555 — 123,735 53,742 1,034,032
Other investments, at cost — — — 133,071 133,071
Total investments 4,482,346 219,875 1,350,135 1,401,999 7,454,355
Cash and cash equivalents 1,007,889 52,735 199,597 73,043 1,333,264
Total invested assets $ 5,490,235 $ 272,610 $ 1,549,732 $ 1,475,042 $ 8,787,619
Duration 1.69 1.80 2.09 5.95 2.39
Average Credit Rating A+ AA- AA- A+ A+
Credit Quality and Maturity Profiles
As at June 30, 2016 and December 31, 2015, our investment portfolio had an average credit quality rating of A+. At June 30, 2016 andDecember 31, 2015, our fixed maturity investments rated lower than BBB- comprised 3.1% and 3.1% of our total investment portfolio,respectively. A detailed schedule of average credit ratings by asset class as at June 30, 2016 is included in "Note 3 - Investments - CreditRatings" of our unaudited condensed consolidated financial statements within Item 1 of this Quarterly Report on Form 10-Q.
Schedules of maturities for our fixed maturity securities are included in "Note 3 - Investments" of our unaudited condensed consolidatedfinancial statements included within Item 1 of this Quarterly Report on Form 10-Q.
71

Table of Contents
Eurozone Exposure
As at June 30, 2016 and December 31, 2015 we owned $17.7 million and $17.3 million, respectively, of investments in fixed maturitysecurities issued by the sovereign governments of Italy, Ireland and Spain. These investments are held by Alpha Insurance, which we acquiredduring 2015.
Investment Results - Consolidated
Note on comparability with prior period disclosures: In our consolidated statement of earnings we have added a new line captioned "otherincome," and for the three and six months ended June 30, 2015 we have reclassified $11.8 and $15.3 million, respectively, from net investmentincome to other income. These reclassifications were primarily related to income from recoveries on acquired insolvent debts and had no impacton net earnings. Comparability between periods is also impacted by our acquisitions and significant new business as described in Notes 3 and 4 ofour consolidated financial statements contained in our Annual Report on Form 10-K for the year ended December 31, 2015 and "Note 2 -Significant New Business" of our unaudited condensed consolidated financial statements included in Item 1 of this Quarterly Report on Form 10-Q.In addition, we record interest on funds held, such as for the Allianz transaction, in net investment income. For the purposes of the below analysisof our annualized investment book yield and financial statement portfolio return, we have excluded interest on funds held because funds held is notincluded in our definition of invested assets.
The following table summarizes our investment results for the three and six months ended June 30, 2016 and 2015.
Three Months Ended June 30, Six Months Ended June 30,
2016 2015 Increase
(decrease) 2016 2015 Increase
(decrease) (in thousands of U.S. dollars) (in thousands of U.S. dollars)Net investment income $ 54,223 $ 34,655 $ 19,568 $ 114,286 $ 65,072 $ 49,214
Interest on funds held (7,633) 184 (7,817) (15,237) 10 (15,247)
Net investment income (excluding funds held) 46,590 34,839 11,751 99,049 65,082 33,967
Net realized and unrealized gains (losses) 37,987 (11,249) 49,236 75,951 31,771 44,180
Annualized Investment Book Yield Annualized net investment income (excluding fundsheld) 186,360 139,356 47,004 198,098 130,164 67,934
Average aggregate invested assets, at cost(1) 8,681,398 8,819,707 (138,309) 8,747,768 8,315,162 432,606
Annualized investment book yield 2.15% 1.58% 0.57% 2.26% 1.57% 0.69%
Financial Statement Portfolio Return Total financial statement return(2) 84,577 23,590 60,987 175,000 96,853 78,147
Average aggregate invested assets, at fair value(1) 8,697,787 8,798,382 (100,595) 8,726,717 8,317,505 409,212
Financial statement portfolio return 0.97% 0.27% 0.70% 2.01% 1.16% 0.85%
(1) These amounts are an average of the amounts disclosed in our quarterly U.S. GAAP consolidated financial statements.(2) This is the sum of net investment income (excluding interest on funds held) and net realized and unrealized gains (losses) from our U.S. GAAP consolidated financial
statements.
Three Months Ended June 30: Net investment income, excluding the increase in interest on funds held of $7.8 million, increased by $11.8million during the three months ended June 30, 2016 compared to the three months ended June 30, 2015 due to an increase of 57 basis points inthe book yield we obtained on our assets. The increase in yield was primarily due to the changing mix in asset allocation as we executed on ourinvestment strategies.
The increase of $49.2 million in net realized and unrealized gains (losses) was comprised of net unrealized gains of $35.8 million in 2016compared to net unrealized losses of $18.3 million in 2015, offset by a decrease in net realized gains of $4.9 million. The increase in netunrealized gains in the three months ended June 30, 2016 was due to the increase in valuations of fixed maturity securities as treasury yieldsmoved lower and credit spreads tightened during the three months ended June 30, 2016.
72

Table of Contents
Six Months Ended June 30: Net investment income, excluding the increase in interest on funds held of $15.2 million, increased by $34.0million during the six months ended June 30, 2016 due to an increase of $432.6 million in our average invested assets and an increase of 69 basispoints in the book yield we obtained on those assets. The increase in yield was primarily due to the changing mix in asset allocation as weexecuted on our investment strategies. This included an increase of $8.0 million in income on life settlements during the six months ended June30, 2016 compared to 2015.
The increase of $44.2 million in net realized and unrealized gains (losses) was comprised of net unrealized gains of $75.2 million in 2016compared to net unrealized gains of $12.0 million in 2015, offset by a decrease in net realized gains of $19.0 million. The increase in netunrealized gains in the six months ended June 30, 2016 was due to the increase in valuations of fixed maturity securities as treasury yields movedlower and credit spreads tightened during the six months ended June 30, 2016. The realized gains in 2015 related to sales of equity securities.
Investment Results - By Segment
The following tables summarize our investment results by segment for the three and six months ended June 30, 2016, and 2015. Thesetables have been prepared on a basis consistent with the consolidated table above.
Non-life Run-off
Three Months Ended June 30, Six Months Ended June 30,
2016 2015 Increase
(decrease) 2016 2015 Increase
(decrease) (in thousands of U.S. dollars)Net investment income $ 37,581 $ 18,569 $ 19,012 $ 73,811 $ 37,433 $ 36,378
Interest on funds held (7,633) 184 (7,817) (15,237) 10 (15,247)
Net investment income (excluding funds held) 29,948 18,753 11,195 58,574 37,443 21,131
Net realized and unrealized gains (losses) 26,161 (4,308) 30,469 49,551 30,352 19,199
Annualized Investment Book Yield Annualized net investment income (excluding fundsheld) 119,792 75,012 44,780 117,148 74,886 42,262
Average aggregate invested assets, at cost 5,339,460 5,718,040 (378,580) 5,406,405 5,226,082 180,323
Annualized investment book yield 2.24% 1.31% 0.93% 2.17% 1.43% 0.74%
Financial Statement Portfolio Return Total financial statement return 56,109 14,445 41,664 108,125 67,795 40,330
Average aggregate invested assets, at fair value 5,342,906 5,705,579 (362,673) 5,395,129 5,188,212 206,917
Financial statement portfolio return 1.05% 0.25% 0.80% 2.00% 1.31% 0.69%
Three Months Ended June 30: Net investment income, excluding the increase in interest on funds held of $7.8 million, increased by $11.2million during the three months ended June 30, 2016 due to an increase of 93 basis points in the book yield we obtained on our assets. Theincrease in yield was primarily due to the changing mix in asset allocation as we executed on our investment strategies.
The increase of $30.5 million in net realized and unrealized gains (losses) was comprised of net unrealized gains of $23.8 million in 2016compared to net unrealized losses of $12.4 million in 2015, offset by a decrease in net realized gains of $5.7 million. The increase in netunrealized gains in the three months ended June 30, 2016 was due to the increase in valuations of fixed maturity securities as treasury yieldsmoved lower and credit spreads tightened during the three months ended June 30, 2016.
Six Months Ended June 30: Net investment income, excluding the increase in interest on funds held of $15.2 million, increased by $21.1million during the six months ended June 30, 2016 due to an increase of $180.3 million in our average invested assets and an increase of 74 basispoints in the book yield we obtained on those assets. The increase in yield was primarily due to the changing mix in asset allocation as weexecuted on our investment strategies.
73

Table of Contents
The increase of $19.2 million in net realized and unrealized gains (losses) was comprised of net unrealized gains of $49.0 million in 2016compared to net unrealized gains of $11.3 million in 2015, offset by a decrease in net realized gains of $18.5 million. The increase in netunrealized gains in the six months ended June 30, 2016 was due to the increase in valuations of fixed maturity securities as treasury yields movedlower and credit spreads tightened during the six months ended June 30, 2016. The realized gains in 2015 related to sales of equity securities.
Atrium
Three Months Ended June 30, Six Months Ended June 30,
2016 2015 Increase
(decrease) 2016 2015 Increase
(decrease) (in thousands of U.S. dollars)Net investment income $ 635 $ 523 $ 112 $ 1,189 1,030 $ 159
Net realized and unrealized gains (losses) 68 38 30 108 129 (21)
Annualized Investment Book Yield Annualized net investment income 2,540 2,092 448 2,378 2,060 318
Average aggregate invested assets, at cost 291,811 309,995 (18,184) 291,801 317,508 (25,707)
Annualized investment book yield 0.87% 0.67% 0.20% 0.81% 0.65% 0.16%
Financial Statement Portfolio Return Total financial statement return 703 561 142 1,297 1,159 138
Average aggregate invested assets, at fair value 288,992 303,621 (14,629) 287,906 297,775 (9,869)
Financial statement portfolio return 0.24% 0.18% 0.06% 0.45% 0.39% 0.06%
Three and Six Months Ended June 30: There was no significant change to Atrium's investment results for the three and six months endedJune 30, 2016 compared to the three and six months ended June 30, 2015. Despite average invested assets being lower than last year, the sameinvestment results were achieved through improved book yield due to our asset allocation.
StarStone
Three Months Ended June 30, Six Months Ended June 30,
2016 2015 Increase
(decrease) 2016 2015 Increase
(decrease) (in thousands of U.S. dollars)Net investment income $ 5,753 $ 4,058 $ 1,695 $ 11,033 $ 6,189 $ 4,844
Net realized and unrealized gains (losses) 8,021 (3,355) 11,376 22,370 1,347 21,023
Annualized Investment Book Yield Annualized net investment income 23,012 16,232 6,780 22,066 12,378 9,688
Average aggregate invested assets, at cost 1,574,362 1,464,375 109,987 1,572,657 1,464,174 108,483
Annualized investment book yield 1.46% 1.11% 0.35% 1.40% 0.85% 0.55%
Financial Statement Portfolio Return Total financial statement return 13,774 703 13,071 33,403 7,536 25,867
Average aggregate invested assets, at fair value 1,563,526 1,463,309 100,217 1,557,699 1,502,861 54,838
Financial statement portfolio return 0.88% 0.05% 0.83% 2.14% 0.50% 1.64%
Three Months Ended June 30: Net investment income increased by $1.7 million during the three months ended June 30, 2016, ascompared to the three months ended June 30, 2015, primarily due to an increase of $110.0 million in our average invested assets and an increaseof 35 basis points in the book yield we obtained on those assets. The increase in yield was primarily due to our asset allocation.
74

Table of Contents
Net realized and unrealized gains (losses) increased by $11.4 million during the three months ended June 30, 2016, primarily due to theincrease in valuations of fixed maturity securities as treasury yields moved lower and credit spreads tightened during the three months ended June30, 2016.
Six Months Ended June 30: Net investment income increased by $4.8 million during the six months ended June 30, 2016, as compared tothe six months ended June 30, 2015, primarily due to an increase of $108.5 million in our average invested assets and an increase of 55 basispoints in the book yield we obtained on those assets. The increase in yield was primarily due to our asset allocation.
Net realized and unrealized gains (losses) increased by $21.0 million during the six months ended June 30, 2016, primarily due to theincrease in valuations of fixed maturity securities as treasury yields moved lower and credit spreads tightened during the six months ended June30, 2016.
Life and Annuities
Three Months Ended June 30, Six Months Ended June 30,
2016 2015 Increase
(decrease) 2016 2015 Increase
(decrease) (in thousands of U.S. dollars)Net investment income $ 11,113 $ 11,577 $ (464) $ 29,534 $ 20,652 $ 8,882
Net realized and unrealized gains (losses) 3,737 (3,624) 7,361 3,922 (57) 3,979
Annualized Investment Book Yield Annualized net investment income 44,452 46,308 (1,856) 59,068 41,304 17,764
Average aggregate invested assets, at cost 1,475,765 1,327,297 148,468 1,476,905 1,307,398 169,507
Annualized investment book yield 3.01% 3.49% (0.48)% 4.00% 3.16% 0.84%
Financial Statement Portfolio Return Total financial statement return 14,850 7,953 6,897 33,456 20,595 12,861
Average aggregate invested assets, at fair value 1,502,363 1,325,873 176,490 1,485,983 1,328,657 157,326
Financial statement portfolio return 0.99% 0.60% 0.39 % 2.25% 1.55% 0.70%
Three Months Ended June 30: Net investment income decreased by $0.5 million during the three months ended June 30, 2016, ascompared to the three months ended June 30, 2015, primarily due to a decrease in income from life settlements of $0.9 million.
Net realized and unrealized gains (losses) increased by $7.4 million during the three months ended June 30, 2016, primarily due to theincrease in valuations of fixed maturity securities as treasury yields moved lower and credit spreads tightened during the three months ended June30, 2016 compared with 2015.
Six Months Ended June 30: Net investment income increased by $8.9 million during the six months ended June 30, 2016, as compared tothe six months ended June 30, 2015, primarily due to an increase in income from life settlements of $8.0 million and an increase of $169.5 millionin our average invested assets, partially offset by a decrease in book yield. Excluding the income from life settlements, annualized investmentbook yield for the six months ended June 30, 2015 was 2.65%, a decrease of 51 basis points from the comparable amount for the six monthsended June 30, 2015. In addition, net realized and unrealized gains (losses) increased by $4.0 million.
75

Table of Contents
Liquidity and Capital Resources
Overview
Enstar aims to generate cash flows from our insurance operations and investments, preserve sufficient capital for future acquisitions, anddevelop relationships with lenders who provide borrowing capacity at competitive rates.
Our capital resources as at June 30, 2016 included shareholders' equity of $2.6 billion, redeemable noncontrolling interest of $0.4 billionclassified as temporary equity, and loans payable of $0.6 billion. The redeemable noncontrolling interest may be settled in the future in cash orEnstar ordinary shares, at our option. Based on our current loss reserves position, our portfolios of in-force insurance and reinsurance business,and our investment positions, we believe we are well capitalized.
Enstar has not historically declared a dividend. We retain earnings and utilize distributions from our subsidiaries to invest in our businessstrategies. We do not currently expect to pay any dividends on our ordinary shares. Any payment of dividends must be approved by our Board ofDirectors. Our ability to pay dividends is subject to certain restrictions, as described in "Note 20 - Dividend Restrictions and StatutoryRequirements" in the notes to our consolidated financial statements included within Item 8 of our Annual Report on Form 10-K for the year endedDecember 31, 2015.
Cash and Cash Equivalents
As at June 30, 2016 and December 31, 2015, we had total cash and cash equivalents, and restricted cash and cash equivalents ofapproximately $1.2 billion and $1.3 billion, respectively. We expect our cash flows, together with our existing capital base and cash andinvestments acquired on the purchase of insurance and reinsurance subsidiaries, to be sufficient to meet cash requirements and to operate ourbusiness. For a description of our sources and uses of cash in our holding company and operating companies, refer to "Item 7. Management'sDiscussion and Analysis of Financial Condition and Results of Operation - Liquidity and Capital Resources" in our Annual Report on Form 10-K forthe year ended December 31, 2015. Our cash and cash equivalents are comprised mainly of cash, high graded fixed deposits, commercial paperwith maturities of less than three months and money market funds.
As of June 30, 2016, we had $800.8 million million of cash and cash equivalents, excluding restricted cash that supports insuranceoperations, and included in this amount was $525.5 million held by foreign subsidiaries outside of Bermuda. Based on our group's current corporatestructure with a Bermuda domiciled parent company and the jurisdictions in which we operate, if the cash and cash equivalents held by our foreignsubsidiaries were to be distributed to us, as dividends or otherwise, such amounts would not be subject to incremental income taxes, however incertain circumstances withholding taxes may be imposed by some jurisdictions, including the United States. Based on existing tax laws,regulations and our current intentions, there was no accrual as of June 30, 2016 for any material withholding taxes on dividends or otherdistributions, as described in "Note 16 - Taxation" in the notes to our consolidated financial statements included within Item 1 of this QuarterlyReport on Form 10-Q.
The following table summarizes our consolidated cash flows provided by (used in) operating, investing and financing activities for the sixmonths ended June 30, 2016 and 2015:
Six Months Ended June 30,
Cash provided by (used in): 2016 2015 Increase
(decrease) (in thousands of U.S. dollars)Operating activities $ (216,332) $ (478,045) $ 261,713Investing activities 181,324 260,153 (78,829)Financing activities 13,548 337,675 (324,127)Effect of exchange rate changes on cash 381 (6,226) 6,607Net increase (decrease) in cash and cash equivalents (21,079) 113,557 (134,636)Cash and cash equivalents, beginning of period 821,925 963,402 (141,477)Cash and cash equivalents, end of period $ 800,846 $ 1,076,959 $ (276,113)
Details of our consolidated cash flows are included in "Item 1. Financial Statements - Unaudited Condensed Consolidated Statements ofCash Flows for the six months ended June 30, 2016 and 2015 (unaudited)."
76

Table of Contents
2016 versus 2015: Cash from operating activities included net sales (purchases) of trading securities of $51.5 million and ($630.1) million forthe six months ended June 30, 2016 and 2015, respectively. Excluding the activity on trading securities, cash (used in) provided by operatingactivities was ($267.8) million and $152.1 million for the six months ended June 30, 2016 and 2015, respectively. Cash used in operating activitiesis largely a result of the timing of loss payments across all of our segments. In addition, our StarStone segment had improved results andoperating cash flows in the six months ended June 30, 2016 as compared with 2015, which partially offset the decrease in cash from operatingactivities, excluding trading securities activity.
Cash provided by investing activities for the six months ended June 30, 2016 primarily related to the cash inflow from redemptions of otherinvestments of $125.1 million and a change in restricted cash contributing $65.1 million. The net cash inflow from investing activities was utilizedin operating activities during the period. Cash provided by investing activities for the six months ended June 30, 2015 primarily related to a changein restricted cash of $242.4 million for the transaction with Voya, described in "Note 4 - Significant New Business" in our consolidated financialstatements in our Annual Report on Form 10-K for the year ended December 31, 2015.
Cash provided by financing activities for the six months ended June 30, 2016 was not significantly changed, as net drawdowns of $44.1million under the Enstar Group Limited ("EGL") Revolving Credit Facility were substantially offset by repayments of $30.5 million related to theSussex term loan (the "Sussex Facility"). During the six months ended June 30, 2015, we fully drew down $109.0 million on the Sussex Facility tofund 50% of the consideration payable for the acquisition of Sussex, and repaid $5.0 million of the outstanding principal on the Sussex Facility. Inthe same period there were also net drawdowns under the EGL Revolving Credit Facility of $224.7 million primarily related to our acquisition ofcertain subsidiaries from Wilton Re Limited and to fund trusts for the Voya transaction. These transactions are described in "Note 3 - Acquisitions"and "Note 4 - Significant New Business", respectively, in the consolidated financial statements in our Annual Report on Form 10-K for the yearended December 31, 2015.
Investments
As at June 30, 2016 and December 31, 2015, we had total investments of approximately $7.4 billion and $7.5 billion, respectively.
For information regarding our investments, refer to "Item 2. Management’s Discussion and Analysis of Financial Condition and Results ofOperations - Investments."
Reinsurance Balances Recoverable
As at June 30, 2016 and December 31, 2015, we had reinsurance balances recoverable of approximately $1.3 billion and $1.5 billion,respectively.
Our insurance and reinsurance run-off subsidiaries, prior to acquisition, used retrocessional agreements to reduce their exposure to the riskof insurance and reinsurance assumed. On an annual basis, both Atrium and StarStone purchase a tailored outwards reinsurance programdesigned to manage their risk profiles. The majority of Atrium’s and StarStone's third-party reinsurance cover is with highly rated reinsurers or iscollateralized by letters of credit.
We remain liable to the extent that retrocessionaires do not meet their obligations under these agreements, and therefore, we evaluate andmonitor concentration of credit risk among our reinsurers. Provisions are made for amounts considered potentially uncollectible.
For further information regarding our reinsurance balances recoverable, refer to "Note 6 - Reinsurance Balances Recoverable" in the notes toour unaudited condensed consolidated financial statements included within Item 1 of this Quarterly Report on Form 10-Q.
Funds Held by Reinsured Companies
As at June 30, 2016 and December 31, 2015, we had funds held by ceding companies of approximately $1.2 billion and $0.1 billion,respectively. The increase was due to the completion on March 31, 2016 of our transaction with Allianz to reinsure portfolios of Allianz's run-offbusiness. In accordance with this transaction, which had an effective date of January 1, 2016, there are $1.1 billion of funds held by Allianz andwe are receiving a fixed rate of investment income in accordance with the contract. For information regarding credit risk, refer to "Item 3.Quantitative and Qualitative Disclosures About Market Risk - Credit Risk - Funds Held by Reinsured Companies" of this Quarterly Report on Form10-Q.
77

Table of Contents
Loan Facilities
We utilize loan facilities primarily for acquisitions and, from time to time, for general corporate purposes. For information regarding our loanfacilities, including our loan covenants, refer to "Note 11 - Loans Payable" in the notes to our consolidated financial statements included withinItem 1 of this Quarterly Report on Form 10-Q. Under our facilities, loans payable as of June 30, 2016 and December 31, 2015 were $614.0 millionand $600.3 million, respectively.
Our main facility is the EGL Revolving Credit Facility, originated on September 16, 2014 for a five-year term, and amended on February 27,2015, February 15, 2016 and most recently on August 5, 2016. This facility is among the Company and certain of its subsidiaries, as borrowersand as guarantors, and various financial institutions. We are permitted to borrow up to an aggregate of $665.0 million, and as of August 5, 2016 wehave an option to obtain additional commitments of up to $166.25 million. The individual outstanding loans under the facility are unsecured short-term floating rate loans with an interest rate of LIBOR plus an applicable margin. As at June 30, 2016, $115.2 million of the $665.0 million totalcapacity was available for use under the EGL Revolving Credit Facility. During the six months ended June 30, 2016 we borrowed Euros to hedgethe foreign currency exposure on our net investment in certain of our subsidiaries whose functional currency is denominated in Euros.
We also have the Sussex Facility, a four-year term loan, that was originated on December 24, 2014 with two financial institutions. We repaid$30.5 million under this facility during the six months ended June 30, 2016. As at June 30, 2016 the outstanding principal under this facility was$63.5 million.
Contractual Obligations
The following table summarizes, as of June 30, 2016, our future payments under contractual obligations and estimated payments for lossesand LAE and policy benefits by expected payment date and updates the table on page 79 of our Annual Report on Form 10-K for the year endedDecember 31, 2015. The table excludes short-term liabilities and includes only obligations that are expected to be settled in cash.
Total Less than
1 Year 1 - 3years
3 - 5years
More than5 Years
(in millions of U.S. dollars)Operating Activities
Estimated gross reserves for losses andLAE (1) $ 6,571.3 $ 1,324.5 $ 1,999.1 $ 931.6 $ 2,316.1Policy benefits for life and annuity contracts (2) 2,139.0 74.5 149.8 142.2 1,772.5Operating lease obligations 44.9 10.3 18.0 9.1 7.5
Investing Activities Investment commitments 138.4 55.6 57.8 25.0 —
Financing Activities Loan repayments (including estimated interestpayments) 673.7 15.0 658.7 — —
Total $ 9,567.3 $ 1,479.9 $ 2,883.4 $ 1,107.9 $ 4,096.1
(1) The reserves for losses and LAE represent management’s estimate of the ultimate cost of settling losses. The estimation of losses is based on various complex andsubjective judgments. Actual losses paid may differ, perhaps significantly, from the reserve estimates reflected in our financial statements. Similarly, the timing ofpayment of our estimated losses is not fixed and there may be significant changes in actual payment activity. The assumptions used in estimating the likely paymentsdue by period are based on our historical claims payment experience and industry payment patterns, but due to the inherent uncertainty in the process of estimating thetiming of such payments, there is a risk that the amounts paid in any such period can be significantly different from the amounts disclosed above. The amounts in theabove table represent our estimates of known liabilities as of June 30, 2016 and do not take into account corresponding reinsurance recoverable amounts that would bedue to us. Furthermore, certain of the reserves included in the unaudited condensed consolidated financial statements as of June 30, 2016 were acquired by us andinitially recorded at fair value with subsequent amortization, whereas the expected payments by period in the table above are the estimated payments at a future timeand do not reflect the fair value adjustment in the amount payable.
(2) Policy benefits for life and annuity contracts recorded in our unaudited condensed consolidated balance sheet as at June 30, 2016 of $1,286.3 million are computed ona discounted basis, whereas the expected payments by period in the table above are the estimated payments at a future time and do not reflect a discount of theamount payable.
78

Table of Contents
For additional information relating to our commitments and contingencies, see "Note 18 - Commitments and Contingencies" in the notes toour unaudited condensed consolidated financial statements included within Item 1 of this Quarterly Report on Form 10-Q.
Off-Balance Sheet Arrangements
At June 30, 2016, we did not have any off-balance sheet arrangements, as defined by Item 303(a)(4) of Regulation S-K.
Critical Accounting Policies
Our critical accounting policies are discussed in Management's Discussion and Analysis of Results of Operations and Financial Conditioncontained in our Annual Report on Form 10-K for the year ended December 31, 2015 and have not materially changed.
79

Table of Contents
Cautionary Statement Regarding Forward-Looking Statements
This quarterly report and the documents incorporated by reference contain statements that constitute "forward-looking statements" within themeaning of Section 21E of the Securities Exchange Act of 1934, as amended, or the Exchange Act, with respect to our financial condition, resultsof operations, business strategies, operating efficiencies, competitive positions, growth opportunities, plans and objectives of our management, aswell as the markets for our ordinary shares and the insurance and reinsurance sectors in general. Statements that include words such as"estimate," "project," "plan," "intend," "expect," "anticipate," "believe," "would," "should," "could," "seek," "may" and similar statements of a futureor forward-looking nature identify forward-looking statements for purposes of the federal securities laws or otherwise. All forward-lookingstatements are necessarily estimates or expectations, and not statements of historical fact, reflecting the best judgment of our management andinvolve a number of risks and uncertainties that could cause actual results to differ materially from those suggested by the forward-lookingstatements. These forward looking statements should, therefore, be considered in light of various important factors, including those set forth in thisquarterly report and in our Annual Report on Form 10-K for the year ended December 31, 2015. These factors include:
• risks associated with implementing our business strategies and initiatives;
• risks that we may require additional capital in the future, which may not be available or may be available only on unfavorable terms;
• the adequacy of our loss reserves and the need to adjust such reserves as claims develop over time;
• risks relating to the availability and collectability of our reinsurance;
• changes and uncertainty in economic conditions, including interest rates, inflation, currency exchange rates, equity markets and creditconditions, which could affect our investment portfolio, our ability to finance future acquisitions and our profitability;
• the risk that ongoing or future industry regulatory developments will disrupt our business, affect the ability of our subsidiaries to operatein the ordinary course or to make distributions to us, or mandate changes in industry practices in ways that increase our costs,decrease our revenues or require us to alter aspects of the way we do business;
• losses due to foreign currency exchange rate fluctuations;
• increased competitive pressures, including the consolidation and increased globalization of reinsurance providers;
• emerging claim and coverage issues;
• lengthy and unpredictable litigation affecting assessment of losses and/or coverage issues;
• loss of key personnel;
• the ability of our subsidiaries to distribute funds to us and the resulting impact on our liquidity;
• our ability to comply with covenants in our debt agreements;
• changes in our plans, strategies, objectives, expectations or intentions, which may happen at any time at management’s discretion;
• operational risks, including system, data security or human failures and external hazards;
• risks relating to our acquisitions, including our ability to continue to grow, successfully price acquisitions, evaluate opportunities,address operational challenges, support our planned growth and assimilate acquired companies into our internal control system in orderto maintain effective internal controls, provide reliable financial reports and prevent fraud;
• risks relating to our ability to obtain regulatory approvals, including the timing, terms and conditions of any such approvals, and tosatisfy other closing conditions in connection with our acquisition agreements, which could affect our ability to complete acquisitions;
80

Table of Contents
• risks relating to our active underwriting businesses, including unpredictability and severity of catastrophic and other major loss events,failure of risk management and loss limitation methods, the risk of a ratings downgrade or withdrawal, cyclicality of demand and pricingin the insurance and reinsurance markets;
• our ability to implement our strategies relating to our active underwriting businesses;
• risks relating to our life and annuities business, including mortality and morbidity rates, lapse rates, the performance of assets tosupport the insured liabilities, and the risk of catastrophic events;
• risks relating to our investments in life settlements contracts, including that actual experience may differ from our assumptionsregarding longevity, cost projections, and risk of non-payment from the insurance carrier;
• risks relating to the performance of our investment portfolio and our ability to structure our investments in a manner that recognizes ourliquidity needs;
• tax, regulatory or legal restrictions or limitations applicable to us or the insurance and reinsurance business generally;
• changes in tax laws or regulations applicable to us or our subsidiaries, or the risk that we or one of our non-U.S. subsidiaries becomesubject to significant, or significantly increased, income taxes in the United States or elsewhere;
• changes in Bermuda law or regulation or the political stability of Bermuda; and
• changes in accounting policies or practices.
The factors listed above should be not construed as exhaustive and should be read in conjunction with the other cautionary statements andRisk Factors that are included in this quarterly report and in our Annual Report on Form 10-K for the year ended December 31, 2015. We undertakeno obligation to publicly update or review any forward looking statement, whether to reflect any change in our expectations with regard thereto, oras a result of new information, future developments or otherwise, except as required by law.
81

Table of Contents
ITEM 3. QUANTITATIVE AND QUALITATIVE DISCLOSURES ABOUT MARKET RISK
The following risk management discussion and the estimated amounts generated from sensitivity analysis presented are forward-lookingstatements of market risk assuming certain market conditions occur. Future results may differ materially from these estimated results due to,among other things, actual developments in the global financial markets, changes in the composition of our investment portfolio, or changes in ourbusiness strategies. The results of analysis we use to assess and mitigate risk are not projections of future events or losses. See "CautionaryStatement Regarding Forward-Looking Statements" for additional information regarding our forward-looking statements.
We are principally exposed to four types of market risk: interest rate risk, credit risk, equity price risk and foreign currency risk. Our policiesto address these risks in 2016 were not materially different than those used in 2015, and, based on our current knowledge and expectations, we donot currently anticipate significant changes in our market risk exposures or in how we will manage those exposures in future reporting periods.
Interest Rate Risk
Interest rate risk is the price sensitivity of a security to changes in interest rates. Our investment portfolio includes fixed maturity and short-term investments, whose fair values will fluctuate with changes in interest rates. We attempt to maintain adequate liquidity in our fixed maturityinvestments portfolio with a strategy designed to emphasize the preservation of our invested assets and provide sufficient liquidity for the promptpayment of claims and contract liabilities, as well as for settlement of commutation payments. We also monitor the duration and structure of ourinvestment portfolio.
The following table summarizes the aggregate hypothetical change in fair value from an immediate parallel shift in the treasury yield curve,assuming credit spreads remain constant, in our fixed maturity and short-term investments portfolio classified as trading and available-for-sale asat June 30, 2016 and December 31, 2015:
Interest Rate Shift in Basis Points
As at June 30, 2016 -100 -50 — +50 +100 (in millions of U.S. dollars)Total Market Value $ 5,584 $ 5,521 $ 5,412 $ 5,364 $ 5,295Market Value Change from Base 3.2% 2.0% — (0.9)% (2.2)%Change in Unrealized Value $ 172 $ 109 $ — $ (48) $ (117) As at December 31, 2015 -100 -50 — +50 +100
Total Market Value $ 5,544 $ 5,478 $ 5,381 $ 5,351 $ 5,292Market Value Change from Base 3.0% 1.8% — (0.6)% (1.7)%Change in Unrealized Value $ 163 $ 97 $ — $ (30) $ (89)
Actual shifts in interest rates may not change by the same magnitude across the maturity spectrum or on an individual security and, as aresult, the impact on the fair value of our fixed maturity securities and short-term investments portfolio may be materially different from theresulting change in realized value indicated in the table above.
Credit Risk
Credit risk relates to the uncertainty of a counterparty’s ability to make timely payments in accordance with contractual terms of theinstrument or contract. We are exposed to direct credit risk primarily within our portfolios of fixed maturity and short-term investments, and throughcustomers, brokers and reinsurers in the form of premiums receivable, reinsurance recoverables, and funds held by reinsured companies, asdiscussed below.
Fixed Maturity and Short-Term Investments
As a holder of fixed maturity and short-term investments, we also have exposure to credit risk as a result of investment ratings downgradesor issuer defaults. In an effort to mitigate this risk, our investment portfolio consists primarily of investment grade-rated, liquid, fixed maturityinvestments of short-to-medium duration. A table of credit ratings for our fixed maturity and short-term investments is in "Note 3 - Investments" inthe notes to our unaudited condensed consolidated financial statements included within Part I, Item 1 of this Quarterly Report on Form 10-Q. As atJune 30, 2016, approximately 46.5% of our fixed maturity and short-term investment portfolio was rated AA or higher by a major rating agency(December 31, 2015: 47.0%) with 4.4% rated lower than BBB- (December 31, 2015: 3.1%). The portfolio as a whole had an average credit qualityrating of A+ as at June 30, 2016 (December 31, 2015: A+). In addition, we manage our portfolio pursuant to guidelines that follow what we believeare prudent standards of
82

Table of Contents
diversification. The guidelines limit the allowable holdings of a single issue and issuers and, as a result, we do not believe we have significantconcentrations of credit risk.
Reinsurance
We have exposure to credit risk as it relates to our reinsurance balances recoverable. Our insurance subsidiaries remain liable to the extentthat retrocessionaires do not meet their contractual obligations and, therefore, we evaluate and monitor concentration of credit risk among ourreinsurers. These amounts are discussed in "Note 6 - Reinsurance Balances Recoverable" in the notes to our unaudited condensed consolidatedfinancial statements included within Item 1 of this Quarterly Report.
Funds Held by Reinsured Companies
Under funds held arrangements, the reinsured company has retained funds that would otherwise have been remitted to our reinsurancesubsidiaries. The funds balance is credited with investment income and losses payable are deducted. We are subject to credit risk if the reinsuredcompany is unable to honor the value of the funds held balances, such as in the event of insolvency. However, we generally have the contractualability to offset any shortfall in the payment of the funds held balances with amounts owed by us to the reinsured for losses payable and otheramounts contractually due. We routinely monitor the creditworthiness of reinsured companies with whom we have funds held arrangements. Wehave a significant concentration of $1.1 billion to one reinsured company which has financial strength credit ratings of A+ from A.M. Best and AAfrom Standard & Poor's.
Equity Price Risk
Our portfolio of equity investments, including the equity funds and call options on equities included in other investments (collectively,"equities at risk"), has exposure to equity price risk, which is the risk of potential loss in fair value resulting from adverse changes in stock prices.Our global equity portfolio is correlated with a blend of the S&P 500 and MSCI World indices, and changes in this blend of indices wouldapproximate the impact on our portfolio. The fair value of our equities at risk at June 30, 2016 was approximately $285.2 million (December 31,2015: $263.3 million). At June 30, 2016, the impact of a 10% decline in the overall market prices of our equities at risk would be approximately$28.5 million (December 31, 2015: $26.3 million), on a pre-tax basis.
Foreign Currency Risk
Our foreign currency policy is to broadly manage, where possible, our foreign currency risk by seeking to match our liabilities underinsurance and reinsurance policies that are payable in foreign currencies with assets that are denominated in such currencies, subject to regulatoryconstraints. In addition, we may selectively utilize foreign currency forward contracts to mitigate foreign currency risk. To the extent our foreigncurrency exposure is not matched or hedged, we may experience foreign exchange losses or gains, which would be reflected in our results ofoperations and financial condition.
Through our subsidiaries located in various foreign countries, we conduct our insurance and reinsurance operations in a variety of non-U.S.currencies. As the functional currency for the majority of our subsidiaries is the U.S. dollar, fluctuations in foreign currency exchange rates relatedto these subsidiaries will have a direct impact on the valuation of our assets and liabilities denominated in local currencies. All changes in foreignexchange rates, with the exception of non-U.S. dollar denominated investments classified as available-for-sale, are recognized in foreign exchangegains (losses) in our consolidated statements of earnings. Changes in foreign exchange rates relating to non-U.S. dollar denominated investmentsclassified as available-for-sale are recorded in unrealized gains (losses) on investments, which is a component of accumulated othercomprehensive income (loss) in shareholders’ equity.
We have exposure to foreign currency risk through our ownership of European, British, Canadian, and Australian subsidiaries whosefunctional currencies are the Euro, British pound, Canadian dollar, and Australian dollar, respectively. The foreign exchange gain or loss resultingfrom the translation of their financial statements from functional currency into U.S. dollars is recorded in the currency translation adjustmentaccount, which is a component of accumulated other comprehensive income (loss) in shareholders’ equity. During the three months ended June30, 2016, we borrowed Euros under the EGL Revolving Credit Facility to hedge the foreign currency exposure on our net investment in certain ofour subsidiaries whose functional currency is denominated in Euros. Subsequent to June 30, 2016, we entered into forward exchange contracts tohedge the foreign currency exposure on our net investment in certain of our subsidiaries whose functional currencies are denominated in Canadianand Australian dollars. The loan and the forward contracts are discussed in "Note 11 - Loans Payable" and "Note 5 - Derivative Instruments",respectively, in the notes to our unaudited condensed consolidated financial statements included within Item 1 of this Quarterly
83

Table of Contents
Report. We utilize hedge accounting to record the foreign exchange gain or loss on these instruments in the currency translation account.
Our total net foreign currency exposure as of June 30, 2016 and December 31, 2015 was $178.1 million and $291.8 million, respectively.The impact of a 10% movement in the U.S. dollar would result in a change in value of $17.8 million and $29.2 million, respectively, portions ofwhich would be reflected in earnings, the currency translation adjustment component of shareholder’s equity or redeemable noncontrolling interest.Our net foreign currency exposure included $64.9 million and $99.4 million, respectively, related to our subsidiaries whose functional currency isU.S. dollars.
Effects of Inflation
We do not believe that inflation has had or will have a material effect on our consolidated results of operations, although inflation may affectthe value of our assets, as well as our liabilities including losses and LAE (by causing the cost of claims to rise in the future). Although lossreserves are established to reflect likely loss settlements at the date payment is made, we would be subject to the risk that inflation could causethese costs to increase above established reserves.
ITEM 4. CONTROLS AND PROCEDURES
Evaluation of Disclosure Controls and Procedures
Under the supervision and with the participation of management, including our Chief Executive Officer and our Chief Financial Officer, weevaluated the effectiveness of our disclosure controls and procedures (as defined in Rules 13a-15(e) and 15d-15(e) of the Exchange Act) as ofJune 30, 2016. Based on that evaluation, our Chief Executive Officer and our Chief Financial Officer have concluded that we maintained effectivedisclosure controls and procedures to provide reasonable assurance that information required to be disclosed by us in reports that we file or submitunder the Exchange Act is recorded, processed, summarized and timely reported as specified in the rules and forms of the U.S. Securities andExchange Commission and is accumulated and communicated to our management, including the Chief Executive Officer and Chief FinancialOfficer, as appropriate, to allow timely decisions regarding required disclosure.
Changes in Internal Control Over Financial Reporting
There were no changes in our internal control over financial reporting that occurred during the three months ended June 30, 2016 that havematerially affected, or are reasonably likely to materially affect, our internal control over financial reporting.
84

Table of Contents
PART II — OTHER INFORMATION
ITEM 1. LEGAL PROCEEDINGS
For a discussion of legal proceedings, see Note 18 - "Commitments and Contingencies" in the notes to our unaudited condensedconsolidated financial statements included in Item 1 of this Quarterly Report on Form 10-Q, which is incorporated herein by reference.
ITEM 1A. RISK FACTORS
Our results of operations and financial condition are subject to numerous risks and uncertainties described in “Risk Factors” included inItem 1A of our Annual Report on Form 10-K for the year ended December 31, 2015. The risk factors identified therein have not materially changed,except as set forth below.
The United Kingdom’s referendum vote to leave the European Union could adversely affect our business.
In an advisory referendum held on June 23, 2016, the United Kingdom (U.K.) voted to leave the European Union (E.U.) (commonly referredto as “Brexit”). The timing and nature of the U.K.’s withdrawal from the E.U. is yet to be determined, and the form of the U.K.’s future relationshipwith the E.U. may not be clear for some time.
We have significant operations and employees in the United Kingdom, including our Lloyd’s businesses. Brexit’s impact on our U.K.businesses will depend on the U.K. and Lloyd’s abilities to retain access to the E.U. markets, and our U.K. businesses could be adverselyaffected if adequate access to these markets is not obtained. Brexit may also lead to legal uncertainty and differences in national laws andregulations as the U.K. determines which E.U. laws to replace or replicate, and these issues could impact our structure and operations.
The Brexit vote had an immediate adverse effect on global financial and foreign exchange markets, and instability and uncertainty in theEuropean economy and in global financial markets may continue for some time. Any of these effects of Brexit, and others we cannot anticipate,could adversely affect our business, results of operations, and financial condition.
ITEM 6. EXHIBITS
The information required by this item is set forth on the exhibit index that follows the signature page of this report.
85

Table of Contents
SIGNATURES
Pursuant to the requirements of the Securities Exchange Act of 1934, the registrant has duly caused this report to be signed on its behalf bythe undersigned, thereunto duly authorized on August 5, 2016.
ENSTAR GROUP LIMITED
By: /S/ MARK SMITH
Mark SmithChief Financial Officer, Authorized Signatory and PrincipalFinancial Officer
By: /S/ GUY BOWKER
Guy BowkerChief Accounting Officer and Principal Accounting Officer
86

Table of Contents
Exhibit Index
ExhibitNo. Description
3.1
Memorandum of Association of Enstar Group Limited (incorporated by reference to Exhibit 3.1 to the Company’s Form 10-K/A filedon May 2, 2011).
3.2
Fourth Amended and Restated Bye-Laws of Enstar Group Limited (incorporated by reference to Exhibit 3.2(b) of the Company’sForm 10-Q filed on August 11, 2014).
3.3
Certificate of Designations of Series C Participating Non-Voting Perpetual Preferred Stock (incorporated by reference to Exhibit 3.1of the Company’s Form 8-K filed on June 17, 2016).
10.1+* Form of Restricted Stock Award Agreement under the Enstar Group Limited 2016 Equity Incentive Plan.10.2+* Form of Stock Appreciation Right Award Agreement under the Enstar Group Limited 2016 Equity Incentive Plan.10.3+
Enstar Group Limited 2016 Equity Incentive Plan (incorporated by reference to Exhibit 10.1 of the Company's Form 8-K filed onJune 17, 2016).
31.1*
Certification of Chief Executive Officer pursuant to Rule 13a-14(a) or Rule 15d-14(a) of the Securities Exchange Act of 1934 asadopted under Section 302 of the Sarbanes-Oxley Act of 2002.
31.2*
Certification of Chief Financial Officer pursuant to Rule 13a-14(a) or Rule 15d-14(a) of the Securities Exchange Act of 1934 asadopted under Section 302 of the Sarbanes-Oxley Act of 2002.
32.1**
Certification of Chief Executive Officer pursuant to 18 U.S.C. Section 1350, as adopted pursuant to Section 906 of the Sarbanes-Oxley Act of 2002.
32.2**
Certification of Chief Financial Officer pursuant to 18 U.S.C. Section 1350, as adopted pursuant to Section 906 of the Sarbanes-Oxley Act of 2002.
101* Interactive Data Files.
________________________________
* filed herewith
** furnished herewith
+ denotes management contract or compensatory arrangement
87

Exhibit 10.1
Restricted Stock Award AgreementUnder the Enstar Group Limited 2016 Equity Incentive Plan
This Restricted Stock Award Agreement (this “Agreement”) is entered into as of the Grant Date (as defined below), by and between theGrantee (as defined below) and Enstar Group Limited (the “Company”). Except as otherwise defined herein, capitalized terms used in thisAgreement have the respective meanings set forth in the Plan (as defined below).
WITNESSETH THAT:
WHEREAS, the Company maintains the Enstar Group Limited 2016 Equity Incentive Plan (the “Plan”), which is incorporated into andforms a part of this Agreement; and
WHEREAS, the Grantee has been selected by the committee administering the Plan (the “Committee”) to receive a Restricted Stockaward under the Plan.
NOW, THEREFORE, IT IS AGREED, by and between the Company and the Grantee as follows:
1. Terms of Award.
(a) The “Grantee” is _______________.
(b) The “Grant Date” is _______________.
(c) The number of ordinary shares of the Company (“Common Shares”) granted under this Agreement is _______ (the“Restricted Stock”).
2. Award. Subject to the terms of this Agreement and the Plan, the Grantee is hereby granted the Restricted Stock as described inparagraph 1.
3. Vesting Schedule. Notwithstanding anything in the terms of the Plan to the contrary, the Grantee shall become vested in theRestricted Stock according to the following schedule:
INSTALLMENT VESTING DATE
The Restricted Stock shall not become vested on the Vesting Date: (i) if the Grantee’s Termination of Service occurs on or before the VestingDate; or (ii) if, on or before the Vesting Date, the Grantee has provided notice of his or her intention to effect a Termination of Service (even if thedate of the Termination of Service occurs after the Vesting Date). Notwithstanding the foregoing provisions, the Restricted Stock shall vest asfollows:
(y) The Grantee shall become fully vested in the Restricted Stock as of the Grantee’s Termination of Service if theGrantee’s Termination of Service occurs by reason of the Grantee’s death or disability.
(z) In accordance with Subsection 13(d) and Section 14 of the Plan, the Grantee shall become fully vested in the
Restricted Stock upon a Change in Control (unless the surviving or successor corporation assumes thisRestricted Stock award or substitutes a new award of Restricted Stock).
Except as otherwise provided in this paragraph 3, the Grantee will forfeit any unvested Restricted Stock if the Grantee experiences a Terminationof Service.
1

4. Legend on Stock Certificates. The Company may require that certificates for shares distributed to the Grantee pursuant to thisAgreement bear any legend that counsel to the Company believes is necessary or desirable to facilitate compliance with applicable securitieslaws. The Company shall not be obligated to transfer any stock to the Grantee free of the restrictive legend described in this Section 4 or of anyother restrictive legend, if such transfer, in the opinion of counsel for the Company, would violate any applicable law or any applicable regulation orrequirement of any securities exchange or similar entity.
5. Transferability. The Grantee shall not transfer or assign, in whole or in part, Restricted Stock subject to this Agreement in which theGrantee is not vested, other than (a) by will or by the laws of descent and distribution, or (b) by designation, in a manner established by theCompany, of a beneficiary or beneficiaries to exercise the rights of the Grantee and to receive any property distributable with respect to thisAgreement upon the death of the Grantee upon satisfaction of the vesting conditions described in paragraph 3 above.
6. Withholding. Any tax consequences arising from the grant of this Award shall be borne solely by the Grantee. The Company and/or itsRelated Corporations shall withhold taxes according to the requirements under the applicable laws, rules and regulations including withholdingtaxes at source. The Grantee will not be entitled to receive from the Company any Common Shares hereunder prior to the full payment of theGrantee’s tax liabilities relating to this Award. The Committee may, in its discretion, permit the Grantee to elect, subject to such conditions as theCommittee shall impose, (a) to have Common Shares otherwise issuable under the Plan withheld by the Company or (b) to deliver to the Companypreviously acquired Common Shares (through actual tender or attestation), in either case for the greatest number of whole shares having a FairMarket Value on the date immediately preceding the date of vesting not in excess of the amount required to satisfy the withholding tax obligations.
7. Compliance with Applicable Law. Notwithstanding any other provision of this Agreement, the Company shall have no obligation toissue any shares of Restricted Stock under this Agreement if such issuance would violate any applicable law or any applicable regulation orrequirement of any securities exchange or similar entity.
8. Administration. The authority to manage and control the operation and administration of this Agreement shall be vested in theCommittee, and the Committee shall have all powers with respect to this Agreement as it has with respect to the Plan. Any interpretation of theAgreement by the Committee and any decision made by it with respect to the Agreement is final and binding on all parties. Any inconsistencybetween this Agreement and the Plan shall be resolved in favor of the Plan.
9. Not an Employment Contract. This Award will not confer on the Grantee any right with respect to the continuance of employment orother service to the Company or any Related Corporation, nor will it interfere in any way with any right the Company or any Related Corporationwould otherwise have to terminate or modify the terms of such Grantee’s employment or other service at any time.
10. Notices. Any written notices provided for in this Agreement or the Plan shall be in writing and shall be deemed sufficiently given ifeither hand delivered or if sent by fax or overnight courier, or by postage paid first class mail. Notices sent by mail shall be deemed received threebusiness days after mailing but in no event later the date of actual receipt. Notices shall be directed, if to the Grantee, at the Grantee’s addressindicated by the Company’s records, or if to the Company, at the Company’s principal executive office.
11. Amendment. This Agreement may be amended in accordance with the provisions of the Plan, and may otherwise be amended bywritten agreement of the Grantee and the Company without the consent of any other person.
12. Counterparts. This Agreement may be executed in any number of counterparts, each of which shall be deemed to be an original andall of which together shall be deemed to be one and the same instrument.
13. Successors and Assigns. This Agreement shall be binding upon and shall inure to the benefit of the Company and the Grantee andtheir respective heirs, executors, administrators, legal representatives, successors and assigns, subject to the transfer restrictions set forth in thisAgreement and the Plan.
2

14. Applicable Law. This Agreement shall be construed in accordance with the laws of Bermuda (without reference to principles ofconflict of laws).
IN WITNESS WHEREOF, the parties hereto have executed and delivered this Restricted Stock Award Agreement on___________________, ____.
ENSTAR GROUP LIMITED
By:________________________________Name: Title:
____________________________________Grantee
Address:
3

Exhibit 10.2
SAR Award AgreementUnder the Enstar Group Limited 2016 Equity Incentive Plan
This SAR Award Agreement (this “Agreement”) is entered into as of the Grant Date (as defined below), by and between the Grantee (asdefined below) and Enstar Group Limited (the “Company”). Except as otherwise defined herein, capitalized terms used in this Agreement have theirrespective meanings set forth in the Plan (as defined below).
WITNESSETH THAT:
WHEREAS, the Company maintains the Enstar Group Limited 2016 Equity Incentive Plan (the “Plan”), which is incorporated into andforms a part of this Agreement; and
WHEREAS, the Grantee has been selected by the committee administering the Plan (the “Committee”) to receive a Stock AppreciationRight (“SAR”) award under the Plan.
NOW, THEREFORE, IT IS AGREED, by and between the Company and the Grantee as follows:
1. Terms of Award.
(a) The “Grantee” is _______________.
(b) The “Grant Date” is _____________.
(c) The number of ordinary shares of the Company (“Common Shares”) covered by the SAR awarded under this Agreement is_______.
(d) The Fair Market Value of a Common Share on the Grant Date is US$_____.
(e) The term of the SAR commences on the Grant Date and expires upon the earliest of (i) the tenth anniversary of the GrantDate; (ii) the date on which the Grantee occurs a Termination of Service due to Cause; (iii) one year after the Grantee incurs a Termination ofService due to death, disability, or Approved Retirement; or (iv) [ ] after the Grantee incurs a Termination of Service for any other reason other thanfor Cause, Approved Retirement, death or disability.
2. Award. Subject to the terms of this Agreement and the Plan, the Grantee is hereby granted the SAR as described in paragraph 1.
3. Vesting Schedule. Notwithstanding anything in the terms of the Plan to the contrary, the Grantee shall become vested in the SARaccording to the following schedule:
INSTALLMENT VESTING DATE
The SAR shall not become vested on the Vesting Date: (i) if the Grantee’s Termination of Service occurs on or before the Vesting Date; or (ii) if,on or before the Vesting Date, the Grantee has provided notice of his or her intention to effect a Termination of Service (even if the date of theTermination of Service occurs after the Vesting Date). In accordance with Subsection 13(d) and Section 14 of the Plan, the Grantee shall becomefully vested in the SAR upon a Change in Control (unless the surviving or successor corporation assumes this SAR award or substitutes a newaward of SARs). Except as otherwise provided in this Paragraph 3, the Grantee will forfeit any unvested portion of the SAR if the Granteeexperiences a Termination of Service.
1

4. Exercise and Settlement of SAR. The vested portion of the SAR is exercisable by delivery of a written exercise notice, signed by theGrantee (or other proper person) at such location and in such form as the Committee shall designate, which notice shall state the election toexercise the SAR, the number of Common Shares in respect of which the SAR is being exercised, and such other information as may be requiredby the Committee. The SAR shall be deemed exercised upon receipt by the Committee of the exercise notice. The SAR may not be exercised fora fraction of a Common Share. The SAR may not be exercised after expiration of its term. Settlement of the exercised SAR will occur as promptlyas possible. Settlement will be accomplished by the payment to the Grantee of cash having a value equal to the (i) excess, if any, of (A) the FairMarket Value of a Common Share on the date of exercise over (B) the Fair Market Value of a Common Share on the Grant Date, multiplied by (ii)the number of Common Shares with respect to which the SAR has been exercised.
5. Transferability. The Grantee shall not transfer or assign, in whole or in part, the SAR subject to this Agreement, other than (a) by willor by the laws of descent and distribution, or (b) by designation, in a manner established by the Company, of a beneficiary or beneficiaries toexercise the rights of the Grantee and to receive any property distributable with respect to this Agreement upon the death of the Grantee uponsatisfaction of the vesting conditions described in paragraph 3 above.
6. Withholding. Any tax consequences arising from the grant of this Award shall be borne solely by the Grantee. The Company and/or itsRelated Corporations shall withhold taxes according to the requirements under the applicable laws, rules and regulations including withholdingtaxes at source. The Grantee will not be entitled to receive from the Company any cash payout hereunder prior to the full payment of the Grantee’stax liabilities relating to this Award.
7. No Common Shares. The Company shall have no obligation to issue any Common Shares in settlement of the SAR awarded underthis Agreement.
8. Administration. The authority to manage and control the operation and administration of this Agreement shall be vested in theCommittee, and the Committee shall have all powers with respect to this Agreement as it has with respect to the Plan. Any interpretation of theAgreement by the Committee and any decision made by it with respect to the Agreement is final and binding on all parties. Any inconsistencybetween this Agreement and the Plan shall be resolved in favor of the Plan.
9. Not an Employment Contract. This Award will not confer on the Grantee any right with respect to the continuance of employment orother service to the Company or any Related Corporation, nor will it interfere in any way with any right the Company or any Related Corporationwould otherwise have to terminate or modify the terms of such Grantee’s employment or other service at any time.
10. Notices. Any written notices provided for in this Agreement or the Plan shall be in writing and shall be deemed sufficiently given ifeither hand delivered or if sent by fax or overnight courier, or by postage paid first class mail. Notices sent by mail shall be deemed received threebusiness days after mailing but in no event later the date of actual receipt. Notices shall be directed, if to the Grantee, at the Grantee’s addressindicated by the Company’s records, or if to the Company or the Committee, at the Company’s principal executive office.
11. Amendment. This Agreement may be amended in accordance with the provisions of the Plan, and may otherwise be amended bywritten agreement of the Grantee and the Company without the consent of any other person.
12. Counterparts. This Agreement may be executed in any number of counterparts, each of which shall be deemed to be an original andall of which together shall be deemed to be one and the same instrument.
13. Successors and Assigns. This Agreement shall be binding upon and shall inure to the benefit of the Company and the Grantee andtheir respective heirs, executors, administrators, legal representatives, successors and assigns, subject to the transfer restrictions set forth in thisAgreement and the Plan.
14. Entire Agreement. This Agreement and the Plan contain the entire agreement and understanding of the parties hereto with respect tothe subject matter contained herein and therein and supersede all prior communications, representations and negotiations in respect thereto.
2

15. Applicable Law. This Agreement shall be construed in accordance with the laws of Bermuda (without reference to principles ofconflict of laws).
IN WITNESS WHEREOF, the parties hereto have executed and delivered this SAR Award Agreement on ________________ ___, ____.
ENSTAR GROUP LIMITED
By:________________________________Name: Title:
____________________________________Grantee
Address:
3

Exhibit 31.1CERTIFICATION PURSUANT TO
RULE 13a-14(a)/15d-14(a),AS ADOPTED PURSUANT TO SECTION 302OF THE SARBANES-OXLEY ACT OF 2002
I, Dominic F. Silvester, certify that:
1. I have reviewed this Quarterly Report on Form 10-Q of Enstar Group Limited;
2. Based on my knowledge, this report does not contain any untrue statement of a material fact or omit to state a material fact necessary tomake the statements made, in light of the circumstances under which such statements were made, not misleading with respect to theperiod covered by this report;
3. Based on my knowledge, the financial statements, and other financial information included in this report, fairly present in all materialrespects the financial condition, results of operations and cash flows of the registrant as of, and for, the periods presented in this report;
4. The registrant’s other certifying officer and I are responsible for establishing and maintaining disclosure controls and procedures (asdefined in Exchange Act Rules 13a-15(e) and 15d-15(e)) and internal control over financial reporting (as defined in Exchange Act Rules13a-15(f) and 15d-15(f)) for the registrant and have:
a. Designed such disclosure controls and procedures, or caused such disclosure controls and procedures to be designed under oursupervision, to ensure that material information relating to the registrant, including its consolidated subsidiaries, is made known tous by others within those entities, particularly during the period in which this report is being prepared;
b. Designed such internal control over financial reporting, or caused such internal control over financial reporting to be designedunder our supervision, to provide reasonable assurance regarding the reliability of financial reporting and the preparation offinancial statements for external purposes in accordance with generally accepted accounting principles;
c. Evaluated the effectiveness of the registrant’s disclosure controls and procedures and presented in this report our conclusionsabout the effectiveness of the disclosure controls and procedures, as of the end of the period covered by this report based onsuch evaluation; and
d. Disclosed in this report any change in the registrant’s internal control over financial reporting that occurred during the registrant’smost recent fiscal quarter that has materially affected, or is reasonably likely to materially affect, the registrant’s internal controlover financial reporting; and
5. The registrant’s other certifying officer and I have disclosed, based on our most recent evaluation of internal control over financialreporting, to the registrant’s auditors and the audit committee of the registrant’s board of directors (or persons performing the equivalentfunctions):
a. All significant deficiencies and material weaknesses in the design or operation of internal control over financial reporting which arereasonably likely to adversely affect the registrant’s ability to record, process, summarize and report financial information; and
b. Any fraud, whether or not material, that involves management or other employees who have a significant role in the registrant’sinternal control over financial reporting.
Dated: August 5, 2016
/S/ DOMINIC F. SILVESTER
Dominic F. SilvesterChief Executive Officer

Exhibit 31.2
CERTIFICATION PURSUANT TO
RULE 13a-14(a)/15d-14(a),
AS ADOPTED PURSUANT TO SECTION 302
OF THE SARBANES-OXLEY ACT OF 2002
I, Mark Smith, certify that:
1. I have reviewed this Quarterly Report on Form 10-Q of Enstar Group Limited;
2. Based on my knowledge, this report does not contain any untrue statement of a material fact or omit to state a material fact necessary tomake the statements made, in light of the circumstances under which such statements were made, not misleading with respect to theperiod covered by this report;
3. Based on my knowledge, the financial statements, and other financial information included in this report, fairly present in all materialrespects the financial condition, results of operations and cash flows of the registrant as of, and for, the periods presented in this report;
4. The registrant’s other certifying officer and I are responsible for establishing and maintaining disclosure controls and procedures (asdefined in Exchange Act Rules 13a-15(e) and 15d-15(e)) and internal control over financial reporting (as defined in Exchange Act Rules13a-15(f) and 15d-15(f)) for the registrant and have:
a. Designed such disclosure controls and procedures, or caused such disclosure controls and procedures to be designed under oursupervision, to ensure that material information relating to the registrant, including its consolidated subsidiaries, is made known tous by others within those entities, particularly during the period in which this report is being prepared;
b. Designed such internal control over financial reporting, or caused such internal control over financial reporting to be designedunder our supervision, to provide reasonable assurance regarding the reliability of financial reporting and the preparation offinancial statements for external purposes in accordance with generally accepted accounting principles;
c. Evaluated the effectiveness of the registrant’s disclosure controls and procedures and presented in this report our conclusionsabout the effectiveness of the disclosure controls and procedures, as of the end of the period covered by this report based onsuch evaluation; and
d. Disclosed in this report any change in the registrant’s internal control over financial reporting that occurred during the registrant’smost recent fiscal quarter that has materially affected, or is reasonably likely to materially affect, the registrant’s internal controlover financial reporting; and
5. The registrant’s other certifying officer and I have disclosed, based on our most recent evaluation of internal control over financialreporting, to the registrant’s auditors and the audit committee of the registrant’s board of directors (or persons performing the equivalentfunctions):
a. All significant deficiencies and material weaknesses in the design or operation of internal control over financial reporting which arereasonably likely to adversely affect the registrant’s ability to record, process, summarize and report financial information; and
b. Any fraud, whether or not material, that involves management or other employees who have a significant role in the registrant’sinternal control over financial reporting.
Dated: August 5, 2016
/S/ MARK SMITH
Mark SmithChief Financial Officer

Exhibit 32.1
CERTIFICATION PURSUANT TO
18 U.S.C. SECTION 1350,
AS ADOPTED PURSUANT TO SECTION 906
OF THE SARBANES-OXLEY ACT OF 2002
In connection with the Quarterly Report of Enstar Group Limited (the “Company”) on Form 10-Q for the quarterly period ended June 30,2016, as filed with the Securities and Exchange Commission on the date hereof (the “Report”), I, Dominic F. Silvester, certify, pursuant to 18U.S.C. section 1350, as adopted pursuant to section 906 of the Sarbanes-Oxley Act of 2002, that to the best of my knowledge:
(1) The Report fully complies with the requirements of Section 13(a) or 15(d) of the Securities Exchange Act of 1934; and
(2) The information contained in the Report fairly presents, in all material respects, the financial condition and results of operations of theCompany.
Dated: August 5, 2016
/S/ DOMINIC F. SILVESTER
Dominic F. SilvesterChief Executive Officer

Exhibit 32.2
CERTIFICATION PURSUANT TO
18 U.S.C. SECTION 1350,
AS ADOPTED PURSUANT TO SECTION 906
OF THE SARBANES-OXLEY ACT OF 2002
In connection with the Quarterly Report of Enstar Group Limited (the “Company”) on Form 10-Q for the quarterly period ended June 30,2016, as filed with the Securities and Exchange Commission on the date hereof (the “Report”), I, Mark Smith, certify, pursuant to 18 U.S.C.section 1350, as adopted pursuant to section 906 of the Sarbanes-Oxley Act of 2002, that to the best of my knowledge:
(1) The Report fully complies with the requirements of Section 13(a) or 15(d) of the Securities Exchange Act of 1934; and
(2) The information contained in the Report fairly presents, in all material respects, the financial condition and results of operations of theCompany.
Dated: August 5, 2016
/S/ MARK SMITH
Mark SmithChief Financial Officer
