Ensure CTE data can be accessed, analyzed and useds3.amazonaws.com/PCRN/docs/DQI/Session_2_DQI_comb_Shah...DQC 10 State Actions to Ensure Effective Data Use Link data systems across
24
Ensure CTE data can be accessed, analyzed and used Rebecca Shah
Ensure CTE data can be accessed, analyzed and used
Rebecca Shah
States Have Made Significant Progress Building SLDS
2010
24 states report that they have all 10 Essential Elements
2010
No states have taken all 10 State Actions
Presenter
Presentation Notes
States have made significant progress building the SLDS…
DQC 10 State Actions to Ensure Effective Data Use
Link data systems across P-20 and the workforce to
answer key questions
Ensure that appropriate data can be accessed while
protecting privacy
Build capacity of all stakeholders to use longitudinal data
1. Link state K-12 data systems with early learning, postsecondary, workforce, and others
2. Create sustainable support for the longitudinal data system (LDS)
3. Develop governance structures to guide LDS4. Build state data repositories
5. Provide timely role-based access to data6. Create progress reports with student-level data
for educators, students, and parents to make individual decisions
7. Create reports with longitudinal statistics to guide change at system level
8. Develop a research agenda9. Implement policies to ensure educators know
how to use data appropriately10. Raise awareness to ensure all key stakeholders
know how to access and use data
Presenter
Presentation Notes
Focusing this session on DQC’s second imperative around data access including how stakeholders access the information and what types of information (reporting) are available to them.
Action 5: Timely, Role-Based Access
8 states ensure timely, role-based access.
Presenter
Presentation Notes
Action 5: Implement systems to provide all stakeholders with timely access to the information they need while protecting student privacy In each of the three imperatives there is one Action needing more national attention than others. Action 5 is that Action in this second imperative with only 8 states ensuring timely, role-based access as defined through DQC’s questions, including ensuring that stakeholders have access to the data they need; ensuring a variety of stakeholders have access to data; ensuring teachers and parents (or students) have access to data via web portals; and ensuring the SEA publishes guidelines for data access via web-portals by user group.
Action 5: Colorado Growth Model
Presenter
Presentation Notes
The Colorado Department of Education has developed a data visualization tool that enables users to explore the complete set of the state’s academic performance data and beyond based on the users’ role. Called the Colorado Growth Model, this interactive web application allows users to navigate through the state's academic growth and achievement data using an intuitive and user-friendly visual interface. Based on delegated roles and password-protected credentials, district and school users can compare the performance of groups of students both in the public domain as well as those they have drill-down rights to see. Figure 2 shows one of Colorado’s aggregate-level growth reports. In these reports, the growth information is aggregated by school and is available to the public on the Web. Each circle represents a school, with school size (total student enrollment) represented by the size of the circle. The chart is divided into four labeled quadrants. The lower left quadrant represents “lower growth [and] lower achievement.” Correspondingly, the circles in the lower left quadrant represent schools with fewer than half of their students reaching the state’s proficiency standard and whose median students achieved below-typical growth; one of these schools is highlighted in blue. Likewise the schools in the lower right quadrant have fewer than half of their students reaching proficiency, but their median students had above-typical growth. Schools with majorities of proficient students and with below- and above-typical median growth are shown in the upper two quadrants.
Action 5: Colorado Growth Model
Presenter
Presentation Notes
Figure 1 shows a mock-up of Colorado’s student-level growth report. Parents can gain password-protected access to reports on their own children, while teachers can view information on the students that they teach. The figure shows how rapidly a hypothetical student grew in mathematics relative to other students with a similar test score history. For example, the student achieved below typical growth in 7th grade (at the 26th growth percentile, growing as fast as or faster than 26 percent of students, but slower than the other 74 percent of students), well above typical growth in 8th grade and below typical growth in 9thgrade.
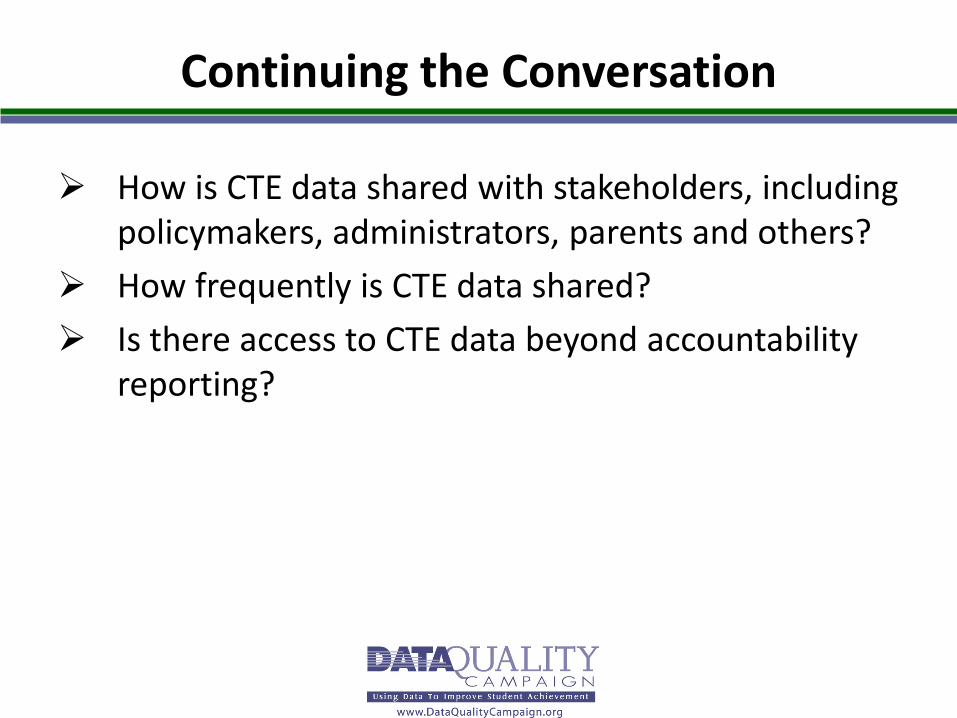
Continuing the Conversation
How is CTE data shared with stakeholders, including policymakers, administrators, parents and others?
How frequently is CTE data shared? Is there access to CTE data beyond accountability
reporting?
Action 6: Student-Level Reports
23 states provide reports using student-level longitudinal data.
Presenter
Presentation Notes
Action 6: Create progress reports with individual student data that provide information educators, parents and students can use to improve student performance 23 states report providing progress reports using student-level data; producing at least two reports using SL data; and teachers and one other stakeholder have access to the reports.
Action 6: Overall Production of Student-Level Longitudinal Reports
Presenter
Presentation Notes
For more detail, the following three reports are produced by states using SL aggregate data.
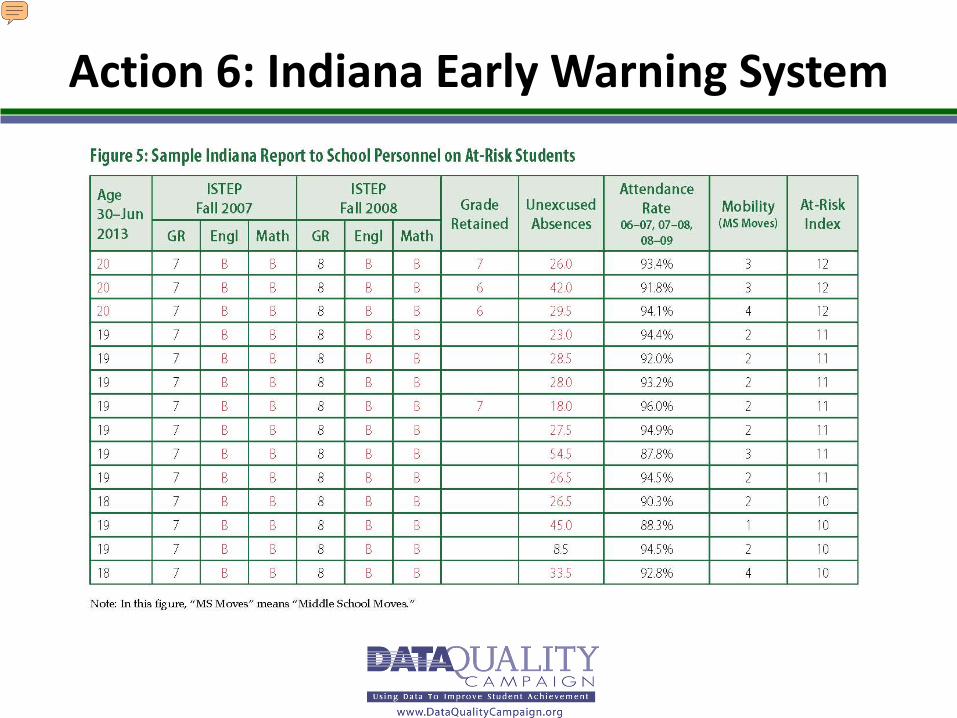
Action 6: Indiana Early Warning System
Presenter
Presentation Notes
Figure 4 shows the criteria that Indiana uses in its early warning report. These criteria are the key to understanding the report in Figure 5, which identifies at-risk students so that the students’ teachers and counselors can develop appropriate interventions. (In an actual version, the students’ names would be on the report.)t that identifies entering 9th graders who are at risk of not graduating from high school.
Action 6: Indiana Early Warning System
Presenter
Presentation Notes
For each student, the report shows the information that was used to determine that the student is at risk. For example, the students in the report are entering high school freshmen in fall 2009; a “B” in the column under “ISTEP” means that the student scored below passing on the state test. A student who would be 20 years old if she or he graduates in four years is around two years older than the typical 9th grader — a common risk factor among students who drop out.
Action 7: Aggregate-Level Reports
27 states provide reports using aggregate-level longitudinal data.
Presenter
Presentation Notes
Action 7: Create reports that include longitudinal statistics on school systems and groups of students to guide school-, district-, and state-level improvement efforts 27 states have reports using aggregate-level data available to stakeholders; produce at least two reports using AG data; and make the reports available on the SEA web site.
Action 7: Public Availability ofAggregate-Level Longitudinal Reports
Presenter
Presentation Notes
For more detail, the following reports using aggregate-level longitudinal data are available to the public through the web (and not available). 14 states produce predictive/relationship analysis 23 feedback 30 cohort graduation/completion 33 growth
Action 7: Kentucky Feedback Reports
Continuing the Conversation
Is CTE data included in state reports using student-level and aggregate-level longitudinal data?
What types of these reports would be valuable to CTE stakeholders?
Additional Data Access Resources
Creating Reports Using Longitudinal Datawww.DataQualityCampaign.org/resources/1065
State Action 5: Role-Based, Timely Access to Information www.DataQualityCampaign.org/resources/989
Continuing the DQC Conversation: How should CTE data be shared with stakeholders,
including policymakers, administrators, parents and others?
How frequently should CTE data be shared? How do we assure access to CTE data beyond
accountability reporting? How do we make sure CTE data is included in state
reports using student-level and aggregate-level longitudinal data?
What types of reports would be valuable to CTE stakeholders?
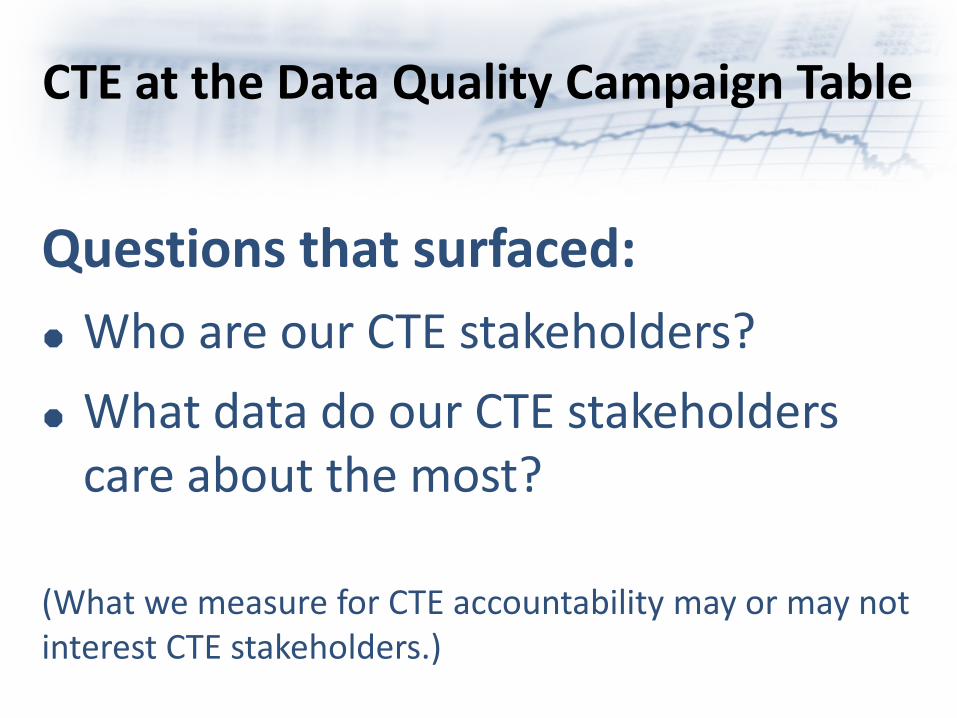
Questions that surfaced: Who are our CTE stakeholders? What data do our CTE stakeholders
care about the most?
(What we measure for CTE accountability may or may not interest CTE stakeholders.)
CTE at the Data Quality Campaign Table
CTE StakeholderWhat Groups (?)Data do CTEStakeholders Care About?
Secondary Students &
Parents
Secondary Teachers &
Admins.
Post-secondary Students
Post-secondary Instructors & Admins.
Business Partners
Policy Makers &
GovernmentOther?
Course grades X X X XPassage of HS graduation exam X X X X XHS diploma / College Degree attainment X X X X X XArticulated postsecondary credit X X X X XMeets benchmarks on college-ready academic assessment X X X X X X
Technically proficient (technical assessment passage) X X X X X X
State or industry-recognized credential X X X X XHave “21st century skills” X XPlacement: Enrollment in postsecondary X X X X X XPlacement: employment or in military or apprenticeship program X X X X X
Non-remedial in postsecondary X X X X XSchools operate programs that meet local/regional business/industry needs X X X X X X
Wages earned by students who complete the CTE POS and obtain employment X X X X X X
Return on Investment (ROI) XOther?
CTE at the Data Quality Campaign Table
CTE at the Data Quality Campaign Table
Where do we start? How do we determine our CTE
stakeholder groups? How do we determine what data our
CTE stakeholders care about the most?
Where do we start? What reports are needed for each “X” in the
grid? What data fields are needed for each report? What would be consistent definitions &
criteria for each measure? Who collects the data required? What relationships would be helpful to obtain
the needed data elements?
CTE at the Data Quality Campaign Table
Sharon Enright, Ph.D.Associate Director, CTE Performance and AccountabilityOhio Department of Education, Office of CTE25 South Front St., MS 602 Columbus OH 43215-4183 [email protected]
Kathy WilkinsPerkins Accountability Specialist and Grant ManagerMontana University SystemPO Box 203201Helena MT [email protected]