entanglement of marine animal in marine renewable energy
TRANSCRIPT
ORE Open Research Exeter
TITLE
Assessment of entanglement risk to marine megafauna due to offshore renewable energy mooringsystems
AUTHORS
Harnois, Violette; Smith, Helen C.M.; Benjamins, Steven; et al.
JOURNAL
International Journal of Marine Energy
DEPOSITED IN ORE
25 June 2015
This version available at
http://hdl.handle.net/10871/17663
COPYRIGHT AND REUSE
Open Research Exeter makes this work available in accordance with publisher policies.
A NOTE ON VERSIONS
The version presented here may differ from the published version. If citing, you are advised to consult the published version for pagination, volume/issue and date ofpublication
Assessment of entanglement risk to marine megafauna due to
offshore renewable energy mooring systems
Violette Harnoisa, Helen CM Smith
a, Steven Benjamins
b, Lars Johanning
a
+0044 (0)1326 259308
a College of Engineering, Mathematics and Physical Sciences
Renewable Energy
University of Exeter, Cornwall Campus, Cottage 2
Penryn, Cornwall TR10 9FE, UK
[email protected] b SAMS (Scottish Association for Marine Science)
Oban, Argyll, Scotland, PA37 1QA, UK
Abstract: This paper defines a methodology to compare different offshore renewable energy
(ORE) mooring configurations in terms of the risk of entanglement they present to marine
megafauna. Currently, the entanglement of large marine animals is not explicitly considered
in environmental impact studies. Recommendations need to be developed, assessing the risk
of entanglement of ORE mooring configurations at the beginning of their design process.
Physical parameters of the mooring system affecting the relative risk of entanglement have
been identified as tension characteristics, swept volume ratio and mooring line curvature.
These have been investigated further through six different mooring configurations: catenary
with chains only, catenary with chains and nylon ropes, catenary with chains and polyester
ropes, taut, catenary with accessory buoys, taut with accessory buoys.
Results indicate that the taut configuration has the lowest relative risk of entanglement, while
the highest relative risk occurs with catenary moorings with chains and nylon ropes or with
catenary moorings with accessory buoys. However, the absolute risk of entanglement is
found to be low, regardless of the mooring configuration. This methodology can also be
applied to other mooring configurations, arrays or power cables.
Keywords Entanglement, Mooring system, Offshore renewable energy, Marine
megafauna, Environmental impact assessment
Highlights
Comparison of the risk of entanglement of marine megafauna for ORE mooring
systems
Parameters: tension characteristics, swept volume ratio and mooring line curvature
Case study with 6 mooring configurations commonly used for floating ORE devices
Catenary moorings and moorings using accessory buoys: higher risk of entanglement
The overall risk of entanglement is low
1. Introduction
Floating offshore renewable energy (ORE) technologies, which include most wave and some
tidal devices, are undergoing extensive development and testing but are yet to reach full
commercialisation. The offshore wind industry is also moving towards the deployment of
floating turbines to enable a move into deeper water. A number of individual full-scale
devices have been successfully deployed and the number of floating offshore renewable
energy projects, and the array sizes proposed, are growing. One of the many challenges
facing developers wishing to test a single device or to deploy an array is the need to ensure
that these devices do not adversely impact the marine environment, or, where this is
unavoidable, that such impacts are minimised and mitigated against. Although requirements
differ slightly between countries, most proposed deployments require environmental impact
studies. Guidelines for the implementation of such environmental impact assessments for
marine energy are detailed for example in the EquiMar protocols [1]. With so few devices
having undergone testing at sea, it will only be possible to validate the predicted
environmental effects once devices have been in place for a number of years.
This paper considers one aspect of environmental impact assessment: the potential for
entanglement of marine megafauna (e.g. cetaceans, pinnipeds, sea turtles, large sharks, etc.),
between mooring lines of floating offshore renewable energy devices. Entanglement can be
defined as the inadvertent capture or restraint of marine animals by strong, flexible materials
of anthropogenic origin. Bycatchs by lost or discarded fishing gears entangled in moorings
are not considered in this study.
The consequences of entanglement are loss of animal life - possibly from endangered
species- and negative public opinion. Entanglement has been observed (albeit infrequently)
for large whales in stationary trap fisheries [2] and in aquaculture [3-4]. It could be noted that
no entanglement has been reported in oil and gas moorings (which however does not mean it
did not occur). Smaller animals are more likely to become entangled in fishing gears, for
example pinnipeds (seals and sea lions) [5], or large sharks and rays [6-7]. It should be noted
that entanglement is difficult to detect because it occurs offshore and underwater in remote
locations with few, if any, observers.
At present, entanglement is not addressed as standard in environmental impact assessment
(EIA) studies, and there are currently no records of such entanglement occurring at any
offshore renewables site; however the risk of entanglement of marine mammals and turtles in
moorings for wave energy devices has been raised [8]. An additional consequence of
entanglement in the case of an ORE device would be a possible damage to an ORE device
leading to a change in the performance of the mooring or the device.
In addition to requirements for environmental impact assessments, ORE moorings have their
technical requirements, which have certain commonalities with conventional mooring
systems, used, for example, for oil and gas platforms [9]. The key aspect is the need to keep
the floating structure in position. In some cases, the restraint of the dynamic motion of the
floating structure is additionally required, for example for floating wind or overtopping wave
energy devices. In other cases, such as point absorber wave energy devices, the mooring
system must leave the floating structure to move “freely” at the wave frequency in order to
maximise energy production. In both cases, the slow and large horizontal motion of the
floating structure should be restrained because a) the power cable, exporting energy, should
not become tensioned, and b) in an array configuration, collisions must be avoided between
devices.
This paper presents a methodology developed to evaluate the relative risk of marine
megafauna entanglement with different mooring systems, focussing on the physical
characteristics of mooring lines that will influence this risk. It is not intended to be a
quantitative assessment of risk; this is unfeasible given the scarcity of data available.
However, it provides a tool that will enable developers to assess whether their proposed
mooring configurations will pose a higher or lower entanglement risk to marine life than
alternative systems, and this can then be highlighted in the EIA with appropriate monitoring
programmes proposed to mitigate any risk if required. The general methodology, using the
hydrodynamic modelling software OrcaFlex, is described in Section 2, with the detailed
physical parameters and their specific mode of assessment presented in Section 3. Results are
presented for each of the physical parameters, and combined in order to assess the overall
relative risk of a particular mooring configuration in Section 4, followed by a discussion of
these results and their implication for the industry in Section 5.
2. Modelling methodology
2.1. OrcaFlex model
This investigation utilises OrcaFlex, a 3D time-domain finite element method (FEM)
modelling program, to predict the response of the various mooring configurations to wave
loading. OrcaFlex is one of the leading software packages for the dynamic analyses of
mooring systems and is well validated for this purpose (e.g. [10]). It is widely used in the
wave energy sector, both in device development ([11-12]), and in specific wave energy
moorings research ([13-14]). Applications also exist for floating wind turbines, for example,
a specific coupling module, FASTlink, has been developed in OrcaFlex to integrate the
aerodynamic loads, the turbine control system and the flexure of the turbine [15].
2.2. Numerical set-up
Within the model, each mooring line is divided into segments with visco-elastic behaviour,
connected by nodes with a given mass (Figure 1). OrcaFlex models are built using a
combination of components such as buoys or lines, and environmental conditions (wave,
wind or current) are provided as model input.
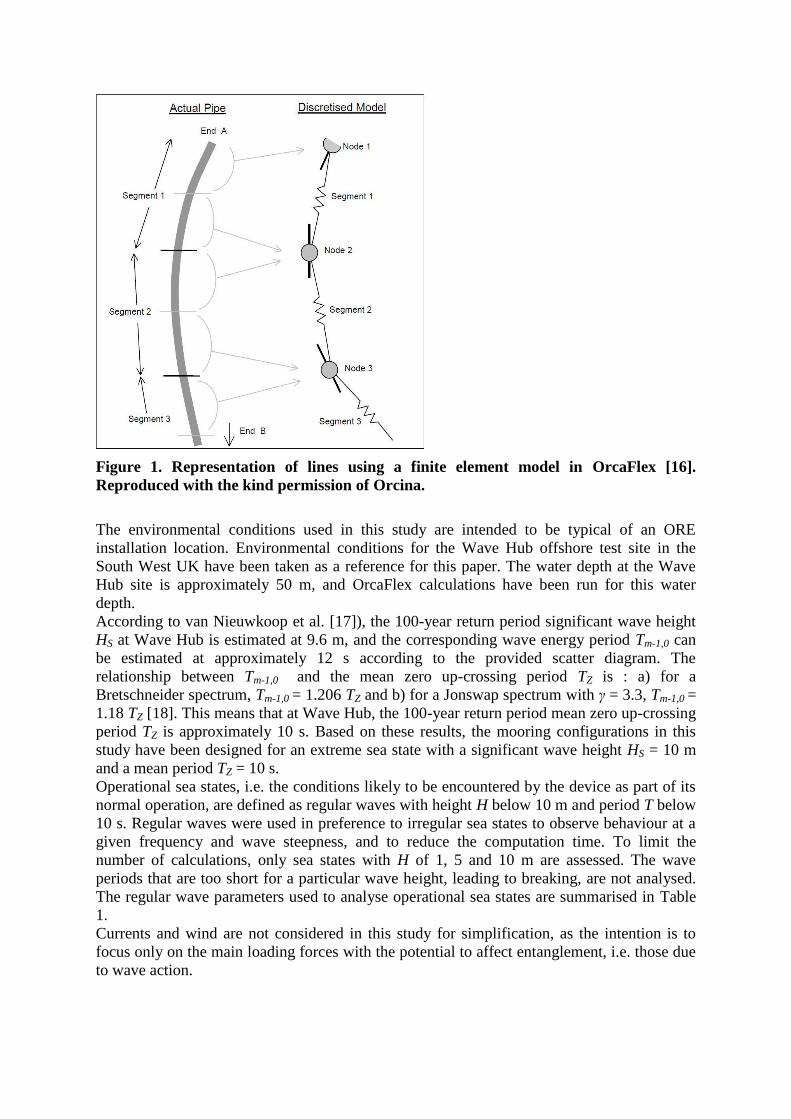
Figure 1. Representation of lines using a finite element model in OrcaFlex [16].
Reproduced with the kind permission of Orcina.
The environmental conditions used in this study are intended to be typical of an ORE
installation location. Environmental conditions for the Wave Hub offshore test site in the
South West UK have been taken as a reference for this paper. The water depth at the Wave
Hub site is approximately 50 m, and OrcaFlex calculations have been run for this water
depth.
According to van Nieuwkoop et al. [17]), the 100-year return period significant wave height
HS at Wave Hub is estimated at 9.6 m, and the corresponding wave energy period Tm-1,0 can
be estimated at approximately 12 s according to the provided scatter diagram. The
relationship between Tm-1,0 and the mean zero up-crossing period TZ is : a) for a
Bretschneider spectrum, Tm-1,0 = 1.206 TZ and b) for a Jonswap spectrum with γ = 3.3, Tm-1,0 =
1.18 TZ [18]. This means that at Wave Hub, the 100-year return period mean zero up-crossing
period TZ is approximately 10 s. Based on these results, the mooring configurations in this
study have been designed for an extreme sea state with a significant wave height HS = 10 m
and a mean period TZ = 10 s.
Operational sea states, i.e. the conditions likely to be encountered by the device as part of its
normal operation, are defined as regular waves with height H below 10 m and period T below
10 s. Regular waves were used in preference to irregular sea states to observe behaviour at a
given frequency and wave steepness, and to reduce the computation time. To limit the
number of calculations, only sea states with H of 1, 5 and 10 m are assessed. The wave
periods that are too short for a particular wave height, leading to breaking, are not analysed.
The regular wave parameters used to analyse operational sea states are summarised in Table
1.
Currents and wind are not considered in this study for simplification, as the intention is to
focus only on the main loading forces with the potential to affect entanglement, i.e. those due
to wave action.
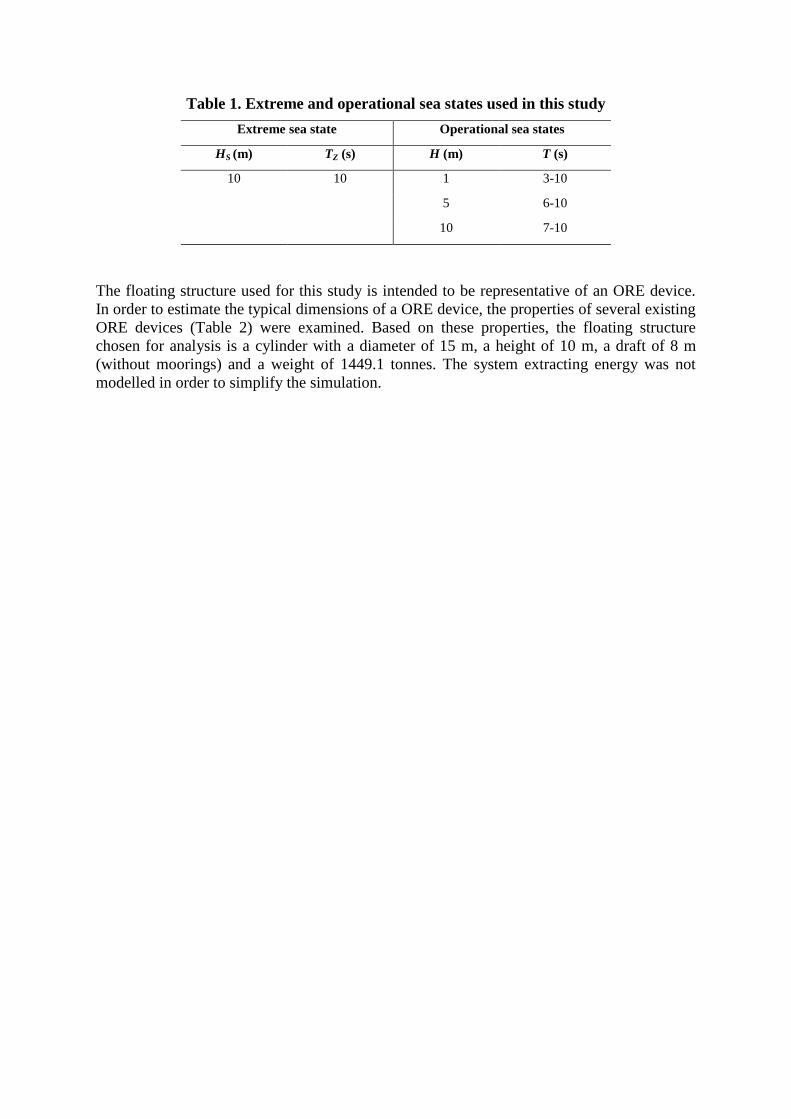
Table 1. Extreme and operational sea states used in this study
Extreme sea state Operational sea states
HS (m) TZ (s) H (m) T (s)
10 10 1 3-10
5 6-10
10 7-10
The floating structure used for this study is intended to be representative of an ORE device.
In order to estimate the typical dimensions of a ORE device, the properties of several existing
ORE devices (Table 2) were examined. Based on these properties, the floating structure
chosen for analysis is a cylinder with a diameter of 15 m, a height of 10 m, a draft of 8 m
(without moorings) and a weight of 1449.1 tonnes. The system extracting energy was not
modelled in order to simplify the simulation.
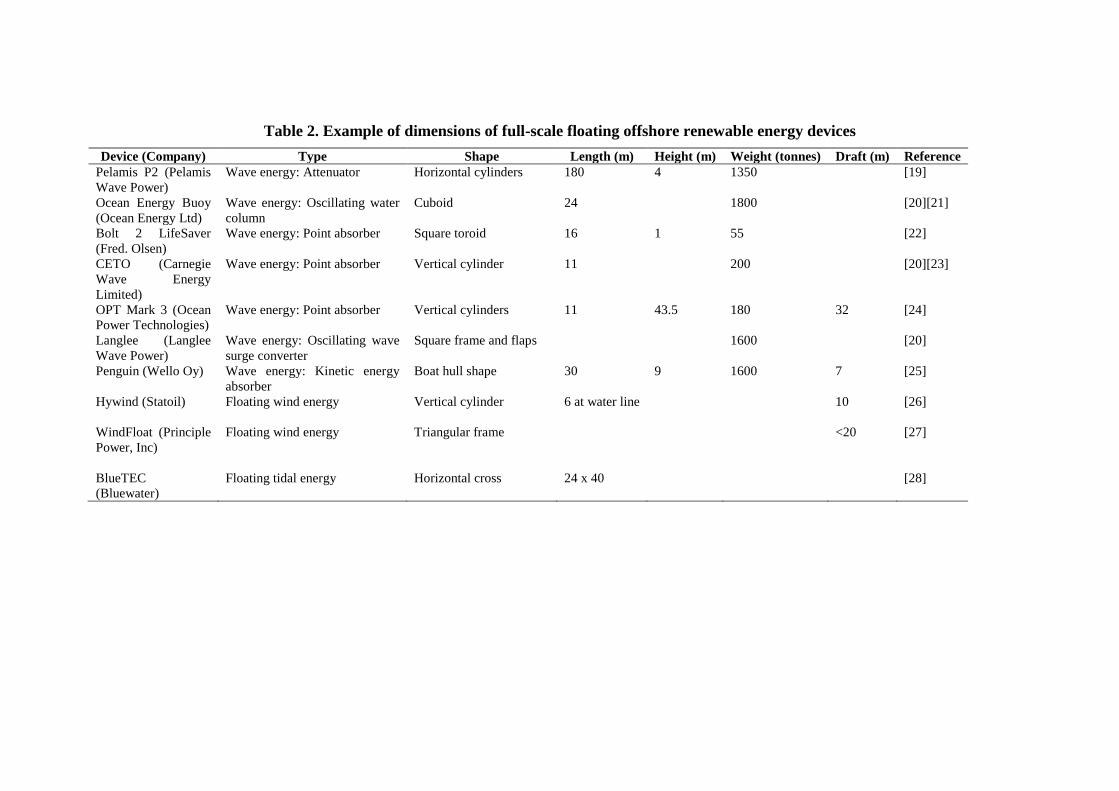
Table 2. Example of dimensions of full-scale floating offshore renewable energy devices
Device (Company) Type Shape Length (m) Height (m) Weight (tonnes) Draft (m) Reference
Pelamis P2 (Pelamis
Wave Power)
Wave energy: Attenuator Horizontal cylinders 180 4 1350 [19]
Ocean Energy Buoy
(Ocean Energy Ltd)
Wave energy: Oscillating water
column
Cuboid 24 1800 [20][21]
Bolt 2 LifeSaver
(Fred. Olsen)
Wave energy: Point absorber Square toroid 16 1 55 [22]
CETO (Carnegie
Wave Energy
Limited)
Wave energy: Point absorber Vertical cylinder 11 200 [20][23]
OPT Mark 3 (Ocean
Power Technologies)
Wave energy: Point absorber Vertical cylinders 11 43.5 180 32 [24]
Langlee (Langlee
Wave Power)
Wave energy: Oscillating wave
surge converter
Square frame and flaps 1600 [20]
Penguin (Wello Oy) Wave energy: Kinetic energy
absorber
Boat hull shape 30 9 1600 7 [25]
Hywind (Statoil)
Floating wind energy Vertical cylinder 6 at water line 10 [26]
WindFloat (Principle
Power, Inc)
Floating wind energy Triangular frame <20 [27]
BlueTEC
(Bluewater)
Floating tidal energy Horizontal cross 24 x 40 [28]
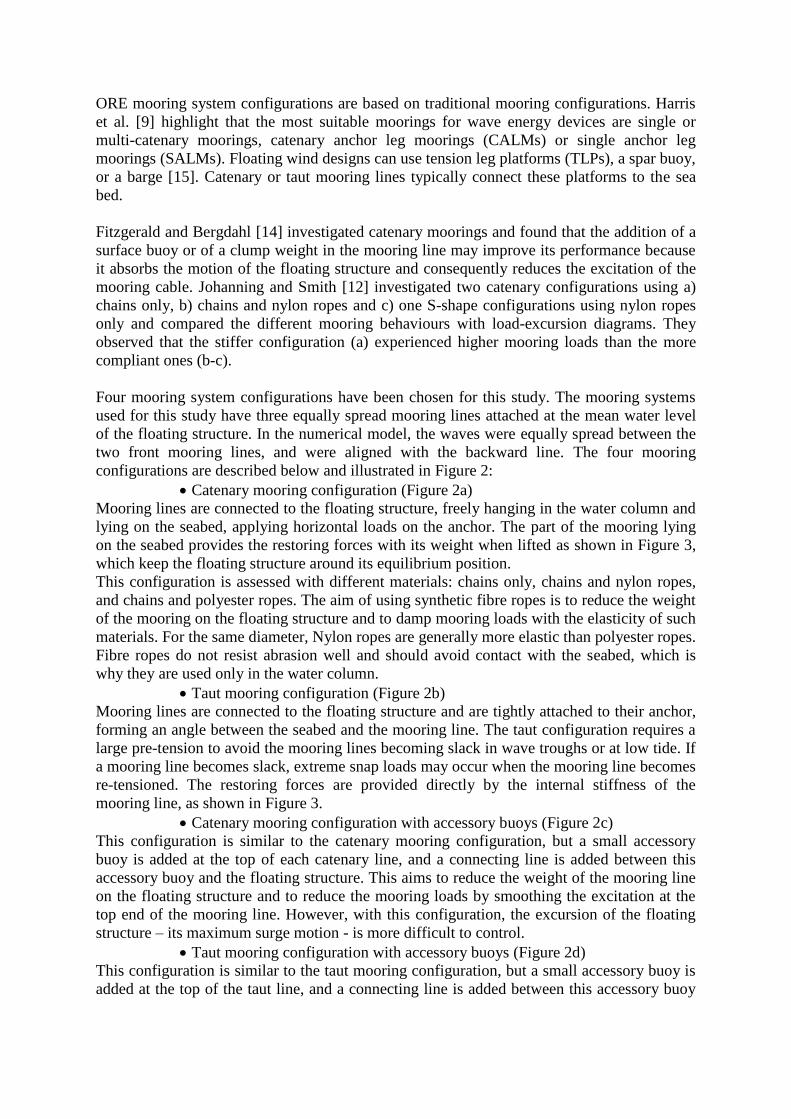
ORE mooring system configurations are based on traditional mooring configurations. Harris
et al. [9] highlight that the most suitable moorings for wave energy devices are single or
multi-catenary moorings, catenary anchor leg moorings (CALMs) or single anchor leg
moorings (SALMs). Floating wind designs can use tension leg platforms (TLPs), a spar buoy,
or a barge [15]. Catenary or taut mooring lines typically connect these platforms to the sea
bed.
Fitzgerald and Bergdahl [14] investigated catenary moorings and found that the addition of a
surface buoy or of a clump weight in the mooring line may improve its performance because
it absorbs the motion of the floating structure and consequently reduces the excitation of the
mooring cable. Johanning and Smith [12] investigated two catenary configurations using a)
chains only, b) chains and nylon ropes and c) one S-shape configurations using nylon ropes
only and compared the different mooring behaviours with load-excursion diagrams. They
observed that the stiffer configuration (a) experienced higher mooring loads than the more
compliant ones (b-c).
Four mooring system configurations have been chosen for this study. The mooring systems
used for this study have three equally spread mooring lines attached at the mean water level
of the floating structure. In the numerical model, the waves were equally spread between the
two front mooring lines, and were aligned with the backward line. The four mooring
configurations are described below and illustrated in Figure 2:
Catenary mooring configuration (Figure 2a)
Mooring lines are connected to the floating structure, freely hanging in the water column and
lying on the seabed, applying horizontal loads on the anchor. The part of the mooring lying
on the seabed provides the restoring forces with its weight when lifted as shown in Figure 3,
which keep the floating structure around its equilibrium position.
This configuration is assessed with different materials: chains only, chains and nylon ropes,
and chains and polyester ropes. The aim of using synthetic fibre ropes is to reduce the weight
of the mooring on the floating structure and to damp mooring loads with the elasticity of such
materials. For the same diameter, Nylon ropes are generally more elastic than polyester ropes.
Fibre ropes do not resist abrasion well and should avoid contact with the seabed, which is
why they are used only in the water column.
Taut mooring configuration (Figure 2b)
Mooring lines are connected to the floating structure and are tightly attached to their anchor,
forming an angle between the seabed and the mooring line. The taut configuration requires a
large pre-tension to avoid the mooring lines becoming slack in wave troughs or at low tide. If
a mooring line becomes slack, extreme snap loads may occur when the mooring line becomes
re-tensioned. The restoring forces are provided directly by the internal stiffness of the
mooring line, as shown in Figure 3.
Catenary mooring configuration with accessory buoys (Figure 2c)
This configuration is similar to the catenary mooring configuration, but a small accessory
buoy is added at the top of each catenary line, and a connecting line is added between this
accessory buoy and the floating structure. This aims to reduce the weight of the mooring line
on the floating structure and to reduce the mooring loads by smoothing the excitation at the
top end of the mooring line. However, with this configuration, the excursion of the floating
structure – its maximum surge motion - is more difficult to control.
Taut mooring configuration with accessory buoys (Figure 2d)
This configuration is similar to the taut mooring configuration, but a small accessory buoy is
added at the top of the taut line, and a connecting line is added between this accessory buoy

and the floating structure. The reasoning is the same as for the catenary mooring with
accessory buoys, but the same challenges are also present.
Other mooring configurations are possible for ORE devices, for example configurations using
accessory clump weights. The same methodology can be applied to these other
configurations; this paper focuses more on the methodology than on particular mooring
arrangements.
a) b)
c) d)
Figure 2. Mooring configurations: a) Catenary mooring configuration with the top lines
being chains or synthetic ropes, b) Taut mooring configuration, c) Catenary mooring
configuration with accessory buoys, d) Taut mooring configuration with accessory
buoys
Figure 3. Change in the shape of a taut (left) and catenary (right) mooring lines due to
surge of the floating structure
A preliminary assessment was carried out with the extreme sea state (HS = 10 m and TZ = 10
s) for each mooring configuration to assess the order of magnitude of the maximum mooring
loads and ensure that the mooring strength is correctly defined. This means that the maximum
load multiplied by a factor of safety is below the minimum breaking load (MBL) of the
weakest element of the mooring system. This leads to mooring system materials and
dimensions as described in Table 3. The material properties (displacement, MBL, axial
stiffness and mass per unit length) were taken as calculated by OrcaFlex. It should be noted
that for a more accurate design, the manufacturer specific properties should be considered. A
more detailed analysis would also be required to design these mooring systems for a real
device.
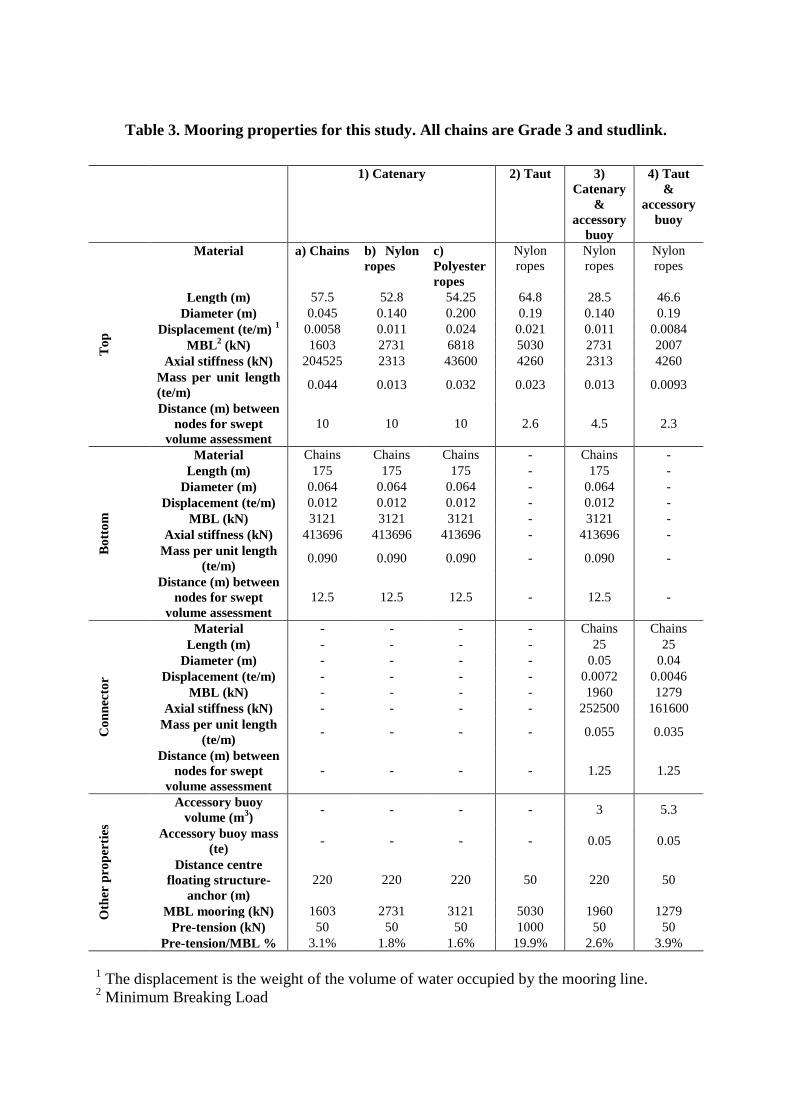
Table 3. Mooring properties for this study. All chains are Grade 3 and studlink.
1) Catenary 2) Taut 3)
Catenary
&
accessory
buoy
4) Taut
&
accessory
buoy
To
p
Material a) Chains b) Nylon
ropes
c)
Polyester
ropes
Nylon
ropes
Nylon
ropes
Nylon
ropes
Length (m) 57.5 52.8 54.25 64.8 28.5 46.6
Diameter (m) 0.045 0.140 0.200 0.19 0.140 0.19
Displacement (te/m) 1 0.0058 0.011 0.024 0.021 0.011 0.0084
MBL2 (kN) 1603 2731 6818 5030 2731 2007
Axial stiffness (kN) 204525 2313 43600 4260 2313 4260
Mass per unit length
(te/m) 0.044 0.013 0.032 0.023 0.013 0.0093
Distance (m) between
nodes for swept
volume assessment
10 10 10 2.6 4.5 2.3
Bo
tto
m
Material Chains Chains Chains - Chains -
Length (m) 175 175 175 - 175 -
Diameter (m) 0.064 0.064 0.064 - 0.064 -
Displacement (te/m) 0.012 0.012 0.012 - 0.012 -
MBL (kN) 3121 3121 3121 - 3121 -
Axial stiffness (kN) 413696 413696 413696 - 413696 -
Mass per unit length
(te/m) 0.090 0.090 0.090 - 0.090 -
Distance (m) between
nodes for swept
volume assessment
12.5 12.5 12.5 - 12.5 -
Co
nn
ecto
r
Material - - - - Chains Chains
Length (m) - - - - 25 25
Diameter (m) - - - - 0.05 0.04
Displacement (te/m) - - - - 0.0072 0.0046
MBL (kN) - - - - 1960 1279
Axial stiffness (kN) - - - - 252500 161600
Mass per unit length
(te/m) - - - - 0.055 0.035
Distance (m) between
nodes for swept
volume assessment
- - - - 1.25 1.25
Oth
er p
rop
erti
es
Accessory buoy
volume (m3)
- - - - 3 5.3
Accessory buoy mass
(te) - - - - 0.05 0.05
Distance centre
floating structure-
anchor (m)
220 220 220 50 220 50
MBL mooring (kN) 1603 2731 3121 5030 1960 1279
Pre-tension (kN) 50 50 50 1000 50 50
Pre-tension/MBL % 3.1% 1.8% 1.6% 19.9% 2.6% 3.9%
1 The displacement is the weight of the volume of water occupied by the mooring line.
2 Minimum Breaking Load
3. Parameters relating to entanglement risk
Three key parameters were considered to assess the relative risk of entanglement for the
selected mooring systems. These parameters were investigated with the OrcaFlex numerical
models described in the previous section. The first parameter evaluates the stiffness of the
mooring system using the tension characteristics, because slack moorings are more likely to
cause entanglement than taut moorings. If an animal comes into contact with a loosely
hanging mooring line, the risk of being entangled is higher than with a taut line. The second
parameter evaluates the volume of water occupied by the mooring line in a particular sea
state. If this volume is high, then it means that the mooring lines are moving significantly,
and that the risk of contact between a marine animal and a mooring line is higher. The third
parameter assesses the curvature of the mooring line. The higher the potential curvature of a
mooring line, the greater the risk, if an animal comes into contact with it, that the line could
form a loop around the body of the animal from which it would be unable to extract itself.
The three different parametric studies are described below.
3.1. Tension characteristics
The tension characteristics were estimated by slowly surging the floating structure forward
and backward with no environmental loads (i.e. wave, wind or current forces). The floating
structure was moved from a minimum distance of -100m to a maximum distance of +100m in
the alignment of the backward line. Mooring loads in the three mooring lines as well as
horizontal surge were used to plot the tension characteristics. For comparison purposes,
dimensions were removed by dividing the mooring load by the MBL of the mooring system,
and the surge position by the water depth.
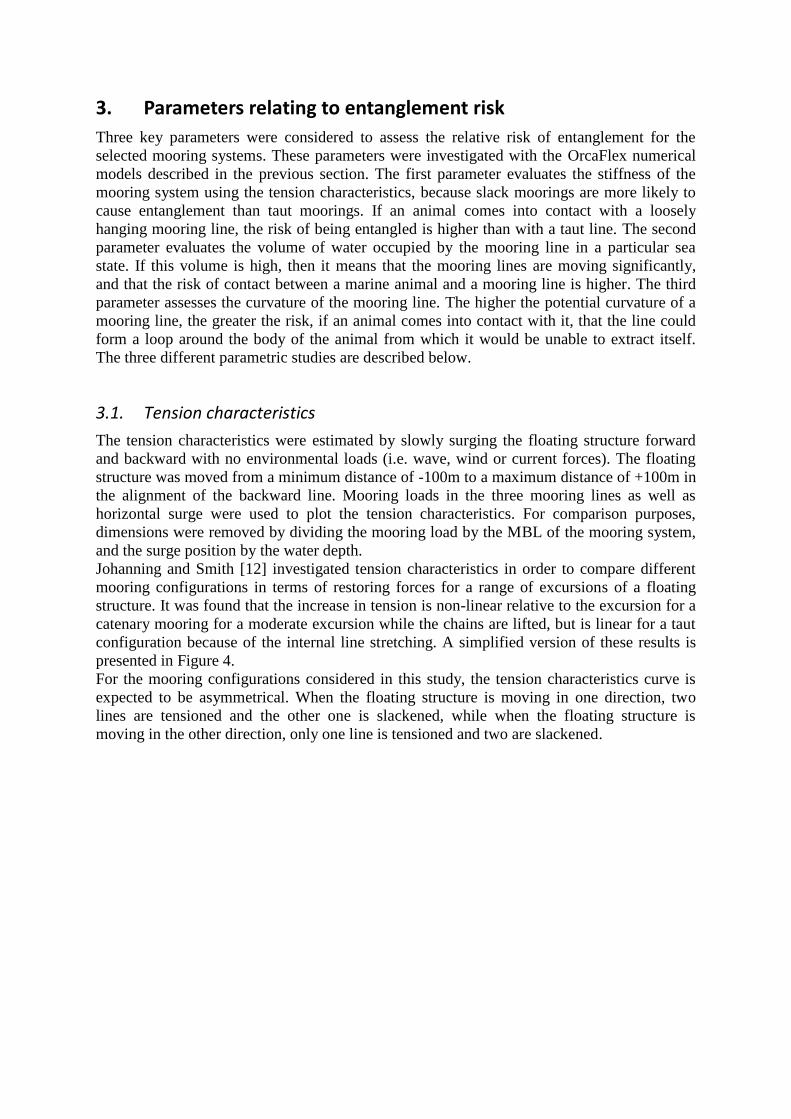
Johanning and Smith [12] investigated tension characteristics in order to compare different
mooring configurations in terms of restoring forces for a range of excursions of a floating
structure. It was found that the increase in tension is non-linear relative to the excursion for a
catenary mooring for a moderate excursion while the chains are lifted, but is linear for a taut
configuration because of the internal line stretching. A simplified version of these results is
presented in Figure 4.
For the mooring configurations considered in this study, the tension characteristics curve is
expected to be asymmetrical. When the floating structure is moving in one direction, two
lines are tensioned and the other one is slackened, while when the floating structure is
moving in the other direction, only one line is tensioned and two are slackened.
a) b)
Figure 4. Examples of tension characteristics for different a) catenary and b) taut
mooring configurations with two opposite lines (adapted from Johanning and Smith
[12]).
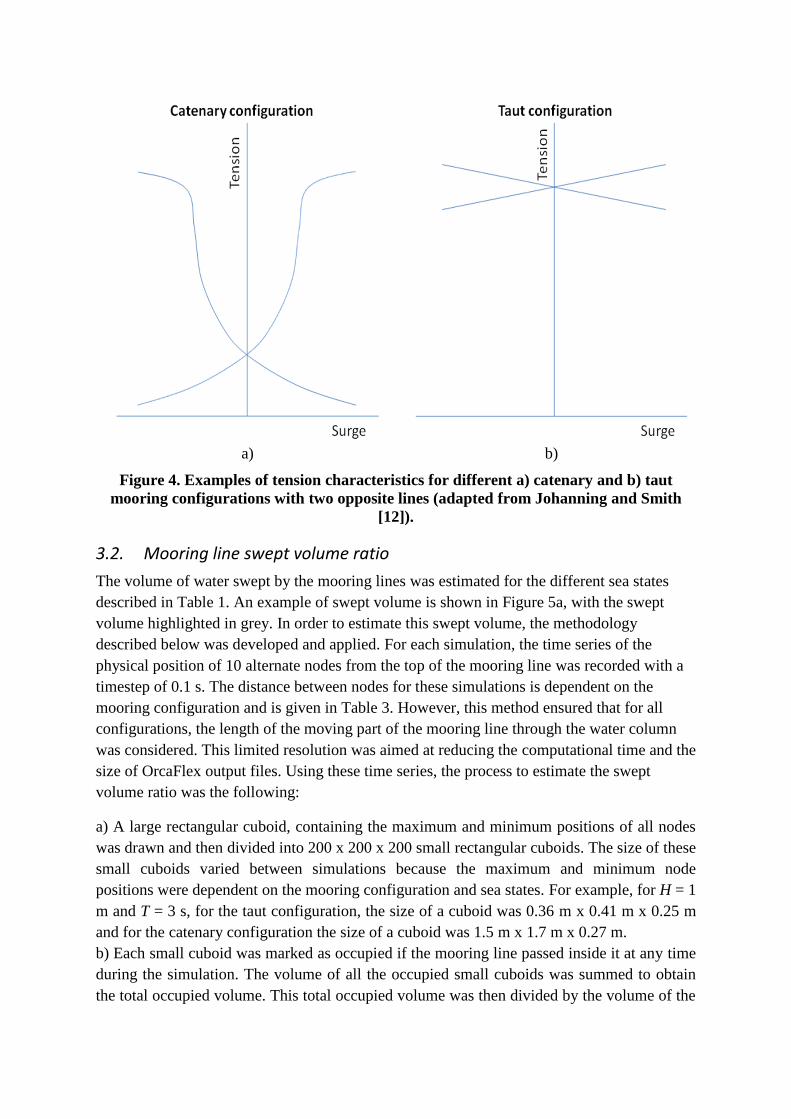
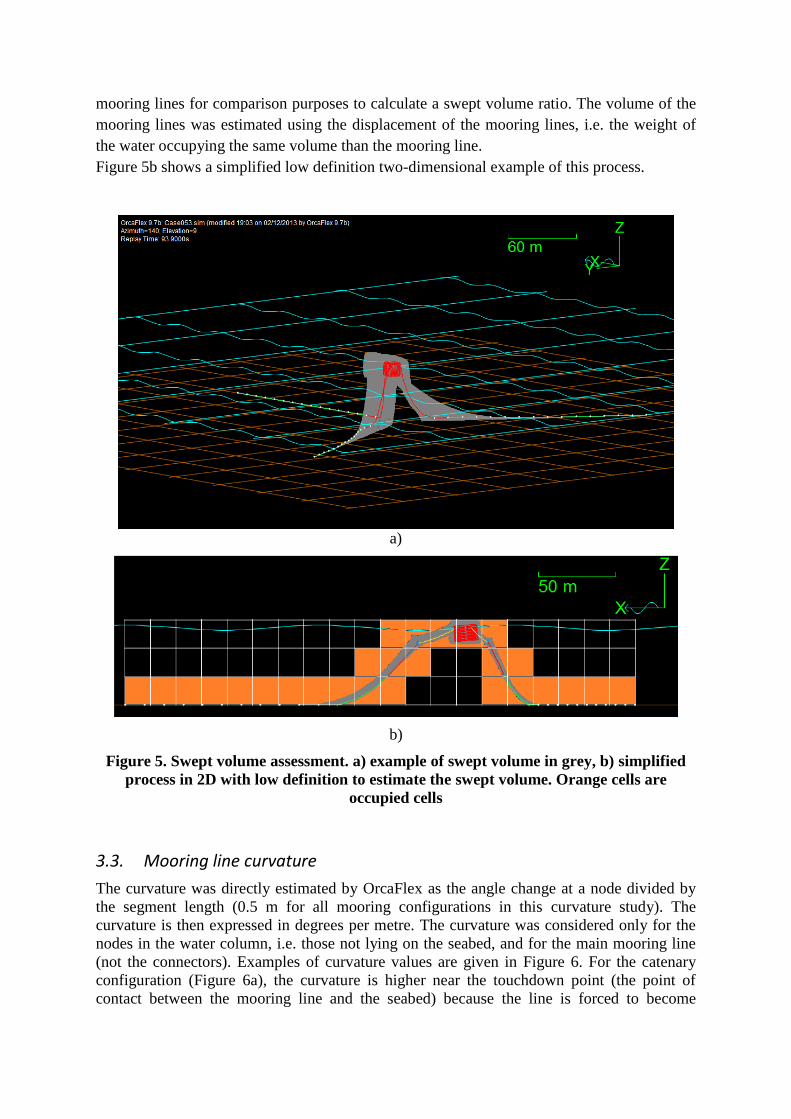
3.2. Mooring line swept volume ratio
The volume of water swept by the mooring lines was estimated for the different sea states
described in Table 1. An example of swept volume is shown in Figure 5a, with the swept
volume highlighted in grey. In order to estimate this swept volume, the methodology
described below was developed and applied. For each simulation, the time series of the
physical position of 10 alternate nodes from the top of the mooring line was recorded with a
timestep of 0.1 s. The distance between nodes for these simulations is dependent on the
mooring configuration and is given in Table 3. However, this method ensured that for all
configurations, the length of the moving part of the mooring line through the water column
was considered. This limited resolution was aimed at reducing the computational time and the
size of OrcaFlex output files. Using these time series, the process to estimate the swept
volume ratio was the following:
a) A large rectangular cuboid, containing the maximum and minimum positions of all nodes
was drawn and then divided into 200 x 200 x 200 small rectangular cuboids. The size of these
small cuboids varied between simulations because the maximum and minimum node
positions were dependent on the mooring configuration and sea states. For example, for H = 1
m and T = 3 s, for the taut configuration, the size of a cuboid was 0.36 m x 0.41 m x 0.25 m
and for the catenary configuration the size of a cuboid was 1.5 m x 1.7 m x 0.27 m.
b) Each small cuboid was marked as occupied if the mooring line passed inside it at any time
during the simulation. The volume of all the occupied small cuboids was summed to obtain
the total occupied volume. This total occupied volume was then divided by the volume of the
mooring lines for comparison purposes to calculate a swept volume ratio. The volume of the
mooring lines was estimated using the displacement of the mooring lines, i.e. the weight of
the water occupying the same volume than the mooring line.
Figure 5b shows a simplified low definition two-dimensional example of this process.
a)
b)
Figure 5. Swept volume assessment. a) example of swept volume in grey, b) simplified
process in 2D with low definition to estimate the swept volume. Orange cells are
occupied cells
3.3. Mooring line curvature
The curvature was directly estimated by OrcaFlex as the angle change at a node divided by
the segment length (0.5 m for all mooring configurations in this curvature study). The
curvature is then expressed in degrees per metre. The curvature was considered only for the
nodes in the water column, i.e. those not lying on the seabed, and for the main mooring line
(not the connectors). Examples of curvature values are given in Figure 6. For the catenary
configuration (Figure 6a), the curvature is higher near the touchdown point (the point of
contact between the mooring line and the seabed) because the line is forced to become

horizontal on the seabed. The curvature is also high at the top end of the mooring line,
because of its dynamic behaviour. The curvature is relatively small in the water column. For
the taut configuration (Figure 6b), the curvature is low all along the mooring line.
For this study, the curvature of the backwards line was observed for the maximum excursion
of the floating structure in a regular sea state with H = 1 m and T = 6 s. The backwards line
was chosen because this line is the most likely to become slack and to display high curvature
values because of the drifted position of the floating structure.
a) b)
Figure 6. Example of curvature calculation in OrcaFlex a) for a catenary configuration
and b) for a taut configuration
4. Results
For each parameter affecting entanglement and for each mooring configuration, the relative
risk of entanglement was assessed based on the results of the parametric studies. This enabled
a risk ‘score’ to be assigned to each mooring configurations. Risk scores ranged from 1 to 3,
with 1 representing a lower risk and 3 a higher risk. It is important to emphasise that this is a
relative risk score, comparing the different mooring configurations, and is not intended to
quantify the actual risk. Results were then summarised to give an overall relative risk of
entanglement for each mooring configuration. The aim is to classify the different mooring
configurations in terms of entanglement in order to assess which configuration has a
relatively higher risk of entanglement.
4.1. Tension characteristics
Tension characteristics for the different mooring arrangements are plotted in Figure 7. As
expected, the tension characteristics are asymmetrical. Results indicate a low tension to MBL
slope for small to medium surge for the catenary moorings (Figure 7a-c), allowing a
considerable flexibility in the mooring. The use of nylon ropes (Figure 7b) even enhances this
flexibility because of the elasticity and low weight of nylon ropes. Because the polyester line
has a considerably higher axial stiffness and a higher weight (Table 3) than the nylon lines,
the catenary mooring using polyester ropes (Figure 7c) behaves very similarly to the catenary
mooring using chains only (Figure 7a) in terms of tension characteristics. The taut mooring
system shows a high tension to MBL slope for all ranges of surge (Figure 7d), meaning that
this mooring system provides large restoring forces for any range of excursion. The addition
of accessory buoys to the catenary configurations (Figure 7e) makes the configuration
slightly more flexible, while the addition to the taut configuration (Figure 7f) makes it largely
more flexible, with a near-constant tension to MBL ratio across the surge range.
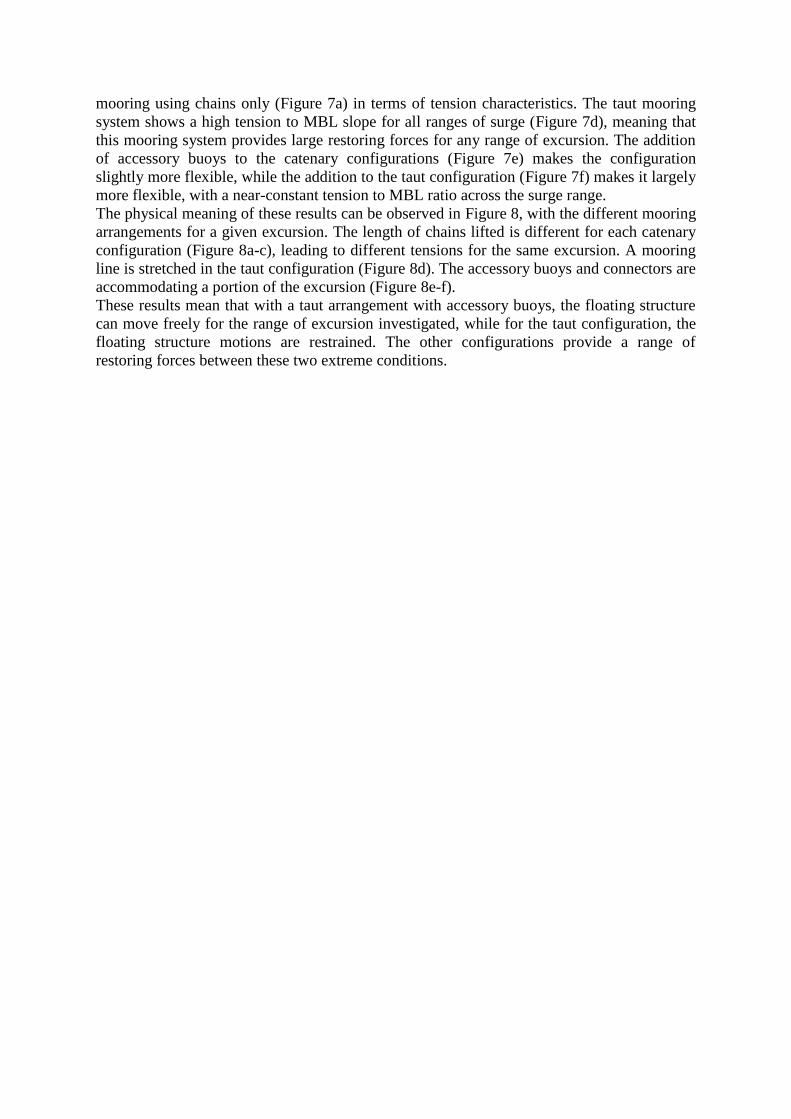
The physical meaning of these results can be observed in Figure 8, with the different mooring
arrangements for a given excursion. The length of chains lifted is different for each catenary
configuration (Figure 8a-c), leading to different tensions for the same excursion. A mooring
line is stretched in the taut configuration (Figure 8d). The accessory buoys and connectors are
accommodating a portion of the excursion (Figure 8e-f).
These results mean that with a taut arrangement with accessory buoys, the floating structure
can move freely for the range of excursion investigated, while for the taut configuration, the
floating structure motions are restrained. The other configurations provide a range of
restoring forces between these two extreme conditions.

a) b)
c) d)
e) f)
Figure 7. Tension characteristics for the different mooring arrangements: a) Catenary,
b) Catenary with chains and nylon ropes, c) Catenary with chains and polyester ropes,
d) Taut, e) Catenary with accessory buoys, f) Taut with accessory buoys
a) b)
c) d)
e) f)
Figure 8. Example for an excursion of 20m of the layout of the different mooring
configurations: a) Catenary, b) Catenary with chains and nylon ropes, c) Catenary with
chains and polyester ropes, d) Taut, e) Catenary with accessory buoys, f) Taut with
accessory buoys
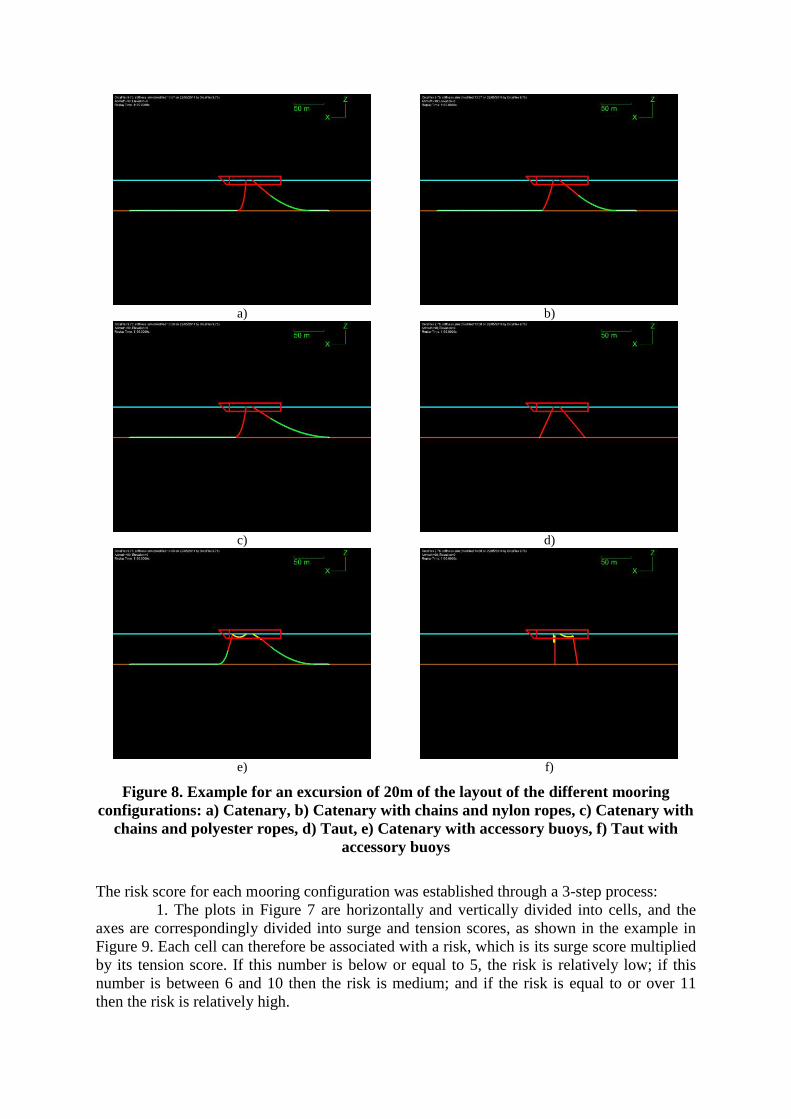
The risk score for each mooring configuration was established through a 3-step process:
1. The plots in Figure 7 are horizontally and vertically divided into cells, and the
axes are correspondingly divided into surge and tension scores, as shown in the example in
Figure 9. Each cell can therefore be associated with a risk, which is its surge score multiplied
by its tension score. If this number is below or equal to 5, the risk is relatively low; if this
number is between 6 and 10 then the risk is medium; and if the risk is equal to or over 11
then the risk is relatively high.
2. The number of low, medium and high risks cells intersected by the tension
characteristics curve are counted and input in Table 4. A weighted average surge/tension
score is calculated. A score of 1 is associated with each low-risk cell intersected, two for each
medium-risk cell and 3 for each high-risk cell. The final surge/tension score is calculated by
dividing the summed total by the total number of intersected cells.
3. If the final surge/tension score is below 1.75, the mooring system is assumed to
be low risk and given a risk score of 1 for its tension characteristics. A surge/tension score
between 1.75 and 2 is given a risk score of 2, and for surge/tension scores greater than 2, a
risk score of 3 is allocated, indicating that there is a relatively higher risk of entanglement for
that mooring configuration. The final results are summarised in Table 4.
Results indicate that when considering only the tension characteristics, the relative risk of
entanglement is higher for the catenary with chains and nylon ropes, the catenary with
accessory buoys and the taut with accessory buoys arrangement. The lowest risk is seen for
the taut configuration.
Figure 9. Example of parameterised risk pattern for the tension characteristics. The
surge and tension scores are multiplied. Light colour indicates relatively low risk while
darker colours indicate increasing risk.
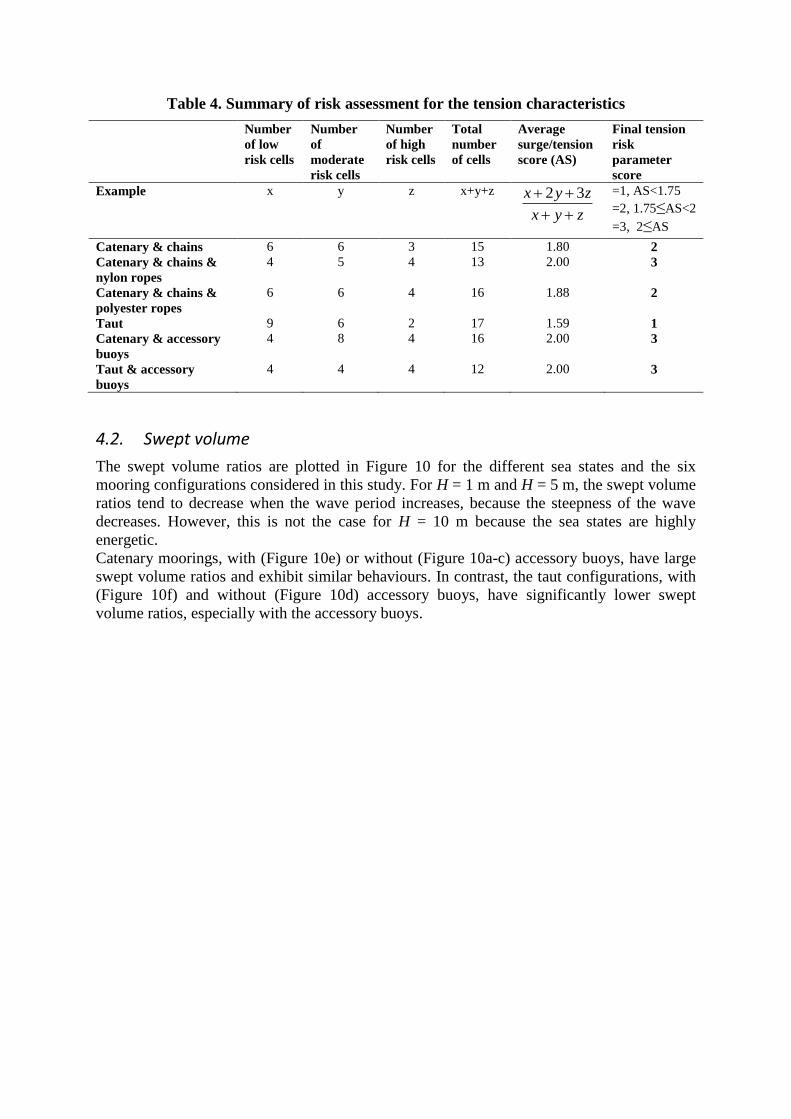
Table 4. Summary of risk assessment for the tension characteristics
Number
of low
risk cells
Number
of
moderate
risk cells
Number
of high
risk cells
Total
number
of cells
Average
surge/tension
score (AS)
Final tension
risk
parameter
score
Example x y z x+y+z
zyx
zyx
32
=1, AS<1.75
=2, 1.75≤AS<2
=3, 2≤AS
Catenary & chains 6 6 3 15 1.80 2
Catenary & chains &
nylon ropes
4 5 4 13 2.00 3
Catenary & chains &
polyester ropes
6 6 4 16 1.88 2
Taut 9 6 2 17 1.59 1
Catenary & accessory
buoys
4 8 4 16 2.00 3
Taut & accessory
buoys
4 4 4 12 2.00 3
4.2. Swept volume
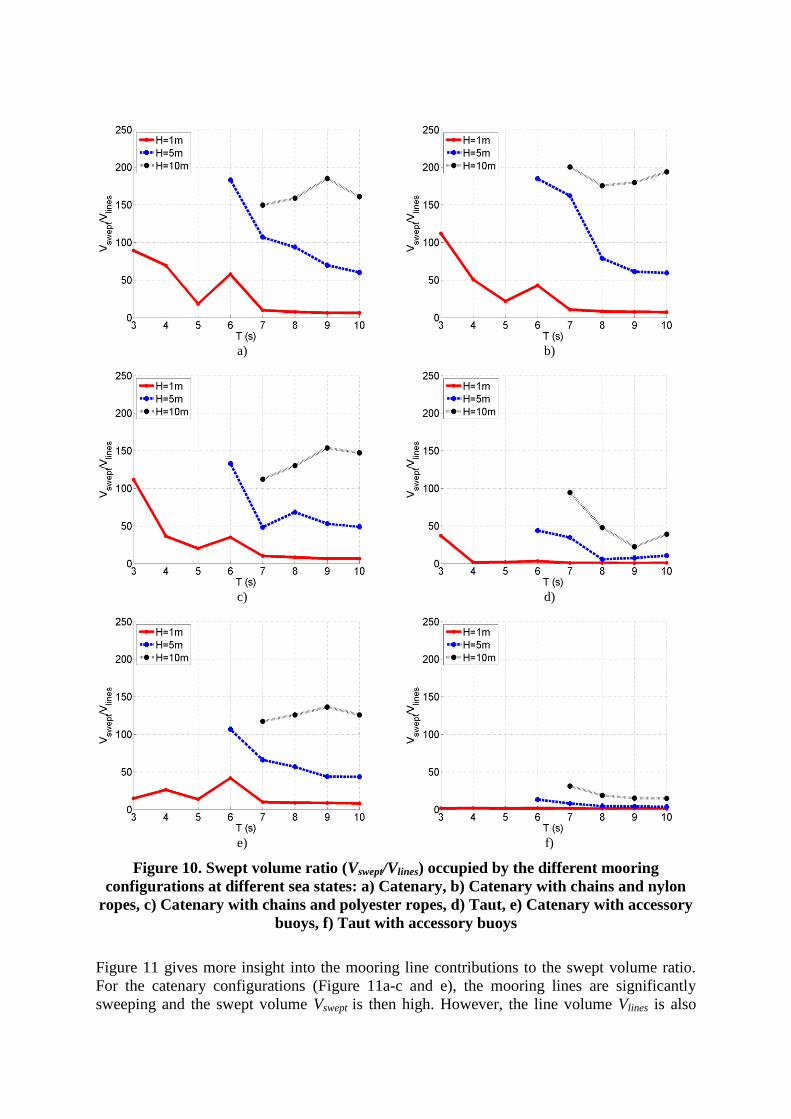
The swept volume ratios are plotted in Figure 10 for the different sea states and the six
mooring configurations considered in this study. For H = 1 m and H = 5 m, the swept volume
ratios tend to decrease when the wave period increases, because the steepness of the wave
decreases. However, this is not the case for H = 10 m because the sea states are highly
energetic.
Catenary moorings, with (Figure 10e) or without (Figure 10a-c) accessory buoys, have large
swept volume ratios and exhibit similar behaviours. In contrast, the taut configurations, with
(Figure 10f) and without (Figure 10d) accessory buoys, have significantly lower swept
volume ratios, especially with the accessory buoys.
a) b)
c) d)
e) f)
Figure 10. Swept volume ratio (Vswept/Vlines) occupied by the different mooring
configurations at different sea states: a) Catenary, b) Catenary with chains and nylon
ropes, c) Catenary with chains and polyester ropes, d) Taut, e) Catenary with accessory
buoys, f) Taut with accessory buoys
Figure 11 gives more insight into the mooring line contributions to the swept volume ratio.
For the catenary configurations (Figure 11a-c and e), the mooring lines are significantly
sweeping and the swept volume Vswept is then high. However, the line volume Vlines is also
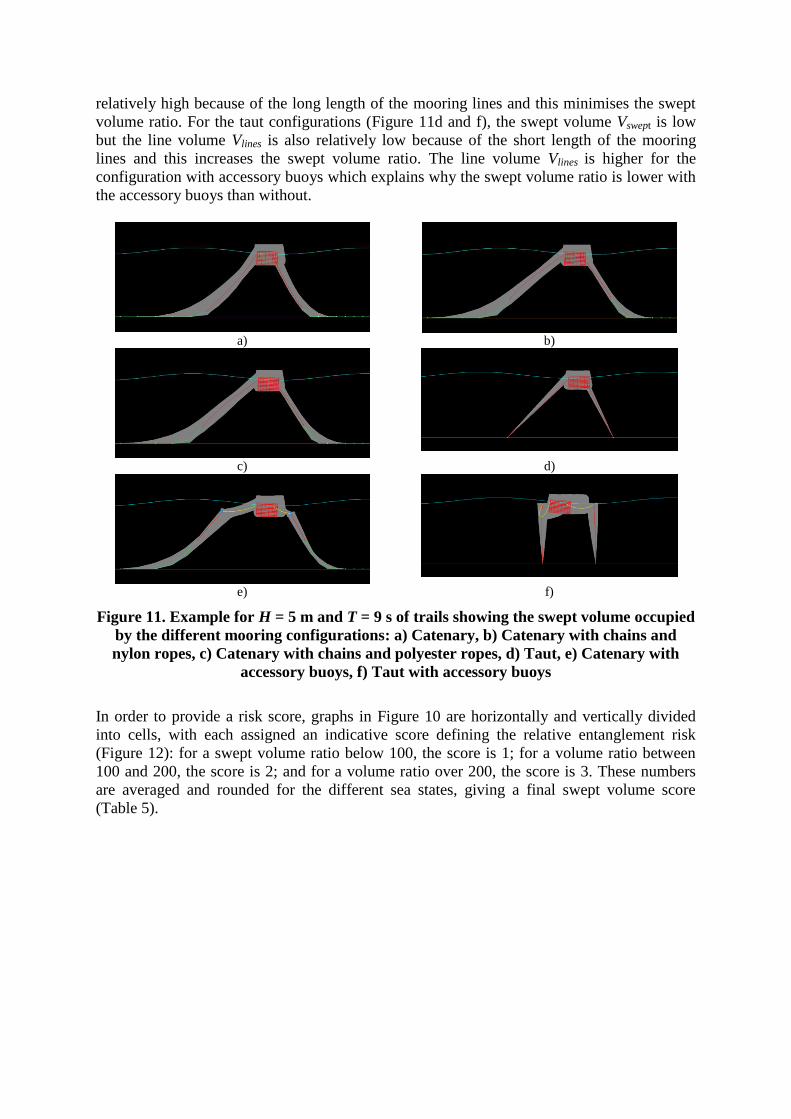
relatively high because of the long length of the mooring lines and this minimises the swept
volume ratio. For the taut configurations (Figure 11d and f), the swept volume Vswept is low
but the line volume Vlines is also relatively low because of the short length of the mooring
lines and this increases the swept volume ratio. The line volume Vlines is higher for the
configuration with accessory buoys which explains why the swept volume ratio is lower with
the accessory buoys than without.
a) b)
c) d)
e) f)
Figure 11. Example for H = 5 m and T = 9 s of trails showing the swept volume occupied
by the different mooring configurations: a) Catenary, b) Catenary with chains and
nylon ropes, c) Catenary with chains and polyester ropes, d) Taut, e) Catenary with
accessory buoys, f) Taut with accessory buoys
In order to provide a risk score, graphs in Figure 10 are horizontally and vertically divided
into cells, with each assigned an indicative score defining the relative entanglement risk
(Figure 12): for a swept volume ratio below 100, the score is 1; for a volume ratio between
100 and 200, the score is 2; and for a volume ratio over 200, the score is 3. These numbers
are averaged and rounded for the different sea states, giving a final swept volume score
(Table 5).
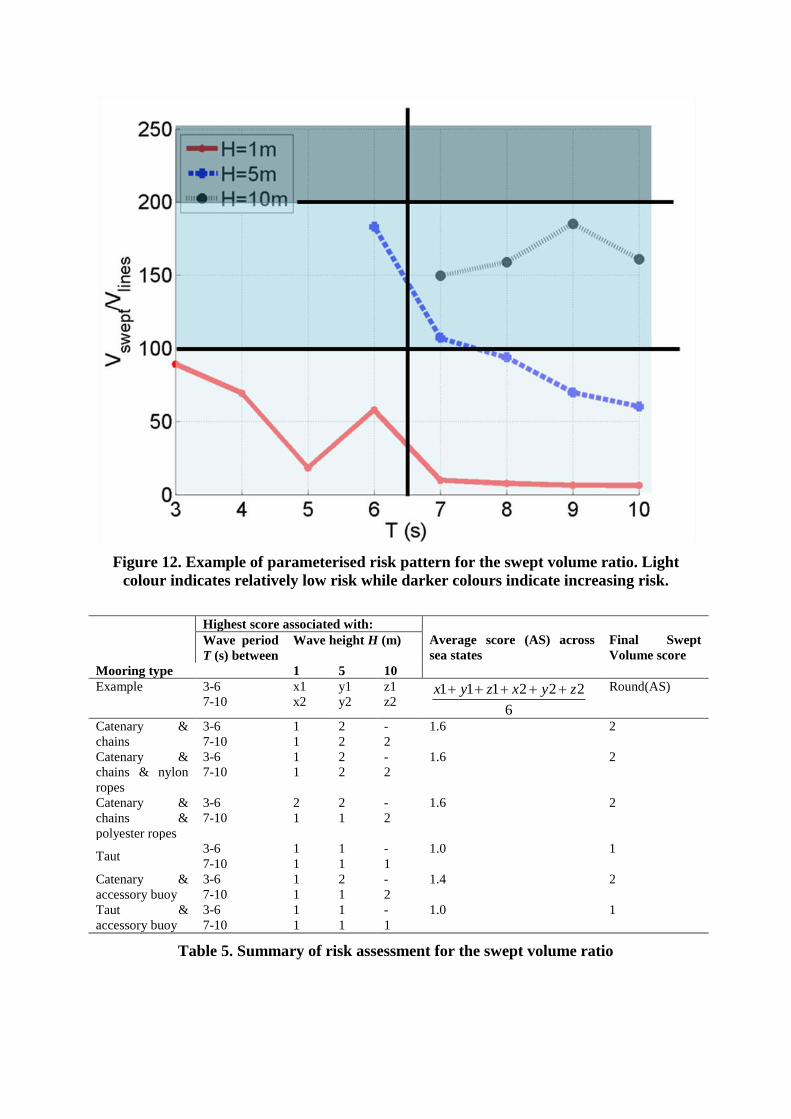
Figure 12. Example of parameterised risk pattern for the swept volume ratio. Light
colour indicates relatively low risk while darker colours indicate increasing risk.
Highest score associated with:
Average score (AS) across
sea states
Final Swept
Volume score
Wave period
T (s) between
Wave height H (m)
Mooring type 1 5 10
Example 3-6 x1 y1 z1
6
222111 zyxzyx
Round(AS)
7-10 x2 y2 z2
Catenary &
chains
3-6 1 2 - 1.6 2
7-10 1 2 2
Catenary &
chains & nylon
ropes
3-6 1 2 - 1.6 2
7-10 1 2 2
Catenary &
chains &
polyester ropes
3-6 2 2 - 1.6 2
7-10 1 1 2
Taut 3-6 1 1 - 1.0 1
7-10 1 1 1
Catenary &
accessory buoy
3-6 1 2 - 1.4 2
7-10 1 1 2
Taut &
accessory buoy
3-6 1 1 - 1.0 1
7-10 1 1 1
Table 5. Summary of risk assessment for the swept volume ratio
Results indicate that the relative risk of entanglement relating to the swept volume ratio of the
mooring lines is moderate for all catenary configurations, with or without accessory buoys,
and low for both taut configurations.
4.3. Curvature
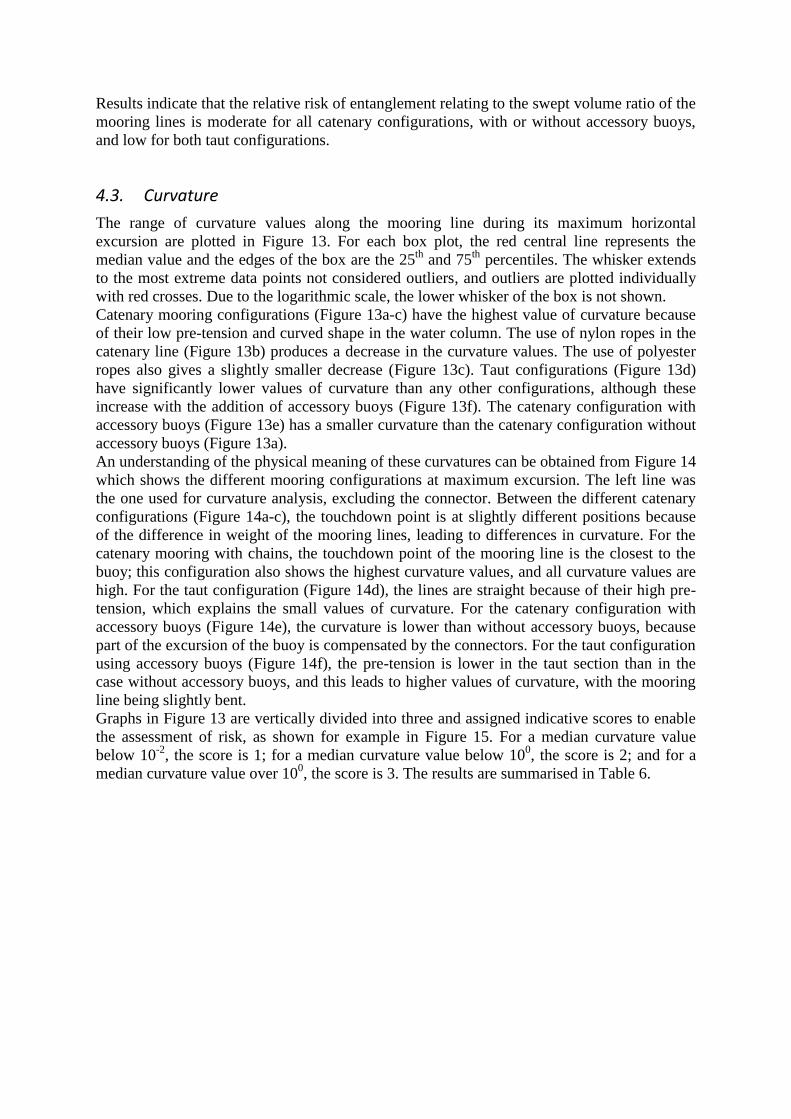
The range of curvature values along the mooring line during its maximum horizontal
excursion are plotted in Figure 13. For each box plot, the red central line represents the
median value and the edges of the box are the 25th
and 75th
percentiles. The whisker extends
to the most extreme data points not considered outliers, and outliers are plotted individually
with red crosses. Due to the logarithmic scale, the lower whisker of the box is not shown.
Catenary mooring configurations (Figure 13a-c) have the highest value of curvature because
of their low pre-tension and curved shape in the water column. The use of nylon ropes in the
catenary line (Figure 13b) produces a decrease in the curvature values. The use of polyester
ropes also gives a slightly smaller decrease (Figure 13c). Taut configurations (Figure 13d)
have significantly lower values of curvature than any other configurations, although these
increase with the addition of accessory buoys (Figure 13f). The catenary configuration with
accessory buoys (Figure 13e) has a smaller curvature than the catenary configuration without
accessory buoys (Figure 13a).
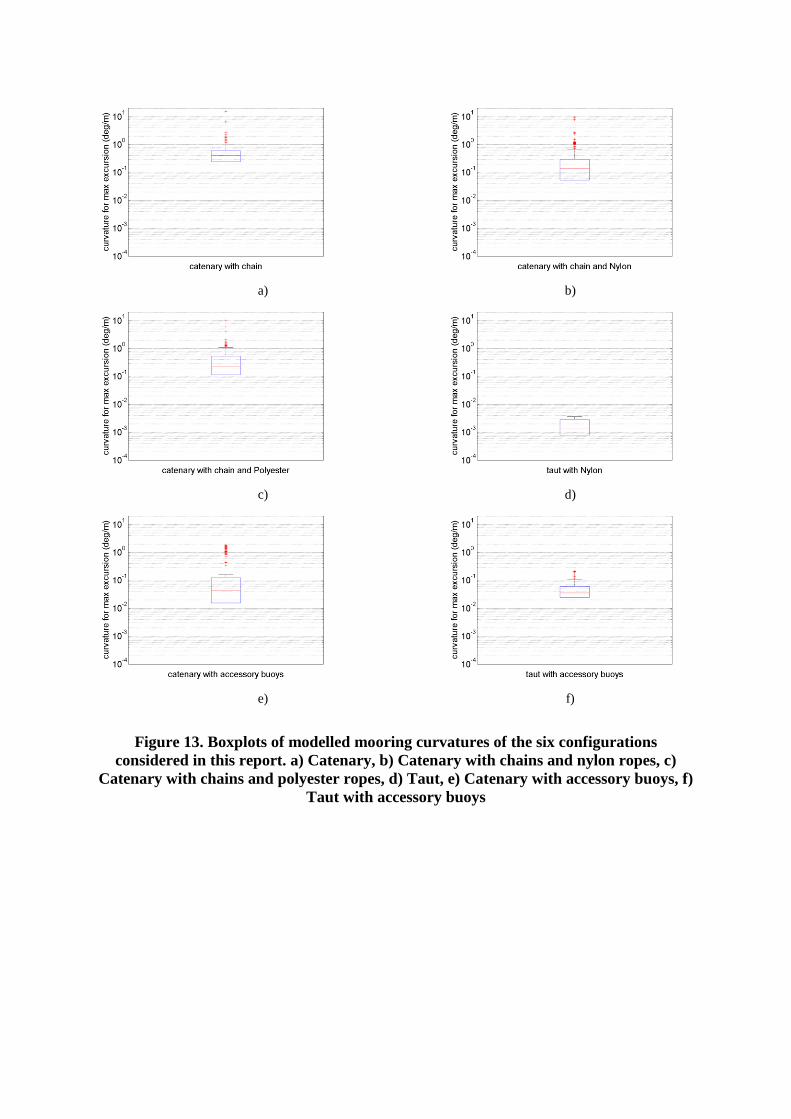
An understanding of the physical meaning of these curvatures can be obtained from Figure 14
which shows the different mooring configurations at maximum excursion. The left line was
the one used for curvature analysis, excluding the connector. Between the different catenary
configurations (Figure 14a-c), the touchdown point is at slightly different positions because
of the difference in weight of the mooring lines, leading to differences in curvature. For the
catenary mooring with chains, the touchdown point of the mooring line is the closest to the
buoy; this configuration also shows the highest curvature values, and all curvature values are
high. For the taut configuration (Figure 14d), the lines are straight because of their high pre-
tension, which explains the small values of curvature. For the catenary configuration with
accessory buoys (Figure 14e), the curvature is lower than without accessory buoys, because
part of the excursion of the buoy is compensated by the connectors. For the taut configuration
using accessory buoys (Figure 14f), the pre-tension is lower in the taut section than in the
case without accessory buoys, and this leads to higher values of curvature, with the mooring
line being slightly bent.
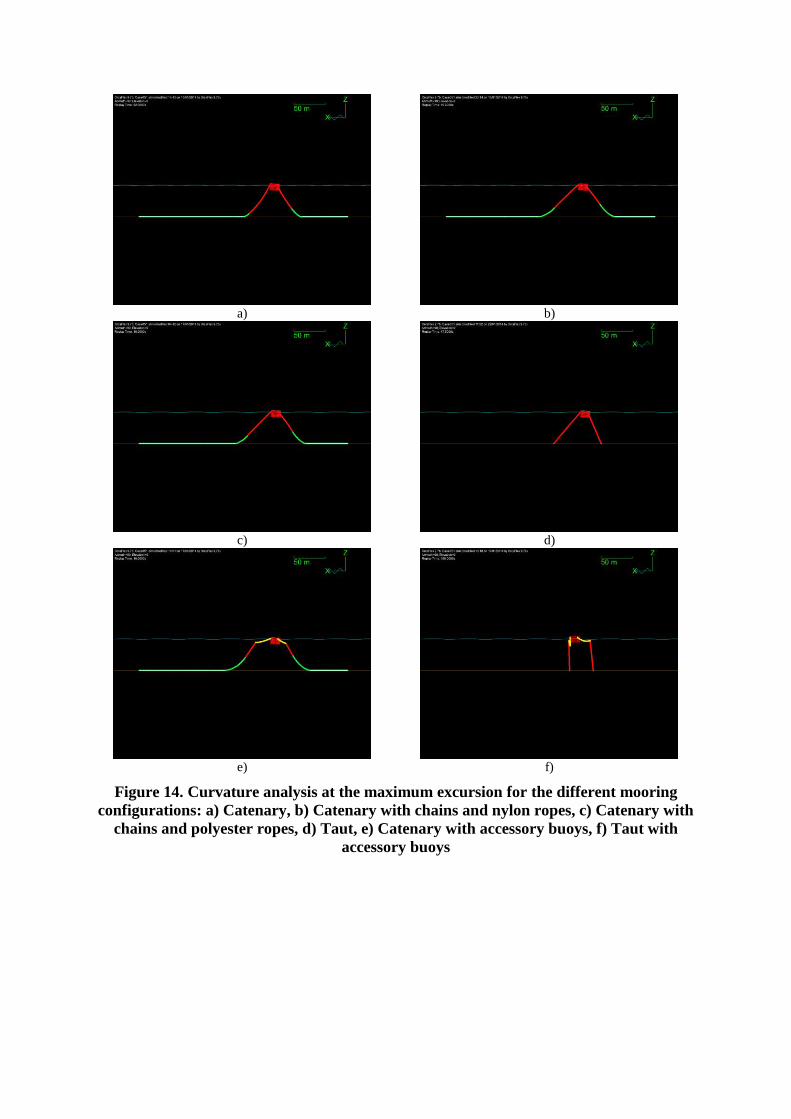
Graphs in Figure 13 are vertically divided into three and assigned indicative scores to enable
the assessment of risk, as shown for example in Figure 15. For a median curvature value
below 10-2
, the score is 1; for a median curvature value below 100, the score is 2; and for a
median curvature value over 100, the score is 3. The results are summarised in Table 6.
a) b)
c) d)
e) f)
Figure 13. Boxplots of modelled mooring curvatures of the six configurations
considered in this report. a) Catenary, b) Catenary with chains and nylon ropes, c)
Catenary with chains and polyester ropes, d) Taut, e) Catenary with accessory buoys, f)
Taut with accessory buoys
a) b)
c) d)
e) f)
Figure 14. Curvature analysis at the maximum excursion for the different mooring
configurations: a) Catenary, b) Catenary with chains and nylon ropes, c) Catenary with
chains and polyester ropes, d) Taut, e) Catenary with accessory buoys, f) Taut with
accessory buoys
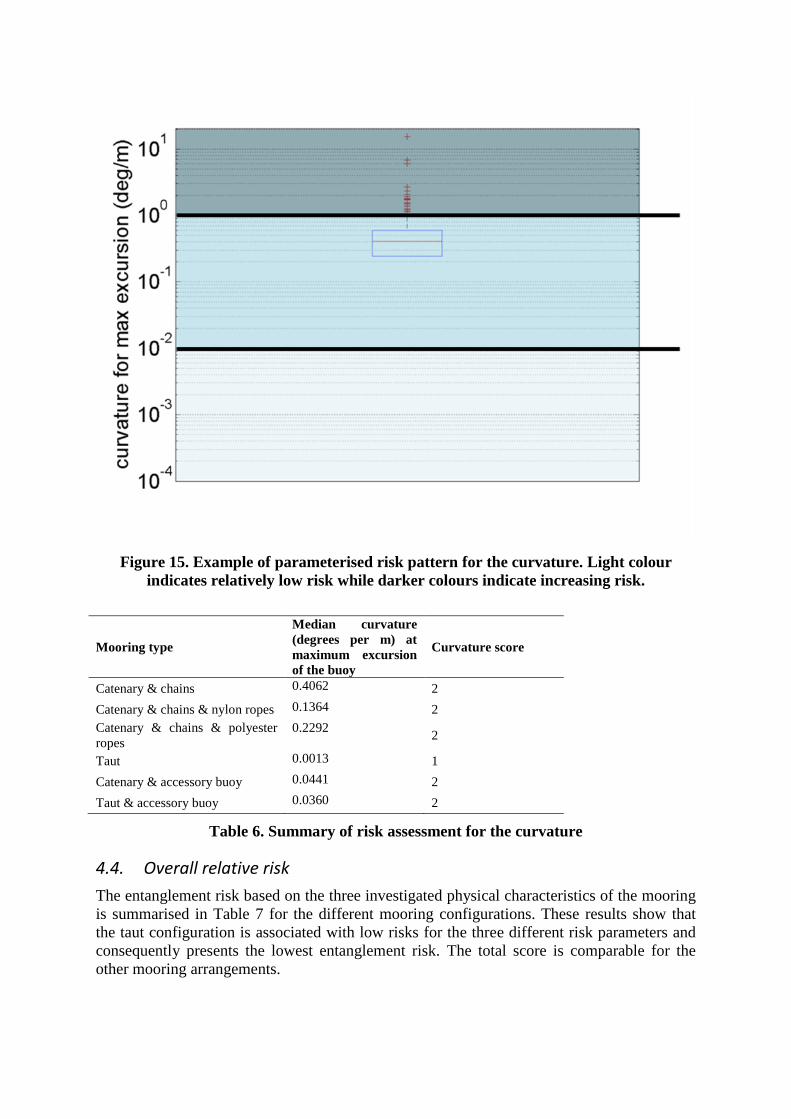
Figure 15. Example of parameterised risk pattern for the curvature. Light colour
indicates relatively low risk while darker colours indicate increasing risk.
Mooring type
Median curvature
(degrees per m) at
maximum excursion
of the buoy
Curvature score
Catenary & chains 0.4062 2
Catenary & chains & nylon ropes 0.1364 2
Catenary & chains & polyester
ropes
0.2292 2
Taut 0.0013 1
Catenary & accessory buoy 0.0441 2
Taut & accessory buoy 0.0360 2
Table 6. Summary of risk assessment for the curvature
4.4. Overall relative risk
The entanglement risk based on the three investigated physical characteristics of the mooring
is summarised in Table 7 for the different mooring configurations. These results show that
the taut configuration is associated with low risks for the three different risk parameters and
consequently presents the lowest entanglement risk. The total score is comparable for the
other mooring arrangements.
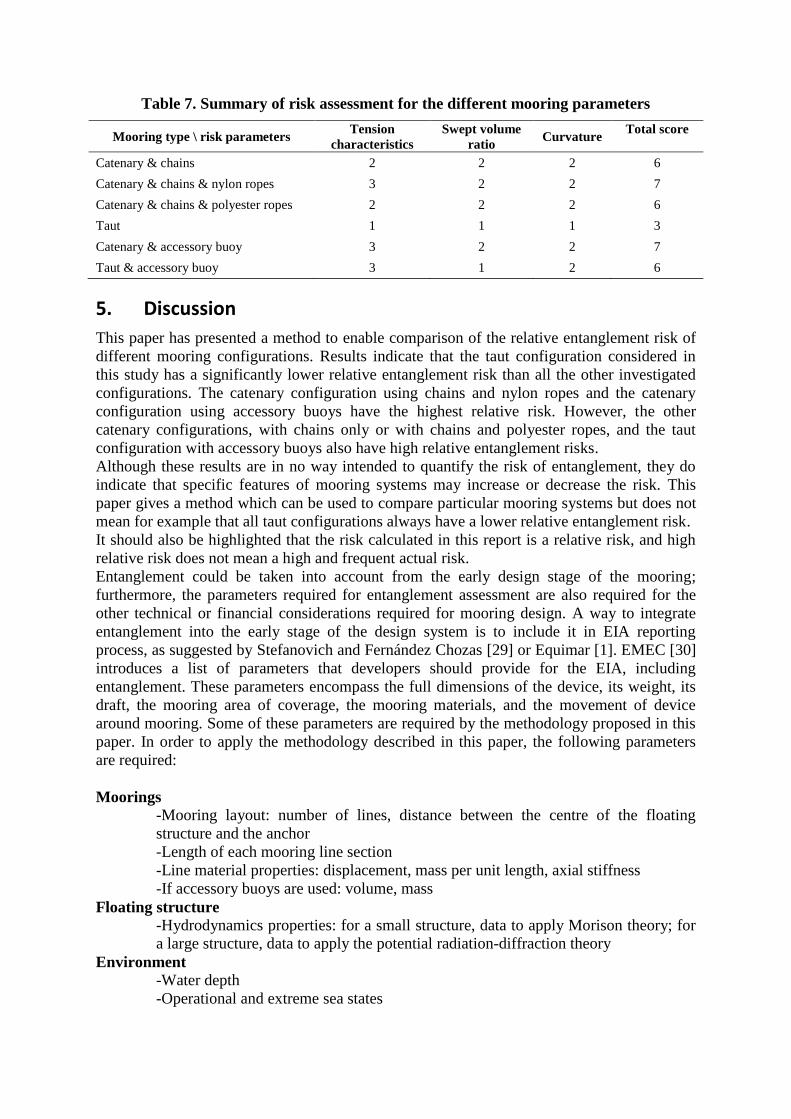
Table 7. Summary of risk assessment for the different mooring parameters
Mooring type \ risk parameters Tension
characteristics
Swept volume
ratio Curvature
Total score
Catenary & chains 2 2 2 6
Catenary & chains & nylon ropes 3 2 2 7
Catenary & chains & polyester ropes 2 2 2 6
Taut 1 1 1 3
Catenary & accessory buoy 3 2 2 7
Taut & accessory buoy 3 1 2 6
5. Discussion
This paper has presented a method to enable comparison of the relative entanglement risk of
different mooring configurations. Results indicate that the taut configuration considered in
this study has a significantly lower relative entanglement risk than all the other investigated
configurations. The catenary configuration using chains and nylon ropes and the catenary
configuration using accessory buoys have the highest relative risk. However, the other
catenary configurations, with chains only or with chains and polyester ropes, and the taut
configuration with accessory buoys also have high relative entanglement risks.
Although these results are in no way intended to quantify the risk of entanglement, they do
indicate that specific features of mooring systems may increase or decrease the risk. This
paper gives a method which can be used to compare particular mooring systems but does not
mean for example that all taut configurations always have a lower relative entanglement risk.
It should also be highlighted that the risk calculated in this report is a relative risk, and high
relative risk does not mean a high and frequent actual risk.
Entanglement could be taken into account from the early design stage of the mooring;
furthermore, the parameters required for entanglement assessment are also required for the
other technical or financial considerations required for mooring design. A way to integrate
entanglement into the early stage of the design system is to include it in EIA reporting
process, as suggested by Stefanovich and Fernández Chozas [29] or Equimar [1]. EMEC [30]
introduces a list of parameters that developers should provide for the EIA, including
entanglement. These parameters encompass the full dimensions of the device, its weight, its
draft, the mooring area of coverage, the mooring materials, and the movement of device
around mooring. Some of these parameters are required by the methodology proposed in this
paper. In order to apply the methodology described in this paper, the following parameters
are required:
Moorings -Mooring layout: number of lines, distance between the centre of the floating
structure and the anchor
-Length of each mooring line section
-Line material properties: displacement, mass per unit length, axial stiffness
-If accessory buoys are used: volume, mass
Floating structure
-Hydrodynamics properties: for a small structure, data to apply Morison theory; for
a large structure, data to apply the potential radiation-diffraction theory
Environment
-Water depth
-Operational and extreme sea states
These results can be extended to an array of devices or to power cables. However, power
cables are less critical than mooring lines. Unlike mooring lines, marine megafauna are likely
to be able to break a power cable which has a lower MBL than mooring lines since it is not
intended to play any role in keeping a device on station.
The method developed in this paper does not consider derelict fishing gears which can add a
potentially significant risk of entanglement, especially in a dense array configuration. If a lost
or discarded net, moving freely in the water column with the ocean currents, were to become
entangled in one or more mooring lines, the entanglement risk, not only to marine megafauna
but also to smaller species such as fishes and diving birds, would increase significantly with
the size and surface area of the net. This scenario would also be detrimental to the mooring
itself, and further investigation is needed to quantify the likelihood of such an event occurring
in areas where ORE devices are likely to be deployed.
The method presented here focuses on three different risk parameters. Other risk parameters
could have been added to this study. For example, the volume and mass of the floating device
may be considered because it can be of similar size and weight to marine megafauna. In
addition to the physical properties of the mooring, it is equally important to consider the
biological characteristics and behaviours of different species of marine megafauna to assess
which species present a higher risk of entanglement. This work has been performed as part of
a wider study in parallel with the moorings assessment [31].
Due to the large degree of uncertainty because of the limited experience with the operation of
ORE moorings, the rarity of entanglement events and the fact that they are not always
detected, these results need to be updated if entanglement is actually observed. From an
engineering point of view, this means that mooring systems need to be able to handle the
additional weight and volume of a carcass until entanglement can be efficiently monitored or
avoided.
6. Conclusion A methodology has been presented to estimate the relative entanglement risk of marine
megafauna with a given mooring configuration. Six different mooring configurations have
been used for this study: catenary with chains only, catenary with chains and nylon ropes,
catenary with chains and polyester ropes, taut, catenary with accessory buoy, taut with
accessory buoy. The parameters which have been used to estimate entanglement risk are
tension characteristics, swept volume ratio and mooring line curvature. Taut mooring systems
represent the lowest relative risk of entanglement.
The methodology presented in this paper can be used by ORE device developers at the early
stage of the mooring design if it is integrated in EIA reporting process. It can also be used for
analysis with other mooring configurations, or for power cables or array configurations.
There are still uncertainties about the relative importance of the risk parameters, and as
projects are deployed and empirical evidence is collected, this uncertainty can be refined.
7. Acknowledgments The authors gratefully acknowledge the support of Scottish National Heritage, who funded
this study.
8. References [1] D. Ingram, G.H. Smith, C. Bittencourt-Ferreira, H. Smith (Eds.), Protocols for the
Equitable Assessment of Marine Energy Converters, University of Edinburgh, School
of Engineering Publishers, Edinburgh, 2011.
[2] S. Benjamins, W. Ledwell, J. Huntington, A.R. Davidson, Assessing changes in
numbers and distribution of large whale entanglements in Newfoundland and
Labrador, Canada. Marine Mammal Science. 28 (2012) 579-601.
[3] D. Pemberton, N. Brothers, G. Copson, Predators on marine fish farms in Tasmania.
Papers and Proceedings of the Royal Society of Tasmania. 125 (1991) 33-35.
[4] B.D. Lloyd, Potential effects of mussel farming on New Zealand’s marine mammals
and seabirds: a discussion paper. Department of Conservation, Wellington, NZ, 2003.
[5] A.J. Read, , P. Drinker, S. Northridge, Bycatch of marine mammals in U.S. and
global fisheries, Conservation Biology, 20 (2006) 163-169.
[6] T.I. Walker, Can shark resources be harvested sustainably? A question revisited
with a review of shark fisheries, Marine and Freshwater Research, 49 (1998) 553-572.
[7] A. Cosandey-Godin, A. Morgan, Fisheries bycatch of sharks: Options for
mitigation, Ocean Sciences series, 2011.
[8] A. Copping, G. Cada, J. Roberts, M. Bevelhimer, Accelerating Ocean Energy to the
Marketplace –Environmental Research at the U.S. Department of Energy National
Laboratories, in: Proc of the 3rd
International Conference and exhibition on Ocean
Energy (ICOE), 2010.
[9] R.E. Harris, L. Johanning, J. Wolfram, Mooring systems for wave energy
converters: A review of design issues and choices, in: Proc of the 3rd International
Conference on Marine Renewable Energy (MAREC), 2004.
[10] D.T. Brown, S. Mavrakos, Comparative study on mooring line dynamic loading,
Marine Structures. 12 (1999) 131-151.
[11] J. Cruz, Ocean Wave Energy Current Status and Future Perspectives, Springer-
Verlag, Berlin, 2008.
[12] Orcina, Dynamic analysis and control of offshore marine systems using OrcaFlex,
presentation to the SUPERGEN 7th
Doctoral Training Programme Workshop ‘Control
of Wave and Tidal Energy Converters’, Lancaster University, 2010.
[13] L. Johanning, G.H. Smith, Station keeping study for WEC devices including
compliant chain, compliant hybrid and taut arrangement, in: Proc. of the 27th
International Conference on Offshore Mechanics and Arctict Engineering (OMAE),
2008.
[14] J. Fitzgerald, L. Bergdahl, Considering Mooring Cables for Offshore Wave Energy
Converters, in: Proc of the 7th European Wave and Tidal Energy Conference
(EWTEC), 2007.
[15] M. Masciola, A. Robertson, J. Jonkman, F. Driscoll, Investigation of a FAST-
OrcaFlex Coupling Module for Integrating Turbine and Mooring Dynamics of
Offshore Floating Wind Turbines, in: Proc of the International Conference on Offshore
Wind Energy and Ocean Energy (ICOWEOE), 2011.
[16] Orcina, OrcaFlex manual, version 9.7b, 2014.
[17] J. C.C. van Nieuwkoop, H.C.M. Smith, G. H. Smith, L. Johanning, Wave resource
assessment along the Cornish coast (UK) from a 23-year hindcast dataset validated
against buoy measurements, Renewable Energy, 58 (2013), 1–14.
[18] B. Cahill, Characteristics of the wave energy resource at the Atlantic marine energy
test site, PhD Thesis, University College Cork, 2013.
[19] Pelamis, Development history. Last accessed: 23/05/2014. [Online]. Available:
http://www.pelamiswave.com/development-history
[20] A. Babarit, J. Hals, M.J. Muliawan, A. Kurniawan, T. Moan, J. Krokstad,
Numerical benchmarking study of a selection of wave energy converters, Renewable
Energy, 41 (2012), 44–63.
[21] J. Lavelle J. P. Kofoed, Power Production Analysis of the OE Buoy WEC for the
CORES Project, The CORES EU Project, DCE Technical Report, No. 119, 2011.
[22] J. Sjolte, I. K. Bjerke, G.Tjensvoll, M. Molinas, Summary of Performance After
One Year of Operation with the Lifesaver Wave Energy Converter System, in: Proc of
the 10th European Wave and Tidal Energy Conference (EWTEC), 2013.
[23] Carnegie, CETO Commercial Scale Unit Overview. Last accessed: 23/05/2014.
[Online]. Available: http://www.carnegiewave.com/index.php?url=/ceto/ceto-
overview,
[24] Ocean Power Technologies, OPT MARK 3PowerBuoy, Utility Power from Ocean
Waves, Last accessed: 23/05/2014. [Online]. Available:
http://www.oceanpowertechnologies.com/PDF/OPT_Mark%203_Feb2014.pdf
[25] EMEC, Wello Oy, Last accessed: 23/05/2014. [Online]. Available:
http://www.emec.org.uk/about-us/wave-clients/wello-oy/
[26] Statoil, Hywind, Crossing energy frontiers, Last accessed: 23/05/2014. [Online].
Available:
http://www.statoil.com/en/TechnologyInnovation/NewEnergy/RenewablePowerProdu
ction/Offshore/Hywind/Downloads/Hywind%20postcard.pdf
[27] Principle, Windfloat, Last accessed: 23/05/2014. [Online]. Available:
http://www.principlepowerinc.com/products/windfloat.html
[28] EMEC, Bluewater Energy Services, Last accessed: 23/05/2014. [Online]. Available:
http://www.emec.org.uk/about-us/our-tidal-clients/bluewater-energy-services/
[29] M. A. Stefanovich, J. Fernández Chozas, Toward Best Practices for Public
Acceptability in Wave Energy: Issues Developers Need to Address, in: Proc of the 3rd
International Conference and exhibition on Ocean Energy (ICOE), 2010.
[30] EMEC, Environmental Impact Assessment (EIA); Guidance for developers at the
European Marine Energy Centre, 2008.
[31] S. Benjamins, V. Harnois, H.C.M. Smith, L. Johanning, L. Greenhill, C.Carter, B.
Wilson, Understanding the potential for marine megafauna entanglement risk from
renewable marine energy developments, Scottish Natural Heritage Commissioned
Report, In press.