enterprise gis in national security, volume 2 - esri · njm (the arabic acronym for unified...
TRANSCRIPT

1
Enterprise GIS in National Security
Volume 2
2
TABLE OF CONTENTS
ROOK: A Digital Oasis in a Challenging Environment
Qatar Enters a New Era of Emergency Response and Proactive Security
US Navy Uses GIS to Minimize Its Impact on Local Communities
Rapidly Responding to Colorado's Historic Floods
GIS-Based Web Services Provide Rapid Analysis and Dissemination of Maritime Data
An Effective Tool for Drinking Water Protection
Keeping an Eye on the Port of Long Beach
Esri Training for National Security/Esri Technical Certification Program
Visit esri.com/defense to learn more about how Esri supports defense,
intelligence, and national security applications. To submit a story for Enterprise
GIS in National Security, send your request for submission guidelines to
Copyright © 2014 Esri.All rights reserved.Printed in the United States of America.
The information contained in this work is the exclusive property of Esri or its licensors. This work is protected under United States copyright law and other international copyright treaties and conventions. No part of this work may be reproduced or transmitted in any form or by any means, electronic or mechanical, including photocopying and recording, or by any information storage or retrieval system, except as expressly permitted in writing by Esri. All requests should be sent to Attention: Contracts and Legal Services Manager, Esri, 380 New York Street, Redlands, CA 92373-8100 USA.
The information contained in this work is subject to change without notice.
4
6
10
12
15
17
20
23

3
The following stories demonstrate how military, intelligence,
public safety, and government organizations use Esri®
technology to solve problems by using a common platform:
ArcGIS. The ArcGIS® platform enables spatial thinking and
reasoning using today's technology, whether in the cloud or via
web, server, desktop, or mobile devices. These technologies take
the power of geospatial information from large organizations,
such as an army, and bring it to small municipal public works and
to the community at large.
Enjoy reading about how organizations move geospatial
technology from the back room to the field, across an
organization, and into the hands of the public.
Warm regards,
Jack Dangermond
President
4
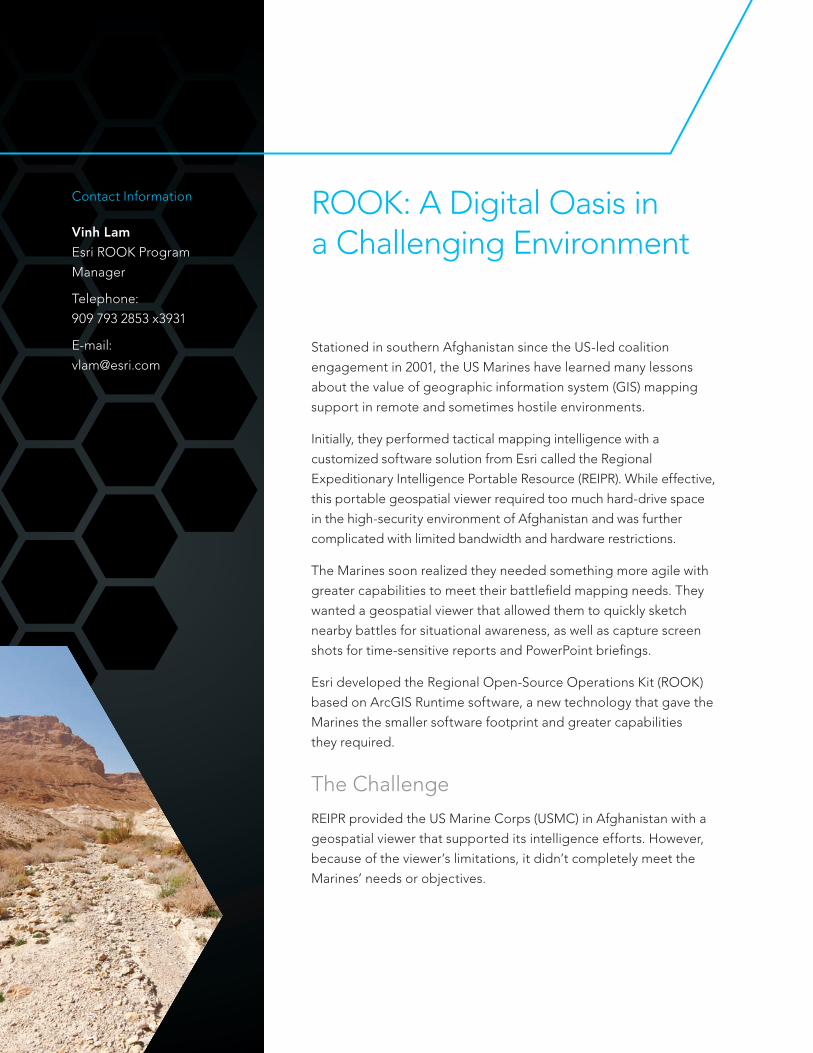
Stationed in southern Afghanistan since the US-led coalition
engagement in 2001, the US Marines have learned many lessons
about the value of geographic information system (GIS) mapping
support in remote and sometimes hostile environments.
Initially, they performed tactical mapping intelligence with a
customized software solution from Esri called the Regional
Expeditionary Intelligence Portable Resource (REIPR). While effective,
this portable geospatial viewer required too much hard-drive space
in the high-security environment of Afghanistan and was further
complicated with limited bandwidth and hardware restrictions.
The Marines soon realized they needed something more agile with
greater capabilities to meet their battlefield mapping needs. They
wanted a geospatial viewer that allowed them to quickly sketch
nearby battles for situational awareness, as well as capture screen
shots for time-sensitive reports and PowerPoint briefings.
Esri developed the Regional Open-Source Operations Kit (ROOK)
based on ArcGIS Runtime software, a new technology that gave the
Marines the smaller software footprint and greater capabilities
they required.
The Challenge
REIPR provided the US Marine Corps (USMC) in Afghanistan with a
geospatial viewer that supported its intelligence efforts. However,
because of the viewer’s limitations, it didn’t completely meet the
Marines’ needs or objectives.
ROOK: A Digital Oasis in a Challenging Environment
Contact Information
Vinh Lam
Esri ROOK Program
Manager
Telephone:
909 793 2853 x3931
E-mail:

5
While using REIPR, the Marines developed four
criteria that were essential to the successful imple-
mentation of a geospatial viewer for military use:
•Small digital footprint for installation
•The ability to operate in a disconnected environment
•Being preloaded with the data and images needed in deployment areas
•Having no administration privileges required to begin the installation process
The Solution
With the release of Esri’s ArcGIS Runtime, new
possibilities became available to develop a
geospatial viewer for military use. ROOK, the
resultant viewer, requires less than 300 MB of
hard-drive space and can function with or without
network connectivity. The application can be
loaded onto a single DVD.
In a disconnected environment, ROOK gives users
the ability to load their laptops with unclassified GIS
resources, such as maps, data, and geoprocessing
tools. This is important for US Marine intelligence
analysts, whether they are deployed for battlefield
assessment or emergency relief efforts.
Publicly available geospatial data and maps can
be preloaded on ROOK before deployment. This
means Marines are not forced to rely on classified
government systems that may have limited resources
and cumbersome administrative procedures.
New users can easily learn ROOK in a single
session. The interface is intuitive and includes
19 buttons and one toolbar, making formal
training unnecessary.
The Results
The US Marine Corps pioneered ROOK and plans
to extend its use throughout the USMC Intelligence,
Surveillance, and Reconnaissance (ISR) Enterprise as
a portable dissemination solution.
While ROOK was not deployed in Afghanistan
because of America’s reduction in troop numbers
and involvement, Typhoon Haiyan, one of the most
powerful storms ever recorded, gave the Marines a
chance to field-test its capabilities.
This ROOK image displays MIL-STD-2525B symbology in Afghanistan.
6
Qatar Enters a New Era of Emergency Response and Proactive SecurityA Unified Geospatial Infrastructure Boosts the Country's Response
Capabilities with Actionable Information
Contact Information
Maj. Aref Hassan EbrahimPM, Technical AffairsDepartment
NCC, MOI, Qatar
E-mail: [email protected]
Mahmoud OsamaProducts Development Manager
Esri Northeast Africa, Egypt
E-mail: mahmoud.osama
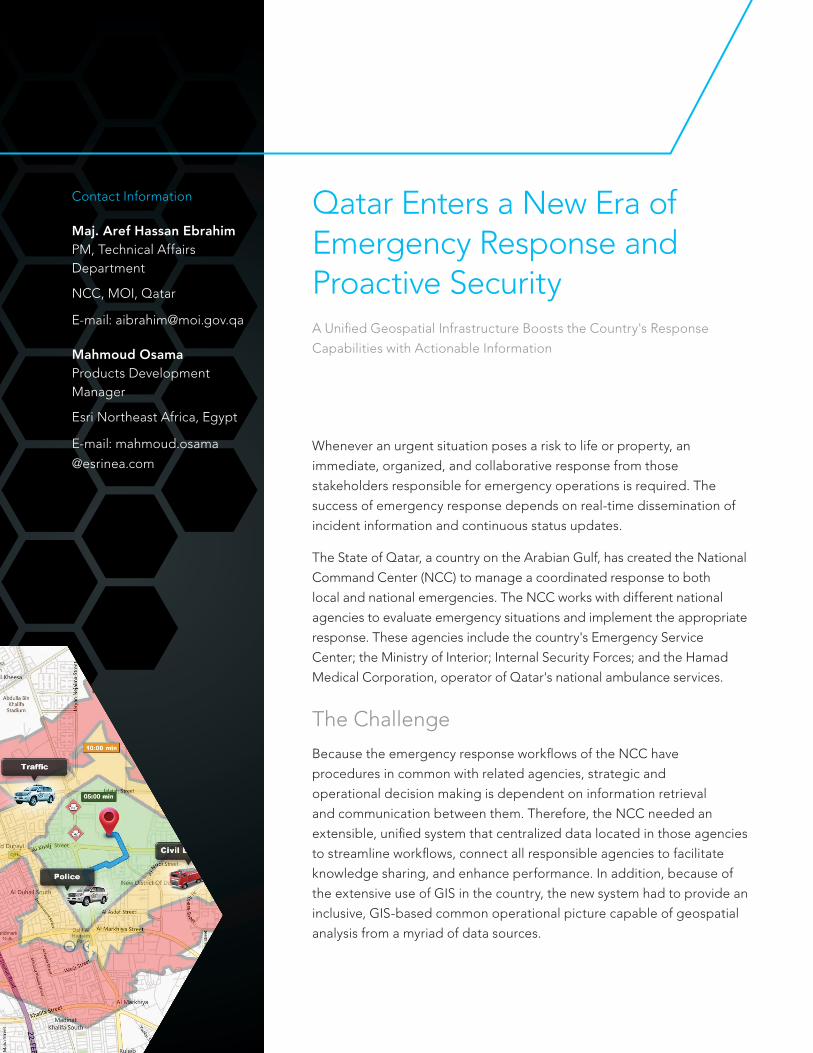
@esrinea.comWhenever an urgent situation poses a risk to life or property, an
immediate, organized, and collaborative response from those
stakeholders responsible for emergency operations is required. The
success of emergency response depends on real-time dissemination of
incident information and continuous status updates.
The State of Qatar, a country on the Arabian Gulf, has created the National
Command Center (NCC) to manage a coordinated response to both
local and national emergencies. The NCC works with different national
agencies to evaluate emergency situations and implement the appropriate
response. These agencies include the country's Emergency Service
Center; the Ministry of Interior; Internal Security Forces; and the Hamad
Medical Corporation, operator of Qatar's national ambulance services.
The Challenge
Because the emergency response workflows of the NCC have
procedures in common with related agencies, strategic and
operational decision making is dependent on information retrieval
and communication between them. Therefore, the NCC needed an
extensible, unified system that centralized data located in those agencies
to streamline workflows, connect all responsible agencies to facilitate
knowledge sharing, and enhance performance. In addition, because of
the extensive use of GIS in the country, the new system had to provide an
inclusive, GIS-based common operational picture capable of geospatial
analysis from a myriad of data sources.

7
Integration between NJM Dispatching application, other NJM applications, and external applications empowers dispatch officers with the actionable information needed for efficient emergency response. Based on service area analysis, NJM Dispatching application recommends units in the proximity of the incident and draws the route to the incident on the map.
The Solution
Qatar-based Mannai Corporation and Esri
Northeast Africa in Egypt, in consultation with Esri's
national security team, developed a solution that
fulfilled the extensive requirements of the NCC.
NJM (the Arabic acronym for Unified Geospatial
Infrastructure) is a web-based, bilingual (Arabic/
English) geographic security system built on the
ArcGIS platform. It includes a number of interactive
applications and a unified geodatabase that
hosts all geographic and tabular data in a single
repository. NJM integrates all NCC functions into a
single system and seamlessly interfaces with other
systems when needed.
NJM supports the NCC's emergency response
workflow, starting with incident reporting, when
NJM Call Taking application receives a call for
service. Through computer telephony integration,
the caller's telephone number is identified with
an automatic number identification system. The
location and related information are then retrieved
and displayed on a map through integration with
the automatic location identification services
provided by mobile operators. Based on that
location, the application provides the emergency
call operator with locational information, including
the records of nearby incidents, hazardous
materials, and critical infrastructures. Predefined
instructions and inquiries (or ProQA directions for
medical cases), per incident classification, guide
the operator through the information collecting
procedure. For certain situations, the NCC
requested that senior officials be notified about
specific incidents that require special attention. This
need is addressed through the integration of the
application with the short message service (SMS).
An SMS is automatically sent by NJM system to
notify predetermined senior officials when a special
incident is recorded.
NJM Dispatching application provides incident
details and its location, as well as the location of
responding vehicles and their availability status. The
application then uses the ArcGIS Network Analyst
extension with an integrated automatic vehicle
location (AVL) service to determine the nearest

8
available units and match the response needs with
predefined unit capabilities and their current location.
Accordingly, it recommends the best units that could
be assigned to the incident as first responders.
Furthermore, with the updates of incident details,
recommendations can be repeated for second
responder units and any additional units needed.
NJM Mobile Data Terminal application
automatically receives the dispatched incident
and pushes it to the in-field officer, along with
all relevant information. Using the system's route
analysis capabilities, route mapping and driving
directions facilitate the unit's response to the
incident. Building diagrams are also provided to
speed up the responders' access to the incident
location. Nearby priority areas and hazards are
highlighted for dispatch and unit officers so that
they can avoid further risks and limit incident
impact. An open channel of communication
between NJM Dispatching and NJM Mobile Data
Terminal enables the continuous exchange of
the latest incident and unit status updates. The
dispatch officer can continuously monitor the
movement of all in-field units on an interactive
map through the integration of NJM Dispatching
application with the AVL service. Also, any
updates to incident details or status are shared
with respective stakeholders through audio and
visual alerts as well as through a live news feed.
NJM Crime and Incident Analyzer provides a number of temporal and spatial analysis capabilities and reports that can be shared with different stakeholders.
9
Solid integration with government services
through an enterprise service bus enables
operators, dispatch officers, and unit officers
to retrieve information from civil records, traffic
authority, visa systems, and mobile operator
systems. The follow-up on overall emergency
response performance is addressed through NJM
Supervisor application, which provides a complete,
generic map-based image of work progress,
key performance indicators, incident frequency,
residential and commercial zone classifications,
and daily staff performance reports. The system
also supports proactive emergency management
activities through NJM Mission Planning
application, which uses ArcGIS Spatial Analyst to
enable geospatial modeling and visualization of
2D preresponse plans for priority areas, supported
with 3D area visibility analysis and line-of-sight
analysis. The plans define the required resources
from different agencies to properly respond
to potential risks. These plans are shared with
dispatch and field officers for implementation.
Another powerful capability of the system is NJM
Crime and Incident Analyzer, which analyzes existing
data using ArcGIS Network Analyst and Spatial
Analyst extensions to provide a comprehensive
view of incident and crime density, geographic
distribution, and temporal and spatial recurrence
patterns to help emergency response authorities
address the root causes behind incidents and
crimes. Analytical results generated by NJM Crime
and Incident Analyzer can be shared with related
agencies through generated reports.
The management of emergency resources
and their daily operations is handled through
two different applications. NJM Resource
Geo-Manager enables resource managers
to add and manage emergency response
resources—personnel, animals, equipment, and
vehicles—and design templates defining the
required resources for the different units. NJM
Task Force Management manages duty rosters,
shift patterns, geographic zones, and resource
assignments. It also monitors shift performance
and provides different reports on work groups
and shift schedules and duties.
In addition, the NCC needed to manage the
business rules governing the entire emergency
response workflow, future changes in the
organizational structure of emergency response
agencies and departments, roles and privileges,
the availability of GIS data, notification rules,
dispatching policy, and the relations between
different applications. All these needs, along with
many other administration services, are addressed
through NJM Enterprise Manager application.
Finally, to guarantee continuous availability
of the system, the entire NJM environment is
replicated in a disaster recovery (DR) center
remotely connected to the main NJM system
at the NCC data center through a fiber-optics
infrastructure. All tiers of the DR environment
are automatically synchronized with the main
data center environment to guarantee minimum
recovery efforts and downtime in the worst-case
scenario of physical damage to the data center
and the main system.
The Result
Emergency response time per incident has been
significantly reduced, and the process itself is
more efficient. All stakeholders now benefit from
the GIS-based common operational picture,
which allows an immediate connection between
incidents, units, critical infrastructures, priority
assets, and other critical information. In addition,
the continuous accumulation of data, along with
the rich analytical capabilities of the system,
supports future response and the reduction of
potential risk. The situational awareness provided
by pushing the right information to the right place
at the right time enhances the overall capabilities
of Qatar's emergency response efforts. The
flexibility of NJM system paves the way to
accommodating new security needs and a safer
future for Qatar's residents and visitors.

10
Compatible land use is a critical consideration whenever military
installations are close to local communities, whether from urban sprawl,
population growth, or mission expansion. To address this issue, the US
Department of the Navy created the Navy Community Planning and
Liaison Officer (CPLO) position to better understand the interaction
between military and civilian activities. CPLOs work directly with community
officials to minimize operational impacts and ensure the health, safety,
and welfare of the public. The GeoReadiness Center (GRC) at the
Commander, Navy Region Southeast in Jacksonville, Florida, provides
tailored Esri GIS support to CPLOs and navy departments from
Texas to Puerto Rico. Analyzing both inside and outside the navy fence
line using parcel, land-use, and zoning data, the GRC creates custom maps
that help CPLOs perform spatial analysis, identify potential impacts, and
develop mitigation recommendations for the local community.
The Challenge
Due to the specialized mission of each military installation, there are
unique challenges between the installation and the adjacent community —
aircraft noise, accident potential zones (APZ), marine training encroachment,
radar or frequency interference, security concerns, airfield obstructions,
and more.
Most land-use conflicts are minor, but some underscore the gravity of
the CPLO mission. In April 2012, an F-18 from Naval Air Station Oceana
crashed into an apartment complex in Virginia Beach, Virginia, that was
located in an APZ where the construction of residential property was
not recommended. Fortunately, there was no loss of life, but this
accident highlights the importance of appropriate land-use development
near military installations.
US Navy Uses GIS to Minimize Its Impact on Local Communities
Contact Information
Ryan Warne, GISPSenior Geospatial Analyst
Telephone: 904 542 6132
E-mail: [email protected]
Naval Facilities Engineering Command SoutheastBuilding 903Yorktown AvenueJacksonville, FL 32212
11
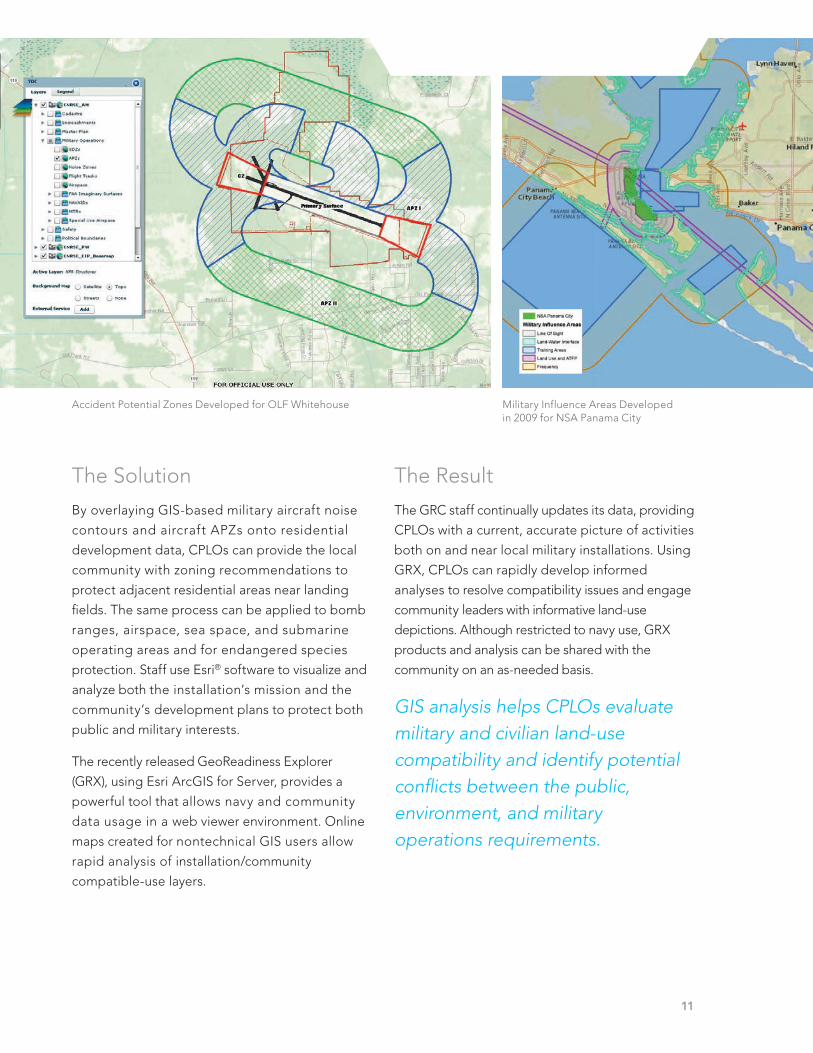
The Solution
By overlaying GIS-based military aircraft noise
contours and aircraft APZs onto residential
development data, CPLOs can provide the local
community with zoning recommendations to
protect adjacent residential areas near landing
fields. The same process can be applied to bomb
ranges, airspace, sea space, and submarine
operating areas and for endangered species
protection. Staff use Esri® software to visualize and
analyze both the installation’s mission and the
community’s development plans to protect both
public and military interests.
The recently released GeoReadiness Explorer
(GRX), using Esri ArcGIS for Server, provides a
powerful tool that allows navy and community
data usage in a web viewer environment. Online
maps created for nontechnical GIS users allow
rapid analysis of installation/community
compatible-use layers.
The Result
The GRC staff continually updates its data, providing
CPLOs with a current, accurate picture of activities
both on and near local military installations. Using
GRX, CPLOs can rapidly develop informed
analyses to resolve compatibility issues and engage
community leaders with informative land-use
depictions. Although restricted to navy use, GRX
products and analysis can be shared with the
community on an as-needed basis.
GIS analysis helps CPLOs evaluate military and civilian land-use compatibility and identify potential conflicts between the public, environment, and military operations requirements.
Accident Potential Zones Developed for OLF Whitehouse Military Influence Areas Developed in 2009 for NSA Panama City
12
Rapidly Responding to Colorado's Historic Floods
Contact Information
Tabatha WaldronGeospatial Analyst
Colorado Department of Public Safety
Division of Homeland Security Emergency Management (DHSEM)
E-mail: [email protected]
Patrick GoodElectrical Engineer
Longmont Power & Communications
E-mail: [email protected]
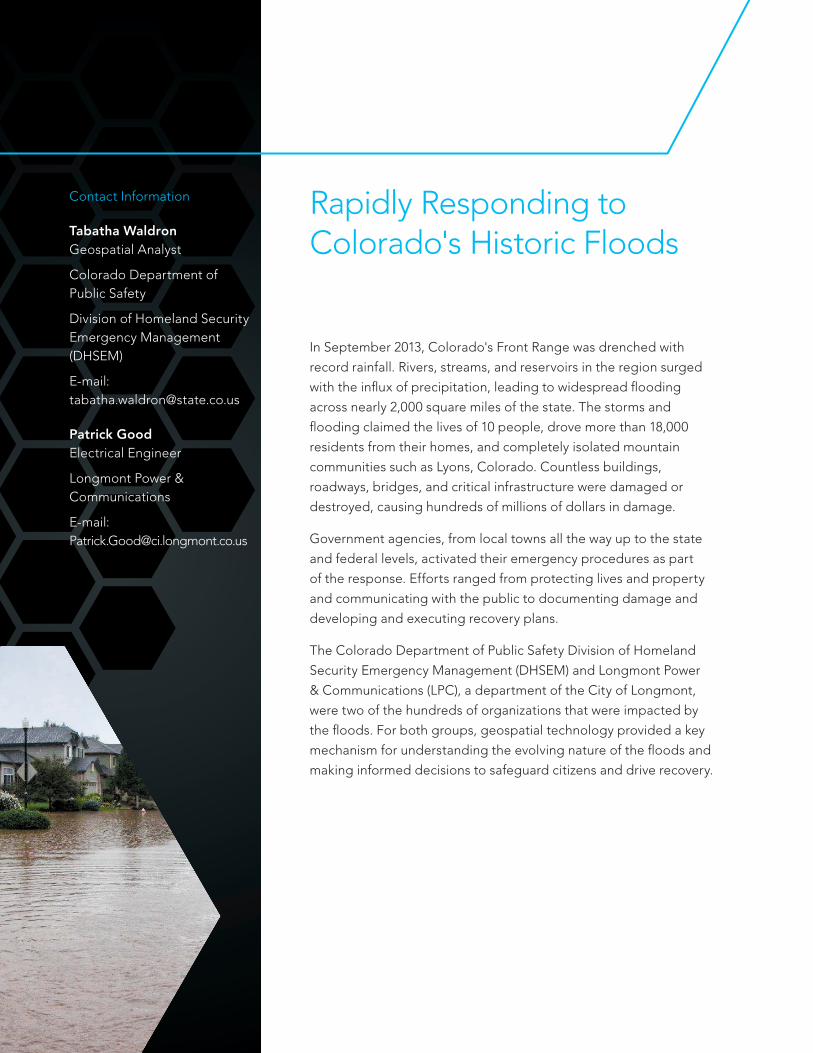
In September 2013, Colorado's Front Range was drenched with
record rainfall. Rivers, streams, and reservoirs in the region surged
with the influx of precipitation, leading to widespread flooding
across nearly 2,000 square miles of the state. The storms and
flooding claimed the lives of 10 people, drove more than 18,000
residents from their homes, and completely isolated mountain
communities such as Lyons, Colorado. Countless buildings,
roadways, bridges, and critical infrastructure were damaged or
destroyed, causing hundreds of millions of dollars in damage.
Government agencies, from local towns all the way up to the state
and federal levels, activated their emergency procedures as part
of the response. Efforts ranged from protecting lives and property
and communicating with the public to documenting damage and
developing and executing recovery plans.
The Colorado Department of Public Safety Division of Homeland
Security Emergency Management (DHSEM) and Longmont Power
& Communications (LPC), a department of the City of Longmont,
were two of the hundreds of organizations that were impacted by
the floods. For both groups, geospatial technology provided a key
mechanism for understanding the evolving nature of the floods and
making informed decisions to safeguard citizens and drive recovery.

13
The Challenge
As the primary state response agency, Colorado
DHSEM was tasked with understanding where
flooding occurred and determining where to
deploy response assets. The department needed
a platform to share information and perform
analysis in real time to coordinate activities across
multiple agencies.
With a service territory of 49 square miles
covering the towns of Longmont and Hygiene and
parts of Lyons, LPC was hit particularly hard by
the storm. Significant portions of its infrastructure
were damaged, and approximately 1,300
customers were without power for several days.
LPC staff needed a way to efficiently manage
inspections and repair infrastructure.
The Solution
Both Colorado DHSEM and LPC used ArcGISSM
Online to visualize information related to the
floods and impacted areas. ArcGIS Online
enabled Colorado DHSEM and LPC to share
continuously updated live maps with staff located
in the field and in offices throughout the state.
Colorado DHSEM worked with local, state,
federal, and private partners to collect imagery
and geospatial information to create maps related
to everything from road closures and traffic
control points to evacuation areas and damaged
facilities. The myriad maps and data created a
common operating platform that decision makers
were able to access in support of response and
recovery efforts. Regional field managers and
other personnel used the maps to maintain
situational awareness and make informed
decisions that supported their local counterparts.
In addition to ArcGIS Online, LPC also used
Collector for ArcGIS, a configurable app for
smartphones and tablets that enables field data
collection and syncs with online maps. Field crews
used Collector for ArcGIS to inspect high-voltage
equipment in the field. Their reports were fed
into an online map that was instantly updated on
all the crews' devices. This let field personnel see
what had already been inspected and allowed
them to perform their work in smaller groups.
Streams and rivers surged, overrunning banks and affecting bridges and pathways.
Widespread flooding left residential communities and commercial properties completely inaccessible.

14
The Results
The online maps created by Colorado DHSEM
were accessed by hundreds of users to visualize
impacted areas and orchestrate response efforts.
Other online maps, such as those identifying
disaster recovery centers, were also shared with
the public. The common operating platform
offered by ArcGIS helped leaders understand the
size, scope, and proximity of the crisis.
Collector for ArcGIS empowered LPC to complete
inspections of all damaged assets in just three
days. By replacing paper maps and dispatch lists,
LPC was able to operate more efficiently and
quickly perform critical tasks. In all, the ArcGIS
platform helped LPC gain a better understanding
of the impact of the floods and lowered costs by
optimizing the efforts of its field crews.
As inspections were completed in the field, they were immediately recorded on an ArcGIS Online map that field- workers and office staff monitored.
Collector for ArcGIS helped field crews stay updated about where inspections had occurred and where to focus repair efforts.
Floodwaters caused severe damage to roadways and other infrastructure throughout the state.

15
GIS-Based Web Services Provide Rapid Analysis and Dissemination of Maritime Data
The Royal Australian Navy’s (RAN’s) Hydrography, Meteorology
and Oceanography (HM) Branch is responsible to the Australian
Department of Defence for the collection, management, analyses, and
dissemination of meteorological and oceanographic data. Through
this process, the HM Branch provides information on the maritime
environment. This enables defense users at the strategic (through
climatology), operational (through forecasts), and tactical (through
observations) levels to properly consider the environmental impacts on
planning and conducting maritime activities.
The Challenge
The ocean can be a harsh and unrelenting environment, providing
no shelter for vessels and their crews caught in open waters.
Extreme winds, rogue waves, untracked icebergs, and freezing ship
superstructures are only a few of the conditions that can disrupt
maritime activities. In extreme cases, they can lead to disasters.
The ability to rapidly assess change for safe navigation is crucial for
the mariner and the defense planner. The volume of data collected
for parameters, such as ocean temperature and salinity, ocean
currents, winds, and waves, is enormous, significantly increased with
the added dimensions of depth and time. To provide context, data
must be geolocated relative to foundation maritime features such
as coastlines, bathymetric survey data, and nautical charts. It must
also be considered in relation to vector datasets such as Automatic
Identification System (AIS) shipping traffic, piracy incidents, and
fishing activity.
Contact Information
Martin RutherfordDirector, Maritime Military Geospatial Information and Services, Royal Australian Navy, Directorate of Oceanography and Meteorology
E-mail: Martin.Rutherford@defence .gov.au
16
In addition to the volume of data, its analysis
and dissemination is further complicated by
the number of formats that are required by
the agencies using it. These formats include
Network Common Data Form (NetCDF), General
Regularly-distributed Information in Binary (GRIB),
and Tagged Image File Format (TIFF). All these
data formats must be easily accessible.
The Solution
Using a combination of custom scripts and
ArcGIS for Server, the HM Branch is able to
satisfy a variety of requirements to quickly serve
meteorological and oceanographic (METOC),
bathymetric, and geospatial foundation data.
•Foundation data is served as Open Geospatial
Consortium, Inc. (OGC), web services.
•Nautical charts and bathymetric data are served
as OGC Web Map Service (WMS) with a REST
endpoint and also as native GeoTIFF.
•The NetCDF weather data is published as WMS
and Web Coverage Service (WCS) and served
as NetCDF.
•The use of WMS and WCS also allows the use of
OGC web processing services (WPS).
These make the data readily available for use in
ArcGIS for Desktop and a variety of systems that
use OGC web services.
The Result
The ability to load data, quickly develop products,
and serve the resultant information in a variety
of formats and web services are significant
advantages when analyzing rapidly changing
environmental conditions. These processes
enable commanders and analysts to gain superior
knowledge of their battlespace and environment,
leading to the best course of action at both
operational and tactical levels.
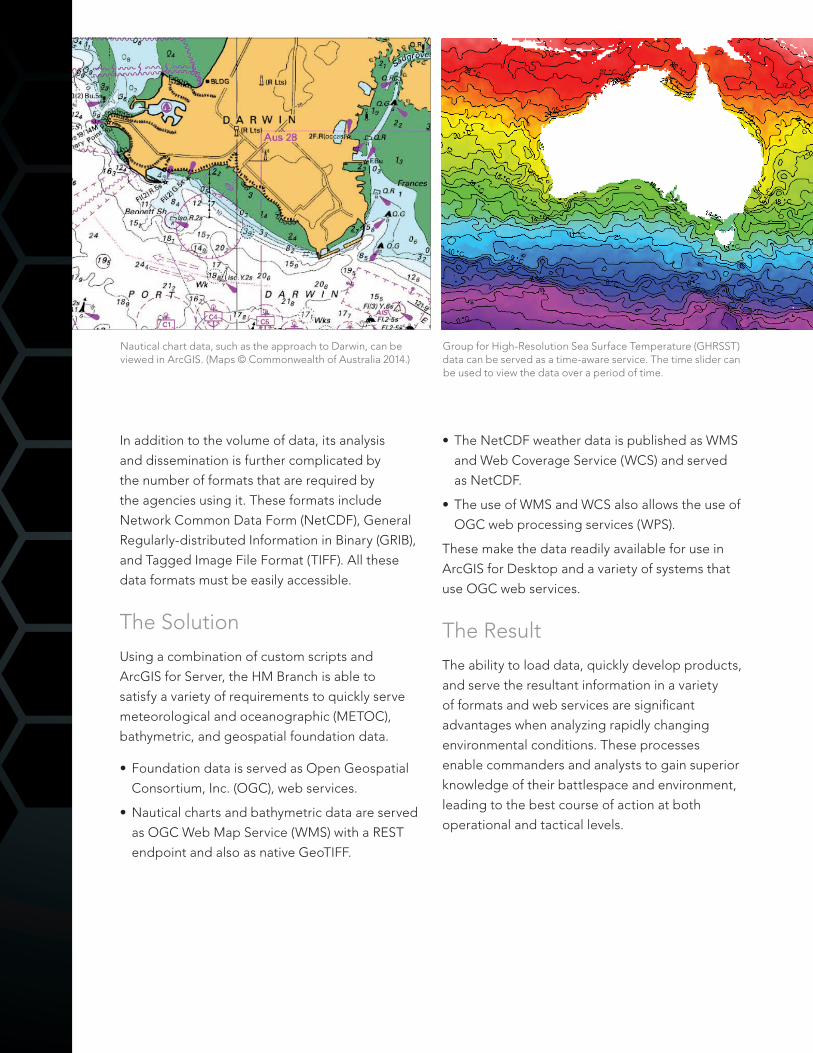
Nautical chart data, such as the approach to Darwin, can be viewed in ArcGIS. (Maps © Commonwealth of Australia 2014.)
Group for High-Resolution Sea Surface Temperature (GHRSST)data can be served as a time-aware service. The time slider can be used to view the data over a period of time.
17
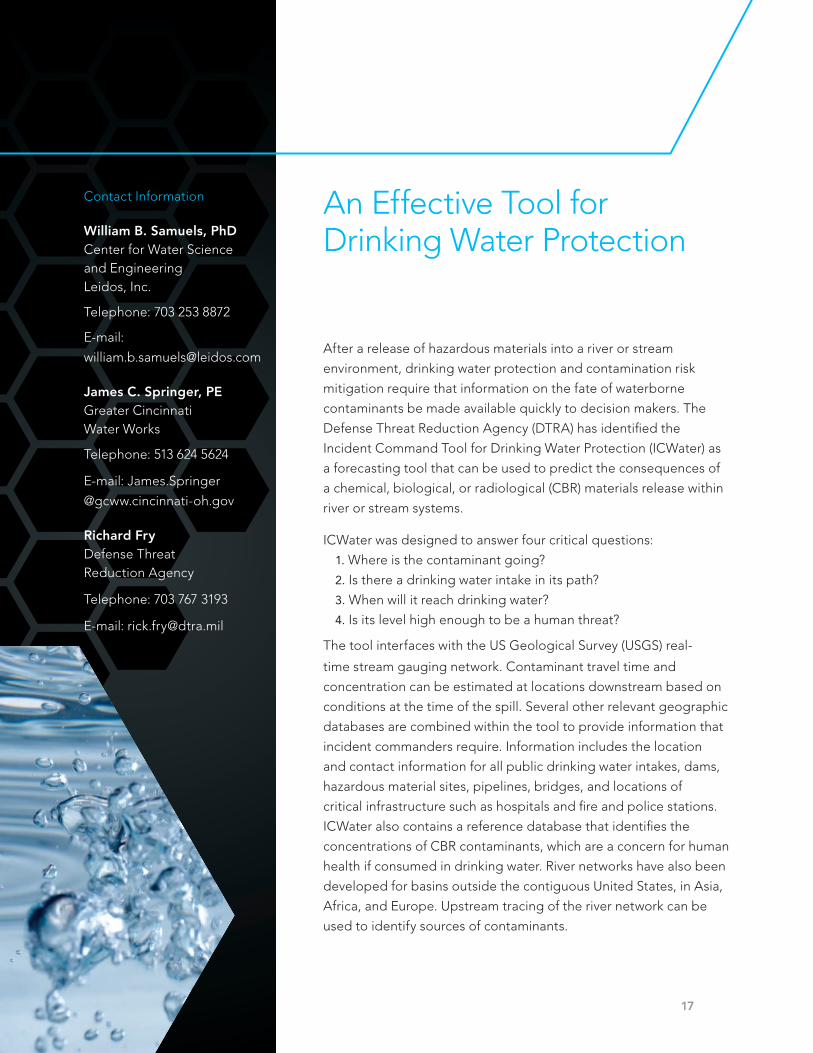
After a release of hazardous materials into a river or stream
environment, drinking water protection and contamination risk
mitigation require that information on the fate of waterborne
contaminants be made available quickly to decision makers. The
Defense Threat Reduction Agency (DTRA) has identified the
Incident Command Tool for Drinking Water Protection (ICWater) as
a forecasting tool that can be used to predict the consequences of
a chemical, biological, or radiological (CBR) materials release within
river or stream systems.
ICWater was designed to answer four critical questions:
1. Where is the contaminant going?
2. Is there a drinking water intake in its path?
3. When will it reach drinking water?
4. Is its level high enough to be a human threat?
The tool interfaces with the US Geological Survey (USGS) real-
time stream gauging network. Contaminant travel time and
concentration can be estimated at locations downstream based on
conditions at the time of the spill. Several other relevant geographic
databases are combined within the tool to provide information that
incident commanders require. Information includes the location
and contact information for all public drinking water intakes, dams,
hazardous material sites, pipelines, bridges, and locations of
critical infrastructure such as hospitals and fire and police stations.
ICWater also contains a reference database that identifies the
concentrations of CBR contaminants, which are a concern for human
health if consumed in drinking water. River networks have also been
developed for basins outside the contiguous United States, in Asia,
Africa, and Europe. Upstream tracing of the river network can be
used to identify sources of contaminants.
An Effective Tool for Drinking Water Protection
Contact Information
William B. Samuels, PhDCenter for Water Science and Engineering Leidos, Inc.
Telephone: 703 253 8872
E-mail:
James C. Springer, PE Greater Cincinnati Water Works
Telephone: 513 624 5624
E-mail: James.Springer
@gcww.cincinnati-oh.gov
Richard Fry Defense Threat Reduction Agency
Telephone: 703 767 3193
E-mail: [email protected]

18
In addition to ICWater, models of water
distribution (PipelineNet) and wastewater
collection systems (SewerNet) have been
developed for emergency management of CBR
events. The tools have demonstrated usefulness
for spill response and homeland security through
their application in national and international
events such as the West Virginia chemical spill
and the Fukushima Daiichi Nuclear Power Plant
incident. ICWater was developed by Leidos, Inc.
(carrying on the legacy of Science Applications
International Corporation[SAIC]), with funding
from several government agencies, most notably
the US Forest Service and DTRA. DTRA currently
maintains, trains, and distributes the software to
federal, state, and local users.
The Challenge
On January 9, 2014, an estimated 10,000 gallons
of 4-methylcyclohexanemethanol (MCHM), an
organic solvent used in coal processing, leaked
from a ruptured container into the Elk River near
Charleston, West Virginia. The spill, just one mile
upstream from a water treatment plant, forced
officials to ban residents and businesses in nine
West Virginia counties from using the water for
anything other than flushing toilets or fighting
fires. An estimated 300,000 West Virginia resi-
dents were affected by the spill. ICWater model
runs were initiated by DTRA, Leidos, and Greater
Cincinnati Water Works (GCWW) to estimate the
travel time and concentration of the spill.
ICWater Interface Showing Spill Site, Charleston Intake,
and Real-Time USGS Gauge

19
The Solution
ICWater, an Esri ArcGIS extension, uses the
National Hydrography Dataset Plus (NHDPlus) river
network for downstream and upstream tracing of
contaminants. NHDPlus contains more than three
million stream and river reaches, all hydrologically
connected. Mean flow volume and velocity are
attributes of each reach in the network.
USGS real-time stream flow gauges are linked to
the network to update the mean flows and
velocities to reflect actual conditions. The
difference between the updated mean velocity
in ICWater and the measured velocity on the
Kanawha River (just downstream of the spill and
the Charleston, West Virginia, intake) was less
than 3 percent. The system also contains locations
of industrial and municipal dischargers such
as the spill site on the Elk River. It is also linked
to the Environmental Protection Agency Safe
Drinking Water Information System to provide
data on populations served by each water utility
downstream of the spill.
Tracing was initiated at the spill site to forecast
the location of the leading edge, peak
concentration, and trailing edge of the plume for
drinking water intakes as far downstream as 200
miles. Model runs were updated based on MCHM
measurements at downstream locations on the
Ohio River to provide accurate forecasts to nearby
water intakes.
The Results
GCWW, a large water utility on the Ohio
River, used ICWater and National Oceanic and
Atmospheric Administration velocity estimations,
along with river grab samples, to determine
when to close its intake to allow the spill to pass
by. Data for Cincinnati showed good agreement
(within several hours) between the observed peak
time of arrival and the model’s estimated peak
time. The leading-edge predictions were also
close to the observations.
According to GCWW, “The model was very useful
in preparing for the arrival of the spill. It assisted
in narrowing down an expected time of arrival
and was especially useful in predicting the peak
concentration. In spills such as the Elk River spill,
GCWW normally closes the raw water intakes to
allow the spill to pass.”
ICWater Downstream Trace (120 hours travel time) Showing Drinking Water Intakes
ICWater Downstream Trace (120 hours' travel time) Showing Drinking Water Intakes

20
Contact Information
Ed CarubisPrincipal Consultant/Senior Program Manager
Professional Services—Public Safety
Esri
E-mail: [email protected]
Keeping an Eye on the Port of Long Beach
Together with the Port of Los Angeles, the Port of Long Beach
accounts for more than 40 percent of the containerized cargo and
materials that enter the United States. The port supports more
than a million jobs throughout the country and generates billions
of dollars in economic activity each year.
With 3,200 acres of land and 80 berths, keeping track of
everything that’s occurring throughout the port is a difficult but
critical task. Port officials must be aware of a variety of potential
problems, from security concerns and environmental hazards to
logistics and staff safety.
The Challenge
Given the size and complexity of port operations, the Port of
Long Beach needed a way to prioritize the allocation of limited
resources throughout the port complex. With literally hundreds of
vessels, trucks, and containers moving at any given moment, port
officials needed a way to easily identify irregular situations, such
as people gathering near a gate, and ensure smooth operations.
The port also coordinates with many other jurisdictions and
agencies, ranging from the US Department of Homeland Security
and the US Coast Guard at the federal level to local fire and law
enforcement agencies in Los Angeles and Long Beach. When
incidents occur, the port must be able to rapidly coordinate and
share information with these various entities.

21
The Solution
The Port of Long Beach contracted with Esri
Professional Services to develop a comprehensive
geospatial technology-based security and
business resiliency system called Virtual Port.
Built with the entire ArcGIS platform, this open,
configurable solution provides a common
operating platform for port operations that pulls
in open-source data from a variety of sources.
With Virtual Port, leadership can view live feeds
from hundreds of cameras in the port complex,
get information about traffic conditions in and
around the port, monitor social media, explore
utility and communication networks, and track
live weather conditions. The system also allows
port officials to identify and monitor any vessels
of interest within its sphere of influence and get
an alert when suspicious or abnormal behavior
is observed. All this information is presented in
a map-based view that lets personnel see at a
glance what’s happening across the complex.
Because of security requirements, Virtual Port
leverages Portal for ArcGIS, which is deployed
behind the organization’s firewall and restricts
access to authenticated users. When information
needs to be shared with the public, the port
uses ArcGIS Online to create public-facing web
applications. Mobile apps ensure that staff
throughout the complex can stay connected to
the system and maintain situational awareness at
all times.
The Results
Virtual Port provides decision makers with
instantaneous information from multiple response
agencies that helps them identify which resources
and assets are available and where they are at
any time. As a shared system, Virtual Port helps
leadership orchestrate resiliency and efficiency
in the movement of cargo, which is the primary
mission of the port.
When incidents—such as fire or the release
of volatile chemicals—occur, the Virtual Port
system used for daily operations becomes a
platform for coordinating response. Rule-based
alerts built with ArcGIS GeoEventTM Extension

22
for Server provide instant notifications to port
personnel when certain conditions occur, such
as a vessel coming within the designated radius
of a restricted area. This helps staff immediately
identify unusual incidents. Multiple agencies can
connect to Virtual Port and access its common
operational picture to collaborate and share
information, ensuring better business recovery
and resiliency. Port officials can also run what-if
scenarios that model chemical plumes and other
potential hazards to help agencies prepare for
and better understand the impact of possibly
dangerous situations.
Virtual Port has been in place for several years
and continues to evolve as new capabilities and
technologies emerge.

23
Esri Training for National Security
Effective training is essential to build and sustain enterprise geospatial
capabilities. Esri training options are designed to help geospatial
professionals and other knowledge workers maximize their productivity
with the ArcGIS platform.
Instructor-led courses take an immersive, experiential approach to
learning. Their design incorporates proven adult learning principles
and focuses on interaction and hands-on skills application. Self-
paced e-learning courses cover focused geospatial topics and
are a convenient option to provide on-demand access to training
throughout your organization.
Esri domain experts have created a specialized curriculum to support
the unique missions of national security organizations. Using a mix
of instructor-led and e-learning courses, the curriculum addresses
core concepts and best practices to visualize, analyze, and manage
geospatial content. Courses use relevant operational scenarios to
enhance learning and skills application.
To learn more, please visit esri.com/geospatial-skills.
Esri Technical Certification Program
The Esri Technical Certification Program is designed to create a
community of qualified individuals who are proficient in best practices
using Esri software. The program helps organizations maximize their
investment in Esri technology by employing a work force certified in
using best practices and assists with creating progressive professional
development plans. Exams recognize expertise in desktop, enterprise,
and developer domains.
To learn more, please visit esri.com/certification.
For more information, e-mail [email protected].

Printed in USA
Contact Esri
380 New York Street Redlands, California 92373-8100 usa
1 800 447 9778 t 909 793 2853 f 909 793 5953 [email protected] esri.com
Offices worldwide esri.com/locations
Esri inspires and enables people to positively impact their future through a deeper, geographic understanding of the changing world around them.
Governments, industry leaders, academics, and nongovernmental
organizations trust us to connect them with the analytic knowledge
they need to make the critical decisions that shape the planet. For
more than 40 years, Esri has cultivated collaborative relationships
with partners who share our commitment to solving earth’s most
pressing challenges with geographic expertise and rational resolve.
Today, we believe that geography is at the heart of a more resilient
and sustainable future. Creating responsible products and solutions
drives our passion for improving quality of life everywhere.
Copyright © 2014 Esri. All rights reserved. Esri, the Esri globe logo, ArcGIS, GeoEvent, @esri.com, and esri.com are trademarks, service marks, or registered marks of Esri in the United States, the European Community, or certain other jurisdictions. Other companies and products or services mentioned herein may be trademarks, service marks, or registered marks of their respective mark owners.
142292ESRI7/14ek