enterprise legal management trends report enterprise legal management trends report
TRANSCRIPT

Powered by:
Enterprise Legal Management Trends Report20
13
Powered by:
Enterprise Legal Management Trends Report2013 Mid-Year Edition
The Rise of “Large Enough” Law Firms2013

2013 CounselLink Enterprise Legal Management Trends Report
Page 2
Executive Highlights
• “Large Enough” law firms are eating into market share of the “Largest 50.”Amongfirmswith201-500lawyers,referredtoas“LargeEnough”firmsinthisreport,theshareofU.S.legalfeespaidbyclientshasgrownfrom18%threeyearsago(July1,2009–June30,2010)to22%inthetrailing12monthsthatendedJune30,2013.Simultaneously,theshareofU.S.legalfeespaidbyclientstofirmswithmorethan750lawyers,the“Largest50,”hasgoneintheoppositedirection–droppingfrom26%to20%overthesameperiod.
• Even more dramatic shift in higher fee legal work. Theshiftinlegalworkfromthe“Largest50”firms(>750lawyers)tothe“LargeEnough”(201-500lawyers)categoryisfarmoredramaticwhenexaminingspecificcategoriesofmatters.“LargeEnough”firmshavealmostdoubledtheshareofhighfeelitigationmatters–thosemattersgeneratingoutsidecounselfeestotaling$1millionormore(HighFeeWork).“LargeEnough”firmsgrewtheirportionofU.S.HighFeeWorkfrom22%threeyearsagoto41%inthetrailing12months.
• “Large Enough” firms twice as likely to use AFAs. Asa%oftheirbillings,firmswith201-500lawyersbillednearlytwiceasmuchunderalternativefeearrangementsasdidthe“Largest50”firmsoverthetrailing12months.
• Average U.S. law firm partner bills at $381 per hour. Intermsofbilledhourlyratespaidbyclients,theaveragehourlybillingrateofapartnerinaU.S.lawfirmincreased2.7%overthepreviousyearto$381perhour.Thepartner’spracticearea,however,hasadramaticimpactonherhourlybillingrate.Forexample,adviceandcounselformergersandacquisitionscommandsahigher-than-averagebillingrateof$630.
• U.S. cities with greatest billable rate increases. Amongthe15largestU.S.cities,Philadelphia,Detroit,SanFrancisco,AtlantaandNewYorkarethefivecitieswherelawfirmhourlybillingratesincreasedabove2.5%inbothyear-over-yearandthree-yearcompoundannualgrowthrate.Phoenix,Boston,Houston,DallasandMinneapolislaggedbehind.

2013 CounselLink Enterprise Legal Management Trends Report
Page 3
Introduction
ThisreportisthefirsteditionoftheEnterpriseLegalManagementTrendsReport,poweredbyLexisNexis®CounselLink®.Itsetsthebaselineforwhatwillbeasemi-annualupdateofseveralkeymetricsthatcaninformthedecisionsandsubsequentactionsofcorporatecounselandlawfirms.
ThereportrepresentsanalysisofasnapshotofdataavailableviatheCounselLinkEnterpriseLegalManagementplatform.Currently,thecollectivestreamofdataandprocessedinvoicesrepresentsmorethan$10billioninlegalspend,2millioninvoices,andwellover300,000mattersgatheredoverthepast4years,withthevolumeofdataavailableforanalysisgrowingatarapidpace.
Detailsaboutthemethodologiesused,definitionsandexpertcontributorsconductingtheanalysisarepresentedattheendofthereport.Unlessnotedotherwise,informationisbasedonthetrailing12monthsendingJune30,2013.
Table of Contents Page
ExecutiveHighlights 2
Introduction 3
MarketInsights:“LargeEnough”FirmsOutperformingthe“Largest50” 4
TheKeyMetrics 9
#1:BlendedHourlyRateforMatters–byPracticeArea 9
#2:LawFirmConsolidation-NumberofLegalVendorsUsedbyCorporations 11
#3:AlternativeFeeArrangement(AFA)Usage 13
#4:PartnerHourlyRate–Overall 15
#5:PartnerHourlyRateGrowth–byLocation(City/State) 16
#6:PartnerHourlyRateGrowth–byPracticeArea 18
AbouttheTrendsReport 20

2013 CounselLink Enterprise Legal Management Trends Report
Page 4
Market Insights: “Large Enough” Firms Taking Share from the “Largest 50” Law Firms
CounselLinkdatareflectsagrowingportionoflegalworkbeinghandledbyfirmswith201-500lawyers,or“LargeEnough”firms.Theterm“largeenough”isappliedtothesefirmsbecausefirmsofthissizegenerallyhavefull-servicecapabilitiesacrossabroadarrayofpracticeareasandhavethecapacitytoappropriatelystaffandhandlecomplexandalsohigh-volume,repetitivelegalmatters.Whichfirmsareonthelosingendofthistrend?It’stheveryhighendofthesizespectrum,calledthe“Largest50”…representedbytheapproximately50firmsintheU.S.withmorethan750lawyers.Thismarketshareshiftisreinforcedbythefindingsassociatedwithlawfirmconsolidationandalternativefeearrangements(AFAs)describedlaterinthisreport.

2013 CounselLink Enterprise Legal Management Trends Report
Page 5
Firms > 750 Lawyers
Firms 501-750 Lawyers
Firms 201-500 Lawyers
Firms 51-200 Lawyers
Firms < 50 Lawyers
Figure 1: Enterprise Legal Management Trends ReportMacro Trend: Legal work is moving from the “Largest 50” to “Large Enough” firmsBased on rolling 12-month totals ending June 30 for years 2010 to 2013
This chart shows the % of legal fees billed to CounselLink customers by law firms of different sizes, as measured by the number of attorneys at the firm, over the past 4 years. Each line shows the % of total billings that firms of that particular size captured in each of the past 4 years. For example, in the 12 months ending June 2013, 22% of spend was directed to firms with 201-500 attorneys.
0
10%
20%
30%
40%
50%
12 Months Ending June 2013
12 Months Ending June 2012
12 Months Ending June 2011
12 Months Ending June 2010
% o
f tot
al o
utsi
de c
ouns
el b
illin
gs
Threeyearsago,“LargeEnough”firmswereresponsiblefor18%ofoveralllegalbillings.Inthemostrecent12months,thesamefirmsarenowresponsiblefor22%oflegalbillings.Atthesametime,therelativeportionoflegalworkgiventothe“Largest50”U.S.firmshastrendeddownwardoverthepastthreeyearsfrom26%to20%.
2013 CounselLink Enterprise Legal Management Trends Report
Page 6
0
10%
20%
30%
40%
50%
12 Months Ending June 2013
12 Months Ending June 2012
12 Months Ending June 2011
12 Months Ending June 2010
% o
f tot
al o
utsi
de c
ouns
el b
illin
gs
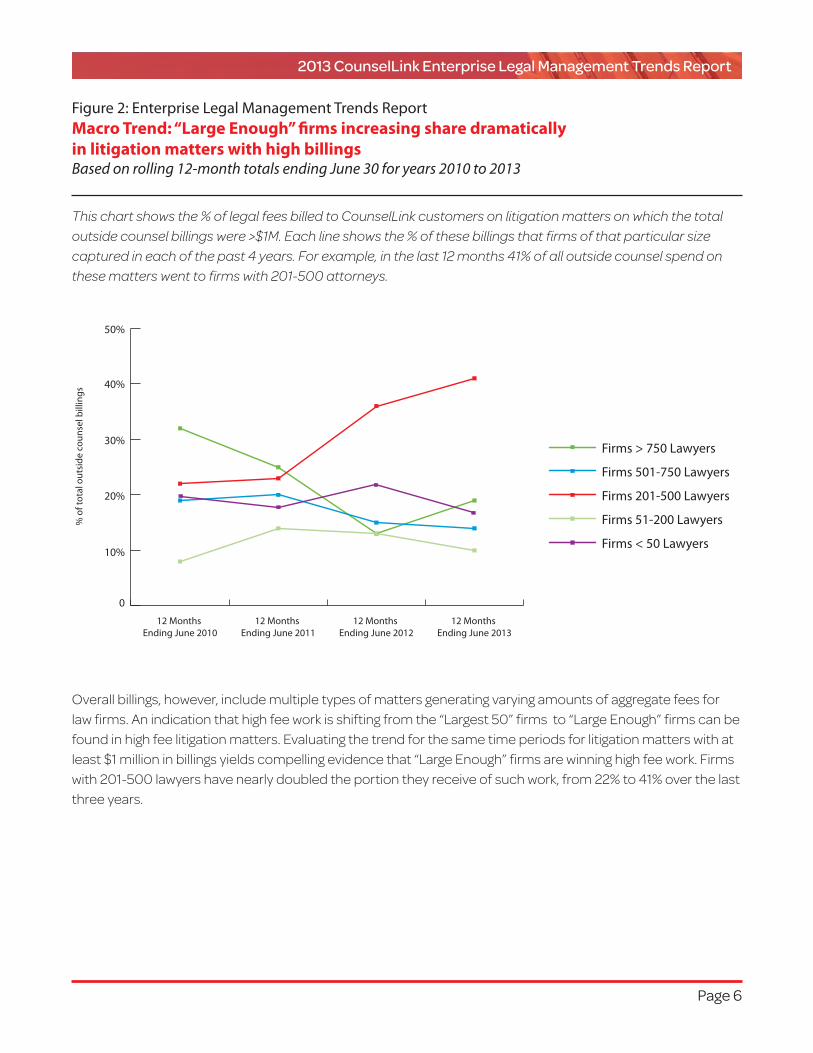
Overallbillings,however,includemultipletypesofmattersgeneratingvaryingamountsofaggregatefeesforlawfirms.Anindicationthathighfeeworkisshiftingfromthe“Largest50”firmsto“LargeEnough”firmscanbefoundinhighfeelitigationmatters.Evaluatingthetrendforthesametimeperiodsforlitigationmatterswithatleast$1millioninbillingsyieldscompellingevidencethat“LargeEnough”firmsarewinninghighfeework.Firmswith201-500lawyershavenearlydoubledtheportiontheyreceiveofsuchwork,from22%to41%overthelastthreeyears.
Firms > 750 Lawyers
Firms 501-750 Lawyers
Firms 201-500 Lawyers
Firms 51-200 Lawyers
Firms < 50 Lawyers
Figure 2: Enterprise Legal Management Trends ReportMacro Trend: “Large Enough” firms increasing share dramatically in litigation matters with high billingsBased on rolling 12-month totals ending June 30 for years 2010 to 2013
This chart shows the % of legal fees billed to CounselLink customers on litigation matters on which the total outside counsel billings were >$1M. Each line shows the % of these billings that firms of that particular size captured in each of the past 4 years. For example, in the last 12 months 41% of all outside counsel spend on these matters went to firms with 201-500 attorneys.

2013 CounselLink Enterprise Legal Management Trends Report
Page 7
Whatmaybedrivingtheshiftinmarketshareawayfromthe“Largest50”tothe“LargeEnough”firms?OnekeymetrictrackedintheEnterpriseLegalManagementTrendsReportisthepercentageoflegalworkaclientprovidestoitstop10lawfirms(formorecontextrefertoKeyMetric#2,page11).Thedataindicatesthatthe“Largest50”firmsarenottheonesbenefitingwhencompaniesdirectmoreoftheirworktofewerfirms;bothhighlyandmoderatelyconsolidatedcompaniesprovide16%ofworktofirmswithgreaterthan750lawyers.Rather,firmswith501-750lawyersand201-500lawyersincreasetheirshareofbillings.Highlyconsolidatedcompaniessend40%oftheirworktofirmsinthesetwosizecategories,whilemoderatelyconsolidatedcompaniesandcompanieswithhighlawfirmfragmentationsend26%and11%,respectively,tothesefirms.
> 750 Lawyers501-750 Lawyers201-500 Lawyers51-200 Lawyers< 50 Lawyers
Firm Size
0
20%
40%
60%
80%
100%
Moderate Consolidation (Top 10 Firms Handle 50-80% of Work)
16%
9%
17%
15%
43%
High Consolidation (Top 10 Firms Handle 80% + of Work)
16%
20%
20%
17%
27%
% o
f out
side
cou
nsel
�rm
bill
ings
Figure 3: Enterprise Legal Management Trends ReportSupporting Point 1: Legal Departments Not Consolidating with “Largest 50”Based on trailing 12-months ending June 30, 2013
This chart groups corporate legal departments into two buckets – highly and moderately consolidated. The buckets are determined by the % of legal work handled by the department’s top 10 law firms.

2013 CounselLink Enterprise Legal Management Trends Report
Page 8
Anotherfactorthatmaybedrivingthisshiftinspendfrom“Largest50”to“LargeEnough”firms,isthefrequencywithwhichthe“LargeEnough”FirmsofferAFAstotheirclientsrelativetothefrequencywithwhichthe“Largest50”offerAFAs.“Largest50”firmsbilllessthan3%oftheirfeesunderAFAs.Ontheotherhand,“LargeEnough”firmsbillnearlytwicethepercentoffeesunderAFAarrangements.The“Largest50”firmslagbehindinofferingandimplementingAFAsregardlessoftheaggregateanticipatedfeesortypesoflegalexpertiseorworkinvolved.(SeedetailsonhowmattersaredeterminedtobesubjecttoanAFAattheendoftheReport.)
Overall,thebattletowinbusinessisbeingwonby“LargeEnough”firmswithstrongreputations,diversepractices,multiplelocations,lowerratesandagreaterwillingnesstooffer,useandimplementAFAsthatmeetclientneeds.“LargeEnough”firmsdeliverabroadrangeofcapabilitiesatlowerpricepointsthantheirlargercounterparts.Themedianpartnerrateforfirmswithgreaterthan750lawyersis60%higherthanmedianratesforthe201-500lawyergroup.
Figure 4: Enterprise Legal Management Trends ReportSupporting Point 2: “Largest 50” firms less likely to execute matter under an AFABased on trailing 12-months ending June 30, 2013
0
2%
4%
6%
8%
10%
Law �rm size by # of attorneys
% o
f mat
ters
usi
ng a
n A
ltern
ativ
e Fe
e A
rran
gem
ent
> 750 Lawyers
501-750 Lawyers
201-500 Lawyers
51-200 Lawyers
< 50 Lawyers
This chart shows the % of billings under an Alternative Fee Arrangement (AFA) by firms of different sizes.

2013 CounselLink Enterprise Legal Management Trends Report
Page 9
The Key Metrics
Eachupdateofthesemi-annualEnterpriseLegalManagementTrendsReportwillcoverastandardsetofkeymetricsthataremeasurementsofhourlylegalratesandclients’procurementoflegalservicesfromlawfirms.PerspectivesofferedinthereportrepresentviewsoftheteamofexpertsatLexisNexisaswellasthoseofcontributingpractitionersinlawfirmsandcorporatelegaldepartments.
Associate - Median
Paralegal - Median
Partner - Median
Legend
Blended matter hourly rate metrics
Timekeeper rate metrics
25th - 75th Percentile RangeMedian10th - 90th Percentile Range
Figure 5: Enterprise Legal Management Trends ReportKey Metric #1: Blended hourly rates and rate volatility differ by type of workBased on trailing 12-months ending June 30, 2013
0
$100
$200
$300
$400
$500
$600
$700
VolatilityIndex
Commercial
and Contracts
6
Hou
rly R
ate
Corporate,
General, Tax
7
Environmental
5
Finance, Loans
and Investm
ents
7
IP - Patent
7
IP - Trademark
8
Litigatio
n -
General
5
Mergers and
Acquisitions
4
Real Esta
te
4
Regulatory &
Compliance
10
Insurance
2
Employment
and Labor
5
See following page for guidance on interpreting this chart.

2013 CounselLink Enterprise Legal Management Trends Report
Page 10
Interpreting the Chart:
This chart captures median rates for three different groups of timekeepers (partners, associates and paralegals) and the range of the blended average rate across multiple matter types. As a guide to interpreting the output, consider IP Patent compared to Labor & Employment. Both matter types have the same median partner rate - $375. But the range of the overall blended rate of these matters is significantly different. IP Patent work – U.S. and international prosecution work, but not litigation – ends up costing significantly less per hour using a blended rate model than does Labor & Employment work, because transactional IP Patent matters typically require far less partner time.
An additional metric provided in this section is called Volatility. The Volatility Index is a calculated marker indicating the variability encountered in blended matter rates. Based on a 10-point scale, the Index reflects how broad the rate spread is between the 25th and 75th percentiles of hourly rates. Higher volatility scores indicate greater variance in prices paid as a result of both the mix of timekeepers and individual hourly rates.
Again, consider IP Patent compared to Labor & Employment. The range between the 25th and 75th percentile for IP Patent rates is broader than the range paid for Employment and Labor work relative to the 25th percentile rate. On a 10 point scale, IP Patent has a volatility index of a 7, indicating that the mix of timekeepers and rates that are paid on these matters vary quite significantly. Some of the variance is likely explained by differences in rates for area of expertise based on the patented technology being protected.
Whilethereisconsiderablefocusintheindustryonindividuallawyerrates,itisequally,orarguablymore,importanttopayattentiontothebigpicture–theaggregateeffectofthemixoftimekeepersthatworkonamatter,andtheirresultingblendedaveragerate.ThemedianblendedrateishighestinMergers&Acquisitions,wherethemostexpensivefirmsaremoreoftenengagedandwherethequatityofpartnerengagementintheworkishigher.
Threemattertypeshaverelativelylowratevolatilityandarelesslikelytohaveratessubjecttonegotiationbetweencorporationsandfirms:
• Insurance
• MergersandAcquisitions
• RealEstate
Legaldepartmentscancomparetheirowndataagainsttheserangesofrates.Forexample,ratespaidonIPPatentworksubmittedandprocessedthroughCounselLinkarehighlyvolatile(7outof10).Dependingontheareaofpatentexpertiserequired,legaldepartmentspayingaveragematterratesonthehighendoftherangemayhavetheopportunitytonegotiatelowerratesoradifferentmixoftimekeepers.
2013 CounselLink Enterprise Legal Management Trends Report
Page 11
Interpreting the Chart:
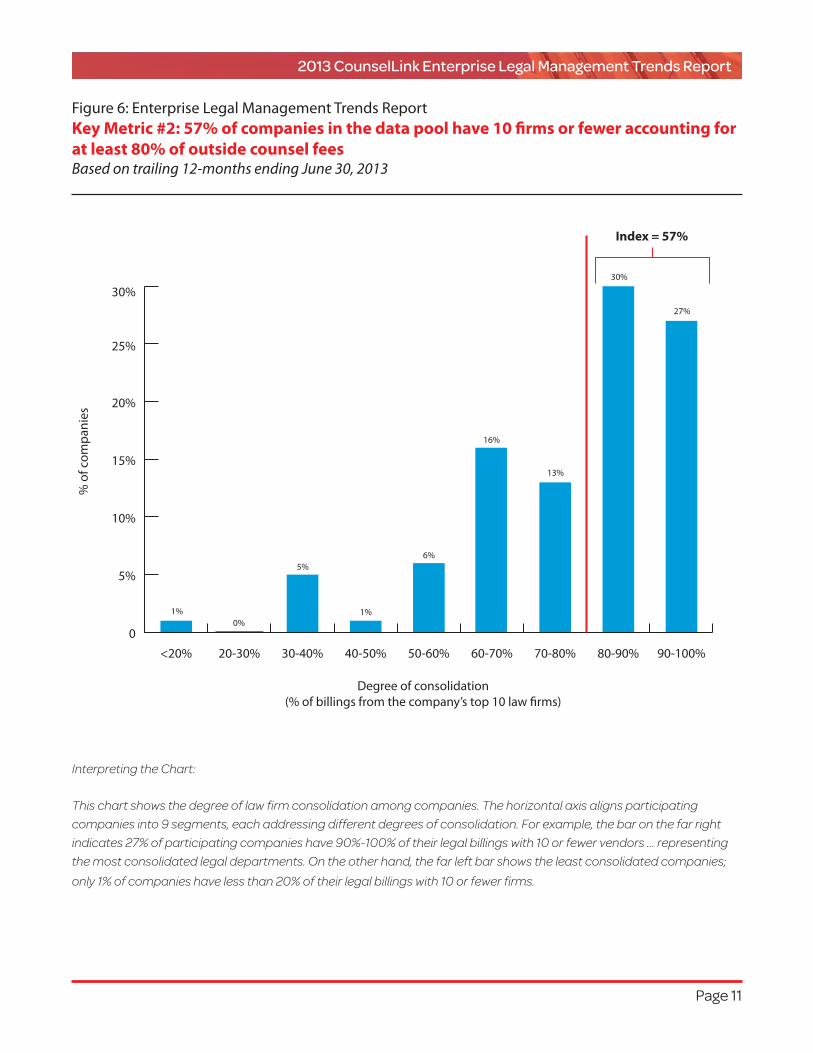
This chart shows the degree of law firm consolidation among companies. The horizontal axis aligns participating companies into 9 segments, each addressing different degrees of consolidation. For example, the bar on the far right indicates 27% of participating companies have 90%-100% of their legal billings with 10 or fewer vendors … representing the most consolidated legal departments. On the other hand, the far left bar shows the least consolidated companies; only 1% of companies have less than 20% of their legal billings with 10 or fewer firms.
Figure 6: Enterprise Legal Management Trends ReportKey Metric #2: 57% of companies in the data pool have 10 firms or fewer accounting for at least 80% of outside counsel feesBased on trailing 12-months ending June 30, 2013
0
5%
10%
15%
20%
25%
30%
1%0%
5%
1%
6%
16%
13%
30%
27%
90-100%80-90%70-80%60-70%50-60%40-50%30-40%20-30%<20%
Index = 57%
% o
f com
pani
es
Degree of consolidation (% of billings from the company’s top 10 law �rms)

2013 CounselLink Enterprise Legal Management Trends Report
Page 12
57%isthebaselineindexforthisfirstTrendsReportmeasurementoflawfirmconsolidation–that’sthepercentageoftotalcompaniesintheCounselLinkdatasetwhoarepayingatleast80%oftheirlegalfeesto10orfeweroutsidelawfirms.Thesecompaniesare“highlyconsolidated”.Diggingdeeperintothecross-sectionsofcompaniesprovidesmorerevealinginformationaboutwhereconsolidationisoccurring:
• 63%oflargecompanies(>$10billioninrevenue)arehighlyconsolidated.Thelargestcompaniesaremorefrequentlylimitingthenumberoffirmsusedforthebulkoftheirlegalwork.
• 80%ofmanufacturingcompanies(includingPharmaandBiotech)arehighlyconsolidated.
• Insurancecompanies–at43%versustheoverallindexof57%–demonstratetheleastconsolidation,handlinghighvolumesofmattersacrossmultiplejurisdictionswithmultiplefirms.

2013 CounselLink Enterprise Legal Management Trends Report
Page 13
Figure 7: Enterprise Legal Management Trends ReportKey Metric #3: Alternative Fee Arrangements used in 10% of matters and 6% of billings in the past yearBased on trailing 12-months ending June 30, 2013
Practice Area
0
5%
10%
15%
20%
25%
30%
Finance, Loans
and Investm
ents
Employment
and Labor
Litigatio
n -
GeneralIP - P
atent
Regulatory &
Compliance
Insurance
Corporate,
General, Tax
Mergers and
Acquisitions
Environmental
IP - Trademark
Real Esta
te
Commercial
and Contracts
% of Billings Executed Under AFA
Average
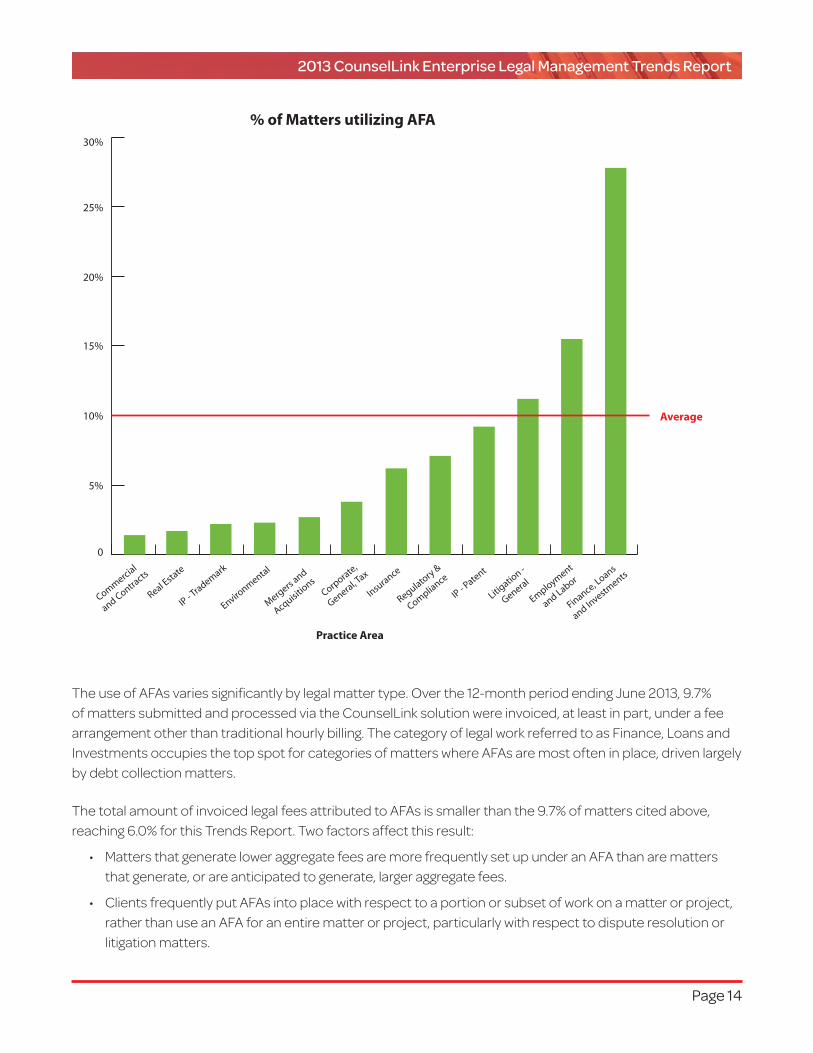
These charts show the frequency with which Alternative Fee Arrangements (AFAs) are used by practice area. One chart shows the % of billings executed under AFA and the other is the % of matters utilizing AFA.
2013 CounselLink Enterprise Legal Management Trends Report
Page 14
0
5%
10%
15%
20%
25%
30%
% of Matters utilizing AFA
Practice Area
Finance, Loans
and Investm
ents
Employment
and Labor
Litigatio
n -
GeneralIP - P
atent
Regulatory &
Compliance
Insurance
Corporate,
General, Tax
Mergers and
Acquisitions
Environmental
IP - Trademark
Real Esta
te
Commercial
and Contracts
Average
TheuseofAFAsvariessignificantlybylegalmattertype.Overthe12-monthperiodendingJune2013,9.7%ofmatterssubmittedandprocessedviatheCounselLinksolutionwereinvoiced,atleastinpart,underafeearrangementotherthantraditionalhourlybilling.ThecategoryoflegalworkreferredtoasFinance,LoansandInvestmentsoccupiesthetopspotforcategoriesofmatterswhereAFAsaremostofteninplace,drivenlargelybydebtcollectionmatters.
ThetotalamountofinvoicedlegalfeesattributedtoAFAsissmallerthanthe9.7%ofmatterscitedabove,reaching6.0%forthisTrendsReport.Twofactorsaffectthisresult:
• MattersthatgenerateloweraggregatefeesaremorefrequentlysetupunderanAFAthanaremattersthatgenerate,orareanticipatedtogenerate,largeraggregatefees.
• ClientsfrequentlyputAFAsintoplacewithrespecttoaportionorsubsetofworkonamatterorproject,ratherthanuseanAFAforanentirematterorproject,particularlywithrespecttodisputeresolutionorlitigationmatters.

2013 CounselLink Enterprise Legal Management Trends Report
Page 15
Figure 8: Enterprise Legal Management Trends ReportKey Metric #4: Average rate for law firm Partners across all practice areas and geographies is $381, up 2.7% year over year.Based on rolling 12-month totals ending June 30 for years 2011 to 2013
$300
$350
$400
7/1/2012 - 6/30/20137/1/2011 - 6/30/20127/1/2010 - 6/30/2011
$362 $371 $381
2.5% growth 2.7% growth
This chart shows the average rate for a law firm partner in the U.S., excluding work on insurance matters.
AcrosstheU.S.,forthe12monthperiodendingJune30,2013,theaveragepartnerbillingratewas$381perhourforthe12monthsendingJune30,2013,whichisup2.7%fromtheprior12months.
Asanamalgamofdifferentlawfirmsizes,practiceareasandlocations,it’sareasonableindicatorofhowhourlyratesaretrending.Hourlyratescontinuetoclimb,evenifgrowthhasslowed.However,thesegrowthratesarewellbelowthehighsingle-digitgrowththeindustrygarneredduringpeakperiodspriorto2008.

2013 CounselLink Enterprise Legal Management Trends Report
Page 16
Interpreting the Chart:
In looking at partner hourly rates across 15 major metro areas, two indicators were plotted for each location to show both the compound annual growth rate (CAGR) over a three-year span, and the year-over-year change. A vertical line marker was added at the 2.5% growth rate as a guide to highlight locations operating above and below that rate.
DataforattorneyrategrowthbymajorU.S.cityshowthatPhiladelphia,Detroit,SanFrancisco,AtlantaandNewYorkareatorabove2.5%inbothcompoundannualgrowthrate(CAGR)andannualgrowthrate.Ontheoppositeendofthespectrum,fivecitiessawhourlyrategrowthbelow2.5%:Phoenix,Boston,Houston,DallasandMinneapolis.
Figure 9: Enterprise Legal Management Trends ReportKey Metric #5: 5 major cities show rate growth of 2.5% or more both over the last year and over the last 3 yearsBased on rolling 12-month totals ending June 30 for years 2010 to 2013
Minneapolis MN
Dallas TX
Houston TX
Boston MA
Chicago IL
Phoenix AZ
Miami FL
Washington DC
Seattle WA
Los Angeles CA
New York NY
Atlanta GA
San Francisco CA
Detroit MI
Philadelphia PA
1% 2% 3% 4% 5% 6% 7% 8%0
3 Year CAGRYOY Change
2013 CounselLink Enterprise Legal Management Trends Report
Page 17
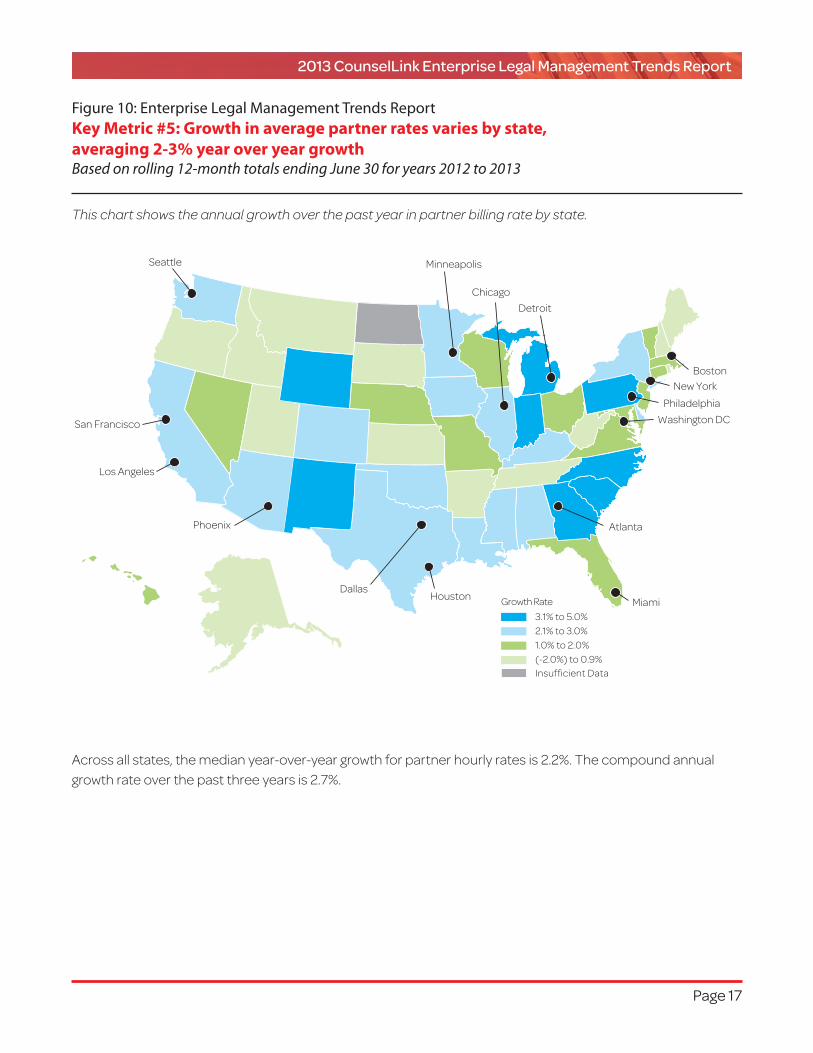
Figure 10: Enterprise Legal Management Trends ReportKey Metric #5: Growth in average partner rates varies by state, averaging 2-3% year over year growthBased on rolling 12-month totals ending June 30 for years 2012 to 2013
3.1% to 5.0%2.1% to 3.0%1.0% to 2.0%(-2.0%) to 0.9%Insufficient Data
Growth Rate
Chicago
Seattle
Detroit
BostonNew York
PhiladelphiaWashington DC
Atlanta
MiamiHoustonDallas
Phoenix
Minneapolis
Los Angeles
San Francisco
This chart shows the annual growth over the past year in partner billing rate by state.
Acrossallstates,themedianyear-over-yeargrowthforpartnerhourlyratesis2.2%.Thecompoundannualgrowthrateoverthepastthreeyearsis2.7%.

2013 CounselLink Enterprise Legal Management Trends Report
Page 18
AggregatestatisticsbasedonCounselLinksolutioninvoicedatasubmittedduringthelast12monthsidentifyMergersandAcquisitionasthepracticeareawiththehighestaveragehourlypartnerrate–$630.NextisGeneralCorporatewhichincludesadviceandcounsel,antitrustworkandtax-relatedmatters.Inpart,bothpracticeareasatthetopoccupythosespacesbecausecompaniesoftenuselargerfirmsforthesekindsofmatters.Inthelast12months,the“Largest50”firmshandled33%ofMerger&AcquisitionandCorporatelegalwork,versus20%foralltypesoflegalwork.AtthelowerendoftheaveragehourlyratespectrumisInsurancework.Insurancecompaniesdemand,andnegotiateaggressivelyfor,lowratesontheircommoditydefensematters.
Figure 11: Enterprise Legal Management Trends ReportKey Metric #6: Partner Hourly Rate – by Practice AreaBased on trailing 12-months ending June 30, 2013
$630
$575
$527
$513
$500
$495
$446
$405
$392
$390
$340
$170
Median Partner Hourly Rates
Mergers and Acquisitions
Corporate, General, Tax
IP - Trademark
Regulatory & Compliance
IP - Patent
Finance, Loans and Investments
Commercial and Contracts
Real Estate
Environmental
Litigation - General
Insurance
Employment and Labor
2013 CounselLink Enterprise Legal Management Trends Report
Page 19
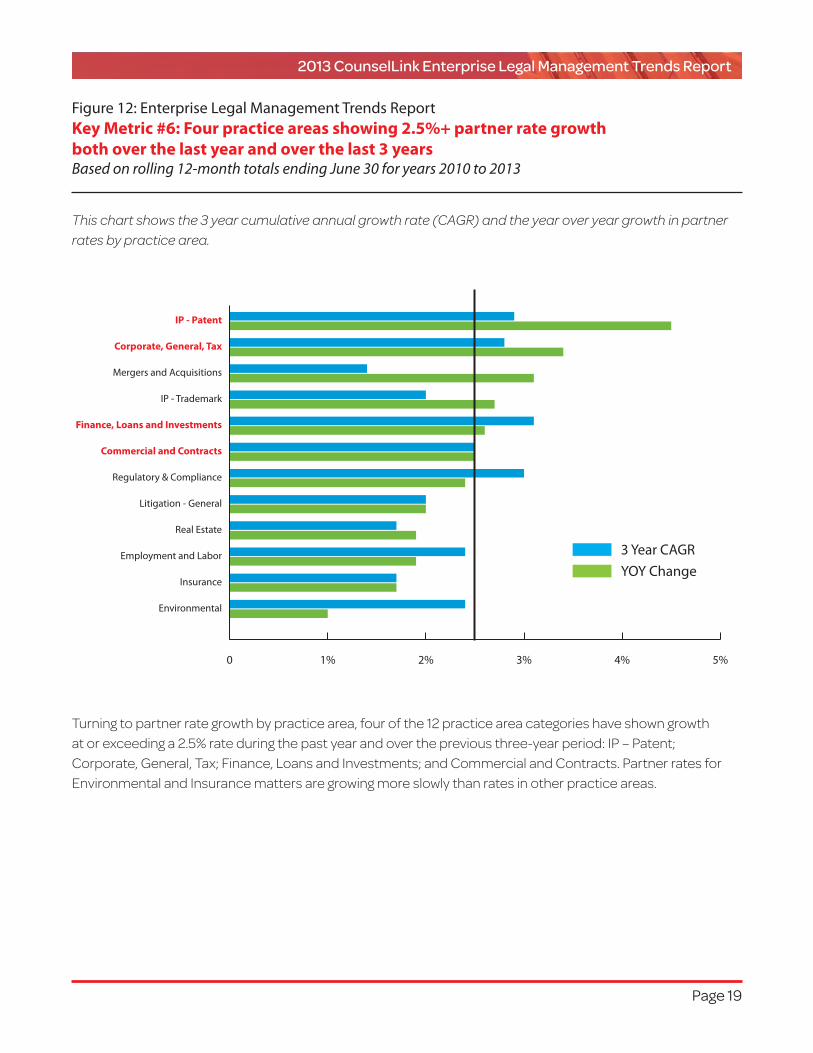
Figure 12: Enterprise Legal Management Trends ReportKey Metric #6: Four practice areas showing 2.5%+ partner rate growth both over the last year and over the last 3 yearsBased on rolling 12-month totals ending June 30 for years 2010 to 2013
This chart shows the 3 year cumulative annual growth rate (CAGR) and the year over year growth in partner rates by practice area.
Turningtopartnerrategrowthbypracticearea,fourofthe12practiceareacategorieshaveshowngrowthatorexceedinga2.5%rateduringthepastyearandoverthepreviousthree-yearperiod:IP–Patent;Corporate,General,Tax;Finance,LoansandInvestments;andCommercialandContracts.PartnerratesforEnvironmentalandInsurancemattersaregrowingmoreslowlythanratesinotherpracticeareas.
Environmental
Insurance
Employment and Labor
Real Estate
Litigation - General
Regulatory & Compliance
Commercial and Contracts
Finance, Loans and Investments
IP - Trademark
Mergers and Acquisitions
Corporate, General, Tax
IP - Patent
0 1% 2% 3% 4% 5%
3 Year CAGRYOY Change

2013 CounselLink Enterprise Legal Management Trends Report
Page 20
About the Trends Report
Terminology:
• Matter Categorization–CounselLinkusersdefinethetypesofworkassociatedwithvariousmattersthatwereanalyzedandcategorizedintolegalpracticeareas.Forthisanalysis,alltypesoflitigationmattersareclassifiedaslitigation;e.g.,apatentlitigationmatterisclassifiedaslitigation,notaspatentwork.Datainthisreporthasbeenmappedtooneof14practiceareas:
o CommercialandContracts,includingmattersoncontractingofdealtermsfornon-M&Atransactions
o Insurance,includingmedicalmalpractice,workerscompensation,autoclaims,titleinsuranceclaims,etal.
o EmploymentandLabor,includingimmigration,non-compete,benefitsandgeneralhumanresourcesrelatedmatters
o MergersandAcquisitions,narrowlydefinedtoencompassM&Atransactions
o RealEstate,includesrealestatetransactions
o RegulatoryandCompliance,coveringmattersthatcompaniesdefineasregulatory,compliance,governmentaffairsoragovernmentaction/investigation
o Litigation,asabroadcategorycoveringlitigationmatterswithpatents,personalinjury,breachofcontract,productliabilityandothers
o IPPatent,patentprosecutionandcounseling,includingfilingsintheU.S.andinternationally,excludingpatentlitigation
o IP-Trademark,forworkclassifiedasTrademarkmatters,includingregistrationsandprotection
o IP-Other,coveringIPmattersnotclassifiedasPatentsorTrademarks
o Finance,LoansandInvestments,includessecurities,creditandcollections,andotherfundingactivities
o Environmental,forallmattersdefinedasenvironmentalorenergyrelated
o Corporate,General&Tax,toincludeantitrust,restructuring,bankruptcy,taxandothergeneralcorporatework
o Other,asanopencategoryforallothermattersandbillsnotalreadyaddressed
• Insurance Matters–Forcomparisonpurposes,chargesonInsurancematterswereremovedfromtwopiecesofanalysiscoveringPartnerHourlyRate–Overall,andPartnerHourlyRateGrowth–byLocation.
• Cities and States–Tocapturelocationofbillingtimekeepers,timekeepersweremappedbasedontheirlawfirmofficezipcodes.Wherecitylocationsareused,theyincludeanyzipcodewithinthatcity’smetropolitandivisionasdefinedbytheU.S.CensusBureau.

2013 CounselLink Enterprise Legal Management Trends Report
Page 21
• Law Firm Roles–Inreferencingpartners,associates,andparalegals,theunderlyingdataincludedsomediscreteroles,suchas“seniorpartner”or“juniorassociate.”Insuchinstances,thosetimekeeperswereplacedwithinthebroaderpartner,associate,andparalegalsegments.Non-partnerlawyertitles,suchas“ofcounsel,”wereclassifiedasassociates.
• Alternative Fee Arrangements (AFAs)–InvoicechargesarecategorizedwithinfeestructuresutilizedintheCounselLinksolution.Thosechargesinnon-hourlyfeestructureswereclassifiedasalternativefeearrangements(AFAs).Additionally,chargescodedashourlywereclassifiedasAFAifthetimekeeperlevelwasapartnerandthecalculatedhourlyrateexceeded$1500.Fortimekeeperlevelsotherthanpartner,chargeswithratesofgreaterthan$1000werecategorizedasAFAs.Lastly,workforwhichinvoiced-timenarrativesincludedtermssuchasflatfee,fixedfeeorsimilarkeywords,wascategorizedasamattersubjecttoAFAs.
• Company Size–Basedon2012revenuecitedinpublicsources,companiesweregroupedintothesethreesizecategories:
o $10Billion
o $1-10Billion
o <$1Billion
• Company Industry–CompaniesweremappedintothehighestlevelofNAICScodesbasedonpublically-availableinformation,resultinginthisarrangement:
o FinanceandInsurance
o Manufacturing
o RetailTrade
o Other
Expert Contributors:
TheCounselLinksolutionhasearnedanindustryreputationforenablingcorporatecounseltousedataeffectivelyasabasisforimprovinglegaldepartmentperformanceandoutcomes.Twofactorsvalidatethesecustomeropinionsandperceptions:
• SpecificlegalspendandmattermanagementfeaturesintheCounselLinksolutiongivecorporateclientsrobustcapabilitiestoevaluatelegaldepartmentperformanceandmetricsonanongoingbasis,entirelyontheirown.
• LexisNexisinvestssignificantresourcesinprofessionalconsultingandserviceofferingsthataddavaluablelayerofexpertiseinanalytics,benchmarkingandbestpractices.Theoverallgoalwiththeseoptimizationprogramsistohelpclientstranslatedata-drivenanalysisintoactionsthatimproveefficiencyandbottom-lineresults.
CounselLinkisanEnterpriseLegalManagementsolutionsuiteformattermanagement,legalspendmanagement,legalhold,analyticsandstrategicconsultingservices.

2013 CounselLink Enterprise Legal Management Trends Report
Page 22
SeveralLexisNexisindividualsplayedamajorroleinanalyzingthelatestCounselLinkdataandcompilingthisfirstEnterpriseLegalManagementTrendsReport,specifically:
Principal Author
Kris Satkunas DirectorofStrategicConsulting
AsDirectorofStrategicConsultingatLexisNexis,KrisleadstheCounselLinkteaminadvisingcorporatelegaldepartmentmanagersonimprovingoperationswithdata-drivendecisions.Krisisanexpertinmanagingthebusinessoflawandindatamining,withspecificexpertiseinmatterpricingandstaffing,practiceareametricsandscorecards.
PriortojoiningCounselLink,KrisservedasDirectoroftheLexisNexisRedwoodThinkTank,whichshealsoestablished.Forfiveyears,Krisworkedcloselywiththoughtleadersinlargelawfirmsconductingunbiaseddata-basedresearchstudiesfocusedonfindingsolutionstolegalindustrymanagementissues.Earlier,sheledtheRedwoodAnalyticsservicesgroupandthebusinessoflawconsultingpracticeforlargelawfirms.DuringthistimesheworkedwithkeymanagementatoverahundredlawfirmstoevolvethefinancialmodelsandanalysesdevelopedbyRedwoodAnalyticsforlargelawfirms.
Krishasauthorednumerousarticlesandspokenatlegalindustryconferencesandevents.ShecametoLexisNexisin2000afterhavinghonedherfinanceskillsasaSeniorVicePresidentinStrategicFinanceatSuntrustBank.SheholdsaB.B.A.inFinancefromTheCollegeofWilliam&Mary.
Key Contributors
Jonah Paransky VicePresident&ManagingDirector
AsVicePresident,ManagingDirectorforLexisNexisCounselLink,Jonahisresponsibleforthedeliveryofsuperiorenterpriselegalmanagementsolutionsandservicestothecorporatelegalindustry.Jonahhasextensiveexperienceandsuccessinbusiness-to-businessproductmanagementandmarketing,withexpertiseinidentifyingmarketopportunitiesandbringingnewproductsandservicestomarket.Heisarecognizedexpertinthelegalsoftware,SaaS(software-as-a-service),informationsecurityandITinfrastructuremarkets.JonahreceivedaBachelorofScienceinelectricalengineeringandaBachelorofArtsineconomicsfromtheUniversityofPennsylvania.
2013 CounselLink Enterprise Legal Management Trends Report
Page 23
Justin Silverman SeniorDirector&ProductChampionofDataAnalytics
AsSeniorDirector&ProductChampion,DataAnalyticsforLexisNexis,Justinisresponsibleforthedevelopmentofsolutionstohelpthelegalindustrymakebetteruseofavailabledatatoinformdecision-making.PriortoLexisNexis,JustinmanagedaprofessionalservicesbusinessatGersonLehrmanGroup.Hehasmorethansixyearsofmanagementconsultingexperience,includingthreeyearsatOliverWymanandthreeyearsattheBostonConsultingGroup.JustinhasaJDfromNorthwesternUniversityLawSchoolandanMBAfromtheKelloggSchoolofManagement.
Mike Haysley DirectorofStrategicServices
AsDirectorofStrategicServicesatLexisNexisCounselLink,Mikehelpscorporatelegaldepartmentsmanagethebusinessoflaw.Hehasmorethan15yearsofexperienceinrolesthatincludeanin-housepositionastheDirectorofLegalOperationsforalargelegaldepartment,andconsultingtolargelegalorganizations.Thisbackgroundprovidesauniqueperspectiveofhavingpersonallyaddressedandmanagedmanyoftheissuesfacinglegaldepartmentstoday,aswellasunderstandingbestpracticesandvaryingneedsoflegaldepartments.MikeworkswithanexpertteamatLexisNexistoadviselegaldepartmentsonimprovingoperationsandresults.HejoinedLexisNexisCounselLinkfromWasteManagement,wherehewastheDirectorofLegalOperations.MikegraduatedfromTexasA&MUniversitywithabusinessdegree,receivedhislawdegreefromtheUniversityofHouston,andislicensedtopracticelawinTexas.
IfyouhavequestionsorcommentsabouttheTrendsReport,orwanttolearnmoreaboutCounselLinksoftwareandservices,visitwww.lexisnexis.com/counsellink,orcontactusviaemail:[email protected]:855.974.7774.Formediainquiries,pleasecontact:[email protected].

www.counsellink.com 866.703.3902 [email protected]
LexisNexis and the Knowledge Burst logo are registered trademarks of Reed Elsevier Properties Inc., used under license. SmartReview and CounselLink are registered trademarks of LexisNexis Examen, Inc. Other products or services may be trademarks or registered trademarks of their respective companies. © 2013 LexisNexis. All rights reserved.