enterprise modernization business case tool –...
TRANSCRIPT

Abhishek Baheti
Enterprise Modernization Business Case Tool

MICROSOFT MAKES NO WARRANTIES, EXPRESS OR IMPLIED, IN THIS DOCUMENT.
Complying with all applicable copyright laws is the responsibility of the user. Without limiting the rights under copyright, no part of this document may be reproduced, stored in or introduced into a retrieval system, or transmitted in any form or by any means (electronic, mechanical, photocopying, recording, or otherwise), or for any purpose, without the express written permission of Microsoft Corporation.
Microsoft may have patents, patent applications, trademarks, copyrights, or other intellectual property rights covering subject matter in this document. Except as expressly provided in any written license agreement from Microsoft, our provision of this document does not give you any license to these patents, trademarks, copyrights, or other intellectual property.
The descriptions of other companies’ products in this document, if any, are provided only as a convenience to you. Any such references should not be considered an endorsement or support by Microsoft. Microsoft cannot guarantee their accuracy, and the products may change over time. Also, the descriptions are intended as brief highlights to aid understanding, rather than as thorough coverage. For authoritative descriptions of these products, please consult their respective manufacturers.
© 2013 Microsoft Corporation. All rights reserved. Any use or distribution of these materials without express authorization of Microsoft Corp. is strictly prohibited.
Microsoft and Windows are either registered trademarks or trademarks of Microsoft Corporation in the United States and/or other countries.
The names of actual companies and products mentioned herein may be the trademarks of their respective owners.
iiEnterprise Modernization Business Case Tool – User Guide Prepared by

User Guide for Enterprise Modernization Business Case Tool
ContentsIntroduction.................................................................................................................. 1Key Assumptions..........................................................................................................2Before You Begin..........................................................................................................2
Tool Basics................................................................................................................ 2Navigation and Buttons.............................................................................................3
Using the tool...............................................................................................................4Completing a Company Profile and Datacenter Profile..............................................5Completing a Server Landscape and FTE Profile.......................................................7Analyzing the AS IS Costs .........................................................................................9Understanding Scenarios Benefits Analysis.............................................................14Understanding NPV, Payback, and ROI for Scenarios..............................................15Generating the Customer Ready Presentation........................................................16
Reference and Source of Information.........................................................................18
3

IntroductionThe Enterprise Modernization Business Case Tool helps you analyze the Scenarios of Enterprise Modernization mainly focused towards three broad categories
1. Upgrading and Consolidating all legacy N-1 and below server versions to latest N version of Windows Server.
2. Migrating VMware based Virtualization and Management to Hyper V3. Extension of Scenario 1 – during upgrade to Nth version moving 30% of the
Server directly to Azure IaaS ( mostly the Dev/Test, and some Application server in ratio of 82:18)
The tool consists of default investment values for all three scenarios which helps it determine the ROI/payback period for each scenarios.
The tool consists of the following sections: Customer profile, Datacenter Profile, Server and Storage Profile, IT FTE profile as input; followed by AS IS costs analysis, Scenarios analysis for above three, and finally the NPV/ROI/Payback period output which can be exported to PowerPoint.
Customer Profile: After you click on begin assessment; the first screen prompted is Customer Profile the below inputs are critical and mandatory. Name of Customer, Sales in (US$), Employee Number, Estimated Growth % of Employee (Year On Year), Geography of Operations (HQ), and Sector it is aligned (Both Geography and Sector and predefined drop down)
Datacenter Profile: the next screen post customer profile is datacenter profile. The screen has major inputs in form of No. of Datacenters, Raised floor area, Applications hosted in company datacenter, Application hosted outside company datacenter, VMware Virtualizations presence, and VM’s running on VMware
Server and Storage Profile: the Next screen post datacenter profile is Server and storage profile. It mainly consists of input required from customer in terms of Physical hosts for a Server version, Current Virtualization % if any, Application hosted on Server, and if Virtualized VM/Server, the customer also has to provide the data for Storage in GB currently as part of company datacenters; the server and storage growth inputs are not mandatory and if customer doesn’t provide them the database will provide it from backend
IT FTE Profile: The next and final screen of input post Server and Storage profile is IT FTE distribution across different IT operations area in company; the customer has a choice to provide the input for distribution of FTE and contractor split or can leave the whole section of questionnaire blank and the database will input the 95% match values to the best fitment for customer’s organization from backend
AS IS State Costs: - the screen is the first output screen which has all costs listed across below headers (The user can edit the Year 1 costs to best of their
4
judgment if they understand the error rate between values projected/ estimated is greater than 10% for Year 1 and all other years will be automated)
o Infra Costs- Consists mainly of hardware, software, AMC, facility, and Management/ admin costs for the inputs provided
o Services costs – Datacenter service delivery costs, Services support costs, and Design/ planning costs
o Application costs – the application costs consists of app dev/test, management, admin, maintenance, and hosting costs in all
o Costs of downtime – the costs here refer to the impact on organizations revenue loss due to downtime of datacenter facilities and services on an annual basis
o Costs of Storage – the annually costs are displayed year wise including hardware, software, AMC, management, admin, virtualization, facility, and other to manage the storage input provided by customer
o Costs of Admin and Management –provided distinctly the costs company is bearing on FTE and contractor to manage the infrastructure in organization
Scenarios Benefits Calculations- the benefits of adopting the three scenarios mentioned above are displayed on this screen based on input/ AS IS costs simulations
o Scenario 1 – Highlights the coverage of benefits across Direct costs savings (mainly hardware, software, AMC, and Facility); Downtime savings (net savings due to improvement of uptime and reliability); Productivity savings (effort saved for FTE’s for providing various services due to enhanced capabilities of new solution); Improved speed to market (Direct OPEX hence Working capital savings passed back by IT to business due to improvement in operations); Asset underutilization avoidance –( efficiency of IT infrastructure leading to savings and avoidance of new Assets been deployed and invested into part of CAPEX impacted); Unanticipated risk induced cost avoided (direct reduction of costs due to risk mitigation, compliance avoidance, and efficiency improvement)
o Scenario 2 - Highlights the coverage of benefits across Direct costs savings (mainly hardware, software, AMC, and Facility); Downtime savings (net savings due to improvement of uptime and reliability); Productivity savings (effort saved for FTE’s for providing various services due to enhanced capabilities of new solution); Improved speed to market (Direct OPEX hence Working capital savings passed back by IT to business due to improvement in operations); Asset underutilization avoidance –( efficiency of IT infrastructure leading to savings and avoidance of new Assets been deployed and invested into part of CAPEX impacted);
o Scenario 3 - Highlights the coverage of benefits across Direct costs savings (mainly hardware, software, AMC, and Facility); Downtime savings (net savings due to improvement of uptime and reliability); Productivity savings (effort saved for FTE’s for providing various services due to
5

enhanced capabilities of new solution); Improved speed to market (Direct OPEX hence Working capital savings passed back by IT to business due to improvement in operations); Asset underutilization avoidance –( efficiency of IT infrastructure leading to savings and avoidance of new Assets been deployed and invested into part of CAPEX impacted); Unanticipated risk induced cost avoided (direct reduction of costs due to risk mitigation, compliance avoidance, and efficiency improvement)
The final Screen Scenarios Summary – the screen provided display and direct comparison between all three scenarios considering financial variables like NPV, ROI, Payback period and based on highest NPV it color codes the scenario title with (red) to provide the best benefits realization case to customer. The customer ready output deck can be pulled by clicking on Export button here and a PowerPoint deck will be generated to showcase to customer; also if you wish to exit the screen click on Exit button; if you wish to review the analysis again hit Back button; if you wish to begin new Assessment click on Button New Assessment.
Key AssumptionsTo help provide a Depth analysis, the tool relies on some assumptions to limit the scope of the analysis.
The tool calculates costs for a Five-year period. The tool used the maturity dimension for customer based on Sales ($)
provided and referencing to similar organizations margin in EVA to come up with unique multiplier.
The tool uses various benchmarks provided by IDC for server and storage growth rate to populate fields of growth if not provided
The tool uses various IT spending benchmark surveys done by Gartner, IDC, Forrester, and Computer economics to arrive at company’s IT spending (by using the quartile and percentile method for a given company) to estimate the IT spending, IT FTE distribution and billing rate
The tool used Uptime institute survey to calculate geography and sector wise Downtime costs due to IT workload to provide downtime savings or impact
The tool uses the CEB application board survey to provide an effective distribution to Application costing based on number of application provided at input
For benefits calculation the tool references the various surveys, Whitepapers, and TEI reports published by research agencies, product companies to determine the right benefits which can be achieved across different scenarios.
6

Before You Begin This section provides helpful information on using the tool.
Tool Basics The tool was built in ASP and SQL server, and is hosted on Azure. Ensure that you clear call cache and clear browsing history if you see the
screens of tool not moving on next click. The fields in the tool are color coded as (*) to indicate mandatory input:
Navigation and Buttons
The final screen has four buttons which is maximum
Back: - Indicated if you want to move backwards to see analysis
Export: - indicates to have a customer ready PowerPoint output click on it
New Assessment: - indicates that to begin new assessment from start you need to click on it
Exit: Indicated to close the browsing session or tool click on it
Submit: indicated once you are done with Input please submit the details so that tool can process the data
Refresh indicates: if you have changed any value in the input and assuming you want to run it for same customer you can click on Refresh/ also as the survey in the backend are updated and if you want to see after 1 year the changes to benefit or ROI for your customer click on Refresh and analysis will be re-run for same data input
7

AS IS Costs Screen Once you submit Input data and click submit the below screen will be generated to provide you a view into current AS IS costs for running the Enterprise datacenter with storage, apps, server, and people.
The data for Year 1 can be edited and saved for processing the Scenarios benefits calculation further if the user sees more than 10% error across the values reported/ calculated.
8

Scenarios Summary Screen (Final Output)Post Individual scenarios analysis and benefits confirmation once the user hits the next button they come to the final screen of the tool which is Scenarios summary Screen; the screen provides summarization of output and also the option of exporting the analysis in PowerPoint deck as shown below
9

Using the toolYou can conduct 3 scenarios analysis using the Enterprise Modernization Business Case Tool :
Platform upgrade and Consolidation to Nth Version of Windows Server VMware to Hyper V Migration if current infrastructure as presence of VMware Platform upgrade and consolidation and Moving the 30% server workload to
Azure IaaS
The tool can be accessed using the below URL
http://roi-eos.cloudapp.net/businesscasetool/Welcomescreen.aspx
The tool can be accessed across all devices like Phone, Tablet, and PC’s
Step up Step Screens and Output Demo
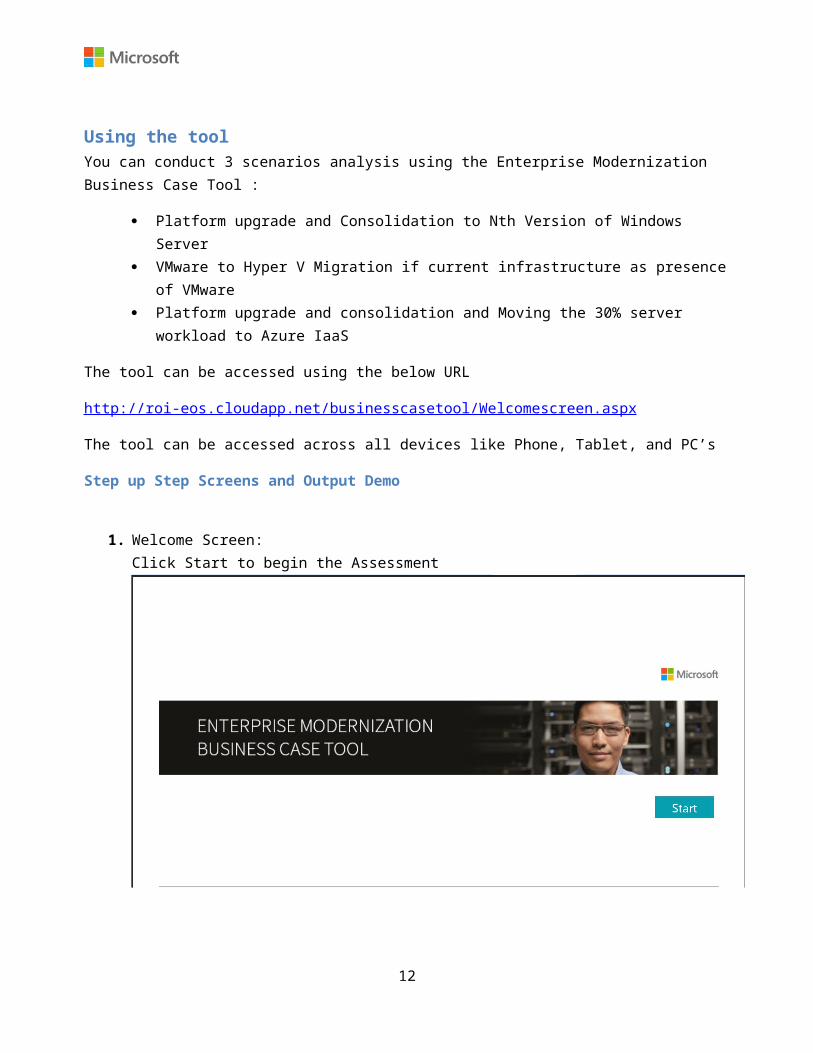
1. Welcome Screen:Click Start to begin the Assessment
10

2. The Customer Profile Screen – Mandatory inputs include Customer Organization Name Sales (US$) Employee Numbers Geography HQ Employee Growth Sector
11
3. The Third Screen is Datacenter Profile detailsMandatory fields include Number of DatacenterRaised Floor Area (SQFT)Application in Datacenter Application hosted outside DatacenterVMware availability and if Yes the VM’s on VM ware
4. The Fourth Screen is Input for Server and Storage Profile
12

5. The Fifth screen is for input of IT FTE and Contractor Distribution for
6. Click Submit and you will see the AS IS Costs Screen below
You can click on any one of the header to see the sub costs under the category and also edit Year 1 costs and see the direct impact on other years costs
Also please remember to SAVE if you wish you will need the same edited numbers to be considered for analysis
13

Analyzing Scenarios and Final Scenarios Comparison
Once you click on Next screen for AS IS State Costs you will be able to see the benefits for Individual scenarios covered as part of tool
14

15

The final Comparison Screen highlights the best scenarios using comparison between NPV 5years and indicates the top Scenario Box with Red Highlight
16

Reference and Source of Information • Gartner Enterprise IT spending Vertical and IT services Report forecast updated
Q1,2014
• EVA Dimensions Tool for Company and Peer Analysis
• Forrester Report on I&O costs of Organization
• Gartner Benchmarking Analytics
• Server
• Application
• Hosting
• Infrastructure
• Staffing and Spending
• IT staffing and Spending report 2013, for SMB and Enterprise
• Application IT spending and Vertical wise view – CEB Application analysis report
• Gartner Server Tracker Enterprise
• Gartner Server Tracker WW Growth rates
• Storage Tracker IDC Black Book
• WW IT Spending report IDC Black Book
• Microsoft Whitepaper on Private cloud
• Gartner VM cost estimation model for Public cloud
• Datacenter costs analysis using Uptime institute calculator
• Downtime costs analysis study released by Emerson Network Power and Uptime Institute
• Forrester Storage analysis Cloud Vs. On Prem
17