enterprise optimization case study: panaust’s inca … enterprise optimization case study:...
TRANSCRIPT

1
Enterprise optimization case study: PanAust’s Inca Oro Project, Chile
Matthew Dorman and Mark Jones
Whittle Consulting, Australia
ABSTRACT
Whittle Consulting’s (WCL) Enterprise Optimization (EO) solution is an integrated approach to
maximizing the Net Present Value (NPV) of a mining business by simultaneously optimizing up to
10 different mechanisms across the mining value chain. The EO methodology which WCL has
developed over the last 12 years draws from the manufacturing industry (theory of constraints) and
cost accounting (activity-based costing) as well as advanced mining techniques such as cut-off
grade optimization and “skin analysis”. The principles behind Enterprise Optimization accelerate
cash flow through the business by applying a holistic planning approach over the whole business
chain rather than conventional ‘silo’ based decision making. The EO methodology and techniques
are underpinned by sophisticated in-house proprietary software and has proven to be an excellent
strategic planning tool for mining businesses having consistently identified significant value uplifts
to projects and operations alike.
This paper presents the findings from the EO Study for the Inca de Oro (IDO) Copper/Gold project
located in the Atacama region of Chile. The Inca de Oro Project is a joint venture between PanAust
Ltd of Australia and Codelco of Chile. The techniques and optimization mechanisms applied
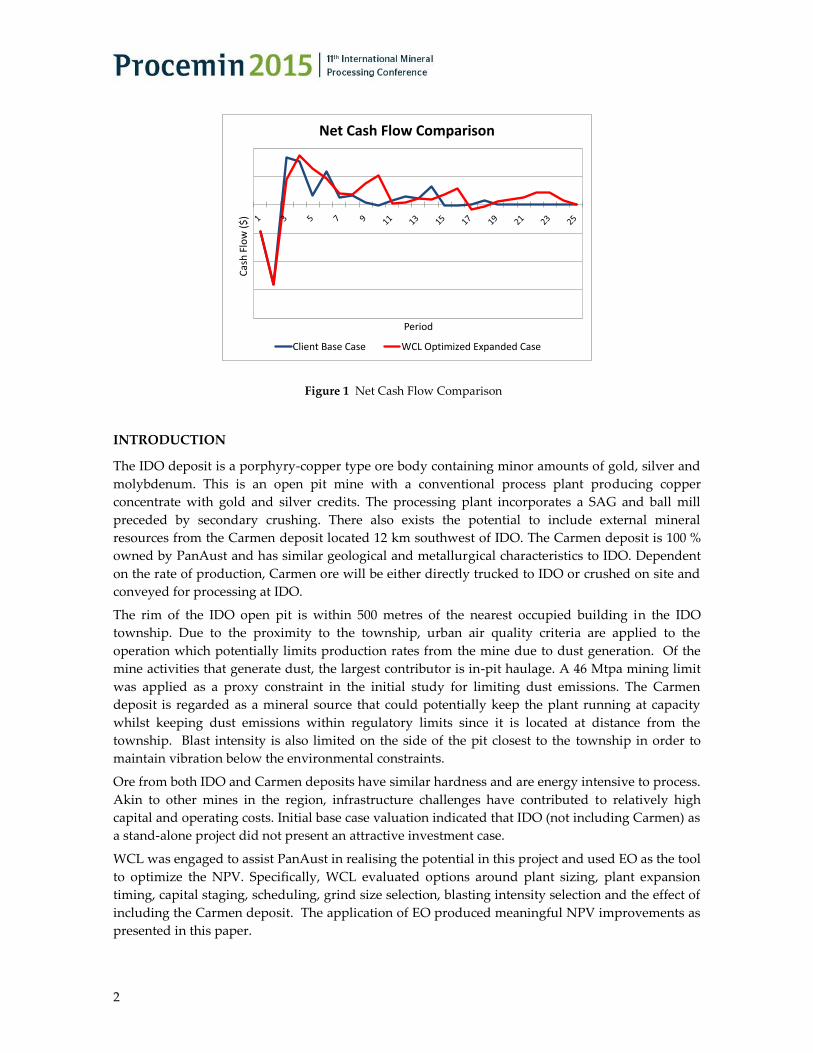
produced a 116.8 % overall increase in pre-tax NPV above the PanAust’s best business case
(referred to as the “base case”).
2
Cas
h F
low
($
)
Period
Net Cash Flow Comparison
Client Base Case WCL Optimized Expanded Case
Figure 1 Net Cash Flow Comparison
INTRODUCTION
The IDO deposit is a porphyry-copper type ore body containing minor amounts of gold, silver and
molybdenum. This is an open pit mine with a conventional process plant producing copper
concentrate with gold and silver credits. The processing plant incorporates a SAG and ball mill
preceded by secondary crushing. There also exists the potential to include external mineral
resources from the Carmen deposit located 12 km southwest of IDO. The Carmen deposit is 100 %
owned by PanAust and has similar geological and metallurgical characteristics to IDO. Dependent
on the rate of production, Carmen ore will be either directly trucked to IDO or crushed on site and
conveyed for processing at IDO.
The rim of the IDO open pit is within 500 metres of the nearest occupied building in the IDO
township. Due to the proximity to the township, urban air quality criteria are applied to the
operation which potentially limits production rates from the mine due to dust generation. Of the
mine activities that generate dust, the largest contributor is in-pit haulage. A 46 Mtpa mining limit
was applied as a proxy constraint in the initial study for limiting dust emissions. The Carmen
deposit is regarded as a mineral source that could potentially keep the plant running at capacity
whilst keeping dust emissions within regulatory limits since it is located at distance from the
township. Blast intensity is also limited on the side of the pit closest to the township in order to
maintain vibration below the environmental constraints.
Ore from both IDO and Carmen deposits have similar hardness and are energy intensive to process.
Akin to other mines in the region, infrastructure challenges have contributed to relatively high
capital and operating costs. Initial base case valuation indicated that IDO (not including Carmen) as
a stand-alone project did not present an attractive investment case.
WCL was engaged to assist PanAust in realising the potential in this project and used EO as the tool
to optimize the NPV. Specifically, WCL evaluated options around plant sizing, plant expansion
timing, capital staging, scheduling, grind size selection, blasting intensity selection and the effect of
including the Carmen deposit. The application of EO produced meaningful NPV improvements as
presented in this paper.
3
DEFINING THE BASE CASE
$ (
Mill
ion
s)
Total Revenue
WCL PanAust FS
Mill
ion
To
nn
es
Waste
WCL PanAust FS
Cu
%
Cu Head grade
WCL PanAust FS
Mill
ion
To
nn
es
Ore Treated
WCL PanAust FS
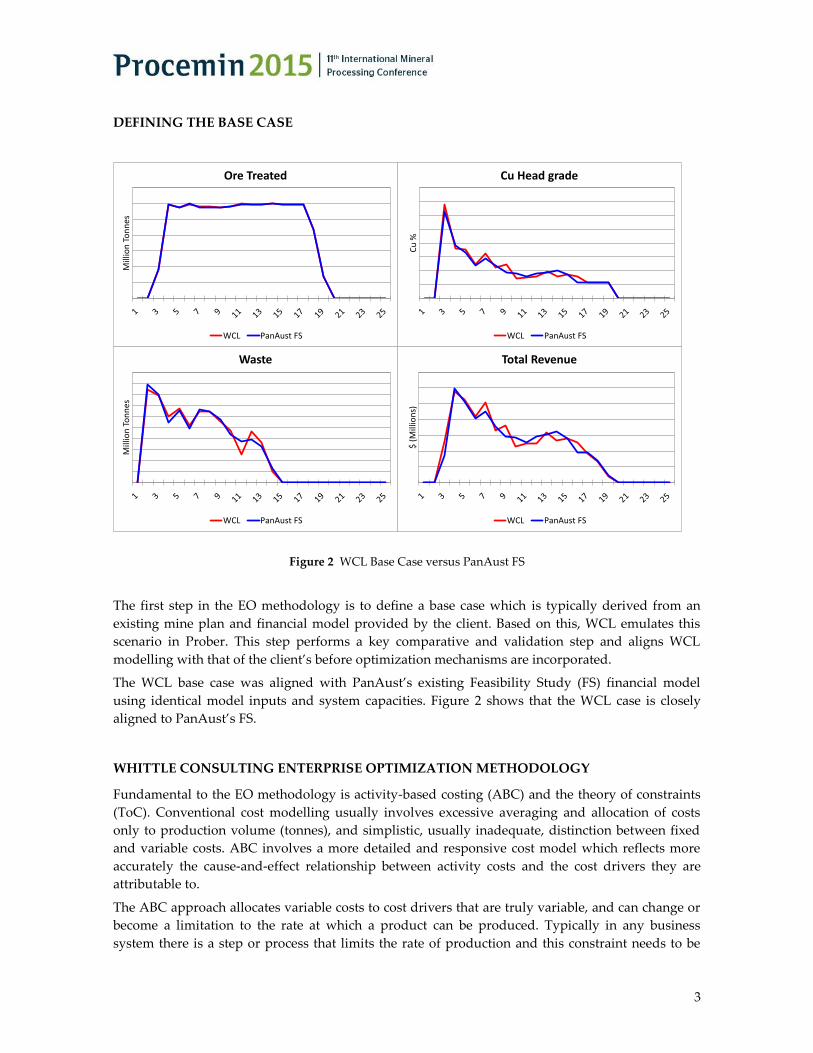
Figure 2 WCL Base Case versus PanAust FS
The first step in the EO methodology is to define a base case which is typically derived from an
existing mine plan and financial model provided by the client. Based on this, WCL emulates this
scenario in Prober. This step performs a key comparative and validation step and aligns WCL
modelling with that of the client’s before optimization mechanisms are incorporated.
The WCL base case was aligned with PanAust’s existing Feasibility Study (FS) financial model
using identical model inputs and system capacities. Figure 2 shows that the WCL case is closely
aligned to PanAust’s FS.
WHITTLE CONSULTING ENTERPRISE OPTIMIZATION METHODOLOGY
Fundamental to the EO methodology is activity-based costing (ABC) and the theory of constraints
(ToC). Conventional cost modelling usually involves excessive averaging and allocation of costs
only to production volume (tonnes), and simplistic, usually inadequate, distinction between fixed
and variable costs. ABC involves a more detailed and responsive cost model which reflects more
accurately the cause-and-effect relationship between activity costs and the cost drivers they are
attributable to.
The ABC approach allocates variable costs to cost drivers that are truly variable, and can change or
become a limitation to the rate at which a product can be produced. Typically in any business
system there is a step or process that limits the rate of production and this constraint needs to be

4
recognized and treated differently than the other non-constraining processes (Goldratt 1984, 2002).
In the case of mining businesses the constraint is typically the processing plant and specifically the
mill or grinding circuit, as this is the single largest capital outlay and also the most difficult to
expand. This element also tends to have a high variable cost.
After determining the truly variable costs and isolating the constraint in the system, remaining
elements of the variable costs are allocated to period, or fixed costs. These period costs tend to be
much higher than the G&A figures generally quoted, as many costs are incurred by an operation
that do not disappear if the operation is not producing anything. WCL has seen that about 30 % of
variable costs are actually fixed costs that “keep the lights on”.
The period costs are used to penalize the constraint in the system, which forces the optimizer
(Prober) to consider the effect of running the operation for one more period. This, in effect, is
quantifying opportunity cost. This also has the effect of flat lining the period costs as the constraint
in the system should always be at capacity, if it is not there is value being lost to poor utilization of
the constraining element.
WCL builds a business model that contains the cost elements to be used in the optimization. These
models can be relatively simple, or very elaborate, but the goal is always the same; to isolate the
critical cost drivers and maximize value through the mining system. Contained in the business
model are a series of calculations that are performed on every block in the resource model to
generate revenue and cost fields that are then used for pit optimization and scheduling by Prober.
Through consultation with PanAust, WCL carried out ABC on processing and mining costs. Each
cost item was scrutinized line by line to determine if it was fixed or variable or if it needed to be
split into fixed and variable. Evaluation of fixed and variable cost was broadly based on:
Type of cost
Forecasted cost profile
Cost driver
Client consultation
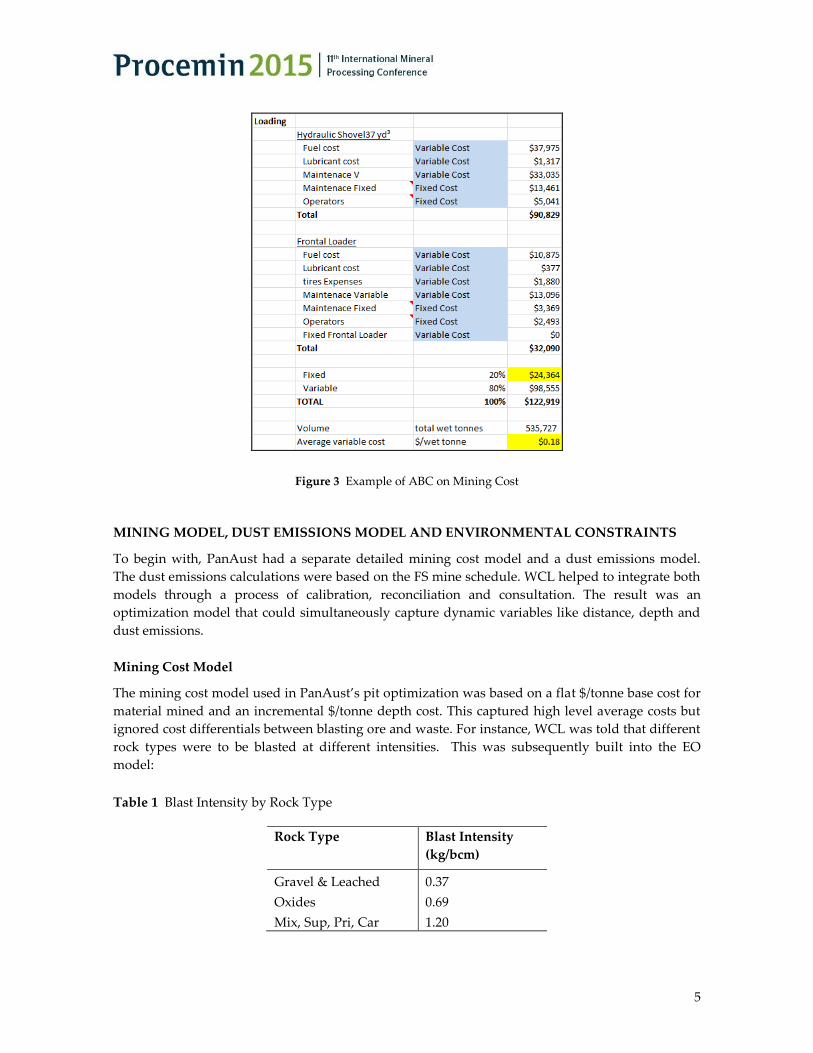
For example (Figure 3), loading costs were split into fixed and variable costs by review of each cost
item. The total fixed cost was then determined and applied annually to the optimization runs. In
this instance, the average cost was calculated based on $/wet tonne:
5
Figure 3 Example of ABC on Mining Cost
MINING MODEL, DUST EMISSIONS MODEL AND ENVIRONMENTAL CONSTRAINTS
To begin with, PanAust had a separate detailed mining cost model and a dust emissions model.
The dust emissions calculations were based on the FS mine schedule. WCL helped to integrate both
models through a process of calibration, reconciliation and consultation. The result was an
optimization model that could simultaneously capture dynamic variables like distance, depth and
dust emissions.
Mining Cost Model
The mining cost model used in PanAust’s pit optimization was based on a flat $/tonne base cost for
material mined and an incremental $/tonne depth cost. This captured high level average costs but
ignored cost differentials between blasting ore and waste. For instance, WCL was told that different
rock types were to be blasted at different intensities. This was subsequently built into the EO
model:
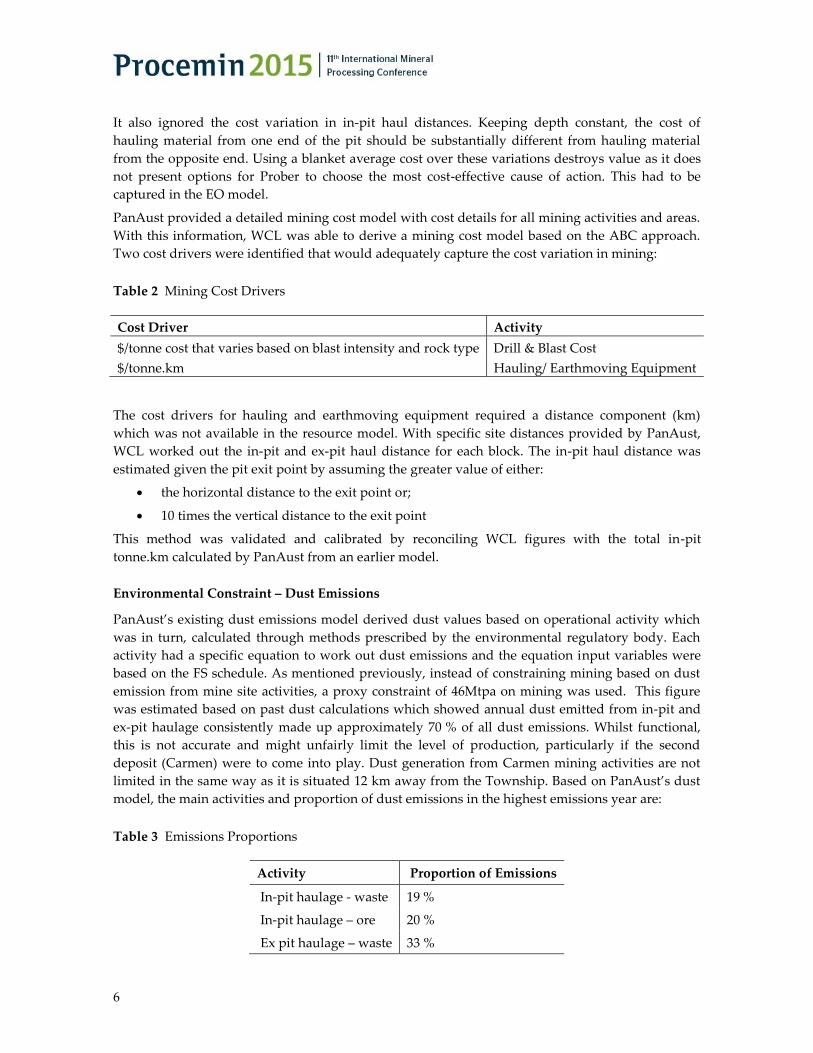
Table 1 Blast Intensity by Rock Type
Rock Type Blast Intensity
(kg/bcm)
Gravel & Leached 0.37
Oxides 0.69
Mix, Sup, Pri, Car 1.20
6
It also ignored the cost variation in in-pit haul distances. Keeping depth constant, the cost of
hauling material from one end of the pit should be substantially different from hauling material
from the opposite end. Using a blanket average cost over these variations destroys value as it does
not present options for Prober to choose the most cost-effective cause of action. This had to be
captured in the EO model.
PanAust provided a detailed mining cost model with cost details for all mining activities and areas.
With this information, WCL was able to derive a mining cost model based on the ABC approach.
Two cost drivers were identified that would adequately capture the cost variation in mining:
Table 2 Mining Cost Drivers
Cost Driver Activity
$/tonne cost that varies based on blast intensity and rock type Drill & Blast Cost
$/tonne.km Hauling/ Earthmoving Equipment
The cost drivers for hauling and earthmoving equipment required a distance component (km)
which was not available in the resource model. With specific site distances provided by PanAust,
WCL worked out the in-pit and ex-pit haul distance for each block. The in-pit haul distance was
estimated given the pit exit point by assuming the greater value of either:
the horizontal distance to the exit point or;
10 times the vertical distance to the exit point
This method was validated and calibrated by reconciling WCL figures with the total in-pit
tonne.km calculated by PanAust from an earlier model.
Environmental Constraint – Dust Emissions
PanAust’s existing dust emissions model derived dust values based on operational activity which
was in turn, calculated through methods prescribed by the environmental regulatory body. Each
activity had a specific equation to work out dust emissions and the equation input variables were
based on the FS schedule. As mentioned previously, instead of constraining mining based on dust
emission from mine site activities, a proxy constraint of 46Mtpa on mining was used. This figure
was estimated based on past dust calculations which showed annual dust emitted from in-pit and
ex-pit haulage consistently made up approximately 70 % of all dust emissions. Whilst functional,
this is not accurate and might unfairly limit the level of production, particularly if the second
deposit (Carmen) were to come into play. Dust generation from Carmen mining activities are not
limited in the same way as it is situated 12 km away from the Township. Based on PanAust’s dust
model, the main activities and proportion of dust emissions in the highest emissions year are:
Table 3 Emissions Proportions
Activity Proportion of Emissions
In-pit haulage - waste 19 %
In-pit haulage – ore 20 %
Ex pit haulage – waste 33 %
7
Ex pit haulage – ore 4 %
Primary crusher 6 %
Secondary crushers 9 %
TSF construction 2 %
Other – unclassified 6 %
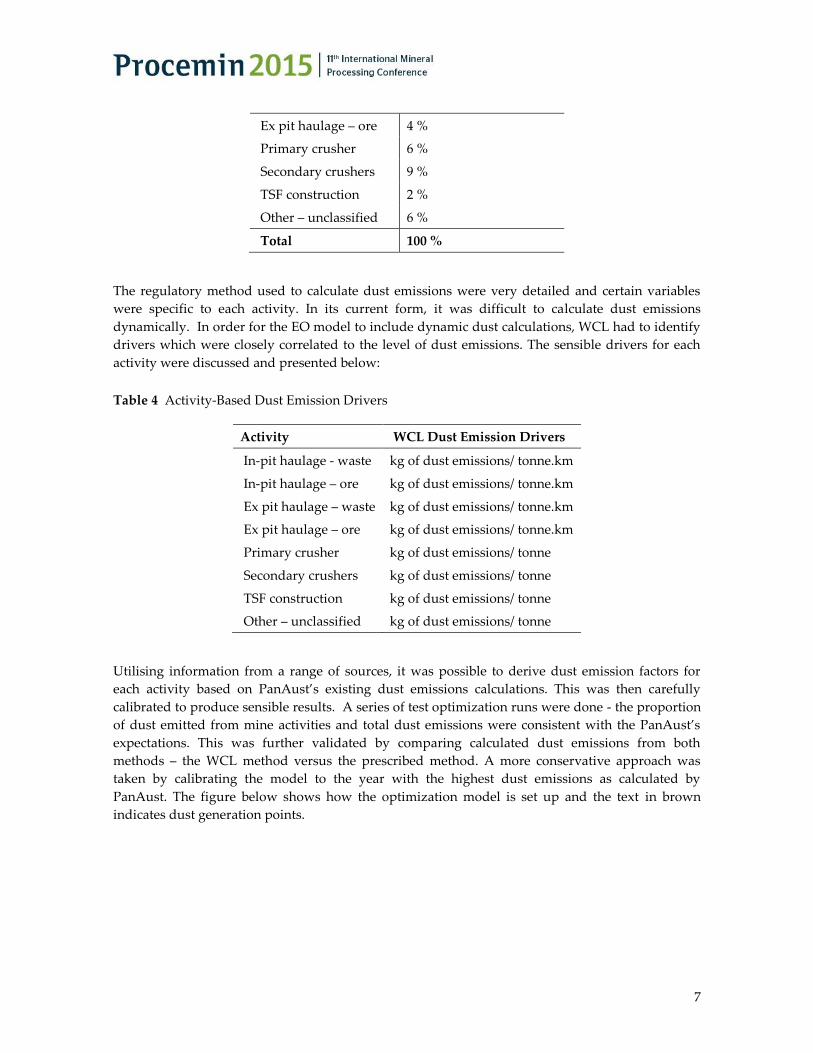
Total 100 %
The regulatory method used to calculate dust emissions were very detailed and certain variables
were specific to each activity. In its current form, it was difficult to calculate dust emissions
dynamically. In order for the EO model to include dynamic dust calculations, WCL had to identify
drivers which were closely correlated to the level of dust emissions. The sensible drivers for each
activity were discussed and presented below:
Table 4 Activity-Based Dust Emission Drivers
Activity WCL Dust Emission Drivers
In-pit haulage - waste kg of dust emissions/ tonne.km
In-pit haulage – ore kg of dust emissions/ tonne.km
Ex pit haulage – waste kg of dust emissions/ tonne.km
Ex pit haulage – ore kg of dust emissions/ tonne.km
Primary crusher kg of dust emissions/ tonne
Secondary crushers kg of dust emissions/ tonne
TSF construction kg of dust emissions/ tonne
Other – unclassified kg of dust emissions/ tonne
Utilising information from a range of sources, it was possible to derive dust emission factors for
each activity based on PanAust’s existing dust emissions calculations. This was then carefully
calibrated to produce sensible results. A series of test optimization runs were done - the proportion
of dust emitted from mine activities and total dust emissions were consistent with the PanAust’s
expectations. This was further validated by comparing calculated dust emissions from both
methods – the WCL method versus the prescribed method. A more conservative approach was
taken by calibrating the model to the year with the highest dust emissions as calculated by
PanAust. The figure below shows how the optimization model is set up and the text in brown
indicates dust generation points.
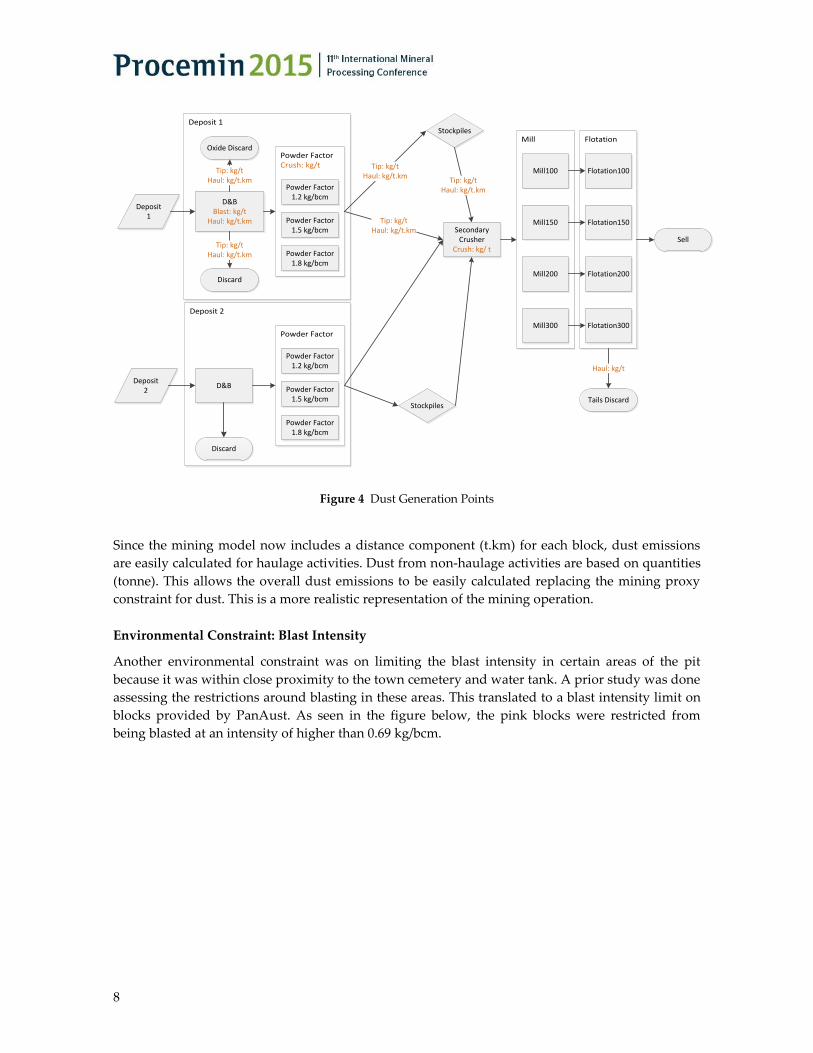
8
Deposit 2
Deposit 1
FlotationMill
Powder FactorCrush: kg/t
Powder Factor
D&BBlast: kg/t
Haul: kg/t.km
Powder Factor 1.2 kg/bcm
Powder Factor 1.8 kg/bcm
Powder Factor 1.5 kg/bcm
Discard
Tip: kg/tHaul: kg/t.km
Secondary Crusher
Crush: kg/ t
Mill100
Mill150
Mill300
Mill200
Flotation100
Flotation150
Flotation300
Flotation200
Tails Discard
Haul: kg/t
Sell
Tip: kg/tHaul: kg/t.km
D&B
Powder Factor 1.2 kg/bcm
Powder Factor 1.8 kg/bcm
Powder Factor 1.5 kg/bcm
Discard
Stockpiles
Tip: kg/tHaul: kg/t.km
Tip: kg/tHaul: kg/t.km
Oxide Discard
Tip: kg/tHaul: kg/t.km
Stockpiles
Deposit 1
Deposit 2
Figure 4 Dust Generation Points
Since the mining model now includes a distance component (t.km) for each block, dust emissions
are easily calculated for haulage activities. Dust from non-haulage activities are based on quantities
(tonne). This allows the overall dust emissions to be easily calculated replacing the mining proxy
constraint for dust. This is a more realistic representation of the mining operation.
Environmental Constraint: Blast Intensity
Another environmental constraint was on limiting the blast intensity in certain areas of the pit
because it was within close proximity to the town cemetery and water tank. A prior study was done
assessing the restrictions around blasting in these areas. This translated to a blast intensity limit on
blocks provided by PanAust. As seen in the figure below, the pink blocks were restricted from
being blasted at an intensity of higher than 0.69 kg/bcm.

9
Figure 5 Blasting Restrictions
THROUGHPUT OPTIMIZATION
Applying a flat constraint on throughput tonnes is not accurate because ore type and thus, the
hardness of the mill feed is variable through the life of mine. Mill throughput varies with ore
hardness which is in turn dependent on available power for processing – processing harder ore
types consumes more power and results in a lower throughput. In most conventional open pit
gold/copper mines, mill power is and should be the bottleneck in the system because it is the most
capital intensive part of the operation. Therefore, the constraint on the mill should be on power
consumption rather than tonnes throughput.
Throughput optimization was done using two EO mechanisms:
1. Determining the optimal blast intensity
2. Determining the optimal grind size
Collectively, finding the optimal blast intensity and grind size contributed a value uplift of 63.1 %.
Throughput optimization was subject to the following constraints in the system:
Dust emissions limit
Material handling limit
Mill power consumption limit
Water supply limit
Throughput Optimization – Blast Intensity
In the base case, all ore is blasted at a powder factor (PF) of 1.2 kg/bcm, and all gravel and leached
rock is blasted at a PF of 0.35 kg/bcm. With the help of PanAust, detailed blasting data was
obtained and applied to later scenarios:
Table 5 Blast Intensity by Rock Type
Rock type Blast Intensity
(kg/bcm)
Water Tank
Cemetery
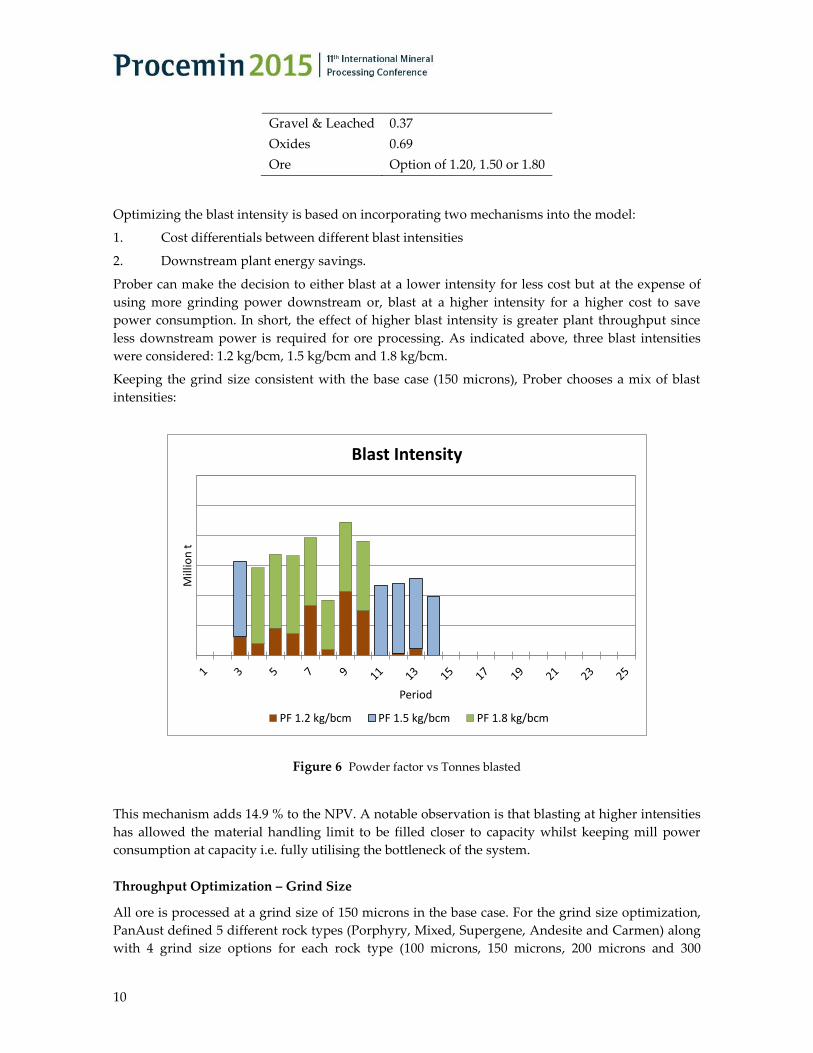
10
Gravel & Leached 0.37
Oxides 0.69
Ore Option of 1.20, 1.50 or 1.80
Optimizing the blast intensity is based on incorporating two mechanisms into the model:
1. Cost differentials between different blast intensities
2. Downstream plant energy savings.
Prober can make the decision to either blast at a lower intensity for less cost but at the expense of
using more grinding power downstream or, blast at a higher intensity for a higher cost to save
power consumption. In short, the effect of higher blast intensity is greater plant throughput since
less downstream power is required for ore processing. As indicated above, three blast intensities
were considered: 1.2 kg/bcm, 1.5 kg/bcm and 1.8 kg/bcm.
Keeping the grind size consistent with the base case (150 microns), Prober chooses a mix of blast
intensities:
Mill
ion
t
Period
Blast Intensity
PF 1.2 kg/bcm PF 1.5 kg/bcm PF 1.8 kg/bcm
Figure 6 Powder factor vs Tonnes blasted
This mechanism adds 14.9 % to the NPV. A notable observation is that blasting at higher intensities
has allowed the material handling limit to be filled closer to capacity whilst keeping mill power
consumption at capacity i.e. fully utilising the bottleneck of the system.
Throughput Optimization – Grind Size
All ore is processed at a grind size of 150 microns in the base case. For the grind size optimization,
PanAust defined 5 different rock types (Porphyry, Mixed, Supergene, Andesite and Carmen) along
with 4 grind size options for each rock type (100 microns, 150 microns, 200 microns and 300
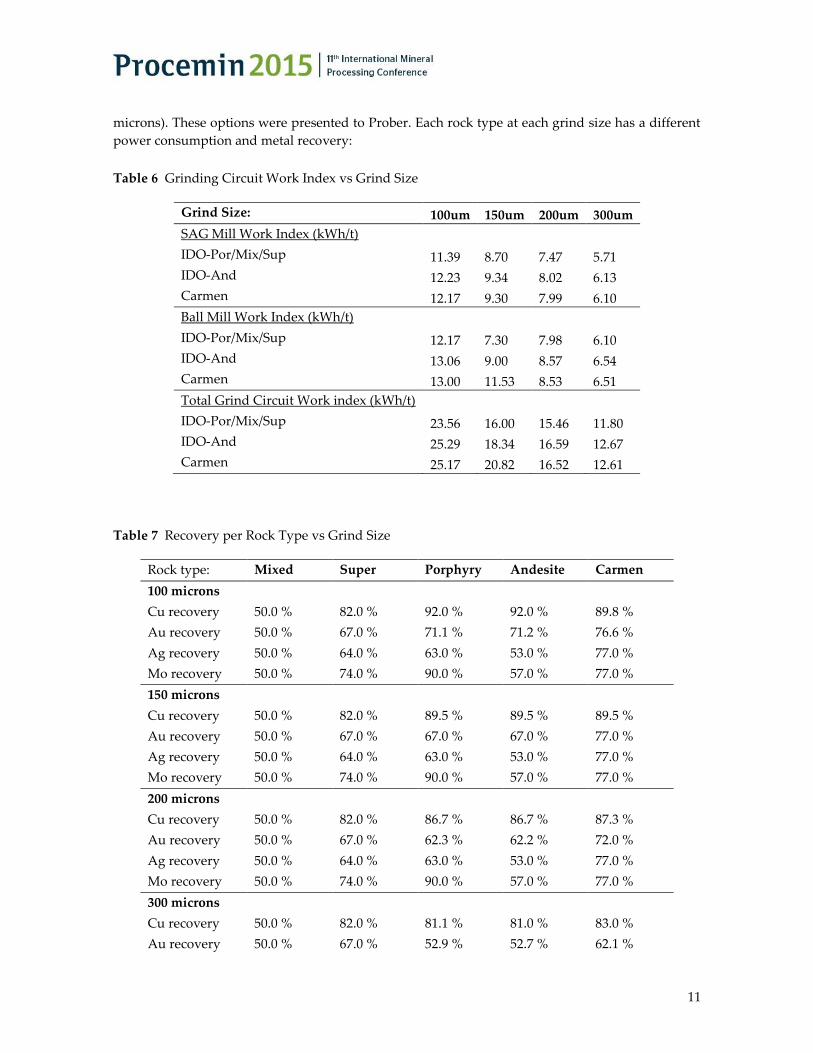
11
microns). These options were presented to Prober. Each rock type at each grind size has a different
power consumption and metal recovery:
Table 6 Grinding Circuit Work Index vs Grind Size
Table 7 Recovery per Rock Type vs Grind Size
Rock type: Mixed Super Porphyry Andesite Carmen
100 microns
Cu recovery 50.0 % 82.0 % 92.0 % 92.0 % 89.8 %
Au recovery 50.0 % 67.0 % 71.1 % 71.2 % 76.6 %
Ag recovery 50.0 % 64.0 % 63.0 % 53.0 % 77.0 %
Mo recovery 50.0 % 74.0 % 90.0 % 57.0 % 77.0 %
150 microns
Cu recovery 50.0 % 82.0 % 89.5 % 89.5 % 89.5 %
Au recovery 50.0 % 67.0 % 67.0 % 67.0 % 77.0 %
Ag recovery 50.0 % 64.0 % 63.0 % 53.0 % 77.0 %
Mo recovery 50.0 % 74.0 % 90.0 % 57.0 % 77.0 %
200 microns
Cu recovery 50.0 % 82.0 % 86.7 % 86.7 % 87.3 %
Au recovery 50.0 % 67.0 % 62.3 % 62.2 % 72.0 %
Ag recovery 50.0 % 64.0 % 63.0 % 53.0 % 77.0 %
Mo recovery 50.0 % 74.0 % 90.0 % 57.0 % 77.0 %
300 microns
Cu recovery 50.0 % 82.0 % 81.1 % 81.0 % 83.0 %
Au recovery 50.0 % 67.0 % 52.9 % 52.7 % 62.1 %
Grind Size: 100um 150um 200um 300um
SAG Mill Work Index (kWh/t)
IDO-Por/Mix/Sup 11.39 8.70 7.47 5.71
IDO-And 12.23 9.34 8.02 6.13
Carmen 12.17 9.30 7.99 6.10
Ball Mill Work Index (kWh/t)
IDO-Por/Mix/Sup 12.17 7.30 7.98 6.10
IDO-And 13.06 9.00 8.57 6.54
Carmen 13.00 11.53 8.53 6.51
Total Grind Circuit Work index (kWh/t)
IDO-Por/Mix/Sup 23.56 16.00 15.46 11.80
IDO-And 25.29 18.34 16.59 12.67
Carmen 25.17 20.82 16.52 12.61
12
Ag recovery 50.0 % 64.0 % 63.0 % 53.0 % 77.0 %
Mo recovery 50.0 % 74.0 % 90.0 % 57.0 % 77.0 %
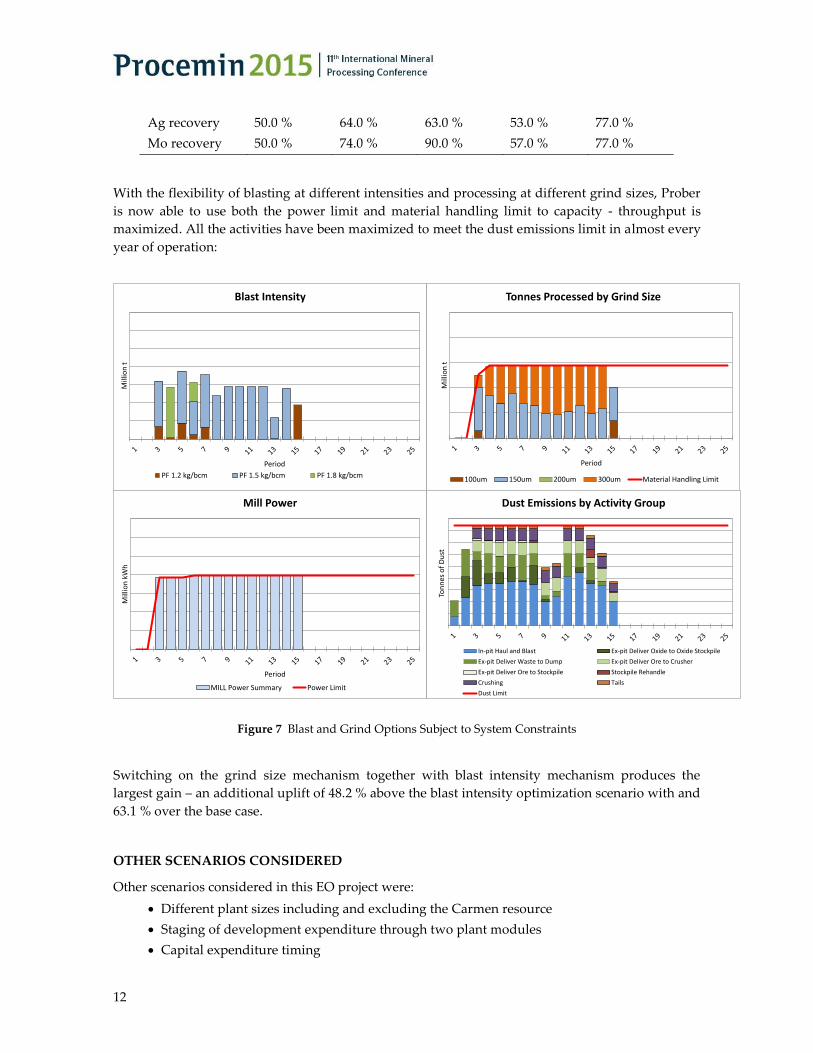
With the flexibility of blasting at different intensities and processing at different grind sizes, Prober
is now able to use both the power limit and material handling limit to capacity - throughput is
maximized. All the activities have been maximized to meet the dust emissions limit in almost every
year of operation:
Mill
ion
t
Period
Blast Intensity
PF 1.2 kg/bcm PF 1.5 kg/bcm PF 1.8 kg/bcm
Mill
ion
t
Period
Tonnes Processed by Grind Size
100um 150um 200um 300um Material Handling Limit
Mill
ion
kW
h
Period
Mill Power
MILL Power Summary Power Limit
Ton
nes
of
Du
st
Dust Emissions by Activity Group
In-pit Haul and Blast Ex-pit Deliver Oxide to Oxide Stockpile
Ex-pit Deliver Waste to Dump Ex-pit Deliver Ore to Crusher
Ex-pit Deliver Ore to Stockpile Stockpile Rehandle
Crushing Tails
Dust Limit
Figure 7 Blast and Grind Options Subject to System Constraints
Switching on the grind size mechanism together with blast intensity mechanism produces the
largest gain – an additional uplift of 48.2 % above the blast intensity optimization scenario with and
63.1 % over the base case.
OTHER SCENARIOS CONSIDERED
Other scenarios considered in this EO project were:
Different plant sizes including and excluding the Carmen resource
Staging of development expenditure through two plant modules
Capital expenditure timing
13
Scenarios moderating blasting and grind size strategies
This provided PanAust with a range of practical mine plans and revealed the sensitivity of
“flexing” certain variables.
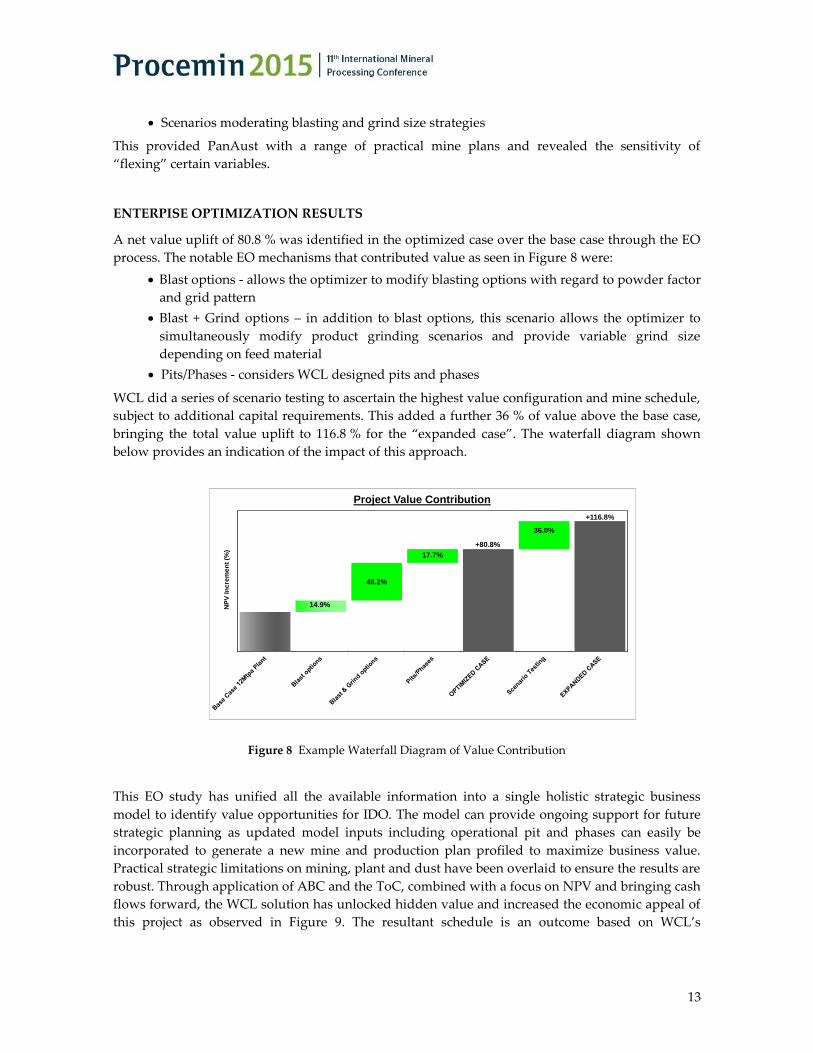
ENTERPISE OPTIMIZATION RESULTS
A net value uplift of 80.8 % was identified in the optimized case over the base case through the EO
process. The notable EO mechanisms that contributed value as seen in Figure 8 were:
Blast options - allows the optimizer to modify blasting options with regard to powder factor
and grid pattern
Blast + Grind options – in addition to blast options, this scenario allows the optimizer to
simultaneously modify product grinding scenarios and provide variable grind size
depending on feed material
Pits/Phases - considers WCL designed pits and phases
WCL did a series of scenario testing to ascertain the highest value configuration and mine schedule,
subject to additional capital requirements. This added a further 36 % of value above the base case,
bringing the total value uplift to 116.8 % for the “expanded case”. The waterfall diagram shown
below provides an indication of the impact of this approach.
14.9%
48.2%
17.7%
36.0%
+80.8%
+116.8%
NP
V I
ncre
men
t (%
)
Project Value Contribution
Figure 8 Example Waterfall Diagram of Value Contribution
This EO study has unified all the available information into a single holistic strategic business
model to identify value opportunities for IDO. The model can provide ongoing support for future
strategic planning as updated model inputs including operational pit and phases can easily be
incorporated to generate a new mine and production plan profiled to maximize business value.
Practical strategic limitations on mining, plant and dust have been overlaid to ensure the results are
robust. Through application of ABC and the ToC, combined with a focus on NPV and bringing cash
flows forward, the WCL solution has unlocked hidden value and increased the economic appeal of
this project as observed in Figure 9. The resultant schedule is an outcome based on WCL’s

14
philosophy, methodology and techniques that maximizes the flow of cash through the whole
business.
Cu
mu
lati
ve N
et C
ash
Flo
w (
$)
Period
Cumulative Net Cash Flow Comparison
Client Base Case WCL Optimized Expanded Base Case
Figure 9 Cumulative Net Cash Flow Comparison
REFERENCES
Goldratt, E.M (1984) The Goal: A Process of Ongoing Improvement, North River Press
ISBN 978-0-88427-187-9
Lane, K.F (1988) Economic Definition of Ore: Cut-off Grades in Theory and Practice, Mining Journal Books Ltd
ISBN-13: 978-0900117459
Staubus, G.J. (1971) Activity Costing and Input-Output Accounting, Richard D. Irwin, Inc.